Embed Size (px)
Citation preview

ENZYMATIC REMOVAL OF LIGNIN FROM PLANT MATERIALS: POTENTIAL
APPLICATIONS
by
SUDEEP SINGH SIDHU
(Under the Direction of Qingguo Huang and Paul. L. Raymer)
ABSTRACT
Lignin is the major contributor to lignocellulosic recalcitrance to microbial degradation.
Lignin acts as a protective matrix making cellulosic and hemicellulosic components inaccessible
to microbes, hence slowing down the decomposition process. My research involved application
of laccase enzyme for lignin removal from lignocellulosic biomass and its impact on two
different applications.
Accumulation of excessive organic matter in the form of thatch layer in turfgrass systems
is a major problem and is believed to be due to slow rate of organic matter decomposition.
Experiments were conducted in this study to examine the effects of laccase treatment on thatch
buildup in turf. Direct application of laccase at 2.06 units cm-2
on potted creeping bentgrass in
greenhouse every two weeks for nine months demonstrated a 45 and 32% reduction in thatch
layer and organic matter relative to control. Field experiments on creeping bentgrass to optimize
rate and frequency of laccase application showed that laccase application at rate as low as 0.5
units cm-2
applied once every two weeks or at rate 2.0 units cm-2
once every twelve weeks was
effective to reduce thatch when applied for six months. An 18-22% and 21-30% reduction in

thatch layer was observed with bi-weekly application of laccase at 2.0 units cm-2
for a period of
six months for bermudagrass and zoysiagrass, respectively.
Lignin removal from lignocellulosic biomass is an essential pretreatment step in
bioethanol production to increase accessibility of structural sugars. Experiments were conducted
to examine the potential of using laccase in such pretreatment to remove lignin from bioethanol
feedstock materials. Sweet sorghum and switchgrass were treated with laccase mediator system
consisting of ABTS (2, 2'-azino-bis (3-ethylbenzothiazoline-6-sulphonic acid), HBT (1-
hydroxybenzotriazole), and violuric acid to optimize mediator concentration. A 25.5 and 24%
lignin from sweet sorghum was removed at 1.88 and 1.25 mM concentration of HBT and
violuric acid, respectively. In switchgrass, reduction of 28% lignin was observed at 0.63 mM
concentration of violuric acid.
Application of laccase has the potential to develop as a new method for thatch
management. Future research is needed to determine the effectiveness of enzymatic pretreatment
for improving the bioethanol production efficiency.
INDEX WORDS: Lignin, Laccase, Lignolytic enzymes, Turfgrass, Thatch management,
Biofuels, Laccase mediator system

ENZYMATIC REMOVAL OF LIGNIN FROM PLANT MATERIALS: POTENTIAL
APPLICATIONS
by
SUDEEP SINGH SIDHU
B.Sc., Punjab Agricultural University, India, 2005
M.Sc., Punjab Agricultural University, India, 2007
A Dissertation Submitted to the Graduate Faculty of The University of Georgia in Partial
Fulfillment of the Requirements for the Degree
DOCTOR OF PHILOSOPHY
ATHENS, GEORGIA
2012

© 2012
Sudeep Singh Sidhu
All Rights Reserved

ENZYMATIC REMOVAL OF LIGNIN FROM PLANT MATERIALS: POTENTIAL
APPLICATIONS
by
SUDEEP SINGH SIDHU
Major Professors: Qingguo Huang
Paul L. Raymer
Committee: Robert N. Carrow
Miguel L. Cabrera
Mussie Y. Habteselassie
Hong Luo
Electronic Version Approved:
Maureen Grasso
Dean of the Graduate School
The University of Georgia
August 2012
iv
DEDICATION
I would like to dedicate this dissertation to my parents Mr. Hardeep Singh and late Ravinder
Kaur. Without their unconditional love, support, and sacrifices, I wouldn’t have reached this far.

v
ACKNOWLEDGEMENTS
I would like to thanks my major professors, Dr. Qingguo Huang and Dr. Paul L. Raymer
for their tremendous faith in my abilities. Their unwavering support inspired me to work hard. I
enjoyed the freedom and encouragement I received from them. I would like to thank Dr. Robert
N. Carrow for the time and effort he invested in me. I would also like to thank my committee
members, Dr. Miguel L. Cabrera, Dr. Mussie Y. Habteselassie, and Dr. Hong Luo for their
suggestions and helping hand.
I owe a lot to Matthew Aderhold, Lewayne White, Brandon Tonnis, Mary G. Flynn, and
Rodney Connell for their technical assistance. This research was supported by funding from the
Golf Course Superintendents Association of America, Georgia Golf Environmental Foundation,
and Georgia Agricultural Experiment Stations.
I would like to express my gratitude to my wife Rashmi for the confidence she has in my
abilities and for her selfless support during tough times. I would like to thank my friends Negi-
Dolly, Vijendra-Tripti, Dr. Ranjan Singh, Vikas-Neha, Dhananjay, and Harwinder Kang for their
invaluable support. Special thanks to my family members Sukhneet, Pooja, Anamika, Rachna,
and Seeha for their unconditional love and support. This acknowledgement would not be
complete without thanking my Mom & Dad in-law for the faith they always had in me.

vi
TABLE OF CONTENTS
Page
ACKNOWLEDGEMENTS .............................................................................................................v
LIST OF TABLES ...........................................................................................................................x
LIST OF FIGURES ..................................................................................................................... xiii
CHAPTER
I INTRODUCTION ...................................................................................................1
LITERATURE CITED ................................................................................4
II LITERATURE REVIEW ........................................................................................7
LIGNIN-DEGRADING FUNGI .................................................................8
LIGNOLYTIC ENZYMES .........................................................................9
LACCASE MEDIATOR SYSTEM ..........................................................11
THATCH/MAT LAYER ...........................................................................12
DETHATCHING TECHNIQUES .............................................................14
PRE-TREATMENT FOR BIOETHANOL PRODUCTION ....................16
LITERATURE CITED ..............................................................................18
III USE OF FUNGAL LACCASES TO FACILITATE BIODETHATCHING: A
NEW APPROACH ................................................................................................33
ABSTRACT ...............................................................................................34
INTRODUCTION .....................................................................................34
MATERIALS AND METHODS ...............................................................37

vii
RESULTS ..................................................................................................42
DISCUSSION ............................................................................................45
CONCLUSIONS........................................................................................48
LITERATURE CITED ..............................................................................48
IV LACCASE MEDIATED CHANGES IN PHYSICAL AND CHEMICAL
PROPERTIES OF THATCH LAYER IN CREEPING BENTGRASS (Agrostis
stolonifera L.) ........................................................................................................61
ABSTRACT ...............................................................................................62
INTRODUCTION .....................................................................................62
MATERIALS AND METHODS ...............................................................66
RESULTS ..................................................................................................71
DISCUSSION ............................................................................................74
CONCLUSIONS........................................................................................78
LITERATURE CITED ..............................................................................78
V OPTIMIZING LACCASE APPLICATION ON CREEPING BENTGRASS
(Agrostis stolonifera L.) TO FACILITATE BIODETHATCHING ......................91
ABSTRACT ...............................................................................................92
INTRODUCTION .....................................................................................92
MATERIALS AND METHODS ...............................................................96
RESULTS ................................................................................................101
DISCUSSION ..........................................................................................105
CONCLUSIONS......................................................................................109
LITERATURE CITED ............................................................................110

viii
VI EFFICACY OF FUNGAL LACCASE TO FACILITATE BIODETHACHING IN
BERMUDAGRASS AND ZOYSIAGRASS ......................................................126
ABSTRACT .............................................................................................127
INTRODUCTION ...................................................................................127
MATERIALS AND METHODS .............................................................130
RESULTS ................................................................................................133
DISCUSSION ..........................................................................................136
CONCLUSIONS......................................................................................137
LITERATURE CITED ............................................................................137
VII RESIDUAL EFFECT OF LACCASE APPLICATION ON THATCH LAYER
CHARACTERISTICS OF CREEPING BENTGRASS ......................................145
ABSTRACT .............................................................................................146
INTRODUCTION ...................................................................................146
MATERIALS AND METHODS .............................................................150
RESULTS ................................................................................................155
DISCUSSION ..........................................................................................161
CONCLUSIONS......................................................................................168
LITERATURE CITED ............................................................................169
VIII LIGNIN REMOVAL FROM SWEET SORGHUM AND SWITCHGRASS
BIOMASS USING LACCASE MEDIATOR SYSTEM ....................................181
ABSTRACT .............................................................................................182
INTRODUCTION ...................................................................................182
MATERIALS AND METHODS .............................................................185

ix
RESULTS ................................................................................................188
DISCUSSION ..........................................................................................194
CONCLUSIONS......................................................................................196
LITERATURE CITED ............................................................................197
IX OVERALL CONCLUSIONS ..............................................................................214

x
LIST OF TABLES
Page
Table 3.1: Analysis of variance (ANOVA) table showing the effects of treatment duration,
laccase application, guaiacol application, and their interactions on creeping bentgrass
maintained in a greenhouse. .........................................................................................54
Table 3.2: Organic layer thickness (OL) and organic matter (OM) content (0-5.0 cm depth) after
two and nine months of different treatments applied to creeping bentgrass. ...............55
Table 3.3: Extractive-free acid-soluble (LS), acid-insoluble (LI), and total lignin (LT) content
after two and nine months of different treatments applied to creeping bentgrass. ......56
Table 3.4: Mean visual turf quality ratings of creeping bentgrass made over time following
continued treatment with different laccase and guaiacol solutions to greenhouse
grown plants .................................................................................................................57
Table 3.5: Mean grass index values of creeping bentgrass made over time following continued
treatment with different laccase and guaiacol solutions to greenhouse grown plants .58
Table 4.1: Analysis of variance (ANOVA) table showing the effects of treatment duration,
laccase application, guaiacol application, and their interactions on dead creeping
bentgrass thatch maintained in a greenhouse ...............................................................85
Table 4.2: Analysis of variance (ANOVA) table showing the effects of treatment duration,
laccase application, guaiacol application, and their interactions on sugar content on
dead creeping bentgrass thatch maintained in a greenhouse. ......................................86

xi
Table 4.3: Extractive-free acid-soluble (LS), acid-insoluble (LI), and total lignin (LT) content
after two and six months of different treatments applied to thatch layer of dead
creeping bentgrass ........................................................................................................87
Table 5.1: Analysis of variance (ANOVA) table for year 1 showing the effects of laccase
treatments, rate of application, frequency of application, laccase with cultural
management, and laccase sources on creeping bentgrass ..........................................115
Table 5.2: Analysis of variance (ANOVA) table for year 2 showing the effects of laccase
treatments, rate of application, frequency of application, and laccase with cultural
management on creeping bentgrass ...........................................................................116
Table 6.1: Characteristics of soils used in zoysiagrass study ......................................................141
Table 6.2: Analysis of variance (ANOVA) table showing the effects of laccase treatments,
treatment duration, and duration and treatment interactions on ultra-dwarf
bermudagrass and zoysiagrass. ..................................................................................141
Table 6.3: Organic matter content (OML, 2.5-5.0 cm; OM, 0-5.0 cm), acid-soluble lignin (LS),
and acid-insoluble lignin (LI) content after first and second year of laccase treatments
on ultra-dwarf bermudagrass and zoysiagrass. ..........................................................142
Table 7.1: Description of laccase treatments applied on creeping bentgrass ..............................174
Table 7.2: Analysis of variance (ANOVA) table showing the effects of laccase treatments,
treatment duration, and duration and treatment interactions on creeping bentgrass ..175
Table 7.3: Total organic matter content at three depths; 0-2.5 cm (OMU), 2.5-5.0 cm (OML), and
0-5.0 cm (OM) at six, twelve and eighteen months after initiation of different laccase
treatments applied on creeping bentgrass. .................................................................176

xii
Table 7.4: Saturated hydraulic conductivity (SHC), extractive-free acid-soluble (LS) and-
insoluble lignin (LI) at six, twelve and eighteen months after initiation of different
laccase treatments applied on creeping bentgrass. .....................................................177
Table 8.1: Extractive-free acid-soluble lignin (LS), acid-insoluble lignin (LI), and total lignin (LT)
in sweet sorghum and switchgrass after 24 h of treatment with laccase enzyme at 0, 2,
5, 10, and 20 units mL-1
activity in a 20 mL reaction mixture. .................................202
Table 8.2: Total lignin content (extractive-free) in sweet sorghum and switchgrass biomass after
24 h treatment with laccase-mediator system. ...........................................................203
Table 8.3: Extractive-free acid-soluble lignin (LS), acid-insoluble lignin (LI), and total lignin (LT)
in sweet sorghum after 24, 48, and 72 h of enzymatic treatment. .............................204
Table 8.4: Extractive-free acid-soluble lignin (LS), acid-insoluble lignin (LI), and total lignin (LT)
in switchgrass after 24, 48, and 72 h of enzymatic treatment. ...................................205
Table 8.5: Extractive-free total structural sugar content (ST) of sweet sorghum and switchgrass
biomass after 24 h of enzymatic treatment. ...............................................................206

xiii
LIST OF FIGURES
Page
Figure 3.1: Thatch (OLT) and mat layer thickness (OLM) after nine months of treatment on
creeping bentgrass with three different levels of laccase (0 (control), 0.206 and 2.06
units cm-2
) with and without the mediator, guaiacol (G). ............................................59
Figure 3.2: Organic matter (OM) for 0-2.5 cm depth and 2.5 to 5.0 cm depth after nine months of
treatment on creeping bentgrass with three different levels of laccase (0 (control),
0.206 and 2.06 units cm-2
) with and without the mediator, guaiacol (G). ...................59
Figure 3.3: Saturated hydraulic conductivity (SHC) after nine months of treatment on creeping
bentgrass with three different levels of laccase (0 (control), 0.206 and 2.06 units cm-2
)
with and without the mediator, guaiacol (G). ..............................................................60
Figure 4.1: Saturated hydraulic conductivity (SHC) after two and six months of treatment on
creeping bentgrass thatch biomass with three different levels of laccase (0 (control),
2.06 and 20.6 units cm-2
) with and without the mediator, guaiacol (G) ......................88
Figure 4.2: Thatch layer thickness (TLT) after two and six months of treatment on creeping
bentgrass thatch biomass with three different levels of laccase (0 (control), 2.06 and
20.6 units cm-2
) with and without the mediator, guaiacol (G) .....................................88
Figure 4.3: Organic matter content (0-2.5 cm; OMU) after two and six months of treatment on
creeping bentgrass thatch biomass with three different levels of laccase (0 (control),
2.06 and 20.6 units cm-2
) with and without the mediator, guaiacol (G) ......................89

xiv
Figure 4.4: Glucose (SGLU) after two and six months of treatment on creeping bentgrass thatch
biomass with three different levels of laccase (0 (control), 2.06 and 20.6 units cm-2
)
with and without the mediator, guaiacol (G) ...............................................................89
Figure 4.5: Arabinose (SARA) after two and six months of treatment on creeping bentgrass thatch
biomass with three different levels of laccase (0 (control), 2.06 and 20.6 units cm-2
)
with and without the mediator, guaiacol (G) ...............................................................90
Figure 4.6: Total sugars (ST) after two and six months of treatment on creeping bentgrass thatch
biomass with three different levels of laccase (0 (control), 2.06 and 20.6 units cm-2
)
with and without the mediator, guaiacol (G) ...............................................................90
Figure 5.1: Thatch layer thickness (TLT) after treatment application on creeping bentgrass with:
five different levels of laccase (Fig 5.1A); laccase activity level 2.0 units cm-2
applied
at four frequencies (Fig 5.1B); laccase at 2.0 units cm-2
applied at a frequency of 4
weeks in comparison with cultural management practice (Fig 5.1C); and laccase
enzyme from different sources (Fig 5.1D) .................................................................117
Figure 5.2: Extractive-free acid-soluble lignin content (LS) after treatment application on
creeping bentgrass with: five different levels of laccase (Fig 5.2A); laccase activity
level 2.0 units cm-2
applied at four frequencies (Fig 5.2B); laccase at 2.0 units cm-2
applied at a frequency of 4 weeks in comparison with cultural management practice
(Fig 5.2C); and laccase enzyme from different sources (Fig 5.2D) ...........................118
Figure 5.3: Extractive-free acid-insoluble lignin content (LI) after treatment application on
creeping bentgrass with: five different levels of laccase (Fig 5.3A); laccase activity
level 2.0 units cm-2
applied at four frequencies (Fig 5.3B); laccase at 2.0 units cm-2

xv
applied at a frequency of 4 weeks in comparison with cultural management practice
(Fig 5.3C); and laccase enzyme from different sources (Fig 5.3D) ...........................119
Figure 5.4: Extractive-free total lignin content (LI) after treatment application on creeping
bentgrass with: five different levels of laccase (Fig 5.4A); laccase activity level 2.0
units cm-2
applied at four frequencies (Fig 5.4B); laccase at 2.0 units cm-2
applied at a
frequency of 4 weeks in comparison with cultural management practice (Fig 5.4C);
and laccase enzyme from different sources (Fig 5.4D). ............................................120
Figure 5.5: Extractive-free total sugar content (ST) after treatment application on creeping
bentgrass with: five different levels of laccase (Fig 5.5A); laccase activity level 2.0
units cm-2
applied at four frequencies (Fig 5.5B); laccase at 2.0 units cm-2
applied at a
frequency of 4 weeks in comparison with cultural management practice (Fig 5.5C);
and laccase enzyme from different sources (Fig 5.5D) .............................................121
Figure 5.6: Extractive-free glucose content (SGLU) after treatment application on creeping
bentgrass with: five different levels of laccase (Fig 5.6A); laccase activity level 2.0
units cm-2
applied at four frequencies (Fig 5.6B); laccase at 2.0 units cm-2
applied at a
frequency of 4 weeks in comparison with cultural management practice (Fig 5.6C);
and laccase enzyme from different sources (Fig 5.6D) .............................................122
Figure 5.7: Extractive-free xylose content (SXYL) after treatment application on creeping
bentgrass with: five different levels of laccase (Fig 5.7A); laccase activity level 2.0
units cm-2
applied at four frequencies (Fig 5.7B); laccase at 2.0 units cm-2
applied at a
frequency of 4 weeks in comparison with cultural management practice (Fig 5.7C);
and laccase enzyme from different sources (Fig 5.7D) .............................................123

xvi
Figure 5.8: Extractive-free galactose content (SGAL) after treatment application on creeping
bentgrass with: five different levels of laccase (Fig 5.8A); laccase activity level 2.0
units cm-2
applied at four frequencies (Fig 5.8B); laccase at 2.0 units cm-2
applied at a
frequency of 4 weeks in comparison with cultural management practice (Fig 5.8C);
and laccase enzyme from different sources (Fig 5.8D) .............................................124
Figure 5.9: Organic matter content in the 0-2.5 cm surface layer (OMU) after treatment
application on creeping bentgrass with laccase at 2.0 units cm-2
applied at a frequency
of 4 weeks in comparison with cultural management practice. .................................125
Figure 5.10: Saturated hydraulic conductivity (SHC) after treatment application on creeping
bentgrass with laccase at 2.0 units cm-2
applied at a frequency of 4 weeks in
comparison with cultural management practice ........................................................125
Figure 6.1: Organic matter content (0-2.5 cm, OMU) after bi-weekly application of laccase on
bermudagrass and zoysiagrass with two levels 0 (control) and 2.0 units cm-2
. .........143
Figure 6.2: Thatch layer thickness (TLT) after bi-weekly application of laccase on bermudagrass
and zoysiagrass with two levels 0 (control) and 2.0 units cm-2
. ................................143
Figure 6.3: Saturated hydraulic conductivity (SHC) after bi-weekly application of laccase on
bermudagrass and zoysiagrass with two levels 0 (control) and 2.0 units cm-2
. .........144
Figure 6.4: Total lignin content (LT) after bi-weekly application of laccase on bermudagrass and
zoysiagrass with two levels 0 (control) and 2.0 units cm-2
. .......................................144
Figure 7.1: Thatch layer thickness (TLT) in mm at six, twelve, and eighteen months after
treatment initiation on creeping bentgrass with cultural management and laccase
treatments (Fig 7.1A); rate of laccase application (7.1B); frequency of application of
laccase (Fig 7.1C); and laccase sources (Fig 7.1D). ..................................................178

xvii
Figure 7.2: Extractive-free total lignin content (LT) in mg·g-1
at six, twelve, and eighteen months
after treatment initiation on creeping bentgrass with cultural management and laccase
treatments (Fig 2A); rate of laccase application (Fig 2B); frequency of application of
laccase (Fig 2C); and laccase sources (Fig 2D). ........................................................179
Figure 7.3: Thatch layer thickness (TLT) in mm at six, twelve, and eighteen months after
treatment initiation on creeping bentgrass with laccase treatments 0 (control), and 2.0
(2) for six months in year one, CHU (2.0) for six months in year one and six months
in year two..................................................................................................................180
Figure 7.4: Extractive-free total lignin content (LT) in mg·g-1
at six, twelve, and eighteen months
after treatment initiation on creeping bentgrass with laccase treatments 0 (control),
and 2.0 (2) for six months in year one, CHU (2.0) for six months in year one and six
months in year two. ....................................................................................................180
Figure 8.1: Extractive-free acid-soluble lignin content (LS, 8.1A) and acid-insoluble lignin
content (LI, 8.1B) of sweet sorghum after 24 h of enzymatic treatment in a 20 mL
reaction mixture with seven different levels of mediator ABTS 0, 0.13, 0.25, 0.31,
0.63, 1.25, and 1.88 mM with and without laccase at activity 10 units mL-1
. ...........207
Figure 8.2: Extractive-free acid-soluble lignin content (LS, 8.2A) and acid-insoluble lignin
content (LI, 8.2B) of switchgrass after 24 h of enzymatic treatment in a 20 mL
reaction mixture with seven different levels of mediator ABTS 0, 0.13, 0.25, 0.31,
0.63, 1.25, and 1.88 mM with and without laccase at activity 10 units mL-1
. ...........208
Figure 8.3: Extractive-free acid-soluble lignin content (LS, 8.3A) and acid-insoluble lignin
content (LI, 8.3B) of sweet sorghum after 24 h of enzymatic treatment in a 20 mL

xviii
reaction mixture with seven different levels of mediator HBT 0, 0.13, 0.25, 0.31,
0.63, 1.25, and 1.88 mM with and without laccase at activity 10 units mL-1
. ...........209
Figure 8.4: Extractive-free acid-soluble lignin content (LS, 8.4A) and acid-insoluble lignin
content (LI, 8.4B) of switchgrass after 24 h of enzymatic treatment in a 20 mL
reaction mixture with seven different levels of mediator HBT 0, 0.13, 0.25, 0.31,
0.63, 1.25, and 1.88 mM with and without laccase at activity 10 units mL-1
. ...........210
Figure 8.5: Extractive-free acid-soluble lignin content (LS, 8.5A) and acid-insoluble lignin
content (LI, 8.5B) of sweet sorghum after 24 h of enzymatic treatment in a 20 mL
reaction mixture with five different levels of mediator VA 0, 0.31, 0.63, 1.25, and
1.88 mM with and without laccase at activity 10 units mL-1
. ....................................211
Figure 8.6: Extractive-free acid-soluble lignin content (LS, 8.6A) and acid-insoluble lignin
content (LI, 8.6B) of switchgrass after 24 h of enzymatic treatment in a 20 mL
reaction mixture with five different levels of mediator VA 0, 0.31, 0.63, 1.25, and
1.88 mM with and without laccase at activity 10 units mL-1
. ....................................212
Figure 8.7: Measured and calculated dry mass loss from sweet sorghum and switchgrass biomass
after 24 h of laccase treatment (10 units mL-1
) in a 20 mL reaction mixture with two
different levels of mediators ABTS, HBT, and VA at 1.25, and 1.88 mM
concentration. .............................................................................................................213

1
CHAPTER I
INTRODUCTION
Lignin, the second most abundant organic substance next to cellulose in plant cell walls,
is a three dimensional amorphous polymer consisting of methoxylated phenyl propane that
resists microbial decomposition of organic matter (Ledeboer and Skogley, 1967). The lignin
macromolecule structure consists of three monomers derived from three primary
hydroxycinnamyl alcohols: p-coumaryl, coniferyl and sinapyl alcohols (Wong, 2009). Lignin is
extremely recalcitrant to degradation due to its complex heterogeneous structure without a
regular pattern. The structure is derived from random oxidative coupling of lignin monomers and
cross-linking of polymers via radical mechanisms in a process known as lignification (Chen and
Sarkanen, 2003; Davin and Lewis, 2003).
Natural degradation of lignin is carried out in the environment most effectively by certain
white-rot fungi which solubilize and mineralize lignin by producing extra-cellular lignolytic
enzymes (Kirk et al., 1975; 1976). White-rot fungi preferentially attack lignin more than
cellulose or hemicellulose in the wood tissue (Mester et al., 2004). This process of selective
delignification exposes cellulosic materials for further bacterial degradation in the environment
and produces cellulose- and hemicellulose-enriched wood, which has a wide range of industrial
applications (Otjen and Blanchette, 1987).
Four different kinds of lignolytic enzymes are produced by white-rot fungi: lignin
peroxidase, manganese peroxidase, versatile peroxidase, and laccase (Baldrian, 2006). The
peroxidases catalyze hydrogen-peroxide dependent oxidation of phenolic and non-phenolic

2
compounds (Farrell, 1987). Laccase is a multi-copper oxidase capable of oxidizing a wide
variety of phenols by reducing oxygen to water in a three step process involving electron
transfer. However, in the presence of certain chemicals known as mediators, efficacy and
substrate range of the laccase enzyme is enhanced (Bourbonnais et al., 1997). For most fungal
laccases, the catalytic ability is stable in slightly acidic environment (pH 4-6) and a wide range
of temperature (30-55oC) making it suitable for different industrial applications (Baldrian, 2006).
Two potential uses of the laccase enzyme for removal of lignin from biomass were
investigated in my dissertation study. First was the application of fungal laccases to facilitate
dethatching of turfgrass by removing lignin from thatch biomass and making cellulosic and
hemicellulosic sugars available for microbial degradation. The second was the use of laccase-
mediator system as a pretreatment for lignocellulosic biomass to enhance lignin removal which
may lead to increase in accessibility of structural sugars for hydrolysis and fermentation.
A major problem in modern turfgrass greens is the formation of high organic matter layer
known as thatch and mat layer. Thatch is a mixed layer of organic matter containing both living
and dead plant tissues intermingled tightly with each other that accumulates between the soil and
green turfgrass. It consists of stolons, rhizomes, roots, leaf sheaths and blades (Engel, 1954).
The mat layer is generally below the thatch layer where sand or soil is intermingled with thatch
due to cultural practices like core aeration and topdressing (McCarty, 2005). The sand or soil
content can vary so that the properties of some mat layers may be dominated by organic matter
while in others the dominant matrix is sand or soil.
The formation of the thatch-mat layer is due to a greater rate of organic matter
accumulation than microbial degradation as presence of lignin in plant cell walls restricts
microbial degradation mechanisms (Beard, 1973; Kirk and Farrell, 1987). Lignin limits the

3
accessibility of microbial degraders to more biodegradable plant materials, such as cellulose and
hemicelluloses (Ledeboer and Skogley, 1967).
Several cultural practices like core aeration, topdressing, and vertical mowing are in use
today and have been successful in reducing thatch accumulation, however, these practices are
energy and cost intensive and often have adverse or disruptive effects on turfgrass surfaces and
quality (Landreth et al., 2008; McCarty et al., 2007). We hypothesize that direct application of
laccase enzyme on turfgrass could reduce thatch layer buildup. The objectives of this study were
to: 1) determine if degradation of soil organic matter can be enhanced by laccase application; and
2) determine if application of laccase enzyme affects turf quality.
The second potential use related to laccase’s ability to selectively remove lignin was the
application of laccase-mediator system as a pretreatment of lignocellulosic biomass to efficiently
remove lignin and enhance the accessibility of cellulosic and hemicellulosic sugars for the
subsequent hydrolysis and fermentation processes. Concerns regarding the security and
availability of crude oil as well as its negative environmental impacts have increased pressure on
our society to find renewable energy resources (Midilli et al., 2006). Bioenergy, in the form of
bioethanol, is a viable potential source, but several limitations need to be overcome. Bioethanol
can be prepared from sugars and starch, but this would not be practical from socio-economic
perspective because it competes for food sources. Lignocellulose is the essential part of cell
walls of plants and is one of the most abundant organic sources. Lignocellulose is composed
primarily of cellulose (24-54%), hemicellulose (11-38%), and lignin (6-31%) and has been
considered as a potential raw material for bioenergy production (Jacques et al., 1999). Cellulose
and hemicellulose are embedded in a protective matrix of lignin and requires pretreatment to be
accessible for hydrolysis and subsequent conversion into bioethanol.

4
Several pretreatments such as wet oxidation (Schmidt and Thomsen, 1989) and steam
explosion (Galbe and Zacchi, 2002) are used to open up the lignocellulosic material for the
subsequent hydrolysis to take place. Loss of cellulose, as well as hemicellulosic sugars,
production of microbial inhibitors, and environmentally undesirable chemicals are produced
during different pretreatment methods (Petersson et al., 2007). The aim of my study was to
optimize the laccase pretreatment conditions including mediator concentrations for lignin
removal from different lignocellulosic biomasses. The study was based on the following
hypothesis: 1) a laccase-mediator system can effectively remove lignin from lignocellulosic
biomass; and 2) enzymatic pretreatment will have minimal impact on structural sugars of the
biomass.
LITERACTURE CITED
Baldrian, P. 2006. Fungal laccases - occurrence and properties. FEMS Microbiol. Revi. 30: 215-
242.
Beard, J.B. 1973. Turfgrass: Science and culture. Prentice Hall Inc., Englewood Cliffs, NJ.
Bourbonnais, R., M.G. Paice, B. Freiermuth, E. Bodie, and S. Borneman. 1997. Reactivities of
various mediators and laccases with kraft pulp and lignin model compounds. Appl.
Environ. Microbiol. 63: 4627-32.
Chen, Y.R., and S. Sarkanen. 2003. Macromolecular lignin replication: A mechanistic working
hypothesis. Phytochem. Rev. 2: 235-255.
Davin, L.B. and N.G. Lewis 2003. A histrorical perspective on lignin biosynthesis: Monolignol,
allylphenol and hydroxycinnamic acid coupling and downstream metabolism.
Phytochem. Rev. 2: 257-288.
Engel, R.E. 1954. Thatch on turf and its control. Golf Course Rep. 22 (5): 12-14.

5
Farrell, L. 1987. Combustion: The microbial degradation of lignin. Annu. Rev. Microbiol. 41:
465-505.
Galbe, M., and G. Zacchi. 2002. A review of production of ethanol from softwood. Appl.
Microbiol. Biotechnol. 59: 618-628.
Jacques, K., T.P. Lyons, D.R. Kelsall. 1999. The alcohol textbook. 3rd
edition. Redwood Books,
Trowbridge, Wiltshire.
Kirk, T.K., and R.L. Farrell. 1987. Enzymatic “combustion”: The microbial degradation of
lignin. Annu. Rev. Microbiol. 41: 465-501.
Kirk, T.K., W.J. Connors, R.D. Bleam, and G. Jeikus. 1976. Requirements for a growth substrate
during lignin decomposition by two wood-rotting fungi. Appl. Environ. Microbiol. 32:
192-194.
Kirk, T.K., W.J. Connors, R.D. Bleam, W.F. Hackett, and J.G. Jeikus. 1975. Preparation and
microbial decomposition of synthetic [14
C] lignins. PNAS. 72: 2515-2519.
Landreth, J., D. Karcher, and M. Richardson. 2008. Cultivating to manage organic matter in sand
based putting greens: University of Arkansas researchers provide important insight for
managing organic buildup on putting greens. USGA Turfgrass Environ. Res. Online
46(1): 16-19.
Ledeboer, F.B., and C.R. Skogley. 1967. Investigations into the nature of thatch and methods for
its decomposition. Agron. J. 59: 320-323.
McCarty, L.B. 2005. Best golf course management practices. 2nd
ed. Prentice Hall Inc. Upper
Saddle River, NJ.
McCarty, L. B., M.F. Gregg, and J.E. Toler. 2007. Thatch and mat management in an established
creeping bentgrass green. Agron. J. 99: 1530-1537.
6
Mester, T., E. Varela, and M. Tien. 2004. Wood degradation by brown-rot and white-rot fungi.
The Mycota II: Genetics and biotechnology. 2nd
edition. Springer-Verlag, Berlin,
Heidelberg.
Midilli, A., I. Dincer, and M. Ay. 2006. Green energy strategies for sustainable development.
Energ. Policy. 34: 3623-3633.
Otjen, L., and R. Blanchette. 1987. Assessment of 30 white rot basidiomycetes for selective
lignin degradation. Holzforschung. 41: 343-349.
Petersson, A., M.H. Thomsen, H. Hauggaard-Nielson, and A.B. Thomsen. 2007. Potential
bioethanol and biogass production using lignocellulosic biomass from winter rye, oilseed
rape and faba bean. Biomass Bioenergy. 31: 812-819.
Schmidt, A.S., and A.B. Thomsen. 1989. Optimization of wet oxidation pretreatment of wheat
straw. Bioresour. Technol. 64: 139-151.
Wong, D.W.S. 2009. Structure and action mechanism of ligninolytic enzymes. Appl. Biochem
Biotechnol. 157: 174-209.

7
CHAPTER II
LITERATURE REVIEW
The cell walls of seed plants, angiosperms and gymnosperms, are storehouses of
fermentable carbohydrates and non-carbohydrate polymers. The major portion of this
carbohydrate is in the form of high molecular weight cellulose (24-54%) along with non-
cellulosic polysaccharides (11-38%). The carbohydrate and non-carbohydrate polymers are
covalently and non-covalently bonded with one another and with non-carbohydrate polymers,
particularly lignin (6-31%), and other polymers such as proteins, suberin, and cutin (Garrote et
al., 1999). Two types of cell walls, primary and secondary cell walls, are recognized (Basic et al.,
1988; Esau, 1953; Harris, 2005). Primary cell walls are typically non-lignified and are formed
when the young cells are still developing and enlarging. Secondary walls are typically lignified
and are formed after the cells are developed by deposition over the primary cell wall (Basic et
al., 1988; Harris, 2005). Cellulose is the structural unit of a plant cell wall (Harris, 2005). The
matrix phase polysaccharides include glucans, heteroglucans, heteroxylans, heteromannans,
arabino galactans, and pectic polysaccharides (Ridley et al., 2001; Trethewey et al., 2005;
Wilkie, 1979).
Lignin is the second most abundant organic substance next to cellulose and the major
contributor to lignocellulosic recalcitrance to microbial degradation. Lignin is a three
dimensional amorphous polymer consisting of methoxylated phenyl propane that resists
microbial decomposition of organic matter (Ledeboer and Skogley, 1967). Lignin
macromolecule is composed of three lignin monomers: p-caumaroyl, coniferyl, and sinapyl

8
alcohols. The corresponding lignin monomers are known as p-hydroxy phenyl, guaiacyl and
syringyl units, respectively, and often abbreviated as H, G, and S lignin (Wong, 2009). The ratio
of G:S:H is generally 70:25:5 in the lignin of grasses and other lignocellulosic materials
(Brunow, 2001; Fukushima 2001; Higuchi, 2006). The recalcitrant nature of lignin is attributed
to its heterogeneous complex structure, which is derived from random oxidative coupling of
lignin monomers and cross-linking of polymers via radical mechanisms, a process known as
lignification (Chen and Sarkanen, 2003; Davin and Lewis, 2003). A lignin macromolecule
contains monolignols randomly bonded by C-O-C and C-C linkages including β-O-4, β-5, β-β, 5-
5, 4-O-5, and β-1 bonds (Alder, 1977; Del Rio et al., 2007; Ralph et al., 2004).
The cellulose and hemicellulose components are covalently bonded with lignin
macromolecules in different ways such as ester-ether cross-links (Grabber et al., 2000, 2004;
Ralph et al., 1995, 2004), direct ester linkages (Imamura et al., 1994; Joseleau and Gancet,
1981), benzyl ether linkages (Grabber et al., 2004; Lam et al., 1990; Watanabe et al., 1989), and
phenyl glycoside linkages (Joseleau and Kesraoui, 1986).
LIGNIN-DEGRADING FUNGI
Lignin is resistant to anaerobic degradation and the aerobic breakdown of lignin is slow
(Wong, 2009). Natural degradation of lignin is carried out effectively in the environment only by
basidiomyceteous white-rot fungi where water soluble fragments (solubilization) and evolution
of 14
C labeled CO2 (mineralization) have demonstrated their efficacy (Kirk et al., 1975, 1976).
Some white-rot fungi such as Ceriporiopsis subvermispora, Phellimus pini, Phlebia spp., and
Pleurotus spp. preferentially attack lignin more than cellulose or hemicellulose in the wood
tissue (Blanchette, 1984; Mester et al., 2004; Otjen and Blanchette, 1987). This process of

9
selective delignification exposes cellulosic materials for further bacterial degradation in the
environment (Otjen and Blanchette, 1987).
Many white-rot fungi such as Trametes versicolor, Heterobasidium annosum, and Irpex
lacteus, however, exhibit a pattern of simultaneous decay characterized by degradation of all cell
wall components with formation of radial cavities (Blanchette, 1991; Eriksson et al., 1990). In
contrast to lignin-degrading white-rot fungi, commonly found on angiosperms, brown-rot fungi
grow primarily on gymnosperms and degrade wood carbohydrate instead of lignin (Cowling,
1961; Gilbertson, 1980).
Several studies have shown that lignin is degraded and oxidized by white-rot fungi that
produce certain enzymes such as lignin peroxidases, manganese peroxidases, laccase and
versatile peroxidases (Elisashvili et al., 2008; Rodrigues et al., 2008). Bermudagrass treated with
two white-rot fungi Ceriporiopsis subvermispora and Cyathus Stercorius showed a decrease in
the level of hydroxycinnamic alcohols (lignin monomers) by 50 and 65%, respectively (Akin et
al., 1996). Similarly, Dinis et al. (2009) observed a 43% decrease in lignin content in wheat
straw treated with fungal isolates during 28 days of incubation. The decrease in lignin content
was 13% in the first seven days of incubation. Arora et al. (2002) reported a decrease in wheat
lignin content by 18.5 and 12.5% when treated with P. radiate and T. vericolor, respectively.
LIGNOLYTIC ENZYMES
White-rot fungi produce four major types of lignin degrading enzymes: i.e. Lignin
peroxidases (LiP; EC1.11.1.14), manganese peroxidases (MnP; EC 1.11.1.13), laccases (Lac; EC
1.10.3.2), and versatile peroxidases (VP; EC 1.11.1.16) (Baldrian, 2006; Farrell, 1987; Gold et
al., 2000). Lignin degradation is further enhanced by the cooperative action of several accessory
enzymes, which may include glyoxal oxidase (EC1.2.3.5), aryl alcohol oxidase (veratryl alcohol

10
oxidase; EC 1.1.3.7), pyranose 2-oxidase (glucose 1-oxidase; EC 1.1.3.4), cellobiose/quinone
oxidoreductase (EC 1.1.5.1), and cellobiose dehydrogenase (EC 1.1.99.18) (Martinez 2002;
Martinez et al., 2005).
Lignin peroxidases catalyze hydrogen-peroxide dependent oxidative de-polymerization
of lignin (Hammel et al., 1993; Tien and Kirt, 1983). These enzymes are relatively non-specific
and act on a variety of phenolic aromatic as well as non-phenolic substrates and have the unique
ability to catalyze oxidative cleavage of C-C bonds and ether (C-O-C) bonds in non-phenolic
aromatic substrates of high redox potential (Schoemaker et al., 1994; Valli et al., 1990) as well as
lignin (Johjima et al., 1999; Martinez, 2002). Hirai et al. (2005) observed the degradation of
lignin model compounds by 84 and 56% by lignin peroxidase from Phanerochaete sordid and
Phanerochaete chrysosporium, respectively.
Manganese peroxidases catalyze manganese-dependent reactions and their extracellular
production is dependent on Mn (II) ions where Mn (II) is oxidized to Mn (III), which in turn
oxidizes monomeric phenolic compounds (Bonnarme and Jeffries, 1990). Non-phenolic lignin
units, the fraction most recalcitrant to degradation, are not oxidized by manganese peroxidase
(Gold et al., 2000). Hofrichter et al. (1999) used manganese peroxidase from white-rot fungi
Nematoloma frowardii on 14
C labeled wheat straw and observed the formation of 14
CO2 (4-10 %)
and water soluble 14
C-lignin fragments (14-25%). Versatile peroxidases are a group of enzymes
which are not only specific for manganese as in manganese peroxidases (Camarero et al., 1996;
Kamitsuji et al., 2005), but also are specific for phenol and non-phenolic compounds that are
acted upon by lignin peroxidases (Camarero et al., 1999; Rodakiewicz-Nowak et al., 2006).
Laccases, the multi-copper oxidases, are known to act on a wide variety of aromatic
compounds by reducing oxygen to water and oxidizing a wide range of diphenols and

11
monophenols (Baldrian, 2006). Laccases are widely distributed in plants and fungi
(Messerschmidt and Huber, 1990) and have also been found in bacteria and insects (Kunamneni
et al., 2007). Redox potential of fungal laccase (800 mV) being higher as compared to bacterial
and plant laccases is used in several biotechnological applications including degradation of lignin
(Thurston, 1994). Redox potential of laccase enzyme from laccase producing fungi is reported as
450 mV (Myceliophthora thermophila), 750 mV (Pycnoporus cinnabarinus), 780 mV (Botrytis
cinerea), 790 mV (Trametes villosa), and 800 mV (Trametes versicolor) (Li et al., 1999; Wong,
2009) along with redox potential of laccase produced from plant Rhus vernicefera to be 450 mV
(Reinhammer and Vanngard, 1971). Plant laccases due to their low redox potential are involved
in the lignin synthesizing system instead of lignin degradation (Bao et al., 1993).
Fungal laccases occur as monomeric or dimeric protein structures. The monomeric
protein structures have a molecular mass of 50 to 100 kDa (Thurston, 1994). The process of
laccase catalysis occurs in three steps: 1) reduction of type I Cu by substrates; 2) electron transfer
from type I Cu to type II and III Cu trinuclear cluster; and 3) reduction of oxygen to water at the
trinuclear cluster (Gianfreda et al., 1999). The catalytic activity of most of the fungal laccases
varies between 30-55oC and mild acidic conditions in the range of pH 4-6 (Baldrian, 2006;
Morozova et al., 2007). Rodriguez Couto (2007) reported that laccase from Trametes hirsute was
able to decolorize a synthetic non-phenolic dye, indigo carmine, at pH values 8-11.
LACCASE MEDIATOR SYSTEM
Laccase is one of the extra-cellular lignolytic enzymes secreted during oxygen dependent
degradation of phenolic compounds by white-rot fungi (Ten-Have and Teunissen, 2001). Low
redox potential of fungal laccase restricts its ability to oxidize non-phenolic compounds (Kersten
et al., 1990; Ten-Have and Teunissen, 2001). However, addition of low molecular weight

12
substances, known as mediators, increase the substrate range of laccase enzyme to non-phenolic
groups, benzyl and alyl alcohols and ethers (Bourbonnais and Paice, 1992; Bourbonnais et al.,
1997; Crestini and Argyropoulos, 1998; Fabbrini et al., 2002; Fabbrini et al., 2001) which
contribute the major fraction of the lignin macromolecule (Fritz-Langhals and Kunath, 1998;
Johannes and Majcherczyk, 2000; Potthast et al., 1995).
In the laccase mediator system, an oxidized mediator with higher redox potential than
laccase, acts on the substrate to carry out its oxidation (Cantarella et al., 2003). Laccase-mediator
system catalyzed oxidation of organic substrate could proceed as two different mechanisms. The
oxidation of substrate is carried out by mono electron oxidation as in case of mediators like
ABTS (2, 2'-azino-bis (3-ethylbenzothiazoline-6-sulphonic acid), and by abstraction of H atom
by a >N-O radical species for N-OH type mediators like HBT (1-hydroxybenzotriazole) and
violuric acid (Cantarella et al., 2003). Elegir et al. (2005) reported oxidation of two phenolic
model lignin compounds (5-5’ phenolic compound, 4,4’-dimethyl-4,4’-dihydroxy,
5,5’dimethoxy-diphenyl; and β-5 phenolic compound, E-methyl-[(2RS-3RS)-2,3-dihyro-2-
(4hydroxy3-methoxyphenyl)-7-methoxy-3-methoxycarbonyl-1-benzofuran-5-yl] proenoate) by
application of laccase from C. subvermispora, however two non-phenolic model lignin
compounds (4,4’-dimethyl-4,4’,5,5’tetramethoxy-diphenyl and E-methyl-[(2RS-3RS)-2,3-
dihyro-2-(3,4-dimethoxyphenyl)-7-methoxy-3-methoxycarbonyl-1-benzofuran-5-yl] proenoate)
were oxidized only in the presence of mediators (ABTS and HBT) and surfactants (Tween 20
and Tween 80).
THATCH/MAT LAYER
Organic matter layer consisting of both living and dead plant tissues intermingled tightly
with each other that accumulates between the soil and green turfgrass is known as thatch layer

13
(Beard 1973). It consists of stolons, rhizomes, roots, leaf sheaths and blades (Engel, 1954). The
mat layer consists of thatch layer intermingled with sand or soil due to cultural practices like core
aeration and sand topdressing along with earthworm activities (McCarty, 2005). The presence of
thatch layer in a limited amount is beneficial to turfgrass as it moderates extreme soil
temperatures, increases wear tolerance, and reduces weed invasion (Beard, 1973; Butler, 1965).
Excessive thatch accumulation increases disease and insect problems (Musser, 1960; Thompson,
1967), reduces pesticide effectiveness (Latham, 1955; Musser 1960), decreases water infiltration
(Carrow, 2003; Murray and Juska, 1977), reduces in hydraulic conductivity (Harris, 1978),
increases localized dry spots (Cornman, 1952), reduces tolerance to cold temperatures (Beard,
1973, Thompson 1967), results in poor aesthetic value, and causes shallow rooting (Engel and
Alderfer, 1967; Hartwiger, 2004).
Thatch accumulates when the rate of organic matter accumulation is greater than the rate
organic matter decomposition. Factors that enhance vegetative growth in turf at a higher rate
than its decomposition could result in thatch development. Also, any factor such as acid soil that
limits microbial activity can enhance thatch accumulation (Satchell, 1967; Starkley, 1954).
Martin and Beard (1975) reported microbial activity, measured by CO2 evolution, to be
maximum at pH 6 while working on red fescue. Lignin content in thatch layer increased whereas
microbial activity decreased by seven percent due to addition of clippings in bermudagrass
(Meinhold et al., 1973). Thatch is high in lignin, a three-dimensional amorphous polymer
consisting of methoxylated phenyl propane that limits microbial degradation of organic matter
(Ledeboer and Skogley, 1967). For this reason, turfgrass species high in lignin content are
resistant to decomposition (Beard, 1973).

14
DETHATCHING TECHNIQUES
McWhirter and Ward (1976) observed core aeration done three to six times a year on
bermudagrass reduced thatch content by 10 percent. Similar results were reported by Murray and
Juska (1977) on a Kentucky bluegrass after five years of core aeration. Weston and Dunn (1985)
on the other hand reported 8 and 25% reduction in thatch by core aeration done once and twice a
year, respectively. No influence of core aeration was observed in other studies by White and
Dickens (1984) and Carrow et al. (1987). McCarty et al. (2005) observed a 58 and 188%
increase in water infiltration rates on bentgrass after one and two years of core aeration,
respectively. Carrow et al. (1987) reported that saturated hydraulic conductivity increased in
bentgrass during the first seven days after cultivation and then decreased 17 to 26 days after
treatment.
Several researchers have showed reduction of thatch content on different grasses by
vertical mowing. McWhirter and Ward (1976) reported a 12% decrease in thatch content by
vertical mowing every 2 to 4 weeks on Tifgreen bermudagrass. Similar results were observed by
Danneberger and Turgeon (1986) on Kentucky bluegrass. Vertical mowing once a year reduced
thatch content up to 18% on zoysiagrass (Dunn et al., 1981). Similarly, Weston and Dunn (1985)
reported an 8 to 10% decrease of thatch in zoysiagrass by vertical mowing once to three times a
year. Similar results on Tifway bermudagrass were reported by Carrow et al. (1987). Vertical
mowing reduces the thatch build up in different grasses but it reduces turf quality (Dunn et al.,
1981; Westen and Dunn, 1985; Carrow et al., 1987). Landreth et al. (2008) observed that
verticutting with a blade width of 3 mm removed four times more organic matter than any of the
core aeration treatments (various combinations of tine spacing, depth and diameter) on creeping

15
bentgrass; however, time required to heal from core aeration treatments was half of that required
for verticutting treatments. Similar results were also reported by Hanna (2005).
Carrow et al. (1987) reported a 44 to 62% decrease in thatch content by topdressing once
or twice a year, respectively on Tifway bermudagrass. Similar results were reported by White
and Dickens (1984) on three different bermudagrass cultivars. Barton et al. (2009) observed that
topdressing alone was three times more effective in reducing the organic matter content on
kikuyu grass than core aeration alone. The reason topdressing is effective in thatch control is that
it provides better micro-environment for the microbes. McCarty et al. (2005) observed that
combination of various mechanical methods on creeping bentgrass reduced thatch-mat depth and
percent organic matter by 18 and 31%, respectively and combinations of different treatments
were better than topdressing, vertical mowing and core aeration alone.
Studies of several non-destructive methods in the past using different treatments like
sugars, mixtures of sugars and microbial inocula, and some enzymes like cellulase, proved
ineffective. Application of commercial microbial inoculum, Biodethatch and Thatch-Away, at
rates of 4.9 and 9.8 g·m-2
on bermudagrass (Cynodon dactylon L.) proved ineffective in thatch
layer reduction (Murdoch and Barr, 1976). Similarly, application of two commercial microbial
inoculum, Biodethatch and Thatch Away, at a rate of 4.9 g·m-2
on creeping bentgrass and annual
bluegrass was ineffective in reducing thatch layer depth (Lancaster et al., 1977). Application of
three commercial biological dethaching materials Biodethatch, Thatch Away, and Earth Anew
on bermudagrass and creeping bentgrass was ineffective in reducing thatch layer thickness
(Gilbeault et al., 1976). Ledeboer and Skogley (1967) reported that application of 24.4 kg per m2
calcium and sucrose at 240 and 490 kg·ha-1
on velvet bentgrass (Agrostis canina L.) had no

16
significant effect on thatch decomposition but sucrose significantly increased dollar spot
incidence.
Thatch-mat depth on creeping bentgrass increased by 12-15% over control when treated
with a biological granular supplement Thach-X (McCarty et al., 2007). Application of the
wetting agent, Aqua-Gro®, at 24.6 kg·ha
-1 and Milogranite, activated sewage sludge, at 275
kg·ha-1
on Kentucky bluegrass was ineffective in reduction of organic matter in thatch layer
(Murray and Juska, 1977). Reduction in cellulose content and total oxidizable organic matter in
bermudagrass and centipedegrass (Sartain and Volk, 1984) and weight loss of bermudagrass
pellets, St. Augustinegrass and zoysiagrass stolons (Martin and Dale, 1980) were observed when
inoculated with different wood-decaying fungi under controlled greenhouse and laboratory
conditions. However, field inoculation experiments on bermudagrass showed no thatch
degradation (Martin and Dale, 1980).
PRE-TREATMENT FOR BIOETHANOL PRODUCTION
A general procedure to produce bioethanol from lignocellulose involves three steps: i)
pretreatment to reduce lignocellulosic recalcitrance, ii) hydrolysis to produce sugars from
carbohydrates, and iii) fermentation to produce ethanol. Hydrolysis, the second step, can be
achieved by cellulolytic enzymes such as cellulases (Cardona and Sanchez, 2007); but the
efficiency is highly dependent upon the pretreatment step, that is intended to disrupt
lignocellulosic structures, making the cellulose and hemicellulose readily accessible by
cellulolytic enzymes during hydrolysis (Petersson et al., 2007). Pretreatment is critical in
lignocellulose-to-ethanol conversion to remove and/or break down lignin contents and thus
disrupt the lignocellulosic structures, leading to increased cellulose accessibility for subsequent

17
hydrolysis (Conte et al., 2009; Fang et al., 2010; Kaparaju et al., 2009; Kerr and Goring, 1975;
Matsushita et al., 2009).
Different pretreatment methods such as steam explosion (Galbe and Zachhi, 2002) and
wet oxidation (McGinnis, 1983; Schmidt and Thomsen, 1989) are commonly used before
enzymatic hydrolysis. Varga et al. (2003) have shown optimal parameters for corn pretreatment
by wet oxidation to be 195oC, 2g·L
-1 Na2CO3, and 12 bar O2 pressure for 15 minutes. Similar
parameters were also used for wheat straw (Klinke et al., 2003). Wet oxidation is energy
consuming, and low sugar recovery during pretreatment has been reported (Petersson et al.,
2007). Wet oxidation processes produce polymers (Ahring et al., 1999) whereas, in dilute acid
hydrolysis, sugar monomers are produced (Taherzadeh et al., 1997). Hydrolysate produced from
wet oxidation consists of low molecular weight carboxylic acids (6.0 g·L-1
), phenols (2.0g·L-1
)
and 2-furoic acid (0.007g·L-1
) that act as inhibitors to the microorganisms used for hydrolysis
(Klinke et al., 2003).
In steam explosion pretreatment, biomass is exposed to pressurized steam with a sudden
drop of pressure, thus making cellulose more available for enzymatic hydrolysis. A maximum
glucose yield of 16.5 g per 100 g of sunflower stalks pre-treated using steam explosion was
reported at 220oC, however the highest hemicellulosic sugar recovery was obtained at 210
oC
(Ruiz et al., 2008). Kaar et al. (1998) reported 216oC as the optimum temperature for steam
explosion pre-treatment for glucose conversion in sugarcane bagasse. The major disadvantages
of steam explosion pretreatment are the loss of hemicellulosic sugars (Kaar et al., 1998; Ruiz et
al., 2008) and production of furural and hydroxymethyl furfural which act as inhibitors to
microbial hydrolysis of cellulose (Buchert, 1990).

18
The rate of glucose formation by enzymatic saccharification in sugarcane bassage, rice
straw and silvergrass pre-treated with sulfuric acid decreased with increasing concentrations
(Guo et al., 2009). Sulfuric acid has many disadvantages of being toxic and hazardous, requiring
corrosion resistant reactors, being able to chemically modify carbohydrates to reduce glucose
availability, and production of cinnamic acids in the residue (Mao, J.-D et al., 2010; Wyman,
1996).
Alteration in biomass structure is required for effective and efficient use of structural
sugars for bioethanol production. Loss in structural sugars is a major concern in different
pretreatment methods. Specificity of laccase-mediator system to act on phenolic and non-
phenolic bonds has the potential to effectively remove lignin from biomass and to increase
accessibility of structural sugars for hydrolysis and fermentation. Research is needed to evaluate
the efficacy of laccase-mediator system, to optimize concentrations of different mediators for
optimum lignin removal, and to determine its impact on structural sugars.
LITERATURE CITED
Ahring, B.K., D. Licht, A.S. Schmidt, P. Sommer, A.B. Thomsen. 1999. Production of ethanol
from wet oxidized wheat straw by Thermoanerobacter mathrani. Biores. Technol. 68: 3-
9.
Akin, D.E., W.H. Morrison, L.L. Rigsby, G.R. Gamble, A. Sethuraman, and K.E.L. Eriksson.
1996. Biological delignification of plant components by white rot fungi Ceriporiopsis
subvermispora and Cyathus stercoreus. Anim. Feed Sci. Technol. 63: 305-321.
Alder, E. 1977. Lignin chemistry - past, present and future. Wood Sci. Technol. 11: 169-218.

19
Arora, D.S., M. Chander, and P.K. Gill. 2002. Involvement of lignin peroxidase, manganese
peroxidase and laccase in degradation and selective lignolysis of wheat straw. Int.
Biodeterior. Biodegrad. 50: 115-120.
Baldrian, P. 2006. Fungal laccases - occurrence and properties. FEMS Microbiol. Rev. 30: 215-
242.
Bao, W., D.M. O’Malley, R. Whetten, and R.R. Sederoff. 1993. A laccase associated with
lignification in loblolly pine xylem. Sci. 260: 672-674.
Barton, L., G.G.Y. Wan, R.P. Buck, and T.D. Colmer. 2009. Effectiveness of cultural thatch-mat
controls for young and mature kikuyu turfgrass. Agron. J. 101: 67-74.
Basic, A., P.J. Harris, and B.A. Stone. 1988. Structure and function of plant cell walls. In: J.
Preiss, editor, The biochemistry of plants: Carbohydrates. Vol. 14. Academic Press, San
Diego. p. 297-371
Beard, J.B. 1973. Turfgrass: Science and culture. Prentice Hall Inc., Englewood Cliffs, NJ.
Blanchette, R.A. 1984. Screening wood decayed by white-rot fungi for preferential lignin
degradation. Appl. Environ. Microbiol. 48: 647-653.
Blanchette, R.A. 1991. Delignification by wood-decay fungi. Annu. Rev. Phytopathol. 29: 381–
398.
Bonnarme, P., and T.W. Jeffries. 1990. Mn(II) regulation of lignin peroxidase and manganese
dependent peroxidases from lignin-degrading white-rot fungi. Appl. Environ. Microbiol.
56: 210-217.
Bourbonnais, R., and M.G. Paice. 1992. Demethylation and delignification of kraft pulp by
Trametes versicolor laccase in the presence of 2,2′-azinobis-(3-ethylbenzthiazoline-6-
sulphonate). Appl. Microbiol. Biotechnol. 36: 823-827.

20
Bourbonnais, R., M.G. Paice, B. Freiermuth, E. Bodie, and S. Borneman. 1997. Reactivities of
various mediators and laccases with kraft pulp and lignin model compounds. Appl.
Environ. Microbiol. 63: 4627-32.
Brunow, G. 2001. Methods to reveal the structure of lignin. In: M. Hofrichter, and A.
Steinbuchel, editors, Lignin, humic substances and coal, Biopolymers, vol. 1. Wiley-
VCH, Weinheim, Germany.
Buchert, J. 1990. Biotechnical oxidation of D-xylose and hemicellulose hydrolyzates by
Gluconobactor oxydans, Ph.D thesis, Technical Research Center of Finland.
Butler, J.D. 1965. Thatch a problem in turf management. III. Turf Conf. Proc. P. 1-3.
Camarero, S., B. Bockle, M.J. Martinez, and A.T. Martinez. 1996. Manganese-mediated lignin
degradation by Pleurotus pulmonarius. Appl. Environ. Microbiol. 62: 1070-1072.
Camarero, S., S. Sarkar, F.J. Ruiz-Duenas, M.J. Martinez, and A.T. Martinez. 1999. Description
of a versatile peroxidase involved in the natural degradation of lignin that has been
manganese peroxidase and lignin peroxidase substrate interaction sites. J. Biol. Chem.
274: 10324-10330.
Cantarella, G., C. Galli, and P. Gentili. 2003. Free radical versus electron-transfer routes of
oxidation of hydrocarbons by laccase/mediator systems: Catalytic or stoichiometric
procedures. J. Mol. Catal. B-Enzym. 22: 135-144.
Cardona, C.A., and O. Sanchez. 2007. Fuel ethanol production: process design trends and
integration opportunities. Biores. Technol. 98: 2415-2457.
Carrow, R.N. 2003. Surface organic matter in bentgrass greens. USGA Turfgrass Environ. Res.
Online 2(17): 1-10.
Carrow, R.N., B.J. Johnson, and R.E. Burns. 1987. Thatch and quality of Tifway bermudagrass

21
turf in relation to fertility and cultivation. Agron. J. 79: 524-530.
Chen, Y.R., and S. Sarkanen. 2003. Macromolecular lignin replication: A mechanistic working
hypothesis. Phytochem. Rev. 2: 235-255.
Conte, P., A. Maccotta, C. De Pasquale, S. Bubici, and Alonzo, G. 2009. Dissolution mechanism
of crystalline cellulose in H3PO4 as assessed by high-field NMR spectroscopy and fast
field cycling NMR relaxometry. J. Agric Food Chem. 57: 8748-8752.
Cornman, J.F. 1952. Mat formation on putting greens. Golf Course Rep. 20 (4): 8-14.
Cowling, E.B. 1961. Comparative biochemistry of decay of sweetgum sapwood by white-rot and
brown-rot fungi. USDA Technical Bulletin, 1258: 1-79.
Crestini, C., and D.S. Argyropoulos. 1998. The early oxidative biodegradation steps of residual
kraft lignin models with laccase. Bioorg. Med. Chem. 6: 2161-2169.
Danneberger, T.K., and A.J. Turgeon. 1986. Soil cultivation and incorporation effects on the
edaphic properties of turfgrass thatch. J. Am. Soc. Hortic. Sci. 111: 184-186.
Davin, L.B. and N.G. Lewis 2003. A historical perspective on lignin biosynthesis: Monolignol,
allylphenol and hydroxycinnamic acid coupling and downstream metabolism.
Phytochem. Rev. 2: 257-288.
Del Rio, J. C., G. Marques, J. Rencoret, A.T. Martinez, and A. Gutierrez. 2007. Occurrence of
naturally acetylated lignin units. J. Agric. Food Chem. 55: 5461-5466.
Dinis, M.J., R.M.F. Bazerra, F. Nunes, A.A. Dias, C.V. Guedes, L.M.M. Ferreira, J.W. Cone,
G.S.M. Marques, A.R.N. Barros, and M.A.M. Rodrigues. 2009. Modification of wheat
straw lignin by solid state fermentation with white-rot fungi. Biores. Technol. 100: 4829-
4835.
Dunn, J.H., K.M. Sheffer, and P.M. Halisky. 1981. Thatch and quality of Meyer zoysia in

22
relation to management. Agron. J. 73: 949-952.
Elegir, G., S. Daina, L. Zoia, G. Bestetti, and M. Orlandi. 2005. Laccase mediator
system:oxidation of recalcitrant lignin model structures present in residual kraft lignin.
Enzym. Microb. Technol. 37: 340-346.
Elisashvilli, V., M. Penninckx, E. Kachlishvili, N. Tasiklauri, E. Metreveli, T. Kharziani, and G.
Kvesitadze. 2008. Lentinus edodes and Pleurotus species lignocellulytic enzymes activity
in submerged and solid-state fermentation of lignocellulosic wastes of different
composition. Biores. Technol. 99: 457-462.
Engel, R.E. 1954. Thatch on turf and its control. Golf Course Rep. 22 (5): 12-14.
Engel, R.E., and R.B. Alderfer. 1967. The effect of cultivation, top-dressing, lime, N, and
wetting agent on thatch development on 1/4-inch bentgrass over a 10-year period. N.J.
Agric. Exp. Stn. Bull. 818: 32-45.
Eriksson, K.-E.L., R.A. Blanchette, and P. Ander 1990. Microbial and enzymatic degradation of
wood and wood components p. 407. Berlin Heidelberg: Springer-Verlag.
Esau, K. 1953. Plant Anatomy. Wiley, New York.
Fabbrini, M., C. Galli, and P. Gentili. 2002. Comparing the catalytic efficiency of some
mediators of laccase. J. Mol. Catal. B-Enzym. 16: 231-240.
Fabbrini, M., C. Galli, P. Gentili, and D. Macchitella. 2001. An oxidation of alcohols by oxygen
with the enzyme laccase and mediation by TEMPO. Tetrahedron Lett. 42: 7551-7553.
Fang, X., Y. Shen, J. Zhao, X. Bao, and Y. Qu. 2010. Status and prospect of lignocellulosic
bioethanol production in China. Bioresour. Technol. 101: 4814-4819.
Farrell, L. 1987. Combustion: The microbial degradation of lignin. Annu. Rev. Microbiol. 41:
465-505.

23
Fritz-Langhals, E., and B. Kunath. 1998. Synthesis of aromatic aldehydes by laccase-mediator
assisted oxidation. Tetrahedron Lett. 39: 5955-5956.
Fukushima, K. 2001. Regulation of syringyl to guaiacyl ratio in lignin biosynthesis. J. Plant Res.
114: 499–508.
Galbe, M., and G. Zacchi. 2002. A review of production of ethanol from softwood. Appl.
Microbiol. Biotechnol. 59: 618-628.
Garrote, G., H. Dominguez, and J.C. Parajo. 1999. Hydrothermal processing of lignocellulosic
materials. Holzals Roh-und Werkstoff. 57: 191-202.
Gianfreda, L., F. Xu, and J.-M. Bollag. 1999. Laccases: a useful group of oxidoreductase
enzymes. Biorem. J. 3: 1-25.
Gilbeault, V.A., R. Baldwin, I. Bivins, and D. Hanson. 1976. Evaluation of biological
dethatching materials. California Turfgrass Culture. 26: 29-30.
Gilbertson, R.L. 1980. Wood-rotting fungi of north America. Mycologia. 72: 1-49.
Gold, M.H., H.L. Youngs, and M.D.S. Gelpke. 2000. Manganese peroxidase. Met. Ions Biol.
Syst. 37: 559-586.
Grabber, J.H., J. Ralph, and R. D. Hatfield. 2000. Cross-linking of maize walls by ferulate
dimerization and incorporation into lignin. J. Agric. Food Chem. 48: 6106-6113.
Grabber, J.H., J. Ralph, C. Lappierre, and Y. Barriere. 2004. Genetic and molecular basis of
grass cell wall degradability. I. Lignin-cell wall matrix interactions. Comptes Rendus
Biologies. 327: 455-465.
Guo, G.-L., D.-C. Hsu, W.-H. Chen, W.-H. Chen, and W.-S. Hwang. 2009. Characterization of
enzymatic saccharification for acid-pretreated lignocellulosic materials with different
lignin composition. Enzym. Microb. Technol. 45: 80-87.

24
Hammel, K.E., K.A. Jensen, Jr., M.D. Mozuch, L.L. Landucci, M. Tien, and E.A. Pease. 1993.
Ligninolysis by a purified lignin peroxidase. J. Biol. Chem. 268: 12274-12281.
Hanna, W. 2005. Controlling thatch in ‘TifEagle’ bermudagrass with graden verticutter. USGA
Turfgrass Environ. Res. Online 4(5):1-6.
Harris, J.R. 1978. Maintenance of soil structure under playing turf. In: W.E. Emerson editor,
Modification of soil structure. John Wiley &Sons, Chichester, UK.
Harris, P.J. 2005. Diversity in plant cell walls. In: R.J. Henry, editor, Plant Diversity and
Evolution: Genotypic and Phenotypic variation in Higher Plants. CAB International
Publishing, Wallingford, Oxon, UK. p. 201-227
Hartwiger, C. 2004. The importance of organic matter dynamics: How research uncovered the
primary cause of secondary problems. USGA Green Section Record 42(3): 9-11.
Higuchi, T. 2006. Look back over the studies of lignin biochemistry. J. Wood Sci. 52: 2-8.
Hirai, H., M. Sugiura, S. Kawai, and T. Nishida. 2005. Characteristics of novel lignin peroxidase
produced by white-rot fungi Phanerochaete sordid YK-624. FEMS Microbiol. Letters.
24: 19-24.
Hofrichter, M., K. Scheibner, F. Bublitz, I. Schneega, D. Ziegenhagen, R. Martens, and W.
Fritsche. 1999. Depolymerization of straw lignin by manganese peroxidase from
Nematoloma frowardii is accompanied by release of carbon dioxide. Holzforschung. 53:
161-166.
Imamura, T., T. Watanabe, M. Kuwahara, and T. Koshijima. 1994. Ester linkages between lignin
and glucuronic acid in lignin-carbohydrate complexes of Fagus crenata. Phytochem. 37:
1165-1173.
Johannes, C., and A. Majcherczyk. 2000. Natural mediators in the oxidation of polycyclic

25
aromatic hydrocarbons by laccase mediator systems. Appl. Environ. Microbiol. 66: 524-
528.
Johjima, T., H. Itoh, M. Kabuto, F. Tokimura, T. Nakagawa, H. Wariishi, and H. Tanaka. 1999.
Direct interaction of lignin and lignin peroxidase from Phaneochaete chrysosporium.
Proc. Natl. Acad. Sci. USA. 96: 1989-1994.
Joseleau, J.P., and C. Gancet. 1981. Selective degradations of lignin-carbohydrate complex from
aspen wood. Svensk Papperstidning. 84: 123-127.
Joseleau, J.P., and R. Kesraoui. 1986. Glycosidic bonds between lignin and carbohydrates.
Holzforschung. 40: 163-168.
Kaar, W.E., C.V. Gutierrez, and C.M. Kinoshita. 1998. Steam explosion of sugarcane bagasse as
a pretreatment for conversion to ethanol. Biomass Bioenerg. 14(3): 277-287.
Kamitsuji, H., Y. Honda, T. Watanabe, and M. Kuwahara. 2005. Mn2+ is dispensable for the
production of active MnP2 by Pleurotus ostreatus. Biochem. Biophys. Res. Commun.
327: 871-876.
Kaparaju, P., M. Serrano, A.B. Thomsen, P. Kongjan, I. Angelidaki. 2009. Bioethanol,
biohydrogen and biogas production from wheat straw in a biorefinery concept. Bioresour.
Technol. 100: 2562-2568.
Kerr, A.J., and D.A.I. Goring. 1975. The ultrstructural arrangement of wood cell wall. Cellul.
Chem. Technol. 9: 563-573.
Kersten, P.J., B. Kalyanaraman, K.E. Hammel, B. Reinhammar, and T.K. Kirk. 1990.
Comparison of lignin peroxidase, horseradish peroxidase and laccase in the oxidation of
methoxybenzenes. Biochem. J. 268(2): 475-80.
Kirk, T.K., W.J. Connors, R.D. Bleam, and G. Jeikus. 1976. Requirements for a growth substrate

26
during lignin decomposition by two wood-rotting fungi. Appl. Environ. Microbiol. 32:
192-194.
Kirk, T.K., W.J. Connors, R.D. Bleam, W.F. Hackett, and J.G. Jeikus. 1975. Preparation and
microbial decomposition of synthetic [14C] lignins. Proc. Natl. Acad. Sci. USA. 72:
2515-2519.
Klinke, F.I.B., L. Olsson, A.B. Thomsen, and B.K. Ahring. 2003. Potential inhibitors found from
wet oxidation from wheat straw and their effect on ethanol production of Saccharomyces
cerevisiae: wet oxidation and fermentation by yeast. Biotechnol. Bioeng. 81: 738-747.
Kunamneni, A., A Ballesteros, F.J. Plou, and M. Alcade. 2007. Fungal laccases-a versatile
enzyme for biotechnological applications. In: A. Mendez-Vilas, editor, Communicating
current research and educational topics and trends in applied microbiology. Formatex,
Badajoz, Spain. p. 233-244.
Lam, T.B.T., K. Iiyama, and B.A. Stone. 1990. Distribution of free and combined phenolic acids
in wheat internodes. Phytochem. 29: 429-433.
Lancaster, D.L., A.W. Redo, and V.A. Gibleault. 1977. Evaluation of biological thatch
decomposing materials. California Turfgrass Culture. 27: 29-30.
Landreth, J., D. Karcher, and M. Richardson. 2008. Cultivating to manage organic matter in sand
based putting greens: University of Arkansas researchers provide important insight for
managing organic buildup on putting greens. USGA Turfgrass Environ. Res. Online
46(1): 16-19.
Latham, J.M. 1955. Symposium: Controlling thatch development with fertilization. Proc. Florida
Turfgrass Manage. Conf. 3: 52-54.
Ledeboer, F.B., and C.R. Skogley. 1967. Investigations into the nature of thatch and methods for

27
its decomposition. Agron. J. 59: 320-323.
Li, K., F. Xu, and K.-E. L. Erikson. 1999. Comparison of fungal laccases and redox mediators in
oxidation of non-phenolic lignin model compound. App. Environ. Microbiol. 65: 2654-
2660.
Mao, J.-D., K.M. Holtman, and D. Franqui-Villanueva. 2010. Chemical structures of corn stover
and its residue after dilute acid prehydrolysis and enzymatic hydrolysis: insight into
factors limiting enzymatic hydrolysis. J. Agric. Food Chem. 58: 11680-11687
Martin, D.P. and J.B. Beard. 1975. Procedure for evaluating the biological degradation of
turfgrass thatch. Agron. J. 67: 835-836.
Martin, S.B., and J.L. Dale. 1980. Biodegradation of turf thatch with wood-decay fungi.
Phytopathology. 70: 297-301.
Martinez, A.T. 2002. Molecular biology and structure-function of lignin-degrading heme
peroxidases. Enzyme Microbiol. Technol. 30: 425-444.
Martinez, A.T., M. Speranza, F. J. Ruiz-Duenas, P. Ferreira, S. Camarero, and F. Guillen. 2005.
Biodegradation of lignocellulosics: microbial, chemical, and enzymatic aspects of the
fungal attack of lignin. International Microbiol. 8: 195-204.
Matsushita, Y., T. Inomata, T. Hasegawa, and K. Fukushima. 2009. Solubilization and
functionalization of sulfuric acid lignin generated during bioethanol production from
woody biomass. Bioresour. Technol. 100: 1024-1026.
McCarty, L.B. 2005. Best golf course management practices. 2nd ed. Prentice Hall Inc. Upper
Saddle River, NJ.
McCarty, L. B., M.F. Gregg, and J.E. Toler. 2007. Thatch and mat management in an established
creeping bentgrass green. Agron. J. 99: 1530-1537.

28
McCarty, L.B., M.F. Gregg, J.E. Toler, J.J. Camberato, and H.S. Hill. 2005. Minimizing thatch
and mat development in a newly seeded creeping bentgrass golf green. Crop Sci. 45:
1529-1535.
McGinnis, G.D. 1983. Biomass pretreatment with water and high pressure oxygen- the wet
oxidation process. Ind. Eng. Chem. Prod. Res. Dev. 22: 352-357.
McWhirter, E.L., and C.Y. Ward. 1976. Effect of vertical mowing and aerification of golf green
quality. Mississipi Agric. For. Exp. Stn. Res. Rep. 2 (12): 1-2.
Meinhold, J.H., R.L. Duble, R.W. Weaver, and E.C. Holt. 1973. Thatch accumulation in
bermudagrass turf in relation to management. Agron. J. 65: 833-835.
Messerschmidt, A., and R. Huber. 1990. The blue oxidases, ascorbate oxidase, laccase and
ceruloplasmin. Modelling and structural relationships. Eur. J. Biochem. 187: 341-352.
Mester, T., E. Varela, and M. Tien. 2004. Wood degradation by brown-rot and white-rot fungi.
The Mycota II: Genetics and biotechnology. 2nd edition. Springer-Verlag, Berlin,
Heidelberg.
Morozova, O.V., G.P. Shumakovich, M.A. Gorbacheva, S.V. Shleev, and A.I. Yaropolov. 2007.
“Blue” laccases. Biochem. 72: 1136-1412.
Murdoch, C.L., and J.P. Barr. 1976. Ineffectiveness of commercial microorganism inoculums in
breaking down thatch in common bermudagrass in Hawaii. HortScience. 11: 488-489.
Murray, J.J., and F.V. Juska. 1977. Effect of management practices on thatch accumulation, turf
quality, and leaf spot damage in common Kentucky bluegrass. Agron. J. 69: 365-369.
Musser, H.B. 1960. Topdressing: Its preparation and use. Golf Course Rep. 28: 16-22.
Otjen, L., and R. Blanchette. 1987. Assessment of 30 white rot basidiomycetes for selective
lignin degradation. Holzforschung. 41: 343-349.

29
Petersson, A., M.H. Thomsen, H. Hauggaard-Nielson, and A.B. Thomsen. 2007. Potential
bioethanol and biogass production using lignocellulosic biomass from winter rye, oilseed
rape and faba bean. Biomass Bioenergy. 31: 812-819.
Potthast, A., T. Rosenau, C.L. Chen, and J.S. Gratzl. 1995. Selective Enzymic Oxidation of
Aromatic Methyl Groups to Aldehydes. J. Org. Chem, 60: 4320-4321.
Ralph, J., J.H. Grabber, R.D. Hatfield. 1995. Lignin-ferulate crosslinks in grasses: Active
incorporation of of ferulate polysaccharide esters into ryegrass lignins. Carbohyd. Res.
275: 167-178.
Ralph, J., K. Lundquist, G. Brunow, F. Lu, H. Kim, and P.F. Schatz. 2004. Lignins: Natural
polymers from oxidative coupling of 4-hydroxyphenylpropanoids. Phytochem. Review.
3: 29-60.
Reinhammar, B.R.M., and T.I. Vanngard. 1971. The electron-accepting sites in Rhus vernicifera
laccase as studied by anaerobic oxidation-reduction titrations. Eur. J. Biochem. 18: 463-
468.
Ridley, B.L., M.A. O’Neill, and D. Mohnen. 2001. Pectins: Structure, biosynthesis, and
oligogalacturonide-related signaling. Phytochem.57: 929-967.
Rodakiewicz-Nowak, J., A. Jarosz-Wilkolazka, and J. Luterek. 2006. Catalytic activity of
versatile peroxidase from Bjerkandera fumosa in an aqueous solutions of water-miscible
organic solvents. Appl. Catal. A-Gen. 308: 56-61.
Rodrigues, M.A.M., P. Pinto, R.M.F. Bazerra, A.A. Dias, C.V.M. Guedes, V.M.G. Cardosso,
J.W. Cone, L.M.M. Ferreira, J. Colaco, and C.A. Sequeira. 2008. Effects of enzyme
extracts isolated from white-rot fungi on chemical composition and in vitro digestibility
of wheat straw. Anim. Feed Sci. Technol. 141: 326-338.

30
Rodriguez Couto, S. 2007. Laccase from Trametes hirsuta grown on paper cuttings: Application
to synthetic dye decolorization at different pH values. Eng. Life Sci. 7: 229-234.
Ruiz, E., C. Cara, P. Manzanares, M. Ballesteros, and E. Castro. 2008. Evaluation of steam
explosion pre-treatment for enzymatic hydrolysis of sunflower stalks. Enzym. Microb.
Tech. 42: 160-166.
Sartain, J.B., and B.G. Volk. 1984. Influence of selected white-rot fungi and topdressings on the
composition of thatch components of four turfgrasses. Agron. J. 76: 359-362.
Satchell, J.E. 1967. Lumbricidae: In: A.Burges and F. Rad editors, Soil Biology. Academic
Press. N.Y.
Schmidt, A.S., and A.B. Thomsen. 1989. Optimization of wet oxidation pretreatment of wheat
straw. Bioresour. Technol. 64: 139-151.
Schoemaker, H.E., T.K. Lundell, A.I. Hatakka, and K. Pointek. 1994. The oxidation of veratryl
alcohol, dimeric lignin models and lignin by lignin peroxidase- the redox cycle revisited.
FEMS Microbiol. Rev. 13: 321-332.
Starkley, R.L. 1954. Soil microorganisms: The dynamic phase of the soil. Golf Course Rep. 22:
14-15.
Taherzadeh, M.J., R. Eklund, L. Gustafsson, C. Niklasson, and G. Linden. 1997.
Characterization and fermentation of dilute-acid hydrolyzates from wood. Ind. Eng.
Chem. Res. 36: 4659-4665.
Ten-Have, R., and P.J.M. Teunissen. 2001. Oxidative mechanisms involved in lignin degradation
by white-rot Fungi. Chemical Rev. 101: 3397-3414.
Thompson, W.R., Jr. 1967. Control of thatch in tifgreen bermudagrass. Proc. Florida Turfgrass
Manage. Conf. 15: 53-55.

31
Thurston, C.F. 1994. The structure and function of fungal laccases. Microbiol. 140: 19-16.
Tien, M., and T.K. Kirt. 1983. Lignin-degrading enzyme from the hymenomycetes
Phanerochaete chrysosporium burds. Science. 221: 661-663.
Tretheway, J.A.K., L.M. Campbell, and P.J. Harris. 2005. (1-3), (1-4)-β-D-Glucans in the cell
walls of the poales (Sensu lato): An immunogold labeling study using a monoclonal
antibody. Am. J. Bot. 92: 1669-1683.
Valli, K., H. Wariishi, and M.H. Gold. 1990. Oxidation of monomethoxylated aromatic
compounds by lignin peroxidase: Role of veratryl alcohol in lignin biodegradation.
Biochemistry. 29: 8535-8539.
Varga, E., A.S. Schmidt, K. Rekzey, A.B. Thomsen. 2003. Pretreatment of corn stover using wet
oxidation to enhance enzymatic digestibility. Appl. Biochem. Biotechnol. 104: 37-50.
Watanabe, T., J. Onishi, Y. Yamasaki, K. Yuko, S. Kaizu, T. Koshijima. 1989. Binding site
analysis of the ether linkages between lignin and hemicelluloses lignin-carbohydrate
complexes by DDQ oxidation. Agric. Biol. Chem. Tokyo. 55: 2233-2252.
Weston, J.B., and J.H. Dunn. 1985. Thatch and quality of Meyer zoysia in response to
mechanical cultivation and nitrogen fertilization. P. 449-458. In F. Lemaire (ed.) Proc.
5th Int. Turfgrass Res. Conf., Avignon, France. 1-5 July 1985. Institut National de la
Recherche Agronomique, Paris, France.
White, R.H., and R. Dickens. 1984. Thatch accumulation in bermudagrass as influenced by
cultural practices. Agron. J. 76: 19-22.
Wilkie, K.C.B. 1979. The hemicelluloses of grasses and cereals. Adv. Carbohyd. Chem.
Biochem. 36: 215-264.
Wong, D.W.S. 2009. Structure and action mechanism of ligninolytic enzymes. Appl. Biochem

32
Biotechnol. 157: 174-209.
Wyman, C.E. 1996. Handbook on bioethanol - production and utilization. Applied energy
Technology Series. Taylor & Francis, Washington, DC.

33
CHAPTER III
USE OF FUNGAL LACCASES TO FACILITATE BIODETHATCHING: A NEW
APPROACH1
1 Sidhu, S.S., Q. Huang, R.N. Carrow, and P.L. Raymer. Submitted to HortScience, 05/10/2012.

34
ABSTRACT
Formation of high organic content as thatch and/or mat layer is a major problem in
management of turfgrass golf greens. A greenhouse experiment using potted bentgrass (Agrostis
stolonifera L.) determined the efficacy of a ligninolytic enzyme, laccase, in reducing organic
matter accumulation in the thatch-mat layer. Laccase was added biweekly at 0, 0.206, 2.06, and
20.6 units of activity cm-2
with and without guaiacol (2-methoxyphenol), a mediator of laccase,
and sampling was performed after two and nine months. Parameters investigated included
thickness of organic layer, thatch layer and mat layer, organic matter content, saturated hydraulic
conductivity, and lignin content. Organic matter and thatch layer increased between the two
sampling dates in all treatments. Laccase was shown to be effective in slowing the rate of
accumulation of organic matter and thatch layer. After two months, application of 20.6 units cm-2
of laccase reduced organic layer thickness by 8.7% and extractive-free total lignin content by
8.4% when compared to non-treated control. After nine months, laccase application rates of 2.06
units cm-2
, reduced organic matter and thatch layer thickness by 15.6, and 45.0%, respectively
below levels observed in the non-treated control. Applications using 0.206 units cm-2
of laccase
were ineffective. Laccase application had only minor influences on turf quality. These positive
responses suggest laccase treatments could be a non-disruptive option for thatch and/or mat
control in bentgrass.
INTRODUCTION
Formation of thatch and mat layers is one of the major problems in management of
modern turfgrass golf greens. Thatch is a layer of organic matter that accumulates between the
soil and green turfgrass and contains both living and dead plant tissues intermingled tightly with
each other. Thatch consists of stolons, rhizomes, roots, crown tissue, leaf sheaths, and blades

35
(Engel, 1954; Roberts and Bredakis, 1960). The mat layer is generally below the thatch layer and
is distinguished from thatch by the presence of sand or soil intermingled with thatch as a result of
cultural practices like core aeration and topdressing (McCarty, 2005). A small amount of organic
matter reduces surface hardness, moderates soil temperature extremes, increases the resilience,
and improves wear tolerance of the turfgrass surface (Beard 1973); however, excessive thatch
and mat layers are undesirable in turfgrass.
High organic matter accumulation in the form of thatch-mat causes problems such as
decreased movement of oxygen through the thatch or mat zone, decreased saturated hydraulic
conductivity, and excessive water retention (Carrow, 2003; Hartwiger, 2004; McCarty et al.,
2007). These primary problems may further lead to secondary problems like wet wilt, soft
surface, black layer, limited rooting, and extra- and intra-cellular freezing damage (Beard, 1973;
Carrow, 2004; O’Brien and Hartwiger, 2003). Although structured organic matter, present in live
underground plant tissues, is thought to have no adverse effect on the soil physical properties,
rapid root death that results in dead gelatinous organic matter swells in the presence of water
during decomposition and plugs the soil macro-pores (air-filled pores), causing low oxygen
levels in the root zones (Carrow, 2004; O’Brien and Hartwiger, 2003). Excessive accumulation
of organic matter causes anaerobic conditions, further reducing the rate of organic matter
decomposition (McCoy, 1992). Grasses also generally produce more adventitious roots (surface
roots) during anaerobic conditions again further increasing organic matter content (Carrow
2004).
Thatch management techniques such as core aeration, vertical mowing, grooming, and
topdressing are currently the most effective strategies to manage thatch-mat buildup but have
shown contrasting results (Barton et al., 2009; Carrow et al., 1987; Dunn et al., 1981; McCarty et

36
al., 2005; McWhirter and Ward, 1976; Weston and Dunn, 1985; White and Dickens, 1984).
These cultural practices are intensive in terms of cost, energy, and labor and have adverse effects
on turfgrass quality (Barton et al., 2009; Landreth et al., 2008; McCarty et al., 2007). Several
non-destructive thatch control studies using glucose, cellulase solutions, (Ledeboer and Skogley,
1967) and commercial inocula containing various microorganisms were ineffective in reducing
the amount of thatch (McCarty et al., 2005; Murdoch and Barr, 1976). Reduction in cellulose
content and total oxidizable organic matter of bermudagrass (Cynodon dactylon L.) and
centipedegrass (Eremochloa ophiuroides) (Sartain and Volk, 1984) and weight loss of
bermudagrass pellets, St. Augustinegrass (Stenotaphrum secundatum [Walt.] Kuntze) and
zoysiagrass (Zoysia japonica Stued., ‘Meyer’) stolons (Martin and Dale, 1980) were observed
when inoculated with different wood-decaying fungi under controlled greenhouse and laboratory
conditions. However, field inoculation experiments on bermudagrass showed no thatch
degradation (Martin and Dale, 1980).
The formation of the thatch-mat layer is due to a greater rate of organic matter
accumulation than degradation (Beard, 1973). Most microbial degradation mechanisms are
restricted by the presence of lignin, a plant cell wall constituent. The slow decomposition of soil
lignin has long been recognized (Kirk and Farrel, 1987). Lignin limits the accessibility of
microbial degraders to more biodegradable plant materials, such as cellulose and hemicelluloses
(Ledeboer and Skogley, 1967). Lignin is formed in plants by oxidative coupling of mono-lignols
of three primary hydroxycinnamyl alcohols: p-coumaryl, coniferyl and sinapyl alcohols. The
corresponding lignin monomers are known as p-hydroxy phenyl, guaiacyl and syringyl units,
respectively (Wong, 2009). Lignification is achieved by cross linking of monomers with a
growing polymer via polymer-polymer coupling. Based on the random coupling theory, several

37
models of lignin molecular structure have been proposed but these models do not imply any
particular sequence of monomeric units in the lignin macromolecule (Chen and Sarkanen, 2003;
Davin and Lewis, 2003).
Natural degradation of lignin occurs in the environment by certain white-rot fungi which
solubilize and mineralize lignin with the help of lignolytic enzymes (Kirk et al., 1975; Kirk et al.,
1976). White-rot fungi preferentially attack lignin more than cellulose or hemicellulose in the
wood tissue (Blanchette, 1984; Mester et al., 2004). This process of selective delignification
exposes cellulosic materials for further bacterial degradation in the environment (Otjen and
Blanchette, 1987). Presence of naturally-occurring (guaiacol) and synthetic (1-
hydroxybenzotriazole, HBT) chemicals, known as mediators, have shown to enhance the activity
of the lignolytic enzyme laccase (Kang et al., 2002; Roper et al., 1995). As lignin content in
thatch layer is higher than that of live grass tissues, the thatch layer in turfgrass species with high
lignin content is more resistant to microbial decomposition (Beard, 1973; Ledeboer and Skogley,
1967).
We hypothesize that the use of lignin-degrading enzymes such as fungal laccases can
effectively reduce the rate of thatch layer accumulation in golf greens. The objectives of our
study were: 1) to determine if degradation of soil organic matter can be enhanced by laccase
application; 2) to determine if addition of guaiacol enhances laccase efficacy in organic matter
decomposition; and 3) to determine if application of laccase enzyme and guaiacol adversely
affect turf quality.
MATERIALS AND METHODS
A greenhouse experiment was conducted using “Crenshaw” creeping bentgrass Agrostis
stolonifera L. (Engelke et al., 1995), established in pots (top diam. 15 cm, height 11.5 cm) at The

38
University of Georgia, Griffin Campus from October 2008 to July 2009. The bentgrass was
acquired from East Lake Country Club, Atlanta, Georgia. Pots were partially filled with 85:15
sand and organic matter mix and sod approximately 3 cm in thickness was cut to fit the pots and
placed on top of the mix. All pots were established in June 2008 and grown under management
conducive to thatch development in a controlled environment greenhouse for approximately four
months prior to initiation of treatments. Pots were irrigated daily, fertilized monthly with a 50-
mL solution of 0.4% (w/v) Macron water soluble 28-7-14 fertilizer (Lesco. Strongsville, OH),
and maintained by hand clipping weekly at a height of 0.6 cm with clippings removed. The
refrigerated air conditioned greenhouse was maintained at 25± 2 / 18 ±2oC, day/night
temperature by a Wadsworth Step 50 controller (Wadsworth Control System, Arvada, CO) under
natural lighting (approximately 85% ambient light).
The treatment design was as a four by two factorial with all combinations of four levels
of laccase and two levels of guaiacol (2-methoxyphenol). The four laccase activity levels were 0
(control), 0.206, 2.06 and 20.6 units cm-2
and guaiacol levels were 0 and 0.1 M solution. The
experimental design was a randomized complete block with five replications and sampling times
of two and nine months. Forty milliliter solutions of the different laccase activity levels and 10
mL of guaiacol solutions were applied uniformly every two weeks to each pot using a hand-held
sprayer. The control pots were treated with equivalent amounts of distilled water. After the two
months of treatment applications the 20.6 units cm-2
treatments with and without guaiacol were
discontinued due to limited availability of laccase enzyme. Due to unexpected problems in
developing protocols for measurement of saturated hydraulic conductivity, one replication was
rendered unusable for measurement of other variables. Therefore, only four replications were
used for analysis after nine months treatment duration.

39
Laccase Activity Assay
The laccase enzyme from Trametes versicolor, a white-rot fungus, was purchased from
Sigma-Aldrich (product 53739, Sigma Aldrich Inc., St. Louis, MO.). Laccase solutions were
standardized based on active units which were quantified using a UV/VIS-spectrophotometer by
a colorimetric assay. One activity unit of laccase corresponds to the amount of enzyme that
causes an absorbance change at 468 nm at a rate of 1.0 unit min-1
in 3.4 mL of 1 mM 2,6-
dimethoxyphenol, a specific substrate for laccase, in citrate-phosphate buffer at pH 3.8 (Park et
al., 1999). Laccase activity treatments of 0 (control), 0.206, 2.06 and 20.6 units cm-2
actually
correspond to laccase solutions with activity levels of 0, 0.912, 9.12 and 91.2 units mL-1
,
respectively. The activity level of laccase applied per unit area was calculated by dividing total
number of units of laccase in 40-mL laccase solution by the top surface area of the pot.
Measurements
Effectiveness of treatments was determined by measuring organic matter content (OM)
for a depth of 0-5.0 cm, organic layer thickness (OL), extractive-free acid-soluble lignin (LS) and
acid-insoluble lignin (LI) content after two and nine months of treatment application. Total lignin
(LT) was obtained by addition of acid-soluble and-insoluble lignin contents.
After nine months of treatment application, some additional variables were measured. OL
was subdivided into thatch layer thickness (OLT) and mat layer thickness (OLM), while organic
matter content (OM) was subdivided into 0-2.5, and 2.5-5.0 cm depths to more accurately reflect
the effectiveness of laccase on the thatch and mat layers. Saturated hydraulic conductivity (SHC)
was also measured after nine months.

40
Organic Matter Content
The measurement of OM was performed as described by Carrow et al. (1987). Soil cores
(2.0 cm diam.) were dried in an oven at 100 ± 5oC for 48 h and weighed. Soil cores were ashed
in a muffle furnace at 600 ± 25oC for 24 h and weighed again. Organic matter content was
determined as the difference in the two readings and percent organic matter was calculated.
Saturated Hydraulic Conductivity
Intact cores (diam. 4.7 cm and length 7.7 cm) were obtained from the center of each pot
using a soil corer. The cores were collected in brass cylinders. The bottom of the core was
covered with a double layer of cheesecloth held in place with a rubber band. The core was
saturated overnight in a 0.05 N CaCl2 solution to minimize dispersion. A clear plastic cylinder of
the same diameter as of the brass cylinder was fastened above the brass cylinder with paraffin
wax tape. The SHC of the cores was measured by a constant hydraulic head method using a
Marriott tube apparatus. A time of 10-minutes was allowed for the establishment of steady state
flow through the samples. The volume of water that passed through the core was measured for
one minute and repeated three times. Saturated hydraulic conductivity was calculated using
Darcy's equation.
Organic Layer Thickness and Thatch-Mat Layer Thickness
After cores were removed for measurement of organic matter content and saturated
hydraulic conductivity, plants were removed from pots and distinct separations among the thatch,
mat, and soil interface were clearly visible. The organic layer (OL), thatch layer (OLT), and mat
layer (OLM) were measured from seven different locations around the edges of the plant/root
mass and averaged.

41
Extractive-free Lignin Content
Thatch was collected from each pot from the top 2.5 cm after sampling for OM and SHC.
Extractive-free acid-soluble (LS) and-insoluble (LI) lignin content in the thatch layer was
determined in a two-step hydrolysis procedure according to the laboratory analytical procedure
developed by The National Renewable Energy Laboratory (NREL, 2008). In the first step,
extractive-free thatch samples were hydrolyzed for 60 min with 72% H2SO4 at 30oC. In the
second step, H2SO4 was diluted to 4% and the samples were autoclaved at 121oC for 1 h. Acid-
soluble lignin was determined by measuring the absorbance of this hydrolysis liquid at 240 nm in
a UV/VIS spectrophotometer. The solids remaining after acid hydrolysis were dried in an oven at
100 ± 5oC for 24 h, weighed, ashed in a muffle furnace at 600 ± 10
oC for 24 h, and weighed
again. Weight difference was used to calculate the acid-insoluble lignin content.
Turf Quality
Turf quality was determined bi-weekly for the first three months and again for the last
two months of the experiment to document the potential for initial and long term phytotoxicity
associated with laccase application. The turf quality of each treatment was recorded every two
weeks by rating both visual turf quality and canopy spectral reflectance. Visual turf quality
ratings were rated on the basis of color, shoot density, and uniformity on a numerical scale where
1 equals no live turf and 9 equals ideal dark green, uniform turf (Johnson et al., 1987). Grass
index was determined using TCM 500 turf color meter (Spectrum Technologies, Plainfield, IL).
Grass index is a numerical score of the color and density of grass based on the spectral
reflectance at 660 and 850 nm. Three grass index readings were recorded from each pot and
averaged for statistical analysis.

42
Statistical Analysis
Analysis of variance (ANOVA) was performed to evaluate the main effects of treatment
duration, laccase, and guaiacol and interaction effects of these three factors using general linear
model (GLM) (SAS Institute, 1994). Strong treatment duration effects (P ≤ 0.001) were observed
in the initial analysis and therefore each treatment duration was analyzed separately using
ANOVA as a two factor study consisting of four levels of laccase enzyme and two levels of
guaiacol for the two months treatment duration and three levels of laccase enzyme and two levels
of guaiacol for the nine months treatment duration. Fisher’s protected LSD test with α = 0.05
was used for determining statistical differences among treatment means following each ANOVA.
RESULTS
The full statistical model was used to compare common parameters at the two and nine
month sampling dates (Table 3.1). The model included the main and interaction effects of
treatment duration, three levels of laccase, and two levels of guaiacol for organic matter (OM)
(0-5.0 cm), organic layer thickness (OL), acid-soluble (LS) and-insoluble lignin (LI). Only three
levels of laccase were used as the 20.6 units cm-2
laccase treatment was discontinued after two
months of application.
Treatment duration strongly affected OM (0-0.5 cm; P ≤ 0.001), OL (P ≤ 0.001), and LS
(P ≤ 0.001) (Table 3.1). Laccase application significantly affected OM (0-5.0 cm), OL, LS and
LI. The very strong interactions for treatment duration and laccase treatment observed in OM (0-
0.5 cm; P ≤ 0.001), OL (P ≤ 0.001), and LS (P ≤ 0.01) were largely due to the lack of response to
laccase treatments after two months as opposed to a strong response seen after nine months.
Guaiacol treatment as well as the interaction of guaiacol and treatment duration had no effect on
any of the parameters (Table 3.1).

43
We observed an overall increase in OM (0-5.0 cm) and OL in all treatments between the
two sampling dates. However, accumulation of OM (0-5.0 cm) and OL were significantly lower
in treatments containing laccase when compared to the control. When compared to the control,
the rate of accumulation of organic matter (0-5.0 cm) was reduced from 15.8 mg·g-1
in control
pots to 9.0 mg·g-1
in pots treated with 2.06 units cm-2
laccase (43%) (Table 3.2). Similarly,
application of 2.06 units cm-2
laccase reduced OL accumulation from 15.5 mm to 11.7 mm
(24%) when compared to the control (Table 3.2). A reduction in lignin content between the two
sampling dates was observed at laccase activity levels of 2.06 units cm-2
with and without
guaiacol (Table 3.3).
Analysis after Two Months Treatment
After two months of treatment application, laccase treatments had no effect on OM (0-5.0
cm) and OL but had significant effects on LS and LI (Table 3.1). Neither guaiacol nor the laccase
by guaiacol interaction had significant effects on any of the parameters (Table 3.1).
Compared to the control, treatment with 20.6 units cm-2
of laccase without guaiacol for two
months significantly lowered LS by 5.2, LI by 20.5, and LT content by 25.6 mg·g-1
(Table 3.3).
Similarly, treatment at the same laccase activity with guaiacol reduced LS by 4.2, LI by 18.9, and
LT by 23.4 mg·g-1
when compared to control. Treatment with 2.06 units cm-2
of laccase with
guaiacol also significantly reduced LS by 1.4 mg·g-1
(Table 3.3).
Analysis after Nine Months Treatment
After nine months of treatment application, laccase application impacted OM (0-5.0, and
0-2.5 cm), SHC, OL, OLT, LS, and LI and SHC (P ≤ 0.001) (Table 3.1). A significant effect of
guaiacol was also observed for LS (P ≤ 0.05) and SHC (P ≤ 0.01) (Table 3.1). The interaction of

44
laccase by guaiacol was significant (P ≤ 0.01) for SHC. However, none of the treatments
affected OM (2.5-5.0 cm) and mat layer thickness after nine months of treatment application.
Treatment with 2.06 units cm-2
of laccase with and without guaiacol decreased OL by
10.8 and 9.5 mm, respectively when compared to the control (Table 3.2). These same treatments
reduced OLT by 8.3 (45%) and 6.5 mm (35%) when compared to the control (Fig. 3.1). Laccase
applied at same activity was effective in reducing OL and OM while laccase application at 0.206
units cm-2
was not different from the control (Table 3.2, Fig. 3.2).
Treatment with 2.06 units cm-2
laccase with and without guaiacol reduced OM (0-5.0 cm)
by 7.6 and 7.8 mg·g-1
, and OM (0-2.5) by 25.9 and 30.3 mg·g-1
, respectively as compared to the
control (Table 3.2, Fig. 3.2). Similarly, treatment with 2.06 units cm-2
laccase with and without
guaiacol increased SHC by 21.6 (322%) and 6.3 cm h-1
(94%), respectively over the control (Fig.
3.3). When compared with control, treatment with 2.06 units cm-2
laccase without guaiacol
reduced LS by 5.1, LI by 14.0, and LT by 19.0 mg·g-1
, respectively (Table 3.3).
Turf Quality
No significant differences in visual quality ratings were observed among the treatments
except for the data collected after thirty eight weeks where 2.06 units cm-2
of laccase exhibited a
slight but significant reduction in turf quality when compared to the control treatment (Table
3.4). No significant differences from the control were observed for any treatment when means of
the visual ratings were compared for the early (2 to 12 weeks), late (32 to 38 weeks), and all
periods (Table 3.4). When compared to the control, pots receiving 20.6 units cm-2
laccase
treatment had a small but significant decrease in grass index at four and six weeks after treatment
initiation (Table 3.5). However, no significant differences in grass index values were observed

45
after six weeks of treatment application. No visual differences among treatments for turf color or
growth rate were observed over the duration of the experiment.
DISCUSSION
Laccase Application
This is the first study to report the direct application of laccase enzyme to manage thatch-
mat accumulation on creeping bentgrass. Application of laccase, especially at the 2.06 units cm-2
activity level, proved to be effective in reducing thatch-mat depth, OM, and significantly
increasing SHC. Carley et al. (2011) noted that the nature of temporal dynamics of organic
matter accumulation was for small annual changes resulting in long term effects. Our results
indicate that application of 2.06 units cm-2
laccase alters organic matter dynamics in a positive
manner by effectively reducing OM (0-2.5 cm) and OLT in comparison to the control. However,
an increase in OM (0-5.0 cm) and OL was observed for all the treatments over the experiment
duration. Application of laccase enzyme was effective in reducing the rate of accumulation of
thatch layer thickness and organic matter.
The 2.06 units cm-2
laccase treatment, after nine months of application, also resulted in
increased SHC where a three-and two-fold increase in SHC was observed with applications of
2.06 units cm-2
laccase with and without guaiacol, respectively. This increase can be explained
on the basis of thatch layer thickness of the corresponding treatment. Thatch layer thickness
more than 1.3 cm was reported to adversely affect water infiltration (McCarty et al., 2005).
Thatch layer thickness for the treatment 2.06 units cm-2
with and without guaiacol after nine
months of treatment was 11.2 and 13.0 mm, respectively.
For both the two and nine months sampling, no effect of guaiacol was observed and no
interaction effect with laccase was observed except for saturated hydraulic conductivity after

46
nine months of application. The 2.06 units cm-2
laccase treatment was ineffective when applied
with guaiacol after two months of application except for a reduction in extractive-free LS. The
significant replication effect observed for LS and LI for two and nine months, respectively may
be associated with incomplete acid-hydrolysis for some replications during autoclaving and
unavailability of additional sample materials for reanalysis.
The lowest level of laccase application (0.206 units cm-2
) proved to be an ineffective
treatment even after nine months of application for all the parameters measured. The 20.6 unit
cm-2
treatment was applied for two months and resulted in no reduction of OM (0-5.0 cm).
However, this treatment did result in a significant reduction in OL and extractive-free lignin
content (LS, LI, and LT) of the thatch layer.
Laccase application had only minor influences on turfgrass quality. A slight reduction in
turf quality was indicated by lower grass index values during the first four to six weeks in
response to the 20.6 units cm-2
laccase treatment. However, visual quality ratings were not
significantly different from controls except for one treatment combination at 38 weeks.
Treatment Duration
If laccase was effective in enhancing organic matter degradation, it would seem
reasonable to expect that effects would become more apparent over time. Samples were analyzed
after two and nine months of treatment application. Laccase activity levels of 0.206 and 2.06
units cm-2
area were continued for nine months. It was observed that treatment duration, and the
interaction of treatment duration with laccase treatments had a significant effect on OM (0-5.0
cm), OL, and LS content.

47
Why Laccase Application?
Studies in the past using various cultural management practices with different cultivation
frequencies have reported contrasting results for reduction in thatch-mat accumulation (Callahan
et al., 1998; Carrow et al., 1987; Engel and Alderfer, 1967; McCarty et al., 2005; Rieke, 1994).
Degradation of thatch-mat is reported either in terms of thatch-mat depth (Smiley et al., 1985;
Soper et al., 1988) or in terms of thatch-mat depth and organic matter content by weight (Barton
et al., 2009; McCarty et al., 2007). The organic matter content by weight in different studies is
observed for different depths further making it difficult to compare the results (Barton et al.,
2009; McCarty et al., 2005; Murray and Juska, 1977). In our study, however, we observed both
organic layer thickness (thatch layer and mat layer) and organic matter content in order to
provide a better comparison of the effectiveness of laccase on thatch-mat degradation.
Cultural practices like core aeration and vertical mowing are disruptive in nature and
have shown to reduce the turf quality both aesthetically and physically, further reducing the
playability of the turf (Barton et al., 2009; Landreth et al., 2008; McCarty et al., 2007). However,
application of laccase is not disruptive and the effective treatment of 2.06 units cm-2
laccase for
nine months showed no reduction in turf quality of bentgrass.
Several non-destructive studies in the past using different treatments like sugars, mixtures
of sugars and microbial inocula, and some enzymes like cellulase, proved ineffective (Ledeboer
and Skogley, 1967; Martin and Dale, 1980; McCarty et al., 2005; Murdoch and Barr, 1976).
Most of these studies intended to increase microbial population to degrade organic matter. But it
is difficult to maintain higher microbial populations over sustained period of time under field
turfgrass management systems due to the inability to maintain proper micro-environment
conditions required by particular microbial populations. Another reason that such studies were

48
ineffective may be that they were focused on degradation of cellulose and hemicellulose by using
cellulase enzyme and by increasing bacterial populations. Whereas, our hypothesis is that lignin
degradation will open the cell wall structure of thatch biomass, hence making cellulose and
hemicellulose more available for further microbial degradation. In our study, we used the end
product from the white-rot fungi Trametes versicolor, the laccase enzyme, which is stable over a
wide pH and temperature (Baldrian, 2006; Munoz et al., 1997; Stoilova et al., 2010; Thurston,
1994) to degrade lignin and to facilitate dethatching.
CONCLUSIONS
This greenhouse research demonstrated that bi-weekly application of laccase enzyme at
2.06 units cm-2
can be effective in reducing the rate of accumulation of organic matter in highly
maintained turf. However, low activity levels of laccase (0.206 units cm-2
) were ineffective in
reducing the rate of thatch accumulation. Laccase application had little effect after two months
but significantly reduced organic matter after nine months. Implications of these findings point
to a novel approach to reduce organic matter in thatch or mat and its associated problems on golf
greens. This approach can lead to the development of a new non-disruptive method for thatch
management. Future research is needed to observe the effectiveness of laccase under field
conditions as well as to optimize the activity level of laccase and the frequency of its application.
LITERATURE CITED
Baldrian, P. 2006. Fungal laccases-occurrence and properties. FEMS Microbiol Rev. 30: 215-
242.
Barton, L., G.G.Y. Wan, R.P. Buck, and T.D. Colmer. 2009. Effectiveness of cultural thatch-mat
controls for young and mature kikuyu turfgrass. Agron. J. 101: 67-74.
Beard, J.B. 1973. Turfgrass: Science and culture. Prentice Hall Inc., Englewood Cliffs, NJ.

49
Blanchette, R.A. 1984. Screening wood decayed by white rot fungi for preferential lignin
degradation. Appl. Environ. Microbiol. 48: 647-653.
Callahan, L.L., W.L. Sanders, J.M. Parham, C.A. Harper, L.D. Lester, and E.R. McDonald.
1998. Cultural and chemical controls of thatch and their influence on rootzone nutrients
in bentgrass green. Crop Sci. 38: 181-187.
Carley, D.S., D. Goodman, S. Sermons, W. Shi, D. Bowman, G. Miller, and T. Rufty. 2011. Soil
organic matter accumulation in creeping bentgrass greens: A chronosequence with
implications for management and carbon sequestration. Agron. J. 103 (3): 604-610.
Carrow, R.N. 2003. Surface organic matter in bentgrass greens. USGA Turfgrass Environ. Res.
Online 2(17): 1-10.
Carrow, R.N. 2004. Surface organic matter in bentgrass greens. Golf Course Mgt. 72(5): 96-101.
Carrow, R.N., B.J. Johnson, and R.E. Burns. 1987. Thatch and quality of Tifway bermudagrass
turf in relation to fertility and cultivation. Agron. J. 79: 524-530.
Chen, Y.R., and S. Sarkanen. 2003. Macromolecular lignin replication: A mechanistic working
hypothesis. Phytochemistry Rev. 2: 235-255.
Davin, L.B. and N.G. Lewis 2003. A historical perspective on lignin biosynthesis: Monolignol,
allylphenol and hydroxycinnamic acid coupling and downstream metabolism.
Phytochemistry Rev. 2: 257-288.
Dunn, J.H., K.M. Sheffer, and P.M. Halisky. 1981. Thatch and quality of Meyer zoysia in
relation to management. Agron. J. 73: 949-952.
Engel, R.E. 1954. Thatch on turf and its control. Golf Course Rep. 22 (5): 12-14.
Engel, R.E., and R.B. Alderfer. 1967. The effect of cultivation, top-dressing, lime, N, and
wetting agent on thatch development on 1/4-inch bentgrass over a 10-year period. N.J.

50
Agric. Exp. Stn. Bull. 818: 32-45.
Engelke, M.C., V.G. Lehman, W.R. Kneebone, P.F. Colbaugh, J.A. Reinert, and W.E. Knoop.
1995. Registration of ‘Crenshaw’ creeping bentgrass. Crop Sci. 35: 589.
Hartwiger, C. 2004. The importance of organic matter dynamics: How research uncovered the
primary cause of secondary problems. USGA Green Section Record 42(3): 9-11.
Johnson, B.J., R.N. Carrow, and R.E. Burns. 1987. Bermudagrass turf response to mowing
practices and fertilizer. Agron. J. 79: 677-680.
Kang, K.H., J. Dec, H. Park, and J.M. Bollag. 2002. Transformation of the fungicide cyprodinil
by a laccase of Trametes villosa in presence of phenolic mediators and humic acid. Water
Res. 36: 4907-15.
Kirk, T.K., and R.L. Farrell. 1987. Enzymatic “combustion”: The microbial degradation of
lignin. Annu. Rev. Microbiol. 41: 465-501.
Kirk, T.K., W.J. Connors, R.D. Bleam, and G. Jeikus. 1976. Requirements for a growth substrate
during lignin decomposition by two wood-rotting fungi. Appl. Environ. Microbiol. 32:
192-194.
Kirk, T.K., W.J. Connors, R.D. Bleam, W.F. Hackett, and J.G. Jeikus. 1975. Preparation and
microbial decomposition of synthetic [14
C] lignins. PNAS. 72: 2515-2519.
Landreth, J., D. Karcher, and M. Richardson. 2008. Cultivating to manage organic matter in sand
based putting greens: University of Arkansas researchers provide important insight for
managing organic buildup on putting greens. USGA Turfgrass Environ. Res. Online
46(1): 16-19.
Ledeboer, F.B., and C.R. Skogley. 1967. Investigations into the nature of thatch and methods for
its decomposition. Agron. J. 59: 320-323.

51
Martin, S.B., and J.L. Dale. 1980. Biodegradation of turf thatch with wood-decay fungi.
Phytopathology. 70: 297-301.
McCarty, L.B. 2005. Best golf course management practices. 2nd
ed. Prentice Hall Inc. Upper
Saddle River, NJ.
McCarty, L. B., M.F. Gregg, and J.E. Toler. 2007. Thatch and mat management in an established
creeping bentgrass green. Agron. J. 99: 1530-1537.
McCarty, L.B., M.F. Gregg, J.E. Toler, J.J. Camberato, and H.S. Hill. 2005. Minimizing thatch
and mat development in a newly seeded creeping bentgrass golf green. Crop Sci. 45:
1529-1535.
McCoy, E. L. 1992. Quantitative physical assessment of organic materials used in sports turf
rootzone mixes. Agron. J. 84: 375-381.
McWhirter, E.L., and C.Y. Ward. 1976. Effect of vertical mowing and aerification on golf green
quality. Mississippi Agric. For. Exp. Stn. Res. Rep. 2 (12): 1-2.
Mester, T., E. Varela, and M. Tien. 2004. Wood degradation by brown-rot and white-rot fungi.
The Mycota II: Genetics and biotechnology. 2nd
edition. Springer-Verlag, Berlin,
Heidelberg.
Munoz, C., F. Guillen, A.T. Martinez, and M.J. Martinez. 1997. Laccase isozymes of Pleurotus
eryngii: Characterization, catalytic properties, and participation in activation of molecular
oxygen and Mn2+
oxidation. App. Environ. Microbiol. 63: 2166-2174.
Murdoch, C.L., and J.P. Barr. 1976. Ineffectiveness of commercial microorganism inoculums in
breaking down thatch in common bermudagrass in Hawaii. HortScience. 11: 488-489.
Murray, J.J., and F.V. Juska. 1977. Effect of management practices on thatch accumulation, turf
quality, and leaf spot damage in common Kentucky bluegrass. Agron. J. 69: 365-369.

52
NREL- National Renewable Energy Laboratory. 2008. Determination of structural carbohydrates
and lignin in biomass. Available at: http://www.nrel.gov/biomass/pdfs/42618.pdf
(Verified 01 July, 2012). NREL, Golden, CO, USA.
O’Brien, P., and C. Hartwiger. 2003. Aeration and topdressing for the 21st century: Two old
concepts are linked together to offer up-to-date recommendations. USGA Green Section
Record 41(2): 1-7.
Otjen, L., and R. Blanchette. 1987. Assessment of 30 white rot basidiomycetes for selective
lignin degradation. Holzforschung. 41: 343-349.
Park, J. W., J. Dec, J. E. Kim, and J. M. Bollag. 1999. Effect of humic constituents on the
transformation of chlorinated phenols and anilines in the presence of oxidoreductive
enzymes or birnessite. Environ. Sci. Tech. 33: 2028-2034.
Rieke, P.E. 1994. Sand topdressing: where are we going? Golf Course Mgt. 62: 36-38.
Roberts, E.C., and E.J. Bredakis. 1960. What, why and how of turfgrass root development. Golf
Course Rep. 28: 13-24.
Roper, J.C., J.M. Sarkar, J. Dec, and J.M. Bollag. 1995. Enhanced enzymatic removal of
chlorophenols in the presence of co-substrates. Water Res. 29: 2720-2724.
Sartain, J.B., and B.G. Volk. 1984. Influence of selected white-rot fungi and topdressings on the
composition of thatch components of four turfgrasses. Agron. J. 76: 359-362.
SAS Institute Inc. 1994. The SAS system for windows. Release 9.2. SAS Inst., Cary, NC.
Smiley, R.W., M. Crawen Fowler, R.T. Kane, A.M. Petrovic, and R.A. White. 1985. Fungicide
effects on thatch depth, thatch decomposition rate, and growth of Kentucky bluegrass.
Agron. J. 77: 597-602.
Soper, D.Z., J.H. Dunn, D.D. Minner, and D.A. Sleper. 1988. Effects of clipping disposal,

53
nitrogen, and growth retardants on thatch and tiller density in zoysiagrass. Crop Sci. 28:
325-328.
Stoilova, I., A. Krastanov, and V. Stanchev. 2010. Properties of crude laccase from Trametes
versicolor produced by solid-substrate fermentation. Adv. Bioscience Biotech. 1: 208-
215.
Thurston, C.F. 1994. The structure and function of fungal laccases. Microbiol. 140: 19-16.
Weston, J.B., and J.H. Dunn. 1985. Thatch and quality of Meyer zoysia in response to
mechanical cultivation and nitrogen fertilization. P. 449-458. In F. Lemaire (ed.) Proc. 5th
Int. Turfgrass Res. Conf., Avignon, France. 1-5 July 1985. Institut National de la
Recherche Agronomique, Paris, France.
White, R.H., and R. Dickens. 1984. Thatch accumulation in bermudagrass as influenced by
cultural practices. Agron. J. 76: 19-22.
Wong, D.W.S. 2009. Structure and action mechanism of ligninolytic enzymes. Appl. Biochem
Biotechnol. 157: 174-209.

54
Table 3.1 Analysis of variance (ANOVA) table showing the effects of treatment duration, laccase application, guaiacol application,
and their interactions on creeping bentgrass maintained in a greenhouse.
Source of Variation df
Organic
layer
thickness
(OL)
Organic
matter
(OM)
(0-5.0 cm)
Acid-
soluble
lignin (LS)
Acid-
insoluble
lignin
(LI)
Total
lignin
(LT)
Thatch
layer
thickness
(OLT)
Mat layer
thickness
(OLM)
Organic
matter
(OM)
(0-2.5 cm)
Organic
matter
(OM)
(2.5-5.0 cm)
Saturated
hydraulic
conductivity
(SHC)
mm mg·g
-1 mg·g
-1 mg·g
-1 mg·g
-1 cm cm mg·g
-1 mg·g
-1 cm h
-1
mean square values
Full Model
Treatment duration 1 3649*** 2008*** 55.8*** 102 309**
Laccase 2 99.2*** 105*** 55.5*** 476*** 852***
Guaiacol 1 9.69 1.03 9.86 50.7 105
Duration*laccase 2 109*** 60.8*** 22.9** 84.4 193*
Duration*guaiacol 1 13.6 4.46 19.6 76.1 172
Error 42 7.71 5.83 2.82 30.2 36.1
2 Months
Rep 4 1.84 16.9 3.83 10.6 22.3
Laccase 3 20.8 16.7 50.1*** 760*** 1195***
Guaiacol 1 0.70 1.84 0.00028 0.01 0.01
Laccase*guaiacol 3 3.85 37.5 1.53 3.02 8.58
Error 28 8.08 7.61 0.96 32.3 33.2
9 Months
Rep 3 10.1 4.63 7.85 120 173 7.39 1.68 194 6.14 3.23
Laccase 2 192*** 143*** 66.6*** 430*** 835*** 96.0*** 16.5 1660*** 27.4 451***
Guaiacol 1 21.9 4.40 25.7* 113 246* 4.53 6.52 192 4.05 193***
Laccase*guaiacol 2 3.55 2.99 5.80 35.5 71.1 1.35 8.79 153 1.04 140***
Error 15 8.72 8.13 4.07 13.1 13.0 4.03 11.2 100 8.27 3.44
* Significant at the 0.05 probability level
**Significant at the 0.01 probability level
*** Significant at the 0.001 probability level

55
Table 3.2 Organic layer thickness (OL) and organic matter (OM) content (0-5.0 cm depth) after two and nine months of different
treatments applied to creeping bentgrass.
Organic layer thickness Organic matter (0-5.0)
Treatmentz
2 Months 9 Months 2 Months 9 Months
--------- mm --------- --------- mg·g-1
-----------
0L (Control) 48.4ay B
x 69.3a A
33.7a B 49.5a A
0L+G 47.4a B
68.2ab A 34.4a B 47.3a A
0.206L 45.7a B
67.3ab A 36.4a B 50.0a A
0.206L+G 47.6a B
63.8bc A 34.3a B 49.4a A
2.06L 48.1a B
59.8cd A 32.7a B 41.7b A
2.06L+G 47.7a B
58.5d A 35.0a B 41.9b A
20.6L 44.2b
- 36.3a -
20.6L+G 45.1a
- 33.9a -
zL denotes Laccase level and G the addition of Guaiacol, a mediator.
yMeans within a column followed by the same lowercase letter are not significantly different according to Fisher’s protected LSD at
α=0.05. xMeans in a row within a parameter followed by the same uppercase letter are not significantly different according to Fisher’s
protected LSD at α=0.05.

56
Table 3.3 Extractive-free acid-soluble (LS), acid-insoluble (LI), and total lignin (LT) content after two and nine months of different
treatments applied to creeping bentgrass.
Acid-soluble lignin Acid-insoluble lignin Total lignin
Treatmentz
2 Months 9 Months 2 Months 9 Months 2 Months 9 Months
-------- mg·g-1
--------- -------- mg·g-1
--------- -------- mg·g-1
---------
0L (Control) 43.7aby A
x 42.2b A
259.9a A
257.4b A
303.5ab A
299.7b A
0L+G 43.8ab A 45.8a A
260.1a A
264.8a A
303.9a A
310.6a A
0.206L 44.1a A
41.4b A
256.9a A
254.5bc A
301.0ab A
295.9b A
0.206L+G 43.3abc A
41.4b A
255.4a A
253.9bc A
298.8ab A
295.5b A
2.06L 42.7bc A
37.1c B
254.0a A
243.4d B
296.7ab A
280.4d B
2.06L+G 42.3c A
39.5bc B
253.9a A
249.6c A
296.2b A 289.0c B
20.6L 38.5d
- 239.4b - 277.9c
-
20.6L+G 39.5d
- 241.0b
- 280.1c
-
zL denotes Laccase level and G the addition of Guaiacol, a mediator.
yMeans within a column followed by the same lowercase letter are not significantly different according to Fisher’s protected LSD at
α=0.05. xMeans in a row within a parameter followed by the same uppercase letter are not significantly different according to Fisher’s
protected LSD at α=0.05.

57
Table 3.4 Mean visual turf quality ratings of creeping bentgrass made over time following continued treatment with different laccase
and guaiacol solutions to greenhouse grown plants.
Weeks
Early Late
Treatmentsz
2 4 6 8 10 12 32 34 36 38 Early Late All
------------------------------------------------------ Visual turfgrass qualityy ----------------------------------------------------
0L (Control) 7.1abx
6.7a 8.3ab 7.8a 7.2a 8.0ab 7.9a 7.9a 8.3a 8.5a 7.5a 8.0a 7.8a
0L+G 7.0ab 6.9a 8.1ab 7.7a 7.1a 8.1a 7.8a 7.7a 8.1a 8.4a 7.4a 7.9a 7.8a
0.206L 7.2a 6.8a 8.2ab 7.6a 7.1a 7.9ab 8.0a 8.0a 8.1a 8.4a 7.4a 7.8a 7.8a
0.206L+G 7.0a 6.7a 8.0b 7.8a 7.3a 7.8b 7.7a 7.6a 8.3a 8.3ab 7.4a 7.8a 7.5a
2.06L 7.2a 7.0a 8.3ab 7.8a 7.4a 7.9ab 7.9a 7.9a 8.1a 8.1b 7.5a 7.9a 7.6a
2.06L+G 6.9ab 6.7a 8.4ab 7.8a 7.3a 7.7b 7.9a 8.0a 8.2a 8.4a 7.4a 7.9a 7.6a
20.6L 6.7b 6.9a 8.4a 7.8a - - - - - - 7.5a - -
20.6L+G 6.9ab 6.7a 8.2ab 7.9a - - - - - - 7.5a - -
zL denotes Laccase level and G the addition of Guaiacol, a mediator.
yTurf quality was visually rated on a 1 to 9 scale with 9=outstanding, 6=acceptable, and 1=dead.
xMeans within a column followed by the same letter are not significantly different according to Fisher’s protected LSD at α=0.05.

58
Table 3.5 Mean grass index values of creeping bentgrass made over time following continued treatment with different laccase and
guaiacol solutions to greenhouse grown plants.
Weeks
Early Late
Treatmentsz
2 4 6 8 10 12 32 34 36 38 Early Late All
------------------------------------------------------- Grass Indexy ---------------------------------------------------------
0L (Control) 7.03abx
6.47a 7.47a 6.71a 7.70a 8.17ab 8.15a 8.23a 9.14a 9.34a 6.92a 8.46a 7.84a
0L+G 7.11ab 6.45a 6.96ab 6.53a 7.94a 8.31a 8.20a 8.47a 9.04a 9.06a 6.76a 8.50a 7.81a
0.206L 7.21a 6.40ab 7.11ab 6.55a 7.70a 7.96ab 8.22a 7.93a 9.07a 9.10a 6.82a 8.33a 7.73a
0.206L+G 7.15ab 6.33ab 6.90ab 6.53a 7.61a 7.84b 8.36a 8.10a 9.06a 9.34a 6.73a 8.39a 7.72a
2.06L 7.10ab 6.44a 7.27ab 6.53a 7.66a 8.14ab 8.10a 8.29a 9.07a 9.33a 6.84a 8.43a 7.79a
2.06L+G 6.94ab 6.19ab 7.50a 6.49a 7.84a 8.20ab 8.16a 8.10a 9.20a 9.12a 6.78a 8.43a 7.77a
20.6L 6.68b 6.02b 6.70b 6.72a - - - - - - 6.53b - -
20.6L+G 6.92ab 6.16ab 6.96ab 6.74a - - - - - - 6.73a - -
zL denotes Laccase level and G the addition of Guaiacol, a mediator.
yGrass index was recorded using TCM 500 based on the spectral reflectance with higher value representing higher quality
xMeans within a column followed by the same letter are not significantly different according to LSD at α=0.05.
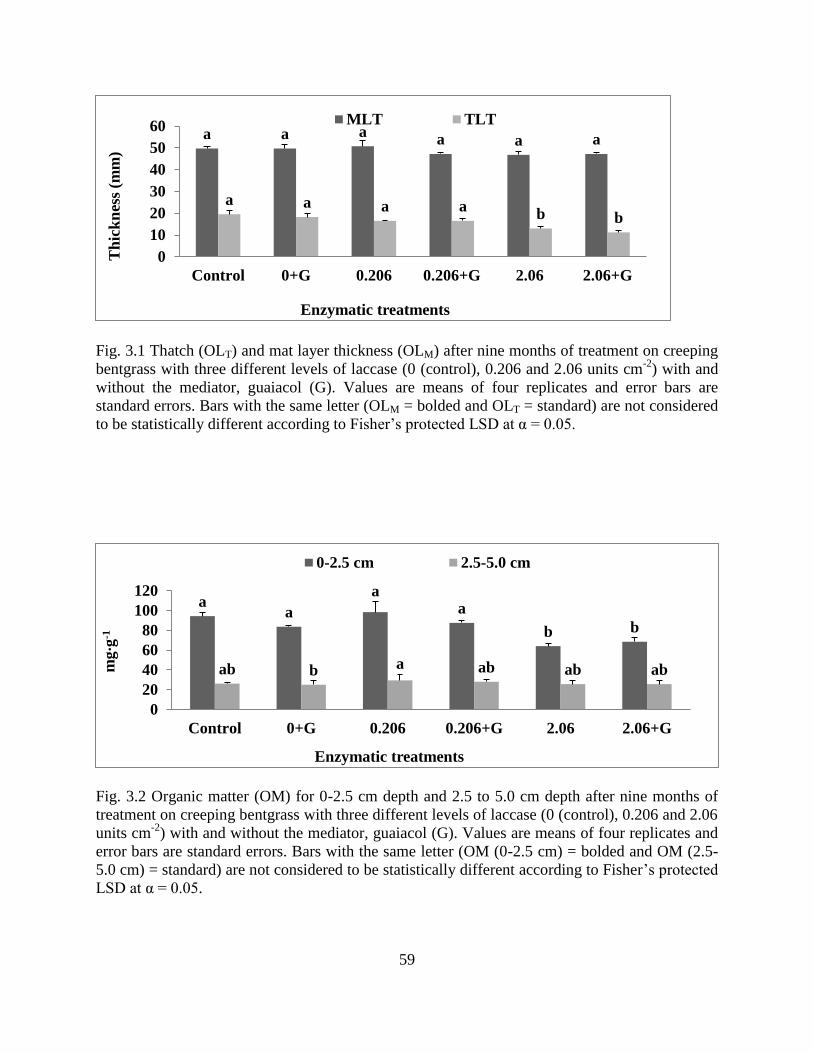
59
Fig. 3.1 Thatch (OLT) and mat layer thickness (OLM) after nine months of treatment on creeping
bentgrass with three different levels of laccase (0 (control), 0.206 and 2.06 units cm-2
) with and
without the mediator, guaiacol (G). Values are means of four replicates and error bars are
standard errors. Bars with the same letter (OLM = bolded and OLT = standard) are not considered
to be statistically different according to Fisher’s protected LSD at α = 0.05.
Fig. 3.2 Organic matter (OM) for 0-2.5 cm depth and 2.5 to 5.0 cm depth after nine months of
treatment on creeping bentgrass with three different levels of laccase (0 (control), 0.206 and 2.06
units cm-2
) with and without the mediator, guaiacol (G). Values are means of four replicates and
error bars are standard errors. Bars with the same letter (OM (0-2.5 cm) = bolded and OM (2.5-
5.0 cm) = standard) are not considered to be statistically different according to Fisher’s protected
LSD at α = 0.05.
a a a a a a
a a a a b b
0
10
20
30
40
50
60
Control 0+G 0.206 0.206+G 2.06 2.06+G
Th
ick
nes
s (m
m)
Enzymatic treatments
MLT TLT
a a
a a
b b
ab b a ab ab ab
0
20
40
60
80
100
120
Control 0+G 0.206 0.206+G 2.06 2.06+G
mg
·g-1
Enzymatic treatments
0-2.5 cm 2.5-5.0 cm

60
Fig. 3.3 Saturated hydraulic conductivity (SHC) after nine months of treatment on creeping
bentgrass with three different levels of laccase (0 (control), 0.206 and 2.06 units cm-2
) with and
without the mediator, guaiacol (G). Values are means of four replicates and error bars are
standard errors. Bars with the same letter are not considered to be statistically different according
to Fisher’s protected LSD at α = 0.05.
c c c c
b
a
0
5
10
15
20
25
30
35
Control 0+G 0.206 0.206+G 2.06 2.06+G
SH
C (
cm h
-1)
Enzymatic treatments

61
CHAPTER IV
LACCASE MEDIATED CHANGES IN PHYSICAL AND CHEMICAL PROPERTIES
OF THATCH LAYER IN CREEPING BENTGRASS (Agrostis stolonifera L.)2
2 Sidhu, S.S., Q. Huang, R.N. Carrow, and P.L. Raymer. To be submitted to Journal of Environmental Quality.

62
ABSTRACT
Excess thatch, a tightly intermingled layer of dead and living organic matter present
below the turf aerial shoots and above the soil, can be a major problem on many turfgrass sites,
especially golf greens. A greenhouse experiment conducted on dead potted bentgrass (Agrostis
stolonifera L.) determined the efficacy of a ligninolytic enzyme, laccase, along with mediator
guaiacol in reducing organic matter content in thatch layer biomass. Laccase was added biweekly
at 0, 2.06, and 20.6 units of activity cm-2
with and without guaiacol (2-methoxyphenol) and
sampling was performed after two and six months. Parameters investigated included thickness of
thatch layer, organic matter, saturated hydraulic conductivity, lignin content, and structural
sugars. After two months of treatment application 22.1 and 12.3% reductions in thatch layer
thickness and extractive-free acid-soluble lignin, respectively were observed, while 6.5 and
124.7% increases in extractive-free acid-insoluble lignin content and saturated hydraulic
conductivity, respectively were observed. No reduction in organic matter and sugar content was
observed after two months of treatment application; but after six months, 62.0, 24.7, and 29.3%
reduction in thatch layer thickness, total organic (0-2.5 cm), and total sugar content, respectively
were observed. Extractive-free acid-insoluble lignin and saturated hydraulic conductivity
increased by 17.1 and 70.8%, respectively in comparison to the control. These positive responses
suggest laccase treatments could expedite organic matter degradation in the thatch layer of
creeping bentgrass.
INTRODUCTION
A major problem in management of recreational turfgrass sites, especially golf greens is
the formation of thatch and/or mat layer that accumulates between the soil and green turfgrass
and contains both living and dead plant tissues intermingled tightly with each other. Thatch, a

63
layer of high organic matter content, consists of stolons, rhizomes, roots, crown tissue, leaf
sheaths, and blades (Engel, 1954; Roberts and Bredakis, 1960). The occurrence of mat layer is
generally due to presence of sand or soil intermingled with thatch as a result of cultural practices
like core aeration and topdressing (McCarty, 2005). A thin layer of thatch aids in reducing
surface hardness, moderating soil temperature extremes, and increasing resilience and wear
tolerance of the turfgrass surface (Beard, 1973); however, excessive thatch and mat layers are
undesirable in turfgrass.
Thatch-mat causes problems such as decreased movement of oxygen through the thatch
or mat zone, decreased saturated hydraulic conductivity, low oxygen levels within the thatch/mat
layer during wet periods, and increased water retention (Carrow, 2003; Hartwiger, 2004;
McCarty et al., 2007). These conditions often lead to secondary problems like wet wilt, soft
surface, increased mower scalp, black layer, limited rooting, and extra- and intra-cellular
freezing damage (Beard, 1973; Carrow, 2004; O’Brien and Hartwiger, 2003). Adverse effects on
the soil physical properties are caused by rapidly decaying dead gelatinous organic matter that
swells in the presence of water during decomposition and plugs the soil macro-pores (air-filled
pores), causing low oxygen levels in the root zones (Carrow, 2004; O’Brien and Hartwiger,
2003).
Biological and mechanical practices have been used to manage thatch-mat buildup but
are not sufficiently effective in most cases in reducing organic matter accumulation and have
shown contrasting results (Barton et al., 2009; Carley et al., 2011; Carrow et al., 1987; Dunn et
al., 1981; McCarty et al., 2005; McWhirter and Ward, 1976; Weston and Dunn, 1985; White and
Dickens, 1984). Biological approaches to enhance organic matter decomposition include
microbial inoculation and attempts to enhance microbial activity or limit plant growth.

64
Mechanical practices like core aeration, vertical mowing, grooming, and topdressing have been
the most effective, but adversely impact turf quality and are intensive in terms of cost, energy,
and labor (Barton et al., 2009; Landreth et al., 2008; McCarty et al., 2007).
When accumulation of organic matter exceeds the degradation rate, formation of thatch-
mat layer is increased (Beard, 1973). The presence of lignin, a plant cell wall constituent, acts as
a protective matrix and limits the accessibility of microbial degraders to more biodegradable
plant materials, such as cellulose and hemicelluloses (Ledeboer and Skogley, 1967). Lignin is
formed in plants by oxidative coupling of mono-lignols of three primary hydroxycinnamyl
alcohols: p-coumaryl, coniferyl, and sinapyl alcohols (Wong, 2009). Lignification is achieved by
random cross linking of monomers through different bonds resulting in a heterogeneous structure
resistant to degradation (Ledeboer and Skogley, 1967). Several models of lignin molecular
structure have been proposed but these models do not imply any particular sequence of
monomeric units in the lignin macromolecule (Chen and Sarkanen, 2003; Davin and Lewis,
2003).
Non-destructive thatch control studies using glucose, cellulase solutions, (Ledeboer and
Skogley, 1967) and commercial inocula containing various microorganisms were ineffective in
reducing the amount of thatch (McCarty et al., 2005; Murdoch and Barr, 1976). The rate of
microbial decomposition is more dependent on the lignin content of the organic matter in the
degradation progress (Taylor et al., 1989). A plant litter decomposition study reported a close
relationship of mass loss with activity of lignocellulose-degrading enzymes. (Sinsabaugh et al.,
1993). Extra-cellular lignolytic enzymes produced by certain white-rot fungi are responsible for
natural degradation of lignin (Kirk et al., 1975; Kirk et al., 1976). The preferential degradation of
lignin by extra-cellular enzymes produced by white-rot fungi exposes cellulosic materials for

65
further bacterial degradation in the environment (Blanchette, 1984; Mester et al., 2004; Otjen and
Blanchette., 1987). Presence of naturally-occurring (guaiacol) and synthetic (1-
hydroxybenzotriazole, HBT) chemicals, known as mediators, have shown to enhance the activity
of the lignolytic enzyme laccase (Kang et al., 2002; Roper et al., 1995). Reduction in cellulose
content and total oxidizable organic matter of bermudagrass (Cynodon dactylon L.) and
centipedegrass (Eremochloa ophiuroides) (Sartain and Volk, 1984) and weight loss of
bermudagrass pellets, St. Augustinegrass (Stenotaphrum secundatum [Walt.] Kuntze) and
zoysiagrass (Zoysia japonica Stued., ‘Meyer’) stolons (Martin and Dale., 1980) were observed
when inoculated with different wood-decaying fungi under controlled greenhouse and laboratory
conditions. However, field inoculation experiments on bermudagrass showed no thatch
degradation (Martin and Dale., 1980).
A novel approach developed to facilitate thatch-mat degradation using direct application
of laccase, an extra-cellular lignolytic enzyme produced from white-rot fungi Trametes
versicolor, on turfgrass was reported to be effective in reducing organic matter content and
thatch layer thickness in creeping bentgrass (Chapter III). However, a net accumulation of
organic matter in thatch layer treated with laccase was observed over time (Chapter III). This
study was designed to observe the potential of laccase enzyme to facilitate organic matter
decomposition in a system where accumulation of organic matter is ceased. The major objectives
of this study are: 1) to determine the potential of laccase enzyme to facilitate organic matter
degradation in thatch layer; and 2) to determine the changes in physical and chemical
composition properties of thatch layer due to application of laccase.

66
MATERIALS AND METHODS
A greenhouse experiment was conducted using ‘Crenshaw’ creeping bentgrass (Engelke
et al., 1995) Agrostis stolonifera L., established in pots (top diam. 15 cm, height 11.5 cm) at The
University of Georgia, Griffin Campus from December 2009 to June 2010. The bentgrass was
acquired from East Lake Country Club, Atlanta, Georgia. Pots were partially filled with 85:15
sand and organic matter mix and sod approximately 3 cm in thickness was cut to fit the pots and
placed on top of the mix. All pots were established in June 2008 and grown in a controlled
environment greenhouse for approximately eighteen months prior to initiation of treatments to
facilitate development of thatch layer in the pots. The refrigerated air conditioned greenhouse
was maintained at 25± 2 / 18 ±2oC, day/night temperature maintained by a Wadsworth Step 50
controller (Wadsworth Control System, Arvada, Co) under natural lighting (approximately 85%
ambient light). Pots were irrigated daily, fertilized monthly with a 50-mL solution of 0.4% (w/v)
Macron water soluble 28-7-14 fertilizer (Lesco. Strongsville, OH), and maintained by hand
clipping weekly at a height of 2.5 cm with clippings removed to develop favorable conditions for
thatch development in the pots.
Prior to the treatment initiation in December 2009, creeping bentgrass in the pots was
clipped down to the thatch layer and growth was ceased by application of a herbicidal solution
containing 1.3% (v/v) of Roundup Pro® (isopropylamine salt of glyphosate, Monsanto, St. Louis,
MO) and 1.3% (v/v) Finale® Herbicide (glufosinate ammonium, Bayer Environmental Science,
Montvale, NJ). To block any natural or artificial light from reaching the pots and avoid any
further growth in the pots, the pots were covered with two 76.2 µm thick sheets of black plastic
sheeting cut from Husky Contractor Clean-up bags (item no HK42WC032B, Poly America,
Grand Prairie, TX). The treatment design was a three by two factorial with all combinations of

67
three levels of laccase and two levels of guaiacol (2-methoxyphenol). The three laccase activity
levels were 0 (control), 2.06 and 20.6 units cm-2
and guaiacol levels were 0 and 0.1 M solution.
The experimental design was a randomized complete block with five replications and sampling
times of two and six months. Forty milliliter solutions of the different laccase activity levels were
applied uniformly every two weeks to each pot using a hand-held sprayer. The control was
applied as 40 mL of distilled water. Guaiacol levels were applied as 10 mL of 0.1M solution.
Guaiacol is a natural co-substrate and mediator of laccase believed to enhance enzyme
performance (Roper et al., 1995). Soil moisture content was maintained in the pots to favor
microbial activity during the 6 months by irrigating the pots twice a week.
Measurements
Effectiveness of treatments on chemical and physical properties of thatch-mat layer was
determined after two and six months of treatment application. Variables measured included
thatch layer thickness (TLT) and saturated hydraulic conductivity (SHC). Similarly, the impact
of treatment application on chemical composition properties of thatch layer biomass was
determined by measuring organic matter content for a depth of 0-2.5 cm (OMU), 2.5-5.0 cm
(OML), and 0-5.0 cm (OM), extractive-free acid-soluble lignin (LS) and acid-insoluble lignin
(LI), monomeric components of structural polysaccharides including glucose (SGLU), xylose
(SXYL), arabinose (SARA), and galactose (SGAL) content after two and six months of treatment
application. Total lignin (LT) was obtained by addition of acid-soluble and-insoluble lignin
contents. Total sugar (ST) was obtained by addition of values for glucose, xylose, arabinose,
galactose, and mannose.

68
Laccase Activity Assay
The laccase enzyme from Trametes versicolor, a white-rot fungus, was purchased from
Sigma-Aldrich (product 53739, Sigma Aldrich Inc., St. Louis, MO.). The activity of laccase was
quantified using a Beckman DU 640B spectrophotometer (Beckman Instruments Inc., Fullerton,
CA) spectrophotometer by a colorimetric assay where one activity unit of laccase corresponds to
the amount of enzyme that causes an absorbance change at 468 nm at a rate of 1.0 unit min-1
in
3.4 mL of 1 mM 2, 6-dimethoxyphenol, a specific substrate for laccase, in citrate-phosphate
buffer at pH 3.8 (Park et al., 1999). Laccase activity treatments of 0 (control), 2.06 and 20.6 units
cm-2
actually corresponds to laccase solutions with activity levels of 0, 9.12 and 91.2 units mL-1
,
respectively. The activity level of laccase applied per unit area was calculated by dividing total
number of units of laccase in 40-mL laccase solution by the top surface area of the pot.
Organic matter Content
The measurement of OM was done as described by Carrow et al. (1987). Two soil cores
(2.0 cm diam.) were obtained at 0-2.5 cm (OMU) and 2.5-5.0 cm (OML) depth from the pot. The
cores were dried in an oven at 100 ± 5oC for 24 h and weighed. Soil cores were ashed in a muffle
furnace at 600 ± 10oC for 24 h and weighed again. Organic matter content was determined as the
difference in the two readings and percent organic matter was calculated.
Saturated Hydraulic Conductivity
An intact core (diam. 4.7 cm and length 7.7 cm) was obtained from the center of each pot
in a brass cylinder using a soil corer (Model 0200 soil sampler, Soilmoisture Equip. Corp., Santa
Barbara, CA) The bottom of the core was covered with a double layer of cheesecloth held in
place with a rubber band and saturated overnight in a 0.05 N CaCl2 solution to minimize
dispersion. The SHC of the cores was measured by a constant hydraulic head method using a

69
Marriott tube apparatus. A steady state flow through the samples was established by flowing 0.05
N CaCl2 through the core for 10 min. After 10 min the volume of water that passed through the
core was measured for one minute and repeated three times. Saturated hydraulic conductivity
was calculated using Darcy's equation.
Thatch Layer Thickness
After cores were removed for measurement of OM and SHC, contents were removed
from pots and distinct separations among the thatch-mat and soil interface were clearly visible.
The TLT were measured from seven different locations around the edges of the plant/root mass
and averaged.
Extractive-free Lignin Content
Thatch was collected from each pot from the top 2.5 cm after sampling for OM and SHC.
Thatch samples were first washed, dried, and ground and then passed through a series of sieves
with a 841µm sieve at the top and a 177µm sieve at the bottom. The material left on the top of
largest sieve size was reprocessed and the material that passed through the smallest sieve was
discarded. The material retained by the 177 µm sieve size was retained and used for analysis.
The thatch was extracted for 24 h using the Soxhlet method for water- and alcohol-soluble
impurities using de-ionized water and 16.26 M (95 percent USP grade) ethyl alcohol,
respectively. Extractive-free LS and LI content in the thatch layer was determined in a two-step
acid-hydrolysis procedure according to the laboratory analytical procedure developed by The
National Renewable Energy Laboratory (NREL, 2008). In the first step, extractive-free thatch
samples were hydrolyzed for 60 min with 72% H2SO4 at 30oC. In the second step, H2SO4 was
diluted to 4% and the samples were autoclaved at 121oC for 1 h and then vacuum filtered. Acid-
soluble lignin was determined using this hydrolysis liquid at 240 nm wavelength in a Beckman

70
DU 640B spectrophotometer (Beckman Instruments Inc., Fullerton, CA). The solids remaining
after acid hydrolysis were dried in an oven at 100 ± 5oC for 24 h, weighed, ashed in a muffle
furnace at 600 ± 10oC for 24 h, and weighed again. Weight difference was used to calculate the
acid-insoluble lignin content.
Extractive-free Sugar Content
The sugar content for glucose (SGLU), xylose (SXYL), arabinose (SARA), and galactose
(SGAL) was determined from hydrolysis liquid collected after vacuum filtration in the above step.
The hydrolysis liquid was neutralized to a pH range 7.0-8.0 using NaHCO3 (sodium bicarbonate)
and monosaccharide sugars were determined using high performance liquid chromatography
(HPLC) in an Agilent 1100 HPLC (Aligent Technologies, Waldbronn, Germany) with binary
pump and refractive index detector. An AMINEX HPX-87P 7.8 x 300 mm Pb2+
carbohydrate
analysis column (Bio-Rad, Hercules, CA) was used at 85oC with deionized water as mobile
phase at a flow rate of 0.6 mL min-1
. These monosaccharide sugars are components of structural
polysaccharides, cellulose and hemicellulose.
Statistical Analysis
Analysis of variance (ANOVA) was performed to evaluate the main effects of treatment
duration, laccase, and guaiacol and interaction effects of these three factors using general linear
model (GLM) (SAS Institute, 1994). Strong treatment duration effects were observed in the
initial analysis and therefore each treatment duration was analyzed separately as a two factor
study consisting of three levels of laccase enzyme and two levels of guaiacol. However, due to
lack of sample availability for extractive-free sugar analysis after two and six months, four and
three replications were considered, respectively. Fisher’s protected LSD test with α = 0.05 was
used for determining statistical differences among treatment means following each ANOVA.

71
RESULTS
The results will be explained on the basis of the ANOVA table showing the effect of
treatment application on TLT, OM, LS, LI, and SHC (Table 4.1) and on sugar content (Table
4.2). The result section will be divided into the combined analysis and analysis of data collected
after two and six months of treatment application.
Combined Analysis
The full statistical model representing the main and interaction effects of treatment
duration, three levels of laccase, and two levels of guaiacol for OMU (0-2.5 cm), OML (2.5-5.0
cm), OM (0-5.0 cm), SHC, TLT, LS, LI, LT (Table 4.1) and SGLU, SXYL, SGAL, SARA, ST (Table
4.2) was used to compare common parameters at the two and six month sampling dates.
Strong duration effects (P ≤ 0.001) were observed for OMU, OM, SHC, TLT, LS, LI, LT
(Table 4.1), SGLU, SXYL, SGAL, SARA, and ST (Table 4.2). Laccase application significantly
effected OMU (P ≤ 0.001), OM (P ≤ 0.05), SHC (P ≤ 0.001), TLT (P ≤ 0.001), LS (P ≤ 0.001), LI
(P ≤ 0.001), LT (P ≤ 0.001) (Table 4.1), SGLU (P ≤ 0.05), SXYL (P ≤ 0.001), SARA (P ≤ 0.001), and
ST (P ≤ 0.01) (Table 4.2). A significant effect of guaiacol was observed for lignin content (P ≤
0.001) (Table 4.1) and (P ≤ 0.05) for SGLU, SARA, and ST (Table 4.2). A significant interaction
for treatment duration and laccase for OMU, SGLU, SXYL, SARA, and ST (Table 4.1 and Table 4.2)
were largely due to the lack of response to laccase treatments after two months as opposed to a
strong response seen after six months. Similarly, a significant interaction effect for guaiacol and
treatment duration was observed in SGLU, SXYL, SARA, and ST (Table 4.2). A very strong
interaction effect for treatment duration and laccase (P ≤ 0.001), and treatment duration and
guaiacol (P ≤ 0.001) was observed for lignin content (Table 4.1).

72
Analysis after Two Months Treatment
After two months of treatment application, laccase treatments had no effect on OMU,
OML, OM (Table 4.1), and sugar content (Table 4.2) but had strong effects (P ≤ 0.001) on SHC,
TLT, LS, LI (Table 4.1, Table 4.2). Guaiacol had significant effects on LI and LT levels and the
laccase by guaiacol interaction was significant for LI (Table 4.1). The LI value increased
significantly with the application of guaiacol at each laccase activity level.
Saturated hydraulic conductivity increased from 11.6 cm h-1
in control pots to 24.4 and
26.1 cm h-1
in pots treated with and without 20.6 units cm-2
laccase (Fig 4.1). Thatch layer
thickness decreased by 2.0 mm (14.5%), 3.0 mm (22.12%), and 2.9 mm (21.9%) when compared
to control in pots treated with 2.06 units cm-2
with guaiacol, 20.6 units cm-2
without guaiacol,
and 20.6 units cm-2
with guaiacol, respectively (Fig 4.2). Similarly, LS decreased by 3.1, 7.8,
and 7.5 mg·g-1
and LI increased by 10.4, 9.5, and 17.0 mg·g-1
over control with the same
treatments (Table 4.3). A slight increase of 7.3 and 9.6 mg·g-1
over control was observed for LT
with treatments 2.06 and 20.6 units cm-2
applied along with guaiacol (Table 4.3). However, no
difference was observed in organic matter at different depths (Table 4.1, Fig 4.3), or for sugar
content (Fig 4.4, Fig 4.5, Fig 4.6).
Analysis after Six Months Treatment
After six months of treatment application, laccase application impacted OMU (P ≤ 0.001),
OM (P ≤ 0.01), SHC (P ≤ 0.001), TLT (P ≤ 0.001), LS (P ≤ 0.01), LI (P ≤ 0.001), LT (P ≤ 0.001)
(Table 4.1), SGLU (P ≤ 0.05), SARA (P ≤ 0.01), and ST (P ≤ 0.01) (Table 4.2). Laccase application
had no effect on OML, SXYL, and SGAL after six months of application. A significant effect of
guaiacol was also observed for LS, LI, LT, SGLU, SARA, ST (Table 4.1 and Table 4.2). Strong
laccase by guaiacol interaction effect (P ≤ 0.001) was observed for LS, LI and LT (Table 4.1). An

73
increase in LI and LT and decrease in LS values were observed with addition of guaiacol along
with laccase (Table 4.3).
Compared to control pots, a reduction of 12.0 (22.3%), 10.2 (18.9%), 13.3 (24.7%), and
12.8 mg·g-1
(23.9%) for OMU (Fig 4.3) and 4.5 (43.8%), 3.8 (38.0%), 5.8 (57.2%), and 6.3 mm
(62%) for TLT (Fig 4.2) was observed with treatments of 2.06 and 20.6 units cm-2
of laccase
without and with guaiacol, respectively. However, no effect was observed with any treatment for
OML and OM after six months of treatment application (data not shown). An increase of 43.9,
41.1, 70.8, 67.1% for SHC (Fig 4.1) and 17.1, 35.0, 27.7, and 46.9% for LI (Table 4.3) was
observed for laccase activity levels of 2.06 and 20.6 units cm-2
without and with guaiacol,
respectively. However, contrasting results for LS were obtained after six months of treatment
application. Acid-soluble lignin was found to be slightly reduced in laccase treatments with
guaiacol and slightly increased over control in laccase treatments without guaiacol (Table 4.3).
After six months of treatment, significant reductions in the monosaccharide components
of structural cellulose and hemicellulose sugar were observed. In comparison to the control pots,
a reduction of 32.2, 34.5, and 29.3% was observed for SGLU, SARA, and ST, respectively in pots
treated with 2.06 units cm-2
along with guaiacol (Fig 4.4, Fig 4.5, Fig 4.6). Similarly, a reduction
of 28.4, 33.2, and 25.7% was observed for SGLU, SARA, and ST, respectively in pots treated with
20.6 units cm-2
when applied along with guaiacol when compared to control pots (Fig 4.4, Fig
4.5, Fig 4.6). However, when only laccase was applied without guaiacol, the reduction in SARA
and ST over the control was 25.2 and 15.6% for 2.06 units cm-2
and 23.7 and 17% for 20.6 units
cm-2
treatment (Fig 4.5, Fig 4.6). No significant effect of any treatment was observed for SXYL,
and SGAL after six months of treatment application (data not shown).

74
DISCUSSION
Laccase Application
In our previous greenhouse study on living creeping bentgrass, we reported that the direct
application of laccase enzyme at 2.06 units cm-2
of activity level applied every two weeks was
effective in reducing thatch-mat depth, OM, and significantly increasing SHC (Chapter III).
However, an overall increase in OM (0-5.0 cm) and organic layer thickness was observed for all
the treatments over the experiment duration. OM (0-5.0 cm) increased by 46.9 and 23.7% in
control pots and pots treated with 2.06 units cm-2
laccase, respectively over a period of seven
months (Chapter III). In our present study, the active growth of creeping bentgrass was ceased by
the application of herbicides which created a system where there is no addition of organic matter.
Our results indicate that application of 2.06 and 20.6 units cm-2
laccase with and without
guaiacol could result in altering organic matter dynamics in a positive manner by effectively
reducing OMU (0-2.5 cm) and TLT in comparison to the control.
After two months of treatment application, physical changes in the thatch-mat profile was
observed in TLT and SHC with laccase applications at 20.6 units cm-2
with and without guaiacol
(Fig 4.1, Fig 4.2). However, no significant effect was observed for organic matter at depths of 0-
2.5 and 2.5-5.0 cm with any treatment. The structural changes in the thatch biomass after two
months were associated with significant reductions in LS with all laccase treatments and a slight
increase in the LI when laccase was applied without guaiacol (Table 4.3). However, a slight
overall reduction in LT was detected at both laccase treatment levels after two months when
applied with guaiacol. The data obtained for monosaccharaide levels showed no significant
changes after two months of treatment application (Fig 4.4, Fig 4.5, Fig 4.6).

75
After six months of treatment application, significant structural changes in TLT and SHC
in the thatch-mat profile were observed over control with both activity levels of laccase whether
applied with or without guaiacol (Fig 4.1, Fig 4.2). An increase in SHC over control treatments
can be explained due to the decrease in the thatch layer depth associated laccase treatments. The
presence of higher levels of organic matter in the thatch layer is known to hinder water
infiltration through the thatch layer (McCarty et al., 2005). Laccase treatments at 2.06 and 20.6
units cm-2
activity were found to be effective in reducing organic matter content at 0-2.5 cm
depth when applied with and without guaiacol (Fig 4.3).
Structural changes in the thatch layer biomass after six months of treatment application
were recorded by the reduction in SGLU, SARA, and ST (Fig 4.4, Fig 4.5, Fig 4.6). This reduction
in the sugar content in the biomass can be attributed to the opening up of biomass structure by
breaking the protective matrix of lignin, making cellulose and hemicellulosic structural
components of plant cell wall more accessible for microbial degradation. The cellulose and
hemicellulose components are covalently bonded with lignin macromolecules in different ways
such as ester-ether cross-links (Grabber et al., 2000; 2004; Ralph et al., 1995; 2004), direct ester
linkages (Imamura et al., 1994; Joseleau and Gancet, 1981), benzyl ether linkages (Grabber et
al., 2004; Lam et al., 1990; Watanabe et al., 1989), and phenyl glycoside linkages. These bonds
or associations must be broken in order to access the sugars. However, increases in the acid-
soluble and -insoluble components were observed after application of both activity levels of
laccase with and without guaiacol. This increase in lignin content can be attributed to the overall
reduction in the structural carbohydrate (sugar) content where lignin and structural carbohydrates
are the major components in the plant cell walls. Lignin percentage is calculated by expressing
lignin as a percentage of the total of lignin plus carbohydrates and thereby dependent upon the

76
carbohydrate content. Therefore, when the carbohydrate content is lowered, lignin percentage
increases
Treatment Duration
If laccase application was effective in changing the physical, chemical, and structural
properties of thatch layer, it would seem reasonable to expect that effects would become more
apparent over time. Samples were analyzed after two and six months of treatment application.
After two months, only laccase applications at the highest activity level of 20.6 units cm-2
were
effective in reducing TLT, LS, and increasing SHC and application of the lower laccase activity
level of 2.06 units cm-2
only impacted lignin content. However, after six months of treatment
application, laccase treatments of 2.06 and 20.6 units cm-2
with and without guaiacol proved
equally effective in reducing TLT, OMU, SGLU, SARA, and ST. This result indicates that
application of laccase with lower activity levels over a period of time could just be as effective as
application laccase solutions with 10 times higher activity . The effect of guaiacol on structural
properties of thatch biomass is evident from effects of guaiacol and the interaction of treatment
duration and guaiacol on LS, LI, LT, SGLU, SARA, and ST (Table 4.1, Table 4.2).
Role of Laccase in Thatch Management
Contrasting results have been reported in the past for reduction in thatch-mat
accumulation using various cultural management practices at different cultivation frequencies
(Callahan et al., 1998; Carrow et al., 1987; Engel and Alderfer, 1967; McCarty et al., 2005;
Rieke, 1994). Cultural practices like core aeration and vertical mowing are disruptive in nature
and adversely impact turf quality, further reducing the playability of the turf (Barton et al., 2009;
Landreth et al., 2008; McCarty et al., 2007). However, application of laccase was not disruptive,

77
showed no reduction in turf quality of creeping bentgrass, and proved to be effective when
applied at activity levels of 2.06 units cm-2
for nine months (Chapter III).
Some efforts in the past to develop non-destructive methods to manage thatch problems
using different treatments like sugars, mixtures of sugars and microbial inocula, mixture of
amino acids and algae, and some enzymes like cellulase, proved ineffective (Ledeboer and
Skogley, 1967; Martin and Dale., 1980; McCarty et al., 2005; Murdoch and Barr, 1976). One of
the possible reasons that past studies found these products to be inconsistent in organic matter
decomposition is that they focused on degradation of cellulosic and hemicellulosic sugars instead
of lignin. Our hypothesis is that the lignin protective matrix has to be at least partially degraded
to allow bacterial population to act on the structural sugars. Another possible reason that the
above mentioned treatments were ineffective is that most of these treatments intended speed
degradation of thatch by simply increasing microbial populations within the thatch layer.
Maintaining higher microbial populations over sustained periods of time under field turfgrass
management systems is very difficult due to the inability to maintain proper micro-environment
conditions, particularly moisture and temperature regimes, required by particular microbial
populations.
Laccases are multi-copper oxidases that mediate the oxidation of a wide range of mono-
and diphenols using oxygen as the electron acceptor (Baldrian, 2006). Laccase-mediated
oxidation leads to decomposition of lignin phenolic components via Cα-Cβ cleavage, alkyl-aryl
cleavage, and Cα oxidation (Wong, 2009). This cleavage of different covalent bonds formed
within lignin macromolecule and between lignin and structural sugars open up the biomass
structure leading to increased availability of easily degradable sugars by microbes. The laccase
enzyme we used is a natural product produced by the white-rot fungi Trametes versicolor, and is

78
stable over a wide range of pH and temperature (Baldrian, 2006; Munoz et al., 1997; Stoilova et
al., 2010; Thurston, 1994). By using laccase enzyme, we can effectively manage thatch over
wide range of environmental conditions and can better utilize the microbial decomposition of
organic matter.
CONCLUSIONS
This greenhouse research demonstrated the efficacy of bi-weekly applications of laccase
enzyme at 2.06 and 20.6 units cm-2
to change physical/structural and chemical composition
properties of the thatch layer of creeping bentgrass turf. Laccase application was effective in
reducing organic matter content, thatch layer thickness, and sugar content and in increasing
saturated hydraulic conductivity. Laccase application at 2.06 units cm-2
was not effective after
two months of treatment application in reducing thatch layer thickness and sugar content but was
effective after six months of application. Duration of treatment application had a significant
positive effect on organic matter degradation. Implications of these findings point that laccase
application at 2.06 units cm-2
can be as effective as laccase activity level of 20.6 units cm-2
when
applied over a period of time. This approach has the potential as a new non-disruptive method
for thatch management. Future research is needed to observe the effectiveness of laccase under
field conditions.
LITERATURE CITED
Baldrian, P. 2006. Fungal laccases-occurrence and properties. FEMS Microbiol Rev. 30: 215-
242.
Barton, L., G.G.Y. Wan, R.P. Buck, and T.D. Colmer. 2009. Effectiveness of cultural thatch-mat
controls for young and mature kikuyu turfgrass. Agron. J. 101: 67-74.
Beard, J.B. 1973. Turfgrass: Science and culture. Prentice Hall Inc., Englewood Cliffs, NJ.

79
Blanchette, R.A. 1984. Screening wood decayed by white rot fungi for preferential lignin
degradation. Appl. Environ. Microbiol. 48: 647-653.
Callahan, L.L., W.L. Sanders, J.M. Parham, C.A. Harper, L.D. Lester, and E.R. McDonald.
1998. Cultural and chemical controls of thatch and their influence on rootzone nutrients
in bentgrass green. Crop Sci. 38: 181-187.
Carley, D.S., D. Goodman, S. Sermons, W. Shi, D. Bowman, G. Miller, and T. Rufty. 2011. Soil
Organic matter accumulation in creeping bentgrass greens: A chronosequence with
implications for management and carbon sequestration. Agron. J. 103 (3): 604-610.
Carrow, R.N. 2003. Surface organic matter in bentgrass greens. USGA Turfgrass Environ. Res.
Online 2(17): 1-10.
Carrow, R.N. 2004. Surface organic matter in bentgrass greens. Golf Course Mgt. 72(5): 96-101.
Carrow, R.N., B.J. Johnson, and R.E. Burns. 1987. Thatch and quality of Tifway bermudagrass
turf in relation to fertility and cultivation. Agron. J. 79: 524-530.
Chen, Y.R., and S. Sarkanen. 2003. Macromolecular lignin replication: A mechanistic working
hypothesis. Phytochemistry Rev. 2: 235-255.
Davin, L.B. and N.G. Lewis 2003. A historical perspective on lignin biosynthesis: Monolignol,
allylphenol and hydroxycinnamic acid coupling and downstream metabolism.
Phytochemistry Rev. 2: 257-288.
Dunn, J.H., K.M. Sheffer, and P.M. Halisky. 1981. Thatch and quality of Meyer zoysia in
relation to management. Agron. J. 73: 949-952.
Engel, R.E. 1954. Thatch on turf and its control. Golf Course Rep. 22 (5): 12-14.
Engel, R.E., and R.B. Alderfer. 1967. The effect of cultivation, top-dressing, lime, N, and
wetting agent on thatch development on 1/4-inch bentgrass over a 10-year period. N.J.

80
Agric. Exp. Stn. Bull. 818: 32-45.
Engelke, M.C., V.G. Lehman, W.R. Kneebone, P.F. Colbaugh, J.A. Reinert, and W.E. Knoop.
1995. Registration of ‘Crenshaw’ creeping bentgrass. Crop Sci. 35: 589.
Grabber, J.H., J. Ralph, and R. D. Hatfield. 2000. Cross-linking of maize walls by ferulate
dimerization and incorporation into lignin. Journal of Agricultural and Food Chemistry.
48: 6106-6113.
Grabber, J.H., J. Ralph, C. Lappierre, and Y. Barriere. 2004. Genetic and molecular basis of
grass cell wall degradability. I. Lignin- cell wall matrix interactions. Comptes Rendus
Biologies. 327: 455-465.
Hartwiger, C. 2004. The importance of organic matter dynamics: How research uncovered the
primary cause of secondary problems. USGA Green Section Record 42(3): 9-11.
Imamura, T., T. Watanabe, M. Kuwahara, and T. Koshijima. 1994. Ester linkages between lignin
and glucuronic acid in lignin-carbohydrate complexes of Fagus crenata. Phytochemistry.
37: 1165-1173.
Joseleau, J.P., and C. Gancet. 1981. Selective degradations of lignin-carbohydrate complex from
aspen wood. Svensk Papperstidning. 84: 123-127.
Kang, K.H., J. Dec, H. Park, and J.M. Bollag. 2002. Transformation of the fungicide cyprodinil
by a laccase of Trametes villosa in presence of phenolic mediators and humic acid. Water
Res. 36: 4907-15.
Kirk, T.K., W.J. Connors, R.D. Bleam, and G. Jeikus. 1976. Requirements for a growth substrate
during lignin decomposition by two wood-rotting fungi. Appl. Environ. Microbiol. 32:
192-194.
Kirk, T.K., W.J. Connors, R.D. Bleam, W.F. Hackett, and J.G. Jeikus. 1975. Preparation and

81
microbial decomposition of synthetic [14
C] lignins. PNAS. 72: 2515-2519.
Lam, T.B.T., K. Iiyama, and B.A. Stone. 1990. Distribution of free and combined phenolic acids
in wheat internodes. Phytochemistry. 29: 429-433.
Landreth, J., D. Karcher, and M. Richardson. 2008. Cultivating to manage organic matter in sand
based putting greens: University of Arkansas researchers provide important insight for
managing organic buildup on putting greens. USGA Turfgrass Environ. Res. Online
46(1): 16-19.
Ledeboer, F.B., and C.R. Skogley. 1967. Investigations into the nature of thatch and methods for
its decomposition. Agron. J. 59: 320-323.
Martin, S.B., and J.L. Dale. 1980. Biodegradation of turf thatch with wood-decay fungi.
Phytopathology. 70: 297-301.
McCarty, L.B. 2005. Best golf course management practices. 2nd
ed. Prentice Hall Inc. Upper
Saddle River, NJ.
McCarty, L. B., M.F. Gregg, and J.E. Toler. 2007. Thatch and mat management in an established
creeping bentgrass green. Agron. J. 99: 1530-1537.
McCarty, L.B., M.F. Gregg, J.E. Toler, J.J. Camberato, and H.S. Hill. 2005. Minimizing thatch
and mat development in a newly seeded creeping bentgrass golf green. Crop Sci. 45:
1529-1535.
McWhirter, E.L., and C.Y. Ward. 1976. Effect of vertical mowing and aerification on golf green
quality. Mississippi Agric. For. Exp. Stn. Res. Rep. 2 (12): 1-2.
Mester, T., E. Varela, and M. Tien. 2004. Wood degradation by brown-rot and white-rot fungi.
The Mycota II: Genetics and biotechnology. 2nd
edition. Springer-Verlag, Berlin,
Heidelberg.

82
Munoz, C., F. Guillen, A.T. Martinez, and M.J. Martinez. 1997. Laccase isozymes of Pleurotus
eryngii: Characterization, catalytic properties, and participation in activation of molecular
oxygen and Mn2+
oxidation. App. Environ. Microbiol. 63: 2166-2174.
Murdoch, C.L., and J.P. Barr. 1976. Ineffectiveness of commercial microorganism inoculums in
breaking down thatch in common bermudagrass in Hawaii. HortScience. 11: 488-489.
NREL- National Renewable Energy Laboratory. 2008. Determination of structural carbohydrates
and lignin in biomass. Available at: http://www.nrel.gov/biomass/pdfs/42618.pdf
(Verified 01 July, 2012). NREL, Golden, CO, USA.
O’Brien, P., and C. Hartwiger. 2003. Aeration and topdressing for the 21st century: Two old
concepts are linked together to offer up-to-date recommendations. USGA Green Section
Record 41(2): 1-7.
Otjen, L., and R. Blanchette. 1987. Assessment of 30 white rot basidiomycetes for selective
lignin degradation. Holzforschung. 41: 343-349.
Park, J. W., J. Dec, J. E. Kim, and J. M. Bollag. 1999. Effect of humic constituents on the
transformation of chlorinated phenols and anilines in the presence of oxidoreductive
enzymes or birnessite. Environ. Sci. Tech. 33: 2028-2034.
Ralph, J., J.H. Grabber, R. D. Hatfield. 1995. Lignin-ferulate crosslinks in grasses: Active
incorporation of of ferulate polysaccharide esters into ryegrass lignins. Carbohydrate
Research. 275: 167-178.
Ralph, J., M. Bunzel, J.M. Marita, R.D. Hatfield, F. Lu, H. Kim, P.F. Schatz, J.H. Grabber, and
H. Steinhart. 2004. Peroxidase dependent cross linking reactions of p-hydroxicinnamates
in lant cellwalls. Phytochemistry Rev. 3: 79-96.
Rieke, P.E. 1994. Sand topdressing: where are we going? Golf Course Mgt. 62: 36-38.

83
Roberts, E.C., and E.J. Bredakis. 1960. What, why and how of turfgrass root development. Golf
Course Rep. 28: 13-24.
Roper, J.C., J.M. Sarkar, J. Dec, and J.M. Bollag. 1995. Enhanced enzymatic removal of
chlorophenols in the presence of co-substrates. Water Res. 29: 2720-2724.
Sartain, J.B., and B.G. Volk. 1984. Influence of selected white-rot fungi and topdressings on the
composition of thatch components of four turfgrasses. Agron. J. 76: 359-362.
SAS Institute Inc. 1994. The SAS system for windows. Release 9.2. SAS Inst., Cary, NC.
Sinsabaugh R.L., R.K. Antibus, A.E. Linkins, C.A. Mcclaugherty, L. Rayburn, D. Repert, T.
Weiland. 1993. Wood decomposition - nitrogen and phosphorus dynamics in relation to
extracellular enzyme-activity. Ecology. 74: 1586-1593.
Stoilova, I., A. Krastanov, and V. Stanchev. 2010. Properties of crude laccase from Trametes
versicolor produced by solid-substrate fermentation. Adv. Bioscience Biotech. 1: 208-
215.
Taylor B.R., D. Parkinson, W.F.J. Parsons. 1989. Nitrogen and lignin content as predictors of
litter decay rates: A microcosm test. Ecology. 70: 97-104.
Thurston, C.F. 1994. The structure and function of fungal laccases. Microbiol. 140: 19-16.
Watanabe, T., J. Onishi, Y. Yamasaki, K. Yuko, S. Kaizu, T. Koshijima. 1989. Binding site
analysis of the ether linkages between lignin and hemicelluloses lignin-carbohydrate
complexes by DDQ oxidation. Agricultral and Biological Chemistry. 55: 2233-2252.
Weston, J.B., and J.H. Dunn. 1985. Thatch and quality of Meyer zoysia in response to
mechanical cultivation and nitrogen fertilization. P. 449-458. In F. Lemaire (ed.) Proc. 5th
Int. Turfgrass Res. Conf., Avignon, France. 1-5 July 1985. Institut National de la
Recherche Agronomique, Paris, France.

84
White, R.H., and R. Dickens. 1984. Thatch accumulation in bermudagrass as influenced by
cultural practices. Agron. J. 76: 19-22.
Wong, D.W.S. 2009. Structure and action mechanism of ligninolytic enzymes. Appl. Biochem
Biotechnol. 157: 174-209.

85
Table 4.1 Analysis of variance (ANOVA) table showing the effects of treatment duration, laccase application, guaiacol application,
and their interactions on dead creeping bentgrass thatch maintained in a greenhouse.
Source of
Variation df
Organic
matter
(OMU)
(0-2.5 cm)
Organic
matter
(OML)
(2.5-5.0 cm)
Organic
matter
(OM)
(0-5.0 cm)
Saturated
hydraulic
conductivity
(SHC)
Thatch
layer
thickness
(TLT)
Acid-
soluble
lignin
(LS)
Acid-
insoluble
lignin
(LI)
Total
lignin
(LT)
mg·g-1
mg·g-1
mg·g-1
cm h-1
mm mg·g-1
mg·g-1
mg·g-1
mean square values
Full Model
Treatment duration 1 641.5*** 33.7 895.8*** 6340.6*** 426.6*** 190.5*** 65449*** 72701***
Laccase 2 414.1*** 12.7 94.2* 1290.7*** 93.3*** 79.7*** 18073*** 15999***
Guaiacol 1 8.7 27.0 35.0 0.2 1.7 22.6*** 5686.6*** 4992.1***
Duration*laccase 2 143.6* 41.6 47.5 53.4 7.0 69.7*** 11713*** 13517***
Duration*guaiacol 1 38.8 2.02 7.5 1.5 0.2 22.8*** 2250.4*** 1819.7***
Error 50 36.1 36.5 27.6 20.1 2.3 0.7 90.5 090.05
2 Months
Laccase 2 51.8 7.2 4.0 446.3*** 25.8*** 146.1*** 455.7*** 91.24
Guaiacol 1 42.2 7.1 37.5 1.5 0.4 0.03 391.2*** 391.90**
Laccase*guaiacol 2 10.8 11.2 10.0 10.4 2.5 0.2 107.8* 109.99
Error 24 50.01 50.1 32.4 29.5 1.4 0.8 25.5 29.09
6 Months
Laccase 2 505.9*** 47.1 137.7** 897.7*** 74.53*** 3.4** 29331*** 29425***
Guaiacol 1 5.3 21.9* 5.0 0.3 1.5 45.4*** 7545.8*** 6420.0***
Laccase*guaiacol 2 1.9 22.7 9.0 3.9 2.7 4.5*** 2719.5*** 2510.7***
Error 24 24.5 23.1 23.7 11.9 2.8 0.4 83.9 87.4
* Significant at the 0.05 probability level
**Significant at the 0.01 probability level
*** Significant at the 0.001 probability level

86
Table 4.2 Analysis of variance (ANOVA) table showing the effects of treatment duration, laccase application, guaiacol application,
and their interactions on sugar content on dead creeping bentgrass thatch maintained in a greenhouse.
Source of Variation df
Glucose
(SGLU)
Xylose
(SXYL)
Glactose
(SGAL)
Arabinose
(SARA)
Total sugar
(ST)
mg·g-1
mg·g-1
mg·g-1
mg·g-1
mg·g-1
-----------------------------------mean square values--------------------------------------------
Full Model
Treatment duration 1 27543.5*** 9278.6*** 2402.9*** 2727.1*** 126250***
Laccase 2 2394.7* 417.5*** 288.3 497.0*** 10525.5**
Guaiacol 1 2964.5* 294.0 32.6 226.4* 8438.9*
Duration*laccase 2 2704.84** 538.9* 67.3 308.8*** 9353.0**
Duration*guaiacol 1 4280.7** 759.6* 174.7 139.7* 13815**
Error 32 440.6 152.6 180.8 31.5 1565.9
2 Months
Laccase 2 78.1 4.6 65.9 13.0 228.2
Guaiacol 1 70.3 63.2 32.8 6.0 384.5
Laccase*guaiacol 2 72.0 8.3 2.1 24.5 317.0
Error 18 18.4 112.4 217.8 26.1 1333.3
6 Months
Laccase 2 4403.5* 833.4 261.8 695.3*** 17222.6**
Guaiacol 1 6286.9** 874.5 156.7 315.8* 19183.9*
Laccase*guaiacol 2 115.7 43.7 23.8 2.5 334.6
Error 12 671.0 231.5 152.1 42.6 2128.1
* Significant at the 0.05 probability level
**Significant at the 0.01 probability level
*** Significant at the 0.001 probability level

87
Table 4.3 Extractive-free acid-soluble (LS), acid-insoluble (LI), and total lignin (LT) content after two and six months of different
treatments applied to thatch layer of dead creeping bentgrass.
Acid-soluble lignin Acid-insoluble lignin Total lignin
Treatment† 2 Months 6 Months 2 Months 6 Months 2 Months 6 Months
-------- mg·g-1
--------- -------- mg·g-1
--------- -------- mg·g-1
---------
0L (Control) 63.1a‡
63.2a
259.0c
273.9e
322.1cd
337.2e
0L+G 62.9a 62.3d
259.6c
267.6e
322.5bcd
330.0e
2.06L 60.2b
65.5a
255.7c
320.7d
315.9cd
386.2d
2.06L+G 60.0b
62.0de
269.4b
369.7b
329.4ab
431.7b
20.6L 55.3c
64.2b
268.5b
349.9c
323.8bc
414.2c
206L+G 55.6c
61.2e
276.0a
402.4a
331.7a 463.6a
† L denotes Laccase level and G the addition of Guaiacol, a mediator.
‡ Means within a column followed by the same letter are not significantly different according to LSD at α=0.05.

88
Fig. 4.1 Saturated hydraulic conductivity (SHC) after two and six months of treatment on
creeping bentgrass thatch biomass with three different levels of laccase (0 (control), 2.06 and
20.6 units cm-2
) with and without the mediator, guaiacol (G). Values are means of five replicates
and error bars are standard errors. Bars with the same letter (2 months = bolded and 6 months =
standard) are not considered to be statistically different according to LSD at α = 0.05.
Fig. 4.2 Thatch layer thickness (TLT) after two and six months of treatment on creeping
bentgrass thatch biomass with three different levels of laccase (0 (control), 2.06 and 20.6 units
cm-2
) with and without the mediator, guaiacol (G). Values are means of five replicates and error
bars are standard errors. Bars with the same letter (2 months = bolded and 6 months = standard)
are not considered to be statistically different according to LSD at α = 0.05.
c c c bc
a ab
c c
b b
c c
0
10
20
30
40
50
60
Control 0+G 2.06 2.06+G 20.6 20.6+G
SH
C (
cm h
-1)
Enzymatic treatments
2 Months
6 Months
a a
ab bc
c c a a
bc b
bc c
0
2
4
6
8
10
12
14
16
0 0+G 2.06 2.06+G 20.6 20.6+G
mm
Enzymatic treatments
2 Months
6 Months

89
Fig. 4.3 Organic matter content (0-2.5 cm; OMU) after two and six months of treatment on
creeping bentgrass thatch biomass with three different levels of laccase (0 (control), 2.06 and
20.6 units cm-2
) with and without the mediator, guaiacol (G). Values are means of five replicates
and error bars are standard errors. Bars with the same letter (2 months = bolded and 6 months =
standard) are not considered to be statistically different according to LSD at α = 0.05.
Fig. 4.4 Glucose (SGLU) after two and six months of treatment on creeping bentgrass thatch
biomass with three different levels of laccase (0 (control), 2.06 and 20.6 units cm-2
) with and
without the mediator, guaiacol (G). Values are means of five replicates and error bars are
standard errors. Bars with the same letter (2 months = bolded and 6 months = standard) are not
considered to be statistically different according to LSD at α = 0.05.
a a a a a
a a a
b b b b
3
13
23
33
43
53
63
Control 0+G 2.06 2.06+G 20.6 20.6+G
mg·g
-1
Enzymatic treatments
2 Months
6 Months
a a a a a a a
ab abc
c
bc bc
0
50
100
150
200
250
300
350
Control 0+G 2.06 2.06+G 20.6 20.6+G
mg·g
-1
Enzymatic treatments
2 Months
6 Months

90
Fig. 4.5 Arabinose (SARA) after two and six months of treatment on creeping bentgrass thatch
biomass with three different levels of laccase (0 (control), 2.06 and 20.6 units cm-2
) with and
without the mediator, guaiacol (G). Values are means of five replicates and error bars are
standard errors. Bars with the same letter (2 months = bolded and 6 months = standard) are not
considered to be statistically different according to LSD at α = 0.05.
Fig. 4.6 Total sugars (ST) after two and six months of treatment on creeping bentgrass thatch
biomass with three different levels of laccase (0 (control), 2.06 and 20.6 units cm-2
) with and
without the mediator, guaiacol (G). Values are means of five replicates and error bars are
standard errors. Bars with the same letter (2 months = bolded and 6 months = standard) are not
considered to be statistically different according to LSD at α = 0.05.
a a a a a a a
b bc
c bc
c
0
10
20
30
40
50
60
70
80
90
Control 0+G 2.06 2.06+G 20.6 20.6+G
mg·g
-1
Enzymatic treatments
2 Months
6 Months
a a a a a a a
ab bc
c
bc bc
0
100
200
300
400
500
600
700
Control 0+G 2.06 2.06+G 20.6 20.6+G
mg·g
-1
Enzymatic treatments
2 Months
6 Months

91
CHAPTER V
OPTIMIZING LACCASE APPLICATION ON CREEPING BENTGRASS
(Agrostis stolonifera L.) TO FACILITATE BIODETHATCHING3
3 Sidhu, S.S., Q. Huang, R.N. Carrow, and P.L. Raymer. To be submitted to Crop Science.

92
ABSTRACT
Organic matter buildup in the form of thatch or mat layers leads to several problems in
turfgrass management systems. In a previous study, laccase enzyme solution proved effective in
reducing the rate of accumulation of organic matter when applied at an activity level of 2.0 units
cm-2
every two weeks for nine months on ‘Crenshaw’ creeping bentgrass (Agrostis stolonifera
L.). A two year field experiment was conducted on creeping bentgrass to optimize the laccase
activity level, frequency of application; to determine potential interactions with core aeration and
topdressing cultural practices; and to compare enzyme sources. Laccase enzyme was applied at
five activity levels 0, 0.5, 1.0, 2.0 and 4.0 units cm-2
applied every two weeks. Frequency of
laccase application was tested using a laccase activity level of 2.0 units cm-2
applied at frequency
of 2, 4, 8, or 12 weeks. The common cultural management practice of core aeration and sand
topdressing was compared with and without laccase enzyme at an activity level of 2.0 units cm-2
applied once a month. Three sources of laccase enzyme were also compared when applied at a
standard activity level of 2.0 units cm-2
every two weeks. Results indicated that laccase
treatments were effective at rates as low as 0.5 units cm-2
applied every two weeks and as
infrequent as once a month when applied at rate of 2.0 units cm-2
. Monthly applications of
laccase further reduced organic matter accumulation when applied in combination with core
aeration and sand topdressing.
INTRODUCTION
One of the major problems in management of recreational turfgrass sites, especially golf
greens, is accumulation of organic matter in the form of tightly intermingled dead and living
plant tissue between the soil and green turfgrass. This high organic matter layer, known as
thatch, consists of stolons, rhizomes, roots, crown tissue, leaf sheaths, and blades (Engel, 1954;

93
Roberts and Bredakis, 1960). Cultural practices like core aeration followed by sand topdressing
may cause formation of a mat layer which is a thatch layer mixed with sand or soil with sand
most common on golf greens (McCarty, 2005). Mat layers are more common on greens and
physical conditions in a mat layer can vary depending upon whether the percent sand or percent
organic matter content dominates with best conditions when the organic matter content is < 4.0%
by weight (Carrow, 2004).
Soil physical properties are adversely modified due to excessive accumulation of a thatch
or mat layer to the point that organic matter, and not sand, is the dominant matrix. Also, within a
mat where bentgrass roots are a major component of total organic matter, high temperatures may
induce root dieback resulting in rapidly decaying dead gelatinous organic matter that swells in
the presence of water during decomposition and plugs the soil macro-pores (air-filled pores),
causing low oxygen levels in the root zones (Carrow, 2004; O’Brien and Hartwiger, 2003),
decreased movement of oxygen through the thatch or mat zone, decreased water infiltration, low
oxygen levels within the thatch/mat layer during wet periods, and increased water retention
(Carrow, 2003; Hartwiger, 2004; McCarty et al., 2007). These conditions often lead to secondary
problems like wet wilt, soft surface, increased mower scalp, black layer, limited rooting, and
extra- and intra-cellular freezing damage (Beard, 1973; Carrow, 2004; O’Brien and Hartwiger,
2003).
The most effective cultural or mechanical techniques used today such as core aeration,
vertical mowing, grooming, and topdressing may adversely impact turf quality, hinder
playability, and require intensive inputs for labor and energy (Barton et al., 2009; Landreth et al.,
2008; McCarty et al., 2007). In addition, these practices have shown contrasting results in their
ability to reduce organic matter content in the thatch or mat layer (Barton et al., 2009; Carrow et

94
al., 1987; Dunn et al., 1981; McCarty et al., 2005; McWhirter and Ward, 1976; Weston and
Dunn, 1985; White and Dickens, 1984). Non-destructive thatch management techniques are
highly desired and several past studies using different products like glucose, cellulase solutions
(Ledeboer and Skogley, 1967), and commercial products containing mixture of amino acids,
microbial inoculum, and fertilizers were inconsistent (McCarty et al., 2005; Murdoch and Barr,
1976). The inconsistencies may be because these different products focused on the degradation
of cellulosic and hemicellulosic sugars in thatch biomass by attempting to improve microbial
populations.
Accumulation of organic matter in the form of thatch or mat layer is due to the presence
of lignin, a plant cell wall constituent that acts as a protective matrix and limits the accessibility
of microbial degraders to more biodegradable plant materials, such as cellulosic and
hemicellulosic sugars (Ledeboer and Skogley, 1967). Lignin is extremely recalcitrant to
degradation due to its complex structure formed by random oxidative couplings of mono-lignols
of three primary hydroxycinnamyl alcohols: p-coumaryl, coniferyl, and sinapyl alcohols
(Ledeboer and Skogley, 1967; Wong, 2009). Mono-lignols randomly bond in the lignin
macromolecule by C-O-C and C-C linkages forming β-O-4, β-5, β-β, 5-5, 4-O-5, and β-1 bonds
(Alder, 1977; Del Rio et al., 2007; Ralph et al., 2004). Several models of lignin molecular
structure have been proposed but these models do not imply any particular sequence of
monomeric units in the lignin macromolecule (Chen and Sarkanen, 2003; Davin and Lewis,
2003).
Lignin acts as the rate limiting step in microbial decomposition of the organic matter and
the rate of the degradation progress is directly related to the amount to lignin present in organic
matter (Taylor et al., 1989). A close relationship of mass loss with activity of lignocellulose-

95
degrading enzymes has been reported (Sinsabaugh et al., 1993). Extra-cellular lignolytic
enzymes produced by certain white-rot fungi are responsible for natural degradation of lignin
(Kirk et al., 1975, 1976). Lignin degradation by extra-cellular enzymes produced by white-rot
fungi exposes cellulosic sugars for further microbial degradation (Blanchette, 1984; Mester et al.,
2004; Otjen and Blanchette., 1987). Several studies have reported weight loss of organic matter
from different turfgrass systems when inoculated with white-rot fungi in controlled conditions
(Martin and Dale., 1980; Sartain and Volk, 1984). However, field inoculation experiments on
bermudagrass showed no thatch degradation (Martin and Dale., 1980).
Direct application of laccase solution to creeping bentgrass was introduced as a novel
approach to facilitate the decomposition of organic matter in a greenhouse study with conditions
conducive for thatch development (Chapter III). It is very difficult to maintain specific microbial
populations for long periods of time under most turfgrass management systems. The direct
application of laccase enzyme, the active end product of white-rot fungi that acts on lignin,
reduced the limitations associated with maintaining microbial populations. Relative to the
control, laccase treatment with an activity level of 2.0 units cm-2
at a bi-weekly interval reduced
the rate of organic matter and thatch accumulation, but a net accumulation of organic matter in
thatch layer was observed overtime including pots treated with laccase (Chapter III). In contrast,
a bi-weekly application of laccase enzyme at 2.0 units cm-2
on thatch layer of a dead creeping
bentgrass for six months verified the effectiveness of laccase in enhancing the rate of organic
matter decomposition and the loss in total sugar content of thatch biomass suggesting that
laccase application exposed cellulosic and hemicellulosic sugars for microbial degradation by
opening up the biomass structure (Chapter IV).

96
This field study on creeping bentgrass was designed to: a) test the efficacy of using
laccase enzyme under field conditions; b) to optimize the rate and frequency of application of
laccase enzyme; c) compare laccase with and without core aeration followed by topdressing; and
d) to compare the effectiveness of laccase from three different sources.
MATERIALS AND METHODS
A two year field study on ‘Crenshaw’ creeping bentgrass, Agrostis stolonifera L.
(Engelke et al., 1995), was conducted at The University of Georgia, Griffin Campus from June
2010 to Jan 2012. The experiment was conducted on a 20-year old bentgrass green established as
a sand based putting green with 90:10 sand and organic matter mix (Michigan peat) based on
USGA specifications. The bentgrass green was mowed three times a week by Toro Greensmaster
3100 (The Toro Company, Bloomington, MN) and maintained at a height of 0.42 cm.
Bi-weekly fungicide applications on the green were performed from the third week of
April to third week of November to control dollar spot (Sclerotinia homoeocarpa), brown patch
(Rhizoctonia solani), anthracnose (Colletotrichium graminicola), Pythium blight (Pythium
aphanidermatum). The fungicide spray routine for both years consisted of applications of Banner
MAXX®
at 3.2 L ha-1
(14.3% propioconazole, Syngenta Crop Protection, Inc., Greensboro, NC)
from April to May. From the last week of May to third week of September fungicide treatments
every two weeks consisted of a mixture containing Daconil® (40.4% tetrachloroisophthalonitrile,
Syngenta Crop Protection, Inc., Greensboro, NC) at the rate of 11.5 L ha-1
alternating with
Subdue MAXX® (22% Mefenoxam, Syngenta Crop Protection, Inc., Greensboro, NC) at 1.6 L
ha-1
and with Banner MAXX® at rate of 9.6 L ha
-1. Fertilizer application for both years consisted
of 50 kg ha-1
granular fertilizer 24-4-10 (Lesco. Strongsville, OH) in the third week of March,
September, and October and 2 kg ha-1
soluble 20-20-20 fertilizer (JR Peters Inc, Allentown, PA)

97
every two weeks starting the third week of April thru September made in combination with a
fungicide application.
The experiment consisted of four replications of thirteen treatments in year one and ten
treatments in year two in a completely randomized block design. Treatments were organized to
evaluate: laccase rates; frequency of application; influence of management (core aeration and
topdressing); and laccase source (Table 5.1). Each block was divided into two halves, one half
received only laccase treatments and the other half received laccase and was core-aerated (Ryan
Greensaire 24 Aerator, Johnson Creek, WI; tine diam. 1.27 cm; tine depth 6.25 cm; tine spacing
5.0 x 5.0 cm) and sand topdressed (1134 g per plot, Quikrete Premium Play Sand) using Scotts
Precision Green Spreader twice a year. Laccase enzyme produced from white-rot fungi Trametes
versicolor was purchased from Sigma Aldrich ((product 53739, Sigma Aldrich Inc., St. Louis,
MO.) and was sprayed as 410-mL solution at five activity levels [0 (control), 0.5, 1.0, 2.0, and
4.0 units cm-2
] at every two weeks. Laccase activity level of 2.0 units cm-2
was applied at four
different frequencies (2, 4, 8, and 12 weeks). Laccase was also applied at 2.0 units cm-2
every 4
weeks on plots core-aerated and sand topdressed to observe the effectiveness of laccase in
combination with the cultural management practice. During the first year of the study, laccase
enzyme from two different sources, Jiangnan University, China (Picnoporus genus) and a
commercial industrial distributor was also applied at an activity level of 2.0 units cm-2
every two
weeks to compare the efficacy of laccase from different sources. Based on unavailability of
laccase from Sigma Aldrich and similar results from different laccase enzymes observed in year
1 of the study, the second year treatments were applied using laccase enzyme from Jiangnan
University, China. For the sake of brevity, laccase treatments hereafter will be mentioned as
activity levels (i.e., rate) followed by the frequency of laccase application in parenthesis.

98
Laccase Activity Assay
The activity of laccase was quantified by a calorimetric assay using a Beckman DU 640B
spectrophotometer (Beckman Instruments Inc., Fullerton, CA) where one activity unit of laccase
corresponds to the amount of enzyme that causes an absorbance change at 468 nm at a rate of 1.0
unit min-1
in 3.4 mL of 1 mM 2, 6-dimethoxyphenol, a specific substrate for laccase, in citrate-
phosphate buffer at pH 3.8 (Park et al., 1999).
Measurements
Organic matter Content
The measurement of OM was conducted by total loss of ignition as described by Carrow
et al. (1987). Two soil cores (2.0 cm diam.) were obtained at 0-2.5 cm (OMU) and 2.5-5.0 cm
(OML) depth from the plot and used to determine organic matter at 0-5.0 (OM). The cores were
dried in an oven at 100 ± 5oC for 24 h and weighed. Soil cores were ashed in a muffle furnace at
600 ± 10oC for 24 h and weighed again. Organic matter content was determined as the difference
in the two readings and percent organic matter was calculated.
Saturated Hydraulic Conductivity
Saturated hydraulic conductivity of the intact cores was measured by constant hydraulic
head method using a Marriot tube apparatus. An intact core (diam. 4.7 cm and length 7.7 cm)
was obtained from each plot in a brass cylinder using a soil corer (Model 0200 soil sampler,
Soilmoisture Equip. Corp., Santa Barbara, CA) The bottom of the core was covered with a
double layer of cheesecloth held in place with a rubber band and saturated overnight in a 0.05 N
CaCl2 solution to minimize dispersion. A steady state flow through the samples was established
by flowing 0.05 N CaCl2 through the core for 10 min. After 10 min the volume of water that

99
passed through the core was measured for one minute and repeated three times. Saturated
hydraulic conductivity was calculated using Darcy's equation.
Thatch Layer Thickness
Thatch layer thickness was measured by two replaceable wedge-shaped turf profiles (8.9
cm wide and 2.5 cm thick) using AMS Turf Profiler (AMS Inc., American Falls, ID). Thatch
layer thickness was measured from four points across the width of each profile and averaged.
The clear visible distinction between thatch layer and the sand layer below was considered as the
boundary for the measurement.
Extractive-free Lignin Content
The top 2.5 cm thatch samples were collected from each intact core after sampling for
SHC. Thatch samples were first washed, dried, and ground and then passed through a series of
sieves with a 841µm sieve at the top and a 177µm sieve at the bottom. The material left on the
top of largest sieve size was reprocessed and the material that passed through the smallest sieve
was discarded. The material retained by the 177 µm sieve size was used for analysis. The thatch
was extracted for 24 h using the Soxhlet method for water- and alcohol-soluble impurities using
de-ionized water and 16.26 M (95 percent USP grade) ethyl alcohol, respectively. Lignin content
after removal of water- and alcohol-soluble extractives from biomass was considered to be
extractive-free lignin.
Extractive-free acid-soluble (LS) and-insoluble lignin (LI) content in the thatch layer was
determined in a two-step acid-hydrolysis procedure according to the laboratory analytical
procedure developed by The National Renewable Energy Laboratory (NREL, 2008). Acid-
soluble lignin consists of low molecular weight phenolic components of lignin macromolecule.
In the first step, extractive-free thatch samples were hydrolyzed for 60 min with 72% H2SO4 at

100
30oC. In the second step, H2SO4 was diluted to 4% and the samples were autoclaved at 121
oC for
1 h and then vacuum filtered. Acid-soluble lignin was determined using this hydrolysis liquid at
240 nm wavelength in a Beckman DU 640B spectrophotometer (Beckman Instruments Inc.,
Fullerton, CA). The solids remaining after acid hydrolysis were dried in an oven at 100 ± 5oC for
24 h, weighed, ashed in a muffle furnace at 600 ± 10oC for 24 h, and weighed again. Weight
difference was used to calculate the acid-insoluble lignin content. Total lignin (LT) was
calculated by adding acid-soluble and-insoluble lignin content.
Extractive-free Sugar Content
Sugar content determined from biomass after removal of water- and alcohol-soluble
extractives is known as extractive-free sugar content. Monosaccharide sugars that are
components of structural polysaccharides, cellulose and hemicellulose were measured. The total
sugar content (TS) was determined by addition of sugar content for glucose (SGLU), xylose
(SXYL), arabinose (SARA), galactose (SGAL), and mannose (SMAN). The sugar content is measured
using hydrolysis liquid collected after vacuum filtration in the above step. The hydrolysis liquid
was neutralized to a pH range 7.0-8.0 using NaHCO3 (sodium bicarbonate) and monosaccharide
sugars were determined using high performance liquid chromatography (HPLC) in an Agilent
1100 HPLC (Aligent Technologies, Waldbronn, Germany) with binary pump and refractive
index detector. An AMINEX HPX-87P 7.8 x 300 mm Pb2+
carbohydrate analysis column (Bio-
Rad, Hercules, CA) was used at 85 oC with deionized water as mobile phase at a flow rate of 0.6
mL min-1
.
Statistical Analysis
Analysis of variance (ANOVA) was performed to evaluate the main effects of treatments using
general linear model (GLM) (SAS Institute, 1994). Treatments were grouped together for

101
analysis related to rate of laccase application, frequency of laccase application, laccase along
with cultural management control, and sources of laccase. Analysis of variance (ANOVA) was
performed using general linear model on each group of treatments to evaluate effects of
treatments in that particular group. Fisher’s protected LSD test with α = 0.05 was used for
determining statistical differences among durations and treatment means following each
ANOVA.
RESULTS
Combined Analysis
Significant treatment effects (P ≤ 0.001) were observed on TLT, LS, LI, LT, and ST during
the first year of treatment application (Table 5.1). During the second year, significant treatment
effects for OMU (P ≤ 0.01), TLT (P ≤ 0.001), SHC (P ≤ 0.001), LS (P ≤ 0.001), LI (P ≤ 0.001),
LT (P ≤ 0.001), and ST (P ≤ 0.05) were observed (Table 5.2).
Rate of Laccase Application
Laccase treatments 0 (2), 0.5 (2), 1.0 (2), 2.0 (2), and 4.0 (2), rate of laccase activity is
followed by frequency of application in parenthesis, are grouped together to observe the effect of
rate of laccase application. A significant effect was observed in year 1 and 2 for TLT (P ≤
0.001), LS (P ≤ 0.001), LI (P ≤ 0.001), LT (P ≤ 0.001), and ST (P ≤ 0.05) (Table 5.1, 5.2). No
differences were observed for organic matter and saturated hydraulic conductivity. All laccase
treatments decreased TLT by 3.8 to 4.8 mm (20 to 26%) and 4.9 to 5.5 mm (24 to 28%) in
comparison to control during year one and two, respectively (Fig 5.1A). No differences were
observed for TLT at different rates of laccase application (Fig 5.1A).
Laccase treatments decreased LS by 6 to 12 mg·g-1
and 4 to 12 mg·g-1
when compared to
control during year one and two, respectively (Fig 5.2A). In year one, laccase treatment 4.0 (2)

102
reduced LS from treatments 0.5 (2) and 1.0 (2). In the second year, LS decreased significantly
with increasing laccase activity rate (Fig 5.2A). A 5 to 29 mg·g-1
and 13 to 35 mg·g-1
reduction
in LI, which makes up the bulk of LT, was observed over the control for first and second year,
respectively with rate of laccase application up to 2.0 units cm-2
(Fig 5.3A). A similar reduction
of 13 to 38 and 17 to 43 mg·g-1
for LT with laccase application up to 2.0 units cm-2
was obtained
for year one and two, respectively when compared to control (Fig 5.4A). However, acid-
insoluble lignin content was similar to the control at laccase activity level of 4.0 units cm-2
(Fig
5.3A).
Total sugar content (ST) in the thatch biomass decreased by 27 to 69 mg·g-1
in year one
and by 65 to 105 mg·g-1
in year two relative to control with application of laccase (Fig 5.5A). A
reduction in SGLU, SXYL, and SGAL was observed when laccase was applied above 1.0 units cm-2
during year one (Fig 5.6A, 5.7A, 5.8A). A reduction in SGLU and SXYL content was observed in
comparison to control for all the rates of laccase application during year two (Fig 5.6A, 5.7A).
No reduction in SGAL was observed for any laccase treatment during year two (Fig 5.8A).
Frequency of Laccase Application
The frequency group consists of control, 2.0 (2), 2.0 (4), 2.0 (8), and 2.0 (12) to observe
effect of laccase application frequency on thatch layer properties. A significant effect was
observed both years for TLT (P ≤ 0.001), LS (P ≤ 0.001), LI (P ≤ 0.001), LT (P ≤ 0.001), and ST
when compared to control; and for SHC in year 1 (Table 5.1, 5.2). Thatch layer thickness was
reduced in comparison to control when laccase was applied at all the frequencies in both years
(Fig 5.1B). Laccase application at eight and twelve weeks in year two showed a slight increase in
TLT in comparison to plots receiving laccase application at two and four weeks frequency (Fig
5.1B). Laccase application at all frequencies reduced LS content in comparison to control in both

103
years (Fig 5.2B). The decrease in laccase application frequency showed slight increase in LS
contents as is evident from higher LS content at 8 and 12 week frequency when compared to
laccase treatment applied every two weeks in both years (Fig 5.2B). Laccase treatments applied
every two and four weeks were effective in reducing LI and LT content in comparison to control
in both years (Fig 5.3B, 5.4B). As laccase application frequency decreased, LI and LT content
increased in both years (Fig 5.3B, 5.4B).
Total sugar content (ST) in the thatch biomass tended to decrease with application of
laccase in both years (Fig 5.5B). No change in SGLU content in comparison to control was
observed for different laccase treatments during the first year (Fig 5.6B). During second year, a
reduction in glucose content of thatch biomass was evident in all plots treated with laccase
regardless of frequency compared to control plots (Fig 5.6B). In both years, the SXYL and SGAL
contents in thatch biomass tended to be lower than in the control, especially at the 2 week
frequency interval (Fig 5.7B, 5.8B).
Cultural Management
Four treatments in the cultural management group were control, CMP, 2.0 (4), and
CMP+2.0 (4). Significant treatments effects were obtained for TLT (P ≤ 0.01), LS (P ≤ 0.001), LI
(P ≤ 0.001), LT (P ≤ 0.001), and ST (P ≤ 0.05) during first year (Table 5.1); and in the second
year for OMU (P ≤ 0.05), TLT (P ≤ 0.01), SHC (P ≤ 0.001), LS (P ≤ 0.001), LI (P ≤ 0.001), LT
(P ≤ 0.001), and ST (P ≤ 0.05) (Table 5.2). In plots treated with CMP, OM content (0-2.5 cm)
decreased by 30.3 and 65.7 mg·g-1
during year one and two, respectively when compared to
control plots (Fig 5.9). Similarly, OMU decreased from 132 to 113 mg·g-1
during first year and
from 193 to 108 mg·g-1
during second year in plots treated with CMP+2.0 (4) as compared to
control plots (Fig 5.9). Thatch layer thickness was lower in plots receiving cultural management

104
treatments and laccase treatments when compared to control plots (Fig 5.1C). Plots treated with
core aeration followed by sand topdressing along with application of laccase once in four weeks
showed a significant reduction in thatch layer when compared to laccase application and cultural
management treatment (Fig 5.1C). A significant increase in SHC was observed during second
year in plots treated with CMP+2.0 (4) as compared to control plots (Fig 5.10).
Compared to control, other treatments in the cultural management group reduced acid-
soluble lignin (Fig 5.2C). Plots receiving laccase application had lower levels of LS as compared
to plots treated with CMP in the both years (Fig 5.2C). Relative to control, acid-insoluble lignin
content increased in plots receiving CMP and CMP+2.0 (4) treatments; but decreased in plots
receiving only laccase enzyme (Fig 5.3C). Plots receiving CMP+2.0 (4) treatment had increased
levels of LI compared to plots receiving only cultural management practice (Fig 5.3C). Total
lignin content in plots receiving CMP+2.0 (4) treatment increased when compared to control; but
decreased in plots receiving only laccase treatments (Fig 5.4C). Total sugar content in thatch
layer biomass from plots treated with CMP+2.0 (4) treatment was significantly lower than the
control plots in both years (Fig 5.5C). Similarly, for the CMP+2.0 (4) treatment SGLU (Fig 5.6C),
SXYL (Fig 5.7 C), and SGAL (Fig 5.8C) contents were lower when compared to control treatment
for both years. Plots treated with CMP showed reduced content of SGAL when compared to
control for year one and two (Fig 5.8C). A reduction in xylose content was observed in plots
treated with CMP as compared to control in first year but not in the second year (Fig 5.7C). No
effect of CMP was observed on the glucose content (Fig 5.6C). Saturated hydraulic conductivity
increased in plots treated with CMP by 12.6 to 13.6 cm h-1
when compared to control plots and
by 6.4 cm h-1
in the second year for CMP+2.0 (4) (Fig 5.10).

105
Source of Laccase Enzyme
Three laccase source treatments are 2.0 (2), CHI, and CHU. Significant treatment effects
were observed for LS (P ≤ 0.05), LI (P ≤ 0.001), and LT (P ≤ 0.01). Laccase enzyme from
different sources had no effect on TLT, SHC, OM and sugar content. Acid-soluble lignin content
was higher in plots treated with CHU and CHI as compared to laccase enzyme from Sigma
Aldrich (Fig 5.2D). Plots treated with CHI showed a slightly higher value for LI and LT as
compared to CHU and 2.0 (2) treatments (Fig 5.3D, 5.4D).
DISCUSSION
Use of Laccase Application to Manage Thatch
Non-destructive methods to manage thatch are highly desirable. Several efforts in the
past using different treatments and commercial products like sugars, mixtures of sugars and
microbial inocula, mixture of amino acids and algae, and some enzymes like cellulase have
showed contrasting results and mostly proved ineffective (Ledeboer and Skogley, 1967; Martin
and Dale., 1980; McCarty et al., 2005; Murdoch and Barr, 1976). The inconsistent results of
these studies may be attributed to the fact that they were focused to increase microbial
population for organic matter decomposition. Maintaining higher microbial populations over
sustained periods of time under field turfgrass management systems is very difficult due to the
inability to maintain proper micro-environment conditions, particularly moisture and temperature
regimes, required by particular microbial species. Another possible reason for contrasting results
of the above mentioned studies was that they focused on degradation of cellulosic and
hemicellulosic sugars instead of lignin. Our hypothesis is that the lignin protective matrix has to
be at least partially degraded to allow bacterial population to act on the structural sugars.

106
Laccase is an extra-cellular enzyme, a multi copper oxidase, known to oxidize a wide
range of phenolic compounds using oxygen as an electron acceptor (Baldrian, 2006). Lignin
phenolic components are oxidized due to laccase-mediated cleavage of different covalent bonds
such as Cα-Cβ, alkyl-aryl, and Cα oxidation (Wong, 2009). This cleavage of different covalent
bonds formed within lignin macromolecule and between lignin and structural sugars open up the
biomass structure leading to increased availability of easily degradable sugars by microbes. The
laccase enzyme is stable over a wide range of pH and temperature (Baldrian, 2006; Munoz et al.,
1997; Stoilova et al., 2010; Thurston, 1994). By using laccase enzyme, we can enhance thatch
management over wide range of environmental conditions and can better utilize the microbial
decomposition of organic matter.
Direct application of laccase on potted creeping bentgrass in a greenhouse study, where
conditions for thatch development were conducive, was found to be effective relative to control
in reducing thatch-mat depth, OM, and significantly increasing SHC (Chapter III). However, an
overall increase in OM (0-5.0 cm) and organic layer thickness was observed for all the
treatments over the experiment duration; but less increase with laccase treatments. Application of
laccase at 2.06 units cm-2
was effective in reducing the rate of accumulation of organic matter
and organic layer thickness (Chapter III). In our present study, the efficacy of laccase enzyme
was verified on the field conditions along with optimization of laccase in terms of rate and
frequency of laccase application. Application of laccase in combination with core aeration and
topdressing was effective in changing thatch characteristics.
Rate of Laccase Application
In our study, laccase enzyme was applied at five different rates (activity levels) as
control, 0.5, 1.0, 2.0, and 4.0 units cm-2
applied every two weeks and thatch layer thickness

107
decreased with all laccase applications (Fig 5.1A). Since there was no difference in the thatch
layer thickness from plots treated with different levels of laccase activity. This indicates that
when laccase is applied biweekly, we can reduce the rate of application to 0.5 units cm-2
. There
was no effect of different laccase applications on the organic matter content (Table 5.1, 5.2).
This may be attributed to a couple of possible reasons, with one being that the bentgrass green on
which the study is conducted is a 20 year old green with high organic matter content within and
below the thatch layer. So, a long term application of laccase may be needed to observe any
significant differences. The second is the method in which we sample and measure organic
matter. The sample is collected for 0-2.5 and 2.5-5.0 cm depth. So, even if there is slight change
in the organic matter content of the thatch layer due to application of laccase, it may be masked
by very high organic matter content below the thatch layer. In our previous greenhouse studies, a
significant decrease in organic matter content was observed with application of laccase (Chapter
III, Chapter IV). This was because as the thatch layer thickness decreased with application of
laccase, the top 2.5 cm core that was used for organic matter content contacted the increased
portion of sand with low organic matter content when using a standard depth of sample. Thus an
overall reduction in organic matter content was observed. Whereas, in our field study although
we observed that thatch layer thickness was decreased with laccase application, the sample depth
never contacted the underlying sand due to deeper thatch/mat layer with high organic matter
content and therefore, no differences in organic matter content were observed within the sample
depth.
Acid-soluble lignin content decreased relative to the control at all laccase activity levels
and LS tended to decrease as laccase activity increased, which indicates the effectiveness of
laccase in oxidizing the bonds of lignin macromolecule (Fig 5.2A). On the other hand,

108
application of laccase up to the 2.0 units cm-2
level decreased LI but at 4.0 units cm-2
LI was
similar to control (Fig 5.3A). This could be explained in term of the decreased total sugar content
(i.e. cellulose and hemicellulose) due to application of laccase at 4.0 units cm-2
as illustrated in
Fig 5.5A. Three major components of plant biomass are cellulosic sugars, hemicellulosic sugars,
and lignin. So, with application of laccase, lignin bonds are broken which leads to opening up of
the biomass structure making sugars more available for microbial decomposition. As the sugar
content is decreased, it tends to increase the lignin content when determined on a dry weight
basis. Since structural carbohydrate content decreased with increased application of laccase, this
suggests there was greater availability of sugars for microbial degradation.
Frequency of Laccase Application
Laccase at 2.0 units cm-2
was applied once every 2, 4, 8, and 12 weeks to optimize the
frequency of application. Thatch layer thickness decreased in comparison to control when
laccase was applied regardless of frequency (Fig 5.1B). All laccase frequencies of application
were similar in year one, but the 2.0 (2) and 2.0 (4) frequencies exhibited the lowest TLT in year
two, indicating that 2.0 units cm-2
of laccase as infrequent as one application in four weeks
would be an effective frequency. A reduction in LS was observed in plots when laccase was
applied at the different frequencies in comparison to control (Fig 5.2B), while LI decreased only
at the 2 and 4 week frequency (Fig 5.3B). The contents of LS and LI tend to be higher at 4 and 8
week frequency relative to two week frequency. In year 1, there was trend for total and
individual sugar contents to decrease in the plots treated with laccase in comparison to the
control plots, but this trend was especially apparent year 2, indicating that laccase application
modified the thatch biomass structure leading to increased decomposition by microbes (Fig 5.5B,
5.6B, 5.7B, 5.8B).

109
Laccase with Core aeration and Topdressing
Organic matter content in the upper 2.5 cm (OMU) was lower in plots treated with core
aeration followed by topdressing as well as plots receiving laccase along with these cultural
management practices (Fig 5.9). Application of laccase once in four weeks along with cultural
management practice was equally effective in reducing OM content as cultural practice alone.
The reduction in OM content may be attributed to the dilution of organic matter caused by
application of sand as topdress into this upper zone. Application of only laccase at 2.0 units cm-2
once in 4 weeks was not as effective in reducing OM content (Fig 5.9). When laccase was
applied along with core aeration and topdressing, it tends to be more effective in reducing TLT
and TS content as well as increasing LI content as compared to only cultural management
practice and only laccase application (Fig 5.3C). This may be attributed to the structural changes
in thatch biomass caused by application of laccase making it more favorable for microbial
decomposition and core aeration creating favorable environment for microbial population
(Carrow et al., 1987; Ledeboer and Skogley, 1967). Increased microbial population in the plots
treated with cultural management led to increase in loss of sugars and eventually led to increase
in lignin content in the remaining organic matter. Application of laccase in combination with
core aeration and sand topdressing may lead to reduced number of cultivations in the long run.
CONCLUSIONS
This field research demonstrated the efficacy of applications of laccase enzyme on
physical and chemical composition properties of the thatch layer of creeping bentgrass turf over
a wide range of activity levels and frequencies of application. Laccase application rate can be
reduced to 0.5 units cm-2
when applied as biweekly applications and remain effective in reducing
thatch layer accumulation. When laccase at 2.0 units cm-2
is applied, the application frequency

110
can be reduced to once a month. Laccase application at 2.0 units cm-2
once in four weeks along
with core aeration and topdressing cultural management practices was effective in lowering TLT,
OMU, LS, ST, and individual sugar contents and increasing LI content.
LITERATURE CITED
Alder, E. 1977. Lignin chemistry - past, present and future. Wood Sci. Technol. 11: 169-218.
Baldrian, P. 2006. Fungal laccases-occurrence and properties. FEMS Microbiol Rev. 30: 215-
242.
Barton, L., G.G.Y. Wan, R.P. Buck, and T.D. Colmer. 2009. Effectiveness of cultural thatch-mat
controls for young and mature kikuyu turfgrass. Agron. J. 101: 67-74.
Beard, J.B. 1973. Turfgrass: Science and culture. Prentice Hall Inc., Englewood Cliffs, NJ.
Blanchette, R.A. 1984. Screening wood decayed by white rot fungi for preferential lignin
degradation. Appl. Environ. Microbiol. 48: 647-653.
Carrow, R.N. 2003. Surface organic matter in bentgrass greens. USGA Turfgrass Environ. Res.
Online 2(17): 1-10.
Carrow, R.N. 2004. Surface organic matter in bentgrass greens. Golf Course Mgt. 72(5): 96-101.
Carrow, R.N., B.J. Johnson, and R.E. Burns. 1987. Thatch and quality of Tifway bermudagrass
turf in relation to fertility and cultivation. Agron. J. 79: 524-530.
Chen, Y.R., and S. Sarkanen. 2003. Macromolecular lignin replication: A mechanistic working
hypothesis. Phytochemistry Rev. 2: 235-255.
Davin, L.B. and N.G. Lewis 2003. A historical perspective on lignin biosynthesis: Monolignol,
allylphenol and hydroxycinnamic acid coupling and downstream metabolism.
Phytochemistry Rev. 2: 257-288.
Del Rio, J. C., G. Marques, J. Rencoret, A.T. Martinez, and A. Gutierrez. 2007. Occurrence of

111
naturally acetylated lignin units. J. Agric. Food Chem. 55: 5461-5466.
Dunn, J.H., K.M. Sheffer, and P.M. Halisky. 1981. Thatch and quality of Meyer zoysia in
relation to management. Agron. J. 73: 949-952.
Engel, R.E. 1954. Thatch on turf and its control. Golf Course Rep. 22 (5): 12-14.
Engelke, M.C., V.G. Lehman, W.R. Kneebone, P.F. Colbaugh, J.A. Reinert, and W.E. Knoop.
1995. Registration of ‘Crenshaw’ creeping bentgrass. Crop Sci. 35: 589.
Hartwiger, C. 2004. The importance of organic matter dynamics: How research uncovered the
primary cause of secondary problems. USGA Green Section Record 42(3): 9-11.
Kirk, T.K., W.J. Connors, R.D. Bleam, and G. Jeikus. 1976. Requirements for a growth substrate
during lignin decomposition by two wood-rotting fungi. Appl. Environ. Microbiol. 32:
192-194.
Kirk, T.K., W.J. Connors, R.D. Bleam, W.F. Hackett, and J.G. Jeikus. 1975. Preparation and
microbial decomposition of synthetic [14
C] lignins. Proc. Natl. Acad. Sci. USA. 72: 2515-
2519.
Landreth, J., D. Karcher, and M. Richardson. 2008. Cultivating to manage organic matter in sand
based putting greens: University of Arkansas researchers provide important insight for
managing organic buildup on putting greens. USGA Turfgrass Environ. Res. Online
46(1): 16-19.
Ledeboer, F.B., and C.R. Skogley. 1967. Investigations into the nature of thatch and methods for
its decomposition. Agron. J. 59: 320-323.
Martin, S.B., and J.L. Dale. 1980. Biodegradation of turf thatch with wood-decay fungi.
Phytopathology. 70: 297-301.
McCarty, L.B. 2005. Best golf course management practices. 2nd
ed. Prentice Hall Inc. Upper

112
Saddle River, NJ.
McCarty, L. B., M.F. Gregg, and J.E. Toler. 2007. Thatch and mat management in an established
creeping bentgrass green. Agron. J. 99: 1530-1537.
McCarty, L.B., M.F. Gregg, J.E. Toler, J.J. Camberato, and H.S. Hill. 2005. Minimizing thatch
and mat development in a newly seeded creeping bentgrass golf green. Crop Sci. 45:
1529-1535.
McWhirter, E.L., and C.Y. Ward. 1976. Effect of vertical mowing and aerification on golf green
quality. Mississippi Agric. For. Exp. Stn. Res. Rep. 2 (12): 1-2.
Mester, T., E. Varela, and M. Tien. 2004. Wood degradation by brown-rot and white-rot fungi.
The Mycota II: Genetics and biotechnology. 2nd
edition. Springer-Verlag, Berlin,
Heidelberg.
Munoz, C., F. Guillen, A.T. Martinez, and M.J. Martinez. 1997. Laccase isozymes of Pleurotus
eryngii: Characterization, catalytic properties, and participation in activation of molecular
oxygen and Mn2+
oxidation. App. Environ. Microbiol. 63: 2166-2174.
Murdoch, C.L., and J.P. Barr. 1976. Ineffectiveness of commercial microorganism inoculums in
breaking down thatch in common bermudagrass in Hawaii. HortScience. 11: 488-489.
NREL- National Renewable Energy Laboratory. 2008. Determination of structural carbohydrates
and lignin in biomass. Available at: http://www.nrel.gov/biomass/pdfs/42618.pdf
(Verified 01 July, 2012). NREL, Golden, CO, USA.
O’Brien, P., and C. Hartwiger. 2003. Aeration and topdressing for the 21st century: Two old
concepts are linked together to offer up-to-date recommendations. USGA Green Section
Record 41(2): 1-7.
Otjen, L., and R. Blanchette. 1987. Assessment of 30 white rot basidiomycetes for selective

113
lignin degradation. Holzforschung. 41: 343-349.
Park, J. W., J. Dec, J. E. Kim, and J. M. Bollag. 1999. Effect of humic constituents on the
transformation of chlorinated phenols and anilines in the presence of oxidoreductive
enzymes or birnessite. Environ. Sci. Tech. 33: 2028-2034.
Ralph, J., M. Bunzel, J.M. Marita, R.D. Hatfield, F. Lu, H. Kim, P.F. Schatz, J.H. Grabber, and
H. Steinhart. 2004. Peroxidase dependent cross linking reactions of p-hydroxicinnamates
in lant cellwalls. Phytochemistry Rev. 3: 79-96.
Roberts, E.C., and E.J. Bredakis. 1960. What, why and how of turfgrass root development. Golf
Course Rep. 28: 13-24.
Sartain, J.B., and B.G. Volk. 1984. Influence of selected white-rot fungi and topdressings on the
composition of thatch components of four turfgrasses. Agron. J. 76: 359-362.
SAS Institute Inc. 1994. The SAS system for windows. Release 9.2. SAS Inst., Cary, NC.
Sinsabaugh R.L., R.K. Antibus, A.E. Linkins, C.A. Mcclaugherty, L. Rayburn, D. Repert, T.
Weiland. 1993. Wood decomposition - nitrogen and phosphorus dynamics in relation to
extracellular enzyme-activity. Ecology. 74: 1586-1593.
Stoilova, I., A. Krastanov, and V. Stanchev. 2010. Properties of crude laccase from Trametes
versicolor produced by solid-substrate fermentation. Adv. Bioscience Biotech. 1: 208-
215.
Taylor B.R., D. Parkinson, W.F.J. Parsons. 1989. Nitrogen and lignin content as predictors of
litter decay rates: A microcosm test. Ecology. 70: 97-104.
Thurston, C.F. 1994. The structure and function of fungal laccases. Microbiol. 140: 19-16.
Weston, J.B., and J.H. Dunn. 1985. Thatch and quality of Meyer zoysia in response to
mechanical cultivation and nitrogen fertilization. P. 449-458. In F. Lemaire (ed.) Proc. 5th

114
Int. Turfgrass Res. Conf., Avignon, France. 1-5 July 1985. Institut National de la
Recherche Agronomique, Paris, France.
White, R.H., and R. Dickens. 1984. Thatch accumulation in bermudagrass as influenced by
cultural practices. Agron. J. 76: 19-22.
Wong, D.W.S. 2009. Structure and action mechanism of ligninolytic enzymes. Appl. Biochem
Biotechnol. 157: 174-209.

115
Table 5.1 Analysis of variance (ANOVA) table for year 1 showing the effects of laccase treatments, rate of application, frequency of
application, laccase with cultural management, and laccase sources on creeping bentgrass.
Source of
variation
df
Total
organic
matter OMU
(0-2.5 cm)
Total
organic
matter OML
(2.5-5.0 cm)
Total organic
matter OM
(0-5.0 cm)
Thatch
layer
thickness
TLT
Saturated
hydraulic
conductivity
SHC
Acid-
soluble
lignin LS
Acid-
insoluble
lignin LI
Total
lignin
LT
Total
sugars
ST
-----------------------------------------------------mean square value------------------------------------------------------------------
Year 1
Rep 3 726 368 379* 12 95.8 1 7 13 86
Treatment 12 488 42 77 13*** 38.2 46*** 918*** 1029*** 2073***
Error 36 278 86 83 1 24.4 2 8 12 399
Rate of Appl.
Rep 3 1217 428 534 5 11.9 1 7 6 284
Treatment 4 59 28 030 15*** 6.15 81*** 1112*** 1196*** 1879*
Error 12 179 103 077 1 3.18 4 8 18 446
Freq. of Appl.
Rep 3 417 431 279 3 6.5 1 5 6 8
Treatment 4 61 16 10 21*** 4.6* 47*** 862*** 1184*** 1499*
Error 12 218 75 83 1 1.25 4 8 18 228
Cultural Mgt.
Rep 3 22 93 46 5 123 1 5 11 235
Treatment 3 753 34 72 17** 105 40*** 698*** 907*** 3136*
Error 9 276 100 71 2 71.1 2 6 8 326
Lacc. Sources
Rep 3 316 181 181 6 7.90 6 33 58 235
Treatment 2 736 011 123 10 1.59 35* 944*** 1123*** 1620
Error 6 230 208 174 1 1.03 4 16 20 434
* Significant at the 0.05 probability level
**Significant at the 0.01 probability level
*** Significant at the 0.001 probability level

116
Table 5.2 Analysis of variance (ANOVA) table for year 2 showing the effects of laccase treatments, rate of application, frequency of
application, and laccase with cultural management on creeping bentgrass.
Source of
variation
df
Total
organic
matter OMU
(0-2.5 cm)
Total
organic
matter OML
(2.5-5.0 cm)
Total
organic
matter OM
(0-5.0 cm)
Thatch
layer
thickness
TLT
Saturated
hydraulic
conductivity
SHC
Acid-
soluble
lignin LS
Acid-
insoluble
lignin LI
Total
lignin
LT
Total
sugars
ST
----------------------------------------------------------------mean square value-----------------------------------------------------
Year 2
Rep 3 4682 1329 1781 1 35.9 1 41 47 12234
Treatment 9 2024** 97 232 14*** 66.1*** 41*** 1334*** 1582*** 4364*
Error 27 589 124 159 1 6.63 1 27 26 1781
Rate of Appl.
Rep 3 4651 676 1096 0.3 9.47 3 44 50 6625
Treatment 4 942 140 256 21*** 2.23 77*** 745*** 1026*** 6092*
Error 12 684 149 185 0.4 1.39 1 27 23 1550
Freq. of Appl.
Rep 3 1785 568 683 2 11.2 1 31 38 4087
Treatment 4 1253 164 302 18*** 4.4 39*** 1260*** 1616*** 8331**
Error 12 605 163 187 1 3.03 1 37 37 1373
Cultural Mgt.
Rep 3 968 330 399 1 35.1 1 14 17 8281
Treatment 3 5372* 179 659 38** 125** 28*** 1678*** 1808*** 11808*
Error 9 850 167 205 1 13.8 1 21 19 2187
* Significant at the 0.05 probability level
**Significant at the 0.01 probability level
*** Significant at the 0.001 probability level

117
Fig. 5.1 Thatch layer thickness (TLT) after treatment application on creeping bentgrass with: five different levels of laccase (Fig
5.1A); laccase activity level 2.0 units cm-2
applied at four frequencies (Fig 5.1B); laccase at 2.0 units cm-2
applied at a frequency of 4
weeks in comparison with cultural management practice (Fig 5.1C); and laccase enzyme from different sources (Fig 5.1D). Values are
means of four replicates. Same letter on top of the bars (year one = standard, year two = bolded) are not considered to be statistically
different according to Fisher’s protected LSD at α = 0.05.
a
b b b b
a
b b b b
0
5
10
15
20
25
Control 0.5 (2) 1.0 (2) 2.0 (2) 4.0 (2)
mm
Rate of laccase treatments
A Year 1
Year 2
a
b b b b
a
c c bc b
0
5
10
15
20
25
Control 2.0 (2) 2.0 (4) 2.0 (8) 2.0 (12)
mm
Frequency of laccase application treatments
B Year 1
Year 2
a
b b c
a
b b c
0
5
10
15
20
25
Control CMC 2.0 (4) CMP+2.0 (4)
mm
Cultural management and laccase treatments
C Year 1
Year 2a
a a
0
4
8
12
16
SA (2) CHU (2) CHI (2)
mm
Sources of laccase enzyme treatments
D Year 1

118
Fig. 5.2 Extractive-free acid-soluble lignin content (LS) after treatment application on creeping bentgrass with: five different levels of
laccase (Fig 5.2A); laccase activity level 2.0 units cm-2
applied at four frequencies (Fig 5.2B); laccase at 2.0 units cm-2
applied at a
frequency of 4 weeks in comparison with cultural management practice (Fig 5.2C); and laccase enzyme from different sources (Fig
5.2D). Values are means of four replicates. Same letter on top of the bars (year one = standard, year two = bolded) are not considered
to be statistically different according to Fisher’s protected LSD at α = 0.05.
a b b bc c
a b c d e
0
20
40
60
80
100
Control 0.5 (2) 1.0 (2) 2.0 (2) 4.0 (2)
mg·g
-1
Rate of laccase treatments
A Year 1
Year 2
a c bc b b
a d c bc b
0
20
40
60
80
100
Control 2.0 (2) 2.0 (4) 2.0 (8) 2.0 (12)
mg·g
-1
Frequency of laccase application treatments
B Year 1
Year 2
a b c b a b c c
0
20
40
60
80
100
Control CMC 2.0 (4) CMP+2.0 (4)
mg·g
-1
Cultural management and laccase treatments
C Year 1
Year 2
b a a
0
20
40
60
80
100
SA (2) CHU (2) CHI (2)m
g·g
-1
Sources of laccase enzyme treatments
D Year 1

119
Fig. 5.3 Extractive-free acid-insoluble lignin content (LI) after treatment application on creeping bentgrass with: five different levels
of laccase (Fig 5.3A); laccase activity level 2.0 units cm-2
applied at four frequencies (Fig 5.3B); laccase at 2.0 units cm-2
applied at a
frequency of 4 weeks in comparison with cultural management practice (Fig 5.3C); and laccase enzyme from different sources (Fig
5.3D). Values are means of four replicates. Same letter on top of the bars (year one = standard, year two = bolded) are not considered
to be statistically different according to Fisher’s protected LSD at α = 0.05.
b c d e a
a b c d ab
0
50
100
150
200
250
300
350
Control 0.5 (2) 1.0 (2) 2.0 (2) 4.0 (2)
mg·g
-1
Rate of laccase treatments
A Year 1
Year 2
b d c b a
a c b
a a
0
50
100
150
200
250
300
350
Control 2.0 (2) 2.0 (4) 2.0 (8) 2.0 (12)
mg·g
-1
Frequency of laccase application treatments
B Year 1
Year 2
c b d
a c b
d
a
0
50
100
150
200
250
300
350
400
Control CMC 2.0 (4) CMP+2.0 (4)
mg·g
-1
Cultural management and laccase treatments
C Year 1
Year 2
b b a
0
50
100
150
200
250
300
SA (2) CHU (2) CHI (2)m
g·g
-1
Sources of laccase enzyme treatments
D Year 1

120
Fig. 5.4 Extractive-free total lignin content (LI) after treatment application on creeping bentgrass with: five different levels of laccase
(Fig 5.4A); laccase activity level 2.0 units cm-2
applied at four frequencies (Fig 5.4B); laccase at 2.0 units cm-2
applied at a frequency
of 4 weeks in comparison with cultural management practice (Fig 5.4C); and laccase enzyme from different sources (Fig 5.4D).
Values are means of four replicates. Same letter on top of the bars (year one = standard, year two = bolded) are not considered to be
statistically different according to Fisher’s protected LSD at α = 0.05.
a b c d a
a b c d b
0
100
200
300
400
500
Control 0.5 (2) 1.0 (2) 2.0 (2) 4.0 (2)
mg·g
-1
Rate of laccase treatments
A Year 1Year 2
a c b a a
a c b a a
0
100
200
300
400
500
Control 2.0 (2) 2.0 (4) 2.0 (8) 2.0 (12)
mg·g
-1
Frequency of laccase application treatments
B Year 1Year 2
b a c a
b b c
a
0
100
200
300
400
500
Control CMC 2.0 (4) CMP+2.0 (4)
mg·g
-1
Cultural management and laccase treatments
C Year 1Year 2
b b a
0
100
200
300
400
SA (2) CHU (2) CHI (2)
mg·g
-1
Sources of laccase enzyme treatments
D Year 1

121
Fig. 5.5 Extractive-free total sugar content (ST) after treatment application on creeping bentgrass with: five different levels of laccase
(Fig 5.5A); laccase activity level 2.0 units cm-2
applied at four frequencies (Fig 5.5B); laccase at 2.0 units cm-2
applied at a frequency
of 4 weeks in comparison with cultural management practice (Fig 5.5C); and laccase enzyme from different sources (Fig 5.5D).
Values are means of four replicates. Same letter on top of the bars (year one = standard, year two = bolded) are not considered to be
statistically different according to Fisher’s protected LSD at α = 0.05.
a ab bc abc c a
b b b b
0
100
200
300
400
500
600
Control 0.5 (2) 1.0 (2) 2.0 (2) 4.0 (2)
mg·g
-1
Rate of laccase treatments
A Year 1
Year 2 a bc ab
c c a
b b
b b
0
100
200
300
400
500
600
Control 2.0 (2) 2.0 (4) 2.0 (8) 2.0 (12)
mg·g
-1
Frequency of laccase application treatments
B Year 1
Year 2
a bc ab
c a ab
b b
0
100
200
300
400
500
600
Control CMC 2.0 (4) CMP+2.0 (4)
mg·g
-1
Cultural management and laccase treatments
C Year 1
Year 2a
a a
0
100
200
300
400
500
600
SA (2) CHU (2) CHI (2)m
g·g
-1
Sources of laccase enzyme treatments
D Year 1

122
Fig. 5.6 Extractive-free glucose content (SGLU) after treatment application on creeping bentgrass with: five different levels of laccase
(Fig 5.6A); laccase activity level 2.0 units cm-2
applied at four frequencies (Fig 5.6B); laccase at 2.0 units cm-2
applied at a frequency
of 4 weeks in comparison with cultural management practice (Fig 5.6C); and laccase enzyme from different sources (Fig 5.6D).
Values are means of four replicates. Same letter on top of the bars (year one = standard, year two = bolded) are not considered to be
statistically different according to Fisher’s protected LSD at α = 0.05.
a ab bc a
c a
b b
b ab
0
50
100
150
200
250
300
Control 0.5 (2) 1.0 (2) 2.0 (2) 4.0 (2)
mg·g
-1
Rate of laccase treatments
A Year 1
Year 2
a a a a a a
b b
b b
0
50
100
150
200
250
300
Control 2.0 (2) 2.0 (4) 2.0 (8) 2.0 (12)
mg·g
-1
Frequency of laccase application treatments
B Year 1
Year 2
a ab ab b
a
ab b b
0
50
100
150
200
250
300
Control CMC 2.0 (4) CMP+2.0 (4)
mg·g
-1
Cultural management and laccase treatments
C Year 1
Year 2
a a a
0
50
100
150
200
250
300
SA (2) CHU (2) CHI (2)
mg·g
-1
Sources of laccase enzyme treatments
D Year 1

123
Fig. 5.7 Extractive-free xylose content (SXYL) after treatment application on creeping bentgrass with: five different levels of laccase
(Fig 5.7A); laccase activity level 2.0 units cm-2
applied at four frequencies (Fig 5.7B); laccase at 2.0 units cm-2
applied at a frequency
of 4 weeks in comparison with cultural management practice (Fig 5.7C); and laccase enzyme from different sources (Fig 5.7D).
Values are means of four replicates. Same letter on top of the bars (year one = standard, year two = bolded) are not considered to be
statistically different according to Fisher’s protected LSD at α = 0.05.
a ab b b b a b b b b
0
50
100
150
200
Control 0.5 (2) 1.0 (2) 2.0 (2) 4.0 (2)
mg·g
-1
Rate of laccase treatments
A Year 1
Year 2
a bc
a c b a
b b
b b
0
50
100
150
200
Control 2.0 (2) 2.0 (4) 2.0 (8) 2.0 (12)
mg·g
-1
Frequency of laccase application treatments
B Year 1
Year 2
a b a
c a ab
b b
0
50
100
150
200
Control CMC 2.0 (4) CMP+2.0 (4)
mg·g
-1
Cultural management and laccase treatments
C Year 1
Year 2
b ab a
0
50
100
150
200
SA (2) CHU (2) CHI (2)m
g·g
-1
Sources of laccase enzyme treatments
D Year 1

124
Fig. 5.8 Extractive-free galactose content (SGAL) after treatment application on creeping bentgrass with: five different levels of laccase
(Fig 5.8A); laccase activity level 2.0 units cm-2
applied at four frequencies (Fig 5.8B); laccase at 2.0 units cm-2
applied at a frequency
of 4 weeks in comparison with cultural management practice (Fig 5.8C); and laccase enzyme from different sources (Fig 5.8D).
Values are means of four replicates. Same letter on top of the bars (year one = standard, year two = bolded) are not considered to be
statistically different according to Fisher’s protected LSD at α = 0.05.
a bc b bc c
a a a a a
0
20
40
60
80
Control 0.5 (2) 1.0 (2) 2.0 (2) 4.0 (2)
mg·g
-1
Rate of laccase treatments
A Year 1
Year 2 a bc
ab c
b a b
b ab ab
0
20
40
60
80
Control 2.0 (2) 2.0 (4) 2.0 (8) 2.0 (12)
mg·g
-1
Frequency of laccase application treatments
B Year 1
Year 2
a
b a
b a
b b
b
0
20
40
60
80
Control CMC 2.0 (4) CMP+2.0 (4)
mg·g
-1
Cultural management and laccase treatments
C Year 1
Year 2a a
a
0
20
40
60
80
SA (2) CHU (2) CHI (2)
mg·g
-1
Sources of laccase enzyme treatments
D Year 1

125
Fig. 5.9 Organic matter content in the 0-2.5 cm surface layer (OMU) after treatment application
on creeping bentgrass with laccase at 2.0 units cm-2
applied at a frequency of 4 weeks in
comparison with cultural management practice. Values are means of four replicates. Same letter
on top of the bars (year one = standard, year two = bolded) are not considered to be statistically
different according to Fisher’s protected LSD at α = 0.05.
Fig. 5.10 Saturated hydraulic conductivity (SHC) after treatment application on creeping
bentgrass with laccase at 2.0 units cm-2
applied at a frequency of 4 weeks in comparison with
cultural management practice. Values are means of four replicates. Same letter on top of the bars
(year one = standard, year two = bolded) are not considered to be statistically different according
to Fisher’s protected LSD at α = 0.05.
ab
b
a ab
a
b ab
b
0
50
100
150
200
250
Control CMP 2.0 (4) CMP+2.0 (4)
mg·g
-1
Cultural management and laccase treatments
Year 1
Year 2
b
a
b
ab
c
a
bc
b
02468
1012141618
Control CMP 2.0 (4) CMP+2.0 (4)
cm h
-1
Cultural management and laccase treatments
Year 1
Year 2

126
CHAPTER VI
EFFICACY OF FUNGAL LACCASE TO FACILITATE BIODETHATCHING IN
BERMUDAGRASS AND ZOYSIAGRASS4
4 Sidhu, S.S., Q. Huang, R.N. Carrow, and P.L. Raymer. To be submitted to Agronomy Journal.

127
ABSTRACT
Accumulation of excessive organic matter in the form of a thatch and/or mat layer can
cause several problems in turfgrass management systems. A previous greenhouse study on
creeping bentgrass (Agrostis stolonifera L.) demonstrated that direct application of laccase
solution every two weeks reduced the rate of accumulation of organic matter and hence buildup
of thatch layer. A two year field study was conducted on an ultra-dwarf bermudagrass (Cynodon
dactylon L., ‘TifEagle’) green, and zoysiagrass (Zoysia japonica Stued., ‘Meyer’) maintained as
a home lawn to observe the influence of laccase enzyme applications on thatch development.
Laccase solution was applied bi-weekly at the activity levels of 0 (control) and 2.0 units cm-2
.
Response to laccase enzyme applications by both the turfgrass species was recorded by
measuring thatch layer physical and chemical properties after six months of treatment
applications within each year. A significant 18-22% and 21-30% reduction in thatch layer
thickness was observed for bermudagrass and zoysiagrass, respectively. Organic matter content
(0-2.5 cm) decreased by 23-24% while saturated hydraulic conductivity increased by 19-30% for
bermudagrass in both years. Acid-soluble and-insoluble lignin reduced in both the grass species
after laccase treatments. The results indicate that bi-weekly application of laccase on
bermudagrass and zoysiagrass has positive impact on thatch management.
INTRODUCTION
Accumulation of organic matter in the form of dead and live tissue between soil and
turfgrass is known as thatch layer. Thatch layer consists of stolons, rhizomes, roots, crown tissue,
leaf sheaths, and blades (Engel, 1954; Roberts and Bredakis, 1960) and is one of the major
problems in management of recreational turfgrass sites, especially golf greens. Mat is defined as
a thatch layer with sand or soil integrated into the layer. A thin layer of thatch is desirable as it

128
provides protection from temperature extremes and provides wear tolerance (Beard, 1973).
However, excessive thatch layer is undesirable in turfgrass as it leads to decreased saturated
hydraulic conductivity, decreased movement of oxygen through the thatch or mat zone, and low
oxygen levels within the thatch/mat layer during wet periods, and increased water retention
(Carrow, 2003; Hartwiger, 2004; McCarty et al., 2007).
The most effective mechanical techniques to manage thatch consist of core aeration,
vertical mowing, sand topdressing, and grooming. However, these techniques have shown
contrasting effects on changes in organic matter decomposition (Barton et al., 2009; Carrow et
al., 1987; Dunn et al., 1981; McCarty et al., 2005; McWhirter and Ward, 1976; Weston and
Dunn, 1985; White and Dickens, 1984). These practices may adversely impact turf quality,
playability and be costly (Barton et al., 2009; Landreth et al., 2008; McCarty et al., 2007). Non-
destructive techniques are highly desirable for uninterrupted availability of the turfgrass areas for
play.
The formation of thatch-mat layer on recreational turfgrass sites, especially golf greens, is
accelerated when accumulation of organic matter exceeds the degradation rate. Accumulation of
organic matter in the thatch layer is known to be strongly influenced by lignin, a plant cell wall
constituent, which is very resistant to microbial degradation and serves as the rate limiting step
for organic matter decomposition (Taylor et al., 1989). Lignin acts as a protective matrix
restricting the availability of cellulosic and hemicellulosic sugars to microbial degraders thus
leading to the accumulation of organic matter (Ledeboer and Skogley, 1967). The recalcitrant
nature of lignin may be attributed to its heterogeneous structure as it is composed of random
oxidative couplings of lignin monomers and cross-linking of polymers (Ledeboer and Skogley,

129
1967). After decades of research, the lignin macromolecule structure is known to exhibit no
particular sequence of monomeric units (Chen and Sarkanen, 2003; Davin and Lewis, 2003).
In nature, the most rapid natural degradation of lignin is carried out by extracellular
enzymes produced by certain white-rot fungi exposing cellulosic sugars to bacterial degradation
(Blanchette, 1984; Kirk et al., 1975; 1976; Mester et al., 2004; Otjen and Blanchette., 1987). It is
very difficult to maintain viable, specific microbial populations in turf management systems.
However, the direct application of laccase enzyme, an extracellular enzyme produced by white-
rot fungi, to turfgrass could be used to remove lignin bonds, hence opening up of the structure of
thatch biomass for microbes to decompose cellulosic and hemicellulosic sugars. This approach
could be an effective means of controlling thatch. In Chapter III, we demonstrated that bi-weekly
applications of laccase enzyme solution (2.0 units cm-2
activity) reduced the rate of thatch
buildup and organic matter accumulation in a greenhouse study on creeping bentgrass. In another
greenhouse study, a bi-weekly application of laccase solution (2.0 units cm-2
activity) on thatch
layer of a dead creeping bentgrass for six months verified the effectiveness laccase in facilitating
the organic matter decomposition, loss in total structural sugar content of thatch biomass
(Chapter IV). This suggested that laccase application exposed cellulosic and hemicellulosic
sugars for microbial degradation by opening up the biomass structure (Chapter IV). Previous
studies were conducted on creeping bentgrass; therefore, this study was designed to observe the
effectiveness of laccase enzyme on organic matter decomposition of an ultra-dwarf
bermudagrass green and zoysiagrass maintained under home lawn conditions. The objective of
this study is to determine the influence of laccase application on thatch layer physical and
chemical properties of bermudagrass and zoysiagrass under field conditions.

130
MATERIALS AND METHODS
Two year field studies were conducted on ultra-dwarf bermudagrass and zoysiagrass at
The University of Georgia, Griffin Campus as part of a two year experiment from June 2010 to
Jan 2012. Bermudagrass plots (60 cm x 30 cm) were established on a sand-based putting green
(90:10 sand and Dakota peat moss) based on USGA specifications. The bermudagrass green is
maintained under low fertility management and was fertilized three times each year during the
growing season at the rate of 50 kg ha-1
granular fertilizer 24-4-10 (Lesco., Strongsville, OH).
The bermudagrass green was mowed three times a week by Toro Greensmaster 3100 (The Toro
Company, Bloomington, MN) and maintained at a height of 0.42 cm. Zoysiagrass was
established on a sandy clay loam soil (Table 6.1) and was maintained under home lawn
conditions, mowed once a week at 4 cm height with clippings returned. Zoysiagrass was
fertilized as 50 kg ha-1
granular 24-4-10 (Lesco. Strongsville, OH) once each May, June, July
and August each year.
The field experiments on bermudagrass and zoysiagrass were a completely randomized
design with two levels of laccase activity (0 and 2.0 units cm-2
) replicated four times. During the
first year, laccase from white-rot fungi Trametes versicolor (Sigma-Aldrich product 53739) was
applied as 410 mL solution at 0 and 2.0 units cm-2
activity level every two weeks on
bermudagrass and zoysiagrass. During the second year laccase from Pycnoporus genus was used
at the same activity level due to the unavailability of the Sigma Aldrich product.
Laccase Activity Assay
Laccase activity was quantified by a colorimetric assay using a Beckman DU 640B
spectrophotometer (Beckman Instruments Inc., Fullerton, CA) spectrophotometer. One unit of
laccase activity is the amount of enzyme that causes an absorbance change at 468 nm at a rate of

131
1.0 unit min-1
in 3.4 mL of 1 mM 2, 6-dimethoxyphenol, a specific substrate for laccase, in
citrate-phosphate buffer at pH 3.8 (Park et al., 1999).
Measurements
Effectiveness of laccase application and its impact on physical and chemical properties of
thatch layer were determined after six months of treatment application each year. In year one, bi-
weekly treatment applications began in June 2010 and continued until Dec 2010. In year two, bi-
weekly treatment applications began in July 2011 and continued until Jan 2012. Parameters
measured included thatch layer thickness (TLT), organic matter content (OM) for a depth of 0-
2.5 cm (OMU), 2.5-5.0 cm (OML), and 0-5.0 cm (OM), saturated hydraulic conductivity (SHC),
extractive-free acid-soluble lignin (LS), and acid-insoluble lignin (LI). Total lignin (LT) was
obtained by addition of acid-soluble and-insoluble lignin contents.
Thatch Layer Thickness
Thatch layer thickness was measured from two subsamples of the soil profile from each
plot. Replaceable wedge-shaped turf profiles (8.9 cm wide and 2.5 cm thick) were pulled using
AMS Turf Profiler (AMS Inc., American Falls, ID). Thatch layer thickness was measured from
four points across the width of each profile and averaged. The clearly visible distinction between
thatch layer and the sand layer below was considered as the bottom of the thatch layer for all
measurement locations.
Organic Matter Content
Organic matter (OM) was measured by total ignition as described by Carrow et al.
(1987). Two soil cores (2.0 cm diam.) were obtained from each plot and divided into 0-2.5 cm
(OMU) and 2.5-5.0 cm (OML) depths. The cores were dried in an oven at 100 ± 5oC for 24 h and
weighed. Soil cores were ashed in a muffle furnace at 600 ± 10oC for 24 h and weighed again.

132
Total organic carbon content was determined as the difference in the two readings and percent
organic matter was calculated.
Saturated Hydraulic Conductivity
The saturated hydraulic conductivity (SHC) from each plot was measured by a constant
hydraulic head method using a Marriott tube apparatus and saturated hydraulic conductivity was
calculated using Darcy's equation. An intact core (diam. 4.7 cm and length 7.7 cm) was obtained
from each plot in a brass cylinder using an undisturbed soil core sampler (Model 0200 soil
sampler, Soilmoisture Equip. Corp., Santa Barbara, CA). The bottom of the core was covered
with a double layer of cheesecloth held in place with a rubber band and saturated overnight in a
0.05 N CaCl2 solution to minimize dispersion. A steady state flow through the samples was
established by flowing 0.05 N CaCl2 through the core for 10 min. After 10 min the volume of
water that passed through the core was measured for one minute and the measurement repeated
three times.
Extractive-free Lignin Content
Thatch biomass was collected from the top 2.5 cm of each core after measurement of
saturated hydraulic conductivity. Thatch samples were first air-dried, ground, washed with water
in a glass jar, on a rotary shaker at 200 rpm, and then passed through a series of sieves with a
841µm sieve at the top and a 177µm sieve at the bottom. The biomass retained by the 177 µm
sieve size was used for analysis. The thatch biomass was extracted for 24 h using the Soxhlet
method for water- and alcohol-soluble extractives using de-ionized water and 16.26 M (95
percent USP grade) ethyl alcohol, respectively. Lignin content determined from an extracted
biomass is known as extractive-free lignin content.

133
Extractive-free acid-soluble lignin (LS) and acid-insoluble lignin (LI) content in the thatch
layer biomass was determined on weight basis in a two-step acid-hydrolysis procedure (NREL,
2008). In the first step, extractive-free thatch samples were hydrolyzed for 60 min with 72%
H2SO4 at 30oC in a water bath. In the second step, H2SO4 was diluted to 4% and the samples
were autoclaved at 121oC for 1 h and then vacuum filtered. Acid-soluble lignin, which consists
of low molecular weight phenolic groups, was determined using this hydrolysis liquid at 240 nm
wavelength in a Beckman DU 640B spectrophotometer (Beckman Instruments Inc., Fullerton,
CA). The solids remaining after acid hydrolysis were dried in an oven at 100 ± 5oC for 24 h,
weighed, ashed in a muffle furnace at 600 ± 10oC for 24 h, and weighed again to calculate the
acid-insoluble lignin content using weight difference. Total lignin content (LT) of each sample
was calculated as the sum of LS and LI.
Statistical Analysis
Data from a completely randomized design with treatments consisting of two levels of
laccase were analyzed separately for each species by year using one was analysis of variance
(ANOVA) using general linear model (GLM) (SAS Institute, 1994). Fisher’s LSD test with α =
0.05 was used for determining statistical differences among treatment means following each
ANOVA.
RESULTS
Organic Matter Content
For bermudagrass, a significant treatment effect was observed for OMU (P ≤ 0.05) and
OM (P ≤ 0.05) during year one and for OMU (P ≤ 0.05) during the second year (Table 6.2). The
OMU, OML and OM contents at the start of the experiment were 97, 07, and 41 mg·g-1
,
respectively (baseline reading). Organic matter content (0-2.5 cm) after six months of treatment

134
was 122 and 93 mg·g-1
for control and plots treated with laccase, respectively (Fig 6.1). The
results indicate that in laccase treated bermudagrass plots OMU rate of accumulation was less
than the control and there was no net accumulation of organic matter in bermudagrass at the end
of 6 months. A reduction of 23 and 24% of OMU was observed in plots treated with laccase in
comparison to control plots in first and second year, respectively (Fig 6.1). No differences were
observed for OML after six months of laccase application between control and treated plots
(Table 6.3). Organic matter (0-5.0 cm) accumulation was observed in control plots after six
months. No accumulation was observed in plots treated with laccase enzyme. Organic matter in
plots treated with laccase was reduced by 19 and 24% in comparison to control plots after
treatment in year one and two, respectively (Table 6.3).
For zoysiagrass, a significant effect of laccase treatment was observed on OMU (P ≤
0.05) during first year of the experiment (Table 6.2). A reduction of 23% OMU in plots treated
with laccase were observed when compared to control plots in year one (Fig 6.1). However, no
significant effect was observed for OMU, OML, and OM during the second year (Table 6.3).
Thatch Layer Thickness
A significant effect of laccase application was observed for TLT (P ≤ 0.05) in the first
and second year of the experiment in bermudagrass (Table 6.2). Thatch layer thickness at the
start of the experiment was 16.6 mm (baseline reading). The reduction in TLT in plots treated
with laccase was 18 and 22% in comparison to control plots during year one and two,
respectively (Fig 6.2). A slight accumulation in TLT was observed in control plots above the
starting value of 16.6 mm at the end of first year treatment application. However, application of
laccase proved effective in reducing TLT after six months of application.

135
In zoysiagrass, laccase application was effective (P ≤ 0.001) in reducing TLT in both
years relative to the control (Table 6.2). TLT at the start of the experiment was 18.5 mm
(baseline reading) with a slight accumulation of that layer noticed in the control plots by the end
of year one and two (Fig 6.2). However, laccase application proved to be effective in reducing
thatch layer thickness with a reduction of 30 and 21% in TLT observed in plots treated with
laccase when compared to control plots in first and second year, respectively (Fig 6.2).
Saturated Hydraulic Conductivity
A significant laccase application effect (P ≤ 0.05) was observed in bermudagrass with
respect to SHC (Table 6.2). An increase of 30 and 19% was observed for SHC in plots treated
with laccase over the control plots during the first and second year, respectively (Fig 6.3). In
zoysiagrass, a significant effect of laccase on SHC was observed in the second year (P ≤ 0.01)
(Table 6.2). After six months of treatment in the second year, SHC increased from 2.1 to 12.5 cm
h-1
(Fig 6.3).
Extracted-free Lignin Content
Application of laccase significantly affected LS, LI, and LT in bermudagrass in both years
(Table 6.2). A slight but significant reduction of 5-10 mg·g-1
in LS was observed in plots treated
with laccase in comparison to control plots in both years (Table 6.3). Content of LI and LT
content were reduced for plots treated with laccase in the range of 45-48 and 54-57 mg·g-1
over
control plots in year one and two (Table 6.3, Fig 6.4).
In zoysiagrass, laccase application had a significant effect on LS (P ≤ 0.001), LI (P ≤
0.001), and LT (P ≤ 0.001) in both year one and two (Table 6.2). Acid-soluble lignin and LI
content decreased from 0.4-0.7 and 38-49 mg·g-1
during first and second year, respectively

136
(Table 6.3). A significant 44-60 mg·g-1
reduction in LT was observed in plots treated with laccase
when compared to control plots (Fig 6.4).
DISCUSSION
In our previous study, we tested the effects of direct application of laccase on creeping
bentgrass under greenhouse conditions that were conducive for thatch development. In this
study, application of laccase at activity levels of 2.06 units cm-2
every two weeks was shown to
be effective in reducing the rate of accumulation of thatch-mat, OM, and significantly increased
SHC over the controls (Chapter III). Although laccase treatment reduced the rate of
accumulation and thatch layer buildup, an overall net accumulation of organic matter and thatch
buildup was observed after nine months even in the most effective laccase treatments (Chapter
III).
In our present study on bermudagrass and zoysiagrass under field conditions, we saw an
actual reduction in organic matter and thatch layer in plots treated with laccase at 2.0 units cm-2
activity after six months when compared to initial levels pre-treatment levels (Fig 6.1, 6.2).
However, the control plots of both grass species showed a slight accumulation of organic matter
and thatch layer. This result indicates that bi-weekly laccase treatment applications for six
months were effective in reducing OM content and thatch layer thickness in bermudagrass and
zoysiagrass. A significant increase was observed in SHC in plots treated with laccase application
(Fig 6.3). This may be attributed to the reduction in thatch layer thickness and organic matter
content. The presence of higher levels of organic matter in the thatch layer is known to decrease
water infiltration through the thatch layer (McCarty et al., 2005).
A reduction in LS, LI, and LT was observed in both years for both grasses in plots treated
with laccase (Table 6.3, Fig 6.4). This may be attributed to the oxidation and eventually

137
degradation of lignin macromolecule. Laccases are produced as extracellular enzymes by white-
rot fungi and facilitate the oxidation of wide range of mono- and diphenols using oxygen as the
electron acceptor (Baldrian, 2006). Lignin phenolic compounds are oxidized by laccase via Cα-
Cβ cleavage, alkyl-aryl cleavage, and Cα oxidation (Wong, 2009). Laccase enzyme acts on
bonds formed between lignin macromolecule and between lignin and structural sugars leading to
opening up of the biomass structure leading to increased availability of easily degradable sugars
by microbes. The laccase enzyme we used is stable over a wide range of pH and temperature
(Baldrian, 2006; Munoz et al., 1997; Stoilova et al., 2010; Thurston, 1994). In these studies,
laccase enzyme effectively managed thatch over a range of environmental conditions for the
period of the studies apparently by allowing better microbial decomposition of organic matter.
This suggests that laccase enzyme treatment may be a valuable non-disruptive means to control
thatch in these species.
CONCLUSIONS
This field research was the first study to demonstrate the efficacy of laccase application
on ultra-dwarf bermudagrass green and zoysiagrass grown under home lawn conditions. The
results from the study revealed the positive impacts of laccase on physical and chemical
properties of thatch layer of these two grass species with no net accumulation of thatch or
organic matter along with an increase in saturated hydraulic conductivity.
LITERATURE CITED
Baldrian, P. 2006. Fungal laccases-occurrence and properties. FEMS Microbiol Rev. 30: 215-
242.
Barton, L., G.G.Y. Wan, R.P. Buck, and T.D. Colmer. 2009. Effectiveness of cultural thatch-mat
controls for young and mature kikuyu turfgrass. Agron. J. 101: 67-74.

138
Beard, J.B. 1973. Turfgrass: Science and culture. Prentice Hall Inc., Englewood Cliffs, NJ.
Blanchette, R.A. 1984. Screening wood decayed by white rot fungi for preferential lignin
degradation. Appl. Environ. Microbiol. 48: 647-653.
Carrow, R.N. 2003. Surface organic matter in bentgrass greens. USGA Turfgrass Environ. Res.
Online 2(17): 1-10.
Carrow, R.N., B.J. Johnson, and R.E. Burns. 1987. Thatch and quality of Tifway bermudagrass
turf in relation to fertility and cultivation. Agron. J. 79: 524-530.
Chen, Y.R., and S. Sarkanen. 2003. Macromolecular lignin replication: A mechanistic working
hypothesis. Phytochemistry Rev. 2: 235-255.
Davin, L.B. and N.G. Lewis 2003. A historical perspective on lignin biosynthesis: Monolignol,
allylphenol and hydroxycinnamic acid coupling and downstream metabolism.
Phytochemistry Rev. 2: 257-288.
Dunn, J.H., K.M. Sheffer, and P.M. Halisky. 1981. Thatch and quality of Meyer zoysia in
relation to management. Agron. J. 73: 949-952.
Engel, R.E. 1954. Thatch on turf and its control. Golf Course Rep. 22 (5): 12-14.
Hartwiger, C. 2004. The importance of organic matter dynamics: How research uncovered the
primary cause of secondary problems. USGA Green Section Record 42(3): 9-11.
Kirk, T.K., W.J. Connors, R.D. Bleam, and G. Jeikus. 1976. Requirements for a growth substrate
during lignin decomposition by two wood-rotting fungi. Appl. Environ. Microbiol. 32:
192-194.
Kirk, T.K., W.J. Connors, R.D. Bleam, W.F. Hackett, and J.G. Jeikus. 1975. Preparation and
microbial decomposition of synthetic [14
C] lignins. PNAS. 72: 2515-2519.
Landreth, J., D. Karcher, and M. Richardson. 2008. Cultivating to manage organic matter in sand

139
based putting greens: University of Arkansas researchers provide important insight for
managing organic buildup on putting greens. USGA Turfgrass Environ. Res. Online
46(1): 16-19.
Ledeboer, F.B., and C.R. Skogley. 1967. Investigations into the nature of thatch and methods for
its decomposition. Agron. J. 59: 320-323.
McCarty, L. B., M.F. Gregg, and J.E. Toler. 2007. Thatch and mat management in an established
creeping bentgrass green. Agron. J. 99: 1530-1537.
McCarty, L.B., M.F. Gregg, J.E. Toler, J.J. Camberato, and H.S. Hill. 2005. Minimizing thatch
and mat development in a newly seeded creeping bentgrass golf green. Crop Sci. 45:
1529-1535.
McWhirter, E.L., and C.Y. Ward. 1976. Effect of vertical mowing and aerification on golf green
quality. Mississippi Agric. For. Exp. Stn. Res. Rep. 2 (12): 1-2.
Mester, T., E. Varela, and M. Tien. 2004. Wood degradation by brown-rot and white-rot fungi.
The Mycota II: Genetics and biotechnology. 2nd
edition. Springer-Verlag, Berlin,
Heidelberg.
Munoz, C., F. Guillen, A.T. Martinez, and M.J. Martinez. 1997. Laccase isozymes of Pleurotus
eryngii: Characterization, catalytic properties, and participation in activation of molecular
oxygen and Mn2+
oxidation. App. Environ. Microbiol. 63: 2166-2174.
NREL- National Renewable Energy Laboratory. 2008. Determination of structural carbohydrates
and lignin in biomass. Available at: http://www.nrel.gov/biomass/pdfs/42618.pdf
(Verified 01 July, 2012). NREL, Golden, CO, USA.
Otjen, L., and R. Blanchette. 1987. Assessment of 30 white rot basidiomycetes for selective
lignin degradation. Holzforschung. 41: 343-349.

140
Park, J. W., J. Dec, J. E. Kim, and J. M. Bollag. 1999. Effect of humic constituents on the
transformation of chlorinated phenols and anilines in the presence of oxidoreductive
enzymes or birnessite. Environ. Sci. Tech. 33: 2028-2034.
Roberts, E.C., and E.J. Bredakis. 1960. What, why and how of turfgrass root development. Golf
Course Rep. 28: 13-24.
SAS Institute Inc. 1994. The SAS system for windows. Release 9.2. SAS Inst., Cary, NC.
Stoilova, I., A. Krastanov, and V. Stanchev. 2010. Properties of crude laccase from Trametes
versicolor produced by solid-substrate fermentation. Adv. Bioscience Biotech. 1: 208-
215.
Taylor B.R., D. Parkinson, W.F.J. Parsons. 1989. Nitrogen and lignin content as predictors of
litter decay rates: A microcosm test. Ecology. 70: 97-104.
Thurston, C.F. 1994. The structure and function of fungal laccases. Microbiol. 140: 19-16.
Weston, J.B., and J.H. Dunn. 1985. Thatch and quality of Meyer zoysia in response to
mechanical cultivation and nitrogen fertilization. P. 449-458. In F. Lemaire (ed.) Proc. 5th
Int. Turfgrass Res. Conf., Avignon, France. 1-5 July 1985. Institut National de la
Recherche Agronomique, Paris, France.
White, R.H., and R. Dickens. 1984. Thatch accumulation in bermudagrass as influenced by
cultural practices. Agron. J. 76: 19-22.
Wong, D.W.S. 2009. Structure and action mechanism of ligninolytic enzymes. Appl. Biochem
Biotechnol. 157: 174-209.

141
Table 6.1 Characteristics of soils used in zoysiagrass study.
pH Ca K Mg Mn P Zn Sand Silt Clay Soil Type
-----------------------Mehlich 1 mg·g-1
(ppm)------------------------- --------------%-------------
6.1 1249 147 196.3 65.38 22.16 7.16 55.70 20.0 24.30 Sandy Clay Loam
Table 6.2 Analysis of variance (ANOVA) table showing the effects of laccase treatments, treatment duration, and duration and
treatment interactions on ultra-dwarf bermudagrass and zoysiagrass.
* Significant at the 0.05 probability level
**Significant at the 0.01 probability level
*** Significant at the 0.001 probability level
Source of variation
df
Organic
matter OMU
(0-2.5 cm)
Organic
matter OML
(2.5-5.0 cm)
Organic
matter OM
(0-5.0 cm)
Thatch layer
thickness
TLT
Saturated
hydraulic
conductivity
SHC
Acid-
soluble
lignin LS
Acid-
insoluble
lignin LI
Total
lignin
LT
--------------------------------------------mean square value--------------------------------------------------------
Bermudagrass
Year 1
Treatment 1 1728* 30 170* 18* 2169* 166** 3987*** 5782***
Error 6 218 8 20 2 303 5 31 31
Year 2
Treatment 1 2062* 336 372 32* 1445* 202*** 4532*** 6649***
Error 6 232 101 104 1 157 8 41 34
Zoysiagrass
Year 1
Treatment 1 1382*** 216 54 63*** 908 19*** 3351*** 3892***
Error 6 26 69 9 4 411 0.01 8 10
Year 2
Treatment 1 384 3 42 31*** 216** 107*** 4841*** 6391***
Error 6 53 17 26 0.4 14.5 1 68 67

142
Table 6.3 Organic matter content (OML, 2.5-5.0 cm; OM, 0-5.0 cm), acid-soluble lignin (LS), and acid-insoluble lignin (LI) content
after first and second year of laccase treatments on ultra-dwarf bermudagrass and zoysiagrass.
Organic matter
(2.5-5.0 cm) OML
Organic matter
(0-5.0 cm) OM
Acid-soluble lignin
LS
Acid-insoluble lignin
LI
Year 1 Year 2 Year 1 Year 2 Year 1 Year 2 Year 1 Year 2
---------------------------------------------------------mg·g-1
-------------------------------------------------------------
Bermudagrass
Control 9.9a† 22.2a 47.5a 58.1a 41.5a 49.5a 317.5a 412.1a
2.0 (2) 6.1a 9.2a 38.2b 44.5a 3.67b 39.5b 272.8b 364.5b
Zoysiagrass
Control 66.9a 68.0a 87.2a 94.0a 23.7a 29.6a 385.7a 430.4a
2.0 (2) 77.3a 66.6a 82.1a 89.4a 20.6b 22.3b 344.7b 381.2b
† Means within a column for grass species followed by the same letter are not significantly different according to LSD at α=0.05.

143
Fig. 6.1 Organic matter content (0-2.5 cm, OMU) after bi-weekly application of laccase on
bermudagrass and zoysiagrass with two levels 0 (control) and 2.0 units cm-2
. Values are means
of four replicates. Means represented by bars with same letter on top (year one = standard, year
two = bolded) are not considered to be statistically different according to Fisher’s LSD at α =
0.05. The horizontal line represents the baseline reading at the start of experiment.
Fig. 6.2 Thatch layer thickness (TLT) after bi-weekly application of laccase on bermudagrass
and zoysiagrass with two levels 0 (control) and 2.0 units cm-2
. Values are means of four
replicates. Means represented by bars with same letter on top (year one = standard, year two =
bolded) are not considered to be statistically different according to Fisher’s LSD at α = 0.05. The
horizontal line represents the baseline reading at the start of experiment.
a a
a
a
b b
b
a
0
20
40
60
80
100
120
140
160
Year 1 Year 2 Year 1 Year 2
Bermudagrass Zoysiagrass
mg·g
-1
Control
2.0
Baseline Baseline
a a a a
b b b
b
0
5
10
15
20
25
Year 1 Year 2 Year 1 Year 2
Bermudagrass Zoysiagrass
mm
Control
2.0
Baseline Baseline

144
Fig. 6.3 Saturated hydraulic conductivity (SHC) after bi-weekly application of laccase on
bermudagrass and zoysiagrass with two levels 0 (control) and 2.0 units cm-2
. Values are means
of four replicates. Means represented by bars with same letter on top (year one = standard, year
two = bolded) are not considered to be statistically different according to Fisher’s LSD at α =
0.05.
Fig. 6.4 Total lignin content (LT) after bi-weekly application of laccase on bermudagrass and
zoysiagrass with two levels 0 (control) and 2.0 units cm-2
. Values are means of four replicates.
Means represented by bars with same letter on top (year one = standard, year two = bolded) are
not considered to be statistically different according to Fisher’s LSD at α = 0.05.
b
b
a b
a
a
a
a
0
20
40
60
80
100
120
140
160
180
Year 1 Year 2 Year 1 Year 2
Bermudagrass Zoysiagrass
cm h
-1
Control
2.0
a
a a
a
b
b b
b
0
100
200
300
400
500
Year 1 Year 2 Year 1 Year 2
Bermudagrass Zoysiagrass
mg·g
-1
Control
2.0

145
CHAPTER VII
RESIDUAL EFFECT OF LACCASE APPLICATION ON THATCH LAYER
CHARACTERISTICS OF CREEPING BENTGRASS5
5 Sidhu, S.S., Q.Huang, R.N. Carrow, and P.L. Raymer. To be submitted to Crop Science.

146
ABSTRACT
Organic layer formation in the form of thatch is one of the major problems in turf
management systems. Bi-weekly application of laccase enzyme has been well documented to
facilitate the degradation of thatch layer and reduce the rate of accumulation of organic matter in
“Crenshaw” creeping bentgrass (Agrostis stolonifera L.). A field experiment on creeping
bentgrass was conducted to observe the residual effect after ceasing laccase application. The
experiment consisted of twelve treatments partitioned into sub studies to investigate: different
activity levels (rates); frequency; sources of laccase; and its application with cultural
management practice i.e. core aeration and sand topdressing. Laccase treatments were applied
for six months and response to residual laccase effect was recorded by sampling at six, twelve,
and eighteen months after treatment initiation. One of the twelve treatments was applied for six
months in year one and for six months in year two to compare the residual effect of laccase with
two year laccase application. Parameters investigated were thatch layer thickness, total organic
matter (0-2.5 cm, 2.5-5.0 cm, and 0-5.0 cm depth), saturated hydraulic conductivity, and acid-
soluble and-insoluble lignin. A significant reduction in thatch layer thickness was observed with
laccase at different rates and frequencies at six, twelve, and eighteen months after treatment
initiation. Residual effect of laccase was observed in thatch layer depth with no accumulation in
after six months of treatment cessation. A significant increase in thatch layer was observed at
eighteen months after treatment initiation in plots where application ceased after six months and
no accumulation was observed in plots treated with laccase for six months once a year.
INTRODUCTION
Lignin is a plant cell wall constituent that acts as a protective matrix and limits
accessibility of microbial degraders to more biodegradable plant materials, such as cellulose and

147
hemicelluloses leading to the accumulation of organic matter in turfgrass ecosystems (Ledeboer
and Skogley, 1967). Lignin is formed in plants by oxidative coupling of mono-lignols of three
primary hydroxycinnamyl alcohols: p-coumaryl, coniferyl, and sinapyl alcohols (Wong, 2009).
Lignin is extremely recalcitrant to degradation due to its complex structure without a regular
pattern, which is derived from random oxidative coupling of lignin monomers and cross-linking
of polymers via radical mechanisms, a process known as lignification (Ledeboer and Skogley,
1967). A lignin macromolecule contains monolignols randomly bonded by C-O-C and C-C
linkages including β-O-4, β-5, β-β, 5-5, 4-O-5, and β-1 bonds (Alder, 1977; Del Rio et al., 2007;
Ralph et al., 2004). Several models of lignin molecular structure have been proposed but these
models do not imply any particular sequence of monomeric units in the lignin macromolecule
(Chen and Sarkanen, 2003; Davin and Lewis, 2003).
Formation of thatch-mat layer in home lawn and recreational turfgrass sites, especially
golf greens, is accelerated when accumulation of organic matter exceeds the degradation rate.
Thatch, a layer of high organic matter content that accumulates between the soil and green
turfgrass, consists of dead and living stolon, rhizome, root, crown, leaf sheath, and blade tissues
(Engel, 1954; Roberts and Bredakis, 1960). A mat layer is developed by addition of soil and sand
in thatch as a result of earthworm activity or cultural practices like core aeration and topdressing
(McCarty, 2005). A thin layer of thatch is desirable as it helps to increase resilience and wear
tolerance of the turfgrass surface, reduce surface hardness and moderate soil temperature
extremes (Beard, 1973). However, excessive thatch or mat layer is undesirable in turfgrass as it
leads to decreased saturated hydraulic conductivity, decreased movement of oxygen through the
thatch or mat zone, and low oxygen levels within the thatch/mat layer during wet periods, and
increased water retention (Carrow, 2003; Hartwiger, 2004; McCarty et al., 2007).

148
Cultural or mechanical control practices like core aeration, vertical mowing, grooming,
and topdressing have been the most effective, but are known to adversely impact turf quality and
have intensive requirement for labor, equipment and energy (Barton et al., 2009; Landreth et al.,
2008; McCarty et al., 2007) as well as have shown contrasting results in reducing organic matter
content in thatch layer (Barton et al., 2009; Carrow et al., 1987; Dunn et al., 1981; McCarty et
al., 2005; McWhirter and Ward, 1976; Weston and Dunn, 1985; White and Dickens, 1984). Non-
destructive biological and chemical attempts to enhance organic matter degradation in thatch
layer have included usage of glucose, cellulase solutions (Ledeboer and Skogley, 1967), and
commercial products containing mixture of amino acids, microbial inocula, and fertilizers. But,
these have been inconsistent (McCarty et al., 2005; Murdoch and Barr, 1976) as they targeted the
degradation of cellulosic and hemicellulosic sugars in thatch biomass by improving conditions
for microbial populations.
The rate of microbial decomposition however is dependent on the lignin content of
organic matter and lignin degradation acts as the rate limiting step in organic matter
decomposition (Taylor et al., 1989). Sinsabaugh et al., (1993) conducted a plant litter
decomposition study and reported a close relationship between lignocellulose-degrading
enzymes and plant litter mass loss. Certain white-rot fungi are responsible for natural
degradation of lignin by producing extra-cellular lignolytic enzymes and hence exposing
cellulosic materials for further bacterial degradation in the environment (Blanchette, 1984; Kirk
et al., 1975; Kirk et al., 1976; Mester et al., 2004; Otjen and Blanchette., 1987). Weight loss of
bermudagrass pellets, St. Augustinegrass (Stenotaphrum secundatum [Walt.] Kuntze) and
zoysiagrass (Zoysia japonica Stued., ‘Meyer’) stolons were observed when inoculated with
different wood-decaying fungi under controlled greenhouse and laboratory conditions (Martin

149
and Dale., 1980). In similar controlled studies, researchers have reported reduction in cellulose
content and total oxidizable organic matter of bermudagrass (Cynodon dactylon L.) and
centipedegrass (Eremochloa ophiuroides) when inoculated with wood-decaying fungi (Sartain
and Volk, 1984). However, field inoculation experiments on bermudagrass showed no thatch
degradation (Martin and Dale., 1980). Microbial inoculation under field conditions may be
ineffective as it is very difficult to maintain suitable microbial environment for longer time
periods under turfgrass management systems.
In greenhouse conditions favorable to growth of creeping bentgrass, decrease in the rate
of thatch layer build up and accumulation of total organic matter relative to the control was
reported in response to direct application of laccase enzyme, an extra-cellular lignolytic enzyme
produced from white-rot fungi Trametes versicolor (Chapter III). However, a net accumulation
of organic matter in thatch layer treated with laccase was observed over time in all treatments
(Chapter III). On the other hand, a bi-weekly application of laccase enzyme on thatch layer of a
dead creeping bentgrass for six months verified the effectiveness of laccase in facilitating
organic matter decomposition and the loss in total sugar content of thatch biomass which
suggested that laccase application exposed cellulosic and hemicellulosic sugars for microbial
degradation by opening up the biomass structure (Chapter IV). Field studies conducted on
creeping bentgrass, ultra-dwarf bermudagrass and zoysiagrass verified the effectiveness of
laccase in thatch management on different turfgrass species (Chapter V, VI). However, bi-
weekly application of laccase in comparison to core aeration followed by sand topdressing on
creeping bentgrass suggested laccase application is as effective in thatch management as cultural
practice (Chapter V). In our previous studies, organic matter degradation in response to enzyme
treatment was determined during and at the end of the application period. The current project

150
was designed to expand on the previous studies by investigating the residual effect of laccase
application on organic matter degradation. Knowledge of any residual effect would have
management and economic implications. The major objectives of this study are: 1) to determine
the residual effect of laccase application on thatch layer physical and chemical properties; 2) to
compare residual effect of laccase application with continued laccase application on organic
matter decomposition.
MATERIALS AND METHODS
A field experiment was conducted on “Crenshaw” creeping bentgrass (Agrostis
stolonifera L.) (Engelke et al., 1995) at The University of Georgia, Griffin Campus as an 18
month study from July 2010 to Jan 2012. The bentgrass green was established as a sand based
putting green on 90:10 sand and organic matter mix (Michigan Peat) as recommended by USGA.
Fertilizer application routine on the plot for 2010 and 2011 consisted of 50 kg ha-1
granular
fertilizer 24-4-10 (Lesco. Strongsville, OH) in the third week of March, September, and October
and 2 kg ha-1
soluble 20-20-20 fertilizer (JR Peters Inc, Allentown, PA) every two weeks starting
third week of April thru September. Bentgrass plots were mowed three times a week by Toro
Greensmaster 3100 (The Toro Company, Bloomington, MN) and maintained at a height of 0.42
cm.
The experiment was conducted on plots (30.5 cm x 61.0 cm) in a completely randomized
block design with twelve treatments replicated four times. Each block was divided into two
halves, one received only laccase treatments and other half was core-aerated (Ryan Greensaire
24 Aerator, Johnson Creek, WI; tine diam. 1.27 cm; tine depth 6.25 cm; tine spacing 5.0 x 5.0
cm) and sand topdressed (1134 g per plot, Quikrete Premium Play Sand) using Scotts Precision
Green Spreader twice a year. Laccase was applied for the initial 6 months from July 2010 to Dec

151
2010 in treatments T2 to T10 listed in Table 7.1. The plots were sampled at the end of treatment
application period and again at twelve and eighteen months after treatment initiation to observe
the residual effects of laccase application i.e. treatment ceased at six months so the residual
effect was after this period. The sample time represents the duration for laccase treatment and
residual time period. Laccase treatments were applied as 410 mL solution at different rates and
frequencies (Table 7.1). Laccase enzyme from Trametes versicolor, a white-rot fungus, was
purchased from Sigma-Aldrich (product 53739, Sigma Aldrich Inc., St. Louis, MO.) and was
applied at activity levels of 0 (control), 0.5, 1.0, 2.0 and 4.0 units cm-2
applied every two weeks
and laccase activity level 2.0 units cm-2
applied every 2, 4, 8, and 12 weeks to optimize the rate
and frequency of laccase application. Laccase was also applied at 2.0 units cm-2
every 4 weeks
on plots core-aerated and sand top-dressed twice a year to observe the effectiveness of laccase in
combination with the cultural management practice. To better understand the treatments, the rate
of the laccase activity level will be followed by the frequency of application in parenthesis
hereafter – e.g., 2.0 (4) denotes laccase activity of 2.0 units cm-2
applied at 4 weeks (Table 7.1).
Laccase from two different sources was procured to compare their effectiveness on thatch
management. Laccase from Pycoporus genus was procured from Jiangnan University, China
(CHU (2)) and from a commercial industrial whole-sale supplier in China (CHI (2) and was
applied at activity level of 2.0 units cm-2
every two weeks (Table 7.1). The treatment CHU (2)
(i.e. T12) was applied from July 2010 to Dec 2010 and from July 2011 to Dec 2011 to compare
the effect of application of laccase every year for six months to the residual effect of laccase
(Table 7.1).

152
Laccase Activity Assay
The activity of laccase was quantified by a calorimetric assay using a Beckman DU 640B
spectrophotometer (Beckman Instruments Inc., Fullerton, CA) spectrophotometer where one
activity unit of laccase corresponds to the amount of enzyme that causes an absorbance change at
468 nm at a rate of 1.0 unit min-1 in 3.4 mL of 1 mM 2, 6-dimethoxyphenol, a specific substrate
for laccase, in citrate-phosphate buffer at pH 3.8 (Park et al., 1999).
Measurements
Residual effect of laccase application on physical and chemical properties of thatch layer
was determined at six, twelve, and eighteen months after start of treatment application. Variables
measured included total organic matter content for a depth of 0-2.5 cm (OMU), 2.5-5.0 cm
(OML), and 0-5.0 cm (OM), thatch layer thickness (TLT), and saturated hydraulic conductivity
(SHC). Similarly, extractive-free acid-soluble lignin (LS) and acid-insoluble lignin (LI) content
was determined to observe the impact of treatment application on chemical composition
properties of thatch layer biomass.
Total Organic Matter Content
Total organic content was determined by the method described by Carrow et al. (1987).
Two soil cores (2.0 cm diam.) were obtained at two depths; 0-2.5 cm (OMU) and 2.5-5.0 cm
(OML) from each plot. The cores were dried in an oven at 100 ± 5oC for 24 h and weighed to
determine moisture content and then ashed in a muffle furnace at 600 ± 10oC for 24 h and
weighed again. The difference in the two readings was used to calculate total organic matter
content.

153
Thatch Layer Thickness
Thatch layer thickness was measured by two replaceable wedge-shaped turf profiles (8.9
cm wide and 2.5 cm thick) using AMS Turf Profiler (AMS Inc., American Falls, ID). Thatch
layer thickness was measured from four points across the width of each profile and averaged.
Clear visible distinction between thatch layer and the sand layer below was considered for the
measurement.
Saturated Hydraulic Conductivity
Saturated hydraulic conductivity (SHC) was measured by a constant hydraulic head
method using a Marriott tube apparatus. An intact core (diam. 4.7 cm and length 7.7 cm) was
obtained from each plot in a brass cylinder using a soil corer (Model 0200 soil sampler,
Soilmoisture Equip. Corp., Santa Barbara, CA). The bottom of the core was covered with a
double layer of cheesecloth held in place with a rubber band and saturated overnight in a 0.05 N
CaCl2 solution. A steady state flow through the samples was established by flowing 0.05 N CaCl2
through the core for 10 min. After 10 min the volume of water that passed through the core was
measured for one minute and repeated three times. Saturated hydraulic conductivity was
calculated using Darcy's equation.
Extractive-free Lignin Content
Thatch biomass was collected from the top 2.5 cm of each core after sampling for SHC.
Thatch samples were first air-dried, ground, washed by adding water in a mason jar and shaking
on a rotary shaker at 200 rpm, and then passed through a series of sieves with a 841µm sieve at
the top and a 177µm sieve at the bottom. The material retained by the 177 µm sieve size was
used for analysis. The thatch biomass was extracted for 24 h using the Soxhlet method for water-
and alcohol-soluble impurities using de-ionized water and 16.26 M (95 percent USP grade) ethyl

154
alcohol, respectively. Contents of LS and LI in the thatch layer were determined in a two-step
acid-hydrolysis procedure according to the laboratory analytical procedure developed by The
National Renewable Energy Laboratory (NREL, 2008) Acid-soluble lignin is primarily low
molecular mass phenolic compounds. In the first step, extractive-free thatch samples were
hydrolyzed for 60 min with 72% H2SO4 at 30oC. In the second step, H2SO4 was diluted to 4%
and the samples were autoclaved at 121oC for 1 h and then vacuum filtered. The solids remaining
after acid hydrolysis were dried in an oven at 100 ± 5oC for 24 h, weighed, ashed in a muffle
furnace at 600 ± 10oC for 24 h, and weighed again to calculate the acid-insoluble lignin content
using weight difference. Acid-soluble lignin was determined using this hydrolysis liquid at 240
nm wavelength in a Beckman DU 640B spectrophotometer (Beckman Instruments Inc.,
Fullerton, CA).
Statistical Analysis
A repeated measures design was used to analyze the full model for laccase residual
effect, consisting of eleven treatments, three levels of treatment duration and four replications.
Treatment CHU (i.e. T12) was repeated from July to Dec 2011 and is not considered in the full
model. Treatments were combined together to form: a) a cultural management group [control,
2.0 (2), CMC, and CMC+2.0 (4)]; b) a rate of application group [control, 0.5 (2), 1.0 (2), 2.0 (2),
and 4.0 (2)]: c) an application frequency group [Control, 2.0 (2), 2.0 (4), 2.0 (8), and 2.0 (12)]; d)
a laccase sources group [2.0 (2), CHU (2), and CHI (2)]; and e) and two year application group
[2.0 (2) and CHU (2)]. Analysis of variance (ANOVA) was performed to evaluate the main
effects of treatment duration, treatments, and interaction effects of duration and treatment using
general linear model (GLM) (SAS Institute, 1994). Treatments were grouped together in five
groups and analyzed as repeated measures to evaluate the effects of treatment, treatment

155
duration, interaction effects of treatment and treatment duration. Fisher’s protected LSD test with
α = 0.05 was used for determining statistical differences among durations and treatment means
following each ANOVA.
RESULTS
Full Model
Strong treatment effects were observed for OMU (P ≤ 0.01), TLT (P ≤ 0.001), SHC (P ≤ 0.001),
LI (P ≤ 0.001), and LT (P ≤ 0.01) (Table 7.2). Strong duration (time after treatment applications
were initiated) effects (P ≤ 0.001) were observed for OMU, TLT and all lignin content
measurements (Table 7.2) indicating residual effect of laccase application on these parameters.
No duration effects were observed for SHC and OML. Interaction effects of duration by
treatment (P ≤ 0.001) were observed for LI and LT indicating that different treatments had
different effects on extractive-free acid-insoluble and total lignin.
Cultural Management
The cultural management treatment group showed treatment effects for OMU (P ≤ 0.05),
TLT (P ≤ 0.001), SHC (P ≤ 0.05) and LI (P ≤ 0.001) and LT (Table 7.2). Significant duration
effects were observed for organic matter content (0-2.5 cm, 2.5-5.0 cm, and 0-5.0 cm), TLT, and
LS, LI, LT extractive-free lignin content. Duration by treatment interaction effects (P ≤ 0.001)
were observed for LI and LT (Table 7.2).
In comparison to control, no differences were observed for OMU, OML, and OM content
at six months after treatment initiation (Table 7.3). When plots were sampled after twelve
months of treatment initiation, OMU content decreased by 50 and 40.7 mg·g-1
in plots treated
with CMC and CMC+2.0 (4), respectively when compared to control plots. Significant duration
effects were observed for OML and OM content which is evident from a slight increase of 18.4

156
and 18.7 mg·g-1
in OML and OM content in comparison to control when sampled after 18 months
of treatment initiation (Table 7.3). No duration effect was observed for OMU (Table 7.3). After
six months, TLT decreased from 18.3 mm in control plots to 13.6 and 15.7 mm in plots treated
with 2.0 (4) and CMC+2.0 (4) treatments, respectively (Fig 7.1A). Measurement of thatch layer
from plots receiving core aeration and sand topdressing had 3 to 4 mm of sand additions and this
was included in the calculations. A TLT reduction of 4.1 mm was observed in plots treated with
2.0 (4) when compared to control plots when sampled at twelve months after start of experiment.
At eighteen months sampling, TLT lowered from 21.0 mm in control plots to 16.2 and 17.9 mm
in plots receiving 2.0 (4) and CMC+2.0 (4) treatment, respectively (Fig 7.1A). Significant
duration effects were observed for control and laccase treatment 2.0 (4) for TLT and no duration
effects were observed for plots receiving cultural management practices (Fig 7.1A).
After six months of treatment application, plots receiving core aeration and sand
topdressing treatment showed an increase of 13.5 cm h-1
in SHC in comparison to control plots
(Table 7.4). Plots receiving laccase treatment with or without cultural management had no
differences in SHC when compared to control plots (Table 7.4). No change in SHC was observed
in comparison to control at other sampling durations. No duration effect was recorded for SHC in
this group of treatments (Table 7.4). A reduction of 3.6, 7.8, and 3.8 mg·g-1
LS content was
recorded in plots treated with CMC, 2.0 (4), and CMC+2.0 (4), respectively when compared to
control plots at six months sampling. However, no differences in LS content were observed at
sampling after twelve and eighteen months of treatment initiation. A slight but significant
duration effect was observed for LS content in 2.0 (4) treatment (Table 7.4). Extractive-free LI
and LT content after six months of treatment application was lowered in plots treated with laccase
treatment alone and increased in plots treated with CMC and CMC+2.0 (4) treatment when

157
compared to control plots Table 7.4, Fig 7.2A). A similar trend was recorded for LI at sampling
conducted at twelve months after treatment initiation. Acid-insoluble content in all the treatments
increased over control at eighteen months after treatment initiation. Significant duration effects
were observed for LI and LT with increase in lignin content in all the treatments over time (Table
7.4, Fig 7.2A).
Rate of Application
Rate of laccase application significantly effected (P ≤ 0.001) TLT, LI, and LT (Table 7.2).
Strong duration effects were observed for OMU (P ≤ 0.001), TLT (P ≤ 0.001), LS (P ≤ 0.01), LI (P
≤ 0.001), and LT (P ≤ 0.001) (Table 7.2). Interaction effects (P ≤ 0.001) of duration by treatment
were observed for LI and LT content. After six months of treatment, no differences were
observed for OMU, OML, and OM in any of the treatments. Sampling at twelve months after
treatment initiation, OMU at laccase activity level of 4.0 units cm-2
decreased by 21.5 mg·g-1
when compared to control (Table 7.3). No differences were observed for OML and OM for
twelve month sampling. At eighteen months sampling after start of experiment a 10.4 mg·g-1
increase in OM content was obtained in plots treated with 1.0 (2) over control plots. Organic
matter content (0-2.5 cm) increased by 19.5 mg·g-1
at 0.5 units cm-2
when sampled between six
and eighteen months after treatment initiation. A significant reduction of 6.2 and 8.0 mg·g-1
in
OML content from six to eighteen months for treatments 2.0 (2) and 4.0 (2), respectively was
observed and reduction of OM (8.5 mg·g-1
) from six to twelve months was observed for
treatment 4.0 (2) suggesting the residual effect of laccase.
Laccase treatments at different activity levels were equally effective and lowered TLT by
3.8 to 4.8 mm in comparison to the control after six months of treatment application (Fig 7.1B).
Twelve months after start of the treatment, TLT was lowered by all activity levels of laccase.

158
However, plots treated with laccase at activity levels of 2.0 and 4.0 units cm-2
showed significant
reduction in thatch layer thickness in comparison to control plots and plots treated with 0.5 and
1.0 units cm-2
laccase activity. A reduction in TLT was observed for all treatments in comparison
to control when sampled after eighteen months after start of the experiment. Application of
laccase at 0.5, 1.0 and 2.0 units cm-2
was effective is maintaining the TLT up to six months after
treatment completion whereas in plots treated with laccase at 4.0 units cm-2
, TLT was lowered
from 14.5 to 13.3 mm from six months after treatment initiation to twelve months after start of
treatment. A significant increase in TLT was obtained when laccase was applied at 0.5 and 1.0
units cm-2
over the three sampling dates.
No effect of laccase activity levels were observed on SHC on all the sampling dates
(Table 7.4). Laccase application up to 2.0 units cm-2
lowered LS by 7.8 to 8.9 mg·g-1
when
compared to control when sampled after six months of treatment (Table 7.4). Acid-soluble lignin
in plots treated with 4.0 cm-2
laccase activity was reduced by 12.2 mg·g-1
when compared to
control plots at the end of treatment (Table 7.4). No differences in LS were observed at sampling
times of twelve and eighteen months after treatment initiation.
Extractive-free LI content lowered in comparison to control plots when treated with
laccase up to 2.0 and 1.0 units cm-2
at six and twelve months sampling after start of treatment,
respectively (Table 7.4). At the end of the treatment application, LI was higher in plots treated
with 4.0 units cm-2
when compared to control. Similarly, LI content was higher than control plots
when treated with 2.0 and 4.0 units cm-2
laccase activity, sampled at twelve months after
treatment initiation suggesting residual effect of laccase. Plots treated with laccase showed
higher LI content compared to control plots at eighteen months after treatment initiation (Table

159
7.4). An increase in the LI content was observed in all the treatments (Table 7.4). Variation in LT
content followed similar trends as for LI content with different laccase activity levels (Fig 7.2B).
Frequency of Application
Laccase application frequency effects (P ≤ 0.001) were observed for TLT, LI, and LT
(Table 7.2). Strong duration effects (P ≤ 0.001) were observed for OMU, TLT, and LT content
(Table 7.2). Interaction effects of duration by treatment were observed for LI (P ≤ 0.001) and LT
(P ≤ 0.001) (Table 7.2). No differences in OMU, OML, and OM in plots treated with laccase and
control plots were observed after six and twelve months of treatment initiation. However, an
increase in OMU and OM content was obtained in plots treated with 2.0 (12) over control plots at
eighteen months after start of treatment application. An accumulation of 52.3 mg·g-1
in OMU was
obtained in plots treated with 2.0 (12) between the between six and eighteen months of sampling
dates (Table 7.3).
Thatch layer thickness was lowered by 4.7 to 5.6 mm, 4.1 to 5.6 mm, and 3 to 4.8 mm in
plots treated with laccase at different frequencies in comparison to control plots when sampled
at six, twelve, and eighteen months, respectively (Fig 7.1C). No differences among different
application frequencies were observed at any sampling date. An increase in thatch layer
thickness was observed in all treatments at eighteen months sampling when compared to TLT
after six months of treatment. No significant change in TLT was observed at twelve months
sampling (Fig 7.1C).
All laccase treatments were effective in lowering the LS content when compared to
control six months after treatment initiation (Table 7.4). However, the decrease in LS content in
comparison to control was more with treatment 2.0 (2) than 2.0 (8) and 2.0 (12) (Table 7.4). It
suggests that frequent application of laccase was more effective in lowering LS content in

160
comparison to control. No differences in LS values were observed when sampled at twelve and
eighteen months after start of the experiment. After six months of treatment, a reduction in LI
content was observed in plots receiving laccase treatments at every 2 (29.6 mg·g-1
) and 4 (15.5
mg·g-1
) weeks when compared to control (Table 7.4). The LI content increased by 5.8 mg·g-1
in
plots receiving 2.0 (12) treatment when compared to the control plots. Sampling after twelve
months indicated an increase in LI content when laccase was applied every 2, 8, and 12 weeks.
However, with application of laccase every 4 weeks, a slight reduction in LI content was
observed at twelve months sampling in comparison to control. All laccase treated plots showed
increase in LI content in comparison to control plots when sampled at eighteen months (Table
7.4). A significant increase in LI content was observed in all the treatments when sampled over
time (Table 7.4). Similar trends were observed for LT content with laccase application at
different frequencies (Fig 7.2C).
Sources of Laccase Enzyme
Laccase enzymes procured from different sources were similarly effective on organic
matter (OMU, OML, and OM; Table 7.3), TLT (Fig 7.1C), and SHC (Table 7.4). Slight
differences in LS and LI content were observed in plots treated with laccase from different
sources (Table 7.4). Six months after treatment initiation, LS content was lower in plots receiving
2.0 (2) in comparison to other two laccase enzymes. After, 12 and 18 months of sampling, no
differences in LS content were observed in plots treated with different laccase enzymes. When
treated with CHI (2) for six months, LI content was slightly higher than the other two laccase
enzymes. However, when sampled after twelve months, LI content was higher in plots treated
with 2.0 (2) followed by CHI (2) and CHU (2). No differences in LS and LI content were
observed in plots receiving different laccase sources at eighteen months after start of treatment

161
(Table 7.4). A significant increase in LI and LT content was observed from six to eighteen
months sampling duration (Table 7.4, Fig 7.2D).
Application Duration
Strong effects of laccase application duration were observed for OM, TLT and LT at
sampling performed at eighteen months after treatment initiation (Table 7.3, Table 7.4, and Fig
7.3). An increase in organic matter was observed at eighteen months sampling after treatment
initiation for treatment CHU (2), which was applied for six months in year one and six months in
year two, in comparison to application of laccase 2.0 (2) applied for only six months in year one
(Table 7.3). The baseline measurement for TLT was 17.2 mm. The TLT value in control plots
continue to increase with time whereas in plots treated with 2.0 (2) and CHU (2), after six
months, a significant reduction in TLT was observed in comparison to control. When sampled 12
months after treatment initiation, TLT was slightly lower than when sampled after six months in
both the treatments. When sampled after eighteen months TLT in plots treated with 2.0 (2) was
3.3 mm higher than plots treated with CHU (2) (Fig 7.3). Lignin content after eighteen months
was slightly higher in both the treatments when compared to the control (Fig 7.4).
DISCUSSION
Non-destructive methods to manage thatch are desired but have shown to be ineffective.
Use of some commercial microbial inoculum such as Biodethatch, Thatch-Away, and Earth
Anew on bermudagrass, creeping bentgrass and annual bluegrass was reported to be ineffective
to reduce thatch layer depth (Gilbeault et al., 1976; Lancaster et al., 1977; Murdoch and Barr,
1976). Similarly, application of biological granular supplement Thatch-X on creeping bentgrass
(McCarty e al., 2007), wetting agent, Aqua-Gro®
and Milogranite, activated sewage sludge, on
Kentucky bluegrass (Murray and Juska, 1977) was ineffective in lowering organic matter content

162
in thatch layer. One of the possible reasons that past studies found these products to be
inconsistent in organic matter decomposition is that they focused on degradation of cellulosic
and hemicellulosic sugars instead of lignin. We believe that lignin protective matrix has to be
removed to open the biomass structure on increase access to readily decomposable structural
carbohydrates.
Controlled greenhouse and laboratory studies reported weight loss of bermudagrass
pellets, St. Augustinegrass and zoysiagrass stolons (Martin and Dale., 1980) and reduction in
cellulose content and total oxidizable organic matter of bermudagrass and centipedegrass
(Eremochloa ophiuroides) (Sartain and Volk, 1984) when inoculated with different wood-
decaying fungi. However, field inoculation experiments on bermudagrass showed no thatch
degradation (Martin and Dale., 1980). This may be due to the inability to maintain proper micro-
environment conditions, particularly moisture and temperature regimes, required by particular
microbial populations under turfgrass management systems which further may lower the
possibility of maintaining higher microbial populations over sustained periods of time.
Laccase enzyme is stable over a wide range of pH and temperature (Baldrian, 2006;
Munoz et al., 1997; Stoilova et al., 2010; Thurston, 1994). Laccase, a multi copper oxidase, is an
extra-cellular enzyme known to oxidize a wide range of phenolic compounds using oxygen as an
electron acceptor (Baldrian, 2006). Lignin phenolic components are oxidized due to laccase-
mediated cleavage of different covalent bonds formed within lignin macromolecule and between
lignin and structural sugars (Wong, 2009). This opens up the biomass structure leading to
increased availability of easily degradable sugars by microbes. By using laccase enzyme,
turfgrass managers may have a new means to effectively manage thatch over wide range of
environmental conditions and can effectively utilize the microbial decomposition of organic

163
matter. In previous studies, reduction in thatch/mat layer by laccase treatment was demonstrated
in greenhouse and field research (Chapter III, IV, V, VI). However, the question of residual
effects was not addressed, which is the focus of the current project.
Cultural Management and Laccase
Cultural management using several management techniques has reported contrasting
results for reduction in thatch layer thickness and accumulation of organic matter. Carrow et al.
(1987) reported a decrease in thatch layer depth of 44-62% with one or two applications of
topdressing annually. Sand topdressing four times a year was reported to be effective in reducing
thatch layer when compared to single application (White and Dickens, 1984). Barton et al.
(2009) reported a significant reduction in organic matter content with sand topdressing twice a
year on Kikuyu turfgrass. It was also noted that core aeration along with sand topdressing was
equally effective in reducing thatch layer depth and organic matter content. However, Engel and
Alderfer (1967), McCarty et al. (2007), and Reiki (1994) observed no reduction in thatch layer
by topdressing alone. It has been suggested that application of sand topdressing improves
microenvironment for microbial growth (Ledeboer and Skogly, 1967). However, some
researchers believe that dilution of organic matter in thatch layer is primary influence of sand
topdressing (Couillard et al., 1997; Rieki, 1994). Topdressing alone had no effect on water
infiltration rates (McCarty et al., 2007).
A 10% reduction in thatch layer thickness was reported by core aeration four times
annually on creeping bentgrass (McCarty et al., 2007) and three to six times a year on Tifgreen
bermudagrass (McWhirter and Ward, 1976). Carrow et al. (1987) noted no effect of core aeration
applied once or twice a year on Tifway bermudagrass on thatch-mat depth although a reduction
in stand density was observed. Several studies have reported an increase in water infiltration in

164
turfgrass field after core aeration due to formation of water channels and porous profile (Bunnell
et al., 2001; Canaway et al., 1986; McCarty et al., 2005).
In our study, organic matter content in the top 2.5 cm was lower in comparison to the
control at 12 months with cultural management practice and this may be attributed to the dilution
effect created by sand topdressing on the surface layer as sand topdressing showed no effect on
organic matter at 2.5-5.0 cm depth (Table 7.3). The increase in OML (18 months) and OM (12
and 18 months) for laccase treated thatch may be related to a more dense thatch biomass
occurring from laccase activity on cellulose and hemicellulose sugars resulting in a higher
content of LT as seen at 18 months (Fig 7.2A). As raw organic matter decomposes, such as in
composting situations, the resulting material increases in lignin content and density.
Lignin dynamics were also apparent in TLT results, where application of laccase along
with cultural management effectively decreased TLT at six and eighteen months and increased
LT content at all three sampling times (Fig 7.1A, 7.2A). The increase in LT may be attributed to
the change in thatch biomass structure caused by laccase, making structural sugars more
available for decomposition as well as better micro-climate for microbial growth due to core
aeration and sand topdressing. Increase in loss of structural sugars from thatch biomass may lead
to elevated levels of lignin in the remaining thatch material. A significant loss in structural sugars
of creeping bentgrass thatch biomass was observed with application of laccase in greenhouse and
field studies (Chapter IV, V).
Saturated hydraulic conductivity was higher at six months in plots with only CMC (Table
7.4). When laccase was applied along with CMC, the SHC was higher at eighteen month
sampling when compared to plots receiving only laccase treatments as well as control. The

165
increase in SHC may be attributed to the core aeration, which creates channels for rapid water
movement.
The laccase-CMC data illustrated that the 2.0 (4) treatment of laccase was effective in
reducing TLT at 6, 12, and 18 months, when applied alone or with CMC. Laccase alone did not
influence SHC, but in combination with CMC, SHC increased relative to the control. These
results suggest that laccase has positive effects thatch control and can be used in conjunction
with routine CMC.
Laccase Rate and Frequency
Laccase treatments at different rates and frequency of application were ineffective in
reducing OMU, OML, and OM content after six months of application (Table 7.3). However, the
highest laccase application 4.0 units cm-2
applied at every two weeks showed a significant
reduction in OMU content when plots were sampled at twelve months after treatment initiation
(Table 7.3). This brings up a very interesting point that laccase application for six months was
effective in slowing accumulation of OMU for over the next six months. As the time progresses
the residual effect of laccase declines and OMU values increase in the treated plots and is similar
to the control plots as is evident from the eighteen months data. The reduction in OML content
was observed over sampling period in plots treated with 2.0 and 4.0 units cm-2
(Table 7.3). This
may also lead us to believe that a long term application of laccase at a high rate (2.0 and 4.0 units
cm-2
) may be effective in lowering organic matter content in turf greens that are established for a
long time and contain high organic matter content in the thatch/mat layer.
Laccase applied at all frequencies and rates was effective in lowering TLT in comparison
to control after six months of treatment (Fig 7.1B, 7.1C). Additionally, TLT readings from plots
treated with the various laccase rates and frequencies were lower relative to the control plots

166
after twelve and eighteen months suggesting strong residual effects of laccase (Fig 7.1B).
However, TLT readings were significantly higher at the three highest laccase rates at eighteen
months sampling when compared to sampling conducted at twelve months after treatment
initiation suggesting that residual effect of laccase in thatch layer is effective for up to six months
after treatment cessation (Fig 7.1B). Thatch layer accumulation decreased with application of
laccase during second year (Fig 7.3), which suggests that annual application of laccase enzyme
for six months in the growing season is effective in reducing or stabilizing thatch accumulation.
While laccase treatments did reduce TLT, there were only minor differences in SHC with no
apparent trend (Table 7.4).
In the sub-study involving laccase application for six months in year one and again for
six months in year two, a significant reduction in thatch layer was observed in comparison to
plots receiving laccase for six months in year one when sampled at eighteen months after
treatment initiation (Fig 7.3). Residual effect of laccase, after treatment cessation, reduced thatch
layer buildup during the next six months. But a significant increase in thatch layer was observed
when no laccase enzyme application was performed during second year. However, no thatch
buildup was observed when laccase was applied for second year. No further reduction in thatch
layer observed during the second year even with application of laccase suggests a threshold level
for thatch layer reduction by application of laccase. Increase in OMU was observed in plots
where laccase was applied for six months during second year when compared to laccase applied
for six months in year one (Table 7.3). This may be attributed to tight stacking of thatch biomass
due to removal of lignin bonds, reduction of structural sugars leading to weak thatch biomass.
Extractive-free LS content initially decreased with application of laccase as was evident
from sampling conducted after conclusion of treatments at 6 months (Table 7.4). The extent of

167
reduction at 6 months was dependent on the amount of laccase applied to the plots whether by
increasing rate or frequency of applications. For LI, application of laccase up to 2.0 units cm-2
decreased LI in thatch biomass, but application of laccase at 4.0 units cm-2
showed an increase in
LI content by dry weight basis in comparison to control (Table 7.4). The increase in LI content
could be attributed to the loss of excessive structural sugars in plots treated with laccase at 4.0
units cm-2
(Chapter V). Three major components of plant biomass are cellulosic sugars,
hemicellulosic sugars, and lignin. So, with application of laccase, lignin bonds are broken which
leads to opening up of the biomass structure making sugars more available for microbial
decomposition. As the sugar content is decreased, it tends to increase the lignin content by dry
weight basis. A decrease in structural carbohydrate (cellulosic and hemicellulosic sugars) content
in thatch biomass after laccase treatment was reported (Chapter IV, V). A decrease in structural
sugar content was observed as the rate of laccase activity increased indicating more availability
of sugars for microbial degradation (Chapter V). Residual effect of laccase application was
observed with an increase in lignin accumulation in thatch biomass from 6 to 18 months
samplings suggesting more loss of sugar content from the biomass due to structural changes
caused by laccase application (Table 4). As LI constitutes the major component of LT, a similar
trend in LT was observed with increasing laccase application rates (Fig 7.2B). For LS, LI and LT,
a maximum reduction in comparison to control at 6 months was observed when laccase was
applied every two weeks and extent of reduction decreased with decreased frequency of laccase
application (Table 7.4, Fig 7.2C) suggesting the extent of lignin reduction was dependent on the
amount of laccase applied to the plots.

168
Laccase Source
Different sources of laccase enzymes proved equally effective in reducing thatch layer
thickness (Fig 7.1D). However, slight differences in LS and LI were observed with different
laccase sources (Table 7.4). Lignin content (LS and LI) was significantly lower in plots treated
with laccase procured from Sigma Aldrich in comparison to plots treated with CHU and CHI
after six months of application but no differences were observed in lignin content when sampled
at twelve and eighteen months after treatment initiation (Table 7.4). This suggests that laccase
from Sigma Aldrich was initially more effective but other laccase enzymes proved to be equally
effective on thatch biomass.
CONCLUSIONS
This field research demonstrated the residual effects of laccase enzyme on creeping
bentgrass with TLT reduced by an average across all laccase rates of 23.5, 25.7, and 23.9% of
the control for 6, 12, and 18 month sampling times, respectively (Fig 7.1B). In a similar manner,
the average TLT reduction across all frequencies of laccase applications were 27.8, 25.5, and
19.7% of the control for 6, 12, and 18 month samplings, respectively (Fig 7.1C). Organic matter
contents (OMU, OML, and OM) were not appreciably affected by laccase rates or frequency of
the three sample dates. Since total lignin content increased, suggesting decomposition of
cellulose and hemicellulose fractions with concentration of lignin, the total OM may not change
but the composition did over time. The 2.0 (4) treatment of laccase was effective in reducing
TLT at 6, 12, and 18 months, when applied alone or with CMC. Laccase alone did not influence
SHC, but in combination with CMC, SHC increased relative to the control. Laccase from
different sources were equally effective in organic matter decomposition and thatch layer
reduction. Laccase application for six months during second year was effective in ceasing thatch

169
layer buildup. The results from this study indicate that application of laccase for six months in
one year is effective to reduce the organic matter content and thatch layer thickness. Six months
application once a year would be effective to maintain thatch layer.
LITERATURE CITED
Alder, E. 1977. Lignin chemistry - past, present and future. Wood Sci. Technol. 11: 169-218.
Baldrian, P. 2006. Fungal laccases-occurrence and properties. FEMS Microbiol Rev. 30: 215-
242.
Barton, L., G.G.Y. Wan, R.P. Buck, and T.D. Colmer. 2009. Effectiveness of cultural thatch-mat
controls for young and mature kikuyu turfgrass. Agron. J. 101: 67-74.
Beard, J.B. 1973. Turfgrass: Science and culture. Prentice Hall Inc., Englewood Cliffs, NJ.
Blanchette, R.A. 1984. Screening wood decayed by white-rot fungi for preferential lignin
degradation. Appl. Environ. Microbiol. 48: 647-653.
Bunnell, B.T., L.B. McCarty, and H.S. Hill. 2001. Summer cultivation effects on sand based
creeping bentgrass golf green. Int. Turfgrass Res. J. 9: 3-9.
Canaway, P.M., S.P. Isaac, and R.A. Bennett. 1986. The effects of mechanical treatments on the
water infiltration rate of a sand playing surface for association football. J. Sports Turf
Res. Inst. 62: 67-73.
Carrow, R.N. 2003. Surface organic matter in bentgrass greens. USGA Turfgrass Environ. Res.
Online 2(17): 1-10.
Carrow, R.N., B.J. Johnson, and R.E. Burns. 1987. Thatch and quality of Tifway bermudagrass
turf in relation to fertility and cultivation. Agron. J. 79: 524-530.
Chen, Y.R., and S. Sarkanen. 2003. Macromolecular lignin replication: A mechanistic working
hypothesis. Phytochem. Rev. 2: 235-255.

170
Couillard, A., A.J. Turgeon, and P.E. Rieke. 1997. New insights into thatch biodegradation. Int.
Turfgrass Res. J. 8: 427-435.
Davin, L.B. and N.G. Lewis 2003. A historical perspective on lignin biosynthesis: Monolignol,
allylphenol and hydroxycinnamic acid coupling and downstream metabolism.
Phytochem. Rev. 2: 257-288.
Del Rio, J. C., G. Marques, J. Rencoret, A.T. Martinez, and A. Gutierrez. 2007. Occurrence of
naturally acetylated lignin units. J.Agric. Food Chem. 55: 5461–5466.
Dunn, J.H., K.M. Sheffer, and P.M. Halisky. 1981. Thatch and quality of Meyer zoysia in
relation to management. Agron. J. 73: 949-952.
Engel, R.E. 1954. Thatch on turf and its control. Golf Course Rep. 22 (5): 12-14.
Engel, R.E., and R.B. Alderfer. 1967. The effect of cultivation, top-dressing, lime, N, and
wetting agent on thatch development on 1/4-inch bentgrass over a 10-year period. N.J.
Agric. Exp. Stn. Bull. 818: 32-45.
Engelke, M.C., V.G. Lehman, W.R. Kneebone, P.F. Colbaugh, J.A. Reinert, and W.E. Knoop.
1995. Registration of ‘Crenshaw’ creeping bentgrass. Crop Sci. 35: 589.
Gilbeault, V.A., R. Baldwin, I. Bivins, and D. Hanson. 1976. Evaluation of biological
dethatching materials. California Turfgrass Culture. 26: 29-30.
Hartwiger, C. 2004. The importance of organic matter dynamics: How research uncovered the
primary cause of secondary problems. USGA Green Section Record 42(3): 9-11.
Kirk, T.K., W.J. Connors, R.D. Bleam, and G. Jeikus. 1976. Requirements for a growth substrate
during lignin decomposition by two wood-rotting fungi. Appl. Environ. Microbiol. 32:
192-194.
Kirk, T.K., W.J. Connors, R.D. Bleam, W.F. Hackett, and J.G. Jeikus. 1975. Preparation and

171
microbial decomposition of synthetic [14C] lignins. Proc. Natl. Acad. Sci. USA. 72:
2515-2519.
Lancaster, D.L., A.W. Redo, and V.A. Gibleault. 1977. Evaluation of biological thatch
decomposing materials. California Turfgrass Culture. 27: 29-30.
Landreth, J., D. Karcher, and M. Richardson. 2008. Cultivating to manage organic matter in sand
based putting greens: University of Arkansas researchers provide important insight for
managing organic buildup on putting greens. USGA Turfgrass Environ. Res. Online
46(1): 16-19.
Ledeboer, F.B., and C.R. Skogley. 1967. Investigations into the nature of thatch and methods for
its decomposition. Agron. J. 59: 320-323.
Martin, S.B., and J.L. Dale. 1980. Biodegradation of turf thatch with wood-decay fungi.
Phytopathology. 70: 297-301.
McCarty, L.B. 2005. Best golf course management practices. 2nd ed. Prentice Hall Inc. Upper
Saddle River, NJ.
McCarty, L. B., M.F. Gregg, and J.E. Toler. 2007. Thatch and mat management in an established
creeping bentgrass green. Agron. J. 99: 1530-1537.
McCarty, L.B., M.F. Gregg, J.E. Toler, J.J. Camberato, and H.S. Hill. 2005. Minimizing thatch
and mat development in a newly seeded creeping bentgrass golf green. Crop Sci. 45:
1529-1535.
McWhirter, E.L., and C.Y. Ward. 1976. Effect of vertical mowing and aerification on golf green
quality. Mississippi Agric. For. Exp. Stn. Res. Rep. 2 (12): 1-2.
Mester, T., E. Varela, and M. Tien. 2004. Wood degradation by brown-rot and white-rot fungi.
The Mycota II: Genetics and biotechnology. 2nd edition. Springer-Verlag, Berlin,

172
Heidelberg.
Munoz, C., F. Guillen, A.T. Martinez, and M.J. Martinez. 1997. Laccase isozymes of Pleurotus
eryngii: Characterization, catalytic properties, and participation in activation of molecular
oxygen and Mn2+
oxidation. App. Environ. Microbiol. 63: 2166-2174.
Murdoch, C.L., and J.P. Barr. 1976. Ineffectiveness of commercial microorganism inoculums in
breaking down thatch in common bermudagrass in Hawaii. HortScience. 11: 488-489.
Murray, J.J., and F.V. Juska. 1977. Effect of management practices on thatch accumulation, turf
quality, and leaf spot damage in common Kentucky bluegrass. Agron. J. 69: 365-369.
NREL- National Renewable Energy Laboratory. 2008. Determination of structural carbohydrates
and lignin in biomass. Available at: http://www.nrel.gov/biomass/pdfs/42618.pdf
(Verified 01 July, 2012). NREL, Golden, CO, USA.
Otjen, L., and R. Blanchette. 1987. Assessment of 30 white-rot basidiomycetes for selective
lignin degradation. Holzforschung. 41: 343-349.
Park, J. W., J. Dec, J. E. Kim, and J. M. Bollag. 1999. Effect of humic constituents on the
transformation of chlorinated phenols and anilines in the presence of oxidoreductive
enzymes or birnessite. Environ. Sci. Tech. 33: 2028-2034.
Ralph, J., M. Bunzel, J.M. Marita, R.D. Hatfield, F. Lu, H. Kim, P.F. Schatz, J.H. Grabber, and
H. Steinhart. 2004. Peroxidase dependent cross linking reactions of p-hydroxicinnamates
in lant cellwalls. Phytochemistry Rev. 3: 79-96.
Rieke, P.E. 1994. Sand topdressing: Where are we going? Golf Course Manage. 62: 36-38.
Roberts, E.C., and E.J. Bredakis. 1960. What, why and how of turfgrass root development. Golf
Course Rep. 28: 13-24.
Sartain, J.B., and B.G. Volk. 1984. Influence of selected white-rot fungi and topdressings on the

173
composition of thatch components of four turfgrasses. Agron. J. 76: 359-362.
SAS Institute Inc. 1994. The SAS system for windows. Release 9.2. SAS Inst., Cary, NC.
Sinsabaugh R.L., R.K. Antibus, A.E. Linkins, C.A. Mcclaugherty, L. Rayburn, D. Repert, T.
Weiland. 1993. Wood decomposition - nitrogen and phosphorus dynamics in relation to
extracellular enzyme-activity. Ecology. 74: 1586-1593.
Stoilova, I., A. Krastanov, and V. Stanchev. 2010. Properties of crude laccase from Trametes
versicolor produced by solid-substrate fermentation. Adv. Bioscience Biotech. 1: 208-
215.
Taylor B.R., D. Parkinson, and W.F.J. Parsons. 1989. Nitrogen and lignin content as predictors
of litter decay rates: A microcosm test. Ecology. 70: 97-104.
Thurston, C.F. 1994. The structure and function of fungal laccases. Microbiol. 140: 19-16.
Weston, J.B., and J.H. Dunn. 1985. Thatch and quality of Meyer zoysia in response to
mechanical cultivation and nitrogen fertilization. P. 449-458. In F. Lemaire (ed.) Proc.
5th Int. Turfgrass Res. Conf., Avignon, France. 1-5 July 1985. Institut National de la
Recherche Agronomique, Paris, France.
White, R.H., and R. Dickens. 1984. Thatch accumulation in bermudagrass as influenced by
cultural practices. Agron. J. 76: 19-22.
Wong, D.W.S. 2009. Structure and action mechanism of ligninolytic enzymes. Appl. Biochem
Biotechnol. 157: 174-209.

174
Table 7.1 Description of laccase treatments applied on creeping bentgrass
Treatment No
Volume
of
solution
Laccase
activity
level
Application
frequency
Cultural
Mgt.
practice
Source of laccase
Designation
Application
time frame
T1 Control 410 mL 0 2 No NA Control 0-6 months
12-18 months
Cultural management
T2 CMC 0 mL 0 0 Yes NA CMC
T3 CMC+2.0 410 mL 2.0 4 Yes Sigma Aldrich CMC+2.0 (4) 0-6 months
Rate of application
T4 0.5 (2) 410 mL 0.5 2 No Sigma Aldrich 0.5 (2) 0-6 months
T5 1.0 (2) 410 mL 1.0 2 No Sigma Aldrich 1.0 (2) 0-6 months
T6 2.0 (2) 410 mL 2.0 2 No Sigma Aldrich 2.0 (2) 0-6 months
T7 4.0 (2) 410 mL 4.0 2 No Sigma Aldrich 4.0 (2) 0-6 months
Application frequency
T8 2.0 (4) 410 mL 2.0 4 No Sigma Aldrich 2.0 (4) 0-6 months
T9 2.0 (8) 410 mL 2.0 8 No Sigma Aldrich 2.0 (8) 0-6 months
T10 2.0 (12) 410 mL 2.0 12 No Sigma Aldrich 2.0 (12) 0-6 months
Laccase sources
T11 CHI (2) 410 mL 2.0 2 No Industrial-China CHI (2) 0-6 months
T12 CHU (2) 410 mL 2.0 2 No University-China CHU (2) 0-6 months
12-18 months

175
Table 7.2 Analysis of variance (ANOVA) table showing the effects of laccase treatments,
treatment duration, and duration and treatment interactions on creeping bentgrass.
Source of variation
df
Organic
matter (OMU)
(0-2.5
cm)
Organic
matter (OML)
(2.5-5.0
cm)
Organic
matter (OM)
(0-5.0
cm)
Thatch
layer thickness
TLT
Saturated
hydraulic conductivity
SHC
Acid-
soluble lignin LS
Acid-
insoluble lignin LI
Total lignin
LT
---------------------------------------------------------------mean square value-------------------------------------------------
Full Model
Rep 3 1429 973 779 5 123 282 60 167 Treatment 10 2583** 316 515 40*** 131*** 37 2065*** 1966***
Error A (rep*treatment) 30 699*** 317* 247** 2 24 30 21 56
Duration 2 7934*** 15 792** 85*** 110 1205*** 69963*** 79960*** Duration*treatment 20 316 181 106 2 24 36 970*** 1127***
Error 66 221 194 105 2 39 66 26 123
Cultural Management Rep 3 194 122 58 2 75 110 36 31
Treatment 3 4865* 252 821 49*** 272* 28 1668*** 1388**
Error A (rep*treatment) 9 906** 195*** 217** 2 57 28 22 41 Duration 2 1343** 132* 436*** 23** 138 226** 13999*** 15053***
Duration*treatment 6 275 65 114 0.7 44 23 206*** 317***
Error 24 225 38 47 3 74 32 15 52
Rate of Application
Rep 3 4105 1368 1747 4 108 182 52 141 Treatment 4 400 139 201 53*** 3 55 3029*** 2980***
Error A (rep*treatment) 12 313 175*** 146** 0.6 4 32 19 42
Duration 2 2900*** 112 120 29*** 35 507** 37614*** 43511*** Duration*treatment 8 225 36 46 2 4 31 1696*** 1982***
Error 30 249 37 40 1 23 59 25 101
Appl. Frequency Rep 3 1333 1134 522 3 55 73 19 41
Treatment 4 322 488 380 53*** 4 59 2170*** 1641***
Error A (rep*treatment) 12 663** 464 302 1 5 43 35 78 Duration 2 4108*** 173 404 64*** 25 690** 35405*** 38414***
Duration*treatment 8 496 290 95 1 4 47 2113*** 1439***
Error 30 230 346 158 2 17 85 29 168
Laccase Sources
Rep 3 531 510 418 8 55 92 10 43
Treatment 2 1088* 86 281 1 12* 23 2909*** 2703*** Error A (rep*treatment) 6 337 224 207 0.8 12 7 7 5
Duration 1 34 94 87 1 65* 83 46837*** 42974***
Duration*treatment 2 37 20 1 0.1 2 13 1360*** 1622*** Error 9 193 128 102 2 9 68 32 84
2 Year Application
Rep 3 862 857 706 4 194 85 113 32 Treatment 1 4150** 780 1520 15 75 57 1447*** 926**
Error A (rep*treatment) 3 120 381** 330* 3 56 7 2 12
Duration 2 3337* 105 460* 8* 113 284* 31421*** 34666***
Duration*treatment 2 97 174 100 4 41 10 2142*** 2362***
Error 12 526 56 74 2 125 60 49 105
* Significant at the 0.05 probability level
**Significant at the 0.01 probability level
*** Significant at the 0.001 probability level

176
Table 7.3 Total organic matter content at three depths; 0-2.5 cm (OMU), 2.5-5.0 cm (OML), and 0-5.0 cm (OM) at six, twelve and
eighteen months after initiation of different laccase treatments applied on creeping bentgrass.
Total organic matter (0-2.5cm) OMU Total organic matter (2.5-5.0 cm) OML Total organic matter (0-5.0 cm) OM
Treatment
group
6 Months
12 Months
18 Months
6 Months
12 Months
18 Months
6 Months
12 Months
18 Months
----------------------------------------------------------------------mg·g-1
--------------------------------------------------------------------------------------
Cultural Mgt.
Control 132.0ab†A‡ 138.6a A 140.1ab A 63.9a A 62.8a A 61.5b A 90.4a A 89.7ab A 91.1b A
CMC 107.1b AB 88.6b B 118.4b A 66.7a A 60.5a A 70.8ab A 83.6a AB 72.4b B 90.51b A
2.0 (4) 134.7a A 141.7a A 160.9a A 67.7a B 73.2a AB 79.9a A 93.8a B 99.8a B 109.8a A
CMC+2.0 (4) 113.0ab AB 97.9b B 118.4b A 71.1a A 63.9a A 71.1ab A 89.1a AB 77.7b B 89.8b A
Rate of Appl.
Control 132.0a A 138.6a A 140.1a A 63.9a A 62.8a A 61.5ab A 90.4a A 89.7a A 91.1b A
0.5 (2) 135.8a B 139.6aAB 155.3a A 69.9a A 69.0a A 60.6ab A 95.8a A 95.2a A 93.8ab A
1.0 (2) 131.5a A 133.9ab A 165.4a A 64.9a A 65.5a A 67.6a A 90.6a A 91.6a A 101.5a A
2.0 (2) 125.2a A 127.7ab A 156.9a A 66.4a A 59.0a B 60.2ab B 90.0a A 85.5a A 94.4ab A
4.0 (2) 129.9a AB 117.1b B 142.2a A 63.1a A 56.1a AB 55.1b B 88.6a A 80.1a B 85.8b AB
Freq. of Appl.
Control 132.0.a A 138.6a A 140.1b A 63.9a A 62.8a A 61.5b A 90.4a A 89.7a A 91.1c A
2.0 (2) 125.2a A 127.7a A 156.9ab A 66.4a A 59.0a B 60.2b B 90.0a A 85.5a A 94.4bc A
2.0 (4) 134.7a A 141.7a A 160.9ab A 67.7a A 73.2a A 79.9a A 93.8a A 99.8a A 109.8a A
2.0 (8) 134.8a A 139.7a A 148.8b A 64.4a A 65.0a A 68.6ab A 91.7a A 93.0a A 97.2abc A
2.0 (12) 131.6a B 129.0a B 183.9a A 62.6a A 94.5a A 70.6ab A 89.8a A 106.7a A 107.9ab A
Lacc. Sources
2.0 (2) 125.2b A 127.7a A 156.9a A 66.4a A 59.0a B 60.2b B 90.0a A 85.5a A 94.4b A
CHI (2) 136.8ab AB 132.6a B 163.9a A 69.1a A 65.6a A 76.6ab A 95.5a AB 91.5a B 108.9a A
CHU (2) 152.2b A 146.7a A 69.5a A 68.5a A 101.1aAB 98.1a B
Cont. appl
2.0 (2) 125.2a A 127.7a A 156.9a A 66.4a A 59.0a B 60.2a B 90.0a A 85.5a A 94.4b A
CHU (2) 152.2a A 146.7a A 189.8a A 69.5a A 68.5a A 81.8a A 101.1aAB 98.1a B 118.4a A
†Means within a column in a treatment group (treatment effect) followed by the same lowercase letter are not significantly different
according to LSD at α=0.05
‡ Means within a row in a treatment group (duration effect) followed by the same uppercase letter are not significantly different
according to LSD at α=0.05.
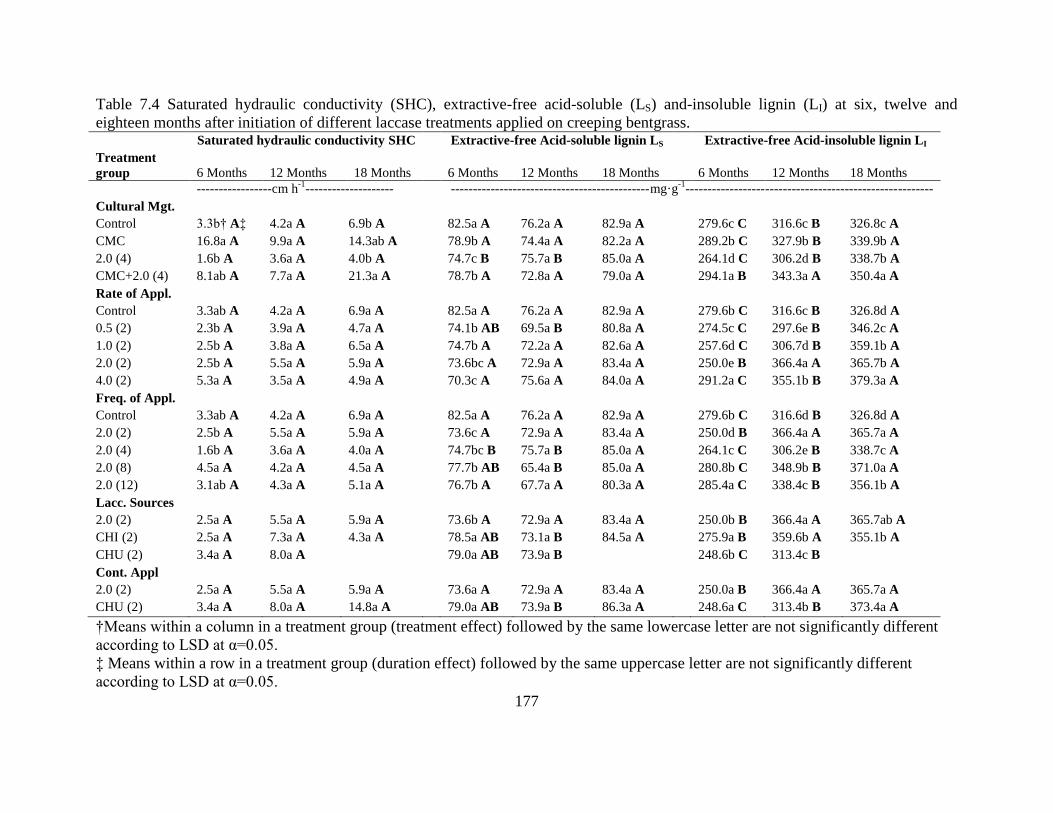
177
Table 7.4 Saturated hydraulic conductivity (SHC), extractive-free acid-soluble (LS) and-insoluble lignin (LI) at six, twelve and
eighteen months after initiation of different laccase treatments applied on creeping bentgrass. Saturated hydraulic conductivity SHC Extractive-free Acid-soluble lignin LS Extractive-free Acid-insoluble lignin LI
Treatment
group
6 Months
12 Months
18 Months
6 Months
12 Months
18 Months
6 Months
12 Months
18 Months
-----------------cm h-1
-------------------- ---------------------------------------------mg·g-1
--------------------------------------------------------
Cultural Mgt.
Control 3.3b† A‡ 4.2a A 6.9b A 82.5a A 76.2a A 82.9a A 279.6c C 316.6c B 326.8c A
CMC 16.8a A 9.9a A 14.3ab A 78.9b A 74.4a A 82.2a A 289.2b C 327.9b B 339.9b A
2.0 (4) 1.6b A 3.6a A 4.0b A 74.7c B 75.7a B 85.0a A 264.1d C 306.2d B 338.7b A
CMC+2.0 (4) 8.1ab A 7.7a A 21.3a A 78.7b A 72.8a A 79.0a A 294.1a B 343.3a A 350.4a A
Rate of Appl.
Control 3.3ab A 4.2a A 6.9a A 82.5a A 76.2a A 82.9a A 279.6b C 316.6c B 326.8d A
0.5 (2) 2.3b A 3.9a A 4.7a A 74.1b AB 69.5a B 80.8a A 274.5c C 297.6e B 346.2c A
1.0 (2) 2.5b A 3.8a A 6.5a A 74.7b A 72.2a A 82.6a A 257.6d C 306.7d B 359.1b A
2.0 (2) 2.5b A 5.5a A 5.9a A 73.6bc A 72.9a A 83.4a A 250.0e B 366.4a A 365.7b A
4.0 (2) 5.3a A 3.5a A 4.9a A 70.3c A 75.6a A 84.0a A 291.2a C 355.1b B 379.3a A
Freq. of Appl.
Control 3.3ab A 4.2a A 6.9a A 82.5a A 76.2a A 82.9a A 279.6b C 316.6d B 326.8d A
2.0 (2) 2.5b A 5.5a A 5.9a A 73.6c A 72.9a A 83.4a A 250.0d B 366.4a A 365.7a A
2.0 (4) 1.6b A 3.6a A 4.0a A 74.7bc B 75.7a B 85.0a A 264.1c C 306.2e B 338.7c A
2.0 (8) 4.5a A 4.2a A 4.5a A 77.7b AB 65.4a B 85.0a A 280.8b C 348.9b B 371.0a A
2.0 (12) 3.1ab A 4.3a A 5.1a A 76.7b A 67.7a A 80.3a A 285.4a C 338.4c B 356.1b A
Lacc. Sources
2.0 (2) 2.5a A 5.5a A 5.9a A 73.6b A 72.9a A 83.4a A 250.0b B 366.4a A 365.7ab A
CHI (2) 2.5a A 7.3a A 4.3a A 78.5a AB 73.1a B 84.5a A 275.9a B 359.6b A 355.1b A
CHU (2) 3.4a A 8.0a A 79.0a AB 73.9a B 248.6b C 313.4c B
Cont. Appl
2.0 (2) 2.5a A 5.5a A 5.9a A 73.6a A 72.9a A 83.4a A 250.0a B 366.4a A 365.7a A
CHU (2) 3.4a A 8.0a A 14.8a A 79.0a AB 73.9a B 86.3a A 248.6a C 313.4b B 373.4a A
†Means within a column in a treatment group (treatment effect) followed by the same lowercase letter are not significantly different
according to LSD at α=0.05.
‡ Means within a row in a treatment group (duration effect) followed by the same uppercase letter are not significantly different
according to LSD at α=0.05.

178
Fig. 7.1 Thatch layer thickness (TLT) in mm at six, twelve, and eighteen months after treatment initiation on creeping bentgrass with
cultural management and laccase treatments (Fig 7.1A); rate of laccase application (7.1B); frequency of application of laccase (Fig
7.1C); and laccase sources (Fig 7.1D). Values are means of four replicates. Same letter within the bars (6 months = lowercase
standard, 12 months = lowercase bold, and 18 months = lowercase italics) and same letter on top of the bars (duration effect =
uppercase bolded) are not considered to be statistically different according to Fisher’s protected LSD at α = 0.05.
a b b b b a b b b b a b b b b
0
5
10
15
20
25
Control 2.0 (2) 2.0 (4) 2.0 (8) 2.0 (12)
mm
Frequency of application of laccase (weeks)
C 6 Months12 Months18 Months
A
B B
A
B
A
B
A B B A
B B
AB AB
a b b b b a b bc d cd a b b b b
0
5
10
15
20
25
Control 0.5 (2) 1.0 (2) 2.0 (2) 4.0 (2)
mm
Rate of laccase application (units cm-2)
B 6 Months
12 Months
18 Months
A
A A B B
AB B B B
B B AB
A A
A
a b b a b b a b b
0
5
10
15
20
25
Control SA (2) CHI (2)m
m
Laccase sources
D 6 Months
12 Months
18 Months
A
B
A
B
A B B
AB AB
a
a a a ab a ab c b c bc a bc
0
5
10
15
20
25
Control CMC 2.0 (4) CMC+2.0 (4)
mm
Cultural management and laccase treatments
A Sand
B B
B
A
A A A
A A A
A
AB

179
Fig. 7.2 Extractive-free total lignin content (LT) in mg·g-1
at six, twelve, and eighteen months after treatment initiation on creeping
bentgrass with cultural management and laccase treatments (Fig 2A); rate of laccase application (Fig 2B); frequency of application of
laccase (Fig 2C); and laccase sources (Fig 2D). Values are means of four replicates. Same letter within the bars (6 months = lowercase
standard, 12 months = lowercase bold, and 18 months = lowercase italics) and same letter on top of the bars (duration effect = uppercase bolded)
are not considered to be statistically different according to Fisher’s protected LSD at α = 0.05.
a b c d a b c bc a a d c b b a
0
100
200
300
400
500
Control 0.5 (2) 1.0 (2) 2.0 (2) 4.0 (2)
mg
·g-1
Rate of laccase application (units cm-2)
B 6 Months12 Months18 Months
C
A A A A A A C
C C
B
B B B
B
a c b a a d ab c a bc cd a d b bc
0
100
200
300
400
500
Control 2.0 (2) 2.0 (4) 2.0 (8) 2.0 (12)
mg
·g-1
Frequency of application of laccase (weeks)
C 6 Months
12 Months
18 Months
B B
B B
B A A
A A A A
A
C C C
b a c a b b c a b ab a a
0
100
200
300
400
500
Control CMC 2.0 (4) CMC+2.0 (4)
mg
·g-1
Cultural management and laccase treatments
A 6 Months
12 Months
18 Months
B C
C C B B B A A A A A
a b a b a a c ab b
0
100
200
300
400
500
Control SA (2) CHI (2)
mg
·g-1
Laccase sources
D 6 Months
12 Months
18 MonthsA A A A
A B
B B C

180
Fig. 7.3 Thatch layer thickness (TLT) in mm at six, twelve, and eighteen months after treatment
initiation on creeping bentgrass with laccase treatments 0 (control), and 2.0 (2) for six months in
year one, CHU (2) for six months in year one and six months in year two. Values are means of
four replicates. Same letter within treatment (6 months = lowercase standard, 12 months =
lowercase bold, and 18 months = lowercase italics) are not considered to be statistically different
according to Fisher’s protected LSD at α = 0.05.
Fig. 7.4 Extractive-free total lignin content (LT) in mg·g-1
at six, twelve, and eighteen months
after treatment initiation on creeping bentgrass with laccase treatments 0 (control), and 2.0 (2)
for six months in year one, CHU (2) for six months in year one and six months in year two.
Values are means of four replicates. Same letter within treatment (control = lowercase standard,
2.0 (2) = lowercase bold, and CHU (2) = lowercase italics) and same letter on top of the bars
(duration effect = uppercase bolded) are not considered to be statistically different according to
Fisher’s protected LSD at α = 0.05.
a a a
b b
b
b b c
0
5
10
15
20
25
0 6 12 18
mm
Laccase application duration (months)
Control
2.0 (2)
CHU (2)
a b c b a b b b a
0
100
200
300
400
500
6 12 18
mg·g
-1
Laccase application duration (months)
Control 2.0 (2) CHU (2)
A B
C B C
A A A B

181
CHAPTER VIII
LIGNIN REMOVAL FROM SWEET SORGHUM AND SWITCHGRASS BIOMASS
USING LACCASE MEDIATOR SYSTEM6
6 Sidhu, S.S., P.L. Raymer, and Q. Huang. To be submitted to Bioresource Technology.

182
ABSTRACT
Lignocellulosic materials are renewable resources for bioethanol production from sugars.
Pretreatment of lignocellulosic materials is a necessary element in bioconversion of cellulosic
and hemicellulosic sugars to ethanol. Removal of lignin from lignocellulosic biomass was
optimized by laccase-mediator system. A 300 mg sample of sweet sorghum and switchgrass in a
50 mL Erlenmeyer flask was subjected to 20 mL reaction mixture of laccase or laccase mediator
system (LMS). Activity of laccase enzyme in the reaction mixture was 10 units mL-1
along with
varying concentrations of one of the three mediators; HBT (1-hydroxybenzotriazole), violuric
acid (5-isonitrosobarbituric acid), and ABTS (2, 2'-azino-bis (3-ethylbenzothiazoline-6-sulphonic
acid). The concentration of HBT and ABTS in the reaction mixture was 0, 0.13, 0.25, 0.31, 0.63,
1.25, and 1.88 mM and violuric acid concentration was 0.31, 0.63, 1.25, and 1.88 mM to
optimize the mediator concentration for maximum lignin removal. A 5-8% and 5-14% lignin
removal was observed sweet sorghum and switchgrass, respectively after 24 h treatment with
laccase-ABTS system. A 25.5% lignin removal at 1.88 mM HBT and 24% at 1.25 mM VA after
24 h treatment was observed in sweet sorghum. Similarly, in switchgrass a 28% lignin removal
at 0.63 mM VA in combination with laccase was observed after 24 h treatment. A slight loss is
structural sugars were observed at treatments with enzymatic treatments. The optimum mediator
concentration for maximum removal of lignin changed with mediators and lignocellulosic
biomass.
INTRODUCTION
Population growth and industrial development has led to increased energy consumption
in the world, which has increased 17-fold over the period of last 100 years (Ayhan, 2007). The
conventional energy resources like fossil fuels are limited in quantity and cannot meet the

183
increasing energy demand, besides having a considerable negative environmental impact such as
emitting greenhouse gases like carbon dioxide. Use of alternate and renewable energy options
like biofuels have several advantages such as lower CO2 emissions and lesser dependency of
non-oil producing nations for crude oil imports, and has thus drawn widespread attention.
Lignocellulosic materials are heterogeneous complexes of cellulose, hemicellulose and
lignin. Removal of lignin from plant cell wall opens up the structure of lignocellulosic biomass
and leads to opening of the pore-space in the cell wall structure and thus increase cellulose
accessibility for further hydrolysis(Conte et al., 2009; Fang et al., 2010; Kaparaju et al., 2009;
Kerr, 1975; Matsushita et al., 2009). Lignocellulosic biomass has to undergo a pretreatment for
bioconversion of polymeric sugars to monomers and further fermentation to ethanol (Cheng et
al., 2008). Pretreatment recognized as a key step in the bioethanol conversion process must
improve the availability of sugars (both cellulosic and hemicellulosic) from enzymatic
hydrolysis, prevent loss of sugars or carbohydrates, and avoid formation of chemical inhibitors
for subsequent hydrolysis and fermentation processes.
The several methods that have been used as pretreatment till date include dilute acid
hydrolysis, wet oxidation, and steam explosion. However, commonly known disadvantages are
associated with the existing pretreatment methods including loss of carbohydrates (Abatzoglov et
al., 1986; Bouchard et al., 1989; Bouchard et al., 1992; Conner et al., 1985), modification of
cellulose polymers or oligomers (Abatzoglov et al., 1986; Bouchard et al., 1989; Mok et al.,
1992; Qian et al., 2005), and re-polymerization reaction among carbohydrates by products and
lignin intermediates (Li et al., 2007; Xiang et al., 2004).
Natural degradation of lignin is carried out in the environment by certain white-rot fungi
which solubilize and mineralize lignin with the help of lignolytic enzymes (Kirk et al., 1975;

184
1976). White-rot fungi preferentially attack lignin more than cellulose or hemicellulose in the
wood tissue (Blanchette, 1984).
Laccase is one of the lignolytic enzymes secreted during oxygen dependent degradation
of organic material by white-rot fungi (Ten Have and Teunissen, 2001). Low oxidation potential
of laccase restricts its ability to oxidize non-phenolic lignin components (Kersten et al., 1990;
Ten Have and Teunissen, 2001). However, addition of low molecular weight substances,
mediators, increases the substrate range of laccase enzyme to non-phenolic groups, benzyl and
alyl alcohols and ethers (Bourbonnais and Paice, 1992; Bourbonnais et al., 1997; Crestini and
Argyropoulos, 1998; Fabbrini et al., 2002; Fabbrini et al., 2001) which comprise the major
moieties in lignin macromolecule (Fritz-Langhals and Kunath, 1998; Johannes and Majcherczyk,
2000; Potthast et al., 1995).
In laccase mediator system, the oxidized mediator with a higher redox potential than
laccase, acts on the substrate to carry outs its oxidation (Cantarella et al., 2003). Oxidation of
organic substrates in laccase-mediator system can proceed by two different mechanisms
(Cantarella et al., 2003). In case of mediators like ABTS, the oxidation of substrate is carried out
by single electron oxidation, whereas for N-OH type mediators like HBT and violuric acid, the
oxidation is carried out by abstraction of H atom by a >N-O radical species.
There are several studies indicating that mediators enhance the oxidation of substrate of
laccase (Kang et al., 2002; Kim and Nicell, 2006; Tsutsumi et al., 2001). However, little has
been done to optimize the use of mediators in lignin removal from lignocellulosic biomass. We
hypothesize that the use of lignin-degrading enzyme such as fungal laccases when applied along
with mediators can effectively reduce lignin content from lignocellulosic biomass and our study
was designed to test two specific hypothesis: 1) degradation of lignin can be enhanced by

185
laccase-mediator system; and 2) Different mediators have different optimum effectiveness in
reducing lignin.
MATERIALS AND METHODS
Biomass Preparation
The sweet sorghum [Sorghum bicolor L., PI 17077) and switchgrass (Panicum virgatum
L.) biomass were obtained from Dr. M. L. Wang’s USDA laboratory at The University of
Georgia, Griffin Campus. The biomass sample was ground (177-841 µm) and extracted with
water and alcohol to remove water-and alcohol-soluble extractives as specified by the protocol
developed by National Renewable Energy Laboratory (NREL, 2008a). The extractive-free
biomass samples were air-dried to a moisture level less than 10% before treatment application.
Chemicals
Laccase used in the experiment was obtained from Jiangnan University, China. The
enzyme was purified from a laccase producing fungal strain Pycnoporus sp. JL-N with accession
number GU 182936. Three mediators used in the experiment; HBT (1-hydroxybenzotriazole),
violuric acid (5-Isonitrosobarbituric acid), and ABTS (2,2'-azino-bis(3-ethylbenzothiazoline-6-
sulphonic acid) along with surfactant, Pluronic F-68 (polyoxyethylene-polyoxypropylene
polymer,C3H6O.C2H4O) were purchased from Sigma-Aldrich (Sigma Aldrich Inc., St. Louis,
MO.).
Laccase Activity Assay
The activity of laccase was quantified using a UV/VIS-spectrophotometer by a
colorimetric assay. One activity unit of laccase corresponds to the amount of enzyme that causes
an absorbance change at 468 nm at a rate of 1.0 unit min-1
in 3.4 mL of 1 mM 2,6-
dimethoxyphenol in citrate-phosphate buffer at a particular pH (Park et al., 1999). Laccase

186
enzyme activity was assayed over a range and was found to be most active at pH 3.0 in the initial
laboratory tests conducted to optimize the pH for this enzyme (Fig 1).
Enzymatic Treatment
The reaction mixture consisted of lignocellulosic biomass, surfactant, laccase, citrate-
phosphate buffer at pH 3.0, and mediators. A 300 mg extractive-free biomass sample of sweet
sorghum and switchgrass was collected in a 50 mL Erlenmeyer flask and was allowed to stand
overnight in a 10 mL solution (3% w/w) of surfactant, Pluronic F-68. Effectiveness of laccase
enzyme was observed at activity level of 0, 2, 5, 10 and 20 units mL-1
in the reaction mixture.
Laccase mediator system consisted of laccase at 10 units mL-1
along with one of the three
mediators. The concentration of HBT and ABTS in the reaction mixture was 0.13, 0.25, 0.31,
0.63, 1.25, and 1.88 mM and violuric acid concentration was 0.31, 0.63, 1.25, and 1.88 mM to
examine the effect of mediator concentration on lignin removal. The reaction mixture was put on
rotary shaker at 150 rpm at 25oC. Samples were removed from the reaction mixture after 24, 48,
and 72 h and were washed three times with 100 mL water.
Measurements
After enzymatic treatment the samples were dried and weighed to observe dry mass loss.
The effectiveness of treatments was determined by measuring acid-soluble lignin (LS) and acid-
insoluble lignin (LI) and structural sugars. The lignin and sugar content will be designated as
extractive-free lignin and extractive-free structural sugar content due to the use of extractive-free
biomass for the experiment. Total lignin (LT) was obtained by addition of acid-soluble and-
insoluble lignin contents.

187
Extractive-free Lignin Content
Lignin content in the sweet sorghum and switchgrass biomass was determined in a two-
step hydrolysis procedure according to the laboratory analytical procedure developed by The
National Renewable Energy Laboratory (NREL, 2008b). In the first step, 100 mg of air dried
treated biomass samples were hydrolyzed for 60 min with 1mL of 72% H2SO4 at 30oC in a water
bath. In the second step, H2SO4 was diluted to 4% and the samples were autoclaved at 121oC for
1 h. After autoclave the samples were vacuum filtered and the hydrolysis liquid was used for
analyzing acid-soluble lignin content and structural sugars. Acid-soluble lignin was determined
using this hydrolysis liquid at 240 nm wavelength in a UV/VIS spectrophotometer. The solids
remaining after acid hydrolysis were dried in an oven at 100 ± 5oC for 24 h, weighed, ashed in a
muffle furnace at 600 ± 10oC for 24 h, and weighed again. Weight difference was used to
calculate the extractive-free acid-insoluble lignin content.
Structural Sugars
Structural sugar content for glucose, xylose, arabinose, mannose, and galactose was
determined for selected samples from the hydrolysis liquid collected after vacuum filtration in
the above step. The hydrolysis liquid was neutralized to a pH range 6.0-8.0 using NaHCO3
(sodium bicarbonate) and structural sugars were determined using high performance liquid
chromatography (HPLC) in an Agilent 1100 HPLC (Aligent Technologies, Waldbronn,
Germany) with a binary pump and a refractive index detector. An AMINEX HPX-87P 7.8 x 300
mm Pb2+
carbohydrate analysis column (Bio-Rad, Hercules, CA) was used at 85oC with
deionized water as mobile phase at a flow rate of 0.6 mL min-1
. These monosaccharide sugars are
components of structural polysaccharides, cellulose and hemicellulose. Total sugars were
calculated by addition of the sugar contents of these monomers.

188
Statistical Analysis
Analysis of variance (ANOVA) was performed to evaluate the main effects of laccase,
mediator, and interaction effects of these two factors using general linear model (GLM) (SAS
Institute, 1989). Fisher’s protected LSD test with α = 0.05 was used for determining statistical
differences among treatment means following each ANOVA.
RESULTS
Lignin Content
Laccase Application
Treatment of sweet sorghum and switchgrass with different levels of laccase for 24 h had
no effect on extractive-free acid-insoluble and total lignin content (Table 8.1). However, slight
but significant differences were observed for LS content (Table 8.1). A slight increase in LS
content (P ≤ 0.05) of sweet sorghum was obtained when reaction mixture consisted of laccase
enzyme at 20 units mL-1
whereas in switchgrass a slight reduction in LS content (P ≤ 0.05) was
observed in reaction mixture containing 5 units mL-1
laccase activity level as compared to the
control (Table 8.1).
Laccase-ABTS Mediator System
A significant effect (P ≤ 0.001) of laccase-ABTS system was observed on LS, LI and LT
content of sweet sorghum and switchgrass. After 24 h of laccase-ABTS treatment, LS content of
sweet sorghum increased by 8.9 (23%), 15.8 (41%), and 24.7 (65%) mg·g-1 over the control with
ABTS concentration of 0.63, 1.25, and 1.88 mM, respectively when applied along with laccase
(Fig 8.1A). However, when compared with control, LI content decreased by 8.0 (5%), 19.4
(11%), 37.7 (21%), and 23.7 (13%) mg·g-1 in reaction mixture containing laccase along with
ABTS at 0.31, 0.63, 1.25, 1.88 mM, respectively (Fig 8.1B). A slight reduction of 5 and 8% in

189
total lignin content when compared to control was obtained when ABTS was applied at 0.63 and
1.25 mM along with laccase (Table 8.2).
Switchgrass biomass treated with laccase-ABTS system showed a slight but significant
reduction in LS content up to ABTS concentration of 0.31 mM when applied along with laccase.
Extractive-free acid soluble content increased over the control by 2.3, 4.2, and 4.8 mg·g-1 when
with ABTS concentration of 0.63, 1.25, and 1.88 mM, respectively, in the reaction mixture
containing laccase (Fig 8.2A). Extractive-free acid-insoluble lignin content of switchgrass
biomass was lowered by 9.4, 13.4, 14.4, 16.7, 22.4, and 41.2 mg·g-1 when ABTS concentration
was 0.13, 0.25, 0.31, 0.63, 1.25, and 1.88 mM, respectively, in the presence of laccase (Fig
8.2B). Similarly, LT content in switchgrass biomass decreased in the range of 12.2 (5%) and 36.4
(14%) mg·g-1 in comparison with control for the same concentration of ABTS (Table 8.2).
Reaction mixture containing ABTS at different concentrations without laccase had no effect on
acid-soluble and-insoluble lignin content in sweet sorghum and switchgrass (Fig 8.1A, 8.1B and
Fig 8.2A, 8.2B).
Duration of laccase-ABTS system had no effect on LS content in sweet sorghum for
ABTS concentration of 0.25, 0.31, and 1.25 mM (Table 8.3). After 48 and 72 h of treatment at
ABTS concentration of 0.63 mM, a reduction in LS content was observed (Table 8.3). However,
a reduction in LS content was observed with increase in treatment duration switchgrass biomass
when ABTS concentration was 0.63mM or higher in laccase-ABTS system (Table 8.4). No
duration effect was observed for LI content in sweet sorghum for ABTS concentrations of 0.25
and 1.25 mM (Table 8.3). When ABTS was applied at 0.31 and 0.63 mM in presence of laccase,
LI content significantly decreased from 168.6 to 157.7 and 157.2 to 138.4 mg·g-1 when measured
after 24 and 72h (Table 8.3). Similarly, LT content in sweet sorghum decreased from 210.6 to

190
201.4, 209.9 to 197.7, and 204.2 to 182.4 mg·g-1 when measured after 24 and 72h at ABTS
concentration of 0.25, 0.31, and 0.63 mM, respectively (Table 8.3). In switchgrass biomass a
significant duration effect was observed for LI and LT content at ABTS concentration of 0.63 and
1.25 mM (Table 8.4). A reduction of 14.7 and 16.1 mg·g-1 and 17.4 and 18.7 mg·g-1
was obtained
for LI and LT content in switchgrass when measured after 24 and 72h at ABTS concentration of
0.63 and 1.25 mM (Table 8.4).
Laccase-HBT Mediator System
Laccase-HBT system had significant effects (P ≤ 0.001) on LS, LI and LT content of
sweet sorghum and switchgrass. After 24 h of treatment with laccase along with HBT mediator
up to concentration of 0.63 mM, a reduction in the range of 1.5-2.2 mg·g-1 in LS content was
obtained in sweet sorghum (Fig 8.3A). No reduction in LS content was observed with higher
HBT content (Fig 8.3A). HBT application without laccase had no significant effect on the LS
content when compared to control (Fig 8.3A). Extractive-free acid-insoluble content of sweet
sorghum was significantly lowered by 13.3 (8%), 27.4 (16%), 31.8 (18%), 41.7 (24%), 49.2
(28%), and 55.1 (31%) mg·g-1 with HBT concentration of 0.13, 0.25, 0.31, 0.63, 1.25, and 1.88
mM, respectively when applied along with laccase (Fig 8.3B). A slight reduction in LI content
was observed when sweet sorghum was treated with 0.63 mM concentration of HBT without
laccase. A 25.5% reduction in total lignin content of sweet sorghum was observed when HBT
was applied at concentration of 1.88 mM along with laccase enzyme (Table 8.2).
A significant reduction in LS content in switchgrass was observed in the range of 6.5-6.8
mg·g-1 when treated with HBT alone at all the concentrations (Fig 8.4A). When HBT was
applied with laccase LS content was lowered by 7.2, 7.4, and 8.1 mg·g-1 at HBT concentration of

191
0.13, 0.25, and 0.31, respectively. However, at HBT concentration of 1.25 and 1.88mM along
with laccase, a significant increase in LS content was observed (Fig 8.4A). No effect of HBT
alone was observed on LI content of switchgrass. However, LI content was significantly lowered
by 9.7, 11.9, 15.9, 18.5, and 25.1 mg·g-1 at HBT concentration of 0.25, 0.31, 0.63, 1.25, and 1.88,
respectively when compared to control (Fig 8.4B). Similarly, LT content was lowered by 9.9
(4%), 16.8 (6%), 20.1 (8%), 19.5 (8%), 15.9 (6%), and 23.9 (9%) mg·g-1 when compared to
control at HBT concentration of 0.13, 0.25, 0.31, 0.63, 1.25, and 1.88 mM, respectively when
applied with laccase enzyme (Table 8.2).
A slight but significant decrease in LS content was observed for sweet sorghum between
24 and 72 h at HBT concentration of 0.31 mM (Table 8.3). Similarly, LI content of sweet
sorghum decreased by 14.5 and 7.5 mg·g-1 and LT content decreased by 14.1 and 7.8 mg·g-1
when measured between 24 and 72 h at HBT concentration of 0.31 and 0.63 mM (Table 8.3).
However, for switchgrass not significant duration effect was observed for LS, LI, and LT except a
slight reduction in LS content with duration at HBT concentration of 0.63 mM (Table 8.4).
Laccase-VA Mediator System
A significant treatment effect (P ≤ 0.001) of laccase-VA system was observed on LS, LI
and LT content of sweet sorghum and switchgrass. After 24 h of laccase-VA treatment of sweet
sorghum, no effect on LS content was observed with application of VA without laccase.
However, a 1.9-7.5 mg·g-1 (5-20%) increase in LS content was observed over control when VA
was applied along with laccase at concentrations 0.63 to 1.88 mM (Fig 8.5A). Extractive-free
acid-insoluble lignin (LI) content of sweet sorghum biomass was not affected when reaction
mixture consisted of mediator without laccase enzyme. In the presence of laccase, LI content of
sweet sorghum was lowered by 38.9 (22%), 45.5 (26%), 53.6 (30%), and 52.6 (29%) mg·g-1

192
when compared to control at VA concentration of 0.31, 0.63, 1.25, and 1.88 mM, respectively
(Fig 8.5B). At the same VA concentrations with laccase in the reaction mixture, reduction in LT
content were 38.5, 46.7, 50.7, and 45.1 mg·g-1 representing 18, 22, 24, and 21% reduction,
respectively (Table 8.2).
After 24 h of treatment of switchgrass biomass with VA without laccase, a significant
decrease in LS content in the range of 7.5-8.8 mg·g-1 was observed when compared to the control
(Fig 8.6A). When applied along with laccase, a slight decrease in LS content (21%) was observed
at VA concentration of 0.31 mM when compared to control (Fig 8.6A). At VA concentration of
0.63-1.88 mM, LS content increased by 1.3-3.5 mg·g-1 over the control (Fig 6A). No effect of VA
was observed on switchgrass biomass LI content when treated without laccase enzyme (Fig
8.6B). When applied along with laccase, a significant reduction in LI content was observed for
all the concentrations of VA (Fig 8.6B). However, the maximum reduction in LI content was 75
(34%) mg·g-1 when compared to control at VA concentration of 0.63 mM (Fig 8.6B). With
increasing concentration of VA, the extent of LI reduction was lowered. Similarly, the maximum
reduction in extractive-free total lignin content in switchgrass amounted to 73.2 (28%) mg·g-1
obtained when VA at 0.63 mM was applied along with laccase enzyme (Table 8.2). At higher
VA concentrations, the impact on lignin reduction decreased significantly (Table 8.2).
A significant reduction in sweet sorghum LS content was observed when reaction time for
laccase-VA system was increased from 24 to 72 h at VA concentration of 0.31 and 0.63 mM
(Table 8.3). However, no further reduction in LI content of sweet sorghum was obtained with
increase in reaction time (Table 8.3). An overall decrease of 20 mg·g-1 in sweet sorghum LT
content was obtained with the duration of reaction at VA concentration of 0.31 mM (Table 8.3).

193
No significant effect of laccase-VA system duration effect was observed for switchgrass LI and
LT content at any VA concentration (Table 8.4). However, a reduction in LS content of
switchgrass was obtained with increased duration for VA concentration of 0.63, 1.25, and 1.88
mM (Table 8.4).
Structural Sugars
Structural sugar content (ST) in treated sweet sorghum biomass was lowered by 20-40
mg·g-1 in comparison to control when ABTS was applied along with laccase enzyme at 0.63,
1.25, 1.88 mM concentration (Table 8.5). At the same ABTS concentrations a slight but non-
significant reduction in structural sugar content was obtained (Table 8.5). However no further
reduction in sugar content was observed for both species when reaction time increased from 24 h
to 72 h (data not shown). A 24-34 and 23-31 mg·g-1 reduction in structural sugar content in
comparison to control was observed for sweet sorghum and switchgrass, respectively when
treated with the laccase-HBT system consisting of HBT at 0.63, 1.25, and 1.88 mM. No
reduction in sugar content was observed with increase in treatment duration from 24 h to 72 h at
the same HBT concentrations. Laccase-VA system consisting of the same VA concentrations
significantly reduced sugar content in sweet sorghum when compared to control at VA
concentration of 1.88 mM (Table 8.5). However, ST content in treated switchgrass was reduced
at VA concentrations of 0.63 (62.6 mg·g-1) and 1.25 mM (18.6 mg·g-1
) compared to the control.
Dry Mass Loss
Weight loss in sweet sorghum and switchgrass was measured after the enzymatic
treatments. A weight loss of 35-49, 70-78, and 63-69 mg·g-1 in comparison to control were
observed in sweet sorghum for ABTS, HBT, and VA mediator system, respectively (Fig 8.7A).
Similarly, 51-81, 53-56, and 56-63 mg·g-1 loss in switchgrass weight was obtained when

194
compared to control after treatment with ABTS, HBT, and VA mediator system, respectively
(Fig 8.7B). Loss in sweet sorghum and switchgrass weight after enzymatic treatment were
calculated by addition of total lignin removal and structural sugar loss. Calculated and measured
weight loss for both species is similar for HBT and VA mediator systems. However, for ABTS
mediator system, calculated and measured weight loss in switchgrass are better related when
weight loss due to acid-insoluble lignin is considered instead of the total lignin (Fig 8.7B).
DISCUSSION
Treatment of biomass with laccase without a mediator was not effective in removal of
lignin from both biomass sources. Laccase-mediator system was effective in decreasing lignin
content from the two biomass sources; however the efficacy of different mediators was different
in different biomass species for LS and LI. The efficiency of laccase mediator system to remove
lignin can be attributed to the high oxidation potential of the oxidized mediator and the small size
of the mediators in comparison to laccase which makes it easier for them to reach deep within
biomass structure to oxidize lignin bonds (Bourbonnais et al., 1997).
No significant reduction in LS content was observed in sweet sorghum when ABTS
concentration was 0.31 mM or less (Fig 8.1A). However, in switchgrass a significant reduction
was observed at the same concentrations (Fig 8.2A). Optimal concentration for LI removal was
1.25 and 1.88 mM for sweet sorghum and switchgrass, respectively. In sweet sorghum 8% total
lignin reduction was obtained at 1.25 mM as compared to 14% in switchgrass at 1.88 mM
concentration of ABTS when applied with laccase enzyme (Fig 8.1B, Fig 8.2 B).
Optimum HBT concentration in the presence of laccase for LS content reduction was up
to 0.63 and 0.31 mM in sweet sorghum and switchgrass, respectively (Fig 8.3A, Fig 8.4A).
Optimum reduction of LI in both grass species was observed at 1.88 mM concentration in the

195
presence of laccase. Laccase-HBT system was more effective in reducing LI content in sweet
sorghum (31%) as compared to switchgrass (12%) (Fig 8.3B, Fig 8.4B). Extractive-free total
lignin content was lowered in sweet sorghum at 1.88 mM HBT along with laccase whereas LT
content in switchgrass decreased when HBT concentration in the reaction mixture was in the
range of 0.25-1.88 mM along with laccase (Table 8.2).
When VA was applied along with laccase, an increase in LS content was observed in
sweet sorghum at concentration 0.63 mM and above (Fig 8.5A). On the other hand, a reduction
in switchgrass LS content was observed at concentration of 0.31 mM and an increase in LS
content was obtained at 0.63 mM concentration or above (Fig 8.6A). The optimum concentration
of VA in laccase-VA system to lower the LI and LT content was 1.25 and 0.63 mM for sweet
sorghum and switchgrass, respectively (Table 8.2, Fig 8.5B, 8.6B).
The different optimum concentrations of the three mediators on the same lignocellulosic
biomass may stem from the difference in the mode of actions of these mediators. ABTS oxidizes
lignin bonds by extraction of electrons whereas HBT and VA abstracts hydrogen atom for
oxidation (Cantarella et al., 2003). Our results suggest that structure of the lignocellulosic
biomass may also influence the extent of lignin removal (Chunxia et al., 2010).
Effect of enzymatic treatment duration on sweet sorghum and switchgrass varied with the
choice of mediator. The duration effect of laccase-ABTS system was observed at different ABTS
concentrations in the two biomass species. The effect was observed at 0.31 and 0.63 mM and
0.63 and 1.25 mM ABTS in sweet sorghum and switchgrass, respectively (Table 8.3, 8.4). It is
seen that with higher ABTS concentration optimum lignin removal reached after 24 h and had no
further duration effect, whereas with lower ABTS concentrations duration effect was shown, but
the amount of delignification is not increased with increase in the reaction time. This may

196
suggest that optimum amount of lignin removal in laccase-ABTS system can be achieved after
24 h with optimum mediator concentration.
The duration effect of laccase-HBT system on sweet sorghum was observed with HBT
concentrations of 0.31 and 0.63 mM for LI and LT contents and with 0.31 mM HBT for LS
content (Table 8.3). However, no significant duration effect for LI and LT contents was observed
at any HBT concentration in switchgrass biomass except a slight reduction in switchgrass LS
content was obtained at 72 h when compared to 24 h at 0.63 mM concentration (Table 8.4).
Laccase-VA system had no duration effect on total lignin content of switchgrass at
different VA concentrations, while a slight reduction of LT content in sweet sorghum was seen at
VA concentration of 0.31 mM VA (Table 8.3, 8.4). This suggests that violuric acid as laccase
mediator functions differently in different biomass species. The duration effect of VA on LS
content was observed at 0.31 and 0.63 mM for sweet sorghum and 0.63, 1.25, and 1.88 mM for
switchgrass.
Different laccase mediators impacted the ST content to different extents on sweet
sorghum and switchgrass. Laccase-ABTS system reduced a ST to a significant extent from the
sweet sorghum but no significant reduction from switchgrass biomass. Laccase-HBT system
impacted ST on both biomass sources to the extent of 23-31 mg·g-1. Laccase-VA system lowered
the sugar content from sweet sorghum at 1.88 mM, but in switchgrass no ST content was
impacted at this concentration (Table 8.5).
CONCLUSIONS
The accessibility of structural sugars in lignocellulosic biomass needs to be improved for
enhancing bioethanol production efficiency. Structural sugar availability for fermentation can be
increased by removing lignin protective matrix. The results from this experiment suggest the

197
efficacy of laccase-mediator system in delignification of sweet sorghum and switchgrass. The
ability of these mediators to remove lignin varied with biomass species. Lignin removal from
sweet sorghum was in the range of 24-25.5% at 1.25 mM VA and 1.88 mM HBT in combination
with laccase after 24 h treatment. In switchgrass, with application of laccase-ABTS system a 5-
14% removal of lignin was observed and 28% lignin removal at 0.63 mM VA in combination
with laccase after 24 h treatments. Future research is needed to study the impact of laccase-
mediator system on overall bioethanol production efficiency.
LITERATURE CITED
Abatzoglov, N., J. Bouchard, E. Chornet, and R.P. Overend. 1986. Dilute acid depolymerization
of cellulose in aqueous phase: Experimental evidence of the significant presence of
soluble oligomeric intermediates. Can. J. Chem. Eng. 64: 781-786.
Ayhan, D. 2007. Progress and recent trends in biofuels. Prog. Energ. Combust. 33: 1-18.
Blanchette, R.A. 1984. Screening wood decayed by white rot fungi for preferential lignin
degradation. Appl. Environ. Microbiol. 48: 647-53.
Bouchard, J., N. Abatzoglou, E. Chornet, and R.P. Overend. 1989. Characterization of
depolymerized cellulosic residues. Wood Sci. Technol. 23: 343-355.
Bouchard, J., R.P. Overend, E. Chornet, and M.-R Van Calsteren, 1992. Mechanism of dilute
acid hydrolysis of cellulose accounting for its degradation in the solid state. J. Wood
Chem. Technol. 12: 335-354.
Bourbonnais, R., and M.G. Paice. 1992. Demethylation and delignification of kraft pulp by
Trametes versicolor laccase in the presence of 2,2′-azinobis-(3-ethylbenzthiazoline-6-
sulphonate). Appl. Microb. Biotechnol., 36: 823-827.

198
Bourbonnais, R., M.G. Paice, B. Freiermuth, E. Bodie, and S. Borneman. 1997. Reactivities of
various mediators and laccases with kraft pulp and lignin model compounds. Appl.
Environ. Microbiol. 63(12): 4627-32.
Bourbonnais, R., M.G. Paice, I.D. Reid, P. Lanthier, and M. Yaghuchi. 1997. Lignin oxidation
by laccase isozymes from Trametes versicolor and role of mediator 2,2’-Azinobis (3-
Ethylbenzthiazoline-6-sulfonate) in kraft lignin depolymerization. Appl. Environ.
Microbiol. 61: 1876-1880.
Cantarella, G., C. Galli, and P. Gentili. 2003. Free radical versus electron-transfer routes of
oxidation of hydrocarbons by laccase/mediator systems: Catalytic or stoichiometric
procedures. J. Mol. Catal. B-Enzym. 22: 135-144.
Cheng, K.K., J.A. Zhang, W.X. Ping, J.P. Ge, Y.J. Zhou, H.Z. Ling, and J.M. Xu. 2008.
Sugarcane bagasse mild alkaline/oxidative pretreatment for ethanol production by
alkaline recycle process. Appl. Biochem. Biotechnol. 15: 43-50.
Chunxia, Lu., H. Wang, L. Yuanming, and L. Guo. 2010. An efficient system for pre-
delignification of gramineous biofuel feedstock in vitro: Application of a laccase from
Pycnoporussanguineus H275. 45: 1141-1147.
Conner, A.H., B.F. Wood, C.G. Hill, and J.F. Harris. 1985. Kinetic model for the dilute sulfuric
acid saccharification of lignocellulose. J. Wood Chem. Technol. 5: 461-489.
Conte, P., A. Maccotta, C. De Pasquale, S. Bubici, and G. Alonzo. 2009. Dissolution mechanism
of crystalline cellulose in H3PO4 as assessed by high-field NMR spectroscopy and fast
field cycling NMR relaxometry. J. Agric. Food Chem. 57: 8748-8752.
Crestini, C., and D.S. Argyropoulos. 1998. The early oxidative biodegradation steps of residual
kraft lignin models with laccase. Bioorg. Med. Chem. 6: 2161-2169.

199
Fabbrini, M., C. Galli, and P. Gentili. 2002. Comparing the catalytic efficiency of some
mediators of laccase. J. Mol. Catal. B-Enzym. 16: 231-240.
Fabbrini, M., C. Galli, P. Gentili, and D. Macchitella. 2001. An oxidation of alcohols by oxygen
with the enzyme laccase and mediation by TEMPO. Tetrahedron Lett. 42: 7551-7553.
Fang, X., Y. Shen, J. Zhao, X. Bao, and Y. Qu. 2010. Status and prospect of lignocellulosic
bioethanol production in China. Bioresour. Technol. 101: 4814-4819.
Fritz-Langhals, E., and B. Kunath. 1998. Synthesis of aromatic aldehydes by laccase-mediator
assisted oxidation. Tetrahedron Lett. 39: 5955-5956.
Johannes, C., and A. Majcherczyk. 2000. Natural mediators in the oxidation of polycyclic
aromatic hydrocarbons by laccase mediator systems. Appl. Environ. Microbiol. 66: 524-
528.
Kang, K.H., J. Dec, H. Park, and J.M. Bollag. 2002. Transformation of the fungicide cyprodinil
by a laccase of Trametes villosa in the presence of phenolic mediators and humic acid.
Water Res. 36: 4907-4915.
Kaparaju, P., M. Serrano, A.B. Thomsen, P. Kongjan, and I. Angelidaki. 2009. Bioethanol,
biohydrogen and biogas production from wheat straw in a biorefinery concept. Bioresour.
Technol. 100: 2562-2568.
Kerr, A.J., and D.A.I. Goring. 1975. The ultrstructural arrangement of wood cell wall. Cellulose
Chem. Technol. 9: 563-573.
Kersten, P.J., B. Kalyanaraman, K.E. Hammel, B. Reinhammar, and T.K. Kirk. 1990.
Comparison of lignin peroxidase, horseradish peroxidase and laccase in the oxidation of
methoxybenzenes. Biochem J. 268: 475-80.
Kim, Y.-J., and J.A. Nicell. 2006. Impact of reaction conditions on the laccase-catalyzed

200
conversion of bisphenol A. Bioresour. Technol. 97: 1431-1442.
Kirk, T.K., W.J. Connors, R.D. Bleam, W.F. Hackett, an J.G. Zeikus. 1975. Preparation and
microbial decomposition of synthetic [14C]ligins. Proc. Natl. Acad. Sci. U S A, 72(7):
2515-2519.
Kirk, T.K., W.J. Connors, and J.G. Zeikus. 1976. Requirement for a growth substrate during
lignin decomposition by two wood-rotting fungi. Appl. Environ. Microbiol. 32: 192-194.
Li, J., G. Henriksson, and G. Gellerstedt. 2007. Lignin depolymerization/repolymerization and
its critical role for delignification of aspen wood by steam explosion. Bioresour. Technol.
98: 3061-3068.
Matsushita, Y., T. Inomata, T. Hasegawa, and K. Fukushima. 2009. Solubilization and
functionalization of sulfuric acid lignin generated during bioethanol production from
woody biomass. Bioresour. Technol. 100: 1024-1026.
Mok, W.S., M.J. Antal, and G. Varhegyi. 1992. Productive and parasitic pathways in dilute acid-
catalyzed hydrolysis of cellulose. Ind. Eng. Chem. Res. 31: 94-100.
NREL- National Renewable Energy Laboratory. 2008a. Preparation of Samples for
Compositional Analysis. Available at: http://www.nrel.gov/biomass/pdfs/42620.pdf
(Verified 01 July, 2012). NREL, Golden, CO, USA.
NREL- National Renewable Energy Laboratory. 2008b. Determination of structural
carbohydrates and lignin in biomass. Available at:
http://www.nrel.gov/biomass/pdfs/42618.pdf (Verified 01 July, 2012). NREL, Golden,
CO, USA.
Potthast, A., T. Rosenau, C.L. Chen, and J.S. Gratzl. 1995. Selective enzymic oxidation of
aromatic methyl groups to aldehydes. J. Org. Chem. 60: 4320-4321.

201
Qian, X., M.R. Nimlos, M. Davis, D.K. Johnson, and M.E. Himmel. 2005. Ab initio molecular
dynamics simulations of β-d-glucose and β-d-xylose degradation mechanisms in acidic
aqueous solution. Carbohydr. Res. 340: 2319-2327.
Ten Have, R., and P.J.M. Teunissen. 2001. Oxidative Mechanisms involved in lignin degradation
by white-rot fungi. Chem. Rev. 101: 3397-3414.
Tsutsumi, Y., T. Haneda, and T. Nishida. 2001. Removal of estrogenic activities of bisphenol A
and nonylphenol by oxidative enzymes from lignin-degrading basidiomycetes.
Chemosphere. 42: 271-276.
Xiang, Q., Y.Y. Lee, and R.W. Torget. 2004. Kinetics of glucose decomposition during dilute-
acid hydrolysis of lignocellulosic biomass. Appl. Biochem. Biotechnol. 113: 1127-1138.

202
Table 8.1 Extractive-free acid-soluble lignin (LS), acid-insoluble lignin (LI), and total lignin (LT) in sweet sorghum and switchgrass
after 24 h of treatment with laccase enzyme at 0, 2, 5, 10, and 20 units mL-1
activity in a 20 mL reaction mixture.
Laccase activity
levels (units mL-1
)
Sweet sorghum Switchgrass
Acid-soluble
lignin (LS)
Acid-insoluble
lignin (LI)
Total lignin
(LT)
Acid-soluble
lignin (LS)
Acid-insoluble
lignin (LI)
Total lignin
(LT)
mg·g-1
0 38.1b† 176.6a 214.7a 43.0a 219.2a 262.2a
2 38.8ab 175.4a 214.2a 42.0ab 218.2a 260.2a
5 38.6ab 175.2a 213.8a 39.1b 221.6a 260.6a
10 38.5ab 175.5a 214.1a 41.3ab 219.0a 260.3a
20 39.2a 174.4a 213.6a 43.5a 221.6a 265.3a
† Means within a column followed by the same letter are not significantly different according to Fisher’s protected LSD at α=0.05.

203
Table 8.2 Total lignin content (extractive-free) in sweet sorghum and switchgrass biomass after
24 h treatment with laccase-mediator system. The 20 mL reaction mixture consisted of laccase at
10 units mL-1
activity with one of the three mediators; ABTS, HBT, and VA at different
concentrations.
Sweet sorghum Switchgrass
Treatment† ABTS HBT VA ABTS HBT VA
mg·g-1
Control 214.7ab‡ 214.7b 214.7a 262.2a 262.2a 262.2a
0+10L 214.1ab 214.1bc 214.1a 260.3a 260.3ab 260.3a
0.12 214.3ab 213.6bc - 263.0a 258.8abc -
0.12+10L 214.4ab 199.0d - 250.6c 252.3cd -
0.25 215.7ab 217.2ab - 260.1ab 258.5abc -
0.25+10L 210.6abc 185.7e - 247.3c 245.0ef -
0.31 215.6ab 216.3ab 209.7a 263.0a 257.3abc 255.8a
0.31+10L 209.9bc 181.4e 176.2b 246.5c 242.1ef 197.7c
0.63 217.7a 209.8c 215.2a 260.1ab 257.2abc 256.5a
0.63+10L 204.2c 170.7f 171.0b 247.8c 242.7ef 189.0d
1.25 216.6ab 220.8a 214.9a 262.5a 257.5abc 259.9a
1.25+10L 196.7d 165.1g 164.0c 244.0c 246.3ed 218.6c
1.88 216.1ab 217.2ab 214.4a 251.9bc 254.9bc 259.0a
1.88+10L 215.7ab 160.4h 169.6bc 225.8d 238.3f 232.8b
† L denotes laccase at 10 units mL-1
activity level
‡ Means within a column followed by the same letter are not significantly different according to
Fisher’s protected LSD at α=0.05.

204
Table 8.3 Extractive-free acid-soluble lignin (LS), acid-insoluble lignin (LI), and total lignin (LT) in sweet sorghum after 24, 48, and 72
h of enzymatic treatment. The 20 mL reaction mixture consisted of laccase at 10 units mL-1
activity with one of the three mediators;
ABTS, HBT, and VA at different concentrations.
--------------------------------------------------------------Duration (hours) ----------------------------------------------------------
Treatments 24 48 72 24 48 72 24 48 72
Acid-soluble lignin (LS) Acid-insoluble lignin (LI) Total lignin (LT)
-------------------------------------------------------------------mg·g-1
----------------------------------------------------------------
ABTS
Control 38.1a† 38.1a 38.2a 176.6a 176.7a 175.1a 214.7a 214.8a 213.4a
0.25 40.5a 39.7a 39.0a 170.2a 166.3a 162.3a 210.6a 206.0ab 201.4b
0.31 41.4a 41.2a 39.5a 168.6a 160.0b 157.7b 209.9a 201.2b 197.2b
0.63 47.0a 45.7b 44.0c 157.2a 147.8ab 138.4b 204.2a 193.4ab 182.4b
1.25 53.9a 54.7a 51.6a 138.8a 141.9a 141.5a 196.7a 196.6a 193.2a
HBT
Control 38.1a 38.1a 38.2a 176.6a 181.7a 182.4a 214.7a 220.2a 220.8a
0.31 36.7a 36.2ab 35.8b 144.7a 140.9a 130.2b 181.4a 177.2a 166.0b
0.63 35.9a 35.6a 35.5a 134.8a 127.1b 127.3b 170.7a 162.7b 162.9b
1.25 37.8a 38.4a 38.1a 127.3a 123.3a 123.8a 165.1a 161.6a 161.8a
1.88 39.0a 38.4a 38.1a 121.4a 121.2a 124.8a 160.4a 159.5a 162.9a
VA
Control 38.1a 38.1a 38.2a 176.6a 177.4a 178.7a 214.7a 215.5a 216.1a
0.31 38.5a 37.7ab 37.2b 137.7a 133.9a 129.0a 176.2a 171.6ab 166.2b
0.63 40.0a 38.6b 38.2b 131.1a 123.4a 121.0a 171.0a 162.0a 159.2a
1.25 40.9a 40.7a 40.3a 123.0a 128.3a 129.7a 164.0a 169.0a 170.0a
1.88 45.7a 44.1a 44.1a 124.0a 126.6a 127.3a 169.6a 170.7a 171.4a
† Means within a row for a parameter followed by the same letter are not significantly different according to Fisher’s protected LSD at
α=0.05.

205
Table 8.4 Extractive-free acid-soluble lignin (LS), acid-insoluble lignin (LI), and total lignin (LT) in switchgrass after 24, 48, and 72 h
of enzymatic treatment. The 20 mL reaction mixture consisted of laccase at 10 units mL-1
activity with one of the three mediators;
ABTS, HBT, and VA at different concentrations.
-------------------------------------------------------------Duration (Hours)----------------------------------------------------------
Treatments 24 48 72 24 48 72 24 48 72
Acid-soluble lignin (LS) Acid-insoluble lignin (LI) Total lignin (LT)
-------------------------------------------------------------------mg·g-1
----------------------------------------------------------------
ABTS
Control 43.0a 42.2a 42.1a 219.2a 217.8a 219.6a 262.2a 260.1a 261.8a
0.25 41.6a 40.3a 40.6a 205.7a 208.8a 203.2a 247.3a 249.1a 243.8a
0.31 41.8a 41.2a 40.7a 204.7a 203.2a 198.8a 246.5a 230.6a 239.5a
0.63 45.3a 44.1b 43.4c 202.4a 196.5a 187.0b 247.8a 240.6b 230.4c
1.25 47.2a 46.2a 44.6b 196.8a 191.2a 180.7b 244.0a 237.4b 225.3c
1.88 47.9a 47.1b 46.6b 177.9a 180.7a 179.7a 225.8a 227.8a 226.3a
HBT
Control 43.0a 42.2a 42.1a 219.2a 217.8a 219.6a 262.2a 260.1a 261.8a
0.31 34.9a 34.5a 34.0a 207.2a 206.4a 204.3a 242.1a 240.9a 238.3a
0.63 39.5a 38.5ab 38.2b 203.2a 204.6a 198.5a 242.7a 243.1a 236.7a
1.25 45.6a 43.5b 43.0b 200.7a 191.9a 193.2a 246.3a 235.4a 236.2a
1.88 44.2a 43.9a 43.2a 194.0a 193.3a 194.7a 238.3a 237.2a 238.0a
VA
Control 43.0a 42.2a 42.1a 219.2a 217.8a 219.6a 262.2a 260.1a 261.8a
0.31 33.8a 34.9a 34.9a 163.9a 176.2a 176.5a 197.7a 211.1a 211.4a
0.63 44.3a 43.1b 42.4c 144.1a 147.5a 149.6a 189.0a 190.6a 191.9a
1.25 46.5a 45.8a 44.4b 172.1a 172.0a 174.1a 218.6a 217.8a 218.4a
1.88 46.1a 45.6a 44.1b 186.7a 178.6a 179.7a 232.8a 224.2a 223.8a
† Means within a row for a parameter followed by the same letter are not significantly different according to Fisher’s protected LSD at
α=0.05.

206
Table 8.5 Extractive-free total structural sugar content (ST) of sweet sorghum and switchgrass
biomass after 24 h of enzymatic treatment. The 20 mL enzymatic treatment mixture consisted of
the three mediators; ABTS, HBT, and VA at concentration of 0.63, 1.25, and 1.88 mM along
with laccase enzyme at 10 units mL-1
.
Treatments† Sweet sorghum Switchgrass
--------------------mg·g-1
-----------------
Control 709.3a‡ 694.8ab
ABTS
0.63+10L 690.9bcd 709.1a
1.25+10L 687.1bcde 677.8bc
1.88+10L 670.9e 679.3bc
HBT
0.63+10L 676.8de 693.8bc
1.25+10L 685.5cde 663.8c
1.88+10L 675.3de 671.3c
VA
0.63+10L 696.1abc 632.2d
1.25+10L 702.1ab 676.2bc
1.88+10L 683.2cde 694.3ab
† L denotes laccase at 10 units mL-1
activity level
‡ Means within a column followed by the same letter are not significantly different according to
Fisher’s protected LSD at α=0.05.

207
Fig. 8.1 Extractive-free acid-soluble lignin content (LS, 8.1A) and acid-insoluble lignin content
(LI, 8.1B) of sweet sorghum after 24 h of enzymatic treatment in a 20 mL reaction mixture with
seven different levels of mediator ABTS 0, 0.13, 0.25, 0.31, 0.63, 1.25, and 1.88 mM with and
without laccase at activity 10 units mL-1
. Values are means of three replicates and error bars
represent standard deviation. Bars with the same letter are not considered to be statistically
different according to Fisher’s protected LSD at α = 0.05.
de de de de de de de de e de d c
b a
0
10
20
30
40
50
60
70
0 0.13 0.25 0.31 0.63 1.25 1.88
mg·g
-1
ABTS (mM)
A Without Laccase
With Laccase
ab ab a a a a a ab ab bc c d
e
d
0
50
100
150
200
0 0.13 0.25 0.31 0.63 1.25 1.88
mg·g
-1
ABTS (mM)
B Without Laccase
With Laccase

208
Fig. 8.2 Extractive-free acid-soluble lignin content (LS, 8.2A) and acid-insoluble lignin content
(LI, 8.2B) of switchgrass after 24 h of enzymatic treatment in a 20 mL reaction mixture with
seven different levels of mediator ABTS 0, 0.13, 0.25, 0.31, 0.63, 1.25, and 1.88 mM with and
without laccase at activity 10 units mL-1
. Values are means of three replicates and error bars
represent standard deviation. Bars with the same letter are not considered to be statistically
different according to Fisher’s protected LSD at α = 0.05.
c c c c c c c d d d d b a a
0
10
20
30
40
50
60
0 0.13 0.25 0.31 0.63 1.25 1.88
mg·g
-1
ABTS (mM)
A Without Laccase
With Laccase
a a ab a ab a bc a bc c cd cd d e
0
50
100
150
200
250
0 0.13 0.25 0.31 0.63 1.25 1.88
mg·g
-1
ABTS (mM)
B Without Laccase
With Laccase

209
Fig. 8.3 Extractive-free acid-soluble lignin content (LS, 8.3A) and acid-insoluble lignin content
(LI, 8.3B) of sweet sorghum after 24 h of enzymatic treatment in a 20 mL reaction mixture with
seven different levels of mediator HBT 0, 0.13, 0.25, 0.31, 0.63, 1.25, and 1.88 mM with and
without laccase at activity 10 units mL-1
. Values are means of three replicates and error bars
represent standard deviation. Bars with the same letter are not considered to be statistically
different according to Fisher’s protected LSD at α = 0.05.
abc cde bc bcd cde abc bc ab f ef def f bc
a
0
10
20
30
40
50
0 0.13 0.25 0.31 0.63 1.25 1.88
mg·g
-1
HBT (mM)
A Without Laccase
With Laccase
bc bc ab ab c ab ab ab
d e e
f g h
020406080
100120140160180200
0 0.13 0.25 0.31 0.63 1.25 1.88
mg·g
-1
HBT (mM)
B Without Laccase
With Laccase

210
Fig. 8.4 Extractive-free acid-soluble lignin content (LS, 8.4A) and acid-insoluble lignin content
(LI, 8.4B) of switchgrass after 24 h of enzymatic treatment in a 20 mL reaction mixture with
seven different levels of mediator HBT 0, 0.13, 0.25, 0.31, 0.63, 1.25, and 1.88 mM with and
without laccase at activity 10 units mL-1
. Values are means of three replicates and error bars
represent standard deviation. Bars with the same letter are not considered to be statistically
different according to Fisher’s protected LSD at α = 0.05.
c
fg fg fg f fg fg d
fgh gh h e
a b
0
10
20
30
40
50
0 0.13 0.25 0.31 0.63 1.25 1.88
mg·g
-1
HBT (mM)
A Without Laccase
With Laccase
a a a a a a a a a b bc bc c d
0
50
100
150
200
250
0 0.13 0.25 0.31 0.63 1.25 1.88
mg·g
-1
HBT (mM)
B Without Laccase
With Laccase

211
Fig. 8.5 Extractive-free acid-soluble lignin content (LS, 8.5A) and acid-insoluble lignin content
(LI, 8.5B) of sweet sorghum after 24 h of enzymatic treatment in a 20 mL reaction mixture with
five different levels of mediator VA 0, 0.31, 0.63, 1.25, and 1.88 mM with and without laccase at
activity 10 units mL-1
. Values are means of three replicates and error bars represent standard
deviation. Bars with the same letter are not considered to be statistically different according to
Fisher’s protected LSD at α = 0.05.
cd d d cd cd c c b b a
0
10
20
30
40
50
0 0.31 0.63 1.25 1.88
mg·g
-1
VA (mM)
A Without Laccase
With Laccase
a a a a a a
b c d d
0
50
100
150
200
0 0.31 0.63 1.25 1.88
mg·g
-1
VA (mM)
B Without Laccase
With Laccase

212
Fig. 8.6 Extractive-free acid-soluble lignin content (LS, 8.6A) and acid-insoluble lignin content
(LI, 8.6B) of switchgrass after 24 h of enzymatic treatment in a 20 mL reaction mixture with five
different levels of mediator VA 0, 0.31, 0.63, 1.25, and 1.88 mM with and without laccase at
activity 10 units mL-1
. Values are means of three replicates and error bars represent standard
deviation. Bars with the same letter are not considered to be statistically different according to
Fisher’s protected LSD at α = 0.05.
a
b b b b
a
b
a a a
0
10
20
30
40
50
0 0.31 0.63 1.3 1.88
mg
·g-1
VA (mM)
A Without Laccase
With Laccase
a a a a a a
c d
c b
0
50
100
150
200
250
0 0.31 0.63 1.3 1.88
mg·g
-1
VA (mM)
B Without Laccase
With Laccase

213
Fig. 8.7 Measured and calculated dry mass loss from sweet sorghum (8.7A) and switchgrass
(8.7B) biomass after 24 h of laccase treatment (10 units mL-1
) in a 20 mL reaction mixture with
two different levels of mediators ABTS, HBT, and VA at 1.25, and 1.88 mM concentration.
0
20
40
60
80
100
ABTS 1.25
+10L
ABTS 1.88
+10L
HBT 1.25
+10L
HBT 1.88
+10L
Vio 1.25
+10L
Vio 1.88
+10L
Dry
mass
loss
(m
g·g
-1)
Enzymatic treatments
7A Measured
Calculated LT+ST
0
20
40
60
80
ABTS 1.25
+10L
ABTS 1.88
+10L
HBT 1.25
+10L
HBT 1.88
+10L
Vio 1.25
+10L
Vio 1.88
+10L
Dry
mass
loss
(m
g·g
-1)
Enzymatic treatments
B Measured
Calculated LT+ST
Calculated LI+ST

214
CHAPTER IX
OVERALL CONCLUSIONS
The greenhouse research demonstrated that direct application of laccase enzyme at 2.06
units cm-2
for nine months on creeping bentgrass every two weeks was effective in slowing the
rate of accumulation of organic matter and thatch layer in highly maintained turf. However, low
activity level of laccase (0.206 units cm-2
) was ineffective in reducing the rate of thatch
accumulation. Laccase application at 2.06 units cm-2
had little effect after two months, but after
nine months significantly reduced organic matter (30.3%), thatch layer (45%), lignin content
(19%) while increasing saturated hydraulic conductivity (322%) relative to control.
Bi-weekly applications of laccase enzyme on dead creeping bentgrass, with a distinct
thatch layer but where new thatch development would not occur, at 2.06 and 20.6 units cm-2
was
effective to cause changes in physical and chemical properties and compositions of the thatch
layer. No reduction in organic matter and sugar content was observed after two months of
treatment; but after six months, 62.0, 24.7, and 29.3% reduction in thatch layer thickness, total
organic matter (0-2.5 cm), and total sugar content, respectively were observed. Application of
laccase for six months increased saturated hydraulic conductivity and acid-insoluble lignin
content by 70.8 and 17.1%, respectively.
The field research to optimize laccase application on creeping bentgrass demonstrated
that a bi-weekly application of laccase for six months at 0.5 units cm-2
is equally effective in
managing thatch as 1.0, 2.0 and 4.0 units cm-2
applied every two weeks. Laccase application
frequency can be reduced to once a month when applied at 2.0 units cm-2
to effectively manage

215
thatch layer accumulation. Organic matter content at 0-2.5 and 2.5-5.0 cm depths was not
affected with application of laccase across different rates and frequencies. Laccase alone did not
influence saturated hydraulic conductivity, but in combination with core aeration and sand
topdressing, saturated hydraulic conductivity increased relative to the control. Laccase
application at 2.0 units cm-2
once in four weeks along with core aeration and topdressing was
effective in lowering thatch layer thickness, organic matter content (0-2.5 cm), acid-soluble
lignin and sugar contents while increasing acid-insoluble lignin content. Laccase enzyme from
different sources was equally effective in thatch layer reduction.
After six months of laccase application on creeping bentgrass, effects of residual laccase
were observed over the next six and twelve months after cessation of laccase treatment across all
rates and frequencies. An average reduction in thatch layer thickness across all laccase rates was
23.5, 25.7, and 23.9% of the control when sampled at 6, 12, and 18 months after start of
treatment. Similarly, thatch layer reduced on an average across all laccase application
frequencies, by 27.8, 25.5, and 19.7% of the control for 6, 12, and 18 month samplings. The field
study demonstrated that application of laccase enzyme for six months once a year would be
effective to reduce the organic matter content and thatch layer thickness.
Laccase enzyme when applied on ultra-dwarf bermudagrass and zoysiagrass once every
two weeks at 2.0 units cm-2
for six months effectively changed properties of the thatch layer of
both grass species. In bermudagrass, a reduction of 24%, 18.2-22.3%, and 12.3 to 13.6% was
observed for organic matter content at depth 0-2.5 cm, thatch layer thickness, and total lignin
content, respectively while increasing saturated hydraulic conductivity (18.8-29.5%) or both
years during two year experiment. In zoysiagrass, a significant reduction in organic matter (0-2.5
cm) content in plots receiving laccase was observed in the first year but not during the second

216
year. Thatch layer thickness and total lignin content decreased by 20.7-29.6% and 10.7-13%,
respectively in both years.
Lignin removal from two lignocellulosic biomasses of sweet sorghum and switchgrass
was optimized using laccase mediator system. A total lignin reduction of 8% with 1.25 mM
ABTS (2, 2'-azino-bis (3-ethylbenzothiazoline-6-sulphonic acid) and 14% with 1.88 mM ABTS
was observed in sweet sorghum and switchgrass, respectively when used with laccase enzyme
after 24 h treatment. Optimum reduction in total lignin after 24 h treatment of laccase-HBT (1-
hydroxybenzotriazole) mediator system was 25 and 9% for sweet sorghum and switchgrass at
HBT concentration of 1.88 mM in the reaction mixture. Violuric acid as a mediator with laccase
was effective in removing total lignin to the extent of 24.6% at 1.25 mM and 28.0% at 0.63 mM
concentration in sweet sorghum and switchgrass, respectively. All three mediators without
laccase enzyme in reaction mixture had no effect on acid-soluble lignin in sweet sorghum while
application of HBT and VA significantly reduced LS content in switchgrass. Enzymatic treatment
was effective in lignin removal from biomass while negligibly effecting sugar content of both
biomass species. The results of this study suggest that laccase mediator system has the potential
to be used as pre-treatment for lignocellulosic biomass for bioethanol production while future
research is needed to observe the downstream process of hydrolysis to observe its impact on
bioethanol production efficiency.
![Decrease of AOX with Various External Effluent Treatments · phite pulp mill [18]. An alternative lignin precipitation process is the lignin removal process (LRF’) [20] which uses](https://img.dokumen.tips/doc/110x75/5f4194da5d981c52071cc730/decrease-of-aox-with-various-external-effluent-treatments-phite-pulp-mill-18.jpg)