Embed Size (px)
Citation preview

Environmentally Sustainable Transport Initiative in Japan
August 23, 2010August 23, 2010 Japan:
Ministry of the EnvironmentMinistry of Land, Infrastructure, Transport and Tourism
11

Table of ContentsTable of Contents
1. Air pollution measures
2. Road Traffic Safety
3 Promotion of utilization of public transportation3. Promotion of utilization of public transportation
4. Cycle Sharing System
5. Mobility Management
6. ITS(Intelligent Transport System)
22
7. Greenhouse Gas Emission Reduction

大気汚染の状況1 Air Pollution Measures大気汚染の状況1. Air Pollution Measures

Air Quality in JapanAir Quality in JapanIn Japan, air pollution levels are constantly measured at the 1,987 nationwide monitoring stations managed by prefectures in accordance with the Air Pollution Control Law. Although air pollution levels have improved in most
SO NO SPM
Although air pollution levels have improved in most regions, some areas (mainly in the Tokyo metropolitan area) need further improvement.
SO2 NO2 SPM0.050
0.060
0 030
0.035
0.040
0.140
0.160
0.180
0.030
0.040
Average:ppm
0.020
0.025
0.030
l Average:ppm
0 080
0.100
0.120
erage:mg per m3
0.010
0.020Annual
0.005
0.010
0.015
Annua
0 020
0.040
0.060
0.080
Annual Av
[Reference] Roadside Air Pollution Monitoring Station 44
0.000
1970 1975 1980 1985 1990 1995 2000 2005
fiscal Year
2008
0.000
1970 1975 1980 1985 1990 1995 2000 2005
fiscal Year
20080.000
0.020
1970 1975 1980 1985 1990 1995 2000 2005
fiscal Year
2008

The level of attainment of environmental quality standards for
Automotive NOx and PM Law Automotive NOx and PM Law Measures
environmental quality standards for NO2 in the Tokyo metropolitan area
ntal
Sta
ndar
ds
80%
100%
• Formulation of each local government’s master plan to reduce exhaust fumes
• Restriction of registration renewal of old model vehicles
• Formulation of each company’s vehicle management
nt o
f Env
ironm
en
20%
40%
60%plan.
Target regions Target regions
The level of attainment of environmental
Atta
inm
en 0%1999 2000 2001 2002 2003 2004 2005 2006 2007 2008
General Monitoring Station Roadside Monitoring Station
FY
quality standards for SPM in the Tokyo metropolitan area
tal S
tand
ards
80%
100%
Aichi/Mie Areas
the Tokyo metropolitan area
t of E
nviro
nmen
t
20%
40%
60%Osaka/Hyogo Areas
55
Atta
inm
ent
(Reference) Guidance for Automotive NOx and PM Low : Ministry of the Environment Ministry of Land, Infrastructure, Transport and Tourism
0%1999 2000 2001 2002 2003 2004 2005 2006 2007 2008
General Monitoring Station Roadside Monitoring Station
FY

Revision of Automotive NOx and PM Law Revision of Automotive NOx and PM Law New measures
(1) Municipal anti-pollution measures• Designation of priority regions for anti-pollution measures by each prefectural governor• Implementation of mandating measures against new construction of particular buildings.
(2) Measures against incoming vehicles( ) g g• Implementation of mandatory measures for freight-forwarding companies in surrounding
areas• Effort obligations by companies
Target areas regulated by the existing laws
Newly expanded target areas for measures (“ Surrounding areas”)
Priority regions for anti-pollution
measures against incoming vehicles
Designation process of surrounding areas
1. Priority regions for anti-pollution measures against incoming vehicles are designated.
incoming vehicles2. Surrounding areas with many
incoming vehicles within the above priority regions are designated.
66Freight-forwarding companies in surrounding areas
Aim to achieve the goal for EQS by 2010 (by the earliest possible time)

Framework for Vehicle Exhaust Emission StandardFramework for Vehicle Exhaust Emission Standard
Air Pollution Control Law
P i ibl li it f hi l h t i iMinistry of the E i t Permissible limit of vehicle exhaust emissionsEnvironment
Road Transport and Motor Vehicle Law
Ministry of Land, Infrastructure
Establishment of exhaust emission standard based on the vehicle safety standardsInfrastructure,
Transport and Tourism
y
No vehicle can be newly registered unless the
77
standards are met.
Vehicle Exhaust Emission ControlVehicle Exhaust Emission ControlChanges in NOx emission Comparison of emission controls
100G li f l d hi l (1973 100)
2005
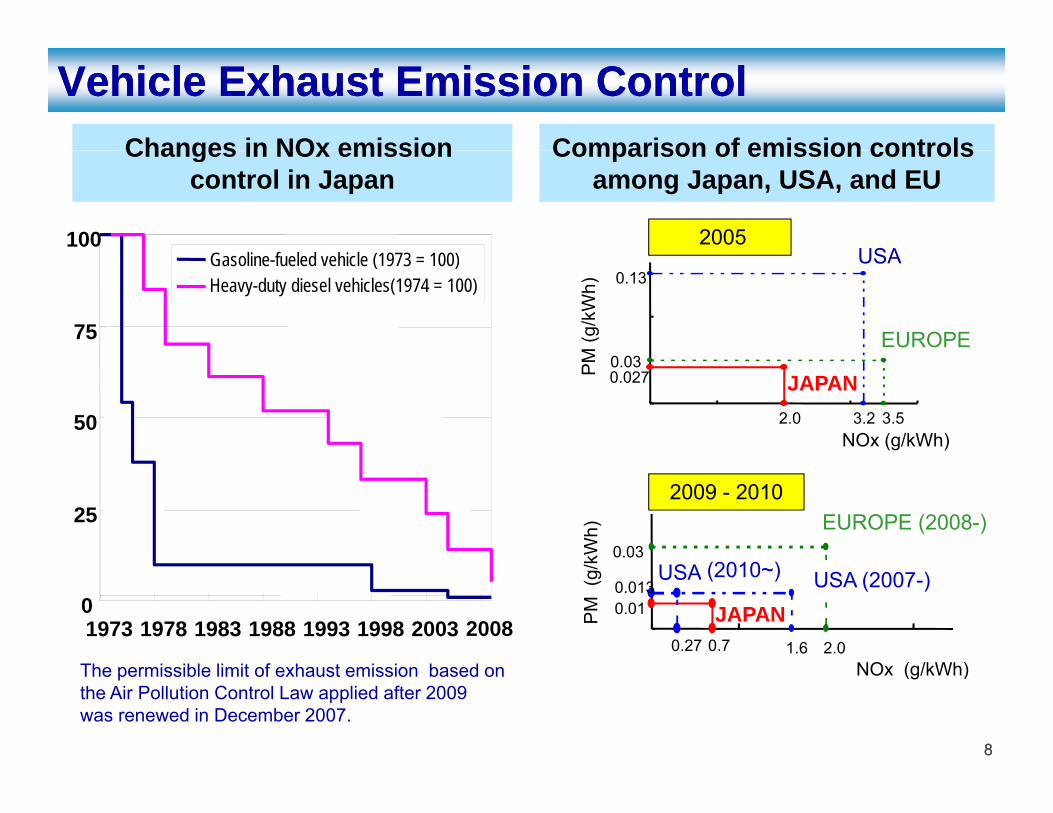
Changes in NOx emission control in Japan
Comparison of emission controls among Japan, USA, and EU
USA
75
Gasoline-fueled vehicle (1973 = 100)Heavy-duty diesel vehicles(1974 = 100) 0.13
M(g
/kW
h)
USA
EUROPE
50NOx (g/kWh)
0.027
2.0 3.2
0.03
3.5
PM
JAPAN
250.03kW
h)
2009 - 2010EUROPE (2008-)
01973 1978 1983 1988 1993 1998 2003 2008
0.7
0.01
0.27
0.013
2.01.6NO ( /kWh)
PM
(g/k
JAPAN
USA (2010~) USA (2007-)
88
NOx (g/kWh)The permissible limit of exhaust emission based on the Air Pollution Control Law applied after 2009 was renewed in December 2007.

Environmental Standards on PMEnvironmental Standards on PM2.52.5PMPM2.52.5PMPM2.52.5 refers to suspended particulates in the air that are smaller than 2.5μm. There are concerns about the health effects of PMPM2.52.5 due to the fact that it can be easily inhaled deeply into the respiratory system and that various harmful substances are absorbed into and attached to the surfaces of those particulates.into and attached to the surfaces of those particulates.
<Sources>
: Large fixed sources, medium and small companies,
Fixed sourcesHuman hair (average particle diameter 70 μm)
PM 2.5 (particle diameter less than 2.5 μm)
small incinerator, people's livelihood etc. (Smoke from plants, Dust generating facilities etc.)
Mobile sources
Human-inducedcauses
SPM (particle diameter less than 10 μm)
: soil particles, sea salt particle, volcanic fume
: Vehicles, Ships, planes Construction, industry, agricultural machinery etc.
Natural causesFine sand on the beaches
Size of particles(Comparison to human hair and fine sand on the beaches)
: Yellow dust is one of the major examples of trans-boundary movement of particulates,
Trans-boundary movement
Japanese environmental standards for PM
Fine sand on the beaches(average particle diameter 90 μm)
(Outline drawing)
99Established in September 2009
Japanese environmental standards for PM2.5Annual average : Less than 15 μg/m3
Daily average: Less than 35 μg/m3

2 Road Traffic Safety2. Road Traffic Safety
1010

Changes in Traffic Accident Statistics in JapanChanges in Traffic Accident Statistics in JapanThe number of traffic-related fatalities in 2009 was 4,914 falling below 5,000 for the first time in 57 d th b d d f i ti57 years, and the number decreased for nine consecutive years. Aim to achieve further reductions in traffic-related fatalities to become the country with the safest roads in the world. The number of traffic accidents and casualties remains high.
16,765 (1970)
FastenSeatbelts
g
Eradication of drinking and driving
Promotion of eco driving(Green driving)
4,914 (2009)Roadimprovements
Other measures
Roads and vehicles
1111

Decrease of fatality rates by fasten seatbeltDecrease of fatality rates as the percentage of personsDecrease of fatality rates as the percentage of personswho fasten seatbelts increases
atbe
lts
Faho
fasten
sea
atality rate (
Percentage of persons who fasten seatbelts Difference in fatality rates (2007)
f persons wh w
hile drivin
Fatality ratey ( )
When fastening seatbelts 0.16%
When not fastening seatbelts 1.53%
: 1.53 per 0.16=9.4times
ercentage of
ng)
p
Pe
1. Source of information: the National Police Agency2. Percentage of persons who fasten seatbelts = Number of persons killed/injured when fastening
1997 1998 1999 2000 2001 2002 2003 2004 2005 2006 2007
1212
g p p / j gseatbelts (while driving) / Number of persons killed/injured (while driving) x 1003. Fatality rate (while driving) = Number of persons killed (while driving) / Number of persons killed/injured (while driving) x 100[Source] White paper on traffic safety 2008, National Police Agency

Road Traffic Safety MeasuresRoad Traffic Safety Measures71% of fatal and injury accidents are concentrated in the 22% of the sections of arterial roads71% of fatal and injury accidents are concentrated in the 22% of the sections of arterial roadsImplement countermeasures from higher priority areas depending on traffic accident rate
1313

大気汚染の状況3 Promotion of utilization of public transport大気汚染の状況3. Promotion of utilization of public transport

Changes in Public Transport Users Changes in Public Transport Users The number of public transport users are declining due to an increase in the rate of use of private vehicles with the progress in motorization. However, the tendency has been recovering in recent years.In particular, as the number of bus users has been significantly decreasing, the future of local public transport is endangered.
80%
90%
100%自家用車
ハイヤー・タクシー
バス
Private vehicles Taxis Buses
50%54% 57% 58% 57% 56%
52%60%
70%
80%バス
鉄道
Buses Trains
42%45%
50%52%
40% 38%33% 32% 32% 33% 34%
35%33%
25%
35% 35% 34%
30%
40%
50%
20%16%
13%11% 9% 8% 7% 7% 7%7%
23%
8% 6%7%7%11%
25%
10%
20%
30%
1515(Reference)Researched by the Ministry of Land, Infrastructure, Transport and Tourism, Policy Bureau,Information Policy Division
8%3%3%4%4%4%5%6%7%7%
0%
1965 1970 1975 1980 1985 1990 1995 2000 2003 2005 2007

Act on Promotion and Restoration of Regional Public TransportAct on Promotion and Restoration of Regional Public Transport
f S E i t l P blNecessities for Promotion and Restoration of Regional Public Transport
Promotion of SightseeingMaintenance of the transport Environmental Problems
Basic GuidelinesBasic GuidelinesFormulation and Implementation of Coordinative Plan ・Duty of the consent for the p
Statutory Committee・Duty of the consent for the request of the participation to the committee
・Public comments・Suggested system
Municipality Public Transport business operator
Administrator of Roads and Ports Public Safety Commission
Inhabitant
etc.
・Obligation of the respect of the discussion result
・Suggested system
Improvement ofComprehensive Coordinative Plan of Regional Public Transport
y
Support by the G t
LocalRailroads
Improvement of Transfers
Improvement of Transport
by Sea
Budget
Government
LRT
BRT
1616
Legal MeasuresCommunity Bus
BRT

Comprehensive Subsidiary System for Infrastructure ImprovementComprehensive Subsidiary System for Infrastructure ImprovementProvision of comprehensive and integrated support for core infrastructure improvement projects and related infrastructure improvement and content-focusedimprovement projects and related infrastructure improvement and content focused projects(so-called “soft projects”).Introduction of a comprehensive subsidiary system that is highly flexible for local governments so that they can take advantage of their own creative approaches .
Ill t ti f th b d l t j t j tIllustrations of the urban development project as a core projectCore projects
Improvement of various mutually cooperated urban transportation facilities Enhancing the attractiveness of public transport Projects to promote efficacy
Improvement of connection points of various means of transport Improvement of bus stops etc. Introduction of LRT trains
Introduction of Bicycle Sharing System Improvement of walkways Pilot Program of a transit mall * Picture shown for illustration purposes only
1717(Reference)the Ministry of Land, Infrastructure, Transport and Tourism
p p y
Realizing “a city where convenience of walking is effectively utilized” by properly dividing the roles of various transportation methods including walking, bicycles, vehicles, and public transport.
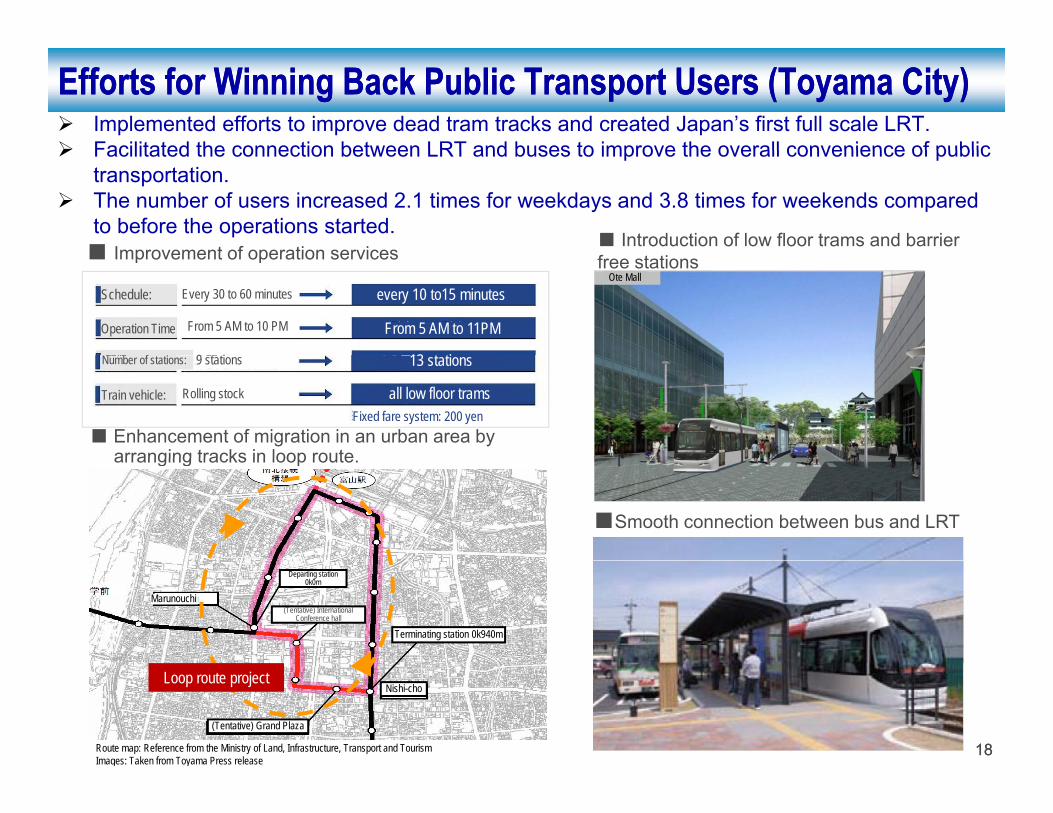
Efforts for Winning Back Public Transport Users (Toyama City) Efforts for Winning Back Public Transport Users (Toyama City) Implemented efforts to improve dead tram tracks and created Japan’s first full scale LRT. Facilitated the connection between LRT and buses to improve the overall convenience of publicFacilitated the connection between LRT and buses to improve the overall convenience of public transportation. The number of users increased 2.1 times for weekdays and 3.8 times for weekends compared to before the operations started. ■ Improvement of operation services
■ Introduction of low floor trams and barrier ■ Improvement of operation services free stations
Schedule: Every 30 to 60 minutes every 10 to15 minutes
Operation Time From 5 AM to 10 PM From 5 AM to 11PM
f 9 t ti 13 t ti
Ote Mall
■ Enhancement of migration in an urban area by arranging tracks in loop route
Number of stations: 9 stations 13 stations
Train vehicle: Rolling stock all low floor trams Fixed fare system: 200 yen
■Smooth connection between bus and LRT
arranging tracks in loop route.
Marunouchi
Departing station 0k0m
(Tentative) International Conference hall
Terminating station 0k940m
1818Route map: Reference from the Ministry of Land, Infrastructure, Transport and TourismImages: Taken from Toyama Press release
Loop route project
(Tentative) Grand Plaza
Nishi-cho

大気汚染の状況4 Cycle Sharing System大気汚染の状況4. Cycle Sharing System

Bicycles can be rented from and returned to any designated rental station.
What is Cycle Sharing System?What is Cycle Sharing System?y y g
Bicycles can be returned to a station different from where they are rented.Multiple designated rental stations tend to be closely located to each other.Establish a station as an unattended, 24/7 system by utilizing IC cards(Smart cards) etccards) etc.
××駅
ショッピングセンター駅
駐輪施設B
Station Rental station B
Shopping malls
観光施設
駐輪施設A
Bicycle Sharing trial project in Sapporo
Rental station A
Tourist facilities
駐輪施設D
駐輪施設C
RentalRental
station C
Outline drawing of Bicycle Sharing System 2020オフィス
オフィス
Bicycle Sharing trial project in TokyoOffices
Rental station D
station C
Offices

Status of Cycle Sharing Pilot ProgramsStatus of Cycle Sharing Pilot ProgramsBicycle Sharing system has been introduced in various placesBicycle Sharing system has been introduced in various places throughout Japan on a trial basis.
Sapporo
Hiroshima
Chigasaki
Kita Kyushu Yokohama
Chiyoda-Ku
2121
NagoyaMatsuyama
Cities where Bicycle Sharing system was introduced on a trial basis

Cycle Sharing System in Toyama CityCycle Sharing System in Toyama City
First attempt in Japan as a standing facilityStarted operation in the City of Toyama in March, 201015 rental stations distributed
Station list 01 Kansui Park 02 Toyama Station
North15 rental stations distributed150 bicycles providedBasic Rate: JPY 500 per monthFor every rental:
N f i d f t 30 i t f
03 Toyama Station South ①
04 Toyama Station South ②
05 Sakurabashi Dori06 City Hall07 Kita Shinmachi 1
Chome 08 Honmachi09 Jyoushi Park 10 M hi• No fee required for up to 30 minutes of use
• JPY 200 for use between 30 and 60 minutes• JPY 500 for 60 minutes and longer
10 Marunouchi11 Otemachi12 Aramachi13 Hatagomachi14 Nishicho15 Tutsumicho Dori
g
2222(Picture, Reference) Citizens’ Bicycle Shared Use System Project , March 2010,
Toyama municipal environmental policy division

大気汚染の状況5 Mobility Management大気汚染の状況5. Mobility Management

Mobility Management Mobility Management What is Mobility Management?y g– Mobility management is a communication-oriented transport policy to create a favorable transport
environment for both society and individuals by promoting voluntary changes in mobility (attitude and behavior) such as facilitating the moderate use of public transport and bicycles to avoid excessive use of vehicles.
Eco Commuting – One form of mobility management and an effort to promote changes in the means of transportation
from private vehicles to public transport and bicycles. – Appoint a person from each office in charge of considering the ideal means of transport for commuting
and provide timetables and route maps for busses and trains and review commuting allowances.
In 2008, 840 companies nationwide implemented Eco Commuting projects. As a result, CO2 emission
Before efforts are made
Project Image After efforts are
made p j , 2was reduced by 11%Homes etc Homes etc
Homes etc
Homes etcCommuter train
Train stations etc.
Means of transport used instead of vehicles
Trains/Buses
Homes etc
Commuter bus
Car Sharing
Trains/Buses
Motorbikes
Bicycles
Walk
One out of every two eco commuters used a
bus or train for commuting
One out of every three eco commuters used a
•Traffic congestion • Surrounding environment deteriorated
• Traffic accidents
Implementation of eco commuting
2424Reference: Ministry of Land, Infrastructure, Transport and Tourism
Offices and plants etc. Homes etc
Car Sharing
Bicycle
Offices and plants etc.
Othereco commuters used a bicycle for commuting
* The above figures are taken from a survey of 5,188 eco commuters who answered “yes” when asked if they used a means of transportation other than vehicles as a part of eco commuting.

Trend Towards Bicycle CommutingTrend Towards Bicycle CommutingIn Japan, many companies permit employees to commute by private vehiclesp , y p p p y y pdespite a short commute distance.On the other hand, environmentally-aware private companies promote theiremployees to switch from private vehicles to bicycles in commuting.
Automobile commuting 92.7%
98.8% 100%
nies
perm
it co
mpa
n
Four-wheeledvehicles
Bicycle commuting6.1%
18.3%
% n
umbe
r of p
commuting 1.2%6.1%
0 1 2 3 4 5 6 7 8 9 10length of commuting : km or longer
%
2525
[Source] “Status of automobile management for commuting and work” (Labour Relations Report No. 3698)
(Number of companies :82)

大気汚染の状況6 ITS(Intelligent Transport System)大気汚染の状況6. ITS(Intelligent Transport System)

ITSITS (“Smart way” Service)(“Smart way” Service)Integrated on-board system of car navigation system, VICS and ETC g y g y ,called “ITS” offers road-to-vehicle two-way communication
2727

ITSITS (“Smart way” Service)(“Smart way” Service)ITS provides drivers behind the wheel with information on traffic
見通しの悪いカーブの先の停広域の渋滞情報を提供し 最
pcongestion and blockages to improve safety and driving efficiency. Field experiment testing started in 2007 and the service started in 2009.
見通しの悪いカ ブの先の停止車両や渋滞をカーブへの進入前に画像や音声で情報提供
広域の渋滞情報を提供し、最適なルートを案内
Congestion Ahead. Drive Carefully!
2828

大気汚染の状況7 Greenhouse Gas Emission Reduction大気汚染の状況7. Greenhouse Gas Emission Reduction

Changes in COChanges in CO22 Emissions In the Transportation SectorEmissions In the Transportation SectorCO emissions in transportation sector have been continuously reducedCO2 emissions in transportation sector have been continuously reduced after peaking in 2001
267267
251254
251
245245235 245
235
3030

Popularization of Environmentally Friendly Vehicles Popularization of Environmentally Friendly Vehicles Low-pollution and fuel-efficient vehicles, mainly the hybrid vehicles,Low pollution and fuel efficient vehicles, mainly the hybrid vehicles,have been rapidly disseminated.
Changes in the number of environmentally-friendly vehicles
347
441
400
450
(1000台)
電気自動車Electric vehicle
(Unit: 1000 vehicles)
Electric vehicles
257
347
250
300
350
電気自動車
ハイブリッド自動車
天然ガス自動車
メタノール自動車
ディーゼル代替LPG自動車
Electric vehiclesHybrid vehiclesNatural gas vehiclesMethanol vehicles Diesel alternative fuel, LPG vehicles
133
197
150
200
250
Hybrid vehicle
5 6 8 9 10 9 923
50
7591
4 5 8 12 17 21 24 28 31 34
0.015 17 19 21 22 23 23
432
37
0.00 00 00.10.10.10.20.20.3
131110
0
50
100
3131
0.00.00.10.10
1998 1999 2000 2001 2002 2003 2004 2005 2006 2007 (年度)
(Reference) Japan Automobile Research Institute, The Japan Gas Association, Automobile Inspection & Registration Information Association, Organization for the promotion of low emission vehicles
Natural gas vehicle (Year)

Promotion of Environmentally Friendly VehiclesPromotion of Environmentally Friendly VehiclesIn order to realize a low carbon society while stimulating demand for replacing and purchasing vehicles, taxes for environmentally efficient vehicles are exempted or reduced for a limited time; in addition, a subsidiary system has been introduced for purchasing environmentally friendly vehicles.
Electric vehicles (including fuel cell powered vehicles), plug-in hybrid vehicles, clean diesel vehicles, natural gas vehicles, hybrid vehicles Exemption
Exemption and reduction of vehicle weight tax and vehicle acquisition tax (2009 -2012)exempted or reduced for a limited time; in addition, a subsidiary system has been introduced for purchasing environmentally friendly vehicles.
Vehicles with a four-star rating in emission standard and vehicles with fuel efficiency 25% above the standardVehicles that complies with new long term regulations and vehicles achieving fuel efficiency standard for heavy-duty vehicles
75% Reduction
Vehicles with a four-star rating in emission standard and vehicles achieving fuel efficiency 15% above the standard Heavy duty vehicles with a one star rating in emission standard and vehicles achieving the 50% Heavy-duty vehicles with a one-star rating in emission standard and vehicles achieving the fuel efficiency standard for heavy-duty vehicles Reduction
Subsidiaries for replacing and purchasing environmentally friendly vehicles (2009 -2010)
Light –duty Requirements Registered vehicles Light –duty vehicles
Subsidiaries provided for purchasing new vehicles including discarding old vehicles. (When replacing vehicles of 13 years and older with vehicles achieving 2010 fuel efficiency standard.) 25 0,000 yen 125,000 yen
Subsidiaries provided for purchasing new vehicles without discarding old vehicles(V hi l ith f t ti i i t d d d f l ffi i 15% b th 2010 f l ffi i t d d) 100,000 yen 50,000 yen(Vehicles with a four-star rating emission standard and a fuel efficiency 15% above the 2010 fuel efficiency standard) 00,000 ye 50,000 ye
Requirements Small sized vehicles (3.5 ton ranges)
Medium sized vehicles (8 ton ranges)
Large sized vehicles (12 tons ranges)
Subsidiaries provided for purchasing new vehicles including discarding old vehicles.(When replacing vehicles 13 years old and older with vehicles achieving the new long 400 000 yen 800 000 yen 1 800 000 yen (When replacing vehicles 13 years old and older with vehicles achieving the new long term standard.)
400,000 yen 800,000 yen 1,800,000 yen
Subsidiaries provided for purchasing new vehicles without discarding old vehicles.(vehicles achieving 2015 fuel efficiency standard and heavy vehicles with a one-star rating in emission standard )
200,000 yen 400,000 yen 900,000 yen 3232
エコドライブ普及・推進アクションプランエコドライブが十分普及・実施されることを目的とし、政府、地方公共団体 民間団体及びドライバー等が取り組む事
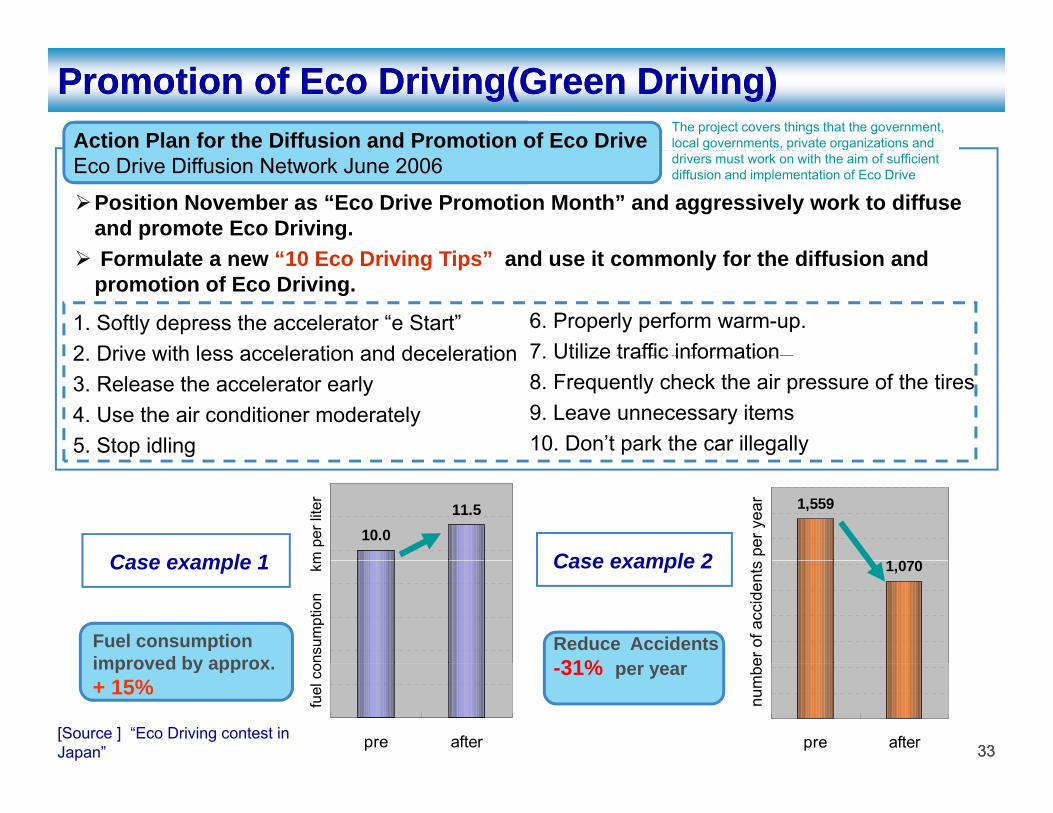
Promotion of Eco Driving(Green Driving)Promotion of Eco Driving(Green Driving)Action Plan for the Diffusion and Promotion of Eco Drive
The project covers things that the government, local governments, private organizations and エコドライブ普及 推進アクションプラン
(平成18年6月 エコドライブ普及連絡会)地方公共団体、民間団体及びドライバ 等が取り組む事項をとりまとめた
11月を「エコドライブ推進月間」と位置づけ、積極的にエコドライブの普及・推進を図る。
Position November as “Eco Drive Promotion Month” and aggressively work to diffuse and promote Eco Driving.F l t “10 E D i i Ti ” d it l f th diff i d
Eco Drive Diffusion Network June 2006 drivers must work on with the aim of sufficient diffusion and implementation of Eco Drive
新たな「エコドライブ10のすすめ」を策定し、エコドライブの普及・推進を図る際に統一的に用いる。
1 ふんわりアクセル『eスタート』6 暖機運転は適切に
7 道路交通情報の活用
Formulate a new “10 Eco Driving Tips” and use it commonly for the diffusion and promotion of Eco Driving.
1. Softly depress the accelerator “e Start” 2 Drive with less acceleration and deceleration
6. Properly perform warm-up. 7 Utilize traffic information
2 加減速の少ない運転
3 早めのアクセルオフ
4 エアコンの使用を控えめに
5 アイドリングストップ
7 道路交通情報の活用
8 タイヤの空気圧をこまめにチェック
9 不要な荷物は積まずに走行
10 駐車場所に注意
2. Drive with less acceleration and deceleration 3. Release the accelerator early 4. Use the air conditioner moderately 5. Stop idling
7. Utilize traffic information 8. Frequently check the air pressure of the tires9. Leave unnecessary items10. Don’t park the car illegally
10.011.5
m p
er li
ter 1,559
1 070
per y
ear
Case example 1 Case example 2
nsum
ptio
n
km 1,070
er o
f acc
iden
ts Case example 1
Fuel consumption improved by approx
Reduce Accidents31%
Case example 2
3333pre after
fuel
co
pre afternu
mbeimproved by approx.
+ 15%-31% per year
[Source ] “Eco Driving contest in Japan”

Case Example Of Eco Driving (Green Driving) MeasuresCase Example Of Eco Driving (Green Driving) Measures
エコドライブ(EMS)の概要Outline of Eco Driving (EMS) Introduce the device
Driving Prevent sudden starting/sudden
W i Clean
Start driving
acceleration Device on board
Excess the acceleration
Warning beep
Clean Emission
Set up driving-related targets (controlling dd l ti th hl b idli t )
Thoroughly ban idlingspeed limit
Device for companies Company A
Seminar
Driving Evaluate a series of driving
sudden acceleration, thoroughly ban idling, etc) Data
Driving instruction
Instructions issued by the Eco Driving manager
Evaluate a series of driving conditions
Organize Eco Driving Seminars, etc
3434
manageretc

Challenge 25 Challenge 25 Speech by former P.M. Yukio Hatoyama p y yUN Summit on Climate Change- Mitigation -
“Emission reduction by 25% by 2020 compared toEmission reduction by 25% by 2020 compared to the 1990 level premised on establishment of a fair and effective international framework in which all major economies participate and agreement of
Challenge 25 Campaign The 6 Challengesj p p g
ambitious targets”
1990 Manufacturing Home Industrial Transport Non-energy
Energy ConversionDaily Life / Community Development
482 127 164 217 68 202
Choose an environmentally-friendly lifestyle
Choose energy-saving products
2008(preliminaryestimates)
2020(variable 374~ 154~90~ 133~ 153~ 42~
172420 232 236 78 148
products
Choose natural energies
Choose environmentally-(variable case*1)
2050
-25%
80%252
(▲11%)*3 (+4%)(▲48%) (▲43%) (▲35%) (▲46%) friendly buildings and housesSupport activities and products that lead to the reduction of CO emissions
2020(static case*2)
385~(▲8%)*3
158~(+7%)
81~(▲53%)
120~(▲48%)
158~(▲33%)
41~(▲47%)
2050 -80%
*1: An “All-sector Variable Macro-frame Case” premised on a set price for carbon.*2: An “Static Industrial Macro-frame Case” where the operation levels in the industrial sector are static.*3: Emission reduction levels compared to 2008.
252 reduction of CO2 emissionsParticipate in community activities to prevent global warming
±0%compared to 1990
3535

Thank you forThank you forThank you for Thank you for your kindyour kindyour kind your kind tt ti !tt ti !attention!attention!
Please visit the following websites for further details. Ministry of the Environment
http://www.env.go.jp/en/Ministry of Land, Infrastructure, Transport and Tourism
http://www.mlit.go.jp/english/index.html
3636


![발표자료집...[발표자료집] Ryuji Tsutsui (CEO, WWF-Japan) Corporate climate leadership with the cases of Science Based Targets Initiative and Japan Climate Initiative [ SessionⅠ]](https://img.dokumen.tips/doc/110x75/6135e4770ad5d2067647aab9/eoeoeeoe-eoeoeeoe-ryuji-tsutsui-ceo-wwf-japan-corporate-climate.jpg)