Embed Size (px)
Citation preview

ENVIRONMENTALLY SUPERIOR
TECHNOLOGY
ORBIT/HSAD
“On-campus Report”
Prepared by: Dr. Leonard S. Bull, PI Dr. Maurice Cook, CO-PI Sample collection and custody supervised and coordinated by: Ms. Lynn Worley-Davis ORBIT Technology Providers: Mr. M. Allen Paul and Mr. James Tarleton ORBIT 484 Hickory Grove Road Clinton, NC 28328 Tel: 910-564-3248 [email protected] PI Contact: Dr. Leonard S. Bull, PAS Box 7608 NCState University Raleigh, NC 27695-7608 919-515-5387 [email protected] Prepared May, 2004
1
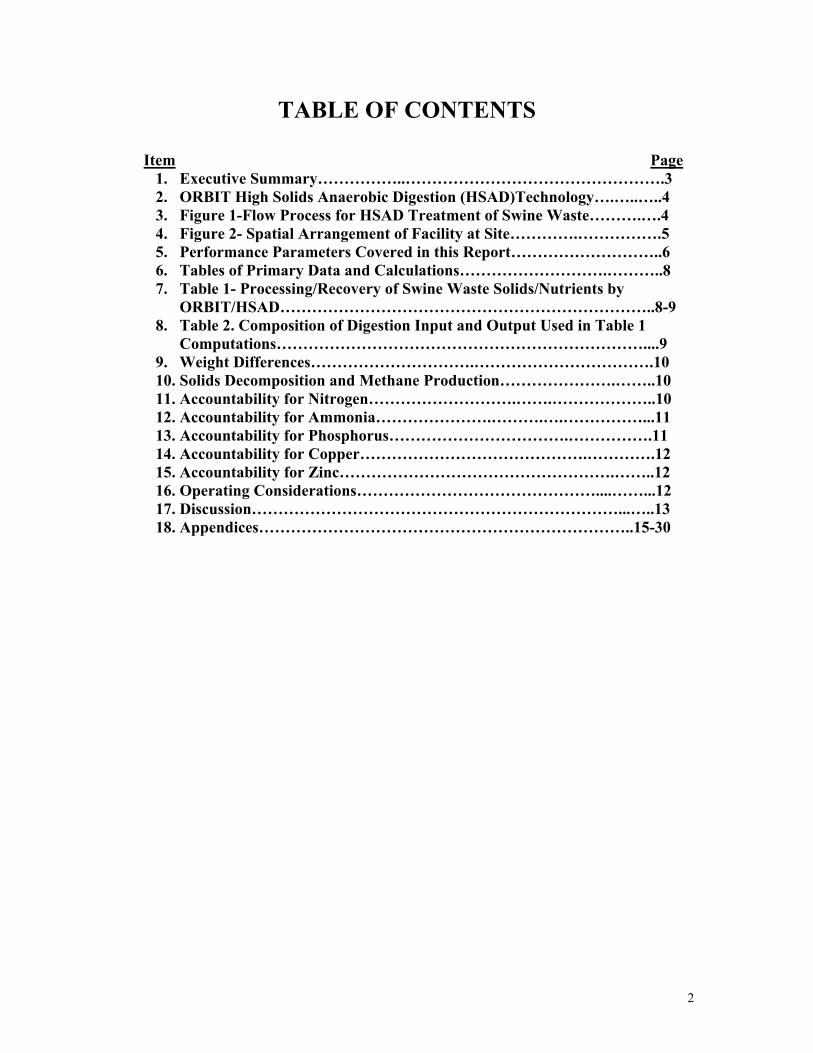
TABLE OF CONTENTS
Item Page 1. Executive Summary……………..………………………………………….3 2. ORBIT High Solids Anaerobic Digestion (HSAD)Technology….…..…..4 3. Figure 1-Flow Process for HSAD Treatment of Swine Waste……….….4 4. Figure 2- Spatial Arrangement of Facility at Site………….…………….5 5. Performance Parameters Covered in this Report………………………..6 6. Tables of Primary Data and Calculations……………………….………..8 7. Table 1- Processing/Recovery of Swine Waste Solids/Nutrients by
ORBIT/HSAD……………………………………………………………..8-9 8. Table 2. Composition of Digestion Input and Output Used in Table 1
Computations……………………………………………………………....9 9. Weight Differences………………………….…………………………….10 10. Solids Decomposition and Methane Production………………….……..10 11. Accountability for Nitrogen……………………….…….………………..10 12. Accountability for Ammonia………………….……….….……………...11 13. Accountability for Phosphorus…………………………….…………….11 14. Accountability for Copper…………………………………….………….12 15. Accountability for Zinc…………………………………………….……..12 16. Operating Considerations………………………………………....……...12 17. Discussion……………………………………………………………...…..13 18. Appendices……………………………………………………………..15-30
2

Executive Summary
The objective of this study was to evaluate the effectiveness of the innovative high solids anaerobic digestion (HSAD) technology in treating swine waste. This technology is distinctive from other anaerobic processes in that relatively high solid concentrations, viz., greater than 30 percent, can be digested. The digestion is accomplished by thermophilic anaerobic bacteria. The evaluation was made at the ORBIT facility in Sampson County, NC. Swine waste was provided by the SuperSoil Systems (SSS) facility at Goshen Farm in Duplin County, NC. The following analyses were conducted on the swine waste prior to and following anaerobic digestion during a 70-day test period: 1) Solids percentage; 2) Total nitrogen (N); 3) Ammonia (NH3); 4) Phosphorus (P); 5) Copper (Cu); and 6) Zinc (Zn). Biogas production was measured by the technology provider. Pathogens were identified and assessed by the OPEN team. The solids content of the original swine waste feedstock was approximately 15%, about one-half of the content required to meet the high solids criterion of at least 30%. The solids content of the processed feedstock was approximately 11%. However, the total quantity of solids before and after processing was about the same.
Total N diminished by approximately 50% during processing. Ammonia decreased by about 72%. Reductions in P, Cu, and Zn were 26%, 46%, and 32%, respectively. The technology provider reported the production of large amounts, up to 81,500 liters per day, of methane. The OPEN team reported the destruction of almost all the harmful pathogens. These results indicate that this system quantitatively eliminates unaccounted-for discharges of critical elements and compounds into the environment.
Several factors limited the evaluation of the technology: 1) Inadequate quantities of swine waste to utilize the full capacity of the system; 2) Variable composition of the swine waste feedstock; 3) Brevity of the evaluation period, 70 days. Despite these limitations, the evaluation indicates that the HSAD system is a promising innovative technology.
3

ORBIT High Solids Anaerobic Digestion (HSAD) Technology General Description
This innovative technology utilizes thermophilic anaerobic digestion and bacteria adapted to these conditions (54.40C as goal) to digest the solids in swine waste, recover energy in the form of biogas, and eliminate pathogenic organisms. This system is distinctive from most other anaerobic processes in that relatively high solid concentrations, e.g., >30% (35-40% preferred), can be digested. The effectiveness of HSAD is based on the theory of film transfer of digestive products between anaerobic microbes in a high-solids environment. The synergistic interaction of thermophilic organisms and high solid concentrations should reduce the construction and operating costs of the HSAD system when compared to conventional mesophilic (340C) systems. A schematic diagram of the HSAD flow process for treatment of swine waste is shown in Figure 1. A logistical layout of the facility as actually constructed in Sampson County, NC is depicted in Figure 2.
Flow Process and Data Collection Points
Notes:1. Biogas was flared throughout the test. BudgetDid not allocate funds for testing gas collection, storageand Co-Gen components because they are off-the-shelf Items that are widely used already.2. Digested Sludge Was Deposited in Barrelsor Transferred to SSS3. Digested sludge in barrels is non-hazardous and willkeep indefinitely. 4. Dotted lines and boxes indicate potential usage of products.
Circled Numbers Identify Specific Data Collection Locations
1 2 3 4
Swine Waste Separation
at Goshen Farm
Transport of Waste from Goshen FarmTo ORBIT Facility
Receipt ofSwine Waste
Transfer to FeedMixing Tank
5
Anaerobic BioreactorDSR-2
Digested Sludge
Gas Flare
Transferred DirectlyTo SSS
Stored in Barrels
6
Collection of feedstock samples; On-site lab tests on pH and moisture.
Co-Gen or Direct Feed to Boiler Type
Furnaces
Conversion to Fertilizer for Ground Application
Figure 1. Flow Process for HSAD Treatment of Swine Waste
4

Methane - flared
Swine solids were loaded into the blender and then carried via belt to the feed tank of DSR2. Digested solids did not go through the screw press for additional separation during this evaluation of the HSAD. All methane was flared.
Liquid storage
Composted solids
Screw press for liquid removal
Port 4
Port 2
Port 1
HSAD DSR1
HSAD DSR2
Feeder – Homogenization (Blender)
Grinder
Blender
Port 3
Figure 2. Spatial Arrangement of ORBIT Site, Showing Two HSAD Units, Feedstock Flow and Location of Sampling Ports in Test Digestion System (HSAD DSR2), Liquid/Solid Separation Unit (not used) with Flow of Separated Solids and Liquid, and Biogas (Methane) Collection/Flaring Unit
5
Swine waste was collected at the SuperSoil Systems (SSS) facility at Goshen Farm in Duplin County, NC. (By contract, this was the sole source of material to be used in the evaluation. Prior to this evaluation, food preparation and dining hall waste was processed in the digestion units as part of a contract with the US Army and was used as the initial charge of feedstock to the DSR2 unit.) The swine waste received from SSS had been treated with chemical additions to remove nutrients. The description of that process can be found in the report on the SSS system. Swine waste was transported to the ORBIT facility in Sampson County and emptied into a large rotary ribbon blender for mixing. ORBIT personnel (hereafter referred to as “technology provider”) weighed the feedstock daily and checked it for moisture content, pH and toxicity. The feedstock was then fed via screw conveyors to a 4-ton capacity surge bin, where precise rates for application of it to the digester were determined. The feedstock was transferred to the digester via a pneumatically retractable and heated screw conveyor, with target temperature of the feedstock to be 54.40C at the time of introduction into the digester. This process required from two to five hours, at which time the digester was sealed until the next feeding period (approximately 24 hours). The digester was heated to 54.40C by means of thermostatically controlled heaters in integral contact with the vessel walls. The contents were gently stirred to release the continual development of biogas, which was removed from the digester, measured (volume) and disposed of by flaring. The preferred commercial fate for the biogas is as an energy source with value recovered to help support the operation of the system. Daily digestate samples were collected from four ports evenly spaced along the length of the digester. The schematic diagram indicates that there is provision for separation of the liquid and solid fractions of the digestate exiting the unit for subsequent value-added product development, e.g., liquid fertilizer, compost. That step was not employed in this testing program due to financial constraints. In addition, the biogas produced during this test was flared rather than being used as a recoverable energy source. In a full-scale production application of HSAD, it is expected that liquid and solid products would be produced and that the collected biogas would be used as an energy source to provide revenue streams. Without data, however, this report cannot address those components.
Performance Parameters Covered in this Report The focus of this report is to describe the fate (destruction or recovery with containment) of the following materials and nutrients associated with the feedstock entering the digester and digestate exiting the digester: a.) solids; b.) total nitrogen; c.) feedstock and digestate ammonia (NH3); d.) phosphorus; e.) copper; f.) zinc. All of these components were measured according to the requirements of the Agreements, indicating that a third party collected, secured, transported and analyzed the samples. Numerous other data were gathered during the project by the technology provider. Some of those, especially the methane production that is central to anaerobic digestion, are included among the Appendices to this report. They are designated in each case as being “Collected by the Technology Provider” in each case for clarity. This report emphasizes
6

the specific components noted above and it also includes a discussion of system operational requirements, considerations and recommendations.
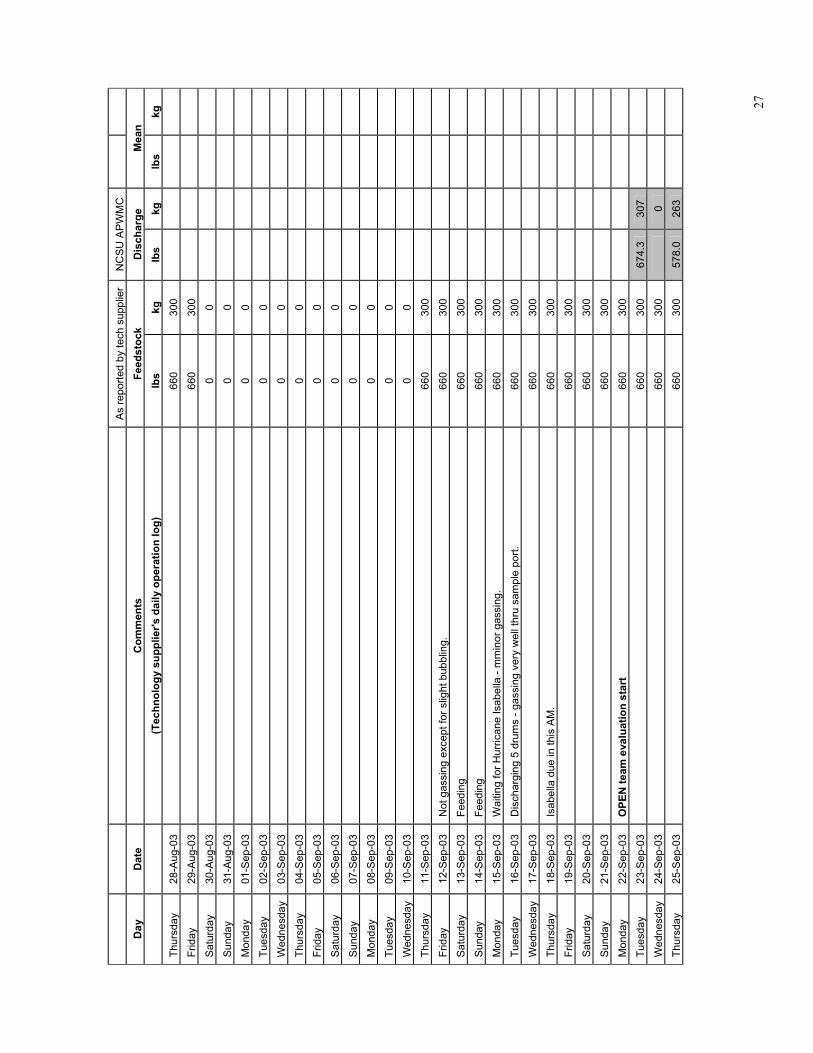
The design and purpose of the total containment ORBIT/HSAD system, as noted above, is to process high-solids (35-40 % solids) biomass at thermophilic anaerobic conditions (54.40C) with extraction of recoverable and usable energy as methane, elimination of odor producing compounds, expected elimination of pathogens by virtue of the temperature used, and recovery and control of nitrogen forms and mineral elements (especially phosphorus, copper and zinc). A documented advantage of the thermophilic digestion process is the elevated rate of reaction and therefore theoretically reduced process (retention) time. By virtue of the total containment and quantitative collection of exiting material, protection of groundwater and the surrounding environment is assured. Theoretically, any non-volatile element added to a single-vessel component system should be quantitatively recovered and, thus, can serve as the basis for calculation of mass-balance. Because of the sealed nature of the system and the fact that it was sited at a location which had no animal production, the only emissions that would be expected (ammonia, odors) would be those associated with the handling of the feedstock prior to introduction into the system, and the subsequent handling of the digestate exiting from the system. The extent of those possible events (emissions) would be dictated by the nature of the material and the operational procedures employed by the technology provider. Prior to swine solids being introduced, material from testing done previously using food residue material was put into the unit to “seed” the thermophilic anaerobic digestion process. Swine waste feedstock was introduced into the unit from August 19-29, from October 24-November 4, and from November 6-29, 2003 (Appendix Table 4). Due to the interrupted feeding schedule and variable quantities of feedstock introduced as a result of variable availability, “steady state operation” was never achieved during this test. The expected retention time of material in the digestion unit was anticipated to be from 7-21 days, depending on loading rate. Due to the variable and interrupted loading rate, it is not possible to calculate an average retention time. Consequently, data are presented in this report based on three different estimated retention times. The fact that the feeding rate was never more than about 20 percent of the capacity of 5,400kg/day (technology provider estimate) would suggest that the retention time was longer than would be observed under full-operating, steady-state conditions. Also, nutrient recovery evaluation would require collection of digestate for an extended time after cessation of feeding of the material. The total period for collecting data was September 11 through November 29, 2003. This period coincided with the availability of swine waste feedstock and the monitoring of ammonia emissions, odors and pathogens by the OPEN team. The test ended ahead of schedule due to operational and financial difficulties. That made this evaluation more difficult to conduct than originally intended. As noted earlier, the digestate was not processed to separate liquid and solid fractions. Thus, there are no data on the distribution of nutrients between those components. The digestate was collected in 55-gallon barrels, which were sealed and stored for future use. All biogas produced was flared.
7

Tables of Primary Data and Calculations All of the critical data required for this evaluation are summarized in Tables 1 and 2 below. The sampling schedule and a complete dataset for all of the analyses are found in Appendix Tables 1 and 2. These data are based on the quantities introduced into and removed from the digestion unit, and the analysis of samples taken by the On-Campus team, with all subsequent chemical analyses conducted by the Division of Agronomic Services of the North Carolina Department of Agriculture and Consumer Services.
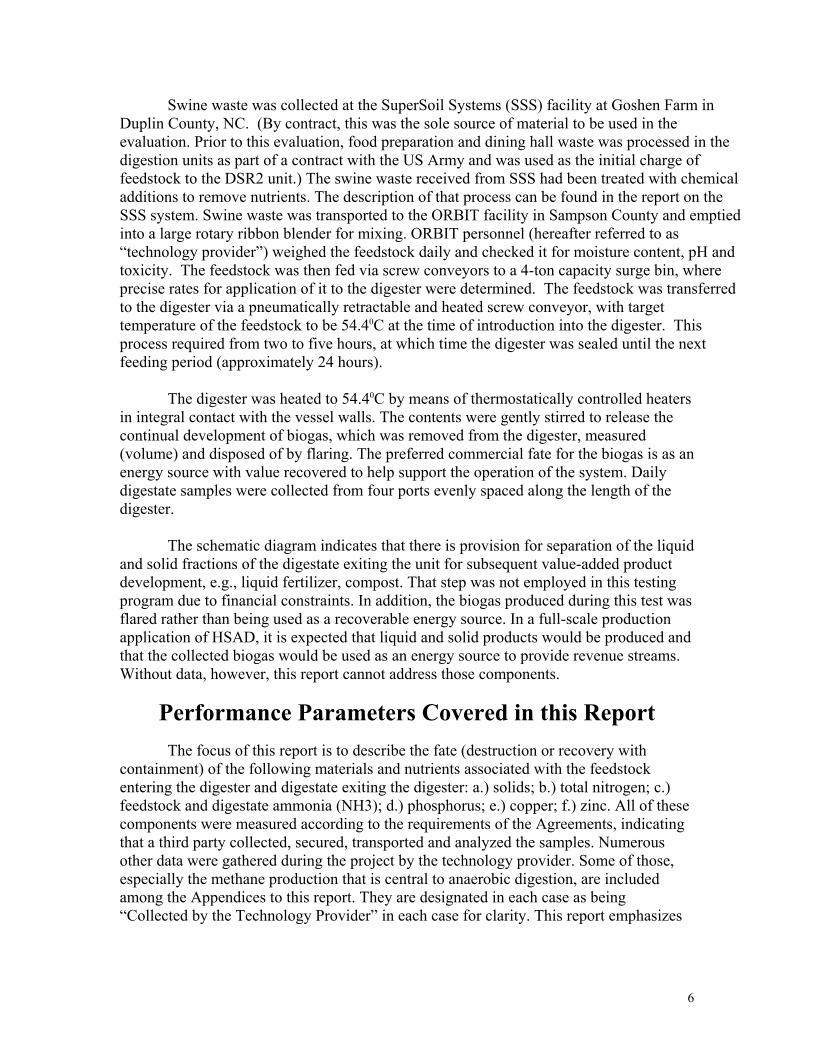
During the test period, eight samples of the material being introduced into the digestion unit were taken and analyzed. Because the performance is based on the difference between what is introduced and what is recovered from the material introduced, and to assure that previously processed food-waste material was totally cleared, only five samples of the material exiting the digestion unit were analyzed. This is based on the originally estimated retention time of 21 days provided by the technology provider (not actually measured-see below). All material introduced into the digestion unit was weighed daily by the technology provider, and all material collected from the digestion unit was weighed by On-Campus team members. The digestion unit is equipped with four sampling ports as described above and shown in Figure 2. Ports 1-3 were used as indicators of internal change in composition during processing. Port 4 was at the point of discharge from the unit. The results of all of those analyses are found in Appendix Table 2.The port 4 sample analyses were used as indicative of the composition of the discharge material resulting from the processing of swine waste by the unit, although a review of the data from ports 1-3 suggest that the majority of digestive activity was completed in the first portion of the digestion unit. The results shown in Table 1 are calculated based on 7, 14 and 21 day estimated retention times due to the variable feedstock addition schedule and the relatively low feeding rate (related to capacity). The difference between each of these calculations is the fact that digestate weight was included from those periods (7, 14, 21 days) after the last feeding to accommodate those three retention time estimates. Table 1. Processing / Recovery Of Swine Waste Solids / Nutrients By ORBIT /
HSAD Parameter Quantity In Quantity Out Loss/(Gain) Loss/(Gain)_Recovery_ -- kg kg kg % %
7-day Estimated Retention Time Total Weight 30,706 30,976 (270) (0.9) 100.9 Solids 4,636 3,314 1,321 29 72 Total Nitrogen 1,424 621 803 56 44 Ammonia 87 25 62 71 29 Phosphorus 683 507 176 26 74 Copper 69 37 32 46 54 Zinc 45 31 14 31 69
8
Table 1. Processing / Recovery Of Swine Waste Solids / Nutrients By ORBIT / HSAD (continued)
Parameter Quantity In Quantity Out Loss/(Gain) Loss/(Gain)_Recovery_ -- kg kg kg % %
14-day Estimated Retention Time
Total Weight 30,706 34,347 (3,641) (84) 108 Solids 4,636 3,675 961 21 79 Total Nitrogen 1,424 689 735 51 49 Ammonia 87 28 59 68 32 Phosphorus 683 562 121 18 82 Copper 69 42 27 39 61 Zinc 45 34 11 24 76
21-day Estimated Retention Time Total Weight 30,706 40,054 (9,348) (30) 130 Solids 4,636 4,285 350 8 92 Total Nitrogen 1,424 804 620 44 56 Ammonia 87 32 55 63 37 Phosphorus 683 656 27 4 96 Copper 69 49 20 29 71 Zinc 45 40 5 11_____ 89______ Notes on Table 1 data:
a. Analytical data are found in Table 2. Complete analyses are found in Appendix Table 2.
b. Values in ( ) represent gain in weight. Table 2. Composition Of Digestion Input And Output Used In Table 1
Computations Sample_Source___n___Solids_____TotalN_____NH3_____P_______Cu______Zn__ -- -- % ppm ppm ppm ppm ppm Input Material 8 15.1 40637 2841 22242 2252 1472 Std. Dev. 3.1 14873 2636 6803 955 527 Output Material 5 10.7 20063 808 16379 1212 996 ______Std. Dev. .64 4837 1039 4504 549 267 Notes on Table 2 data:
a. Nutrients in Parts Per Million (ppm) as-received basis (1 ppm = 1 mg/1000g).
b. Input material at 15.1 percent solids from supplier was at less than 50% of system performance design and recommended specifications (35-40%).
c. Output material is collected from port 4 of the digestion unit. All data for all samples shown in Appendix Table 2.
9

Weight Differences
The fact that the weight of material added to the digestion unit was less than that removed for each of the Estimated Retention Times is baffling. A partial explanation may be that there was a lower solids content in the removed material than that added. With extension of the digestate collection period to accommodate the longer Estimated Retention Times, the weight difference increased. Since weight is not a critical parameter per se, and since there are concerns about the irregular feeding patterns and unknown retention times, no further discussion of the wet weight data will be made.
Solids Decomposition and Methane Production
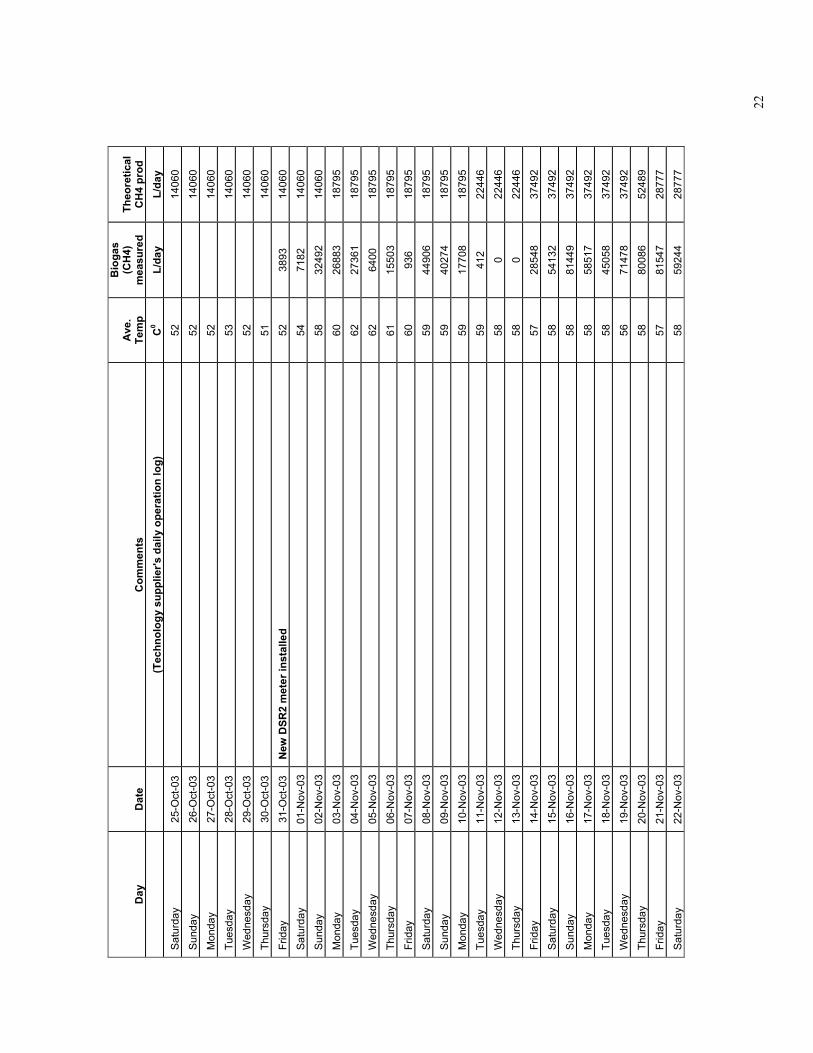
The primary interest in solids disappearance is related to the production of biogas (methane and carbon dioxide) as a method for extraction of useful energy from the system in a form that has added value. Data collected by the technology provider (see Appendix Table 3) indicated that the swine waste solids contained 79% of volatile solids (VS), and that the conversion of those VS to biogas was predicted to be 51% based on theoretical calculations. This should have resulted in a reduction in solids passing through the digestion unit of about 40%. That reduction was not achieved under any of the Estimated Retention Times. The data on estimated and measured methane production (Appendix Figure 1, provided by technology provider) show variable production rates during the time of actual measurement (10/31-11/27/03). The range in daily methane yield is from 0-81,500l/day. In some cases the yields reported were above theoretical estimates, and in other cases they were below. We believe that the variable flow created by the feeding pattern noted above is responsible for these variations.
Accountability for Nitrogen
Ability to account for, contain and manage nitrogen within a waste processing system is an important performance parameter. In a component and sealed system such as ORBIT/HSAD, the tracking of nutrients should be relatively easier than in more complex, multi-component systems with numerous transfers and partitioning functions.
The nitrogen analysis data from the samples taken of input and output material are found in Table 2 above. Total nitrogen balance (all forms) across the digestion system during the 70-day test interval is shown in Table 1. Only 44-56% of the nitrogen introduced into the system can be accounted for. The specific percentage depends on the Estimated Retention Time used. That recovery is disappointing. We attribute these differences to a combination of uncertainties associated with the weights obtained, the small number of digestate samples (5) that were collected and analyzed, the lack of steady-state operation, and uncertain retention time. These erratic findings point to the need for steady-state operation with an extended sampling period in future evaluations. The unaccounted-for nitrogen, other than that due to analytical and sampling causes, could be partly due to a small amount exiting with the produced biogas. This is not considered a major loss avenue due to the pH of the digestion mixture (7.5-8.3).
10

Accountability for Ammonia
The concentrations of ammonia in the input and output samples are shown in Table 2 above. There is a concentration decrease of nearly 75% between input and output. The balance of ammonia calculated from those data indicates that from 63-71% was lost during the process, depending on the Estimated Retention Time used. The same uncertainties can be assigned to these data as are noted above, including the possibility that some ammonia was lost in the biogas stream. The report of the OPEN team evaluations of this site (see OPEN team report) suggests that ammonia emission at this site was not high. Ammonia was detectable around the digestion site, and that may have been due to the combination of some emissions from the feedstock, the digestate, and the fact that there was an operating composting facility on the same site located “upwind” from the ORBIT facility.
Accountability for Phosphorus
The recovery data for phosphorus are shown in Table 1. Concentrations of total phosphorus in samples of input and output materials to the digestion unit are found in Table 2. The balance of phosphorus calculated from those data and the weights of materials resulted in our being unable to account for from 3.9-26% of the input phosphorus, for the three Estimated Retention Times. In a closed system such as this, the expected theoretical recovery is 100% for a non-volatile mineral such as phosphorus under extended steady-state conditions. It is anticipated that a full recovery of phosphorus would occur if tests were conducted under steady-state conditions created by a more nearly constant feeding protocol. A common practice in many analytical procedures is the use of a non-volatile element as an internal marker that allows adjustment of all data to an assumed 100 percent recovery of that marker. That probably would have been useful in this evaluation. While phosphorus may not be the element of choice, an extensive and statistically-based evaluation of all of the non-volatile mineral elements included in the analyses conducted as part of this project could yield candidates for consideration in future testing. A review of the data in Table 1 suggests that the true retention time for the system under the conditions employed would be slightly longer than 21 days to achieve 100% recovery of phosphorus. The same projections could be made using other non-volatile elements.
Accountability for Copper
The balance of copper through the system is shown in Table 1. As a point of interest, the animals from which the waste was collected prior to pre-processing (Super Soil, USA) in this study were managed to the exclusion of sub-therapeutic use of antibiotics in production, but with elevated levels of dietary copper as an alternative. For that reason, copper concentration in the material processed here was notably high (Table 2). Based on those data, the unaccountability for copper during the test period ranged from 29-46% of that put into the system, for the three Estimated Retention Times. One
11
could use the same approach here as for phosphorus, and estimate that under the conditions used, exiting digestate collection would have needed to be measured and sampled for longer than the 21-day period used at the end of the test period to achieve full copper recovery.
Accountability for Zinc
The balance of zinc through the system is shown in Table 1.Zinc concentrations in material put into and collected from the digestion unit are shown in Table 2. Based on those data, the unaccountability of zinc during the test period ranged from 11-31% of the amount introduced. As with the results for phosphorus and copper balances noted above, a quantitative recovery of zinc should be expected during steady-state operation for an extended time, and these data suggest that to be the case, with a retention time that is longer than that used in this test.
Operating Considerations
The ORBIT/HSAD system is designed to operate with a feedstock solids content of 35-40 percent for optimal biogas production and value-added product output. The solids content of the feedstock used in this study averaged 15.1 percent during the 70-day evaluation period. Thus, optimal performance of the high solids feature of the system was probably not realized. It is difficult to ascertain from this brief study if a high solids content of feedstock is essential for the system to qualify as an effective new technology option. Obviously, the description of the high solids aspect of the system would need to be modified in the event that the solids content of the feedstock does not reach the levels for which the system was designed.
It is notable that the OPEN team evaluation (to be found elsewhere) indicated that
the HSAD system performed extremely well in pathogen destruction.
The system requires an adequate and consistent supply of feedstock to attain maximum efficiency. In addition to the low solids content noted above, the swine waste solids provided for the operation of the system were deficient in quantity and variable in composition. The potential capacity of the system is approximately 6,000 kg per day. The average feeding rate during the 70-day trial was 270 kg per day. Large variations in the amounts of nitrogen, ammonia, phosphorus, copper, and zinc in the feedstock were noted earlier in this report. These deficiencies limited the function of the system and, hence, any evaluation of the system.
Large amounts of solid digestate were produced by the digestion process. A utilization plan for these solids needs to be developed. A conceivable use is as a soil amendment. Storage of the byproducts in 55-gallon barrels, the current practice, is an inadequate long-term solution.
12

Large amounts of biogas high in methane were produced by the operation. The disposition and/or utilization of this gas need to be addressed. The disposal of the methane-rich material by flaring may pose an environmental concern. The large amounts of methane (up to 80,000 liters/day) can be viewed positively as a source of energy when properly utilized.
The system requires at least one skilled operator. Additional personnel are likely required if the system is adopted as a regional collection facility. The operator must have a high school education as a minimum. The operator needs to receive adequate training that includes detailed information on equipment, its operation and maintenance, identification and reporting of malfunctions, and troubleshooting. The training should also include health and safety requirements, and record keeping.
Attention needs to be given to biosecurity. It appears that there are no compliance measures for personnel entering and leaving the property.
Discussion The ORBIT/HSAD system represents a single vessel component for waste management, unlike the more comprehensive and multi-component or multi-compartmental systems. For that reason, the entire performance evaluation is based on a single set of input and output samples taken across the digestion unit. The transit time of material through the digestion system was projected by the technology provider to be between 7-21 days. It is based on continual feedstock introduction and modest mixing of the feedstock during that transit. These processing actions should cause the samples of effluent to reflect the composition of influent 7-21 days earlier plus the influence of internal mixing during transit. If the system operated with a constant feeding rate (which was not possible due to erratic feedstock supply and periods of interrupted feeding), and if the composition of the feedstock was relatively constant, a mass balance could be calculated that would represent the true operational capability of the system. Steady state operation is a definite requirement for any system of this type in order to achieve reliable estimates of mass balance of any of the critical nutrients associated with this performance verification program. Since that condition was not achieved, as discussed in this report, these data are limited in their interpretation within the context of the conditions of this test period. These data suggest strongly that in order for a truly functionally and economically representative test of the ORBIT/HSAD system to take place the following would have been needed:
a. Feedstock availability daily at a quantity consistent with the capacity of the system (not achieved in this test and a serious disadvantage);
b. Feedstock composition of either low variability or accompanied by daily aliquot sampling for analysis (not achieved in this test);
c. Daily representative sampling of effluent discharged from the digestion unit for analysis (not achieved in this test).
13

Prior to the initiation of the swine waste solids tests upon which this report is based, a very successful test was conducted by ORBIT/HSAD using food waste under contract with the U. S. Army (Fort Bragg, NC). That test was reviewed and certified by the U. S. Army, and there are significant data contained therein that demonstrate the effectiveness of the HSAD process when operated at an appropriate feeding rate. The Executive Summary of that report is found in the Appendix of this report.
14

APPENDICES
15

Appendix Table 1. Sample Collection Schedule for HSAD System During Test Period _______________________________________________________________________ Date Feed tank Port 1 Port 2 Port 3 Port 4__ 8/20/03 X N/A N/A N/A N/A 8/27/03 X X N/A N/A N/A 9/3/03 X X X N/A N/A 9/17/03 X X X X N/A 9/22/03 X X X X X 9/29/03 X X X X X 10/13/03 -- X X X X 10/20/03 X X X X X 11/12/03 X X X X X____ Notes: a. N/A indicates dates when no sample were taken based on expected
transit time for material through digestion unit. b. No sample was available on 10/13/03
16

App
endi
x T
able
2. A
naly
ses o
f Fee
dsto
ck a
nd S
ampl
ing
Port
Sam
ples
from
HSA
D S
yste
m D
urin
g T
est P
erio
d, a
s Rep
orte
d by
N
CD
A a
nd C
S A
gron
omic
Lab
orat
ory
(all
in p
pm, w
et b
asis
exc
ept D
M, %
)
Dat
e
Sam
ple
Cod
eN
(tot
al)
IN-N
NH
4N
O3
OR
-NU
rea
PZn
Cu
%D
M
*8/2
0/20
03
feed
stoc
kO
151
142
656
649
7.45
5048
61.
8615
301
1159
1639
21.2
98/
27/2
003
feed
stoc
kO
137
701
1125
709
416
3587
622
.117
610
1485
2605
17.4
69/
3/20
03
feed
stoc
kO
153
233
6897
6772
125
4633
723
.931
288
1958
3157
11.9
9/17
/200
3 fe
edst
ock
O1
1779
296
592
540
1682
712
.614
885
761
973
12.8
79/
22/2
003
feed
stoc
kO
145
459
3725
3431
320
4270
835
922
518
1803
2902
13.9
69/
29/2
003
feed
stoc
kO
117
958
45.3
35.2
10.1
1791
30.
5518
326
959
994
12.0
910
/13/
2003
fe
edst
ock
O1
n/a
n/a
n/a
n/a
n/a
n/a
n/a
n/a
n/a
n/a
10/2
0/20
03
feed
stoc
kO
150
482
6118
6021
9744
364
20.9
3140
522
9234
4715
.58
11/1
2/20
03
feed
stoc
kO
151
330
4309
4191
118
4702
139
2660
213
5922
9915
.29
Mea
n 40
637.
1329
80.0
428
41.6
514
1.69
3769
1.50
59.9
922
241.
8814
72.0
022
52.0
015
.06
Std
dev
1487
2.70
2646
.45
2635
.73
149.
0713
228.
6712
1.46
6803
.04
520.
6895
5.48
3.16
8/27
/200
3P
ort 1
O2
1423
514
1710
1640
112
818
11.3
8257
422
448
9.79
9/3/
2003
P
ort1
O2
1417
390
781
690
.113
267
7.27
1276
153
857
711
.99/
17/2
003
Por
t1O
212
594
319
298
2112
275
5.12
1249
656
362
212
.28
9/22
/200
3 P
ort1
O2
2028
310
0675
625
019
277
152
1135
674
985
611
.52
9/29
/200
3 P
ort1
O2
1589
735
.626
.39.
3315
861
0.73
1466
575
278
210
.86
10/1
3/20
03
Por
t1O
215
262
57.3
44.7
12.5
1520
50.
9814
301
987
927
9.87
10/2
0/20
03
Por
t1O
228
714
2964
2735
229
2575
012
.320
634
1293
1829
12.3
111
/12/
2003
P
ort1
O2
1909
915
2597
155
417
574
19.6
1685
783
612
3111
.41
Mea
n 17
532.
1310
28.8
683
2.88
195.
8716
503.
3826
.16
1391
5.88
767.
5090
9.00
11.2
4St
d de
v 52
01.9
797
0.37
864.
7720
1.62
4446
.07
51.2
337
11.3
427
8.64
443.
120.
99
17

Dat
e
Sam
ple
Cod
eN
(tot
al)
IN-N
NH
4N
O3
OR
-NU
rea
PZn
Cu
%D
M
9/
3/20
03
Por
t 2
O3
1115
7 60
9 54
2 67
10
549
7.8
1230
0 52
3 52
8 12
.02
9/17
/200
3 P
ort2
O3
1265
537
032
941
.412
275
010
182
473
540
10.5
79/
22/2
003
Por
t2O
316
842
820
580
239
1602
322
.710
609
656
725
11.3
9/29
/200
3 P
ort2
O3
1686
040
.431
.68.
8516
819
0.78
1685
391
482
910
.87
10/1
3/20
03
Por
t2O
315
660
45.5
3411
.515
615
0.65
1369
489
081
910
.82
10/2
0/20
03
Por
t2O
328
208
2812
2710
102
2539
613
.721
791
1319
2062
13.0
911
/12/
2003
P
ort2
O3
1570
581
873
087
.614
888
24.1
1654
283
312
3410
.76
Mea
n 16
726.
7178
7.84
708.
0979
.62
1593
7.86
9.96
1456
7.29
801.
1496
2.43
11.3
5St
d de
v 55
02.0
295
0.04
922.
6678
.78
4724
.10
10.4
241
25.2
928
7.50
539.
250.
91
9/17
/200
3 P
ort3
O4
1329
542
534
381
.412
870
5.65
1169
350
954
911
.64
9/22
/200
3 P
ort3
O4
1930
190
362
228
118
398
11.8
9869
692
781
11.4
19/
29/2
003
Por
t 3O
427
603
55.1
46.1
927
547
0.81
2236
413
8415
0710
.27
10/1
3/20
03P
ort 3
O4
1909
746
.535
.511
1905
10.
8713
631
979
918
8.7
10/2
0/20
03
Por
t3O
429
021
3583
3475
109
2543
827
2367
213
6220
9712
.55
11/1
2/20
03
Por
t3O
417
218
942
874
67.3
1627
625
.318
339
901
1335
11.5
5M
ean
2092
2.50
992.
4389
9.27
93.1
219
930.
0011
.91
1659
4.67
971.
1711
97.8
311
.02
Std
dev
6133
.17
1327
.93
1303
.48
100.
1755
61.8
711
.76
5735
.17
352.
0556
4.97
1.35
9/22
/200
3 P
ort4
O5
1762
679
156
922
216
835
8.81
1111
673
582
810
.95
9/29
/200
3 P
ort4
O5
1806
149
.434
.714
.618
012
0.55
1695
095
891
210
.63
10/1
3/20
03
Por
t4O
517
651
45.2
33.7
11.6
1760
60.
713
518
933
839
10.6
610
/20/
2003
P
ort4
O5
2870
226
8025
5712
326
022
15.5
2301
914
4821
0811
.24
11/1
2/20
03
Por
t4O
518
273
949
846
103
1732
423
.717
295
908
1376
9.56
Mea
n 20
062.
6090
2.92
808.
0894
.84
1915
9.80
9.85
1637
9.60
996.
4012
12.6
010
.61
Std
dev
4837
.38
1076
.67
1038
.64
87.1
738
59.9
39.
9445
03.8
626
7.20
549.
160.
64
18

App
endi
x T
able
3.
Tec
hnol
ogy
Prov
ider
’s D
aily
Ope
ratio
n L
og -
Bio
gas P
rodu
ctio
n D
ata
Day
D
ate
Com
men
tsA
ve.
Tem
p
Bio
gas
(CH
4)
mea
sure
d Th
eore
tical
C
H4
prod
(T
echn
olog
y su
pplie
r's d
aily
ope
ratio
n lo
g)
C0
L/da
y
L/da
yFr
iday
01-A
ug-0
329
Sat
urda
y
02-A
ug-0
334
Sun
day
03
-Aug
-03
37
Mon
day
04
-Aug
-03
38
Tues
day
05
-Aug
-03
38
Wed
nesd
ay
06
-Aug
-03
39
Thur
sday
07-A
ug-0
339
Frid
ay
08-A
ug-0
3 G
ot h
eat g
oing
to D
SR
2.
29
Sat
urda
y
09-A
ug-0
339
Sun
day
10
-Aug
-03
43
Mon
day
11
-Aug
-03
29
Tues
day
12
-Aug
-03
39
Wed
nesd
ay
13
-Aug
-03
44
Thur
sday
14-A
ug-0
339
Frid
ay
15
-Aug
-03
43
Sat
urda
y
16-A
ug-0
346
Sun
day
17
-Aug
-03
48
Mon
day
18
-Aug
-03
50
Tues
day
19
-Aug
-03
Fed
pig
was
te fr
om S
SS fo
r the
firs
t tim
e.
490
Wed
nesd
ay
20-A
ug-0
3 O
pene
d ho
t wat
er p
ump
wid
e op
en y
este
rday
. 49
0
Thur
sday
21-A
ug-0
350
1534
7
Frid
ay
22-A
ug-0
3 O
pene
d D
SR
1 he
ater
to D
SR
2 at
10:
00 a
m.
Exp
losi
on.
53
15
046
Sat
urda
y
23-A
ug-0
351
8090
Sun
day
24
-Aug
-03
4880
90
Mon
day
25-A
ug-0
3 Tu
rned
hea
ters
bac
k on
with
doo
r ope
n.
45
80
90
Tues
day
26
-Aug
-03
4880
90
Wed
nesd
ay
27-A
ug-0
3 H
eate
r bre
aker
faile
d - s
witc
hed
brea
kers
- fo
und
skin
t wire
. 50
8090
19

Day
D
ate
Com
men
tsA
ve.
Tem
p
Bio
gas
(CH
4)
mea
sure
d Th
eore
tical
C
H4
prod
(T
echn
olog
y su
pplie
r's d
aily
ope
ratio
n lo
g)
C0
L/da
y
L/da
yTh
ursd
ay
28
-Aug
-03
5180
90
Frid
ay
29
-Aug
-03
5714
800
Sat
urda
y
30-A
ug-0
359
0
Sun
day
31
-Aug
-03
580
Mon
day
01
-Sep
-03
570
Tues
day
02
-Sep
-03
560
Wed
nesd
ay
03
-Sep
-03
550
Thur
sday
04-S
ep-0
355
0
Frid
ay
05
-Sep
-03
540
Sat
urda
y
06-S
ep-0
355
0
Sun
day
07
-Sep
-03
550
Mon
day
08
-Sep
-03
550
Tues
day
09
-Sep
-03
540
Wed
nesd
ay
10
-Sep
-03
550
Thur
sday
11-S
ep-0
355
1480
0
Frid
ay
12-S
ep-0
3 N
ot g
assi
ng e
xcep
t for
slig
ht b
ubbl
ing.
56
1480
0
Sat
urda
y
13
-Sep
-03
Feed
ing
5614
800
Sun
day
14-S
ep-0
3 Fe
edin
g56
1480
0
Mon
day
15-S
ep-0
3 W
aitin
g fo
r Hur
rican
e Is
abel
la -
mm
inor
gas
sing
. 56
1480
0
Tues
day
16-S
ep-0
3 D
isch
argi
ng 5
dru
ms
- gas
sing
ver
y w
ell t
hru
sam
ple
port.
56
1480
0
Wed
nesd
ay
17
-Sep
-03
5614
602
Thur
sday
18
-Sep
-03
Isab
ella
due
in th
is A
M.
55
14
602
Frid
ay
19
-Sep
-03
5534
532
Sat
urda
y
20-S
ep-0
354
3453
2
Sun
day
21
-Sep
-03
5434
532
Mon
day
22-S
ep-0
3 O
PE
N te
am e
valu
atio
n 55
3453
2
Tues
day
23
-Sep
-03
5434
532
Wed
nesd
ay
24
-Sep
-03
5424
074
Thur
sday
25-S
ep-0
355
2407
4
20

Day
D
ate
Com
men
tsA
ve.
Tem
p
Bio
gas
(CH
4)
mea
sure
d Th
eore
tical
C
H4
prod
(T
echn
olog
y su
pplie
r's d
aily
ope
ratio
n lo
g)
C0
L/da
y
L/da
yFr
iday
26-S
ep-0
355
8682
Sat
urda
y
27-S
ep-0
354
8682
Sun
day
28
-Sep
-03
5486
82
Mon
day
29
-Sep
-03
5386
82
Tues
day
30
-Sep
-03
5386
82
Wed
nesd
ay
01
-Oct
-03
5519
387
Thur
sday
02-O
ct-0
364
1938
7
Frid
ay
03
-Oct
-03
6419
387
Sat
urda
y
04-O
ct-0
3-
1938
7
Sun
day
05
-Oct
-03
-19
387
Mon
day
06
-Oct
-03
6219
387
Tues
day
07
-Oct
-03
6219
387
Wed
nesd
ay
08
-Oct
-03
-19
387
Thur
sday
09-O
ct-0
361
1938
7
Frid
ay
10
-Oct
-03
6111
988
Sat
urda
y
11-O
ct-0
359
1198
8
Sun
day
12
-Oct
-03
5711
988
Mon
day
13-O
ct-0
3 B
egan
redu
cing
vol
ume
in D
SR
2 to
enh
ance
gas
pro
duct
ion.
54
0
Tues
day
14-O
ct-0
3 R
educ
ing
volu
me
(by
disc
harg
ing)
53
0
Wed
nesd
ay
15-O
ct-0
3 R
educ
ing
volu
me
500
Thur
sday
16
-Oct
-03
Red
ucin
g vo
lum
e51
0
Frid
ay
17
-Oct
-03
Red
ucin
gvo
lum
e54
0
Sat
urda
y
18
-Oct
-03
Red
ucin
g vo
lum
e56
0
Sun
day
19
-Oct
-03
Red
ucin
gvo
lum
e60
0
Mon
day
20-O
ct-0
3 R
educ
ing
volu
me
- OP
EN
team
eva
luat
ion
60
0
Tues
day
21-O
ct-0
3 P
ut b
oxes
on
heat
er c
oils
. 59
0
Wed
nesd
ay
22-O
ct-0
3 La
st o
f mas
s di
scha
rges
will
take
pla
ce th
is w
eeke
nd -
norm
al fe
edin
g ne
xt w
eek.
57
0
Thur
sday
23
-Oct
-03
Cal
led
FCI a
bout
DSR
2 m
eter
- w
ill s
end
out t
echn
icia
n.
55
0
Frid
ay
24
-Oct
-03
Feed
ing
agai
n54
1406
0
21
Day
D
ate
Com
men
tsA
ve.
Tem
p
Bio
gas
(CH
4)
mea
sure
d Th
eore
tical
C
H4
prod
(T
echn
olog
y su
pplie
r's d
aily
ope
ratio
n lo
g)
C0
L/da
y
L/da
yS
atur
day
25
-Oct
-03
5214
060
Sun
day
26
-Oct
-03
5214
060
Mon
day
27
-Oct
-03
5214
060
Tues
day
28
-Oct
-03
5314
060
Wed
nesd
ay
29
-Oct
-03
5214
060
Thur
sday
30-O
ct-0
351
1406
0
Frid
ay
31
-Oct
-03
New
DSR
2 m
eter
inst
alle
d 52
3893
1406
0
Sat
urda
y
01-N
ov-0
354
7182
1406
0
Sun
day
02
-Nov
-03
5832
492
1406
0
Mon
day
03
-Nov
-03
6026
883
1879
5
Tues
day
04
-Nov
-03
6227
361
1879
5
Wed
nesd
ay
05
-Nov
-03
6264
0018
795
Thur
sday
06-N
ov-0
361
1550
318
795
Frid
ay
07
-Nov
-03
6093
618
795
Sat
urda
y
08-N
ov-0
359
4490
618
795
Sun
day
09
-Nov
-03
5940
274
1879
5
Mon
day
10
-Nov
-03
5917
708
1879
5
Tues
day
11
-Nov
-03
5941
222
446
Wed
nesd
ay
12
-Nov
-03
580
2244
6
Thur
sday
13-N
ov-0
358
022
446
Frid
ay
14
-Nov
-03
5728
548
3749
2
Sat
urda
y
15-N
ov-0
358
5413
237
492
Sun
day
16
-Nov
-03
5881
449
3749
2
Mon
day
17
-Nov
-03
5858
517
3749
2
Tues
day
18
-Nov
-03
5845
058
3749
2
Wed
nesd
ay
19
-Nov
-03
5671
478
3749
2
Thur
sday
20-N
ov-0
358
8008
652
489
Frid
ay
21
-Nov
-03
5781
547
2877
7
Sat
urda
y
22-N
ov-0
358
5924
428
777
22

Day
D
ate
Com
men
tsA
ve.
Tem
p
Bio
gas
(CH
4)
mea
sure
d Th
eore
tical
C
H4
prod
(T
echn
olog
y su
pplie
r's d
aily
ope
ratio
n lo
g)
C0
L/da
y
L/da
yS
unda
y
23-N
ov-0
357
7535
928
777
Mon
day
24
-Nov
-03
5863
995
3464
7
Tues
day
25
-Nov
-03
5736
439
4949
6
Wed
nesd
ay
26
-Nov
-03
5735
638
4587
9
Thur
sday
27-N
ov-0
357
3559
645
879
Frid
ay
28
-Nov
-03
5625
734
4587
9
Sat
urda
y
29-N
ov-0
355
645
879
Sun
day
30
-Nov
-03
550
0
Mon
day
01
-Dec
-03
570
0
Tues
day
02
-Dec
-03
560
0
Wed
nesd
ay
03
-Dec
-03
560
0
Thur
sday
04-D
ec-0
357
110
0
Frid
ay
05
-Dec
-03
5545
845
879
Sat
urda
y
06-D
ec-0
355
384
0
Sun
day
07
-Dec
-03
5516
20
Mon
day
08
-Dec
-03
5515
40
Tues
day
09
-Dec
-03
550
0
Wed
nesd
ay
10
-Dec
-03
5549
0
Thur
sday
11-D
ec-0
355
10
Frid
ay
12
-Dec
-03
564
0
Sat
urda
y
13-D
ec-0
356
262
0
Sun
day
14
-Dec
-03
5584
40
Mon
day
15
-Dec
-03
5543
80
Tues
day
16
-Dec
-03
5318
60
Wed
nesd
ay
17
-Dec
-03
5316
0
Thur
sday
18-D
ec-0
353
00
Frid
ay
19
-Dec
-03
520
0
Satu
rday
20
-Dec
-03
No
mor
e sw
ine
was
te a
vaila
ble.
53
0
0
Sun
day
21
-Dec
-03
530
0
23

Day
D
ate
Com
men
tsA
ve.
Tem
p
Bio
gas
(CH
4)
mea
sure
d Th
eore
tical
C
H4
prod
(T
echn
olog
y su
pplie
r's d
aily
ope
ratio
n lo
g)
C0
L/da
y
L/da
yM
onda
y
22-D
ec-0
352
00
Tues
day
23
-Dec
-03
520
0
Wed
nesd
ay
24
-Dec
-03
5314
70
Thur
sday
25-D
ec-0
354
00
Frid
ay
26
-Dec
-03
5666
30
Sat
urda
y
27-D
ec-0
357
686
0
Sun
day
28
-Dec
-03
5617
90
Mon
day
29
-Dec
-03
5776
80
Tues
day
30
-Dec
-03
5838
10
Wed
nesd
ay
31
-Dec
-03
5812
00
Thur
sday
01-J
an-0
459
953
0
24

CH
4 Pr
oduc
tion
- OR
BIT
(HSA
D)
0
1000
0
2000
0
3000
0
4000
0
5000
0
6000
0
7000
0
8000
0
9000
0
9/11/1903
9/18/1903
9/25/1903
10/2/1903
10/9/1903
10/16/1903
10/23/1903
10/30/1903
11/6/1903
11/13/1903
11/20/1903
11/27/1903
Dat
e
CH4 Production (L/day)
CH
4 pr
oduc
tion
(mea
sure
d)
CH
4 pr
oduc
tion
(The
o)
__
A
ppen
dix
Figu
re 1
. O
RB
IT M
etha
ne P
rodu
ctio
n, T
heor
etic
al A
nd A
ctua
l, A
s Det
erm
ined
By
T
echn
olog
y Pr
ovid
er
25

App
endi
x T
able
4.
Tec
hnol
ogy
Prov
ider
’s D
aily
Ope
ratio
n L
og –
Fee
dsto
ck A
dditi
on a
nd D
iges
tate
Dis
char
ge D
ata
Dat
e C
omm
ents
Fe
edst
ock
Dis
char
geM
ean
(Tec
hnol
ogy
supp
lier's
dai
ly o
pera
tion
log)
lb
s kg
lb
s kg
lb
s kg
Fr
iday
01-A
ug-0
3
Sat
urda
y
02-A
ug-0
3
Sun
day
03
-Aug
-03
Mon
day
04
-Aug
-03
Tues
day
05
-Aug
-03
Wed
nesd
ay
06-A
ug-0
3
Thur
sday
07-A
ug-0
3
Frid
ay
08-A
ug-0
3 G
ot h
eat g
oing
to D
SR
2.
Sat
urda
y
09-A
ug-0
3
Sun
day
10
-Aug
-03
Mon
day
11
-Aug
-03
Tues
day
12
-Aug
-03
Wed
nesd
ay
13-A
ug-0
3
Thur
sday
14-A
ug-0
3
Frid
ay
15
-Aug
-03
Sat
urda
y
16-A
ug-0
3
Sun
day
17
-Aug
-03
Mon
day
18
-Aug
-03
Tues
day
19
-Aug
-03
Fed
pig
was
te fr
om S
SS fo
r the
firs
t tim
e.
660
300
W
edne
sday
20
-Aug
-03
Ope
ned
hot w
ater
pum
p w
ide
open
yes
terd
ay.
660
300
Thur
sday
21-A
ug-0
3 67
330
6
Frid
ay
22-A
ug-0
3 O
pene
d D
SR
1 he
ater
to D
SR
2 at
10:
00 a
m.
Exp
losi
on.
660
300
Sat
urda
y
23-A
ug-0
3 66
030
0
Sun
day
24
-Aug
-03
660
300
Mon
day
25-A
ug-0
3 Tu
rned
hea
ters
bac
k on
with
doo
r ope
n.
660
300
Tues
day
26
-Aug
-03
660
300
Wed
nesd
ay
27-A
ug-0
3 H
eate
r bre
aker
faile
d - s
witc
hed
brea
kers
- fo
und
skin
t wire
. 66
0 30
0
26
A
s re
porte
d by
tech
sup
plie
r N
CS
U A
PW
MC
D
ay
Dat
eC
omm
ents
Feed
stoc
kD
isch
arge
Mea
n
(T
echn
olog
y su
pplie
r's d
aily
ope
ratio
n lo
g)
lbs
kg
lbs
kg
lbs
kg
Thur
sday
28-A
ug-0
3 66
030
0
Frid
ay
29
-Aug
-03
660
300
Sat
urda
y
30-A
ug-0
3 0
0
Sun
day
31
-Aug
-03
00
Mon
day
01
-Sep
-03
00
Tues
day
02
-Sep
-03
00
Wed
nesd
ay
03-S
ep-0
30
0
Thur
sday
04-S
ep-0
3 0
0
Frid
ay
05
-Sep
-03
00
Sat
urda
y
06-S
ep-0
3 0
0
Sun
day
07
-Sep
-03
00
Mon
day
08
-Sep
-03
00
Tues
day
09
-Sep
-03
00
Wed
nesd
ay
10-S
ep-0
30
0
Thur
sday
11
-Sep
-03
660
300
Fr
iday
12
-Sep
-03
Not
gas
sing
exc
ept f
or s
light
bub
blin
g.
660
300
Sat
urda
y
13-S
ep-0
3 Fe
edin
g66
030
0
Sun
day
Fe
edin
g
14
-Sep
-03
660
300
Mon
day
15-S
ep-0
3 W
aitin
g fo
r Hur
rican
e Is
abel
la -
mm
inor
gas
sing
. 66
0 30
0
Tu
esda
y 16
-Sep
-03
Dis
char
ging
5 d
rum
s - g
assi
ng v
ery
wel
l thr
u sa
mpl
e po
rt.
660
300
Wed
nesd
ay
17-S
ep-0
366
030
0
Thur
sday
18
-Sep
-03
Isab
ella
due
in th
is A
M.
660
300
Frid
ay
19
-Sep
-03
660
300
Sat
urda
y
20
-Sep
-03
660
300
S
unda
y
21
-Sep
-03
660
300
M
onda
y
22
-Sep
-03
OPE
N te
am e
valu
atio
n st
art
660
300
Tues
day
23-S
ep-0
3 66
030
0 67
4.3
307
Wed
nesd
ay
24-S
ep-0
366
030
0
0
Th
ursd
ay
25-S
ep-0
3 66
030
0 57
8.0
263
27

As
repo
rted
by te
ch s
uppl
ier
NC
SU
AP
WM
C
D
ay
D
ate
Com
men
tsFe
edst
ock
Dis
char
ge
Mea
n
(T
echn
olog
y su
pplie
r's d
aily
ope
ratio
n lo
g)
lbs
kg
lbs
kg
lbs
kg
Frid
ay
26-S
ep-0
3 66
030
0 27
4.7
125
Sat
urda
y
27-S
ep-0
3 66
030
0
0
S
unda
y
28
-Sep
-03
660
300
247.
2 11
2
M
onda
y
29
-Sep
-03
660
300
312.
3 14
2
Tu
esda
y
30
-Sep
-03
660
300
611.
7 27
8
W
edne
sday
01-O
ct-0
366
030
0 59
9.0
272
Thur
sday
02
-Oct
-03
660
300
0
Frid
ay
03
-Oct
-03
660
300
0
Sat
urda
y
04-O
ct-0
3 66
030
0
0
S
unda
y
05-O
ct-0
3 66
030
0
0
M
onda
y
06
-Oct
-03
660
300
287.
8 13
1
Tu
esda
y
07-O
ct-0
3 66
030
0
0
W
edne
sday
08-O
ct-0
366
030
0 27
6.2
126
Thur
sday
09-O
ct-0
366
030
0 52
3.1
238
Frid
ay
10-O
ct-0
3 66
030
0 88
6.7
403
Sat
urda
y
11-O
ct-0
3 66
030
0
0
S
unda
y
12-O
ct-0
3 66
030
0
0
M
onda
y 13
-Oct
-03
Beg
an re
duci
ng v
olum
e in
DS
R2
to e
nhan
ce g
as p
rodu
ctio
n.
0 0
2573
.1
1,17
0
Tu
esda
y 14
-Oct
-03
Red
ucin
g vo
lum
e (b
y di
scha
rgin
g)
0 0
4932
.8
2,24
2
W
edne
sday
15-O
ct-0
3R
educ
ing
volu
me
00
752.
4 34
2
Th
ursd
ay
16
-Oct
-03
Red
ucin
g vo
lum
e0
0 64
55.6
2,
934
Frid
ay
17-O
ct-0
3 R
educ
ing
volu
me
00
686.
7 31
2
S
atur
day
18-O
ct-0
3 R
educ
ing
volu
me
00
3990
.9
1,81
4
S
unda
y
19-O
ct-0
3 R
educ
ing
volu
me
00
0
Mon
day
20-O
ct-0
3 R
educ
ing
volu
me
- OPE
N te
am e
valu
atio
n st
art
00
1007
.6
458
Tues
day
21-O
ct-0
3 P
ut b
oxes
on
heat
er c
oils
. 0
0 20
84.7
94
8
W
edne
sday
22
-Oct
-03
Last
of m
ass
disc
harg
es w
ill ta
ke p
lace
this
wee
kend
- no
rmal
feed
ing
next
wee
k.
0 0
1810
.7
823
Thur
sday
23
-Oct
-03
Cal
led
FCI a
bout
DS
R2
met
er -
will
sen
d ou
t tec
hnic
ian.
0
0 12
77.3
58
1
Fr
iday
24
-Oct
-03
Feed
ing
agai
n66
030
0 47
8.6
218
28

As
repo
rted
by te
ch s
uppl
ier
NC
SU
AP
WM
C
D
ay
D
ate
Com
men
tsFe
edst
ock
Dis
char
ge
Mea
n
(T
echn
olog
y su
pplie
r's d
aily
ope
ratio
n lo
g)
lbs
kg
lbs
kg
lbs
kg
Sat
urda
y
25
-Oct
-03
660
300
313.
7 14
3
S
unda
y
26-O
ct-0
3 66
030
0
0
M
onda
y
27-O
ct-0
3 66
030
0
0
Tu
esda
y
28
-Oct
-03
660
300
507.
7 23
1
W
edne
sday
29-O
ct-0
366
030
0 67
6.5
307
Thur
sday
30-O
ct-0
366
030
0 64
9.3
295
Frid
ay
31-O
ct-0
3 66
030
0 34
8.1
158
Sat
urda
y
01
-Nov
-03
660
300
371.
7 16
9
S
unda
y
02-N
ov-0
3 66
030
0
0
M
onda
y
03
-Nov
-03
660
300
343.
5 15
6
Tu
esda
y
04
-Nov
-03
660
300
726.
0 33
0
W
edne
sday
05-N
ov-0
366
030
0 49
5.5
225
Thur
sday
06
-Nov
-03
660
300
2444
.7
1,11
1
Fr
iday
07
-Nov
-03
660
300
2220
.4
1,00
9
S
atur
day
08-N
ov-0
3 66
030
0 16
66.5
75
8
S
unda
y
09
-Nov
-03
660
300
610.
4 27
7
M
onda
y
10
-Nov
-03
660
300
1433
.0
651
Tues
day
11-N
ov-0
3 66
030
0 11
58.7
52
7
W
edne
sday
12-N
ov-0
366
030
0 75
3.5
343
Thur
sday
13
-Nov
-03
660
300
370.
6 16
8
Fr
iday
14
-Nov
-03
1,10
050
0 14
72.9
67
0
S
atur
day
15-N
ov-0
3 1,
100
500
2315
.7
1,05
3
S
unda
y
16
-Nov
-03
1,10
050
0 11
53.8
52
4
M
onda
y
17-N
ov-0
3 1,
100
500
812
369
Tues
day
18
-Nov
-03
1,10
050
061
1.3
278
Wed
nesd
ay
19-N
ov-0
31,
100
500
843.
6 38
3
Th
ursd
ay
20-N
ov-0
3 1,
540
700
1474
.0
670
Frid
ay
21-N
ov-0
3 1,
540
700
2693
.9
1,22
5
S
atur
day
22
-Nov
-03
1,54
070
0
0
29

As
repo
rted
by te
ch s
uppl
ier
NC
SU
AP
WM
C
D
ay
D
ate
Com
men
tsFe
edst
ock
Dis
char
ge
Mea
n
(T
echn
olog
y su
pplie
r's d
aily
ope
ratio
n lo
g)
lbs
kg
lbs
kg
lbs
kg
Sun
day
23
-Nov
-03
1,54
070
038
7.8
176
Mon
day
24-N
ov-0
3 1,
540
700
1174
.5
534
Tues
day
25-N
ov-0
3 2,
200
1,00
0 11
04.8
50
2
W
edne
sday
26-N
ov-0
32,
200
1,00
0 22
23.5
1,
011
Thur
sday
27
-Nov
-03
2,20
01,
000
440.
7 20
0
Fr
iday
28
-Nov
-03
2,20
01,
000
833.
6 37
9
S
atur
day
29
-Nov
-03
2,20
0 1,
000
0
67,5
53
30,7
06
Sun
day
30
-Nov
-03
00
0
Mon
day
01
-Dec
-03
00
0
Tues
day
02-D
ec-0
3 0
0 13
09.7
59
5
W
edne
sday
03-D
ec-0
30
0 29
5.1
134
Thur
sday
04-D
ec-0
3 0
0
0
Fr
iday
05
-Dec
-03
66
9.0
304
Sat
urda
y
06
-Dec
-03
19
19.0
87
2 68
146.
1
30,9
76S
unda
y
07-D
ec-0
3 42
6.8
194
Mon
day
08-D
ec-0
3
2447
.8
1,11
3
Tu
esda
y
09
-Dec
-03
21
57.6
98
1
W
edne
sday
10-D
ec-0
3
1163
.7
529
Thur
sday
11
-Dec
-03
84
7.0
385
Frid
ay
12-D
ec-0
3
373.
3 17
0
S
atur
day
13
-Dec
-03
0
7556
2.3
34
,347
Sun
day
14-D
ec-0
3
3144
.0
1,42
9
M
onda
y
15
-Dec
-03
26
27.2
1,
194
Tues
day
16-D
ec-0
3
3263
.3
1,48
3
W
edne
sday
17-D
ec-0
3
2426
.0
1,10
3
Th
ursd
ay
18-D
ec-0
3
1095
.6
498
8811
8.4
40
,054
Frid
ay
19
-Dec
-03
Sat
urda
y
20
-Dec
-03
No
mor
e sw
ine
was
te a
vaila
ble.
S
unda
y
21-D
ec-0
3
30

ORBIT US ARMY Dem/Val Final Report 25 Feb 2004
Executive Summary Military Need The technology demonstration and validation described in this report responds to the Army’s pollution prevention requirement on recycling, A (3.5.c). The system tested and proven in this Dem/Val also has considerable potential to fulfill the Zero Footprint Camp initiative’s need for a transportable system for overseas deployments. That goal is priority number one for the Army. Dem/Val Background Between August 2, 2002 and November 6, 2003, HSAD was tested and evaluated for potential Army use under a contract issued to Unisphere Inc., an Army contractor responsible for assessing, developing and commercializing dual use technologies under the direction of Office of the Assistant Secretary of the Army (Installations and Environment) (ASAI&E). Unisphere subcontracted all tasks in the “HSAD Demonstration/Validation Test and Evaluation Plan” (DCC-W Contract No.: DASW01-02-0033) to Organic Biotechnologies, LLC (ORBIT), a company established to develop HSAD for ultimate use by military and commercial customers. ORBIT performed all test plan tasks at its near-commercial scale plant 10 miles west of Clinton, NC and 35 miles east of Fort Bragg. Food waste from Army mess halls and paper waste were picked up at Fort Bragg, transported to the ORBIT plant and converted into two value-added products: biogas and a pathogen free digestate that is appropriate for use as a soil amendment.
History of HSAD In The U.S. The commercial scale HSAD plant near Clinton, NC is believed to be the first of its kind in the United States. Thermophilic anaerobic digestion has flourished in Europe for the last two decades. Unlike its U.S. counterpart, most European technology is based on designs adapted, for the most part, from wastewater treatment systems. The European industry is fostered by high electricity rates and high landfill tipping fees. Recent attempts by firms there to penetrate the U.S. market have not succeeded. Lab scale experiments with HSAD began at the National Renewal Energy Laboratory (NREL) in Golden, CO in the late 1980s. Over the next decade, NREL spent $8.5 million developing the technology. To breed a thermophilic consortium, NREL gathered bacteria from volcanic “hot spots” like Old Faithful, the Chicago Stockyards and municipal sewer systems where unusual species had proven their survivability. Gradually, as the consortium developed, so did a new mechanical approach. The basic mechanical problem associated with HSAD was the feeding, mixing, agitation, and discharge of 35% to 40% solids. The pug tine technology resolved the issue of how to mix high solids materials without damaging the microbial films. A food industry ribbon blender was found to be adequate for mixing the high solids feed stocks, and screw
31
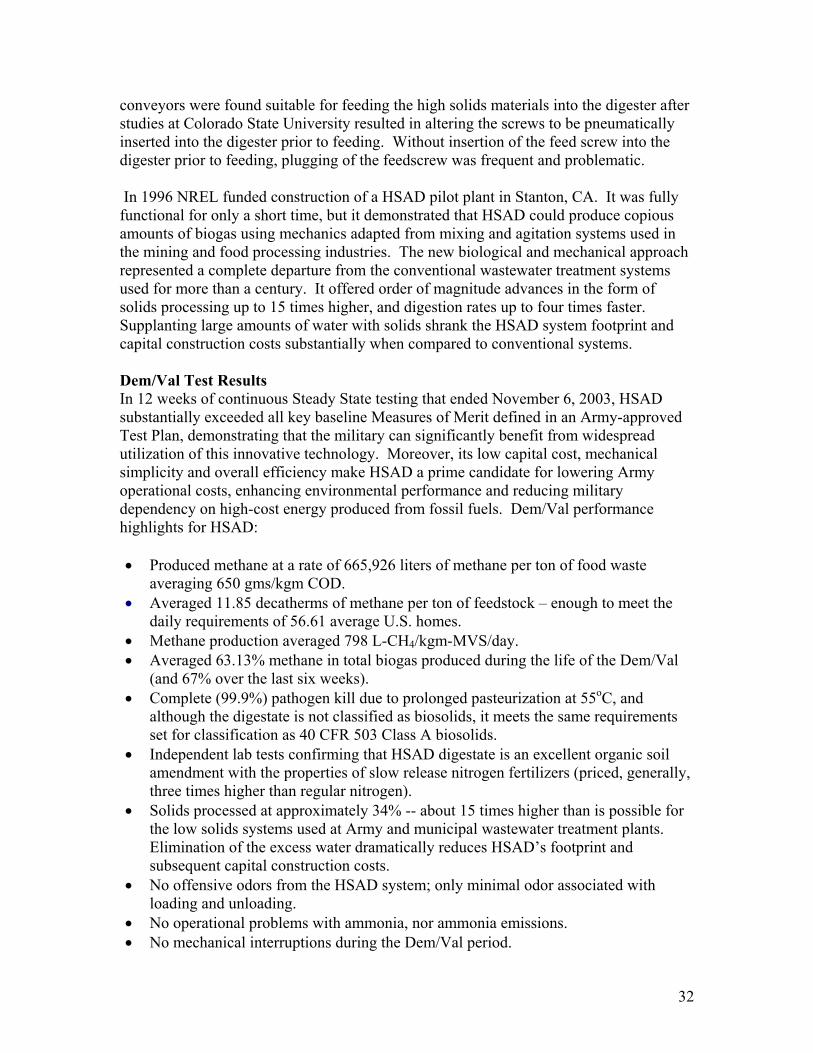
conveyors were found suitable for feeding the high solids materials into the digester after studies at Colorado State University resulted in altering the screws to be pneumatically inserted into the digester prior to feeding. Without insertion of the feed screw into the digester prior to feeding, plugging of the feedscrew was frequent and problematic. In 1996 NREL funded construction of a HSAD pilot plant in Stanton, CA. It was fully functional for only a short time, but it demonstrated that HSAD could produce copious amounts of biogas using mechanics adapted from mixing and agitation systems used in the mining and food processing industries. The new biological and mechanical approach represented a complete departure from the conventional wastewater treatment systems used for more than a century. It offered order of magnitude advances in the form of solids processing up to 15 times higher, and digestion rates up to four times faster. Supplanting large amounts of water with solids shrank the HSAD system footprint and capital construction costs substantially when compared to conventional systems. Dem/Val Test Results In 12 weeks of continuous Steady State testing that ended November 6, 2003, HSAD substantially exceeded all key baseline Measures of Merit defined in an Army-approved Test Plan, demonstrating that the military can significantly benefit from widespread utilization of this innovative technology. Moreover, its low capital cost, mechanical simplicity and overall efficiency make HSAD a prime candidate for lowering Army operational costs, enhancing environmental performance and reducing military dependency on high-cost energy produced from fossil fuels. Dem/Val performance highlights for HSAD: • Produced methane at a rate of 665,926 liters of methane per ton of food waste
averaging 650 gms/kgm COD. • Averaged 11.85 decatherms of methane per ton of feedstock – enough to meet the
daily requirements of 56.61 average U.S. homes. • Methane production averaged 798 L-CH4/kgm-MVS/day. • Averaged 63.13% methane in total biogas produced during the life of the Dem/Val
(and 67% over the last six weeks). • Complete (99.9%) pathogen kill due to prolonged pasteurization at 55oC, and
although the digestate is not classified as biosolids, it meets the same requirements set for classification as 40 CFR 503 Class A biosolids.
• Independent lab tests confirming that HSAD digestate is an excellent organic soil amendment with the properties of slow release nitrogen fertilizers (priced, generally, three times higher than regular nitrogen).
• Solids processed at approximately 34% -- about 15 times higher than is possible for the low solids systems used at Army and municipal wastewater treatment plants. Elimination of the excess water dramatically reduces HSAD’s footprint and subsequent capital construction costs.
• No offensive odors from the HSAD system; only minimal odor associated with loading and unloading.
• No operational problems with ammonia, nor ammonia emissions. • No mechanical interruptions during the Dem/Val period.
32

• An economic study, conducted as part of the test and evaluation of HSAD, projects, based on actual operating data and experience, an 18.8% internal rate of return from a 6.5 ton per day system processing Army organic waste on or near Ft. Bragg. The economic study in this report does not contemplate use of either the screw press or liquid fertilizer storage.
• The Dem/Val test demonstrates that the HSAD process is resilient in nature, can be operated by one trained worker, and is extremely efficient at producing a large amount of energy from a relatively small amount of waste products.
Tables 1, 2 and 3 provide Critical Measures of Merit and actual results for HSAD’s Dem/Val performance using technical, environmental and economic criteria.
33

Table 1- Critical Technical HSAD Measures of Merit
Critical Measure Dem/Val Benchmark Dem/Val Result
Average Biomass Conversion Efficiency (BCE) 55-60%% 65.4%
Chemical Oxygen Demand (COD) Total Destruction 60% 87%
Methane Production-NL-CH4/kgm-COD @100% Conversion 330 525
Average Methane Content in Biogas, % 55% 63.13%
Maximum Daily Methane Content in Biogas, % 55% 79.03%
Average Daily Methane Production, NLM 105,000 332,963
Average Organic Loading Rate, gms-VS/kgm/day 5.0 5.17
Maximum Organic Loading Rate, gms-VS/kgm/day 5.0 8.53
Average Digestate pH 6.6 to 8.2 7.75
Digester Internal Temperature 50oC to 65oC 52oC
Average COD, gms/kgm (wet) 500 650
Pathogen Kill >99% 99.9%
.
34

Table 2-Critical Environmental HSAD Measures of Merit
Critical Measure Dem/Val Benchmark Dem/Val Result
Waste spills in transport None None
Ensure Containment of Food Waste Until Processing Begins
Maintain in closed containers until
processing begins
Food Wastes contained in same containers until
processed
Prevent Liquid Runoff No runoff from liquid tanks No liquid runoff
Prevention of Odor No discernable odor No odor
Compliance with NC DENR Environmental Regulations Compliance Full Compliance
Table 3- Critical Economic HSAD Measures of Merit
Title Dem/Val Operation Benchmark Dem/Val Achievement
Internal Rate of Return Positive 18.8%
Reduced Army operating costs Show potential to lower May lower by one third or
more
Capital construction costs Identify potential reductions Design innovations to lower substantially
Organic fertilizer product Prove production viability Excellent qualities
HSAD an Innovative Technology The demonstration defined significant innovations in four areas: 1) A new methodology for film transfer of end products of different bacteria in the complete consortium; 2) The mechanical system – including mixing system; hydraulically operated ratchet assembly; and the screw feeder; 3) Operational knowledge that could only be developed through trial and error experience; and 4). a new transportable design for a stand-alone system that will facilitate on-farm deployments and deployments on military bases. Several of these innovations will be patented and are protected currently as trade secrets.
HSAD is truly innovative anaerobic technology based on the theory of film transfer of digestive products between anaerobic microbes in a solids environment, and as such, HSAD is significantly different from any other anaerobic system in that it utilizes sub-rpm, low-shear, pug-tine agitation to protect and preserve the bacterial films required for efficient digestion, maintain constant contact between the hydrolytic bacteria and the food substrate for rapid breakdown and solubilization of polymers, and a bacterial consortium that has been adapted to concentrations of ammonia that exceed 4,000 ppm.
35

The Future of HSAD When the Dem/Val period ended on November 6, ORBIT doubled the feed rate of Army food waste to see how the system would respond. It reacted by producing more than 500,000 liters of methane in the next 24-hour period. Feeding at this new organic loading rate continued for over the next week with no negative effects, thus refuting the notion that organic loading rates must be increased very slowly. Results of this Dem/Val proved that HSAD is relatively simple to manage biologically and mechanically. The system’s operating efficiency, low capital cost and high internal rate of return point the way to broad adoption of the technology by military and commercial customers. Even more important is the fact that HSAD addresses what many believe is the greatest environmental problem the U.S. currently faces: i.e. rising amounts of and costs associated with disposal of organic wastes that pollute aquifers, watersheds and the air we breathe.
36