Embed Size (px)
Citation preview

1
SUMMETHSustainable Marine Methanol
Environmental Performance and Provision of Sustainable Methanol for the Smaller Vessel Fleet
Final Seminar6 December 2017
Joanne Ellis, SSPA Sweden AB

Outline
2
• Environmental performance– Fuel life cycle assessment and
comparison– Data sources and analysis– Results
• Methanol supply chain– Production– Transport– Bunkering– Fuel costs
SUMMETH J. Ellis 20171206

Why is methanol interestingas a fuel from an environmental perspective?
3
• No sulphur, so is an option for meeting SECA requirements
• Low emissions of particulates and nitrogen oxide, even withoutexhaust gas after-treatment
• In the event of a spill to water it dissolves, is biodegradable and doesnot bio-accumulate (GESAMP)
• Can be produced from manyrenewable feedstocks, includingbiomass and CO2 – this can result in significant GHG reductions for fueluse
SUMMETH J. Ellis 20171206

Methanol fuel feedstock and production – overview
NaturalGas (methane)
Synthesis Gas
Methanol
RenewablesFossil Feedstock
CoalOil
Gasification of biomass / waste
4
Farmedwood(SRF)
CO2 plus renewable energy
Natural gas reformation and catalytic synthesis
CO2 , energyfrom geothermal (CRI Iceland)
CO2from steelmillFreSMe
CO2from wasteplantLiquidWind
Municipal Solid Waste (Enerkemin Canada)
Forest Residues(Värmlands Methanol
Black Liquor(Chemrec)
Synthesis with H2 from water electrolysis
SUMMETH J. Ellis 20171206

Production locations for methanol
5
Image: MethaShip project as shown in Ellis, J. and K. Tanneberger. 2015. Study on the use of ethyl and methyl alcohol as alternative fuels inshipping. Report prepared for the European Maritime Safety Agency (EMSA).
3 kT
SUMMETH J. Ellis 20171206

Extraction, cultivation, capture, etc. ofprimary energysource
Fuel Production
Ex.: refining (fueloils), biomassgasification, electrolysis to produce H2 and CO2capture
Transport, storage, and distribution offuel to the ship’stanksMay include severalsteps (e.g. may be transported to largehub with furtherfeeder transport)
Fuel Use
Emissions from fuel combustion on board
Well to Tank Chain Tank to propeller or ”tank to wake”
Fuel Life Cycle Assessment Main Steps
SUMMETH J. Ellis 20171206

7
Life cycle approach for marine fuel assessmentfor SUMMETH
Impactassessment
Interpretation
Main components of an LCA study [ISO 14040] 1997
InventoryAnalysis
Goal and scopedefinition
• Focus on North West Europe fleet ofsmaller vessels, case study ferry
• Well-to-tank fuel data adapted from:• Fuels in the Baltic Sea (Brynolf,
2014)• JEC Well to Tank Study• Literature sourcesAdaptation of transport and distribution to reflect supply to smaller vessels
• Tank to wake (combustion) from SUMMETH WP3 and GreenPilot for methanol concepts. Comparison for MGO from published emission factorsfor marine engines; for road ferry casefrom measurement data
SUMMETH J. Ellis 20171206

Impact categories
8
• Inventory categories for the fuel life cycle comparison:• Greenhouse gases
(GHGs) (CO2, N2O, CH4)• SOx• NOx• Particulates
Corresponding to impacts:• climate change• eutrophication• acidification• health effects
SUMMETH J. Ellis 20171206

Particulate emission impacts
9
The European Environment Agency 2016 air quality report states that health impact estimates from air pollution attribute PM 2.5 to 467 000 premature deaths in Europe from long term exposure
SUMMETH

Pathways considered for fuel production - WTT
10
MGO, Diesel
Crude oil Extraction and conditioning at source
Transport(Shipping)
RefiningTransport to port, storage, bunkering
MGO
DieselShip’s tank
Methanol from natural gas
Crudenaturalgas
Extraction and processing at source
Methanolsynthesis at source
Sea transport by tanker500 NM
MethanolPort storage
Transport by road tanker to ship’s tank
Methanol from forestry residuals
Forestryresidues
CollectionGasificationMethanolSynthesis
Methanol
to ship’s tank
Transport by road tanker
Road transport
Methanol from black liquor gasification
Pathways adapted from ”Well-to-tank Report Version 4.0”, JEC Well to Wheels Analysis” of Future Automotive Fuels and Powertrains in the Automotive Context”, 2013, Report EUR 26028
SUMMETH J. Ellis 20171206
Waste wood via black liquor
Collection ofwaste wood
Methanol
to ship’s tank
Transport by road tanker
BL Gasifier + MeOHSynthesis
Road transport

Comparison of emissions per MJ fuel produced (WTT)
11
* Estimate based on production of methanol from renewable hydrogen and carbon dioxide as described in Matzen and Demeril (2016).
Fuels CO2 CH4 N2O GHGs NOx SOx PM10
g/MJ g/MJ g/MJ g CO2e/MJ g/MJ g/MJ g/MJ
MGO, 0.1% S 7,1 0,078 0,00017 9,3 0,023 0,041 0,00110Methanol from natural gas 20,5 0,011 0,00031 20,9 0,051 0,003 0,00063Methanol, from forest residues 17,0 0,043 0,00021 18,3 0,047 0,046 0,01080
Methanol black liquor 3,1 0,011 0,00835 5,7 - - -
Methanol, from biogenic CO 2 , wind energy* 7,4 0,012 0,01420 11,5 0,029 0,017 0,00239
SUMMETH J. Ellis 20171206

GHG reductions of other methanol production pathways
12
• Carbon Recycling International – Iceland: certified by the International Sustainability and Carbon Certification system (ISCC) as an ultra-low carbon advanced renewable transport fuel. Stated that the methanol has 75% lower GHG emissions than standard fuel.
• Enerkem: municipal waste to methanol to ethanol. Received lowest ever carbonintensity value issued by the British Columbia governmentunder the renewable and lowcarbon fuel regulation.
SUMMETH J. Ellis 20171206

Comparison of emissions per MJ fuel combusted
13
Fuel and Engine Concept CO2 CH4 N2O GHGs NOx SOx PM10*
g/MJ g/MJ g/MJ g CO2e/MJ g/MJ g/MJ g/MJ
MGO, 0.1% S, High Speed Diesel1 74,5 0,00046 0,004 75,4 1,371 0,047 0,011MK 1 (Diesel), with particle filter, measurements on Göta (Scania)2 71,5 71,5 0,781 0,000046 0,00048MK 1 (Diesel), no particle filter, measurements on Göta (Scania)2 72,3 72,3 0,820 0,000046 0,00947MK 1 (Diesel), with particle filter, lab measurements (by EMTEC, Penta engine)3 74,3 74,3 0,635 0,00056MK 1 (Diesel), no particle filter, lab measuremenets (Penta engine)3 74,2 74,2 0,639 0,0054Methanol, spark ignited, port fuel injection, no particle filter, 64% MCR4 70,0 70,0 0,285 1,9E-06
Methanol, PPC, with 3 way catalyst, lab measurements (Lund) 5 69,1 69,1 0,039 5,2E-07Methanol, DI-SI, lab measurements (Lund) 6 69,1 69,1 0,012 < 0,0001
1 from Cooper and Gustafsson (2004) and Brynolf (2014); 2 Winnes and Peterson, 2012; 3 STT Emtec Presentation; 4 Molander, 2017; 5 scaled from Shamun et al. 2016; 6 Björnestrand, 2017. *For the methanol spark ignited port fuel injection total particulate matter was measured.
SUMMETH

Comparison of emissions per MJ fuel Well to Propeller
14
0
10
20
30
40
50
60
70
80
90
100
MGO MK 1 Methanol(NG)
Methanol(wood res.)
Methanol(BLG)
Methanol(CO2 and
Wind)
WTW
GHG
Em
issi
ons a
s CO
2eq
per
MJ f
uel
Well-to-tank Tank to propeller
SUMMETH J. Ellis 20171206

Particulate and NOx Emissions
15
0,000
0,002
0,004
0,006
0,008
0,010
0,012
0,014
MGO MK 1 MK 1 Particle Filter Methanol (NG)
WTW
Par
ticle
Emis
sion
s as g
per
MJ f
uel
Well-to-tank Tank to propeller
0,0
0,2
0,4
0,6
0,8
1,0
1,2
1,4
1,6
MGO MK 1 MK 1 Particle Filter Methanol (NG)
WTW
NO
x Em
issi
ons a
s g p
er M
J fue
l
Well-to-tank Tank to propeller
• Significant PM reductions withmethanol (no particle filter needed)
• NOx – majority of emissions occur during the ”tank to propeller” phase; methanolcombustion results in significantly lower NOxemissions
SUMMETH J. Ellis 20171206

Methanol supply and distribution to the smaller vesselsegment
16
- Supply chain approach to compare fuelsfrom different feedstocks and assessfeasibility
- Some considerations for renewablefeedstocks
- Economies of scale of production vs diseconomies of scale of acquiring larger volumes due to longer distances
- Feedstock storage required due to seasonal issues – size optimisation
- Optimising location and size ofproduction facility to minimisefeedstock and product transport costs
- Integration: using both feedstock (the by-products) and residual heat from the processes
MethanolProduction
Storage Hub
Transport
Transport
Natural gas extraction and processing
Transfer to ship fuel tanks
Fossil feedstock Renewable
Feedstockcollection
MethanolProduction
Feedstockcollection Feedstock
collection
Transport
Transport
Storage offeedstock
SUMMETH J. Ellis 20171206
17
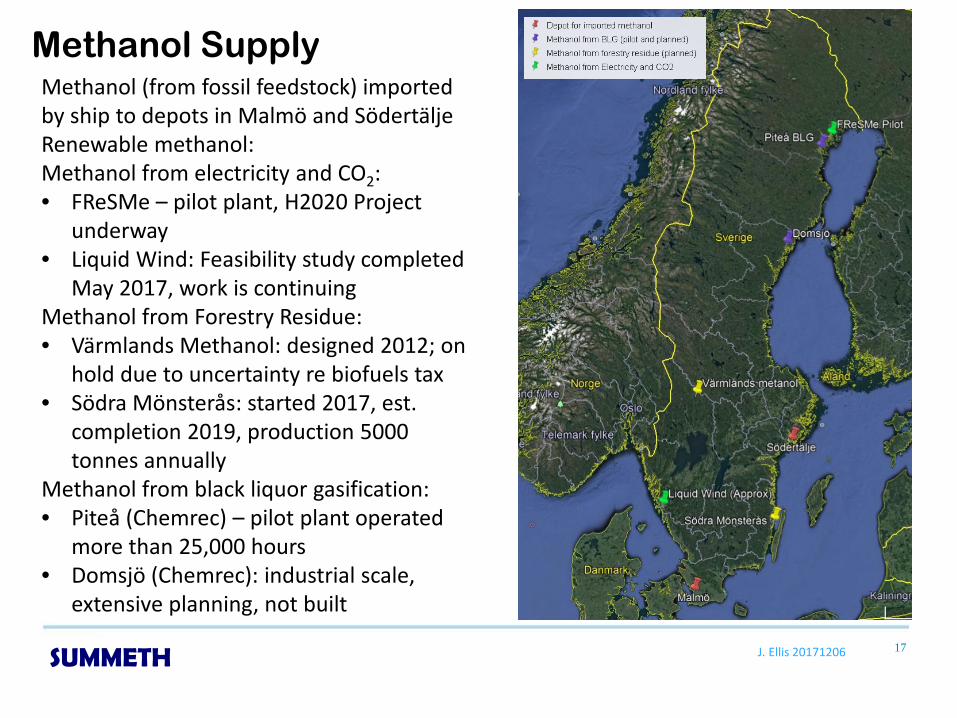
Methanol SupplyMethanol (from fossil feedstock) importedby ship to depots in Malmö and SödertäljeRenewable methanol:Methanol from electricity and CO2:• FReSMe – pilot plant, H2020 Project
underway• Liquid Wind: Feasibility study completed
May 2017, work is continuingMethanol from Forestry Residue:• Värmlands Methanol: designed 2012; on
hold due to uncertainty re biofuels tax• Södra Mönsterås: started 2017, est.
completion 2019, production 5000 tonnes annually
Methanol from black liquor gasification:• Piteå (Chemrec) – pilot plant operated
more than 25,000 hours• Domsjö (Chemrec): industrial scale,
extensive planning, not built
SUMMETH J. Ellis 20171206

18
40 TWh of methanol = 7.2 million tonnes
Potential for methanol production from biomass in Sweden
Methanol production as a function of biomass potential for different conversion efficienciesSource: Landälv, I. 2017. Methanol as a renewable fuel – a knowledge synthesis. Report No. f3 2015:08. The Swedish Knowledge Centre for Renewable Transportation Fuels (f3)
Marine Fuel Use – annual (examples)North West Europe, vessels with ME 250 kW – 1200 kW: 525 000 tSwedish Icebreaker Atle: 990 tJupiter Road Ferry: Est. 700 t
SUMMETH J. Ellis 20171206
19
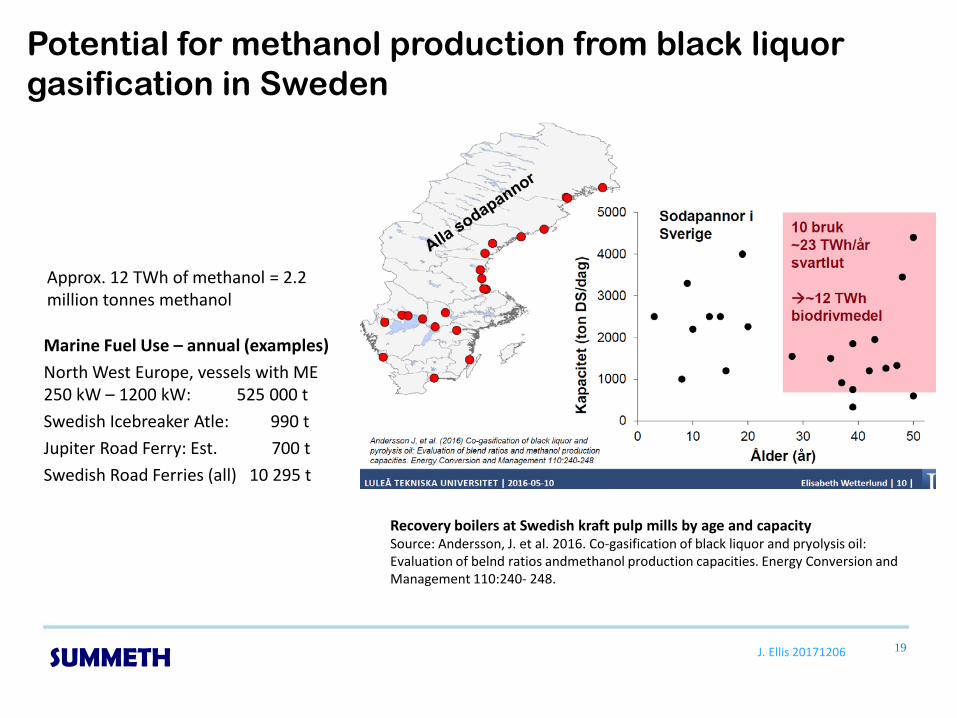
Potential for methanol production from black liquorgasification in Sweden
Recovery boilers at Swedish kraft pulp mills by age and capacitySource: Andersson, J. et al. 2016. Co-gasification of black liquor and pryolysis oil: Evaluation of belnd ratios andmethanol production capacities. Energy Conversion and Management 110:240- 248.
Marine Fuel Use – annual (examples)North West Europe, vessels with ME 250 kW – 1200 kW: 525 000 tSwedish Icebreaker Atle: 990 tJupiter Road Ferry: Est. 700 t Swedish Road Ferries (all) 10 295 t
Approx. 12 TWh of methanol = 2.2 million tonnes methanol
SUMMETH J. Ellis 20171206

20
Transport • Methanol is regularly transported by road and rail• Class 3 flammable liquid according to the UN dangerous goods
classification (same category as many other liquid fuels)• Transport by road according to ADR-S regulations; by rail according
to RID
SUMMETH J. Ellis 20171206
21
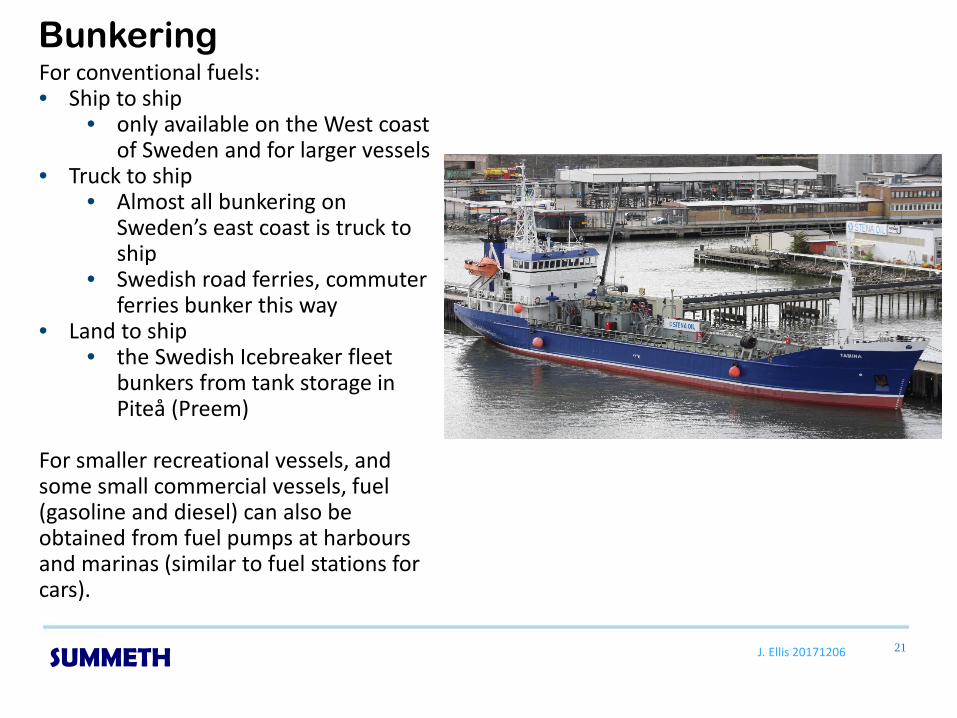
BunkeringFor conventional fuels:• Ship to ship
• only available on the West coastof Sweden and for larger vessels
• Truck to ship• Almost all bunkering on
Sweden’s east coast is truck to ship
• Swedish road ferries, commuterferries bunker this way
• Land to ship• the Swedish Icebreaker fleet
bunkers from tank storage in Piteå (Preem)
For smaller recreational vessels, and some small commercial vessels, fuel(gasoline and diesel) can also be obtained from fuel pumps at harboursand marinas (similar to fuel stations for cars).
SUMMETH J. Ellis 20171206

22
Bunkering
For methanol:• SPIRETH project bunkered from a
truck on deck• Stena Germanica bunkers from tanker
trucks via a pump station on shore
Most smaller vessels as investigated in the SUMMETH project already bunker by truck, thus infrastructure is not a problem.
SUMMETH J. Ellis 20171206

23
Fuel Prices / Production Costs
0,0
10,0
20,0
30,0
40,0
50,0
60,0
70,0
80,0
90,0
jul-0
9
nov-
09
mar
-10
jul-1
0
nov-
10
mar
-11
jul-1
1
nov-
11
mar
-12
jul-1
2
nov-
12
mar
-13
jul-1
3
nov-
13
mar
-14
jul-1
4
nov-
14
mar
-15
jul-1
5
nov-
15
mar
-16
jul-1
6
nov-
16
mar
-17
jul-1
7
EU
R/M
Wh
MGO Price
Methanol (NG) Price
Methanol from wood: 56 -91
Methanol from municipal waste (Italian case): 20
Methanol from BLG: 69
HVO: 50 – 90
e- methanol: 80 - 140
Estimated production costs
SUMMETH Data sources: Bunker Index for MGO, Methanex for Methanol NG (European contractprice); Landälv (2017) methanol BLG; Landälv and Waldheim (2017) HVO and methanol from wood; Ianquaniello et al. (2017) for methanol from municipal waste; Taljegård et al. 2015 for e-methanol

24
Sustainable Methanol for Smaller Vessels: Summary
Opportunities:• Significant reduction of GHGs with
renewable feedstock• Large reductions in PM reductions• Many local feedstocks and production
opportunities• Distribution system essentially in place,
no challenges technically
Barriers:• Economic: Cost for fuel – mechanisms
for encouraging the use of renewables
SUMMETH J. Ellis 20171206

Thank you!
25SUMMETH