Embed Size (px)
Citation preview

YMPÄRISTÖN-SUOJELU
ENVIRONMENTALPROTECTION
CA
RB
ON
FO
OT
PR
INT
CA
LC
UL
AT
OR
S F
OR
PU
BL
IC P
RO
CU
RE
ME
NT
THE FINNISH ENVIRONMENT 36 | 2011
Carbon Footprint Calculators for Public Procurement
Maija Mattinen and Ari Nissinen
Finnish Environment Institute
Green public procurement is a way for public authorities to
reduce environmental impacts of goods and services they procure.
This publication describes carbon footprint calculators for public
procurement, developed for six product groups: office and tissue
paper, laptop computers, office seating solutions, incontinence
products, and outdoor lighting products. Additionally, the piloting
of one calculator in a real tender call case is described, and general
aspects of the use of tools in public procurement are discussed.
ISBN978-952-11-3961-1 (PDF)
ISSN 1796-1637 (verkkoj.)
TH
E F
INN
ISH
EN
VIR
ON
ME
NT
36
| 20
11


THE FINNISH ENVIRONMENT
Helsinki 2011
FINNISH ENVIRONMENT INSTITUTE
Carbon Footprint Calculators for Public Procurement
Maija Mattinen and Ari Nissinen

THE FINNISH ENVIRONMENT 36 | 2011Finnish Environment InstituteCentre for Sustainable Consumption and Production
Cover photo: Virpi Liesimaa: Pekka Jylhä´s Spring/UKK Monument.Layout: Liisa LamminpääThe publication is availablein in the internet: www.ymparisto.fi/publications
ISBN 978-952-11-3961-1 (PDF)ISSN 1796-170X (online)

CONTENTS
1 Introduction ................................................................................................................71.1 Background...............................................................................................................7
1.2 Objectives .................................................................................................................7
1.3 Scope ..........................................................................................................................8
1.4 Approach ...................................................................................................................8
1.5 Structure ...................................................................................................................8
2 Basic Concepts ...........................................................................................................92.1 Life Cycle Approaches ...........................................................................................9
2.2 Carbon Footprint ....................................................................................................9
2.2.1 Streamlined Carbon Footprint Evaluation ........................................... 10
2.3Environmental Product Declaration ..................................................................10
2.4 Carbon Footprint as an Award Criterion .........................................................10
3 Calculator Development .................................................................................... 123.1 Motivation ..............................................................................................................12
3.2 Development Process ...........................................................................................12
3.3 Calculators in Tender Calls.................................................................................13
3.3.1 Carbon Footprint Calculation ................................................................. 14
4 Product Group-Specific Calculators ............................................................. 154.1 Paper Products .......................................................................................................15
4.1.1 Literature Review ...................................................................................... 154.1.2 Paper Calculator Approach ..................................................................... 19
4.2 Incontinence Products ..........................................................................................20
4.2.1 Literature Review on Inco-Products ...................................................... 204.2.2 Inco Calculator Approach .......................................................................22
4.3 Office Chairs ..........................................................................................................24
4.3.1 Literature Review on Office Chairs ....................................................... 244.3.2 Office Chair Calculator Approach ......................................................... 27
4.4 IT- Products ............................................................................................................29
4.4.1 Literature Review on IT-products .......................................................... 294.4.2 Laptop Calculator Approach .................................................................. 31
4.5 Outdoor Lighting .................................................................................................33
4.5.1 Literature Review on Lighting ...............................................................334.5.2 Lighting Calculator Approach ...............................................................35
3The Finnish Environment 36 | 2011

4 The Finnish Environment 36 | 2011
5 Demonstration Results and Discussion ........................................................ 365.1 First Attempts ........................................................................................................36
5.2 IT-Calculator ..........................................................................................................36
5.3 Observations ..........................................................................................................37
5.3.1 Limitations of the Calculators ................................................................ 37
5.4 Discussion ..............................................................................................................38
6 Summary and Conclusions ................................................................................406.1 Summary .................................................................................................................40
6.2 Conclusions ............................................................................................................40
6.3 Suggestions for Future Improvements .............................................................40
Bibliography ................................................................................................................... 41
Appendix A. MEEUP Unit Indicators .................................................................43
Documentation pages ................................................................................................45Documentation page .................................................................................................45
Kuvailulehti ................................................................................................................46
Presentationsblad .......................................................................................................47

5 The Finnish Environment 36 | 2011
LIST OF ABBREVIATIONS
BOM Bill of materialsBSI British Standards InstitutionCEPI Confederation of European Paper IndustriesCF Carbon footprintCFL Compact fluorescent lampCMH Ceramic metal halide lampCO2e Carbon dioxide equivalentEOL End-of-lifeEPD Environmental product declarationEuP Energy using productFU Functional unitGHG Greenhouse gasGLS Incandescent lampGWP Global warming potentialHPM High pressure mercury IC Integrated circuitIEA International Energy AgencyIPCC Intergovernmental Panel on Climate ChangeISO The International Organization for StandardizationLED Light emitting diodeLCA Life cycle assessmentMEEUP Methodology for eco-design of energy-using productsPCF Product carbon footprintPCR Product category rulesPE PolyethylenePP PolypropyleneSAP Superabsorbent polymerSYKE Finnish Environment InstituteVTT Technical Research Centre of FinlandWRI World Resource InstituteWWF The World Wide Fund for Nature
5The Finnish Environment 36 | 2011

6 The Finnish Environment 36 | 2011

7The Finnish Environment 36 | 2011
1 Introduction
1.1 BackgroundThere is growing interest in public organizations to take into account the climate impacts of the products and services they procure. Local authorities are important purchasers capable of setting an example by procuring products that are sustainable from the point of view of mitigating greenhouse gas emissions. Furthermore, in Fin-land a Government Resolution exists that provides a framework and sets aims for sustainable public procurement.
Several municipalities in the Helsinki region together with the Helsinki Region Environmental Services Authority and several expert organizations initiated an EU Life+ project, JULIA2030, to develop calculators for different sectors in municipali-ties. Our sub-project deals with procurement of products and the other sub-projects deal with buildings (energy use), public transport, and waste.
We developed carbon footprint calculators for six product groups: office and tis-sue paper, laptop computers, office seating solutions, incontinence products, and outdoor lighting products. The calculators are intended for use in calls for tender, as an attachment that the bidders must deliver together with their bid. The products’ carbon footprint would be used as an award criterion.
The results of the sub-project include: this report, calculators, instructions for each calculator, a guidebook on environmentally sound procurement, and an internet-site.
1.2 ObjectivesThe purpose of this study is to help procurers to take into account the climate im-pacts of products and thus increase the procurement of products with relatively low climate impacts.
The study aims to develop product-specific carbon footprint calculation tools that are suitable for public procurement, i.e. as part of calls for tender of public organiza-tions. The intention is to produce excel-based calculators that work as annexes in the competitive bidding process.
Secondly, the purpose is to integrate the calculators in several public procurement cases and test these tools in calls for tender in the Julia2030 partner municipalities. The piloting phase also includes an evaluation of the impact of the calculators used in the procurement of certain products.

8 The Finnish Environment 36 | 2011
1.3 ScopeIn the selection of product groups, it was crucial that the product group is significant in public procurement, i.e. public procurers often make calls for tender for the prod-uct. As the ‘carbon footprint’ concept is relatively new and there is little experience of including this kind of analysis in a streamlined way, we started with products, and did not include any services.
1.4 ApproachAt first we considered carbon footprinting methodology that can be employed in gen-eral, and summarized the presently available tools. We then constructed the carbon footprinting tools for the selected product groups. The tool building also included identification of the key life cycle stages as well as the most suitable methods and simplifications to achieve tailored easy-to-use calculators. We then demonstrated the use of the calculators in some procurement processes and evaluated the results. After piloting and evaluation, conclusions were drawn based on the discoveries made dur-ing the calculator development and demonstration phases.
1.5 StructureThis report is organized as follows. In Chapter 2 we explain the relevant concepts related to carbon footprinting and its usage in the public procurement process. The general process of calculator development and award criterion of the procurement process are discussed in Chapter 3. The product-specific literature reviews and cal-culators are presented in Chapter 4. Chapter 5 is devoted to a description and discus-sion of the demonstration phase for the carbon footprinting tools. Finally, the report concludes with proposals for future studies in Chapter 6.
9The Finnish Environment 36 | 2011
2 Basic Concepts
2.1 Life Cycle ApproachesThe concept of life cycle thinking can be explained as follows. In order to take into account all the environmental impacts of a product or a service, the whole life cycle from cradle to grave should be assessed. The life cycle approach can focus on, among others, material or energy flows, as well as on economical aspects. Some approaches are designed to assess only one impact category. Carbon footprint (CF) is nowadays a well-known example of such an approach, in which only climate impacts, assessed by life cycle assessment methodology are considered.
Life cycle assessment (LCA) is a study of environmental impacts caused by e.g. a certain product or process (JRC 2010). LCA considers the entire product life cycle: raw material acquisition, production, use, and end-of-life.
Generally, LCA has four analytical stages: goal and scope definition, life cycle inventory, impact assessment, and interpretation of the results. In many ways, the first stage is the most important. The goal and scope define what is studied, what alternatives are compared and how. After the goal and scope are well defined, the comparison of different alternatives can be done on a common basis, often defined as the functional unit (FU) (JRC 2010).
2.2 Carbon Footprint Product carbon footprint (PCF) can be defined as follows (BSI 2008): GHG emissions of a product across its life cycle, from raw materials through production (or service provision), distribution, consumer use and disposal or recycling. It includes the greenhouse gases, such as carbon dioxide (CO2), methane ( CH4) and nitrous oxide (N2O), together with families of gases including hydrofluorocarbons (HCFs) and perfluorocarbons (PFCs). Typically, the three gases mentioned first contribute most to the indicator of climate change, the Global Warming Potential (GWP). As defined by the Intergovernmental Panel on Climate Change (IPCC), the GWP is an indicator that reflects the relative effect of GHGs in terms of climate change considering a pre-defined time period (IPCC 2007). Typically, a time period of 100 years is considered. CF can be calculated by multiplying amounts of GHG emissions by their respective GWP values. CF is expressed in carbon dioxide equivalents (CO2e). This unit is used for comparing the radiative forcing of other GHGs to carbon dioxide. In other words, the GWP value for CO2 is 1, whereas for CH4 it is 25, and for N2O it is 298, for instance (ReCiPe 2010). We chose to use a 100 years time perspective for the calculation of GWP. Thus, the term GWP refers to GWP100 in this report hereafter.

10 The Finnish Environment 36 | 2011
Many different calculating schemes for PCF exist, including among others: GHG protocol, ISO series (e.g. 14044) and PAS2050 (BSI 2008, GHG Protocol 2011). Typi-cally, the level of detail given in the standards differs. Each standard has a slightly different focus on the links between product category rules. Other assumptions and allocation procedures can also explain the differences between calculating schemes. At present, the various protocols have not been harmonized. Thus, comparability between products and their carbon footprints is limited.
Additionally, for example, the results based on GHG protocol are not meant as a platform for comparing other products. Some comparisons in the results would be possible if sufficient information, i.e. a detailed report, is provided and considered. However, as the provided information would be very technical, it could be difficult and time-consuming for a non-expert to understand all the assumptions and make justified comparisons between products.
2.2.1 Streamlined Carbon Footprint Evaluation
In 2010, two tailor-made streamlined approaches for evaluation of carbon footprints were presented (Bala et al. 2010). The inclusion of environmental requirements in new product standards was presented as the first application. The second applica-tion deals with an assessment of CF savings. The examples show that the simplified tools produce scientifically sound and robust results. The main conclusion was that streamlined approaches can be used to facilitate the introduction of life cycle thinking and LCA in the day-to-day practice of industries and policy makers.
2.3 Environmental Product DeclarationEnvironmental product declaration (EPD) presents the environmental impact of a product or service throughout its life cycle, i.e. the results of a LCA. Within each EPD system, the results should be comparable, as they follow certain rules (product cat-egory rules). The Swedish EPD system was launched in 1998, and later became truly international (International EPD 2011). A climate declaration is a further development of EPDs that focuses on climate-related data and gives the impact in CO2e. The method for producing climate declarations follows ISO standards 14040, 14044, and 14025.
Product category rules (PCR) provide guidance and rules for the collection of data and other information, as well as how the calculations on climate declarations or EPDs should be done to transfer the data to the environmental impact.
2.4 Carbon Footprint as an Award CriterionIn the documents of the tender calls, the carbon footprint of the procured products can be used as technical specifications or award criteria. If used as technical specifica-tions, the limit value for acceptable products should be presented. Products with a CF below the limit value would be acceptable. Other products, i.e. products with a higher value or no value at all (if not known yet) would be rejected from the tender competition. Because there is only limited knowledge about the range of CF values for products, in each product group, we do not recommend this approach. Note however that this can be an effective way to favor more climate friendly products as more knowledge becomes available.

11The Finnish Environment 36 | 2011
Another alternative, which we propose, is to introduce the CF as an award criterion. This way the merits of the eligible tenders are considered to assess which tender is the most advantageous overall based on all criteria (overall economically advantageous).
A specific problem arises, if the tenderer does not provide information about the CF. We propose that if it is not specified in the tender call then that the bid is given zero points for the CF criteria, but not rejected altogether.
Another specific problem arises, if the tenderer gives most of the information that is needed, but leaves out an essential piece of data (e.g. related to the energy use of the factory that makes the final assembly of the product or information related to the transport). In this case the carbon footprint estimate must be rejected and the bidder given zero in this award criterion, even if this seems harsh due to the work required collecting other data for the estimate. However, the calculation tool has been designed so that only information that can be checked relatively easily by the bidder is required.
The products that have the CF information would be given points. A straightfor-ward way would be to give the maximum number of points (P) to the lowest CF. The other bids would be given points according to the following equation:
, (1)
where Qi is the points given to ith bid, A is the lowest carbon footprint of the bids, and Bi is the carbon footprint of the ith bid.
Qi = PABi

12 The Finnish Environment 36 | 2011
3 Calculator Development
3.1 MotivationThere are several aspects that should be considered before the actual development of product-specific calculators, especially considering that the calculators are intended for use in the public procurement process. The main requirements are summarized below.
• Easy to use: As the users of the CF tools are not necessarily CF or LCA experts, the tools should be as simple and user-friendly as possible.
• Comparable and reliable results: Comparability and fairness are key aspects in the public procurement processes. The calculation tools are expected to provide comparable values for CO2 emissions of the products in each product group. It is very important that the carbon footprint tools produce reliable and reasonable results that do not allow bias.
As a calculation result, a quantitative dimension is needed in order to make com-parisons between bids. Different PCF are not truly comparable unless the same data sources, boundary definitions and other assumptions are used. Therefore, a uniform method to assess the PCF is necessary in the CF calculators.
3.2 Development ProcessIn this section the development process of the calculators is described. We can roughly categorize tool development into two stages. The first stage involves the scope defini-tion and method selection. In the second stage, the tool is further tailored and final-ized during an iterative process in collaboration with other experts. The approach is schematically depicted in Fig. 1.The development work began with a literature review on the LCA and carbon foot-print studies of the product groups. The purpose of the literature review was to: summarize and evaluate the following: good practice for determining the environ-mental impacts of products; methods that have already been developed; and possible calculators for the products of interest. Screening of LCA and CF publications also gave information on the most important life cycle stages and helped to define the scope and method of the calculators.
After the literature review we used the information to select the methods for the carbon footprint calculators and we also made necessary simplifications. From this stage on it was important to get feedback from LCA experts and other experts

13The Finnish Environment 36 | 2011
Figure 1. Approach to the calculator development showed schematically.
involved with the products and their procurement. During actual calculator develop-ment, input from the experts was crucial. This feedback was also used to formulate instructions for the calculators.
3.3 Calculators in Tender CallsThe calculator, i.e. excel-file, would be attached together with other call for tender documents. The idea is that the bidder fills in the calculation form using the informa-tion provided by the manufacturer of the product and/or other sources of informa-tion. After this the bidder delivers the filled CF form together with other documents. This step is followed by an evaluation of the received bids. Finally, the procurer makes the decision, typically based on the principle of selecting the most economi-cally advantageous tender. A simplified procurement process using a CF calculator is schematically illustrated in Fig. 2.
Figure 2.The use of the carbon footprint calculators in the procurement process.
Data collection: -life cycle studies -carbon footprint
data
Data assessment, scope definition
and method selection
Calculator development (excel-file)
Feedback from:
-bidders
-procurers
-other experts
Finished CO2
calculators with manuals
Pro
gres
s
-
PROCURER BIDDER MANUFACTURER
1
TENDER CALL: including carbon
footprint (CF) attachment (excel -�le )
BID DELIVERY: �lled CF form
FILLING PHASE: Information from
manufacturer
AWARDING PROCEDURE:
=> the most economically advantageous tender
2
3
4

14 The Finnish Environment 36 | 2011
3.3.1 Carbon Footprint Calculation
Bala et al. (2010) obtained encouraging results using a simplified carbon footprinting algorithm. For calculating the PCF we take a similar approach. This simplified CF algorithm can be written mathematically as:
, (2)
where CFtot is the total carbon footprint, CFmaterials is the material related carbon foot-print, CFenergy is the energy and fuel related CF, CFuse is the carbon footprint caused by the use stage, and CFeol is the CF caused by the end-of-life processes. End-of-life processes typically include transportation of waste, disposal or recycling processes.
CFtot= CFmaterials + CFenergy + CFuse + CFeol

15The Finnish Environment 36 | 2011
4 Product Group-Specific Calculators
In this chapter the literature reviews and the construction of product-specific calculators are presented. The chapter is divided into 5 sections that consist of literature review and description of product-specific calculator. The chapter begins with a paper product ana-lysis. After this incontinence products are examined. Then we deal with office chairs and IT-products. Finally, the chapter concludes with analysis of outdoor lighting products.
4.1 Paper ProductsIn this section we consider both office paper and tissue paper products. Both products have identical raw materials and a similar production process.
4.1.1 Literature Review
Case StudyThe case study of Sanft & Sicher toilet paper was published quite recently (dm 2009). The study was undertaken within the PCF Pilot Project Germany. The carbon foot-print of a triple-ply toilet paper consumer package including 10 rolls was examined. The implemented methodology was in line with ISO standards and the PAS2050 standard. The CF was calculated to be 2.5 kg CO2e. The results are summarized in Tab. 1. According to study, the production processes accounted for over 80% of the total GHG emissions. Other life cycle stages contribute 5% or less to the total emis-sions. Wood chips in the raw material extraction stage were identified as making a significant contribution to emissions. Additionally, the energy supply (i.e. electricity and steam) was identified as the most important contributor in the production stage.
Table 1. Summarized results of the toilet paper case study (dm 2009).
Life cycle stage % of GHG emissions
Wood Supply 5
Production 83
Distribution 4
Shopping tour 4
End of Life 3
Paper ProfilesPaper Profile is a uniform environmental declaration designed especially for paper products. It is a voluntary EPD scheme. Paper Profile covers relevant environmental

16 The Finnish Environment 36 | 2011
aspects related to pulp and paper production. Additionally information on product composition, wood procurement and environmental management are included. The form of the Paper Profile is presented in Fig. 3. The fossil CO2 emissions are reported in the profile as kilograms CO2 per tonne of paper. Also, the amount of purchased electricity for producing one tonne of final product is clearly reported in the paper profile. All the figures include both paper and pulp production.
Paper Profiles are widely available on the web sites of leading paper producers. There are currently several participating companies, such as Arctic Paper, Holmen Paper, International Paper, LECTA, M-real, Norske Skog, Sappi, SCA Forest Products, Stora Enso, UPM, and VIDA Paper. For the full list of companies see (Paper Profile 2010). The different products can have different environmental characteristics, de-pending e.g. on the production processes applied. Thus, Paper Profile is not suitable for ranking products directly. (Paper Profile 2010)In Tab. 2 we have collated details for office paper from various Paper Profiles.
Table 2. Fossil fuel CO2 emissions and purchased electricity according to reviewed Paper Profiles.
Product Producer Mill Fossil CO2[kg CO2/t]
Purchased electricity[kWh/t]
Data Copy Everyday Printing M-real Alizay 96 861
Data Copy Everyday Printing M-real Husum 109 798
Quality copy Paper M-real Husum 111 772
Evolve 75 M-real Alizay 200 594
Evolve Blue Angel M-real Alizay 230 514
Evolve Business M-real Alizay 245 398
Evolve Business M-real Gohrsmühle 1 591 1 364
Evolve Everyday M-real Alizay 230 514
Logic 300 M-real Alizay 96 861
Logic 300 M-real Alizay 108 796
Logic 500 M-real Alizay 96 861
Logic 500 M-real Husum 109 799
Logic Eco M-real Alizay 96 861
Logic Image M-real Husum 109 799
WFU Paper UPM Docelles PM1 380 450
WFU Paper UPM Kymi PM9 160 200
Office Paper International Paper Kwidzyn 512 473
WWF Paper Tools and GuidanceThe World Wide Fund for Nature (WWF) recently launched an online database of eco-rated paper products. Check Your Paper is a benchmarking tool that rates the environmental quality of the papermaking process. It is based on the parameters and rating system of the WWF Paper Scorecard. The tool takes into account forest management, use of recycled fiber, fossil CO2 emissions, landfill waste and water pollution from mills. Check Your Paper includes the main pulp and paper categories, i.e. coated and uncoated papers, tissue, packaging and board papers, newsprint and several types of pulp. (WWF 2011a)
The WWF Check Your Paper report card has a four-step questionnaire, in which step three deals with fossil carbon dioxide emissions. Points are given in a 0-20 scale depending on the CO2 emissions per tonne of paper. (WWF 2011b)

17The Finnish Environment 36 | 2011
Figure 3. The Paper Profile form. Material received from Paper Profile 2011.
18 The Finnish Environment 36 | 2011
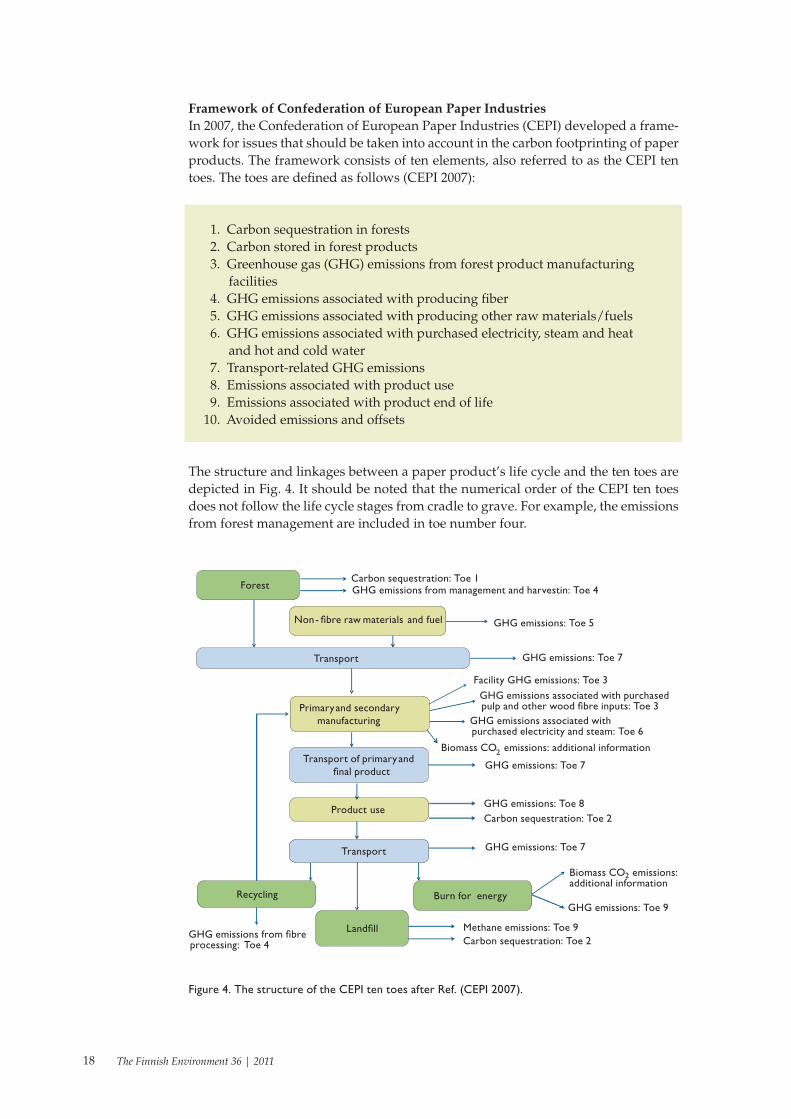
Framework of Confederation of European Paper IndustriesIn 2007, the Confederation of European Paper Industries (CEPI) developed a frame-work for issues that should be taken into account in the carbon footprinting of paper products. The framework consists of ten elements, also referred to as the CEPI ten toes. The toes are defined as follows (CEPI 2007):
1. Carbon sequestration in forests 2. Carbon stored in forest products 3. Greenhouse gas (GHG) emissions from forest product manufacturing
facilities 4. GHG emissions associated with producing fiber 5. GHG emissions associated with producing other raw materials/fuels 6. GHG emissions associated with purchased electricity, steam and heat
and hot and cold water 7. Transport-related GHG emissions 8. Emissions associated with product use 9. Emissions associated with product end of life10. Avoided emissions and offsets
The structure and linkages between a paper product’s life cycle and the ten toes are depicted in Fig. 4. It should be noted that the numerical order of the CEPI ten toes does not follow the life cycle stages from cradle to grave. For example, the emissions from forest management are included in toe number four.
Figure 4. The structure of the CEPI ten toes after Ref. (CEPI 2007).
Biomass CO
Forest
Non- �bre raw materials and fuel
Transport
Primary and secondary manufacturing
Transport of primary and �nal product
Product use
Recycling Burn for energy
Land�ll
Transport
Carbon sequestration: Toe 1 GHG emissions from management and harvestin: Toe 4
GHG emissions: Toe 5
GHG emissions: Toe 7
Facility GHG emissions: Toe 3
GHG emissions associated with purchased
pulp and other wood �bre inputs: Toe 3
GHG emissions associated with
purchased electricity and steam: Toe 6
2 emissions: additional information
GHG emissions: Toe 7
GHG emissions: Toe 7
GHG emissions: Toe 8
Carbon sequestration: Toe 2
Biomass CO2
emissions: additional information
GHG emissions: Toe 9
Methane emissions: Toe 9
Carbon sequestration: Toe 2 GHG emissions from �bre
processing: Toe 4
19The Finnish Environment 36 | 2011
According to the framework, the calculation should be based on LCA referring to ISO 14044:2006. The ten toes encompass useful ideas but there is a lack of exact calcula-tion principles and instructions. However, CEPI has published additional guidance on transport calculations (CEPI 2009).
Life Cycle PublicationDias et al. (2007) examined the life cycle of printing and writing paper produced in Portugal as a LCA case study. The system boundaries include forestry, pulp produc-tion, paper production, paper distribution and final disposal in two schemes. The in-ventory data used in the study represents the period between 1995 and the year 2000.
Results for five impact assessment categories were reported, including global warming over 100 years. In conclusion, Dias et al. identified the paper production stage as an important contributor to all impact categories. In addition, they concluded that forestry plays a minor role in the impacts generated during the paper life cycle. (Dias et al. 2007)
Swan Labelling of Paper ProductsThe Nordic Ecolabel has introduced criteria for swan labelling of paper products. The basic module contains requirements regarding forest management, emissions, energy and waste in pulp and paper manufacturing. The chemical module encompasses requirements for the chemicals used in the pulp and paper production. (Nordic Ecolabelling 2009)
4.1.2 Paper Calculator Approach
MotivationThe CEPI framework is widely accepted among paper manufacturers. According to our discussions with Finnish paper manufacturers, the framework of the CEPI ten toes is well known and well used within the paper industry. In addition, the CEPI ten toes are well documented. Consequently, we chose to implement the ten toes in our calculator.
The CEPI framework was applied for the calculator with the following modifica-tions. Since the framework gives no exact methodology for the inclusion of biogenic carbon and carbon stored in forests, we chose to exclude toes one and two. In addition, the use phase of the paper product causes no or very little emissions. Thus, toe eight was omitted in the calculator. Among the researchers there are no well-defined and accepted rules regarding how to calculate emissions associated with the end of life and avoided emissions. Hence, for simplicity we excluded toes nine and ten from the analysis. Transportation from the factory to the customer was included in the analysis in addition to toe seven regarding transport-related greenhouse gas emissions.
In conclusion, CEPI toes three to seven were included for the paper products as well as the transportation of final product to the customer. By customer we mean the organization responsible for the procurement.
SpecificationIn the calculator, the bidder fills in the CEPI toes three to seven. For the detailed specification we recommend (CEPI 2007). For transportation CEPI has published additional guidelines that should be followed (CEPI 2009).
To make the bids comparable toe 6 is also calculated with IEA country-specific emission factors. Therefore the calculator presents two parallel results for the carbon footprint (i.e. sum of emissions from toes 3-7).
20 The Finnish Environment 36 | 2011
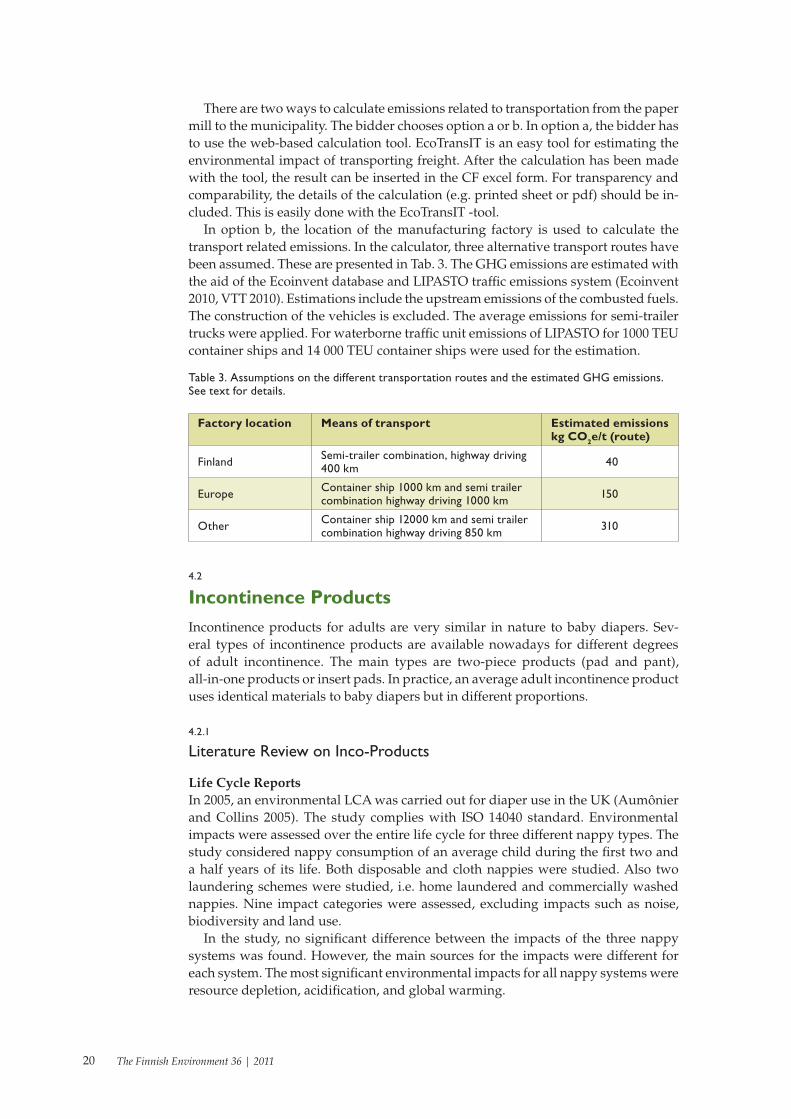
There are two ways to calculate emissions related to transportation from the paper mill to the municipality. The bidder chooses option a or b. In option a, the bidder has to use the web-based calculation tool. EcoTransIT is an easy tool for estimating the environmental impact of transporting freight. After the calculation has been made with the tool, the result can be inserted in the CF excel form. For transparency and comparability, the details of the calculation (e.g. printed sheet or pdf) should be in-cluded. This is easily done with the EcoTransIT -tool.
In option b, the location of the manufacturing factory is used to calculate the transport related emissions. In the calculator, three alternative transport routes have been assumed. These are presented in Tab. 3. The GHG emissions are estimated with the aid of the Ecoinvent database and LIPASTO traffic emissions system (Ecoinvent 2010, VTT 2010). Estimations include the upstream emissions of the combusted fuels. The construction of the vehicles is excluded. The average emissions for semi-trailer trucks were applied. For waterborne traffic unit emissions of LIPASTO for 1000 TEU container ships and 14 000 TEU container ships were used for the estimation.
Table 3. Assumptions on the different transportation routes and the estimated GHG emissions. See text for details.
Factory location Means of transport Estimated emissions kg CO2e/t (route)
Finland Semi-trailer combination, highway driving 400 km 40
Europe Container ship 1000 km and semi trailer combination highway driving 1000 km 150
Other Container ship 12000 km and semi trailer combination highway driving 850 km 310
4.2 Incontinence ProductsIncontinence products for adults are very similar in nature to baby diapers. Sev-eral types of incontinence products are available nowadays for different degrees of adult incontinence. The main types are two-piece products (pad and pant), all-in-one products or insert pads. In practice, an average adult incontinence product uses identical materials to baby diapers but in different proportions.
4.2.1 Literature Review on Inco-Products
Life Cycle ReportsIn 2005, an environmental LCA was carried out for diaper use in the UK (Aumônier and Collins 2005). The study complies with ISO 14040 standard. Environmental impacts were assessed over the entire life cycle for three different nappy types. The study considered nappy consumption of an average child during the first two and a half years of its life. Both disposable and cloth nappies were studied. Also two laundering schemes were studied, i.e. home laundered and commercially washed nappies. Nine impact categories were assessed, excluding impacts such as noise, biodiversity and land use.
In the study, no significant difference between the impacts of the three nappy systems was found. However, the main sources for the impacts were different for each system. The most significant environmental impacts for all nappy systems were resource depletion, acidification, and global warming.

21The Finnish Environment 36 | 2011
According to the study, the raw materials extraction, nappy manufacture and trans-port to retail were the main contributors to global warming in the disposable nappy system. The superabsorbent polymer (SAP) was identified as the main contributor of the materials, also polyethylene-film (PE), polypropylene (PP), and fluff pulp had a considerable impact on the GWP value.
An update of the UK LCA has since been published (Aumônier et al. 2008). The aim of the study was to assess the changes in the environmental profile of disposable and reusable nappies that have resulted from developments in the manufacture and use of the nappies in the UK since 2002. The study demonstrates the environmental effects of the following: disposable nappy design and manufacturing, disposable nappy disposal choices, and laundry schemes for shaped nappies.
The updated study reports a decrease in GWP value due to manufacturing changes and the weight reduction of nappies. According to the report, manufacturing of dis-posable nappies has a greater GWP impact than their waste management in landfill sites in the UK. In other words, in terms of CO2 emissions manufacturing is more significant than the end of life phase in the product life cycle.
Manufacturer’s ReportSome detailed information on adult incontinence products is reported in the 2007-2008 Sustainability Report of Edana (2008). The material composition is given for the all-in-one incontinence product for two different years; 1995 and 2005.
Edana has conducted two LCA studies for incontinence products; one covering products from 2001-2003, and the other in 2005. The functional unit was set to 1000 incontinence products. A decrease in product GWP value during 1995-2005 can be clearly seen (see Graph 11 in Edana’s report). The energy credits coming from energy recovery processes are included in the results. The net GWP for 2005 was around 320 kg CO2e/ FU. According to the graph, the main contributor to GWP is waste treat-ment (about 160 CO2e/ FU). Unfortunately no further information is given about the treatment process or the other life cycle stages. According to the material com-position Edana’s graph we see that the main material is fluff pulp, 71.9 g/diaper. The total mass of the diaper is about 115 g (see Graph 9 in the report). The average material composition and their respective shares of inco-product in 2004 is showed in Fig. 5. The figure clearly shows that the fluff pulp is the main material (about 60 % of total mass).
Figure 5. Raw materials used in an average incontinence product. Data as in Ref. (Edana2005).
Fluff pulp 59 %
SAP 14 %
PP 9 %
PE 10 %
Adhesive 4 %Elastics 1 % Other 3 %

22 The Finnish Environment 36 | 2011
Nordic Ecolabel CriteriaThe Nordic Ecolabel sets criteria for sanitary products (Nordic Ecolabelling 2008). GWP values per kg of material produced and used in the sanitary product are given in Tab. 4. The background memo on sanitary products explains the polymer GWP values in detail (Nordic Ecolabelling 2010). Other materials, such as tape are assumed to have zero GWP value.
Table 4. Global warming potential values for materials that are used in sanitary products. GWP is expressed with a time scale of 100 years and stated as kilo of CO2 equivalents per kilo of material from cradle to gate (Nordic Ecolabelling 2010).
Polymer GWP [kg CO2e/kg polymer]
SAP 3.7
PE 2.6
PP 3.9
PET 6.5
PS 2.8
Fluff 0.9
Bio-polymers 1.2
Paper / viscose 1.2
4.2.2 Inco Calculator Approach
MotivationAccording to the studies published on diaper systems, raw material production and manufacturing of the hygiene products have the biggest impact on global warming. Thus, we examined the materials used in the incontinence products. Because the polymer GWP values of Nordic Ecolabelling are well documented, we used them as default values for the calculator. The final manufacturing of the inco-product was also taken into account. However, the packaging was assumed to only have a minor contribution to CO2 emissions, therefore it was omitted.
According to Edana’s environmental report, waste management also has a signifi-cant effect on global warming. Thus, we also briefly considered the emissions related to landfilling of the incontinence product.
Typically, the bidder also arranges the delivery of incontinence products. In order to take into account the influence of the delivery a base-case should be defined. This base-case should be a representative of an average delivery route. The transport sce-nario could be formed according to realized deliveries; the delivered amounts and destinations are typically recorded by the transport company. In this study we were unable to obtain necessary data for delivery transportation. Thus, the distribution stage was omitted. However, we included transportation from factory gate to the public procurer, i.e. to the municipality.
SpecificationThe calculator includes emissions from the following:
• Polymer materials• Manufacturing factory (‘final’ factory)• Transportation from gate to customer (excluding distribution)• Waste treatment

23The Finnish Environment 36 | 2011
The total GWP of materials are calculated by using the values in Tab. 4. The impact of other materials, e.g. adhesives etc., are omitted (GWP value set to zero). As the amounts of these materials are only fractional, it is assumed that the related emis-sions are insignificant.
Since the manufacturing process of a product can be complex and might include multiple stages it is inconvenient to consider it at the process level. Process based data is typically difficult to access and time-consuming to analyze. For simplicity, emis-sions of the assembly stage are calculated based on the energy and fuel consumption of the factory. In other words, the GHG emissions of the product manufacturing are estimated by using an economic allocation method. This means that GHG emissions are allocated in proportion to the economic value of the co-products. The economic allocation can be mathematically written as follows:
, (3)
where EI is the environmental impact (kg CO2e), Cp is the producer price of a product (eur), Cf total the producer price (eur) per factory including all products manufactured during one year, and Ef total is the environmental impact of the factory (kg CO2e).
In order to calculate emissions of the factory’s energy consumption, the calculator uses country-specific emission factors of electricity and heat production. The source for these emission factors is a publication of the International Energy Agency (IEA 2009). The emissions from fuel combustion is calculated based on the emission factors of Statistics Finland, see e.g. (Statistics Finland 2010). GWP values for methane and nitrous oxide are as the ReCiPe (2010) midpoint method suggests.
The calculator uses information on energy and fuel consumption from the factory and the producer’s prices as initial data. The total GHG emissions are calculated with the aid of emission factors for electricity, heat and fuel combustion. The period of examination is one year.
Emissions of the transportation phase are calculated as described in Sec. 4.1.2.A simple analysis was undertaken in order to compare the emissions of the dis-
tribution phase with the emissions related to transportation from factory gate to the municipality. The emissions of the delivery stage of the products were estimated as follows. Emission factors of LIPASTO for delivery driving were implemented (VTT 2010). Estimates are presented in Tab.5. All the calculated numbers are rounded up in the estimations. Compared to emissions estimated in Tab. 3, it can be seen that with these assumptions, emissions of delivery stage are clearly smaller than the trans-portation phase. Based on the previous assumptions, and if we additionally assume that the weight of an inco-product is 150 g, we find that the delivery of one product would only cause about 2-4 g of CO2e. This would represent about 1% of gross CO2e emissions according to Edana’s LCA study (see section 4.2.1). Due to this assessment, our exclusion of the distribution phase does not significantly affect the overall carbon footprint of an inco-product.
Table 5. Assumptions on the delivery of inco-products including the estimated distances and GHG emissions.
Means of transport Distance [km] Load factor [%] Emissions [kg CO2e /t of product]
Delivery lorry, heavy (15 t) 100 50 26
Delivery lorry, heavy (15 t) 100 10 15
EI = Ef
Cp
Cf

24 The Finnish Environment 36 | 2011
Emissions related to waste management are included as follows. For simplicity, we assumed that the diapers are landfilled after use. Recently, different waste component GHG emission factors have been produced in the Julia 2030 -project. The calculator uses the factor developed for mixed solid waste in the Helsinki Metropolitan Area, which has a value of 365 kg CO2e/tonne of waste (SYKE 2010). The waste-related emissions are simply calculated by multiplying the mass of a diaper by the emission factor.
4.3 Office ChairsHere seating solutions are discussed, i.e. chairs used in offices. The use phases of these products are relatively long.
4.3.1 Literature Review on Office Chairs
Environmental Product DeclarationsThe Norwegian EPD Foundation developed Product Category Rules (PCR) for seat-ing solutions in 2008. In addition, the International EPD system has its own PCRs for furniture and seats (Eriksson 2009). The PCRs are based on life cycle assessments of environmental data from raw materials production, manufacture, use, and dis-posal. Both PCRs follow the international standards ISO 9001, ISO 14001, ISO 14040, ISO 14044, ISO 14025, and ISO 21930. A snapshot of a chair EPD document is pre-sented in Fig. 6.
Environmental product declarations (EPDs) of seating solutions can be found in the web sites of Norwegian EPD and International EPD systems. The EPDs comply with ISO 14025 as well as the corresponding PCR. In addition, one EPD was found that is not currently registered in the mentioned EPD systems (Steelcase 2004). EPDs for the following manufacturers are publicly available; RH Form AB, Håg, Steelcase, and EFG European Furniture Group AB.
LCA principles in PCRs are similar. Calculations are based on the concept of CML 2001. Allocation rules, cut-off criteria, data collection principles etc. are adopted from ISO standards. Presumably the used characterization factors are the same as both systems refer to ISO standards. The system boundaries defined in PCRs are also quite similar, i.e. the entire life cycle is assessed. However, infrastructure is excluded in both schemes.
The most obvious difference between the PCRs is the definition of the life cycle stages. Additionally, the format of the impact results given in the documents differs. For instance, the Norwegian EPD gives global warming potential (GWP) results speci-fied for the factory gate and for the user phase. On the other hand, the International EPD gives GWP results specified for upstream, core, and downstream processes, re-spectively. Interestingly, the Norwegian PCR also gives alternative system boundaries for the EPD that can exclude one or more life cycle stage.
The information given in EPD documents differs depending on the EPD system. For example, the methodological assumptions are not similarly presented. The al-location procedures and databases used might only be reported in the reference documents. In the PCR documents recommended databases and other sources for the inventory stage can be found. However, there can be variation in the database values. Thus, a variation in inventory results and therefore impact results can be caused by different database. Transport related calculations are only briefly discussed in PCRs. Use of secondary/averaged data over primary data also introduces variation in emis-sion results. In addition, assumptions about energy mixes can result in differences.

25The Finnish Environment 36 | 2011
Figure 6. A snapshot of an EPD document for an office chair. Material received from (EPD Norge 2011).

26 The Finnish Environment 36 | 2011
Life Cycle StudiesGamage et al. (2008) have published a case LCA study of Formway LIFE chair. The two models of LIFE chair were investigated including all life cycle stages from raw-material extraction to waste management. The method implemented was the CML 2 baseline 2000 available in SimaPro7. In the paper the two following life cycle stages were identified as contributing most to the total GWP100 value: raw material ex-traction and component production. These stages contributed about 60% and 30 %, respectively. The two transport stages and the waste-management stage were seen as negligible contributors. Gamage et al. (2008) also found that aluminum is a major contributor to the GWP100 impact of aluminum based LIFE chairs.
In 2006, The Center for Sustainable Systems at the University of Michigan pub-lished an LCA report of Steelcase office furniture (Spitzley et al. 2006). One examined product was the Siento chair. The analysis was carried out using the SimaPro model. The results were compiled in six environmental impact categories, including global warming potential. The following stages were included: product and sub-assembly manufacturing, delivery of materials, parts and final products, use, collection of dis-carded furniture, and processing of materials. They assumed that no impacts occur during 30 years of use. The GWP impact of a Siento chair was 114 kg CO2e. Results for different life cycle stages were not reported. Instead a flow diagram showing the relative contribution to impacts was presented.
SummaryThe life cycle of a chair can be divided into six stages: raw material extraction and production, transportation of the (raw) materials, assembly/manufacturing of the seat, transport of final product to retailer and/or customer, use and maintenance, and finally the waste treatment or recycling procedures.
According to the data found, the following stages contribute the most to the total global warming potential of a seat: the raw material extraction and refinement; and production of parts and components of the seating solution. These stages account for a share of up to 70 % of the total carbon footprint. The assembly, transportations, and end of life treatment cover the remaining share of the carbon footprint. During the use stage no relevant emissions occur as little or no maintenance work is usually needed. In terms of the carbon footprint, all other stages are more relevant.
Tab. 6 summarizes GWP results of office chairs from different manufacturers. The functional unit is a seating solution used for a certain time period (typically 15-30 years). The GWP values also include the use phase. The differences in GWP values can be explained, among other reasons, by the use of different materials. We also calculated the GWP/kg of the chairs. For instance, the GWP/kg of the product can vary between 2.8 and 5.1 kg CO2e/kg for chairs with a mass of 20 kg (see Tab. 6).

27The Finnish Environment 36 | 2011
Table 6. Summary of carbon footprint results for office chairs. Weight and GWP values are taken from (EPD Norge 2008, Steelcase 2004). The GWP/kg is also calculated and presented. All values are rounded up.
Chair Manufacturer Mass of chair [kg]
GWP [kg CO2e / FU]
GWP/kg of chair [kg CO2e/kg]
Logic 400 RH 22 73 3.3
Ambio RH 20 101 5.1
Extend RH 21 67 3.3
Capisco 8106 Håg 16 38 2.4
Futu Håg 20 57 2.8
HO3 320 Håg 16 45 2.8
H04 4400 Håg 19 55 2.9
H05 5300 Håg 23 63 2.7
H09 Inspiration 9230 Håg 20 68 3.5
Sideways 9732 Håg 12 31 2.7
Convention Wing 9811 Håg 7 24 3.6
Splice 10 EFG 21 80 3.8
Teamspirit 2 EFG 14 57 4.1
Savo Stol EFG 11 12 1.1
Savo Studio 32 EFG 9 29 3.2
Savo EOS HL EFG 16 59 3.7
Savo Ikon 3 LN EFG 19 108 5.7
Savo Studio 22 EFG 10 31 3.0
Think Steelcase 15 103 6.8
Siento Steelcase 29 114 3.9
4.3.2 Office Chair Calculator Approach
MotivationComparisons of carbon footprints are only reasonable when calculations have been made for similar products with identical assumptions and system boundaries. As stated in EPDs of the international system; EPDs within the same product category but from different programs may not be comparable. This is mostly due to the dif-ferences mentioned above.
We aimed to provide a reliable and user-friendly tool for procurers to compare the CO2 emissions of different products. Since the key assumptions and system bounda-ries are reported and presented differently in the EPDs, it is unreliable to make direct comparisons based only on the EPD documents. Additionally, not all manufacturers have registered EPDs for their products.
Therefore, in order to make uniform comparisons between the products and their impact on climate change, we have provided the procurer with a simple calculation tool that gives comparable results on the carbon footprint for each product.
The tool introduced here, referred to as the calculator hereafter, encompasses all relevant life cycle stages in terms of CF. For seating the most relevant stages are: raw materials extraction, production of components, and assembly.

28 The Finnish Environment 36 | 2011
SpecificationThe calculator for office chairs takes the following into account:
• Materials extraction• Material processing• Factory (final assembly)• Transportation (gate to customer)
We assumed that the use phase does not have any impact, i.e. maintenance work is omitted. We also assumed that the packaging only makes a minor contribution to CO2 emissions, therefore it is omitted. Additionally, for simplicity, waste treatment was excluded.
The calculator uses information which the bidder mostly has in their EPD. The calculator is a simple excel sheet where the bidder fills in the necessary cells. First, the user gives the material composition of the seating solution. According to the ma-terial composition, the GWP for each material used for the seat is calculated based on the emission factors and then aggregated to form the total GWP value of material production. A simple mass balance test is implemented. Thus, the inputs of material amounts are compared to the mass of the chair.
The Norwegian PCR for seating solutions includes a list of materials and substances used in seats (EPD Norge 2008). The listing includes metals; textiles and leather; plas-tics; coating; wood; and packaging materials. This materials listing is used as a basis for our calculator. The emission coefficients for different materials have been collected from widely accepted databases and when possible, from primary data sources. The values and sources are presented in Tab. 7.
Table 7: The materials used in seats and corresponding GWP values. See text for details.
Material GWP [kg CO2e/kg] Reference
Aluminum extrusion profile (primary) 2.3 (ELCD 2010)
Copper sheet 1.0 (ELCD 2010)
Zinc (primary) 3.2 (ELCD 2010)
Steel sheet 1.9 (ELCD 2010)
Leather 151.9 (Joseph and Nithya 2009)
Polycarbonate 7.6 (Plastics Europe 2010)
ABS (acrylonitrile-butadiene-styrene copolymer) 3.8 (Plastics Europe 2010)
Polystyrene (general purpose) 3.4 (Plastics Europe 2010)
HDPE resin 1.9 (Plastics Europe 2010)
LPDE resin 2.1 (Plastics Europe 2010)
Polyurethane flexible foam 4.7 (Plastics Europe 2010)
Polyurethane rigid foam 4.2 (Plastics Europe 2010)
Polyvinylchloride (PVC) bulk polymerization 1.6 (Plastics Europe 2010)
PVC emulsion polymerization 25.0 (Plastics Europe 2010)
Polypropylene (PP) 2.0 (Plastics Europe 2010)
Polyamide 6 (Nylon 6) 9.1 (Plastics Europe 2010)
Glass filled polyamide 6 7.2 (Plastics Europe 2010)
Wood (planed for indoor use) 0.1 LCA-sawmill
Chipboard 0.4 VTT/Puhos Board Oy
Epox powder paint 5.6 Expert judgement 1)
Polyester owder paint 6.2 Expert judgement 1)
1) based on data provided by Coating Tech Oy

29The Finnish Environment 36 | 2011
The final report of the Methodology Study Eco-design of Energy-using Products (MEEUP) lists unit indicators for a large number of materials used in the studied prod-ucts (VHK 2005). For material processing MEEUP unit indicators are implemented. For all plastic parts the MEEUP method suggests one indicator. For metal parts there are several indicators. For simplicity, we used the average of the indicators developed for metal parts. This leads to GWP values of 2.27 kg CO2e/kg and 0.53 kg CO2e/kg, respectively for plastic and metal.
Emissions for the assembly and transportation phase are calculated as described in Secs. 4.1.2 and 4.2.2.
4.4 IT- ProductsThis section focuses on IT-products, especially on laptop computers.
4.4.1 Literature Review on IT-products
LCA PublicationsAndrae and Andersen (2010) published a review to assess the consistency between different LCA studies for consumer electronics. The paper includes a comprehen-sive summarizing table of life cycle CO2 emission results for four electronic devices: desktops, laptops, mobile phones and TVs. In the paper it was stated that MEEUP methodology underestimates the GWP100 value for the manufacturing processes of electronic components. In addition, according to the study, recycling and other end-of-life processes only have a small share of the total GWP100 score for consumer electronics. Laptop carbon footprint results of the study are summarized in Tab. 8. Due to energy consumption, the use phase contributes over 50% of the GHG emissions, except in the ecoinvent study (laptop Switzerland). The data and assumptions were different which can explain some of the differences. However, it is clear that the pro-duction and transport stages together are a major contributor to the carbon footprint.
Table 8. Summary of carbon footprint results for laptops (Andrae and Andersen 2010).
Device and Reference CarbonFootprint (CF) [kg CO2e]
% Production % Use and transports
Laptop PC, Japan 260 44 56
Laptop PC, China 54 - -
Laptop, Europe 360 26 74
Laptop PC, Switzerland 660 93 6.6
Laptop, global 410 41 63
Socolof et al. (2005) studied the life-cycle impacts of cathode ray tube (CRT) and liquid crystal display (LCD) desktop computer monitors. The results were presented for 20 environmental impact categories. The sizes of the monitor types examined were 17-inch and 15-inch for CRT and LCD, respectively. Electricity consumption in the use phase was identified as the greatest contributor to the global warming from the CRT. According to the results, the manufacturing phase of the LCD display has the biggest impact on GWP. The use phase and upstream stages have almost an equal effect in terms of global warming. For both types of displays, the end of life stage had a minor contribution (less than two kilos CO2e/functional unit). The greatest contributor to the LCD global warming impact score was sulfur hexafluoride. It is used as a process material in the manufacturing of LCDs and encompasses 29% of the GWP value.

30 The Finnish Environment 36 | 2011
Quite recently Duan et al. (2009) published an LCA study of a Chinese desktop computer. For the impact assessment, the Eco-indicator 99 method was implemented. The paper shows that the manufacturing and use stages of the life cycle generate sig-nificantly more impacts than the distribution and EOL stages. The CML’01 method results for GWP100 show that the use phase makes the largest contribution (Fig. 5 in the paper by Duan et al.). Additionally, in terms of Eco-Indicator points (EIP), the production of the motherboard, CRT tube, housing of CRT, and LCD module have the biggest impacts.
Choi et al. (2006) assessed the life cycle of a PC and its effective recycling rate. The ISO 14041 guidelines were adopted. The system boundaries included raw-material production, the parts and components manufacture, assembly, transportation, use, and disposal. Site-specific data was used along with SimaPro 4.0 and the Korean national databases. Results were presented for eight impact categories. In terms of GWP, the pre-manufacturing phase, i.e. raw materials production together with the parts and components manufacture, is the greatest contributor (over 80% of the total GWP). The assembly, distribution and disposal phases contribute less than 10% each.
Reports The EU has published a research and evaluation report dealing with the Energy-Using Products (EuP) Directive. The objective of the preparatory study was to find out whether and which eco-design requirements could improve environmental per-formance throughout the life cycle of the products. The MEEUP methodology was implemented (see below). The study consisted of eight different tasks considering, among others, economic and market analysis, consumer behavior, technical analysis and base-case definition. The environmental impact results for IT-equipment are presented in the report of task five. According to this study, energy use during the use phase is the most important for all product cases in relation to environmental and cost impact. The total electricity consumption was reported to be 0.55 MWh for an office laptop over the product-life (Table 74 in the report). (IVF 2005)
The final report of the Methodology Study Eco-design of Energy-using Products (MEEUP) lists unit indicators for a large number of materials used in the studied products (VHK 2005). Data on energy, water, waste, and emissions to air and water are presented. Also, GWP values for the materials are reported.
A PCR for notebook computers has been prepared by the Taiwan Electrical and Electronic Manufacturers Association and the Pegatron Corporation (Environment and Development Foundation 2008). Unfortunately, there is no EPD for laptops pub-licly available that follows the mentioned PCR. (EPD 2008)
Apple has introduced environmental reports that include EPDs. These reports are publicly available for six notebooks of the MacBook product family. In the reports, the general material composition is given besides power consumption and greenhouse gas emission data. Apple has estimated the GHG emissions over the product life cycle by using the guidelines of ISO 14040 and ISO 14044. However, only a limited descrip-tion of the assumptions and calculations is provided. Published carbon footprint information is presented in Tab. 9. The carbon footprint results for different MacBook laptops are illustrated in Fig. 7. The values show that the production phase is the main contributor of the total GHG emissions during the laptop’s life cycle (46-63% of total CF). The use phase also has a significant impact (about 30-40% of calculated CF). According to Apple’s calculations, transportation contributes about 10% to the total CF. In addition, the results show that the recycling phase contributes only about 1% to the CF. (Apple 2011)

31The Finnish Environment 36 | 2011
Table 9. Carbon footprint results of Apple’s products (Apple 2011).
Product Carbon footprint (CF) [kg CO2e]
Share of production phase in CF [%]
Share of use phase in CF [%]
13 inch MacBook Pro 350 58 32
15 inch MacBook Pro 460 63 28
17 inch MacBook Pro 540 62 29
11 inch MacBook Pro 280 58 34
13 inch MacBook Pro 350 60 32
MacBook 310 46 42
Figure 7: Published carbon footprint results for MacBook products. Data from (Apple 2011).
4.4.2 Laptop Calculator Approach
MotivationAccording to Sec. 4.4.1 two main contributors to the carbon footprint of laptops are the manufacturing phase and the use phase. The transportation and end-of-life (EOL) phase are reported to have a smaller impact to GHG emissions than the previously mentioned phases. For simplicity, the EOL (i.e. recycling and waste treatment) phases were excluded from the calculator. Therefore, the calculator includes the following life cycle stages:
• Material extraction• Material processing• Factory (final assembly)• Transportation to customer• Laptop use
We chose to use the MEEUP methodology for materials extraction and material processing as it is well documented. Despite the observed underestimation of GWP values in the method, it provides a first approximation of the material-related emis-sions for the calculator. The CO2 emissions of the use phase are calculated with the aid of electricity consumption and use time in each operation mode of the product. We have assumed that the emissions of possible maintenance and repair etc. are negligible, thus they are omitted. The packaging was also assumed to have only a minor contribution to CO2 emissions, therefore it is omitted. Transportation from factory gate to the public procurer (e.g. municipality) is included. For simplicity, the delivery of the laptops to the user was omitted in the calculator.
0
100
200
300
400
500
13 inch MacBook Pro
15 inch MacBook Pro
17 inch MacBook Pro
11 inch MacBook Air
13 inch MacBook Air
MacBook
Car
bon
foot
prin
t [k
g C
O2e
]

32 The Finnish Environment 36 | 2011
The battery of the laptop was approximated to big capacitors and coils as in the EuP Lot 3 study.
In our study, the emissions for component transportation were briefly considered. The transportation related emissions of integrated circuits (ICs), printed wiring boards (PWBs) and LCD display components were estimated by using the mass assumptions summarized in Tab. 10. For emission estimation the ecoinvent database was used by using the component mass information given in the publication of Lu et al. (2006).
Table 10. Assumptions on specific components and the estimated transport-related emissions. See text for details.
Component Mass [g] Estimated emissions (transport) [kg CO2e]
Integrated circuit (IC) 240 4.5
Printed board 360 0.88
LCD 150 0.011
All in all, we estimated that the transport-related emissions of components are about 6-8 kg CO2e. If we assume that the CF of a laptop is about 400 kg CO2e the component transportation accounts for only about 2% of the total CF. The foregoing is of course an approximation but gives a rough estimate of the emissions. However, for simplicity the transportation of the components were excluded from the calculator.
SpecificationThe environmental impacts of the materials used in IT-products are calculated as the MEEUP methodology suggests. The necessary unit indicators are implemented with the list of materials picked from the EuP report of IT-products. In addition, material processing of plastic and metal is included by using MEEUP original equipment manufacturers (OEM) unit indicators. To avoid double-counting, the processing of materials included here should be omitted in the emission calculation of the manufac-turing factory. The emissions of the manufacturing (assembly) factory are calculated as described in Sec. 4.2.2.
The emissions of the use phase are calculated by multiplying total energy consump-tion during product life (kWh) by the emission factor for electricity (kg CO2e/kWh). The typical usage rhythm and product life is adopted from the EuP report (See Tab. 11). The user has to input the typical energy consumption wattages for three different usage modes. The use modes are the following: on mode, sleep mode, and standby mode. We assumed that the laptops are used in Finland. According to a recent LCA study the average emission factor for Finnish electricity is 0.287 kg CO2/kWh (SYKE 2011). In the calculator we also included CH4 and N2O emissions. By using the infor-mation of the study we calculated an emission factor of about 0.31 kg CO2e/kWh for electricity. This value is used in the calculator for the use phase.
Table 11. Assumptions on the use phases of laptops that are used in offices (IVF 2005).
Description Value Unit
Product Life 5.6 years
Idle-mode use 2 613 hours per year [h/a]
Sleep-mode use 2 995 hours per year [h/a]
Off-mode use 3 153 hours per year [h/a]
Product transportation from factory gate to the customer is calculated as described in Sec. 4.1.2.

33The Finnish Environment 36 | 2011
4.5 Outdoor LightingIn this section we consider the lighting equipment used in outdoor conditions in municipalities. Primarily, the focus is on lighting of public streets and other areas.
Sippola (2010) studied outdoor lighting in Finland. According to Finnish enquir-ies, the number of outdoor lamps in Finland is about 1.3 million and their estimated energy consumption is about 800 GWh/a (Sippola 2010). If we assume that the emission factor of Finnish electricity is 0.31 kg CO2e/kWh, we can calculate the total emissions of outdoor lighting energy usage to be about 240 kt CO2e. This is about 0.4% of Finland’s total CO2e emissions in 2009.
4.5.1 Literature Review on Lighting
Public Street Lighting ReportA study of public street lighting prepared for the European Commission was pub-lished in 2007 by Tichelen et al. It is a preparatory study on energy using products that provides information on the impact of eco-design on environmental performance. The study follows the MEEUP methodology and includes environmental impact analysis of a base-case (i.e. lighting solutions). The use phase of the lamps is set for 30 years and the annual hours of use as 4000 hours.
The study identified electricity use as the largest contributor to environmental impacts. The environmental impacts were calculated with the aid of a bill of materi-als (BOM) and the MEEUP unit indicators. BOM for lamps, ballasts, and luminaires are specified and given in tables. The impact results are presented for two different lamp types and three different road categories. Low and high-pressure sodium (LPS and HPS) and high-pressure mercury lamps (HPM) were investigated in fast traffic (F), mixed traffic (M), and slow traffic (S) locations. The assessed road categories have different luminance or illuminance requirements, for instance, according to the set minimum luminance requirement. Additionally, compact fluorescent lamps (CFL) and high-pressure ceramic metal halide lamps (CMH) were assessed. The GWP results are summarized in Tab. 12. In terms of GWP, the results of the study clearly show that the contribution of electricity use over the lifetime of a the lighting is very significant. It covers over 90% of the total GWP impact.
Table 12. Global Warming Potential (GWP) results for different luminaires. The GWP100 is pre-sented per 1000 functional lumen (IVF 2005).
Category Lamp type GWP100 [kg CO2e / 1000 functional lumen]
FLPS 1.4
HPS 1.6
MHPM 7.3
HPS 2.3
S
HPM 9.0
HPS 3.7
CMH 166
CFL 242

34 The Finnish Environment 36 | 2011
A Study of BallastsBakri et al. (2010) studied the life cycle impacts of magnetic and electronic ballasts. The material processing, production and use stages were assessed using the Eco-indicator 99 method. Impact results for human health were reported as disability adjusted life years. The assumptions for ballast usage were: 2500 use times, i.e. continuous use of nine hours over 10 years of lifetime. Some reported results are presented in Tab. 13.
Table 13. Energy inventory results for ballasts (Bakri et al. 2010). The table shows electricity con-sumption in the production (assembly) and use phases in kWh.
Magnetic ballast Electronic ballast
Production 0.03 0.67
Use 135 45
According to the energy inventory of the study, electronic ballast requires more energy during the production stage but uses less energy during the lifetime than magnetic ballast does. The paper shows that magnetic ballast consumes about three times more during the use stage than the electronic ballast.
Lamp LCA StudyOsram published a comparative life cycle study of lamps in 2009. The analysis was done according to ISO 14040 and 14044. For the impact assessment the CML method developed at the Institute of Environmental Sciences at the University of Leiden was used. Three different lamps were compared: a 40 W incandescent lamp (GLS), an 8 W compact fluorescent lamp (CFL), and an 8 W LED lamp. The complete life cycle was analyzed. This included the raw material production, manufacturing and assembly, transport, use and end of life. In the study resource and primary energy consumption as well as six environmental categories were assessed. A lifetime of 25 000 hours was taken as a reference parameter for the use phase.
The results show that the use phase is the major contributor to the GWP over the life cycle of the light sources. End of life has only a small role compared to manufacturing and use phases. The GWP results for the studied lamps are summarized in Tab. 14.
Table 14. Global warming potential results for the manufacturing and use of the lamp (OSRAM 2009). GWP values are in units of kg / CO2e. See text for details.
GLS CFL LED
Manufacturing 3.5 2.2 2.4
Use 564 113 113

35The Finnish Environment 36 | 2011
4.5.2 Lighting Calculator Approach
Motivation The calculator includes the following stages:
• Materials extraction• Material processing• Final assembly in factory• Transportation to customer• Use
We chose to use MEEUP unit indicators for materials and material processing, since the methodology is well documented. Despite the underestimation of GWP values in the method, it provides an accurate enough estimate of the emissions for the cal-culator. The CO2-emissions of the use phase are calculated with the aid of electricity consumption and use time during product life time. We have assumed that the emis-sions of the possible maintenance, repair etc. are negligible, thus they are omitted. The packaging is also assumed to have only a minor contribution to CO2 emissions, therefore it is omitted.
Transportation from factory gate to the customer is included. For simplicity, the distribution of the product to the actual place of use was omitted from the calculator.
SpecificationRelevant materials are picked from the MEEUP unit indicator list. The publication of Tichelen et al. (2007) includes tables that identify the relevant BOMs for lamps, ballasts, and luminaires.
The emissions of the manufacturing (assembly) phase are calculated as described in Sec. 4.2.2.
The emissions of use phase are calculated by multiplying total energy consumption during product lifetime (kWh) by the emissions factor for electricity (kg CO2e/kWh). The user has to input the typical wattage of the lighting equipment. We assumed that the lighting equipments are used in Finland. As discussed in Sec. 4.4.2, the country-specific emission factor for Finland is about 0.31 kg CO2e/kWh (SYKE 2011). We used this for the electricity use of the lighting equipment.
The use phase is modeled as follows. We assumed about 4000 hours of operating hours per year (Tichelen et al. 2007, Sippola 2010). Typically the lamps operate 8-12 hours per day, depending on the local conditions. Partial switch off is rarely applied during the night (Tichelen et al. 2007). Due to this fact, and for simplicity, we excluded the turn-on and -off cycles. The total electricity consumption per year is calculated simply by multiplying the wattage of the lighting solution (including lamp, ballast, and other components) by the operating hours per year.
Product transportation from factory gate to the customer is calculated as described in Sec. 4.1.2.

36 The Finnish Environment 36 | 2011
5 Demonstration Results and Discussion
In this chapter the demonstrations (‘pilots’) of the developed carbon footprinting tools are presented. The actual demonstrations of the calculators began in autumn 2011. The chapter begins with a description of the performed pilots followed by observations and a short discussion.
5.1 First AttemptsThe first attempts to integrate the CF tools into the procurement processes for the city of Espoo in spring and summer 2011 were not successful. The actual demonstration of the calculators began in autumn 2011.
5.2 IT-CalculatorThe Finnish Environment Institute (SYKE) put out a request for tender for desktop and laptop computers in August 2011. Four bidders participated in the competitive bidding. These bidders had earlier been selected as framework agreement suppliers, which means the state organization may invite tenders for deliveries from these sup-pliers using a lightweight procedure.
In this tender call, for the four sellers, carbon footprint was used as an award cri-terion. The weight of this criterion was set as 10%. The carbon footprint calculator for IT equipment was included in the tender call.
In the tender call it was stated that the bidders should fill in the calculation form and send it together with other tender call documents. The time period for receipt of the bids was extended by one week due to the introduction of the carbon footprint calculator.
Two bids were received and analyzed. Both bidders provided information related to the carbon footprint of their products. However, one of the bidders provided only an earlier LCA analyses of equivalent IT products and not the excel-file including data of the products they offered. The other bidder provided the excel-files. However, in the excel-form not all the required cells were filled in.
The material composition section seemed to be the easiest part of the form to fill in. Other parts, e.g. factory-specific information, were not given in full. To summarize, one of the bidders did not deliver the required information (excel-files), and the other bidder provided excel-files but with crucial information missing.
The missing data led to a situation in which the carbon footprints could not be calculated. Thus, both bidders received zero points for the carbon footprint criterion. However, it should be highlighted that the two bidders did deliver a lot of meaningful

37The Finnish Environment 36 | 2011
information related to the carbon footprints of the procured products. This informa-tion will be used by the procuring organization, i.e. Finnish Environment Institute, in the assessment of its own carbon footprint. It also indicates that the bidders will be able to deliver such information in the future.
5.3 ObservationsThe first couple of attempts to integrate the CF tools into the procurement processes were not successful. However, the first pilot was performed successfully, and did not require extra work from the procurers.
In general, among the procurers there seems to be interest in CO2 calculators. However, some questioned the extra pressure and demands put on the procurers. The procurers to some extent resisted and feared any increase in the workload in the preparation and realization of tender calls. The lack of LCA knowledge and the complexity of the excel-calculator aroused doubt in the presented tools. The procurers stressed a demand for easy and simplified calculators.
Some concerns were highlighted regarding the capability of the bidders to use the calculators and the possibility of not obtaining enough eligible and comparable tenders for decision-making.
The bidders found the calculation form difficult in the first pilot. Almost imme-diately a need for English documentation arose. This was solved by translating the manual and calculation form into English. Some improvements were also made to the documents of the tender call. In addition, the manufacturers commented on the following:
• Insufficient description of materials• Confusion about the data required for material processing• Difficulties gathering and giving the data of assembly, e.g. energy and electri-
city consumption in the factory
Ways to facilitate the use of the calculators were identified and are summarized below. • Training. The procurers should have a general understanding of the calculati-
on method and know how to integrate and tailor it to their own use.• Manuals. Bidders, importers or manufacturers, who fill in the information in
the calculator, should have comprehensive guidance in written form.• Informing in advance. It would be good to inform the bidders, importers or
manufacturers about the calculators and data required in advance (before any tender calls).
• Experience sharing and pilot experiences.
5.3.1 Limitations of the Calculators
GeneralTypically, the actors in the procurement process have tight time constraints, therefore there is limited willingness to include new environmental issues and/or new tools in the tender calls. Another restriction is the lack of LCA expertise among procurers.
There are also limiting issues for the bidders in the use of the presented CF tools. A lack of interest or knowledge in environmental issues can weaken the ability to

38 The Finnish Environment 36 | 2011
fill in the CF form. Difficulties can arise in data collection, for instance. In principle, this could lead to a situation of not having eligible tenders at all. Another possible scenario is that the product with the lowest CF is not even evaluated by the bidder due to time constraints. In this case, the highest score for the CF criterion would go to the “wrong” product.
Method SpecificOne major limitation of our tools is that they focus on a single environmental issue. If the comparison is only based on CF, it can lead to disadvantageous decisions in terms of other environmental impacts.
One should note that environmental impacts are not only caused by emissions, but also e.g. land use and land use change. Currently, the guidelines for the impact assessment of land use are still problematic and need to be improved.
The LCA approach also has its important limitations such as various uncertainties in the process. For instance, data variability, incomplete data and erroneousness data can affect the results and their interpretation. All the mentioned issues restrict the conclusions that can be drawn from a specific study.
Missing data can be a typical problem in LCA. In our case, missing information can lead to a situation where comparability is difficult or impossible. In principle, one could replace the missing data with e.g. values taken from other sources such as related literature. However, the replacement of missing data also has drawbacks. For instance, if the new data is beneficial to the bidders in some sense, it could lead to distorted or even false results and decisions.
The quantified nature of the results produced by the calculators also has limita-tions. The seeming precision in quantification of the CF can easily lead to trust in the analysis more than is warranted. As an example, it can lead to the comparison of results calculated using different methods and data. In other words, the different PCFs calculated by using the tools presented here, can only be compared with products from the same product group.
5.4 DiscussionThe EU commission recommends that public organizations use common environ-mental criteria in their procurement (EC Europa 2011a). Criteria have recently been developed and published for 18 product groups (EC Europa 2011b), and more product groups are under development.
It is clear that the carbon footprint will be used in public procurements in the future as a technical specification and award criteria, and only the speed of this develop-ment is uncertain. Carbon footprint as a criterion is not currently listed in EU criteria, and pilot projects such as Julia2030 are clearly necessary for wider application of this criterion.
Another recent example of the use CF in procurement is in the Synergy building process, in which the carbon footprint of the main structure materials of buildings is used as an award criterion for the design solution, i.e. the plan for the new office and laboratory building for the Finnish Environment Institute, see Nissinen et al. (2010), and internet-site: www.environment.fi/eco-officebuilding. The Synergia-carbon-footprint-tool can be freely uploaded from the website.
Know-how about climate impacts and carbon footprints of products and services among procurers and bidders is increasingly crucial for the introduction of this im-portant criterion in public procurement. Although the manufacturers of IT-products evidently have a lot of experience in this field, in this case 3 out of 4 bidders could not

39The Finnish Environment 36 | 2011
complete the information in the tender. Evidently, at least at the beginning, the best approach will be to allow bids that do not include CF information but give them a score of zero for this criterion. It is evident that the EU commission sees a future role for carbon footprint calculators in the procurement process of public organizations. Finnish government or participants in the criteria process could recommend this type of carbon footprint calculators to the EU commission.

40 The Finnish Environment 36 | 2011
6 Summary and Conclusions
6.1 SummaryIn this study, six product-specific carbon footprinting tools were developed. The tools are intended for use in public procurement processes. The calculators help estimate the greenhouse gas emissions of products being procured. The tools utilize current state-of-the-art knowledge and guidelines for estimating the climate impact of the products. One of the tools was piloted in autumn 2011 at the Finnish Environment Institute.
6.2 ConclusionsWe succeeded in developing six carbon footprinting tools for public procurement. The tools are understandable and relatively simple to use. LCA expertise is not needed to fill in the data form. The excel-files and manuals are in both Finnish and English. The calculator for the IT-products was integrated successfully into one tender competition.
The approach used in the calculators could be adapted to other product groups. This would possibly require the introduction of new material-specific GWP values taken e.g. from literature.
The Finnish government or participants in the criteria process could recommend this type of carbon footprint calculators to EU commission.
6.3 Suggestions for Future ImprovementsThe natural next step is to develop similar carbon footprinting tools for other products and services. In the development work, the experience gained in this study could be utilized.
The calculators do not cover the entire life cycle of the products comprehensively. The challenge is to include more of the processes during the entire life cycle of a product whilst at the same time avoiding an overly-complex and time consuming structure for the tools. Requiring more life cycle-specific data and using input-output data to get better cover of all the life cycle chains are possibilities that could be used. The benefits of any adjustments to the methods should be assessed in order to im-prove the calculators.
The tools presented here provide no information on the overall environmental performance of the products. Because of this, additional impact categories should be considered. Other impact categories could be assessed in a similarly streamlined way.

41The Finnish Environment 36 | 2011
BibliographyAndrae, A. and Andersen, O. 2010. Life cycle assessments of consumer electronics - are they consistent?
The International Journal of Life Cycle Assessment 15(8):827-836, DOI: 10.1007/s11367-010-0206-1. Apple 2011. Product environmental reports. http://www.apple.com/environment/reports/. [Accessed
on July 14, 2011]Aumônier, S. and Collins, M. 2005. Life cycle assessment of disposable and reusable nappies in the UK.
Environment Agency, Bristol. http://www.ahpma.co.uk/docs/LCA.pdf. Accessed on October 19, 2011]
Aumônier, S., Collins, M. and Garrett, P. 2008. An updated lifecycle assessment study for dispos-able and reusable nappies. Environment Agency, Bristol. http://randd.defra.gov.uk/Document.aspx?Document=WR0705_7589_FRP.pdf. [Accessed on October 19, 2011]
Bakri, S. N. S., Ramasamy, R. K. and Surif, S. 2010. Life cycle assessment of magnetic and electronic ballast for 36-W fluorescent lamp. The International Journal of Life Cycle Assessment, 15(8):837-841, DOI: 10.1007/s11367-010-0216-z.
Bala, A., Raugei, M., Benveniste, G., Gazulla, C. and Fullana-i-Palmer, P. 2010. Simplified tools for global warming potential evaluation: when ‘good enough’ is best. The International Journal of Life Cycle Assessment, 15(5):489-498, DOI: 10.1007/s11367-010-0153-x.
BSI (The British Standards Institution) 2008. PAS2050:2008, specification for the assessment of the life cycle greenhouse gas emissions of goods and services.
CEPI (Confederation of European Paper Industries) 2007. Framework for the development of carbon footprints for paper and board products. http://www.cepi.org/Content/Default.asp?PageID=558&DocID=13681. [Accessed on December 15, 2010]
CEPI (Confederation of European Paper Industries) 2009. Transport carbon footprint assessment guide-lines. http://www.cepi.org/content/default.asp?PageID=558&DocID=25539. [Accessed on October 19, 2011]
Choi, B.-C., Shin, H.-S., Lee, S.-Y. and Hur, T. 2006. Life cycle assessment of personal computer and its effective recycling rate. The International Journal of Life Cycle Assessment, 11(2):122-128.
Dias, A. C., Arroja, L. and Capela, I. (2007). Life cycle assessment of printing and writing paper produc-tion in Portugal. The International Journal of Life Cycle Assessment, 12(7):521-528.
dm 2009. Case Study Sanft & Sicher toilet paper by DM Drogeriemarkt, case study documentation. Case Study undertaken within the PCF Pilot Project Germany. http://www.pcf-projekt.de/down-load/1232962631/main/results/case-studies/. [Accessed on October 19, 2011]
Duan, H., Eugster, M., Hischier, R., Streicher-Porte, M. and Li, J. 2009. Life cycle assessment study of a Chinese desktop personal computer. Science of the Total Environment, 407(5):1755-1764. DOI: 10.1016/j.scitotenv.2008.10.063.
EC Europa 2011a. GPP Policy. http://ec.europa.eu/environment/gpp/gpp policy en.htm. [Accessed on July 12, 2011]
EC Europa 2011b. GPP Criteria. http://ec.europa.eu/environment/gpp/gpp criteria en.htm. [Accessed on July 12, 2011]
Ecoinvent 2010. Swiss center for life cycle inventory, ecoinventdatabase, v. 2.2. http://www.ecoinvent.ch/. [Accessed on September 22, 2010]Edana 2005. Sustainability report: Baby diapers and incontinence products. The Absorbent Hy-
giene Products Manufacturers Committee of Edana. http://www.edana.org/content/default.asp?PageID=75&DocID=2134. [Accessed on October 19,2011]
Edana 2008. Sustainability report 2007-2008, absorbent hygiene products. Edana. http://www.nappyin-formationservice.co.uk/docs/SUSREPORT_LV_FINAL.pdf. [Accessed on October 19, 2011]
ELCD (European Life Cycle Database) 2010. Joint research center, ELCD database 2.0. http://lca.jrc.ec.europa.eu/lcainfohub/datasetArea.vm. [Accessed on December 13, 2010]
EPD 2008. Product category rules for preparing an environmentalproduct declaration (EPD) for notebook computers. Version 1.0, Environment and Development
Foundation. http://media.gednet.org/2011/03/EDF200810_EPD-PCR_Electronic_Notebook.pdf. [Accessed on October 19, 2011]
EPD Norge 2008. Product category rules, seating solution. http://www.epd-norge.no/getfile.php/PDF/PCR/NPCR003-Seating%20updatedA.pdf. [Accessed on October 19, 2011]
EPD Norge 2011. Environmental product declaration. Personal communication with the EPD secretariat Signe Nielsen.
Eriksson, E. 2009. Product category rules for seats. http://www.environdec.com/pcr/pcr0902.pdf. [Ac-cessed on August 18, 2010]
Gamage, G. B., Boyle, C., McLaren, S. J. and McLaren, J. 2008. Life cycle assessment of commercial furniture: a case study of Formway life chair. The International Journal of Life Cycle Assessment, 13(5):401-411. DOI: 10.1007/s11367-008-0002-3.
GHG Protocol 2011. Greenhouse gas protocol standards. http://www.ghgprotocol.org/standards. [Ac-cessed on August 5, 2011]
IEA (International Energy Agency) 2009. CO2 emissions from fuel combustion, highlights. International EPD 2011. The international EPD consortium, climate declaration. http://www.climat-
edec.com/. [Accessed on August 5, 2011]
41The Finnish Environment 36 | 2011

42 The Finnish Environment 36 | 2011
IPCC (International Panel on Climate Change) 2007. Climate Change 2007: The Physical Science Basis. Cambridge University Press.
IVF 2005. Lot 3 personal computers (desktops and laptops) and computer monitors. Final report, Euro-pean Comission DG TREN, IVF Industrial Research and Development Corporation. Availabe online: http://extra.ivf.se/ecocomputer/downloads/Eup%20Lot%203%20Final%20Report%20070913%20published.pdf. [Accessed on October 19, 2011]
Joseph, K. and Nithya, N. 2009. Material flows in the life cycle of leather. Journal of Cleaner Production, 17(7):676-682. DOI:10.1016/j.jclepro.2008.11.018
JRC (Joint Research Centre) 2010. General guide for Life Cycle Assessment. http://lct.jrc.ec.europa.eu/assessment. [Accessed on August 5, 2011]
Lu, L.-T., Wenick, I. K., Hsio, T.-Y., Yu, Y.-H., Yang, Y.-M.,and Ma, H.-W. 2006. Balancing the life cycle impacts of notebook computers:Taiwan’s experience. Resources, Conservation and Recycling, 48(1):13-25. DOI:10.1016/j.rescon-
rec.2005.12.010Nissinen, A., Kämäri, J., Linjama, J., Niemelä, J., Muttilainen,J., Rintala, T. and Etelämäki, P., (editors) 2010. Identifying and assessing the critical aspects of eco-
efficiency for a new Finnish office and laboratory building. SB10 Finland, Sustainable Community - building SMARTtm, 22-24 September in Espoo, Finland, Conference proceedings electronic version p. 768-773.
Nordic Ecolabelling 2008. Nordic ecolabelling of sanitary products, version 5.2. http://www.nordic-ecolabel.org/Templates/Pages/CriteriaPages/CriteriaGetFile.aspx?fileID=115420001. [Accessed on October 19, 2011]
Nordic Ecolabelling 2009. Nordic ecolabelling of paper products- basic module, version 1.0. http://jout-senmerkki.fi/joutsenkriteerit/kriteerit/paperituotteiden_moduulit. [Accessed on August 11, 2010]
Nordic Ecolabelling 2010. Background memo on the swan labelling of sanitary products, version 5.2.OSRAM 2009. Life Cycle Assessment of Illuminants, A Comparison of Light Bulbs, Compact Fluerescent
Lamps and LED Lamps. Executive summary, OSRAM Opto Semiconductors GmbH, Regensburg, Germany. http://www.osram-os.com/osram_os/EN/About_Us/We_shape_the_future_of_light/Our_obligation/LED_life-cycle_assessment/OSRAM_LED_LCA_Summary_November_2009.pdf. [Accessed on October 19, 2011]
Paper Profile 2010. http://www.paperprofile.com/index.html. [Accessed on August 5, 2010]Plastics Europe 2010. EPD plastics. http://www.plasticseurope.org/plastics-sustainability/ life-cycle-
thinking/epd-reports.aspx. [Accessed on Dec. 15, 2010]ReCiPe 2010. ReCiPe Mid/Endpoint method, version 1.0.Sippola, V. 2010. Replacement of Lamps in Outdoor Lighting Due to the Implementing Measures of the
Eco-design -directive (in Finnish). Master’s thesis, Aalto University, School of Science and Technol-ogy. http://lib.tkk.fi/Dipl/2010/urn100148.pdf. [Accessed on October 19, 2011]
Socolof, M., Overly, J. and Geibig, J. 2005. Environmental life-cycle impacts of CRT and LCD desk-top computer displays. Journal of Cleaner Production, 13(13-14):1281-1294. DOI:10.1016/j.jclepro.2005.05.014
Spitzley, D. V., Dietz, B. A. and Keoleian, G. A. 2006. Life-cycle assessment of office furniture products. Final report on the study of three Steelcase office furniture. Center for Sustainable Systems, Univer-sity of Michigan. http://css.snre.umich.edu/css_doc/CSS06-11.pdf. [Accessed on October 19, 2011]
Statistics Finland 2010. Greenhouse gas emissions in Finland 1990-2008. http://www.stat.fi/tup/khkinv/fin_nir_ 20100525.pdf. [Accessed on August 12, 2011]
Steelcase 2004. Think Chair EPD. http://www.steelcase.com/en/products/Category/Seating/task/think/Documents/Environmental%20Product%20Declaration_04-0012421.pdf . [Accessed on Au-gust 4, 2010]
SYKE (Finnish Environment Institute) 2010. Emissions factors for waste fractions. Developed atSYKE in Julia2030-project.SYKE (Finnish Environment Institute) 2011. Emissions of electricity purchasing in life cycle calculations
Finland. http://www.ymparisto.fi/default.asp?node=26328&lan=fi#a0.(in Finnish), [Accessed on July 14, 2011]Tichelen, P. V., Geerken, T., Jansen, B., Bosch, M. C., Hoof, V. V., Vanhooyodonk, L. and Vercalsteren, A.
2007. Lot9 public street lighting, Final report. VITO. http://www.eup4light.net/assets/pdffiles/Final/VITOEuPStreetLightingFinal.pdf. [Accessed on October 19, 2011]
VHK 2005. Meeup methodology final report.VHK for European Comission. http://ec.europa.eu/en-ergy/demand/legislation/doc/2005_11_28_finalreport1_en.pdf. [Accessed on October 19, 2011]
VTT 2010. Lipasto traffic emissions. http://www.lipasto.vtt.fi/indexe.htm.[Accessed on July 13, 2011]WWF 2011a. Check your paper database. http://checkyourpaper.panda.org.[Accessed on July 12, 2011]WWF 2011b. Users manual: WWF check your paper. WWF International. http://checkyourpaper.panda.
org/files/dl/CYP_manual_FINAL_280411.pdf. [Accessed on September 12, 2011]
42 The Finnish Environment 36 | 2011

43The Finnish Environment 36 | 2011
Appendix A. MEEUP Unit Indicators
The relevant MEEUP unit indicators are presented below. In Tab. A.1 indicators for plastics, plastic fillers, reinforcement, and additives are listed. In Tab.A.2 indicators for metals, coatings and platings are listed. Indicators for electronics and miscellane-ous materials are listed in Tab. A.3. Finally, Tab. A.4 shows the indicators of OEM manufacturing.
Table A.1. MEEUP unit indicators for plastics and fillers (VHK 2010).
Material GWP [kg CO2e/kg]
LDPE 1.9
HDPE 1.81
LLDPE 1.86
PP 1.97
PS 2.79
EP 2.70
HI-PS 2.90
PVC 2.16
SAN 3.00
ABS 3.32
PA 6 8.56
PC 5.39
PMMA 6.00
Epoxy 6.59
Rigid PUR 4.17
Flex PUR 4.48
Talcum filler 0.61
E-glass fiber 3.36
Aramid fibre 13.09
Table A.2.MEEUP unit indicators for metals and coatings (VHK 2005).
Material GWP [kg CO2e/kg]
Steel sheet galvanized 2.83
Steel tube / profile 1.38
Cast iron 1.06
Ferrite 4.24
Stainless coil 6.21
Aluminium sheet / extrusion 10.35
Aluminium die-cast 3.55
Cu winding wire 7.37
Cu wire 6.20
Cu tube / sheet 2.73
Cu with 36% Zn cast 1.81
Zn with 4% Al 1.10
Mg with 5% Zn 18.38
pre-coating coil 15.56
powder coating 17.81
Cu/Ni/Cr plating 124.68
Au/Pt/PD (per g) 17.74
Appendix A/1

44 The Finnish Environment 36 | 2011
Appendix A/2
Table A.3. MEEUP unit indicators for electronics and miscellaneous (VHK 2005).
Material GWP [kg CO2e/kg]
LCD per m2 screen 184.3
CRT per m2 screen 171
large capasitors and coils 21.67
slots / external ports 10.03
ICs, large 505.41
Surface mounted devices (SMDs) 167
Printed wiring board (PWB), ½ lay 2.75 kg/m2 11.22
PWB, 6 lay 4.5 kg/m2 15.69
PWB, 6 lay 2 kg/m2 20.21
lead-free tin solder with 4% Ag and 0.5% Cu 11.60
glass for lamps 0.83
Table A.4. MEEUP unit indicators for OEM manufacturing (VHK 2005).
Material GWP [kg CO2e/kg]
all plastic parts 2.27
foundries Fe/Cu/Zn 0.12
foundries Al 0.36
sheetmetal plant 0.84
sheetmetal scrap 0.80

45The Finnish Environment 36 | 2011
DOCUMENTATION PAGEPublisher Finnish Environment Institute (SYKE) Date
December 2011
Author(s) Maija Mattinen and Ari Nissinen
Title of publication Carbon Footprint Calculators for Public Procurement
Publication seriesand number
The Finnish Environment 36/2011
Theme of publication Environmental Protection
Parts of publication/other projectpublications
The publication is avalable only on the internet: www.ymparisto.fi/publications
Abstract There is growing interest in public organizations to take into account the climate impacts of the products and services they procure. Furthermore, in Finland a Government Resolution exists that provides a framework and sets aims for sustainable public procurement.Several municipalities in the Helsinki region together with the Helsinki Region Environmental Services Authority and several expert organizations initiated an EU Life project, JULIA2030, to develop calculators for different sectors in municipalities.Our subproject deals with the procurement of products, and we developed carbon footprint calculators for six product groups: office and tissue paper, laptop computers, office seating solutions, incontinence products, and outdoor lighting products. The developed calculators are intended for use in tender calls, as attachments that the bidders must deliver together with their bid. The carbon footprint would be used as an award criterion.The results of the sub-project include: this report, calculators, instructions for each calculator, a guidebook on climatically sound public procurement, and an internet-site: www.hsy.fi/julia2030/en.
Keywords public procurement, carbon footprint, climate impacts, calculators, office paper, tissue paper, laptop computers, office chairs, incontinence products, outdoor lighting
Financier/ commissioner
ISBN(pbk.)
ISBN978-952-11-3961-1 (PDF)
ISSN(print)
ISSN 1796-1637 (online)
No. of pages47
LanguageEnglish
RestrictionsPublic
Price (incl. tax 8 %)
For sale at/distributor
The publication is avalable only on the internet: www.ymparisto.fi/publications
Financierof publication
Finnish Environmental Institute (SYKE)P.O.Box 140, FI-00251 Helsinki, Finland
Printing place and year

46 The Finnish Environment 36 | 2011
KUVAILULEHTIJulkaisija Suomen ympäristökeskus (SYKE) Julkaisuaika
Joulukuu 2011
Tekijä(t) Maija Mattinen ja Ari Nissinen
Julkaisun nimi Carbon Footprint Calculators for Public Procurement(Julkisten hankintojen hiilijalanjälkilaskurit)
Julkaisusarjan nimi ja numero
The Finnish Environment 36/2011 (Suomen ympäristö 36/2011)
Julkaisun teema Ympäristön suojelu
Julkaisun osat/muut saman projektin tuottamat julkaisut
Julkaisu on saatavana vain internetistä: www.ymparisto.fi/publications (englanniksi)
Tiivistelmä Julkisissa organisaatioissa on kasvava kiinnostus ottaa huomioon hankittavien tuotteiden ja palveluiden ympäristövaikutuksia. Myös hallituksen päätös kestävistä julkisista hankinnoista luo puitteet ja asettaa tavoitteita tälle työlle Suomessa.Helsingin alueen kunnat aloittivat yhdessä Helsingin seudun ympäristöpalvelujen ja muutamien asiantuntijaorganisaatioiden kanssa EU Life-hankkeen, JULIA2030, jossa kehitetään laskureita kunnan eri sektorien käyttöön.Osaprojektimme käsittelee tuotteiden hankintaa. Hiilijalanjälkilaskureita kehitettiin kuudelle tuoteryhmälle: toimisto- ja pehmopaperit, kannettavat tietokoneet, toimistotuoleille, inkontinenssituotteille ja ulkovalaistukselle. Kehitetyt laskurit on tarkoitus sisällyttää tarjouksiin liitteinä, jotka tarjoajien tulee toimittaa tarjouksensa mukana. Hiilijalanjälkeä käytettäisiin vertailuperusteena.Tämän osahankkeen tulokset käsittävät tämän raportin, laskurit, ohjeet jokaiseen laskuriin, ohjekirjan ilmastollisesti kestävistä julkisista hankinnoista ja internet-sivun: www.hsy.fi/julia2030 .
Asiasanat julkiset hankinnat, hiilijalanjälki, ilmastovaikutukset, laskurit, toimistopaperi, pehmopaperi, kannettavat tietokoneet, työtuolit, inkontinenssituotteet, ulkovalaistus
Rahoittaja/ toimeksiantaja
ISBN(nid.)
ISBN978-952-11-3961-1 (PDF)
ISSN(pain.)
ISSN1796-1637 (online)
Sivuja47
KieliEnglanti
LuottamuksellisuusJulkinen
Hinta (sis. alv 8 %)
Julkaisun myynti/ jakaja
Julkaisu on saatavana vain internetistä: www.ymparisto.fi/publications (englanniksi)
Julkaisun kustantaja Suomen ympäristökeskus (SYKE)PL 140, 00251 Helsinki
Painopaikka ja -aika

47The Finnish Environment 36 | 2011
PRESENTATIONSBLADUtgivare Finlands miljöcentral (SYKE) Datum
December 2011
Författare Maija Mattinen och Ari Nissinen
Publikationens titel Carbon Footprint Calculators for Public Procurement(Räkneverk för koldioxidavtryck för offentlig upphandling
Publikationsserieoch nummer
Miljön i Finland 36/2011
Publikationens tema Miljövård
Publikationens delar/andra publikationerinom samma projekt
Publikationen finns tillgänglig bara på internet: www.ymparisto.fi/publications (på engelska)
Sammandrag Offentliga organisationer har ett ökat intresse att ta i beaktande miljöeffekterna hos de produkter och den service de upphandlar. Även statsrådets beslut om hållbar offentlig upphandling ger ramarna och ställer upp målen för detta i Finland.Kommunerna i Helsingfors-området startade tillsammans med Helsingforsregionens miljötjänster och några expertorganisationer EU Life-projektet JULIA2030, där man utvecklar räkneverk för att användas av de olika sektorerna i kommunen.Vårt delprojekt gäller upphandlingen av produkter. Koldioxidavtrycksräkneverk utvecklades för sex produktgrupper: kontors- och mjukpapper, bärbara datorer, kontorsstolar, inkontinensprodukter och utomhusbelysning. Avsikten är att inkludera de utvecklade räkneverken i offerterna som bilagor till att levereras med offerten av den som gör offerten. Koldioxidavtrycket skulle användas som jämförelsegrund.Vårt delprojekts resultat omfattar denna rapport, räkneverken, anvisningar för varje räkneverk, en handbok om sådan upphandling som är hållbar ur klimatsynpunkt och webbplatsen: www.hsy.fi/julia2030.
Nyckelord offentlig upphandling, koldioxidavtryck, klimatpåverkan, räkneverk, kontorspapper, mjukpapper, arbetsstolar, inkontinens produkt, utomhusbelysning
Finansiär/uppdragsgivare
ISBN(hft.)
ISBN978-952-11-3961-1 (PDF)
ISSN(print)
ISSN1796-1637 (online)
Sidantal47
SpråkEngelska
OffentlighetOffentlig
Pris (inneh. moms 8 %)
Beställningar/distribution
Publikationen finns tillgänglig bara på internet: www.ymparisto.fi/publications (på engelska)
Förläggare Finland miljöcentral (SYKE)PB 140, 00251 Helsingfors
Tryckeri/tryckningsort-år

YMPÄRISTÖN-SUOJELU
ENVIRONMENTALPROTECTION
CA
RB
ON
FO
OT
PR
INT
CA
LC
UL
AT
OR
S F
OR
PU
BL
IC P
RO
CU
RE
ME
NT
THE FINNISH ENVIRONMENT 36 | 2011
Carbon Footprint Calculators for Public Procurement
Maija Mattinen and Ari Nissinen
Finnish Environment Institute
Green public procurement is a way for public authorities to
reduce environmental impacts of goods and services they procure.
This publication describes carbon footprint calculators for public
procurement, developed for six product groups: office and tissue
paper, laptop computers, office seating solutions, incontinence
products, and outdoor lighting products. Additionally, the piloting
of one calculator in a real tender call case is described, and general
aspects of the use of tools in public procurement are discussed.
ISBN 978-952-11-3961-1 (PDF)
ISSN 1796-1637 (verkkoj.)
TH
E F
INN
ISH
EN
VIR
ON
ME
NT
36
| 20
11