Embed Size (px)
Citation preview

National Water-Quality Assessment Study Unit
Upper Illinois River Basin Study Unit
U.S. DEPARTMENT OF THE INTERIORU.S. GEOLOGICAL SURVEY
National Water-Quality Assessment Program
Environmental Setting of theUpper Illinois River Basin and Implications for Water Quality
Water-Resources Investigations Report 98–4268

Environmental Setting of the Upper Illinois River Basin and Implications for Water Quality
By Terri L. Arnold, Daniel J. Sullivan, Mitchell A. Harris, Faith A. Fitzpatrick, Barbara C. Scudder,Peter M. Ruhl, Dorothea W. Hanchar, and Jana S. Stewart
Water-Resources Investigations Report 98–4268
Urbana, Illinois1999
U.S. DEPARTMENT OF THE INTERIORU.S. GEOLOGICAL SURVEY

U.S. DEPARTMENT OF THE INTERIOR
BRUCE BABBITT, Secretary
U.S. GEOLOGICAL SURVEY
Charles G. Groat, Director
For additional information write to: Copies of this report can be purchasedfrom:
U.S. Geological SurveyBranch of Information ServicesBox 25286Denver, CO 80225-0286
The use of firm, trade, and brand names in this report is for identification purposes only and does not constitute endorsement by the U.S. Geological Survey.
District ChiefU.S. Geological Survey, WRD221 N. BroadwayUrbana, IL 61801
Information regarding National Water-Quality Assessment (NAWQA) Program is available on the Internet on the World Wide Web. You may connect to the NAWQA Home Page using the Uniform Resource Locator (URL):
http://wwwrvares.er.usgs.gov/nawqa/nawqa_home.html
FOREWORD
The mission of the U.S. Geological Survey (USGS) is to assess the quantity and quality of the earth resources of the Nation and to provide informa-tion that will assist resource managers and policymak-ers at Federal, State, and local levels in making sound decisions. Assessment of water-quality conditions and trends is an important part of this overall mission.
One of the greatest challenges faced by water-resources scientists is acquiring reliable information that will guide the use and protection of the Nation’s water resources. That challenge is being addressed by Federal, State, interstate, and local water-resource agencies and by many academic institutions. These organizations are collecting water-quality data for a host of purposes that include: compliance with permits and water-supply standards; development of remedia-tion plans for specific contamination problems; opera-tional decisions on industrial, wastewater, or water-supply facilities; and research on factors that affect water quality. An additional need for water-quality information is to provide a basis on which regional- and national-level policy decisions can be based. Wise decisions must be based on sound information. As a society we need to know whether certain types of water-quality problems are isolated or ubiquitous, whether there are significant differences in conditions among regions, whether the conditions are changing over time, and why these conditions change from place to place and over time. The information can be used to help determine the efficacy of existing water-quality policies and to help analysts determine the need for and likely consequences of new policies.
To address these needs, the U.S. Congress appropri-ated funds in 1986 for the USGS to begin a pilot pro-gram in seven project areas to develop and refine the National Water-Quality Assessment (NAWQA) Pro-gram. In 1991, the USGS began full implementation of the program. The NAWQA Program builds upon an existing base of water-quality studies of the USGS, as well as those of other Federal, State, and local agencies. The objectives of the NAWQA Program are to:
• Describe current water-quality conditions for a large part of the Nation’s freshwater streams, rivers, and aquifers.
• Describe how water quality is changing over time.
• Improve understanding of the primary natural and human factors that affect water-qualityconditions.
This information will help support the development and evaluation of management, regulatory, and moni-toring decisions by other Federal, State, and local agencies to protect, use, and enhance water resources.
The goals of the NAWQA Program are being achieved through ongoing and proposed investigations of 59 of the Nation’s most important river basins and aquifer systems, which are referred to as study units. These study units are distributed throughout the Nation and cover a diversity of hydrogeologic settings. More than two-thirds of the Nation’s freshwater use occurs within the 59 study units and more than two-thirds of the people served by public water-supply systems live within their boundaries.
National synthesis of data analysis, based on aggregation of comparable information obtained from the study units, is a major component of the program. This effort focuses on selected water-quality topics using nationally consistent information. Comparative studies will explain differences and similarities in observed water-quality conditions among study areas and will identify changes and trends and their causes. The first topics addressed by the national synthesis are pesticides, nutrients, volatile organic compounds, and aquatic biology. Discussions on these and other water-quality topics will be published in periodic summaries of the quality of the Nation’s ground and surface water as the information becomes available.
This report is an element of the comprehensive body of information developed as part of the NAWQA Program. The program depends heavily on the advice, cooperation, and information from many Federal, State, interstate, Tribal, and local agencies and the public. The assistance and suggestions of all are greatly appreciated.
Robert M. HirschChief Hydrologist


CONTENTS
Foreward ................................................................................................................................................................................ IIIAbstract.................................................................................................................................................................................. 1Introduction ........................................................................................................................................................................... 1
Purpose and Scope....................................................................................................................................................... 3Location and Extent of the Study Area........................................................................................................................ 3Acknowledgments ....................................................................................................................................................... 5
Environmental Setting ........................................................................................................................................................... 5Natural Factors............................................................................................................................................................. 5
Bedrock Geology............................................................................................................................................... 5Physiography and Surficial Geology ................................................................................................................. 9Soils ................................................................................................................................................................... 18Vegetation .......................................................................................................................................................... 18Climate............................................................................................................................................................... 21Ecoregions ......................................................................................................................................................... 23
Human Factors............................................................................................................................................................. 25Land Use............................................................................................................................................................ 25Urbanization ...................................................................................................................................................... 26Population Change............................................................................................................................................. 26
Hydrologic Characteristics .......................................................................................................................................... 26Surface Water..................................................................................................................................................... 26
Streamflow Characteristics ...................................................................................................................... 31Floods and Droughts................................................................................................................................ 38Lakes and Wetlands ................................................................................................................................. 38Water Chemistry ...................................................................................................................................... 39
Aquatic Biological Characteristics .................................................................................................................... 40Early Biogeographic Setting.................................................................................................................... 40Early Aquatic Communities..................................................................................................................... 43Recent Conditions and Trends................................................................................................................. 43Nonindigenous Species............................................................................................................................ 44Threatened and Endangered Species ....................................................................................................... 46
Ground Water..................................................................................................................................................... 47Surficial Aquifers ..................................................................................................................................... 47Bedrock Aquifers ..................................................................................................................................... 47Surface-Water and Ground-Water Interactions........................................................................................ 49
Water Use........................................................................................................................................................... 49Implications of Environmental Setting for Water Quality ..................................................................................................... 50
Study Area Stratification by Natural and Human Factors ........................................................................................... 50Surface Water and Aquatic Biota................................................................................................................................. 52Ground Water............................................................................................................................................................... 55
Summary................................................................................................................................................................................ 56References Cited.................................................................................................................................................................... 57Appendix 1. Bibliography of U.S. Geological Survey Reports from the Upper Illinois River Basin Pilot Study of
the National Water-Quality Assessment Program.................................................................................................... 67
FIGURES
1. Map showing the location of National Water-Quality Assessment Program study units and their proposedimplementation dates................................................................................................................................................ 2
Contents V

2. Graph showing the rotation schedule for activities in the upper Illinois River Basin study unit as partof the National Water-Quality Assessment Program, 1997–2010............................................................................ 3
3–19. Maps of the upper Illinois River Basin showing:3. Drainage basins ............................................................................................................................................... 44. (A) Generalized uppermost bedrock geology and (B) uppermost bedrock geology....................................... 65. Coal seams mined............................................................................................................................................ 106. Approximate historical extent of glacial lobes................................................................................................ 117. Prominent glacial moraines ............................................................................................................................. 128. Quaternary deposits ......................................................................................................................................... 139. Surface topography.......................................................................................................................................... 14
10. Physiography ................................................................................................................................................... 1511. Thickness of Quaternary deposits ................................................................................................................... 1712. Soil order of the uppermost horizon................................................................................................................ 1913. Soil permeability ............................................................................................................................................. 2014. Potential-natural vegetation............................................................................................................................. 2215. Average annual precipitation for the period 1961–90 ..................................................................................... 2416. Anderson level-1 land-use classification, 1990 ............................................................................................... 2717. Urbanization .................................................................................................................................................... 2818. Calculated mean annual streamflows .............................................................................................................. 3219. Active U.S. Geological Survey streamflow-gaging stations, 1997.................................................................. 35
20. Graphs showing mean monthly streamflow at four stations in the upper Illinois River Basin, 1950–97................ 3721–22. Maps of the upper Illinois River Basin showing:
21. Loads of selected constituents ......................................................................................................................... 4122. Uppermost bedrock aquifers ........................................................................................................................... 48
23. Graphs showing surface- and ground-water use in the upper Illinois River Basin, 1995........................................ 5124–25. Maps of the upper Illinois River Basin showing:
24. Level-3 surface-water stratification ................................................................................................................. 5325. Level-4 ground-water stratification ................................................................................................................. 54
TABLES (all apply to the upper Illinois River Basin unless indicated)
1. Uppermost bedrock stratigraphy............................................................................................................................. 82. Uppermost Quaternary stratigraphy ....................................................................................................................... 163. Land use, 1970 and 1990 ........................................................................................................................................ 264. Population change, by county, for the period 1970–90 .......................................................................................... 295. Active U.S. Geological Survey streamflow-gaging stations, 1997......................................................................... 336. Flow-duration characteristics at selected streamflow-gaging stations.................................................................... 367. Trends in streamflow at selected streamflow-gaging stations, 1950–97................................................................. 388. Biological Stream Characterization (BSC) categories............................................................................................ 459. Summary of Biological Stream Characterization (BSC) of the Des Plaines, Fox, and Kankakee River
Basins in Illinois ..................................................................................................................................................... 4510. Historically recorded fish species that are listed as threatened, endangered, or of special concern by
the States of Illinois, Indiana, or Wisconsin ........................................................................................................... 4611. History of water use................................................................................................................................................ 49
VI Contents

CONVERSION FACTORS, VERTICAL DATUM, AND ABBREVIATIONS
Temperature in degrees Fahrenheit (°F) may be converted to degrees Celsius (°C) as follows:
°C = (°F - 32) / 1.8
Vertical datum: In this report, "sea level" refers to the National Geodetic Vertical Datum of 1929(NGVD of 1929)—a geodetic datum derived from a general adjustment of the first-order level netsof both the United States and Canada, formerly called Sea Level Datum of 1929.
Concentrations of chemical constituents in water are given either in milligrams per liter (mg/L) ormicrograms per liter (µg/L).
Abbreviations used in this report:.
Multiply By To obtain
Length
inch (in.) 25.4 millimeterfoot (ft) 0.3048 meter
mile (mi) 1.609 kilometer
Area
acre 4,047 square metersquare mile (mi2) 2.590 square kilometer
Flow rate
cubic foot per second (ft3/s) 0.02832 cubic meter per second million gallons per day (Mgal/d) 0.04381 cubic meter per second
inch per year (in/yr) 25.4 millimeter per year
Mass
ton per day (ton/d) 0.9072 metric ton per day
APC Areas of Probable ConcernBSC Biological Stream Characterization
IBI Index of Biotic IntegrityIEPA Illinois Environmental Protection AgencyINHS Illinois Natural History SurveyLIRB Lower Illinois River Basin
MWRDGC Metropolitan Water Reclamation District of Greater ChicagoNAWQA National Water-Quality Assessment Program
TARP Tunnel and Reservoir PlanUIRB Upper Illinois River Basin
USEPA United States Environmental Protection AgencyUSGS United States Geological Survey
Contents VII


Environmental Setting of the Upper Illinois River Basin and Implications for Water QualityBy Terri L. Arnold, Daniel J. Sullivan, Mitchell A. Harris, Faith A. Fitzpatrick, Barbara C. Scudder, Peter M. Ruhl, Dorothea W. Hanchar, and Jana S. Stewart
Abstract
The upper Illinois River Basin (UIRB) is the 10,949 square mile drainage area upstream from Ottawa, Illinois, on the Illinois River. The UIRB is one of 13 studies that began in 1996 as part of the U.S. Geological Survey’s National Water-Quality Assessment program. A compilation of environmental data from Federal, State, and local agencies provides a description of the environmen-tal setting of the UIRB. Envi-ronmental data include natural factors such as bedrock geology, physiography and surficial geol-ogy, soils, vegetation, climate, and ecoregions; and human factors such as land use, urban-ization trends, and population change. Characterization of the environmental setting is useful for understanding the physical, chemical, and biological char-acteristics of surface and ground water in the UIRB and the possible implications of that environmental setting for water quality. Some of the possible implications identified include depletion of dissolved
oxygen because of high concen-trations of organic matter in wastewater, increased flooding because of suburbanization, elevated arsenic concentrations in ground water because of weathering of shale bedrock, and decreasing ground-water levels because of heavy pump-ing of water from the bedrock aquifers.
INTRODUCTION
The National Water-Quality Assessment (NAWQA) program of the U.S. Geological Survey (USGS) was designed to provide a national view of the status and trends of the Nation’s water resources (Hirsch and others, 1988). On this national scale, consistent monitoring of water-quality conditions over time and a nationally comparable description of water resources are provided. Concerns for the unique hydrologic systems of individual drainage basins are balanced with nationally consistent design criteria. The program utilizes an interdiscipli-nary approach to study basin ecosystems by incorporating ground- and surface-water hydrology and biology. Results from NAWQA studies will help in
understanding how natural and human factors affect water quality.
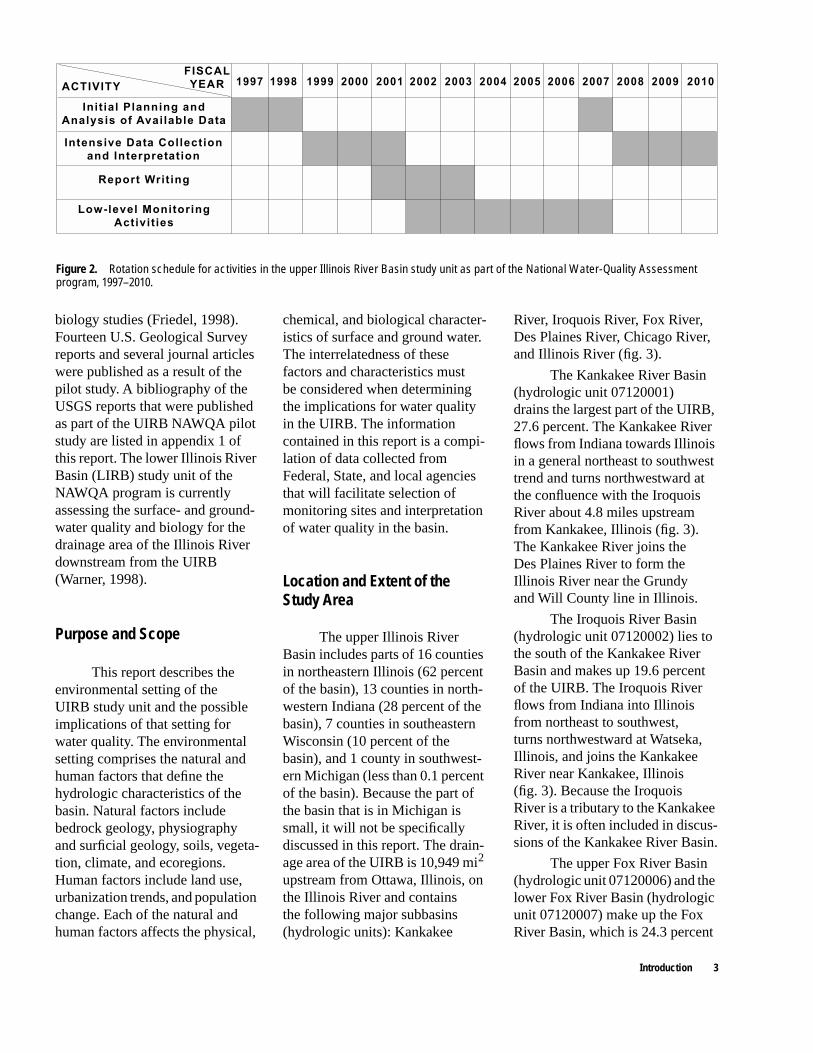
The building blocks of the NAWQA program are approxi-mately 60 major surface-water drainage basins, called study units (fig. 1). The number of study units varies with changes in priority and funding for the NAWQA program. These drainage basins include about one-half of the area of the conterminous United States, supply water to approximately 65 percent of the population that uses public water supplies, and represent a variety of natural and manmade settings and water-quality issues. The study units are divided into three groups that operate on a 10-year rotational schedule. This schedule is designed to provide periods of initial planning and analysis of available data, intensive data collection and interpretation, report writing, and low-level monitoring activities (fig. 2). (Gilliom and others, 1995).
In 1986, the upper Illinois River Basin (UIRB) was selected as one of seven study units to participate in the pilot phase of the National Water-Quality Assessment program. The UIRB pilot study focused on surface water (Mades, 1987), but the study that began in 1996 includes surface-water, ground-water, and
Introduction 1

2 Environmental Setting of the Upper Illinois River Basin and Implications for Water Quality
Pu
ge
tS
ou
nd
Ba
sin
Ya
kim
aR
ive
rB
asin
Will
am
ett
eB
asin
Ye
llow
sto
ne
Up
pe
rS
na
ke
Riv
er
Ba
sin
Sa
cra
me
nto
Riv
erB
asin
Re
dR
ive
rR
ed
Riv
er
oft
he
oft
he
No
rth
Ba
sin
Gre
at
Sa
ltL
ake
Ba
sin
sN
eva
da
Ba
sin
an
dR
an
ge
Sa
nta
An
aB
asin
So
uth
Ce
ntr
al
Te
xa
s
So
uth
ern
Hig
h
Pla
ins
Rio
Gra
nd
e
Va
lley
Aca
dia
n-
Po
ntc
ha
rtra
in
Mo
bile
Riv
er
an
d
Trib
uta
rie
s
Oza
rk
Pla
tea
us
Ce
ntr
al
Arizo
na
Ba
sin
s
Nort
hP
latte
Ba
sin
Ka
nsa
sR
ive
rB
asin
Ce
ntr
alN
eb
raska
Ba
sin
s
South
Pla
tte
South
Pla
tte
Ba
sin
Up
pe
rA
rka
nsa
sR
ive
rB
asin
Ke
ntu
cky
Riv
erB
asin
Apa
lach
ico
la-
Ch
atta
ho
och
ee
-F
lintR
ive
rB
asin
Ca
na
dia
n-
Cim
arr
on
Riv
er
Ba
sin
s
So
uth
ern
Sa
nte
e
Up
pe
r
Mis
sis
sip
pi
Riv
er
Ba
sin
Ea
ste
rn
Iow
a
Ba
sin
s
We
ste
rn
La
ke
Mic
hig
an
Dra
ina
ge
Up
pe
rIllin
ois
Up
pe
rIllin
ois
Riv
erB
asin
Lo
we
rIllin
ois
Riv
erB
asin
White
Riv
er
Ba
sin
Gre
ata
nd
Little
Mia
mi
Riv
er
Ba
sin
s
La
ke
Erie
-
La
ke
St.
Cla
irL
ake
St.
Cla
ir
Dra
ina
ge
Alb
em
arle
-
Pa
mlic
o
Dra
ina
ge
Ka
na
wh
a-N
ew
Riv
erB
asin
De
lma
rva
Pe
nin
su
la
Po
tom
ac
Riv
erB
asin
Po
tom
ac
Riv
erB
asin
Co
nn
ecticu
t,H
ou
sa
ton
ic,
an
dT
ha
me
sR
ive
rB
asin
s
Up
pe
r
Te
nn
esse
e
Riv
er
Ba
sin
Lo
ng
Isla
nd
an
dL
on
gIs
lan
da
nd
Ne
wJe
rse
y
Co
asta
lDra
ina
ge
sC
oa
sta
lDra
ina
ge
s
Hu
dso
nR
ive
rH
ud
so
nR
ive
r
Ba
sin
Alle
gh
en
ya
nd
Alle
gh
en
ya
nd
Mo
no
ng
ah
ela
Riv
erB
asin
sR
ive
rB
asin
sL
ow
er
Su
sq
ue
ha
nn
a
Riv
er
Ba
sin
Mis
sis
sip
pi
Em
ba
ym
en
t
Sa
n
Jo
aq
uin
-
Tu
lare
Ba
sin
s
Up
pe
rC
olo
rad
oR
ive
rB
asin
No
rth
ern
Ro
ckie
sN
ort
he
rnR
ockie
s
Inte
rmo
nta
ne
Ba
sin
s
Mid
dle
Ark
an
sa
s
Riv
erB
asin
Trinity
Riv
er
Ba
sin
Ge
org
ia-
Flo
rid
a
Co
asta
l
Pla
in
Lo
we
r
Te
nn
esse
e
Riv
erB
asin
Riv
erB
asin
Ba
sin
an
d
Co
asta
l
Dra
ina
ge
s
Flo
rid
a
Pu
ge
tS
ou
nd
Ba
sin Ce
Cen
tn
trarall
Cen
tral
Co
Colulu
mb
mbiaia
Colu
mbia
Pl
Pla
ta
tea
eauu
Pla
teau
Ce
Cen
tn
trarall
Co
Colulu
mb
mbiaia
Pl
Pla
ta
tea
eauu
Ya
kim
aR
ive
rB
asin
Will
am
ett
eB
asin
Ye
llow
sto
ne
Ye
llow
sto
ne
Up
pe
rU
pp
er
Sn
ake
Sn
ake
Riv
er
Riv
er
Ba
sin
Ba
sin
Sa
cra
me
nto
Sa
cra
me
nto
Riv
er
Riv
erB
asin
Ba
sin
Re
dR
ed
Riv
er
Riv
er
of
oft
he
the
No
rth
No
rth
Ba
sin
Ba
sin
Gre
at
Sa
ltL
ake
Ba
sin
sN
eva
da
Ba
sin
an
dR
an
ge
Sa
nta
An
aR
ive
rB
asin
So
uth
So
uth
Ce
ntr
al
Ce
ntr
al
Te
xa
sTe
xa
s
So
uth
ern
So
uth
ern
Hig
hH
igh
Pla
ins
Pla
ins
Rio
Rio
Gra
nd
eG
ran
de
Va
lley
Va
lley
Aca
dia
n-
Aca
dia
n-
Po
ntc
ha
rtra
inP
on
tch
art
rain
Mo
bile
Mo
bile
Riv
er
Riv
er
an
da
nd
Trib
uta
rie
sT
rib
uta
rie
s
Oza
rkO
za
rk
Pla
tea
us
Pla
tea
us
Ce
ntr
al
Ce
ntr
al
Arizo
na
Arizo
na
Ba
sin
sB
asin
s
Co
ok
Inle
tB
asin
Oa
hu
Co
ok
Inle
tB
asin
Oa
hu
No
rth
Nort
hP
latte
Pla
tte
Ba
sin
Ba
sin
Ka
nsa
sK
an
sa
sR
ive
rR
ive
rB
asin
Ba
sin
Ce
ntr
al
Ce
ntr
alN
eb
raska
Ne
bra
ska
Ba
sin
sB
asin
s
So
uth
So
uth
Pla
tte
Pla
tte
Ba
sin
Ba
sin
Up
pe
rU
pp
erA
rka
nsa
sA
rka
nsa
sR
ive
rR
ive
rB
asin
Ba
sin
Ke
ntu
cky
Riv
erB
asin
Apa
lach
ico
la-
Apa
lach
ico
la-
Ch
atta
ho
och
ee
-C
ha
tta
ho
och
ee
-F
lint
Flin
tRiv
er
Riv
erB
asin
Ba
sin
Ca
na
dia
n-
Ca
na
dia
n-
Cim
arr
on
Cim
arr
on
Riv
er
Riv
er
Ba
sin
sB
asin
s
So
uth
ern
So
uth
ern
Sa
nte
eS
an
tee
Up
pe
rU
pp
er
Mis
sis
sip
pi
Mis
sis
sip
pi
Riv
er
Riv
er
Ba
sin
Ba
sin
Ea
ste
rnE
aste
rn
Iow
aIo
wa
Ba
sin
sB
asin
s
We
ste
rnW
este
rn
La
ke
La
ke
Mic
hig
an
Mic
hig
an
Dra
ina
ge
Dra
ina
ge
Up
pe
rU
pp
erIllin
ois
Illin
ois
Riv
er
Riv
erB
asin
Ba
sin
Lo
we
rL
ow
erIllin
ois
Illin
ois
Riv
er
Riv
erB
asin
Ba
sin
White
White
Riv
er
Riv
er
Ba
sin
Ba
sin
Gre
at
Gre
ata
nd
an
d
Little
Little
Mia
mi
Mia
mi
Riv
er
Riv
er
Ba
sin
sB
asin
s
La
ke
La
ke
Erie
-E
rie
-
La
ke
La
ke
St.
St.
Cla
irC
lair
Dra
ina
ge
Dra
ina
ge
Alb
em
arle
-A
lbe
ma
rle
-
Pa
mlic
oP
am
lico
Dra
ina
ge
Dra
ina
ge
Ka
na
wh
a-N
ew
Ka
na
wh
a-N
ew
Riv
er
Riv
erB
asin
sB
asin
s
De
lma
rva
De
lma
rva
Pe
nin
su
laP
en
insu
la
Po
tom
ac
Po
tom
ac
Riv
er
Riv
erB
asin
Ba
sin
Co
nn
ecticu
t,H
ou
sa
ton
ic,
Co
nn
ecticu
t,H
ou
sa
ton
ic,
an
da
nd
Th
am
es
Th
am
es
Riv
er
Riv
erB
asin
sB
asin
s
Ne
wE
ng
lan
d
Co
asta
lBa
sin
s
Ne
wN
ew
En
gla
nd
En
gla
nd
Co
asta
lC
oa
sta
lBa
sin
sB
asin
s
Up
pe
rU
pp
er
Te
nn
esse
eTe
nn
esse
e
Riv
er
Riv
er
Ba
sin
Ba
sin
Lo
ng
Lo
ng
Isla
nd
Isla
nd
an
da
nd
Ne
wN
ew
Je
rse
yJe
rse
y
Co
asta
lC
oa
sta
lDra
ina
ge
sD
rain
ag
es
Hu
dso
nH
ud
so
nR
ive
rR
ive
r
Ba
sin
Ba
sin
Alle
gh
en
yA
lleg
he
ny
an
da
nd
Mo
no
ng
ah
ela
Mo
no
ng
ah
ela
Riv
er
Riv
erB
asin
sB
asin
sL
ow
er
Lo
we
r
Su
sq
ue
ha
nn
aS
usq
ue
ha
nn
a
Riv
er
Riv
er
Ba
sin
Ba
sin
Mis
sis
sip
pi
Mis
sis
sip
pi
Em
ba
ym
en
tE
mb
aym
en
t
Sa
nS
an
Jo
aq
uin
-Jo
aq
uin
-
Tu
lare
Tu
lare
Ba
sin
sB
asin
s
Up
pe
rU
pp
er
Co
lora
do
Co
lora
do
Riv
er
Riv
er
Ba
sin
Ba
sin
No
rth
ern
No
rth
ern
Ro
ckie
sR
ockie
s
Inte
rmo
nta
ne
Inte
rmo
nta
ne
Ba
sin
sB
asin
s
Mid
dle
Mid
dle
Ark
an
sa
sA
rka
nsa
s
Riv
er
Riv
erB
asin
Ba
sin
Trinity
Trinity
Riv
er
Riv
er
Ba
sin
Ba
sin
Ge
org
ia-
Ge
org
ia-
Flo
rid
aF
lorid
a
Co
asta
lC
oa
sta
l
Pla
inP
lain
Lo
we
rL
ow
er
Te
nn
esse
eTe
nn
esse
e
Riv
er
Riv
erB
asin
Ba
sin
Riv
er
Riv
erB
asin
Ba
sin
Ba
sin
Ba
sin
an
da
nd
Co
asta
lC
oa
sta
l
Dra
ina
ge
sD
rain
ag
es
Flo
rid
aF
lorid
a
Ch
eye
nn
ea
nd
Be
lleF
ou
rch
eB
elle
Fo
urc
he
Ba
sin
s
Ch
eye
nn
eC
he
ye
nn
ea
nd
an
d
Belle
Belle
Fo
urc
he
Fo
urc
he
Ba
sin
sB
asin
s
De
law
are
Riv
er
Ba
sin
De
law
De
law
are
Riv
are
Riv
er
Ba
sin
er
Ba
sin
0200
400
MIL
ES
0200
400
KIL
OM
ET
ER
S
EX
PL
AN
AT
ION
BE
GA
NIN
FIS
CA
LY
EA
R1991
BE
GA
NIN
FIS
CA
LY
EA
R1994
BE
GA
NIN
FIS
CA
LY
EA
R1997
SC
HE
DU
LE
DT
OB
EG
ININ
FIS
CA
LY
EA
R1999
NO
TS
CH
ED
ULE
DY
ET
HIG
HP
LA
INS
RE
GIO
NA
LG
RO
UN
D-W
AT
ER
ST
UD
Y,
BE
GA
NIN
FIS
CA
LY
EA
R1997
Figu
re 1
.Lo
catio
n of
Nat
iona
l Wat
er-Q
ualit
y As
sess
men
t pro
gram
stu
dy u
nits
and
thei
r pro
pose
d im
plem
enta
tion
date
s.
ACTIVITY
FISCAL
YEAR 1997 1998 1999 2000 2001 2002 2003 2004 2005 2006 2007 2008 2009 2010
Report Writ ing
Init ial Planning and
Analysis of Available Data
Intensive Data Collection
and Interpretation
Low-level Monitoring
Activit ies
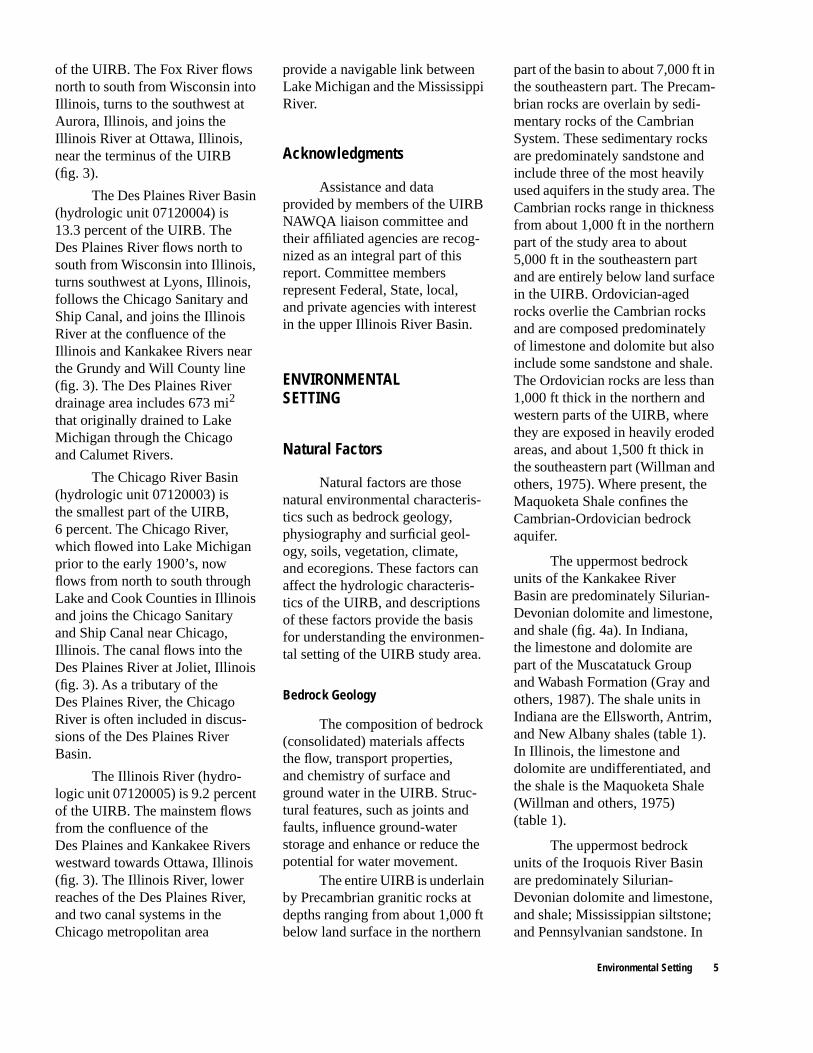
biology studies (Friedel, 1998). Fourteen U.S. Geological Survey reports and several journal articles were published as a result of the pilot study. A bibliography of the USGS reports that were published as part of the UIRB NAWQA pilot study are listed in appendix 1 of this report. The lower Illinois River Basin (LIRB) study unit of the NAWQA program is currently assessing the surface- and ground-water quality and biology for the drainage area of the Illinois River downstream from the UIRB (Warner, 1998).
Purpose and Scope
This report describes the environmental setting of the UIRB study unit and the possible implications of that setting for water quality. The environmental setting comprises the natural and human factors that define the hydrologic characteristics of the basin. Natural factors include bedrock geology, physiography and surficial geology, soils, vegeta-tion, climate, and ecoregions. Human factors include land use, urbanization trends, and population change. Each of the natural and human factors affects the physical,
chemical, and biological character-istics of surface and ground water. The interrelatedness of these factors and characteristics must be considered when determining the implications for water quality in the UIRB. The information contained in this report is a compi-lation of data collected from Federal, State, and local agencies that will facilitate selection of monitoring sites and interpretation of water quality in the basin.
Location and Extent of the Study Area
The upper Illinois River Basin includes parts of 16 counties in northeastern Illinois (62 percent of the basin), 13 counties in north-western Indiana (28 percent of the basin), 7 counties in southeastern Wisconsin (10 percent of the basin), and 1 county in southwest-ern Michigan (less than 0.1 percent of the basin). Because the part of the basin that is in Michigan is small, it will not be specifically discussed in this report. The drain-age area of the UIRB is 10,949 mi2 upstream from Ottawa, Illinois, on the Illinois River and contains the following major subbasins (hydrologic units): Kankakee
River, Iroquois River, Fox River, Des Plaines River, Chicago River, and Illinois River (fig. 3).
The Kankakee River Basin (hydrologic unit 07120001) drains the largest part of the UIRB, 27.6 percent. The Kankakee River flows from Indiana towards Illinois in a general northeast to southwest trend and turns northwestward at the confluence with the Iroquois River about 4.8 miles upstream from Kankakee, Illinois (fig. 3). The Kankakee River joins the Des Plaines River to form the Illinois River near the Grundy and Will County line in Illinois.
The Iroquois River Basin (hydrologic unit 07120002) lies to the south of the Kankakee River Basin and makes up 19.6 percent of the UIRB. The Iroquois River flows from Indiana into Illinois from northeast to southwest, turns northwestward at Watseka, Illinois, and joins the Kankakee River near Kankakee, Illinois (fig. 3). Because the Iroquois River is a tributary to the Kankakee River, it is often included in discus-sions of the Kankakee River Basin.
The upper Fox River Basin (hydrologic unit 07120006) and the lower Fox River Basin (hydrologic unit 07120007) make up the Fox River Basin, which is 24.3 percent
Figure 2. Rotation schedule for activities in the upper Illinois River Basin study unit as part of the National Water-Quality Assessment program, 1997–2010.
Introduction 3

Figure 3. Drainage basins in the upper Illinois River Basin (modified from Seaber and others, 1984).
4 Environmental Setting of the Upper Illinois River Basin and Implications for Water Quality
of the UIRB. The Fox River flows north to south from Wisconsin into Illinois, turns to the southwest at Aurora, Illinois, and joins the Illinois River at Ottawa, Illinois, near the terminus of the UIRB (fig. 3).
The Des Plaines River Basin (hydrologic unit 07120004) is 13.3 percent of the UIRB. The Des Plaines River flows north to south from Wisconsin into Illinois, turns southwest at Lyons, Illinois, follows the Chicago Sanitary and Ship Canal, and joins the Illinois River at the confluence of the Illinois and Kankakee Rivers near the Grundy and Will County line (fig. 3). The Des Plaines River drainage area includes 673 mi2 that originally drained to Lake Michigan through the Chicago and Calumet Rivers.
The Chicago River Basin (hydrologic unit 07120003) is the smallest part of the UIRB, 6 percent. The Chicago River, which flowed into Lake Michigan prior to the early 1900’s, now flows from north to south through Lake and Cook Counties in Illinois and joins the Chicago Sanitary and Ship Canal near Chicago, Illinois. The canal flows into the Des Plaines River at Joliet, Illinois (fig. 3). As a tributary of the Des Plaines River, the Chicago River is often included in discus-sions of the Des Plaines River Basin.
The Illinois River (hydro-logic unit 07120005) is 9.2 percent of the UIRB. The mainstem flows from the confluence of the Des Plaines and Kankakee Rivers westward towards Ottawa, Illinois (fig. 3). The Illinois River, lower reaches of the Des Plaines River, and two canal systems in the Chicago metropolitan area
provide a navigable link between Lake Michigan and the Mississippi River.
Acknowledgments
Assistance and data provided by members of the UIRB NAWQA liaison committee and their affiliated agencies are recog-nized as an integral part of this report. Committee members represent Federal, State, local, and private agencies with interest in the upper Illinois River Basin.
ENVIRONMENTALSETTING
Natural Factors
Natural factors are those natural environmental characteris-tics such as bedrock geology, physiography and surficial geol-ogy, soils, vegetation, climate, and ecoregions. These factors can affect the hydrologic characteris-tics of the UIRB, and descriptions of these factors provide the basis for understanding the environmen-tal setting of the UIRB study area.
Bedrock Geology
The composition of bedrock (consolidated) materials affects the flow, transport properties, and chemistry of surface and ground water in the UIRB. Struc-tural features, such as joints and faults, influence ground-water storage and enhance or reduce the potential for water movement.
The entire UIRB is underlain by Precambrian granitic rocks at depths ranging from about 1,000 ft below land surface in the northern
part of the basin to about 7,000 ft in the southeastern part. The Precam-brian rocks are overlain by sedi-mentary rocks of the Cambrian System. These sedimentary rocks are predominately sandstone and include three of the most heavily used aquifers in the study area. The Cambrian rocks range in thickness from about 1,000 ft in the northern part of the study area to about 5,000 ft in the southeastern part and are entirely below land surface in the UIRB. Ordovician-aged rocks overlie the Cambrian rocks and are composed predominately of limestone and dolomite but also include some sandstone and shale. The Ordovician rocks are less than 1,000 ft thick in the northern and western parts of the UIRB, where they are exposed in heavily eroded areas, and about 1,500 ft thick in the southeastern part (Willman and others, 1975). Where present, the Maquoketa Shale confines the Cambrian-Ordovician bedrock aquifer.
The uppermost bedrock units of the Kankakee River Basin are predominately Silurian-Devonian dolomite and limestone, and shale (fig. 4a). In Indiana, the limestone and dolomite are part of the Muscatatuck Group and Wabash Formation (Gray and others, 1987). The shale units in Indiana are the Ellsworth, Antrim, and New Albany shales (table 1). In Illinois, the limestone and dolomite are undifferentiated, and the shale is the Maquoketa Shale (Willman and others, 1975) (table 1).
The uppermost bedrock units of the Iroquois River Basin are predominately Silurian-Devonian dolomite and limestone, and shale; Mississippian siltstone; and Pennsylvanian sandstone. In
Environmental Setting 5

Figure 4. (A) Generalized uppermost bedrock geology in the upper Illinois River Basin (modified from Willman and others, 1975; Gray and others, 1987; and Wisconsin Geological and Natural History Survey, 1981).
6 Environmental Setting of the Upper Illinois River Basin and Implications for Water Quality

Figure 4. (B) Uppermost bedrock geology in the upper Illinois River Basin (modified from Willman and others, 1975; Gray and others, 1987; and Wisconsin Geological and Natural History Survey, 1981).
Environmental Setting 7

Tabl
e 1.
Upp
erm
ost b
edro
ck s
tratig
raph
y of
the
uppe
r Illi
nois
Riv
er B
asin
[mod
ified
fro
m W
illm
an a
nd o
ther
s, 1
975;
Gra
y an
d ot
hers
, 198
7; a
nd W
isco
nsin
Geo
logi
cal a
nd N
atur
al H
isto
ry S
urve
y, 1
981]
Illin
ois
Indi
ana
Wis
cons
inPe
riod
Geo
logi
c un
itLi
thol
ogy
Geo
logi
c un
itLi
thol
ogy
Geo
logi
c un
itLi
thol
ogy
Penn
sylv
ania
nC
arbo
ndal
eFo
rmat
ion
Gre
y sh
ale,
sub
gray
wac
kes
sand
ston
e, g
rey
argi
lla-
ceou
s lim
esto
ne,
and
coal
Not
pre
sent
as
uppe
rmos
t bed
rock
Not
pre
sent
as
uppe
rmos
t bed
rock
Penn
sylv
ania
nM
odes
toFo
rmat
ion
Gre
y sh
ale,
thin
arg
illac
eous
limes
tone
, and
thin
coa
l be
dsN
ot p
rese
nt a
s up
perm
ost b
edro
ckN
ot p
rese
nt a
s up
perm
ost b
edro
ck
Penn
sylv
ania
nN
ot p
rese
nt a
s up
perm
ost b
edro
ckR
acco
on C
reek
Gro
upM
ostly
sha
le a
nd s
ands
tone
;th
in b
eds
of li
mes
tone
, cla
y,
and
coal
Not
pre
sent
as
uppe
rmos
t bed
rock
Penn
sylv
ania
nSp
oon
Form
atio
nW
ell d
evel
oped
san
dsto
ne,
coal
, and
lim
esto
neN
ot p
rese
nt a
s up
perm
ost b
edro
ckN
ot p
rese
nt a
s up
perm
ost b
edro
ck
Mis
siss
ippi
anN
ot p
rese
nt in
stu
dy a
rea
Ells
wor
th S
hale
Gre
en s
hale
; som
e bl
ack
shal
ein
low
er p
art
Not
pre
sent
as
uppe
rmos
t bed
rock
Mis
siss
ippi
anV
alm
eyer
anSe
ries
Silts
tone
and
lim
esto
neB
orde
n G
roup
Silts
tone
with
lens
es o
f lim
esto
nein
low
er p
art
Not
pre
sent
as
uppe
rmos
t bed
rock
Mis
siss
ippi
anK
inde
rhoo
kian
Seri
esSh
ale
with
thin
lim
esto
neN
ot p
rese
nt a
s up
perm
ost b
edro
ckN
ot p
rese
nt a
s up
perm
ost b
edro
ck
Dev
onia
nU
pper
Bla
ck a
nd g
rey
shal
e of
the
New
Alb
any
Shal
eN
ew A
lban
y Sh
ale
Bla
ck a
nd g
reen
ish-
grey
sha
leN
ot p
rese
nt a
s up
perm
ost b
edro
ck
Dev
onia
nM
iddl
eL
imes
tone
Mus
cata
tuck
Gro
upL
imes
tone
and
dol
omite
Not
pre
sent
as
uppe
rmos
t bed
rock
Dev
onia
nN
ot p
rese
nt a
s up
perm
ost b
edro
ckA
ntri
m S
hale
Bla
ck s
hale
, gre
y sh
ale
and
limes
tone
in lo
wer
par
tN
ot p
rese
nt a
s up
perm
ost b
edro
ck
Silu
rian
Not
pre
sent
as
uppe
rmos
t bed
rock
Lou
isvi
lle L
imes
tone
Lim
esto
neN
ot p
rese
nt a
s up
perm
ost b
edro
ckSi
luri
anU
ndif
fere
ntia
ted
Lim
esto
ne a
nd d
olom
iteW
abas
h Fo
rmat
ion
Lim
esto
ne, d
olom
ite, a
ndar
gilla
ceou
s do
lom
iteU
ndif
fere
ntia
ted
Dol
omite
Ord
ovic
ian
Anc
ell G
roup
Sand
ston
e, a
rgill
aceo
us a
ndsa
ndy
limes
tone
, and
do
lom
ite. S
t. Pe
ter
Sand
ston
e an
d G
lenw
ood
form
atio
n
Not
pre
sent
as
uppe
rmos
t bed
rock
Not
pre
sent
as
uppe
rmos
t bed
rock
Ord
ovic
ian
Gal
ena-
Plat
tevi
lle
Gro
up
Lim
esto
ne a
nd d
olom
iteN
ot p
rese
nt a
s up
perm
ost b
edro
ckN
ot p
rese
nt a
s up
perm
ost b
edro
ck
Ord
ovic
ian
Maq
uoke
ta S
hale
Gro
upSh
ale
and
limes
tone
Maq
uoke
ta G
roup
Not
pre
sent
as
uppe
rmos
t be
droc
kM
aquo
keta
For
mat
ion
Shal
e an
d do
lom
ite
Ord
ovic
ian
Prai
rie
du C
hien
Gro
upC
hert
y do
lom
ite w
ithin
terb
edde
d sa
ndst
one
Not
pre
sent
as
uppe
rmos
t bed
rock
Prai
rie
du C
hien
Gro
upD
olom
ite w
ithso
me
sand
ston
ean
d sh
ale
Ord
ovic
ian
Not
pre
sent
as
uppe
rmos
t bed
rock
Not
pre
sent
as
uppe
rmos
t bed
rock
Sinn
ipee
Gro
upD
olom
ite w
ithso
me
limes
tone
and
shal
eC
ambr
ian
Und
iffe
rent
iate
dSa
ndst
one
and
dolo
mite
Not
pre
sent
as
uppe
rmos
t bed
rock
Not
pre
sent
as
uppe
rmos
t bed
rock
8 Environmental Setting of the Upper Illinois River Basin and Implications for Water Quality

Indiana, the limestone and dolo-mite compose the Muscatatuck Group, Wabash Formation, and Louisville Limestone; the shale is the New Albany shale; the silt-stone is part of the Borden Group; and the sandstone is part of the Raccoon Creek Group (Gray and others, 1987). In Illinois, the lime-stone and dolomite is undifferenti-ated, the shale is part of the Upper Devonian and the Mississippian Kinderhookian Series, the siltstone is part of the Valmeyeran Series, and the sandstone is the Spoon Formation (fig. 4; table 1). The Kentland Dome, a small structural feature (approximately 5 mi2), is in southern Newton County, Indiana (fig. 4b). This feature is represented by dipping Ordovician and Silurian rocks that have been uplifted approximately 2,000 ft (Fenelon and others, 1994).
The uppermost bedrock units of the upper Fox River Basin are predominately undifferentiated Silurian-Devonian dolomite and limestone, and Ordovician shale of the Maquoketa Shale Group in Illinois; and the Maquoketa Forma-tion and Sinnipee Groups in Wisconsin (fig. 4; table 1). The uppermost bedrock units of the lower Fox River Basin are predom-inately undifferentiated Silurian-Devonian dolomite and limestone, Ordovician limestone of the Galena-Platteville Group, Ordovi-cian dolomite of the Prairie du Chien Group, Ordovician shale of the Maquoketa Shale Group, and Cambrian-Ordovician sandstone. The Prairie du Chien Group is exposed along the Fox River Valley (Willman and others, 1975) (fig. 4). The Sandwich Fault is evident in southern De Kalb County in Illinois where Cambrian
rocks are adjacent to Ordovician rocks (fig. 4b).
The uppermost bedrock units of the Chicago and Des Plaines River Basins are predominately undifferentiated Silurian-Devonian dolomite and limestone, and Ordovician shale of the Maquoketa Shale Group (fig. 4). The Des Plaines Distur-bance fault, unexposed at the surface, is in northern Cook County, Illinois, near the Des Plaines and Chicago River Basin drainage divide (fig. 4b). The origin of the fault has been explained as being from either volcanic activity or from meteoric impact (Willman and others, 1975).
The uppermost bedrock units of the Illinois River Basin are predominately Pennsylvanian shale of the Carbondale Formation, Ordovician shale of the Maquoketa Shale Group, and Ordovician lime-stone and dolomite of the Galena-Platteville Formation (fig. 4) (Willman and others, 1975). The Carbondale Formation contains coal seams and is a source for mining in the UIRB (fig. 5).
Physiography and Surficial Geology
Studying the physiography provides a generalized description of the natural characteristics of an area by aggregating areas that were formed under similar conditions and have similar surficial geology. A description of these factors is an important part of the environmen-tal setting because the composition and origin of surficial deposits affect soil composition and water chemistry. When water flows through the interstitial spaces of surficial deposits, its chemical composition and/or the minerals in the surficial deposits can be
changed by processes like ion exchange. The surficial sand, and sand and gravel deposits form the important unconsolidated aquifers in the basin. Surficial geologic materials are broken down by weathering processes and form the parent material for most soils in the UIRB. Most of the unconsolidated surficial deposits in the basin are of glacial, fluvial, or aeolian origin.
Surficial geologic materials were deposited and land-surface features were formed in the UIRB during five major glacial periods. With each glacial advance and retreat, succeeding glaciers modi-fied the deposits left during previ-ous periods. The most recent period of glaciation, called the Wisconsinan period, occurred about 17,000–12,000 years ago (Willman and Frye, 1970; Gilbert, 1980). The Lake Michigan, Sagi-naw, and Huron-Erie glacial lobes once covered the UIRB (fig. 6). Typical glacial features such as till and outwash plains, moraines, kettles, kames, and drumlins are found in various parts of the basin, but moraines are the most preva-lent glacial feature (fig. 7). Bed-rock has been exposed in places along the Illinois, Des Plaines, and Kankakee River valleys by glacial processes such as meltwater floods (Illinois State Geological Survey, 1973). Except for these bedrock exposures in major river valleys, unconsolidated glacial (Quaternary) deposits cover most of the study area (fig. 8).
In recent times, glacial deposits and features have been modified by wind and water erosion (Piskin and Bergstrom, 1975). The glacial and erosional processes are the sources of the present-day landforms in the UIRB; these landforms are the
Environmental Setting 9

basis for the following physio-graphic definitions. Overall, topog-raphy in the UIRB varies from 443 ft above sea level in the Chicago River Basin and the west-ern parts of the Kankakee River Basin to 1,250 ft above sea level in the northern extremes of the upper Fox River Basin (fig. 9).
The UIRB lies in the Central Lowlands physiographic province and is divided into two physio-graphic sections: the Great Lake
10 Environmental Setting of the Upper Illinois
Section and the Till Plains Section (Fenneman, 1938). Leighton and others (1948) divided the Illinois part of these sections into two subsections each. In the Illinois part of the UIRB, the Great Lake Section was divided into the Chicago Lake Plain and the Wheaton Morainal Plain, whereas the Till Plains Section was divided into the Kankakee Till Plain and the Bloomington Ridged Plain. For the Indiana part of the UIRB,
River Basin and Implications for Water Quality
Schneider (1966) subdivided the Great Lake and the Till Plains physiographic sections into the Northern Moraine and Lake Region and the Tipton Till Plain. In the area of the UIRB, the Northern Moraine and Lake Region subsection was further divided into the Valparaiso Morainal Area, the Kankakee Outwash and Lacustrine Plain, and the Steuben Morainal Lake Area (Schneider, 1966).
Figure 5. Coal seams mined in the upper Illinois River Basin (from Illinois State Geological Survey, 1991).
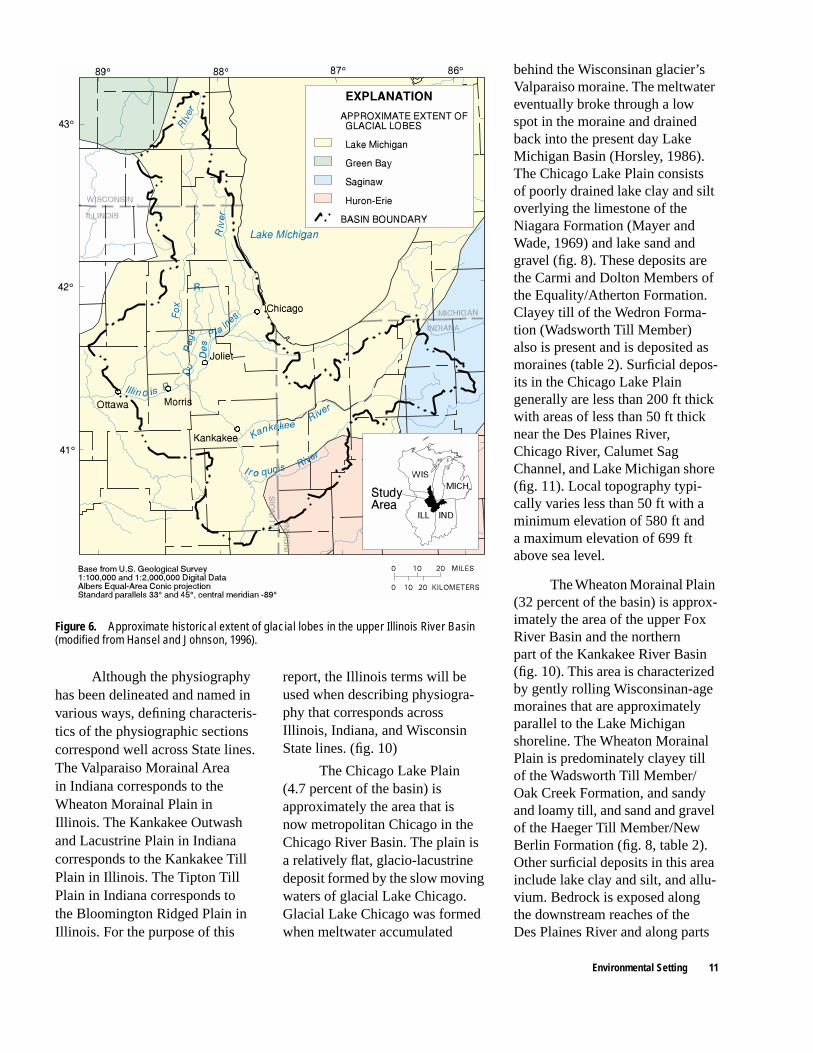
Figure 6. Approximate historical extent of glacial lobes in the upper Illinois River Basin (modified from Hansel and Johnson, 1996).
Although the physiography has been delineated and named in various ways, defining characteris-tics of the physiographic sections correspond well across State lines. The Valparaiso Morainal Area in Indiana corresponds to the Wheaton Morainal Plain in Illinois. The Kankakee Outwash and Lacustrine Plain in Indiana corresponds to the Kankakee Till Plain in Illinois. The Tipton Till Plain in Indiana corresponds to the Bloomington Ridged Plain in Illinois. For the purpose of this
report, the Illinois terms will be used when describing physiogra-phy that corresponds across Illinois, Indiana, and Wisconsin State lines. (fig. 10)
The Chicago Lake Plain (4.7 percent of the basin) is approximately the area that is now metropolitan Chicago in the Chicago River Basin. The plain is a relatively flat, glacio-lacustrine deposit formed by the slow moving waters of glacial Lake Chicago. Glacial Lake Chicago was formed when meltwater accumulated
behind the Wisconsinan glacier’s Valparaiso moraine. The meltwater eventually broke through a low spot in the moraine and drained back into the present day Lake Michigan Basin (Horsley, 1986). The Chicago Lake Plain consists of poorly drained lake clay and silt overlying the limestone of the Niagara Formation (Mayer and Wade, 1969) and lake sand and gravel (fig. 8). These deposits are the Carmi and Dolton Members of the Equality/Atherton Formation. Clayey till of the Wedron Forma-tion (Wadsworth Till Member) also is present and is deposited as moraines (table 2). Surficial depos-its in the Chicago Lake Plain generally are less than 200 ft thick with areas of less than 50 ft thick near the Des Plaines River, Chicago River, Calumet Sag Channel, and Lake Michigan shore (fig. 11). Local topography typi-cally varies less than 50 ft with a minimum elevation of 580 ft and a maximum elevation of 699 ft above sea level.
The Wheaton Morainal Plain (32 percent of the basin) is approx-imately the area of the upper Fox River Basin and the northern part of the Kankakee River Basin (fig. 10). This area is characterized by gently rolling Wisconsinan-age moraines that are approximately parallel to the Lake Michigan shoreline. The Wheaton Morainal Plain is predominately clayey till of the Wadsworth Till Member/Oak Creek Formation, and sandy and loamy till, and sand and gravel of the Haeger Till Member/New Berlin Formation (fig. 8, table 2). Other surficial deposits in this area include lake clay and silt, and allu-vium. Bedrock is exposed along the downstream reaches of the Des Plaines River and along parts
Environmental Setting 11

Figure 7. Prominent glacial moraines in the upper Illinois River Basin (modified from Sugden and John, 1976).
of the Fox River. Surficial deposits in the Wheaton Morainal Plain are generally between 50 and 200 ft thick; however, deposits in some northern areas of the UIRB are less than 50 ft thick, and deposits in many southern areas are greater than 200 ft thick (fig. 11). Relief generally is less than 100 ft with a minimum elevation of 505 ft and a maximum elevation of 1,188 ft above sea level (fig. 9). As the Wisconsinan glacier retreated through the upper Fox River Basin,
12 Environmental Setting of the Upper Illinois
many lakes (kames) and some swamps were formed by isolated buried ice blocks melting in depressions made by the glacier (Mades, 1987).
The Kankakee Till Plain (37 percent of the basin) is approx-imately the area covered by the western three-quarters of the Kankakee River Basin, the Illinois River Basin, and the western part of the Iroquois River Basin (fig. 10). The Kankakee Till Plain is an outwash plain formed by the
River Basin and Implications for Water Quality
variable gradient, variable volume, and variable velocity of glacial floods (Mickelson and others, 1984). Surficial deposits are predominately outwash sand and gravel of the Henry/Atherton Formation (Mackinaw and Batavia Members in Illinois, undifferenti-ated in Indiana) (fig. 8, table 2) but also include alluvium and fill materials. Bedrock is exposed along the downstream reaches of the Kankakee River. Surficial deposits generally are less than 200 ft thick; however, some depos-its in the Kankakee River lowland are less than 50 ft thick, and some deposits in the upland are greater than 200 ft thick (fig. 11). Local changes in elevation generally are less than 100 ft with a minimum elevation of 482 ft and a maximum elevation of 899 ft above sea level (fig. 9).
The Bloomington Ridged Plain (22 percent of the basin) is approximately the area of the lower Fox River Basin and the southern part of the Iroquois River Basin (fig. 10). Surficial deposits in this area are mostly loamy till (Malden Till Member) and clayey till (Yorkville Till Member) of the Wedron Formation (fig. 8, table 2) deposited as moraines by the Lake Michigan glacial lobe (fig. 6). The lower Fox River Basin has well developed rolling moraines, whereas the southern part of the Iroquois River Basin has lower and more gently rolling moraines. In the Iroquois River Basin, the Bloomington Ridged Plain is mostly loamy till (unnamed in Illinois; Trafalgar Formation in Indiana), and lake clay and silt (Carmi Member of the Equality Formation) deposited by the Huron-Erie glacial lobe (fig. 6). Surficial deposits generally are less
Figure 8. Quaternary deposits in the upper Illinois River Basin (modified from Lineback and others, 1983) (Quaternary Geologic Map of the Chicago 4°x6° Quadrangle, United States).
Environmental Setting 13

Figure 9. Surface topography of the upper Illinois River Basin (modified from U.S. Geological Survey [undated]).
14 Environmental Setting of the Upper Illinois River Basin and Implications for Water Quality

Figure 10. Physiography of the upper Illinois River Basin (modified from Fenneman, 1938; Leighton and others, 1948; and Schneider, 1966).
Environmental Setting 15

Tabl
e 2.
Uppe
rmos
t Qua
tern
ary
stra
tigra
phy
of th
e up
per I
llino
is R
iver
Bas
in[m
odifi
ed f
rom
Will
man
and
oth
ers,
197
5; G
ray,
198
9; L
ineb
ack
and
othe
rs, 1
983;
and
Mic
kles
on a
nd o
ther
s, 1
984]
Illin
ois
Indi
ana
Wis
cons
inFo
rmat
ion
Mem
ber
Lith
olog
yFo
rmat
ion
Lith
olog
yFo
rmat
ion
Lith
olog
yH
enry
Bat
avia
Out
was
h pl
ains
: san
d, g
rave
l,an
d si
lt.A
ther
ton
Out
was
h fa
cies
: gra
vel a
nd s
and
ofgl
acia
l out
was
h de
posi
ts.
Pres
ent,
but u
nnam
ed
Hen
ryM
acki
naw
Val
ley
trai
ns: s
and,
peb
bly
san
d, a
nd g
rave
l; w
ell-
sort
ed.
Ath
erto
nO
utw
ash
faci
es: g
rave
l and
san
d of
glac
ial o
utw
ash
depo
sits
.Pr
esen
t, bu
t unn
amed
Hen
ryW
asco
Ice
cont
act d
epos
its: s
and
and
grav
elin
kam
es, e
sker
s, a
nd d
elta
s.N
o in
form
atio
nN
o in
form
atio
n
Equ
ality
Car
mi
Cla
y, s
ilt, a
nd s
ome
sand
.A
ther
ton
Lac
ustr
ine
faci
es: s
ilt, s
and,
and
clay
of
glac
ial l
ake
sedi
men
ts.
Pres
ent,
but u
nnam
ed
Equ
ality
Dol
ton
Mos
tly s
and
with
bed
s of
silt
and
grav
el d
epos
ited
as b
each
es a
ndsa
nd b
ars.
Bes
t dev
elop
ed in
C
ook
Cou
nty.
Ath
erto
nL
acus
trin
e fa
cies
: silt
, san
d, a
ndcl
ay o
f gl
acia
l lak
e se
dim
ents
.N
ot p
rese
nt a
s up
perm
ost d
epos
it
Wed
ron
Tis
kilw
a T
illPi
nkis
h-ta
n sa
nd, m
ost e
xten
sive
mem
ber
of W
edro
n Fo
rmat
ion.
No
info
rmat
ion
Tis
kilw
aPi
nk, m
ediu
m te
xtur
ed ti
ll of
sand
, silt
, and
cla
y.W
edro
nM
alde
n T
illSi
lty, s
andy
, loa
my
yello
w-g
ray
till
with
lens
es o
f gr
avel
and
san
d.N
o in
form
atio
nN
o in
form
atio
n
Wed
ron
Yor
kvill
e T
illC
laye
y, d
ark
gree
nish
-gre
ytil
l with
sm
all d
olom
ite p
ebbl
es.
Tra
falg
arD
ark
grey
loam
with
are
as o
fca
lcar
eous
till
and
lens
esof
silt
, san
d, a
nd g
rave
l.
New
Ber
linL
ower
uni
t is
prog
laci
alou
twas
h sa
nd a
nd g
rave
l.U
pper
uni
t is
grav
elly
san
dylo
amy
till.
Wed
ron
Hae
ger
Till
Cal
care
ous,
gra
velly
, silt
y til
l.N
ot p
rese
nt a
s up
perm
ost d
epos
itN
ew B
erlin
Low
er u
nit i
s pr
ogla
cial
outw
ash
sand
and
gra
vel.
Upp
er u
nit i
s gr
avel
ly s
andy
loam
y til
l.W
edro
nW
adsw
orth
Till
Cla
yey
grey
tills
dep
osite
d as
mor
aine
s.Pr
esen
t, bu
t uni
dent
ified
on
sour
ce m
aps
Oak
Cre
ekC
alca
reou
s fi
ne-g
rain
ed ti
ll an
dla
cust
rine
cla
y, s
ilt, a
nd s
and
depo
site
d as
mor
aine
s.G
rays
lake
Pea
tPe
at, s
andy
and
silt
y pe
at,
muc
k an
d cl
ay.
Pres
ent,
but u
nnam
edN
ot p
rese
nt a
s up
perm
ost d
epos
it
Cah
okia
Allu
vium
Silt,
cla
y, a
nd s
ilty
sand
with
lens
es o
f sa
nd a
nd g
rave
l.M
artin
svill
eA
lluvi
al f
acie
s: m
ud, s
ilt, s
and,
and
grav
el o
f pr
esen
t-da
y st
ream
s.
Not
pre
sent
as
uppe
rmos
t dep
osit
Park
land
San
dW
indb
low
n sa
nd in
dun
es a
ndsh
eet-
like
depo
sits
.A
ther
ton
Dun
e fa
cies
: dun
e sa
nd d
epos
ited
onth
e su
rfac
e of
out
was
h se
dim
ents
.N
ot p
rese
nt a
s up
perm
ost d
epos
it
16 Environmental Setting of the Upper Illinois River Basin and Implications for Water Quality
Figure 11. Thickness of Quaternary deposits in the upper Illinois River Basin (from Soller, 1998).
Environmental Setting 17

than 200 ft thick; however, there are areas in both basins that are more than 400 feet thick (fig. 11). Topography in upland areas of the Bloomington Ridged Plain is flat or gently rolling. Lowland areas, such as along the Fox and Illinois Rivers, are very hilly and rugged with local relief as great as 300 ft where the rivers are deeply incised and bedrock is exposed (Piskin and Bergstrom, 1975). Topography generally varies less than 300 ft with a minimum elevation of 472 ft and a maximum elevation of 981 ft above sea level (fig. 9).
The Steuben Morainal Lake Area (4.3 percent of the basin) is the eastern-most part of the Kanka-kee River Basin (fig. 10). This area is characterized by hilly knob and kettle glacial terrain. Knobs are formed when a melting glacier deposits hills of sand and gravel into a depression left by the ice. Kettles are formed when ice blocks from a glacier melt in depressions left by the ice. The kettles form the basins for many kames and peat bogs in the area. Surficial deposits are predominately loamy till of the Trafalgar Formation deposited by the Saginaw glacial lobe (fig. 6) and generally are greater than 200 ft thick (fig. 11). Topography generally is less than 100 ft with a minimum elevation of 721 ft and a maximum elevation of 899 ft above sea level (fig. 9) (Schneider, 1966).
Soils
The texture and composition of soil affects the chemistry and infiltration rate of water. Soil texture and composition predomi-nately is determined by climate, parent material, and vegetation. Temperature and precipitation determine the rate of chemical
18 Environmental Setting of the Upper Illinois
weathering and the development of soil materials. The more humid the climate, the faster soils can develop. During the Wisconsinan period, when most of the soils in the UIRB formed, the climate was more humid and warmer than at present (Fehrenbacher and others, 1984).
In the UIRB, parent materi-als of soil are generally the under-lying surficial deposits in which the soils are developed. The parent materials can be identified from the map showing Quaternary deposits (fig. 8). Some of the soil along the major river valleys, such as the Illinois River valley, is from decomposition of exposed bedrock (Fehrenbacher and others, 1984), but most of the soil in the UIRB is derived from the glacial surficial deposits discussed earlier in this report.
In addition to glacial materi-als, alluvium is a prime parent material for younger soils (enti-sols) around stream banks and flood plains in the UIRB (fig. 12). Entisols generally are light colored and sandy (Fehrenbacher and others, 1984); have poor horizon definition (Muller and Oberlander, 1984); and, on a relative scale, are moderately to highly permeable (fig. 13). Entisols are common in the Kankakee and Illinois River Basins and cover 5 percent of the UIRB.
Soil development also is affected by vegetation because of the organic matter it contributes to the soil. Soils formed under grasslands tend to be dark and high in organic content (mollisols); in contrast, soils formed under forested land tend to be light colored and low in organic content (alfisols) (Fehrenbacher and others, 1984). Mollisols generally
River Basin and Implications for Water Quality
contain greater than 1 percent organic matter in their surficial horizon, whereas alfisols generally contain less than 1 percent organic matter. Mollisols cover 59 percent of the UIRB and dominate the Iroquois, Illinois, Chicago, and lower Fox River Basins (fig. 12). Relative soil permeability of mollisols in the UIRB is low to very low (fig. 13). Alfisols cover 33 percent of the UIRB and are common around dry morainal areas and in gently rolling, well drained areas of the Kankakee, Des Plaines, and upper Fox River Basins (fig 12.). Rela-tive soil permeability of alfisols is low to moderate (fig 13).
Histosols, soils from mostly organic parent materials, cover 2 percent of the UIRB and are scattered throughout the Fox, Kankakee, and Iroquois River Basins (fig. 12). Generally, histo-sols have greater than 20 percent organic content in their surficial horizon and are found in low lying areas that remain wet most of the time (Fehrenbacher and others, 1984). In the UIRB, histosols have relatively very low permeability (fig. 13).
Inceptisols are soils with poorly developed soil horizons. These soils cover approximately 1 percent of the UIRB and are found in the Fox and Des Plaines River Basins (fig. 12). On a relative scale, inceptisols are moderately permeable (fig. 13).
Vegetation
Vegetation is an important part of soil formation and the water cycle. The type and quantity of plant material contributes to the organic content of the soil and the activity of root growth affects breakdown of soil components.

Figure 12. Soil order of the uppermost horizon in the upper Illinois River Basin (from U.S. Department of Agriculture, 1994).
Environmental Setting 19
Figure 13. Soil permeability in the upper Illinois River Basin (modified from U.S. Department of Agriculture, 1994).
20 Environmental Setting of the Upper Illinois River Basin and Implications for Water Quality
In addition, vegetation intercepts precipitation and also draws moisture from the soil that could otherwise infiltrate to ground water.
The central part of the UIRB lies in the eastern lobe of the grassland region of central North America and the eastern and northern parts lie in the decid-uous forest regions. Prior to Euro-pean settlement of the area, the UIRB vegetation communities included prairies, savannas, wood-lands, and wetlands. Today, only fragments of the presettlement vegetation remain; the dominant modern vegetation is agricultural.
Plant communities that would exist if humans were not present in the basin and a climax plant community were allowed to develop naturally are called potential-natural vegetation. Küchler (1964) classified these potential plant communities on the basis of the one to three (usually two) dominant plant genera present in an area. On a national scale, six potential-natural vegetation types in the UIRB are defined by Küchler (1964): oak-hickory forest, beech-maple forest, maple-basswood for-est, oak savanna, bluestem prairie, and mixed bluestem prairie and oak-hickory forest (fig. 14).
Prior to European settle-ment, the potential-natural vegetation of the central part of the UIRB was mostly a mixture of tallgrass bluestem prairie and oak-hickory forest. In the western part of the basin, tallgrass prairie typi-cally grew as broad expanses on the flat uplands and forests grew on protected slopes, in ravines, and in river valleys. The prairie ecosystem was formed and main-tained by a harsh climate, grazing by free-ranging-large animals, and
periodic fires. Tallgrass prairie plants typically have extensive deep root systems that build soil fertility. During the midnineteenth century, natural prairie land was converted to agricultural land when the metal plow was introduced and settlers discovered that prairie soils were more productive than forest soils (Illinois Department of Energy and Natural Resources, 1994). As a result, only small fragments of prairie remain in the UIRB.
A national prairie restoration effort is ongoing at the Midewin National Tallgrass Prairie in Will County, Illinois. This 24-mi2 area was established in 1996 on the grounds of the former Joliet Army Ammunition Plant (1940–96) near the confluence of the Des Plaines and Kankakee Rivers. This prairie is the Nation’s first Federally designated tallgrass prairie and, in conjunction with nearby natural areas, forms the 62-mi2 Prairie Parklands Macro-site, which is a mix of public, private, and corporate lands managed to protect diversity (Midewin National Tallgrass Prairie, 1998).
Further east, in the upper reaches of the Kankakee River Basin, prairie vegetation characteristically decreased and was replaced by oak-hickory and beech-maple forest vegetation. In the upper Fox and Des Plaines River Basins, the tallgrass prairie graded northward into oak savanna and eventually into a maple-basswood forest. Oak savanna is tallgrass prairie with deciduous trees, characteristically Bur oak (Quercus macrocarpa), scattered singly or in groves (Küchler, 1964). Similarly, Finley (1976) depicted the original
vegetation of the Wisconsin part of the UIRB as a mosaic of oak forest, oak savanna, prairie, maple-basswood-oak forest, and herba-ceous and shrub wetlands.
Climate
The climate of the UIRB is classified as humid continental because of the cool, dry winters and warm, humid summers. Both seasons are usually dominated by cool, dry air from Canada (conti-nental polar); warm, moist air from the Gulf of Mexico (maritime trop-ical); and occasionally warm, dry air from the Pacific Ocean (mari-time polar). The combinations of cool, dry and warm, moist air are the sources of most precipitation in the basin. However, any combina-tion of these three air masses can be over the basin at any time. Large daily fluctuations in temperature and precipitation can result from this combination (Muller and Oberlander, 1984).
The average annual tempera-ture for the UIRB (1961–90) ranged from 46° F in the north of the basin to 51° F in the south of the basin. The coolest temperatures occurred during the winter months of December, January, and Febru-ary; the minimum average monthly temperature occurred in January. During the period of record through 1995, minimum average January temperatures ranged from less than 4° F in the northwestern Wisconsin part of the basin to more than 11° F in the northeastern Indiana and southern Illinois parts of the basin. The average basin-wide January temperature ranged from 18° F to 25° F during the same period (National Oceanic and Atmospheric Administration, 1995).
Environmental Setting 21

2
Figure 14. Potential-natural vegetation in the upper Illinois River Basin (modified from Küchler, 1964).
2 Environmental Setting of the Upper Illinois River Basin and Implications for Water Quality

The warmest temperatures in the UIRB (1961–90) occurred during the months of June, July, and August; the maximum average monthly temperature occurred in July. Maximum average July temperatures during the period of record through 1995 ranged from less than 77° F in the northern parts of the basin to greater than 82° F in the southern part of the basin. The average basinwide July temperature ranged from 72° F to 75° F during the same period (National Oceanic and Atmo-spheric Administration, 1995). Lake Michigan has a moderating effect on temperature near the shoreline because the water in Lake Michigan heats up and cools down more slowly than the sur-rounding land.
Average annual precipita-tion, including the liquid equiva-lent of snowfall, for the period 1961–90 ranged from less than 32 in. in the northern Wisconsin part of the basin to more than 38 in. near the southern and eastern Lake Michigan shoreline in the Indiana part of the basin (fig. 15). During the same period, the minimum mean monthly precipitation occurred in February (1.54 in.), and the maximum mean monthly precipitation occurred in June (3.61 in.) (National Oceanic and Atmospheric Administration, 1995). About 50 percent of the average annual precipitation, approximately 16–18 in., generally occurs during the growing season from May through mid-October.
On average, for the period of record through 1995, annual snow-fall (including snow, ice, sleet, and hail) varied from less than 30 in/yr in the southwestern part of the basin in Illinois to greater than 65 in/yr east of Lake Michigan in
the extreme northeastern part of the basin in Indiana. West of Lake Michigan, in Wisconsin, average annual snowfall for the same period was less than 50 in/yr. Lake Michigan produces seasonal effects on precipitation in the basin for areas near the shoreline (Changnon, 1968).
Evapotranspiration (mois-ture released from plants) returns an estimated 70 percent of the average annual precipitation to the atmosphere. Based on this percent-age, average annual evapotranspi-ration ranges from about 22 in. in the northern part of the UIRB to about 27 in. in the eastern part. Approximately 75 percent of the average annual evapotranspiration usually occurs during the growing season (U.S. Geological Survey, 1970). Evapotranspiration normally exceeds precipitation during the growing season and, thereby, depletes available soil moisture. During the nongrowing season, precipitation generally exceeds evapotranspiration and, thereby, replenishes soil moisture and recharges ground-water sources.
Ecoregions
Ecoregions are areas of rela-tively homogeneous ecological systems or relations between organisms and their environments (Omernik, 1987). Ecoregion classi-fication builds on single-purpose geographical classifications (such as physiography, climate, or soils) to create a framework for under-standing regional patterns and managing aquatic and terrestrial resources. Classification of ecore-gions can assist environmental planners and decision makers in addressing environmental prob-lems on a regional scale. Based on
this regionalization, chemical or biological standards within a region can be established in order to evaluate environmental condi-tions.
Omernik’s (1987) ecoregion classification, which divided the conterminous United States into 76 level-3 ecoregions, is used by the NAWQA program to evaluate regional water-quality patterns. Omernik primarily used maps of land use, potential-natural vegetation, surficial geology, physiography, and climate to develop his classification, which resulted in areas that were rela-tively homogenous in their charac-teristics. Omernik and Gallant (1988) defined the “most typical” areas of each level-3 ecoregion for the upper Midwest States. A most typical area of an ecoregion has all characteristics that typify the level-3 ecoregion.
Over 80 percent of the UIRB is classified as the Central Corn Belt Plains ecoregion. Aside from the Chicago metropolitan area, land use in the Central Corn Belt Plains is mostly corn and soybean cultivation for livestock feed crops and some livestock production. The soils are typically mollisols. Historically, vegetation in the Central Corn Belt Plains was a mosaic of bluestem prairie and oak-hickory forest. The prairie typically covered the flat uplands, and the forest typically occupied stream valleys and moraines. High stream turbidity and sedimentation are a problem in the streams of this ecoregion (Omernik and Gallant, 1988).
Parts of the upper Fox and upper reaches of the Des Plaines River Basins, about 10.5 percent of the UIRB, are classified in the Southeastern Wisconsin Till
Environmental Setting 23

Figure 15. Average annual precipitation for the period 1961–90 in the upper Illinois River Basin (modified from National Oceanic and Atmospheric Administration, 1995).
24 Environmental Setting of the Upper Illinois River Basin and Implications for Water Quality

Plains ecoregion. In contrast to the feed-grain cultivation in the Central Corn Belt Plains, dairy and livestock production are the predominant land use in this ecoregion. Other land uses include cultivation for livestock-feed grain, canning, and truck crops; pasture; and woodlots. Watersheds gener-ally are smaller in the Southeastern Wisconsin Till Plains than in the Central Corn Belt Plains, typically covering from about 386 to 956 mi2. Approximately 25–30 percent of the streams are intermittent in this ecoregion. The Wisconsin Till Plains ecoregion lies within the Wheaton Morainal Plain physiographic subsection (fig. 10). The soils are typically alfisols and mollisols. The histori-cal vegetation in the Southeastern Wisconsin Till Plains was a mixture of tallgrass prairie to the south, oak savanna to the west, and hardwood forest to the north (Omernik and Gallant, 1988).
The upper reaches of the Kankakee River Basin, 8.5 percent of the UIRB, are classified as less typical areas of the Southern Michigan/Northern Indiana Till Plains ecoregion. This is a transi-tional region between the hillier regions in northern Michigan and the flatter central and eastern corn belt plains to the south and over-laps the Steuben Morainal Lake Area physiographic subsection (fig. 10). Crop and livestock production are the most extensive land use in the UIRB part of this ecoregion, and gravel quarries are common. Streams tend to be slug-gish, often bordered with swampy tracts. Stream channelization is widespread (Omernik and Gallant, 1988).
Human Factors
Human factors that affect the hydrologic characteristics of the UIRB include land use, urbaniza-tion, and population change. These human factors have had an appre-ciable effect on the basin because people reshape the landscape to fit their needs. One of the earliest human activities was the develop-ment of transportation corridors. These corridors opened a passage-way between the Great Lakes and the Mississippi River, first by using natural waterways and manmade canal systems and later by building railroads. With the ease of trans-portation came rapid settlement. Population in the basin grew steadily and created urban and industrial growth areas along the Lake Michigan shoreline and along major rivers, such as the Illinois and Des Plaines. Because of rapid urban growth in these areas, wastewater disposal became a serious issue (Mayor and Wade, 1969). Railroads, such as the Illinois Central; Chicago, Burling-ton, and Quincy; and Chicago, Rock Island, and Pacific Railroads, soon supplemented and nearly replaced waterway transport (Conzen and Morales, 1989). Agri-culture also developed as farmers moved into the basin to supply the growing urban areas with food and goods. Some of the earliest traded goods were lumber from Chicago, and coal and stone from the Illinois Valley (Conzen and Morales, 1989).
Manmade features in the UIRB can be grouped into two broad categories that relate to agricultural and urban land use (Mades, 1987). Today, the UIRB receives numerous inputs of contaminants and nutrients from manmade sources that include
municipal and industrial releases, urban and agricultural runoff, and atmospheric deposition. Data collected during the UIRB NAWQA pilot study (1986–92) indicated that differences in fish community structure and water quality could be correlated with differences in urban and agricul-tural land use (Fitzpatrick and others, 1995; Ruhl, 1995; Sullivan and others, 1998).
Land Use
In 1990, agriculture accounted for about 75 percent of the land use in the basin (table 3). Corn was the principal row crop harvested in the basin, followed by soybeans. In 1985, approximately 1.8 million acres of corn were harvested for seed, grain, silage, or sweet corn; and approximately 1.4 million acres of soybeans were harvested for beans (Battaglin and Goolsby, 1995). In 1990, urban areas accounted for about 17 percent of the land use in the basin and were concentrated mainly in the metropolitan areas in and around Chicago. Of this 17 percent, 11 percent was used for low to high density residential purposes, and 6 percent was used for commercial and industrial purposes (Hitt, 1992). The land drained by the Calumet and lower Des Plaines Rivers was some of the most heavily industrialized in the Nation. Along these rivers, petro-leum refining and steel manufac-turing were the dominant industries (City of Chicago and Illinois Environmental Protection Agency, 1989). In 1990, forests covered about 5 percent of the UIRB and were concentrated in city forest preserves and along large-stream riparian areas (fig. 16)
Environmental Setting 25
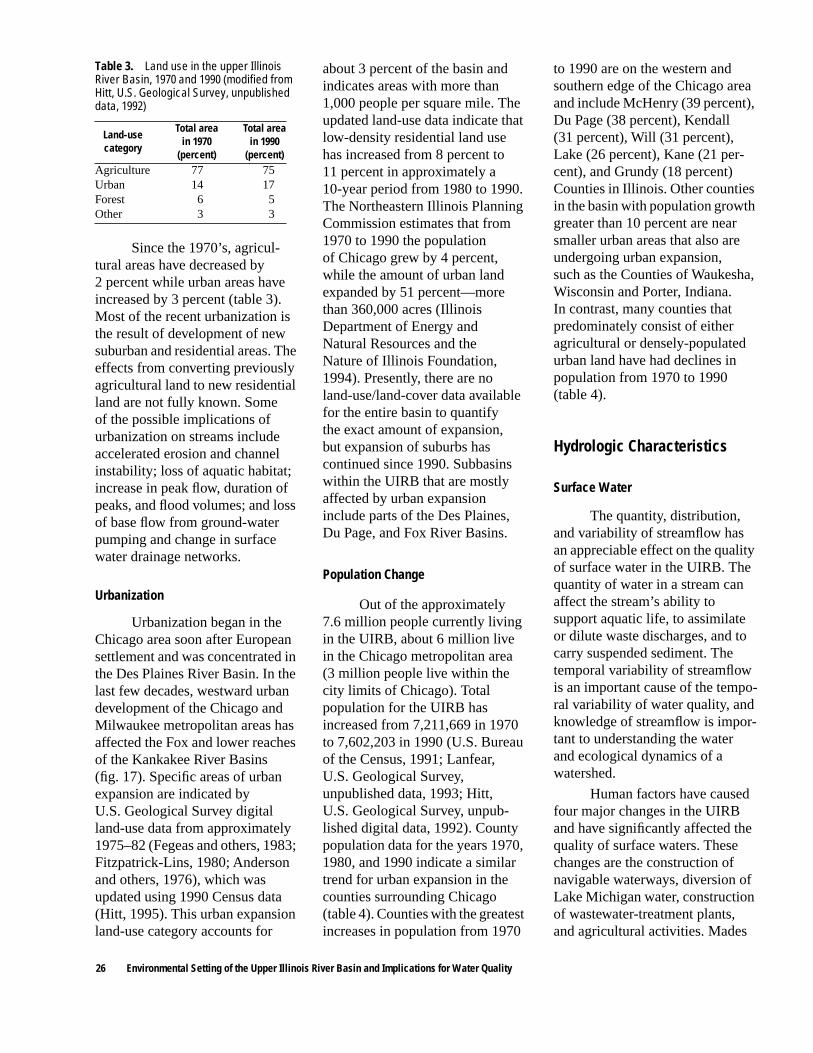
.
Since the 1970’s, agricul-tural areas have decreased by 2 percent while urban areas have increased by 3 percent (table 3). Most of the recent urbanization is the result of development of new suburban and residential areas. The effects from converting previously agricultural land to new residential land are not fully known. Some of the possible implications of urbanization on streams include accelerated erosion and channel instability; loss of aquatic habitat; increase in peak flow, duration of peaks, and flood volumes; and loss of base flow from ground-water pumping and change in surface water drainage networks.
Urbanization
Urbanization began in the Chicago area soon after European settlement and was concentrated in the Des Plaines River Basin. In the last few decades, westward urban development of the Chicago and Milwaukee metropolitan areas has affected the Fox and lower reaches of the Kankakee River Basins (fig. 17). Specific areas of urban expansion are indicated by U.S. Geological Survey digital land-use data from approximately 1975–82 (Fegeas and others, 1983; Fitzpatrick-Lins, 1980; Anderson and others, 1976), which was updated using 1990 Census data (Hitt, 1995). This urban expansion land-use category accounts for
Table 3. Land use in the upper Illinois River Basin, 1970 and 1990 (modified from Hitt, U.S. Geological Survey, unpublished data, 1992)
Land-usecategory
Total areain 1970
(percent)
Total areain 1990
(percent)Agriculture 77 75Urban 14 17Forest 6 5Other 3 3
26 Environmental Setting of the Upper Illinois
about 3 percent of the basin and indicates areas with more than 1,000 people per square mile. The updated land-use data indicate that low-density residential land use has increased from 8 percent to 11 percent in approximately a 10-year period from 1980 to 1990. The Northeastern Illinois Planning Commission estimates that from 1970 to 1990 the population of Chicago grew by 4 percent, while the amount of urban land expanded by 51 percent—more than 360,000 acres (Illinois Department of Energy and Natural Resources and the Nature of Illinois Foundation, 1994). Presently, there are no land-use/land-cover data available for the entire basin to quantify the exact amount of expansion, but expansion of suburbs has continued since 1990. Subbasins within the UIRB that are mostly affected by urban expansion include parts of the Des Plaines, Du Page, and Fox River Basins.
Population Change
Out of the approximately 7.6 million people currently living in the UIRB, about 6 million live in the Chicago metropolitan area (3 million people live within the city limits of Chicago). Total population for the UIRB has increased from 7,211,669 in 1970 to 7,602,203 in 1990 (U.S. Bureau of the Census, 1991; Lanfear, U.S. Geological Survey, unpublished data, 1993; Hitt, U.S. Geological Survey, unpub-lished digital data, 1992). County population data for the years 1970, 1980, and 1990 indicate a similar trend for urban expansion in the counties surrounding Chicago (table 4). Counties with the greatest increases in population from 1970
River Basin and Implications for Water Quality
to 1990 are on the western and southern edge of the Chicago area and include McHenry (39 percent), Du Page (38 percent), Kendall (31 percent), Will (31 percent), Lake (26 percent), Kane (21 per-cent), and Grundy (18 percent) Counties in Illinois. Other counties in the basin with population growth greater than 10 percent are near smaller urban areas that also are undergoing urban expansion, such as the Counties of Waukesha, Wisconsin and Porter, Indiana. In contrast, many counties that predominately consist of either agricultural or densely-populated urban land have had declines in population from 1970 to 1990 (table 4).
Hydrologic Characteristics
Surface Water
The quantity, distribution, and variability of streamflow has an appreciable effect on the quality of surface water in the UIRB. The quantity of water in a stream can affect the stream’s ability to support aquatic life, to assimilate or dilute waste discharges, and to carry suspended sediment. The temporal variability of streamflow is an important cause of the tempo-ral variability of water quality, and knowledge of streamflow is impor-tant to understanding the water and ecological dynamics of a watershed.
Human factors have caused four major changes in the UIRB and have significantly affected the quality of surface waters. These changes are the construction of navigable waterways, diversion of Lake Michigan water, construction of wastewater-treatment plants, and agricultural activities. Mades

Figure 16. Anderson level-1 land-use classification in the upper Illinois River Basin, 1990 (from Hitt, U.S. Geological Survey, unpublished data, 1992).
Hydrologic Characteristics 27

Figure 17. Urbanization in the upper Illinois River Basin (from Hitt, U.S. Geological Survey, unpublished data, 1992).
28 Environmental Setting of the Upper Illinois River Basin and Implications for Water Quality

Table 4. Population change, by county, for the period 1970–90 in the upper Illinois River Basin (modified from Lanfear, U.S. Geological Survey, unpublished data, 1993; and Hitt, U.S. Geological Survey, unpublished data, 1992)
CountyCounty population Change in population
1970 1980 1990 1970 to 1980 1980 to 1990 1970 to 1990
Illinois
Cook 5,426,286 5,191,233 5,105,067 −235,053 −86,166 −321,219
De Kalb 71,589 74,624 77,932 3,035 3,308 6,343
Du Page 487,578 658,835 781,666 171,257 122,831 294,088
Ford 16,370 15,265 14,275 −1,105 −990 −2,095
Grundy 26,510 30,582 32,337 4,072 1,755 5,827
Iroquois 33,505 32,976 30,787 −529 −2,189 −2,718
Kane 250,806 278,405 317,471 27,599 39,066 66,665
Kankakee 97,161 102,926 96,255 5,765 −6,671 −906
Kendall 26,348 37,202 39,413 10,854 2,211 13,065
Lake 381,781 439,737 516,418 57,956 76,681 134,637
La Salle 111,298 112,033 106,913 735 −5,120 −4,385
Lee 37,918 36,328 34,392 −1,590 −1,936 −3,526
Livingston 40,650 41,381 39,301 731 −2,080 −1,349
McHenry 111,456 147,897 183,241 36,441 35,344 71,785
Vermilion 96,966 95,222 88,257 −1,744 −6,965 −8,709
Will 247,605 324,460 357,313 76,855 32,853 109,708
Indiana
Benton 11,252 10,218 9,441 −1,034 −777 −1,811
Elkhart 126,436 137,330 156,198 10,894 18,868 29,762
Jasper 20,414 26,138 24,960 5,724 −1,178 4,546
Kosciusko 48,086 59,555 65,294 11,469 5,739 17,208
Lake 545,886 522,872 475,594 −23,014 −47,278 −70,292
La Porte 105,254 108,632 107,066 3,378 −1,566 1,812
Marshall 34,964 39,155 42,182 4,191 3,027 7,218
Newton 11,596 14,844 13,551 3,248 −1,293 1,955
Porter 87,068 119,816 128,932 32,748 9,116 41,864
Pulaski 12,526 13,258 12,643 732 −615 117
St. Joseph 244,652 241,617 247,052 −3,035 5,435 2,400
Starke 19,270 21,997 22,747 2,727 750 3,477
White 20,981 23,867 23,265 2,886 −602 2,284
Michigan
Berrien 163,819 171,276 161,378 7,457 −9,898 −2,441
Wisconsin
Jefferson 60,028 66,152 67,783 6,124 1,631 7,755
Kenosha 117,842 123,137 128,181 5,295 5,044 10,339
Milwaukee 1,053,740 964,988 959,275 −88,752 −5,713 −94,465
Racine 170,751 173,132 175,034 2,381 1,902 4,283
Walworth 63,384 71,507 75,000 8,123 3,493 11,616
Washington 63,788 84,848 95,328 21,060 10,480 31,540
Waukesha 231,165 280,326 304,715 49,161 24,389 73,550
Hydrologic Characteristics 29

(1987) discusses these changes in detail; selected changes are discussed here.
A number of canals were built to enable navigation between Lake Michigan and the Mississippi River. The 96 mi long Illinois and Michigan Canal was opened to traffic in 1848 (Illinois Department of Public Works and Buildings, 1969). This canal connected the Illinois River 14 mi downstream from Ottawa with Lake Michigan at Chicago. Subsequent competi-tion from railroads led to further improvements in the Illinois River for navigational purposes; as a result, Chicago replaced St. Louis as the major center of commerce for the Illinois River Valley trade. The present navigable waterway was completed in 1939.
The city of Chicago has relied on Lake Michigan as a major source of freshwater from the time of its incorporation in 1837 (Schodek, 1987). Waste disposal was accomplished through a sewer system that fed into the Chicago River and then into Lake Michigan. Untreated sewage often would flow into the water-supply intake cribs during floods and create health hazards. During the latter one-half of the 19th century, periodic outbreaks of typhoid fever, amoebic dysentery, and cholera were attributed to contaminated lake water. In an effort to protect their Lake Michi-gan water supply, the city of Chicago redirected the flow of industrial and domestic wastes to the upper Illinois River system by way of the Chicago Sanitary and Ship Canal (Forbes and Richard-son, 1913, 1919; Richardson, 1928). The Chicago Sanitary and Ship Canal links the Chicago River to the Des Plaines River. A second
30 Environmental Setting of the Upper Illinois
canal, the Calumet Sag Channel, links the Chicago Sanitary and Ship Canal to the Calumet River (Mades, 1987).
Diversion of Lake Michigan water was begun in 1900 at a rate of about 3,000 ft3/s. Of this amount, about 1,200 ft3/s was used for water supply and the remainder was used to dilute domestic and industrial wastes. The allowable rate of diversion varied over the years with maximum diversions of about 8,470 ft3/s occurring during the late 1920’s. Guidelines, outlined in a 1980 amendment to the 1967 Supreme Court Decree, limit the diversion, including with-drawals for water supply, to an average of 3,200 ft3/s over a 40-year running accounting period (Espey and others, 1981).
Water-quality conditions in the UIRB were dramatically affected by these diversions, but water quality has improved since wastewater-treatment practices were begun. The Metropolitan Sanitary District of Greater Chicago (now called the Metropol-itan Water Reclamation District of Greater Chicago, or MWRDGC) began operation of the first large-scale treatment plant in 1922 (Metropolitan Sanitary District of Greater Chicago, 1982). As a result of the Clean Water Act, the U.S. Environmental Protection Agency (USEPA) helped to finance improvements for waste-water treatment in order to reduce municipal and industrial pollution (U.S. Environmental Protection Agency, 1979). In 1982, MWRDGC treatment plants served an area of 870 mi2, includ-ing Chicago and 124 communities in Cook County. These plants treated a domestic wastewater load of 5.1 million persons and
River Basin and Implications for Water Quality
an industrial load equivalent to 4.5 million persons (Terrio, 1994). The return flow from these treatment operations averaged 2,200 ft3/s. In 1983–84, MWRDGC ceased chlorination of wastewater at three treatment plants because chlorination provided limited benefits to the streams receiving the treated wastewater and possibly affected aquatic life. (Terrio, 1994). In addition, implementation of Chicago’s Tunnel and Reservoir Plan (TARP), a series of tunnels and reservoirs that capture over-flow from combined sewers and store the water until it can be treated, resulted in improved quality and controlled quantity of effluent discharged from Chicago’s wastewater-treatment plants (Terrio, 1994).
Despite improvements in the effectiveness of wastewater-treatment plants since 1900 (U.S. Environmental Protection Agency, 1979; 1989), point sources in the Chicago area continue to be major sources of nutrients and contaminants in the UIRB. Approximately 196 wastewater-treatment plants discharge wastewater to streams in the UIRB, the majority of which are located in the greater Chicago area (U.S. Environmental Protec-tion Agency, 1997b).
Agricultural practices in the lower Fox, Des Plaines, and Kankakee River Basins changed appreciably during the 1940’s and 1950’s, nearly a century after these basins were first developed for agricultural purposes. Increas-ing demands for corn and soybeans in domestic and international markets caused an intensification in the cultivation of these row crops. Commercial fertilizers and
pesticides were used in larger amounts to increase crop yields and profits. The practice of crop rotation decreased, and fall plow-ing increased. Irrigation, especially in the Indiana part of the Kankakee River Basin, has steadily increased. A nationwide study of water-quality trends concluded that trends in concentrations of total phosphorus and total nitrate observed from 1974 to 1981 show strong associations with measures of agricultural activity, such as fertilizer application rates (Smith and others, 1987). Because these intensified agricultural practices were effecting water quality nega-tively at the same time that wastewater-treatment improve-ments were effecting water quality positively, expected improvements in water quality have not been as dramatic as anticipated.
Streamflow Characteristics
Streamflow in the study area consists of overland flow, ground-water discharge, and point-source return flow. Overland flow is rain-water or snowmelt that flows over the land surface toward stream channels. Ground-water discharge enters stream channels from springs or as seepage. Typically, point-source return flow is previ-ously used water that is discharged to streams from industrial and municipal wastewater-treatment facilities. In the UIRB, the original source of return-flow water is often ground water or Lake Michigan water and, thus, represents water introduced to the surface-water system that may not have been present under natural conditions.
The mean annual flow from the upper Illinois River Basin is estimated at 12,600 ft3/s, on the basis of streamflow records from
gaging stations near the terminus of the basin (fig. 18 and table 5). These stations, the Fox River at Dayton, Ill. (05552500), and the Illinois River at Marseilles, Ill. (05543500), have been in opera-tion since 1915 and 1919, respectively. In 1997, there were 78 active streamflow-gaging stations operated by the USGS in the study area (fig. 19, table 5).
Effects of geology and natural land-surface features on streamflow are indicated by the differences in flow-duration characteristics for rivers that receive little return flow, such as the upper reaches of the Kankakee River, the Iroquois River, and the upper Fox River (table 6). The drainage area size and land use above streamflow-gaging stations on the Kankakee and Iroquois Rivers are similar, but the clayey soils in the Iroquois River Basin result in slower infiltration of precipitation and less ground-water discharge and, thus, greater varia-tions in streamflow. In fact, the index of variability for the Iroquois River station is almost 10 times greater than that for the Kankakee River station (table 6). In the upper Fox River Basin, the large percent-age of low, poorly drained land and numerous lakes provide natural storage that affects streamflow in a manner similar to that of the sandy soils of the upper Kankakee River Basin.
Seasonal streamflow characteristics are consistent throughout the study area. The highest mean monthly streamflow of all streams and rivers generally occurs during June or July, and the lowest mean monthly streamflow generally occurs during December or January (fig. 20).
Streamflow data analyzed during the UIRB NAWQA pilot study indicated that flow trends during 1978–86 were above the long-term average at many streamflow-gaging stations (Schmidt and Blanchard, 1997). Presently, these trends are continu-ing. Regression analyses indicate significant increases in streamflow at a majority of stations for the period 1950–97 (table 7). Analysis of precipitation records for the 1950–90 period showed no signifi-cant trend (National Oceanic and Atmospheric Administration, 1995); therefore, increased precipi-tation probably is not the source of the increased streamflow. For streamflow analysis, three flow regimes were analyzed: 7-day low flow, mean annual flow, and maxi-mum annual flow. Mean annual streamflows increased during the 1950–97 period at all seven stations shown in table 7, which include streamflow in all the major subbasins of the upper Illinois River Basin. The 7-day low flow also increased at five of the seven stations analyzed, while maximum flow increased at three of the seven stations. The most dramatic increases occurred at stations draining urbanized land, although there also were increases at stations draining agricultural land.
The largest increase in mean annual streamflow from 1950 to 1997 was 84 percent at the Des Plaines River at Riverside, Ill. (05532500). However, further analysis of mean annual stream-flow data indicate a step increase around 1980. The two major wastewater-treatment plants upstream from this station began operations in 1975 and 1980, and contributed an average of about 32 and 53 ft3/s, respectively, to the
Hydrologic Characteristics 31

Base from U.S. Geological Survey
1:100,000 and 1:2,000,000 Digital Data
Albers Equal-Area Conic projection
Standard parallels 33° and 45°, central meridian -89°
89° 88° 87° 86°
43°
42°
41°
0
20
40 MILES
0
20
40 KILOMETERS
LakeMichigan
Illinois
Du D
es
River
BASIN BOUNDARY
EXPLANATION
05520500
1005001,000
10,00015,000
2,500
50
5,000
0552050005520500
0552500005525000
0552550005525500
0552600005526000
0552750005527500
0553600005536000
05536275055362750553900005539000
0554050005540500
0554350005543500
0554828005548280
0555000005550000
0555250005552500
0551750005517500
WISCONSINWISCONSIN
ILLINOISILLINOIS
ILLINOISILLINOIS INDIANAINDIANA
INDIANAINDIANA
MICHIGANMICHIGAN
0552900005529000
0553250005532500
05545750055457500552780005527800
0554383005543830
0552250005522500
0553699505536995 0551500005515000
0551650005516500
WISMICH
INDILL
Study
Area
U.S. GEOLOGICALSURVEY STREAMFLOW-GAGING STATION ANDSTATION NUMBER
MEAN ANNUAL FLOW,IN CUBIC FEET PERSECOND--See table 5
Figure 18. Mean annual streamflows calculated for the upper Illinois River Basin.
32 Environmental Setting of the Upper Illinois River Basin and Implications for Water Quality
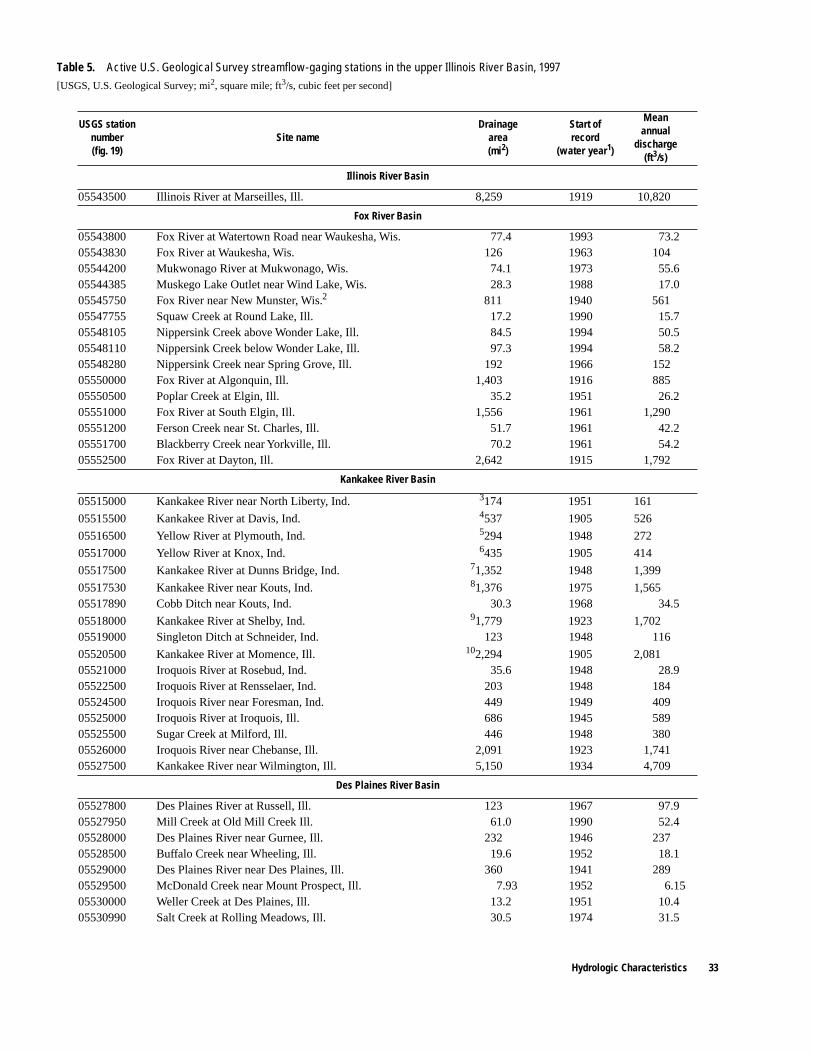
USGS stationnumber(fig. 19)
Site nameDrainage
area(mi2)
Start ofrecord
(water year1)
Meanannual
discharge(ft3/s)
Illinois River Basin
05543500 Illinois River at Marseilles, Ill. 8,259 1919 10,820
Fox River Basin
05543800 Fox River at Watertown Road near Waukesha, Wis. 77.4 1993 73.205543830 Fox River at Waukesha, Wis. 126 1963 10405544200 Mukwonago River at Mukwonago, Wis. 74.1 1973 55.605544385 Muskego Lake Outlet near Wind Lake, Wis. 28.3 1988 17.005545750 Fox River near New Munster, Wis.2 811 1940 56105547755 Squaw Creek at Round Lake, Ill. 17.2 1990 15.705548105 Nippersink Creek above Wonder Lake, Ill. 84.5 1994 50.505548110 Nippersink Creek below Wonder Lake, Ill. 97.3 1994 58.205548280 Nippersink Creek near Spring Grove, Ill. 192 1966 15205550000 Fox River at Algonquin, Ill. 1,403 1916 88505550500 Poplar Creek at Elgin, Ill. 35.2 1951 26.205551000 Fox River at South Elgin, Ill. 1,556 1961 1,29005551200 Ferson Creek near St. Charles, Ill. 51.7 1961 42.205551700 Blackberry Creek near Yorkville, Ill. 70.2 1961 54.205552500 Fox River at Dayton, Ill. 2,642 1915 1,792
Kankakee River Basin
05515000 Kankakee River near North Liberty, Ind. 3174 1951 161
05515500 Kankakee River at Davis, Ind. 4537 1905 526
05516500 Yellow River at Plymouth, Ind. 5294 1948 272
05517000 Yellow River at Knox, Ind. 6435 1905 414
05517500 Kankakee River at Dunns Bridge, Ind. 71,352 1948 1,399
05517530 Kankakee River near Kouts, Ind. 81,376 1975 1,56505517890 Cobb Ditch near Kouts, Ind. 30.3 1968 34.5
05518000 Kankakee River at Shelby, Ind. 91,779 1923 1,70205519000 Singleton Ditch at Schneider, Ind. 123 1948 116
05520500 Kankakee River at Momence, Ill. 102,294 1905 2,08105521000 Iroquois River at Rosebud, Ind. 35.6 1948 28.905522500 Iroquois River at Rensselaer, Ind. 203 1948 18405524500 Iroquois River near Foresman, Ind. 449 1949 40905525000 Iroquois River at Iroquois, Ill. 686 1945 58905525500 Sugar Creek at Milford, Ill. 446 1948 38005526000 Iroquois River near Chebanse, Ill. 2,091 1923 1,74105527500 Kankakee River near Wilmington, Ill. 5,150 1934 4,709
Des Plaines River Basin
05527800 Des Plaines River at Russell, Ill. 123 1967 97.905527950 Mill Creek at Old Mill Creek Ill. 61.0 1990 52.405528000 Des Plaines River near Gurnee, Ill. 232 1946 23705528500 Buffalo Creek near Wheeling, Ill. 19.6 1952 18.105529000 Des Plaines River near Des Plaines, Ill. 360 1941 28905529500 McDonald Creek near Mount Prospect, Ill. 7.93 1952 6.1505530000 Weller Creek at Des Plaines, Ill. 13.2 1951 10.405530990 Salt Creek at Rolling Meadows, Ill. 30.5 1974 31.5
[USGS, U.S. Geological Survey; mi2, square mile; ft3/s, cubic feet per second]
Table 5. Active U.S. Geological Survey streamflow-gaging stations in the upper Illinois River Basin, 1997
Hydrologic Characteristics 33
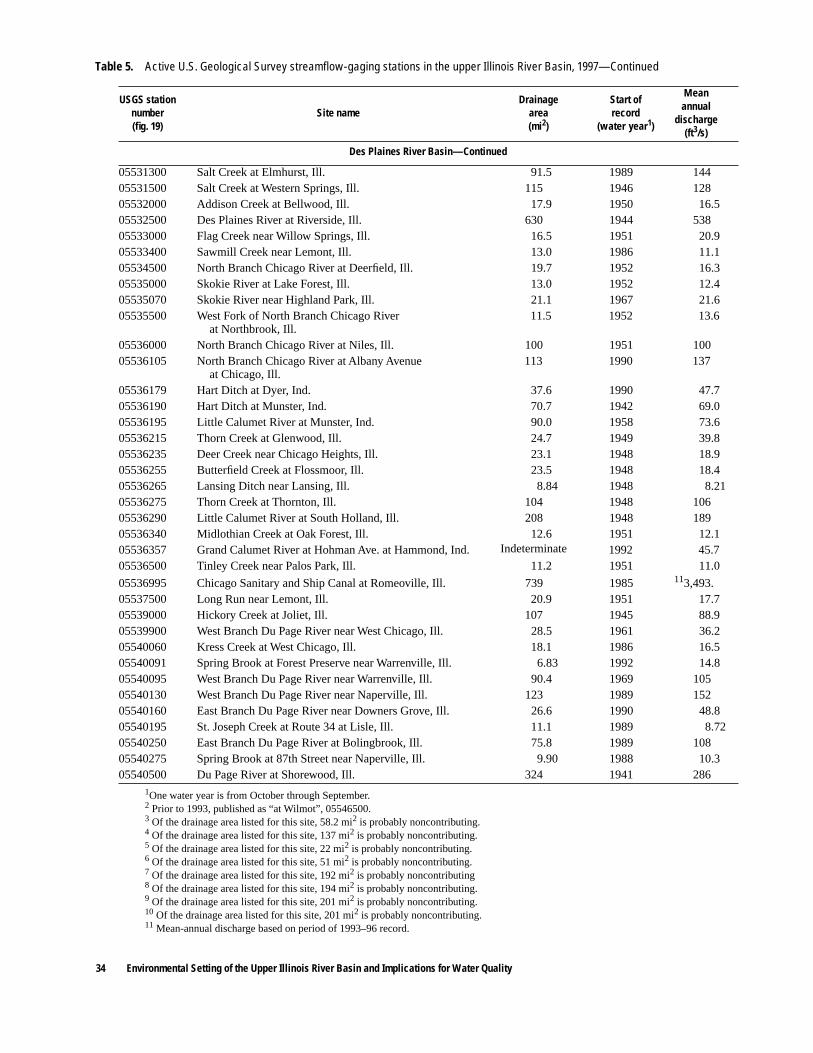
Des Plaines River Basin—Continued
05531300 Salt Creek at Elmhurst, Ill. 91.5 1989 14405531500 Salt Creek at Western Springs, Ill. 115 1946 12805532000 Addison Creek at Bellwood, Ill. 17.9 1950 16.505532500 Des Plaines River at Riverside, Ill. 630 1944 53805533000 Flag Creek near Willow Springs, Ill. 16.5 1951 20.905533400 Sawmill Creek near Lemont, Ill. 13.0 1986 11.105534500 North Branch Chicago River at Deerfield, Ill. 19.7 1952 16.305535000 Skokie River at Lake Forest, Ill. 13.0 1952 12.405535070 Skokie River near Highland Park, Ill. 21.1 1967 21.605535500 West Fork of North Branch Chicago River
at Northbrook, Ill.11.5 1952 13.6
05536000 North Branch Chicago River at Niles, Ill. 100 1951 10005536105 North Branch Chicago River at Albany Avenue
at Chicago, Ill.113 1990 137
05536179 Hart Ditch at Dyer, Ind. 37.6 1990 47.705536190 Hart Ditch at Munster, Ind. 70.7 1942 69.005536195 Little Calumet River at Munster, Ind. 90.0 1958 73.605536215 Thorn Creek at Glenwood, Ill. 24.7 1949 39.805536235 Deer Creek near Chicago Heights, Ill. 23.1 1948 18.905536255 Butterfield Creek at Flossmoor, Ill. 23.5 1948 18.405536265 Lansing Ditch near Lansing, Ill. 8.84 1948 8.2105536275 Thorn Creek at Thornton, Ill. 104 1948 10605536290 Little Calumet River at South Holland, Ill. 208 1948 18905536340 Midlothian Creek at Oak Forest, Ill. 12.6 1951 12.105536357 Grand Calumet River at Hohman Ave. at Hammond, Ind. Indeterminate 1992 45.705536500 Tinley Creek near Palos Park, Ill. 11.2 1951 11.0
05536995 Chicago Sanitary and Ship Canal at Romeoville, Ill. 739 1985 113,493.05537500 Long Run near Lemont, Ill. 20.9 1951 17.705539000 Hickory Creek at Joliet, Ill. 107 1945 88.905539900 West Branch Du Page River near West Chicago, Ill. 28.5 1961 36.205540060 Kress Creek at West Chicago, Ill. 18.1 1986 16.505540091 Spring Brook at Forest Preserve near Warrenville, Ill. 6.83 1992 14.805540095 West Branch Du Page River near Warrenville, Ill. 90.4 1969 10505540130 West Branch Du Page River near Naperville, Ill. 123 1989 15205540160 East Branch Du Page River near Downers Grove, Ill. 26.6 1990 48.805540195 St. Joseph Creek at Route 34 at Lisle, Ill. 11.1 1989 8.7205540250 East Branch Du Page River at Bolingbrook, Ill. 75.8 1989 10805540275 Spring Brook at 87th Street near Naperville, Ill. 9.90 1988 10.305540500 Du Page River at Shorewood, Ill. 324 1941 286
1One water year is from October through September.2 Prior to 1993, published as “at Wilmot”, 05546500.3 Of the drainage area listed for this site, 58.2 mi2 is probably noncontributing.4 Of the drainage area listed for this site, 137 mi2 is probably noncontributing.5 Of the drainage area listed for this site, 22 mi2 is probably noncontributing.6 Of the drainage area listed for this site, 51 mi2 is probably noncontributing.7 Of the drainage area listed for this site, 192 mi2 is probably noncontributing8 Of the drainage area listed for this site, 194 mi2 is probably noncontributing.9 Of the drainage area listed for this site, 201 mi2 is probably noncontributing.10 Of the drainage area listed for this site, 201 mi2 is probably noncontributing.11 Mean-annual discharge based on period of 1993–96 record.
USGS stationnumber(fig. 19)
Site nameDrainage
area(mi2)
Start ofrecord
(water year1)
Meanannual
discharge(ft3/s)
Table 5. Active U.S. Geological Survey streamflow-gaging stations in the upper Illinois River Basin, 1997—Continued
34 Environmental Setting of the Upper Illinois River Basin and Implications for Water Quality

Figure 19. Active U.S. Geological Survey streamflow-gaging stations in the upper Illinois River Basin, 1997.
Hydrologic Characteristics 35

Tabl
e 6.
Flow
-dur
atio
n ch
arac
teris
tics
at s
elec
ted
stre
amflo
w-g
agin
g st
atio
ns in
the
uppe
r Illi
nois
Riv
er B
asin
[Flo
w-d
urat
ion
char
acte
rist
ics
base
d on
rec
ords
col
lect
ed p
rior
to 1
998
wat
er y
ear;
exc
eeda
nce
freq
uenc
y is
per
cent
age
of ti
me
that
indi
cate
d st
ream
flow
is e
qual
ed o
r ex
ceed
ed;
USG
S, U
.S. G
eolo
gica
l Sur
vey;
mi2 , s
quar
e m
iles;
ft3 /s
, cub
ic f
eet p
er s
econ
d; -
-, n
o da
ta]
USG
Sst
ream
flow
-ga
ging
sta
tion
(fig.
19,
tabl
e 5)
USG
S st
atio
n na
me
Peri
od o
fre
cord
1
(wat
er y
ear2 )
1 Con
tinuo
us r
ecor
d sh
own.
2 One
wat
er y
ear
is f
rom
Oct
ober
thro
ugh
Sept
embe
r.
Dra
inag
ear
ea(m
i2 )
Mea
nan
nual
flow
(ft3 /s
)
Flow
at e
xcee
danc
efr
eque
ncy
for
peri
od o
f rec
ord
at in
dica
ted
perc
entil
e (ft
3 /s)
Flow
at e
xcee
danc
efr
eque
ncy
1950
–97
atin
dica
ted
perc
entil
e (ft
3 /s)
Inde
x of
vari
abili
ty3
3 Inde
x of
var
iabi
lity
is th
e ra
tio o
f st
ream
flow
s at
the
10-
and
90-p
erce
nt e
xcee
danc
e fr
eque
ncie
s.
90th
perc
entil
eflo
wpe
r mi2
(ft3 /s
)10
50(m
edia
n)90
1050
(med
ian)
90
0552
0500
Kan
kake
e R
iver
at M
omen
ce, I
ll.19
15–p
rese
nt4 2,
294
4 201
squa
re m
iles
prob
ably
is n
onco
ntri
butin
g.
2,06
64,
300
1,58
065
54,
658
1,85
071
26.
50.
34
0552
6000
Iroq
uois
Riv
er n
ear
Che
bans
e, I
ll.19
24–p
rese
nt2,
091
1,73
54,
740
735
795,
044
832
9056
.0.0
4
0553
2500
Des
Pla
ines
Riv
er a
t Riv
ersi
de, I
ll.19
43–p
rese
nt63
053
51,
320
290
341,
385
318
5027
.7.0
8
0553
6995
Chi
cago
San
itary
and
Shi
p C
anal
at R
omeo
ville
, Ill.
5
5 Flow
sta
tistic
s fo
r th
is s
ite w
ere
base
d on
199
1–97
dat
a.1984
–pre
sent
739
3,53
65,
080
3,11
02,
140
----
----
--
0554
0500
Du
Page
Riv
er a
t Sho
rew
ood,
Ill.
1940
–pre
sent
324
285
618
162
4665
017
653
12.3
.16
0554
3500
Illin
ois
Riv
er a
t Mar
seill
es, I
ll.19
19–p
rese
nt6 8,
259
6 Doe
s no
t inc
lude
div
ersi
on f
rom
Lak
e M
ichi
gan
thro
ugh
the
Chi
cago
San
itary
and
Shi
p C
anal
, whi
ch h
as o
ccur
red
sinc
e Ja
n. 1
7, 1
900.
10,8
1019
,400
9,02
04,
590
19,5
987,
618
4,39
24.
5.5
3
0555
0000
Fox
Riv
er a
t Alg
onqu
in, I
ll.19
15–p
rese
nt1,
403
884
2,00
059
018
62,
167
684
224
9.7
.16
0555
2500
Fox
Riv
er a
t Day
ton,
Ill.
1915
–pre
sent
2,64
21,
790
4,06
01,
160
370
4,51
61,
376
456
9.9
.17
36 Environmental Setting of the Upper Illinois River Basin and Implications for Water Quality
streamflow at this station during 1978–88 (Terrio, 1994). During the period 1975–97, mean annual streamflow was 682 ft3/s compared with 565 ft3/s for the period 1950–97. Although there was an increase above the additional discharge from the wastewater-treatment plants, most of the increase in streamflow at this station is due to effluent return flow. Prior to 1975, effluent from this part of the Chicago area was treated at wastewater-treatment plants that discharged to the Chicago Sanitary and Ship Canal.
Streamflow data at the other stations shown in table 7 are normally distributed and seem to indicate a more gradual increase in flows. These trends are probably the result of three factors: land-use changes that have resulted in less infiltration and faster runoff of precipitation from the basins; gradually increasing ground-water pumpage and/or use of Lake Michigan waters; and the associ-ated increase in wastewater-treatment plant effluent return flows. In urban areas, less infiltra-tion and faster runoff result from an increase in impervious surfaces including roads, parking lots, and buildings. In agricultural areas, less infiltration and faster runoff result from the trend toward more inten-sive row-crop production and prac-tices designed to speed drainage, including tile drains and the drain-age of wetlands by ditching. In agricultural areas of the basin, an increase in the acreage of irrigated cropland probably also has contrib-uted to increased streamflows as ground water from aquifers is brought to the surface and chan-neled toward streams through agricultural drainage systems.

Hydrologic Character
16,0
00
6,00
0
8,00
0
10,0
00
12,0
00
14,0
00 200
1,20
0
200
400
600
800
1,00
0
0
4,00
0 0
1,00
0
2,00
0
3,00
0500
3,50
0
500
1,00
0
1,50
0
2,00
0
2,50
0
3,00
0
JF
MA
MJ
JA
SO
ND
MO
NT
HJ
FM
AM
JJ
AS
ON
D
MO
NT
H
MEAN MONTHLY STREAMFLOW, IN CUBIC FEET PER SECOND
Sta
tion
0554
3500
:Ill
inoi
s R
iver
at M
arse
illes
, Ill.
Sta
tion
0553
2500
:D
es P
lain
es R
iver
at R
iver
side
, Ill.
Sta
tion
0555
2500
:F
ox R
iver
at D
ayto
n, Il
l.
Sta
tion
0552
6000
Iroq
uois
Riv
er n
ear
Che
bans
e, Il
l.
Figu
re 2
0.M
ean
mon
thly
stre
amflo
w a
t fou
r sta
tions
in th
e up
per I
llino
is R
iver
Bas
in, 1
950–
97.
istics 37

Table 7. Trends in streamflow at selected streamflow-gaging stations in the upper Illinois River Basin, 1950–97[Trends are considered significant at p<0.05; USGS, U.S. Geological Survey; ft3/s, cubic feet per second; o, no trend; +, increasing trend; --, not applicable]
USGSstreamflow-
gaging station(fig. 19, table 5)
Direction of flow trend Change in flow, in percent1
1Percent change is defined as the average yearly change divided by the mean annual flow.
7-daylow flow
Meanannual
flow
Maximumannual
flow
7-daylowflow(ft3/s)
Meanannual
flow(ft3/s)
Maximumannual
flow(ft3/s)
05520500 o + + -- 39 3805526000 + + o 113 47 --05532500 +2
2Residuals were non-normal because of a step change in the data.
+ + 237 84 3905540500 + + o 136 72 --05543500 o + o -- 26 --05550000 + + o 85 50 --05552500 + + + 456 48 62
Floods and Droughts
Floods and droughts are caused by climatic conditions and affect surface runoff, soil moisture, stream discharge, and ground water. Local flooding generally is caused by isolated thunderstorms, whereas widespread flooding is caused by more extensive thunder-storms that cover a wide area, by rapid snowmelt in the spring, or by a combination of these factors (U.S. Geological Survey, 1991). Usually, some flooding occurs in the UIRB every year. In some years the floods are minor; in other years, floods are extensive and cause loss of life and property. The most widespread flooding to affect the UIRB was during 1943.
Floods of greater than 100-year recurrence intervals have been experienced in the UIRB a number of times since records have been kept. On July 13, 1957, local rainfall of greater than 6 in. caused 9 deaths and extensive damage in northeastern Illinois. During February and March 1985, rain fell on snow-covered areas in northeastern Illinois and was followed by a second intense rain-fall period. Subsequent flooding
38 Environmental Setting of the Upper Illinois
caused 26 counties to be declared disaster areas with $10 million worth of damage. During a 2-week period from September 20 to October 3, 1986, local rains caused flooding that resulted in 4 deaths and $50 million in damages.
Heavy rainfall on August 13 and 14, 1987, caused severe flood-ing of urban areas by streams in Cook and Du Page Counties in Illinois. An all-time 24-hour rainfall record was set during the storm, with 9.35 in. falling at O’Hare International Airport (Chicago, Ill.). This record was more than 3 in. greater than the previous 24-hour record. The worst flooding occurred along the Des Plaines River and its tributary, Salt Creek. Record maximum peak streamflows were recorded at 10 streamflow-gaging stations on 8 streams.
Droughts are the result of more persistent climate patterns than those of floods, produce less precipitation than normal, and usually have a duration measured in years (U.S. Geological Survey, 1991). Four droughts have been severe in all or part of the basin: 1930–36, 1952–57,1962–67, and
River Basin and Implications for Water Quality
1975–78. The most severe drought basinwide was around 1957 when precipitation was 64 percent of the average, but less severe droughts have been observed during every decade from 1920 to 1980. The most severe drought in the Midwest, one that resulted in dustbowl conditions, occurred in the 1930’s. The drought of 1952–57 was the most severe in terms of deficient streamflow in Illinois and was followed by another drought of almost equal severity only 5 years later (1962–67). The last major drought observed in all or part of the basin was during 1975–78, and this drought was the least severe of the four.
Lakes and Wetlands
Few natural lakes are present in the study area, with the excep-tion of glacial lakes in the upper Fox River Basin in Wisconsin and McHenry County, Illinois. A few small remnant glacial lakes also exist in Lake County, Illinois. There are a number of manmade lakes throughout the basin.
Many wetland types occur in the basin, including marshes and shrub swamps, sedge meadows, fens, and bogs (Sullivan, undated). These wetland types are differenti-ated by their time of inundation, chemical properties, water depth, place in the landscape, and the plants and animals that occupy them. Wetlands are often located between terrestrial and aquatic systems, and function in hydrolog-ical, chemical, and biological roles (Mitsch and Gosselink, 1993). Although wetlands make up a rela-tively small amount (1 percent) of land cover in the UIRB, a great proportion of species, including endangered and threatened species,

are dependent on wetlands (Illinois Department of Energy and Natural Resources, 1994). Alteration of wetlands changes the character of streams and can affect stream water quality (Mitsch and Gosselink, 1993). Wetlands were once a major feature of the basin, but most of the wetlands in the upper Illinois River Basin were drained prior to the 1850’s. The effects of such extensive wetland drainage on the hydrology and water quality of the UIRB cannot be quantified because most of the drainage was completed before water-data collection programs were estab-lished.
Development of farmland in the Kankakee Till Plain (fig. 10) was made possible by the drainage of wetland areas such as the “Grand Marsh.” The Grand Marsh of the Kankakee River Basin was one of the largest wetlands in the interior United States until the early twentieth century (Mitsch and Gosselink, 1993). This marsh and swamp complex covered an area of about 400,000 acres in a corridor 3–5 mi wide on each side of the Kankakee River (Bellrose, 1976; Meyer, 1936). The wetland was a mosaic of various types of grassy wetlands, hardwood swamps, and sandy islands; and supported a rich and diverse vari-ety of fish, wildlife, and plants (Meyer, 1936). During the middle nineteenth century, tributaries to the Kankakee River were channel-ized and land was cleared and drained for agriculture. Prior to these changes, the area was a prime hunting and fishing region used by Indians, European traders and settlers, and American sportsmen. Channelization of the mainstem Kankakee River began in 1906 and the entire river in Indiana was
channelized by 1918. Because of channelization, the length of the Kankakee River in Indiana was reduced from about 250 mi to about 80 mi. Riparian forest wetlands between the Indiana border and Momence, Illinois, are remnants of the Grand Marsh (Ivens and others, 1981; Mitsch and Gosselink, 1993). Presently (1998), the U.S. Fish and Wildlife Service is proposing the re-creation of a 30,000-acre Grand Kankakee Marsh National Wildlife Refuge in the Kankakee River Basin.
Remaining wetlands in the UIRB are mainly in riparian areas, with the largest areas occurring along the Kankakee River on both sides of the Illinois-Indiana border and along the Des Plaines River in Wisconsin. Small wetlands are scattered about the Fox River Basin in Wisconsin and in McHenry County, Illinois, and in the upper reaches of the Kankakee River Basin in Indiana.
Water Chemistry
Information on water-quality conditions in the UIRB is widely available. The NAWQA pilot study (1986–92) produced numerous reports about (1) changes in wastewater-treatment practices and effects on water quality (Terrio, 1994); (2) trace elements in water, sediment, and biota (Fitzpatrick and others, 1995); (3) relations between fish communities and environmental factors (Ruhl, 1995); (4) nutrients, dissolved oxygen, and fecal-indicator bacteria (Terrio, 1995); (5) organic compounds in water, sediment, and biota (Sullivan and others, 1998); and produced a summary report (Schmidt and Blanchard, 1997). In addition, the
Illinois Environmental Protection Agency (IEPA) produces a bian-nual report that summarizes results from their monitoring network (Illinois Environmental Protection Agency, 1996a, 1996b, 1996c).
Results of analyses of histor-ical data indicate that the primary factor affecting water quality in the UIRB is land use (Schmidt and Blanchard, 1997). Distinct chemi-cal signatures are seen in streams that drain urban land compared with streams that drain agricultural land. For trace inorganic constitu-ents, loads were 2–13 times greater from the Chicago metropolitan area, mainly from the Des Plaines to the Illinois River (Schmidt and Blanchard, 1997). Nonagricultural synthetic organic compounds were similarly enriched in urban areas compared to agricultural areas (Sullivan and others, 1998). Although the specific pesticides differed among land use, pesticides were found in both urban and agri-cultural areas with a few excep-tions. The most commonly used herbicide in the Midwest in the 1980’s and 1990’s, atrazine, was found in concentrations that exceeded USEPA standards in urban and agricultural streams (Sullivan and others, 1998).
As of 1996, IEPA samples 39 stream sites in the UIRB (Illi-nois Environmental Protection Agency, 1996b). At most sites, samples are analyzed for nutrients and major ions. A number of other constituents may be monitored, depending on the location of the stream and important water-quality issues.
The IEPA reports that over-all water quality in the State has steadily improved over the last 26 years (Illinois Environmental Protection Agency, 1996c). The
Hydrologic Characteristics 39

report notes declining trends in many conventional pollutants, as well as increased species diversity in the Illinois River. Much of the mainstem rivers in the upper Illinois River Basin were assessed as having “poor” water quality in 1972; in 1996 most mainstem rivers had been upgraded to “fair” and a few were classified as “good.” Most of the nonmainstem streams were assessed as having “good” water quality in 1996; most nonmainstem streams were not assessed in 1972.
Constituent loads were calculated for selected sites in the UIRB (fig. 21) with IEPA data collected during 1978–97 using the Estimator program (Cohn and others, 1989). In general, nutrient loads, as illustrated by nitrogen and phosphorus, were greatest from the urban center of the Chicago metro-politan area, reflecting the effect of wastewater return flows to the Des Plaines River and Chicago Sanitary and Ship Canal. Total-suspended solids loads were great-est from agricultural areas.
Aquatic Biological Characteristics
Water-quality assessments commonly utilize information about aquatic biology for determin-ing the status of water resources. Perhaps the simplest approach is to use the presence of species with restrictive ecological requirements to indicate particular environmen-tal conditions. For example, because trout require cool water, their presence can indicate that water temperature does not exceed a given threshold. A more compli-cated approach is to use informa-tion about the relative abundance of aquatic species to calculate various numerical indices. The Index of Biotic Integrity (IBI),
40 Environmental Setting of the Upper Illinois
which is based on the relative abundance of fish species, is one example of a widely used numerical index (Karr and others, 1986).
Although each of these approaches varies in complexity, all require an understanding of biogeography, which is the study of the geographic distribution of plants and animals, and the factors that determine those distributions. These factors fall into two broad categories: (1) ecological factors and (2) historical factors. Ecologi-cal factors include structural habitat features, water-chemistry conditions, and biological interac-tions such as competition and predation. Historical factors include geologic and climatic conditions acting over geologic time scales and recent influences such as introduction of constituents associated with human activities (Gilbert, 1980).
Water-resource assessments usually focus on ecological factors and recent historical influences. Assessments based solely on ecological factors and recent historical influences, however, can be inaccurate or misleading if long-term geologic and climatic factors also are not considered. This result is particularly true at regional scales, where long-term geologic and climatic antecedent conditions can be important factors affecting species distributions (Gilbert, 1980; Jackson and Harvey, 1989).
Early Biogeographic Setting
The dominant long-term geologic and climatic factors affecting presettlement species distributions in the UIRB were the glacial periods. As the Wiscon-sinan glaciers advanced, aquatic
River Basin and Implications for Water Quality
species were either eliminated or displaced to areas where they could exist until the ice retreated. When the glaciers retreated, species reinvaded the glaciated regions. The majority of the present-day aquatic fauna of the UIRB reinvaded by moving north from the lower Mississippi River Basin. Interconnected meltwater lakes at the southern end of the retreating glaciers enhanced this reinvasion by providing avenues for rapid dispersal. The unglaciated (driftless) region of southwest Wisconsin and northwestern Illinois also was a source for reinvasion of the UIRB. Fishes that may have reinvaded from the drift-less region include northern brook lamprey (Ichthyomyzon fossor), central mudminnow (Umbra limi), brassy minnow (Hybognathus hankinsoni), pugnose shiner (Notropis anogenus), blackchin shiner (Notropis heterodon), and common shiner (Luxilus cornutis) (Burr and Page, 1986). An outlet between the Great Lakes and the Susquehanna River on the Atlantic Slope provided an invasion path-way for spottail shiner (Notropis hudsonius) and banded killifish (Fundulus diaphanus). Red shiner (Cyprinella lutrensis) and sucker-mouth minnow (Phenacobius mirabilis) probably came from the west through aquatic connections to the Missouri River Basin (Burr and Page, 1986). The red shiner is of particular interest because the range of this plains-adapted species is expanding eastward and this species is displacing other fishes (Burr, 1991). Although the red shiner is not historically wide-spread in the UIRB, this fish may be expanding its range in the region. In 1990, the red shiner was captured in the Iroquois River

Hydrologic Characteristics 41
Ph
os
ph
oru
s
WIS IL
LIN
D
ST
UD
Y
AR
EA
Tota
lN
itro
ge
n
002
0
20
40
MIL
ES
40
KIL
OM
ET
ER
S00
20
20
40
MIL
ES
40
KIL
OM
ET
ER
S
N
05552500
05552500
05552500
05552500
05
55
00
00
05
55
00
00
05
55
10
00
05
55
10
00
05
55
17
00
05
55
17
000
55
48
28
00
55
48
28
0
05
53
25
00
05
53
25
00
05
53
60
00
05
53
60
00
05
53
15
00
05
53
15
00 0
55
37
00
00
55
37
00
0
05
52
75
00
05
52
75
00
05
54
05
00
05
54
05
00
05
55
25
00
05
55
25
00
05
54
35
00
05
54
35
00
05
52
60
00
05
52
60
00
05
52
05
00
05
52
05
00
N
WIS
CO
NS
IN
ILL
INO
IS
ILL
INO
ISIN
DIA
NA
IND
IAN
A
MIC
HIG
AN
05
55
00
00
05
55
00
00
05
55
10
00
05
55
10
00
05
55
17
00
05
55
17
000
55
48
28
00
55
48
28
0
05
53
25
00
05
53
25
00
05
53
60
00
05
53
60
00
05
53
15
00
05
53
15
00 0
55
37
00
00
55
37
00
0
05
52
75
00
05
52
75
00
05
54
05
00
05
54
05
00
05
55
25
00
05
55
25
00
05
54
35
00
05
54
35
00
05
52
60
00
05
52
60
00
05
52
05
00
05
52
05
00
WIS
CO
NS
IN
ILL
INO
IS
ILL
INO
ISIN
DIA
NA
IND
IAN
A
MIC
HIG
AN
UN
MO
NIT
OR
ED
RIV
ER
UN
MO
NIT
OR
ED
RIV
ER
GA
GIN
GS
TA
TIO
NA
ND
ST
AT
ION
NU
MB
ER
GA
GIN
GS
TA
TIO
NA
ND
ST
AT
ION
NU
MB
ER
TO
TA
LN
ITR
OG
EN
LO
AD
,
INT
ON
SP
ER
YE
AR
TO
TA
LP
HO
SP
HO
RU
SL
OA
D,
INT
ON
SP
ER
YE
AR
EX
PL
AN
AT
ION
EX
PL
AN
AT
ION
BA
SIN
BO
UN
DA
RY
BA
SIN
BO
UN
DA
RY
10
05
00
5,0
00
50
,00
0
1,0
00
10
,00
0
10
50
10
05
00
1,0
00
5,0
00
Figu
re 2
1.Lo
ads
of s
elec
ted
cons
titue
nts
in th
e up
per I
llino
is R
iver
Bas
in.

42 Environm
0
0 20
20
40 MILES
40 KILOMETERS
WIS
ILL IND
STUDY
AREA
Total Suspended Solids
N
0555250005552500
0555000005550000
0555100005551000
0555170005551700
0554828005548280 0552780005527800
0553250005532500
0553600005536000
0552900005529000
0554009505540095
0553450005534500
0553150005531500
05537000055370000553627505536275
0553900005539000
0552750005527500
05540500055405000555250005552500
0554350005543500
0552600005526000
0554200005542000
0552500005525000
0552550005525500
0552050005520500
WISCONSIN
ILLINOIS
ILLINOIS INDIANA
INDIANA
MICHIGAN
UNMONITORED RIVER
GAGING STATION AND
STATION NUMBER
TOTAL SUSPENDED SOLIDS
LOAD, IN TONS PER YEAR
EXPLANATION
BASIN BOUNDARY
1,0005,000
50,000
500,0001,000,000
10,000
100,000
Figure 21. Continued.
Basin at stations in Illinois and Indiana (Simon, 1992).
One of the likely conse-quences of the Wisconsinan glaciation is that fishes that prefer small, clear streams were favored during the southern dispersal. Because water became tied up in glacial ice, rainfall declined, and the Mississippi River and its tributaries became less turbid, upland and clear-water
ental Setting of the Upper Illinois
species were able to utilize the tributaries for dispersal and refuge (Burr and Page, 1986). The pool of species available for reinvading the glaciated regions, thus, included many fishes that were adapted to small, clear streams. This fact suggests that the presettlement fish assemblage of the UIRB may have been particularly sensitive to increases in turbidity and sedimen-tation.
River Basin and Implications for Water Quality
Another consequence of the Pleistocene glaciation is that the aquatic fauna of the upper midwestern United States, includ-ing the UIRB, consists of relatively few endemic species compared to other more stable regions, such as the Tennessee Uplands and the Ozark Plateau. Endemic species are those that are confined to a certain region or area. In general, areas with stable geologic and
climatic history will have more endemic species than unstable regions. For example, the Great Lakes area, which also was covered by glaciers during the Pleistocene, has nine endemic fish species, whereas the climati-cally more stable Tennessee Uplands area has about 50 endemic fish species (Gilbert, 1980).
One of the most notable features of the aquatic biota of the UIRB is the presence of relic populations of species that have current-day distributions centered in the southern coastal plain of the Mississippi River Basin and Gulf Coast. These relic populations include those of the ironcolor shiner (Notropis chalybaeus) and the weed shiner (Notropis texanus), which are characteristic of south-ern lowland swamps. Both species are found in the northeastern part of the Kankakee River Basin (Burr and Page, 1986). Other relic popu-lations found in or near the UIRB include the nonparasitic lamprey (Ichthyomyzon cf. gagei) and several kinds of plants. Ichthyo-myzon cf. gagei, which is found in the southeastern United States, also may be found in Wisconsin (Lyons and others, 1997). Several southern Coastal Plain plants are found in the sandplains near Lake Michigan in southwestern Michigan and northern Indiana (Reznicek, 1994).These relic populations probably became established during an unusually warm post-glacial climatic period between 4,000 and 8,000 years ago. Subsequent climatic cooling has reduced the northern range of these populations until they are found in only a few locations in the upper Midwest (Burr and Page, 1986).
Early Aquatic Communities
Landforms created by the Pleistocene glaciations, post-glacial faunal reinvasion, and subsequent climatic variation are important factors for the develop-ment of presettlement aquatic communities in the UIRB. Although the productivity and diversity of presettlement aquatic communities were not formally cataloged, accounts of the early explorers and investigations of the late nineteenth and early twentieth century indicate these communities were large and diverse. When the first European explorers entered the Illinois River Basin, they described the area as “teeming” with fish and wildlife. Fish and waterfowl were plentiful, the mainstem of the Illinois River ran clear, and the associated back-waters and bottomland lakes had firm bottoms and luxurious stands of submerged and emergent aquatic macrophytes (Steffeck and Striegl, 1989). In 1900, prior to the opening of the Chicago Sanitary and Shipping Canal, the economic value of the commercial fishery of the Illinois River was ranked third nationally behind the salmon fishery of the Pacific Coast and the Great Lakes fishery (Steffeck and Striegl, 1989). Between 1870 and 1900, at least 38 mussel species were collected from the Illinois River (Starrett, 1971). Smith (1979) recorded 97 fish species that were captured before 1908 in the Illinois part of the UIRB.
Presettlement aquatic communities encompassed warm- to cool-water assemblages adapted to low- to moderate-gradient streams and rivers. Although level-3 ecoregion classi-fication suggests a rather uniform
environment, the glacial landforms provided diverse habitats and ecological niches. The Kankakee, upper Fox, and Des Plaines River Basins contained many small lakes, ponds, and wetlands. Some cool-water streams persist in the Little Kankakee River Basin in Indiana and in the northern Fox River Basin in Wisconsin, some of which are capable of supporting stocked trout (Fago, 1984; Robert-son, 1979).
Recent Conditions and Trends
During the last 150 years, aquatic communities of the UIRB have been affected by human activities. In the State of Illinois, 7 percent of the fish species have disappeared since the turn of the century, and many more species are in decline (Illinois Department of Energy and Natural Resources, 1994). Smith (1971) listed eight conditions responsible for the extirpation or decimation of many fish populations in Illinois streams. Some of these conditions can be found in the UIRB, including: silt-ation; drainage of natural lakes, swamps, and prairie marshes; desiccation during drought; species interactions, including competition from nonindigenous fish; indus-trial, domestic, and agricultural pollution other than siltation; dams and impoundments; and increased water temperature.
One of the most notable human effects occurred between 1900 and 1920 in the Illinois River downstream from Chicago, after the Chicago Sanitary and Shipping Canal opened. The biological repercussions of indus-trial and domestic wastes being diverted to the upper Illinois River peaked about 1920, when plants, benthic organisms, and fish were
Hydrologic Characteristics 43

practically eliminated from the Illinois River for about 160 mi downstream from Chicago (Rich-ardson, 1928). Since the 1920’s, there has been a gradual improve-ment in this reach of the Illinois River because of the improved wastewater-treatment practices upstream. Monitoring by the Illinois Natural History Survey (INHS) has documented partial recovery of fish communities. Between 1957 and 1992, common carp and goldfish dominated fish communities in the mainstem of the upper Illinois River. By 1993, however, native species had returned to the mainstem of the river and the relative abundance of common carp and goldfish had declined significantly (Sparks and Lerczak, 1993). In contrast, fish life in the bottomland lakes along the lower Illinois River has not increased to the degree anticipated from improvement in dissolved oxygen conditions (Mills and others, 1966; Sparks and Starrett, 1975).
Urban streams in the UIRB tend to have degraded aquatic communities relative to streams in agricultural areas. Studies have consistently shown that fish communities in urbanized areas generally have low IBI scores and relatively low species richness, and are often dominated by tolerant fish species such as green sunfish (Lepomis cyanellus) and common carp (Smith, 1971; Bertrand, 1984; Illinois Environmental Protection Agency, 1987, 1988a, 1988b, Ruhl, 1995). During the 1970’s, some streams in Chicago were so degraded that no fish could be captured despite repeated sampling attempts (Dennison and others, 1997).
44 Environmental Setting of the Upper Illinois
In contrast with urban streams, streams in predominantly agricultural areas generally have higher IBI scores and more diverse fish communities that often include several intolerant fish species (Smith, 1971; Bertrand, 1984; Illinois Environmental Protection Agency, 1987, 1988a, 1988b, Ruhl, 1995). Ruhl (1995) analyzed IEPA fish, habitat, and water-chemistry data and found differences in fish community structure in the Fox, Des Plaines, and Du Page River Basins were strongly related to water-quality gradients associated with differences between agricultural and urban land uses. Differences were only moderately related to habitat structure. Bertrand (1984) also concluded that fish communities in the Calumet, Des Plaines, and Du Page River Basins probably were limited by water quality rather than by habitat.
The contrast between urban and agricultural streams also is reflected in the IEPA’s Biological Stream Characterization (BSC) of UIRB streams (Bertrand and others, 1996). The BSC is a system for classifying streams according to the status of the their aquatic biota (table 8). The BSC is based primarily on IBI scores but also is based on game fish and macroin-vertebrate information as needed. In the primarily agricultural Kankakee River Basin, 74 percent of the total stream miles were classified as highly valued aquatic resources, and none were classified as limited aquatic resources. In contrast, in the more heavily urbanized Des Plaines River Basin (including the Chicago Waterways and Calumet Basins) only 7 percent of the river miles was classified as highly valued
River Basin and Implications for Water Quality
resources and 56 percent was classified as limited aquatic resources (table 9).
There is some evidence that aquatic communities in the Chicago Waterways have improved recently in response to changes in wastewater treatment and implementation of the TARP. Dennison and others (1997) have documented increased fish abun-dance (from an average of 43 fish per unit effort to 111 per unit effort) and fish species richness (from 41 species to 61 species) at sampling stations downstream from affected areas. They also documented an increase in the proportion of game fish (from 16 percent to 36 percent) found in the MWRDGC monitoring collections.
Nonindigenous Species
Most nonindigenous (also known as exotic, alien, or nonnative) species are regarded as negative indicators of water quality (Karr, 1995) because they often have direct negative effects on the landscape. Many nonindigenous species are able to colonize and become abundant only where water quality has already been negatively affected. Nonindigenous species may alter habitat, prey on native species, compete with native species for food and habitat, or transmit diseases or parasites (Florida Caribbean Science Center, 1998). Nonindigenous species may be introduced by intentional and accidental stocking, release from bait buckets, release of unwanted aquarium fish, escape from aqua-culture facilities, and discharge of ballast water.
Nonindigenous fish species in the UIRB include the common carp (Cyprinus carpio), goldfish

Table 8. Biological Stream Characterization (BSC) categories
[Adapted from Bertrand and others (1996), table 1]
Stream class BSC category Biotic resource quality description
A Unique aquatic resource Excellent. Comparable with the best situations without human distur-bance.
B Highly valued aquatic resource Good. Good fishery for important gamefish species; species richness may be below expectations for stream size or geographic region.
C Moderate aquatic resource Fair. Fishery consists predominantly of bullheads (Ictalurus spp.), sunfish (Lepomis spp.), and carp (Cyprinus carpio). Species diversity and number of intolerant fish reduced. Trophic structure skewed with increased frequency of omnivores, green sunfish, or tolerant species.
D Limited aquatic resource Poor. Fishery predominantly for carp; fish community dominated by omnivores and tolerant species. Intolerant macroinvertebrates rare or absent; moderate, facultative and tolerant organisms dominate benthic community. Species richness may be notably lower than expected for geographic area, stream size, or available habitat.
E Restricted aquatic resource Very Poor. Few fish of any species present; no sport fishery exists. Intolerant macronivertebrates absent; benthic community consists of essentially tolerant species or no aquatic life may be present. Species richness may be restricted to a few oligochaete or chironomid taxa.
Table 9. Summary of Biological Stream Characterization (BSC) of the Des Plaines, Fox, and Kankakee River Basins in Illinois
[Stream miles are shown outside the parentheses, numbers within the parentheses are percentages of the total miles in the basin]
River basinStream class
Total milesA B C D E
Des Plaines 10.2 (1.3) 53.8 (6.7) 254.2 (32) 444 (56) 35.5 (4) 797.7Fox 16.4 (2.4) 221.9 (32.9) 381.6 (56.6) 54.9(8.1) 0 (0) 674.8Kankakee 0 (0) 362.2 (74) 127.5 (26) 0 (0) 0 (0) 489.7
(Carassius auratus), rainbow trout (Oncorhynchus mykiss), brown trout (Salmo trutta), white perch (Morone americana), rudd (Scardinius erythrophthalmus), oriental weatherfish (Misgurnus anguillicaudatus), and round goby (Smith, 1979; Fago, 1984; Page and others, 1992; Sparks and Lerc-zak, 1993; Steingraeber and others, 1997). The common carp was introduced into the United States over 100 years ago. Today, common carp is one of the most abundant fish in many streams. Common carp is considered a pest because it disturbs habitat by stirring up the stream bottom,
which uproots aquatic vegetation and increases turbidity. Goldfish, similar to common carp, are extremely tolerant and can be the most abundant fish species where habitat and water-chemistry conditions are severely degraded.
Rainbow trout and brown trout are intentionally stocked in streams in the upper Fox River Basin in Wisconsin and in the Little Kankakee River Basin in Indiana (Robertson, 1979; Fago, 1984). These basins contain streams that are able to support stocked trout because water temperatures remain relatively cool during summer.
Several additional nonindig-enous fish have either recently arrived in the UIRB or have the potential to enter the basin. The round goby (Neogobius melanostomus), tubenose goby (Proterorhinus marmoratus), and the ruffe (Gymnocephalus cernuus) have become established in the Great Lakes and have access to the UIRB through the Chicago Waterways. The round goby, a native of Eurasia, was collected from the Little Calumet River in 1996 (Steingraeber and others, 1997). The round goby has deci-mated populations of mottled sculpin (Cottus bairdi) in the
Hydrologic Characteristics 45

St. Clair River near Detroit, Michi-gan (Jude and Crawford, 1995). Breeding populations of the grass carp (Ctenopharyngodon idella) and bighead carp (Hypophthal-michthys nobilis) are found down-stream from the UIRB but may invade UIRB rivers and eventually the Great Lakes (Florida Caribbean Science Center, 1998).
The zebra mussel (Dreissena polymorpha) invaded the UIRB from Lake Michigan in 1991 and has spread throughout the Missis-sippi River Basin (Neves and others, 1996). Zebra mussels can attach to almost any hard surface, and populations can reach densities of greater than 2,000,000 per acre, threatening native mussel species and fouling water pipes.
Other nonindigenous species are of concern in the
46 Environmental Setting of the Upper Illinois
UIRB. The zooplankter (Daphnia lumholtzi), a type of water flea, moved upriver from the Missis-sippi Basin and has become established in the Illinois River. The behaviorally aggressive rusty crayfish (Orconectes rusticus), which first appeared in Illinois in 1973, is now found in all UIRB drainages and has displaced native crayfish species (Taylor and Red-mer, 1996). In many UIRB wet-lands, purple loosestrife and glossy buckthorn, two plant species originally from northern Europe, have spread rapidly and also have displaced native plants (Illinois Department of Energy and Natural Resources, 1994).
Threatened and Endangered Species
A number of aquatic species of the UIRB are listed by the indi-
River Basin and Implications for Water Quality
vidual States or by the Federal government as endangered, threat-ened, of special concern, or extirpated. These species include fish such as the river redhorse (Moxostoma carinatum) and greater redhorse (Moxostoma valenciennesi), mollusks such as the snuffbox (Epioblasma trique-tra) and sheepnose (Plethobasus cyphyus), and a Federally endan-gered insect—the Hine’s emerald dragonfly (Somatochlora hineana) (Illinois Department of Energy and Natural Resources, 1994). Nine-teen fish species that historically were found in the UIRB are listed as threatened or endangered by Illinois, Indiana, or Wisconsin (table 10). The river redhorse and greater redhorse are listed by all three States as threatened, endangered, or of special concern
Table 10. Historically recorded fish species found in the upper Illinois River Basin that are listed as threatened, endangered, or of special concern by the States of Illinois, Indiana, or Wisconsin
[Upper Illinois River Basin distribution records from Smith (1979), Becker (1983), Lee and others (1980) and Kwak (1991); E, endangered; --, not applicable T, threatened; SC, special concern]
Scientific name Common nameListed by
Illinois1 Indiana2 Wisconsin3
Acipenser fulvescens Lake sturgeon E E --
Etheostoma exile Iowa darter E -- --
Fundulus diaphanus Banded killifish -- T --
Fundulus dispar Starhead topminnow -- -- E
Ichthyomyzon fossor Northern brook lamprey E -- --
Lepomis megalotis Longear sunfish -- -- T
Lepomis punctatus Spotted sunfish T -- --
Luxilus chrysocephalus Striped shiner -- -- E
Lythrurus umbratilis Redfin shiner -- -- T
Moxostoma carinatum River redhorse T SC T
Moxostoma valencien-nesi
Greater redhorse E E T
Notropis amblops Bigeye chub E -- --
Notropis amnis Pallid shiner E -- E
Notropis anogenus Pugnose shiner E -- T
Notropis boops Bigeye shiner E -- --
Notropis chalybaeus Ironcolor shiner T -- --
Notropis heterodon Blackchin shiner T -- --
Notropis heterolepis Blacknose shiner E -- --
Notropis texanus Weed shiner E -- --
1Illinois listings from http://www.inhs.uiuc.edu/cbd/main/TnE/fishte.html

(table 10). Lists of threatened and endangered species can change as a result of new distribu-tional and life history information. The most up-to-date information can be accessed using the Internet (Illinois Natural History Survey, 1998; Indiana Department of Natural Resources, 1998; Wisconsin Department of Natural Resources, 1998; U.S. Fish and Wildlife Service, 1998).
Ground Water
Aquifers in the UIRB are associated with the Quaternary, Silurian-Devonian, and Cambrian-Ordovician stratigraphic systems. Surficial or unconsolidated aquifers are in the Quaternary system, whereas bedrock or consolidated aquifers are in the Silurian-Devonian or Cambrian-Ordovician systems (Friedel, 1998). Regional ground-water flow is affected by geology and, in the UIRB, is generally from west to east; intermediate and local flow is spatially variable throughout the basin (Friedel, 1998).
Surficial Aquifers
Surficial aquifers are composed of the unconsolidated Quaternary glacial deposits that overlie the bedrock in the basin (fig. 8). These deposits form one of the most productive aquifers in the UIRB and mainly consist of sand, and sand and gravel. Before water suppliers began using Lake Michi-gan water, the surficial aquifers supplied approximately 10 percent of the water for the urban Chicago area and almost 85 percent of the water for the rural areas in the southeastern part of the basin. Since that time, the importance of the surficial aquifers has increased.
Some Chicago suburbs are grow-ing into areas that are too far away to efficiently utilize Lake Michigan water; therefore, the ground water in surficial aquifers is under ever increasing demand (Fitzpatrick and others, 1992). Trilinear plots of water-chemistry data from Illinois indicate that the chemical composition of water from the unconsolidated aquifers is predominately calcium bicar-bonate. Where unconsolidated material may be in contact with underlying shale, the chemical composition is predominately calcium sulfate.
Bedrock Aquifers
The Cambrian-Ordovician aquifer is the oldest and deepest aquifer underlying the UIRB (fig. 22). This aquifer consists of numerous alternating layers of sandstone, limestone, and dolo-mite. On a regional scale, each of the layers of Cambrian and Ordovician strata are hydraulically interconnected and act as a single aquifer (Visocky and others, 1985).
The Mount Simon Sand-stone, Elmhurst Sandstone Member of the Eau Claire Forma-tion, and Ironton and Galesville Sandstones (Willman and others, 1975) of the Cambrian system are important sources of freshwater north of the Kankakee River. The Mount Simon aquifer is composed of the Mount Simon Sandstone and the Elmhurst Member of the Eau Claire Formation. Ground water in this aquifer occurs under leaky artesian conditions because of the overlying relatively confin-ing siltstone and shale beds of the Eau Claire Formation (Walton and Csallany, 1962).
The Prairie du Chien Series and Galena-Platteville
Group of Ordovician age overlie the Cambrian system and yield small to moderate quantities of water. Where directly underlying drift, solution activity of water has enlarged openings in the dolomite of the Galena-Platteville Group, allowing water to flow more freely (Walton and Csallany, 1962).
The Maquoketa Shale is a confining unit of the Cambrian-Ordovician aquifer. Localized areas of recharge from the shallow, surficial aquifers to the deeper bedrock aquifers suggest that the Maquoketa Shale may not completely confine the Cambrian-Ordovician aquifer (Michael Friedel, U.S. Geological Survey, written, commun., 1998).
Dolomites and limestones of Silurian and Devonian age constitute one of the principal shallow-bedrock aquifers in the UIRB (fig. 22). The Silurian-Devonian aquifer is the uppermost bedrock aquifer and is primarily overlain by unconsolidated glacial deposits. Although the Devonian is absent throughout most of Illinois and Wisconsin, the name “Silurian-Devonian” will be used for comparisons and consistency.
Historically, the Silurian-Devonian aquifer has been heavily pumped in the basin. Pumping of the aquifer has resulted in slowly degrading water quality because heavily mineralized water has migrated upward from the deeper parts of the Elmhurst and Mount Simon sandstones (Visocky, 1997), and water has locally migrated downward from uncon-solidated aquifers (Mike Friedel, U.S. Geological Survey, written commun., 1998). Trilinear plots of water chemistry data from Illinois indicate that the chemical
Hydrologic Characteristics 47

4
Figure 22. Uppermost bedrock aquifers in the upper Illinois River Basin (from U.S. Geological Survey, 1998).
8 Environmental Setting of the Upper Illinois River Basin and Implications for Water Quality
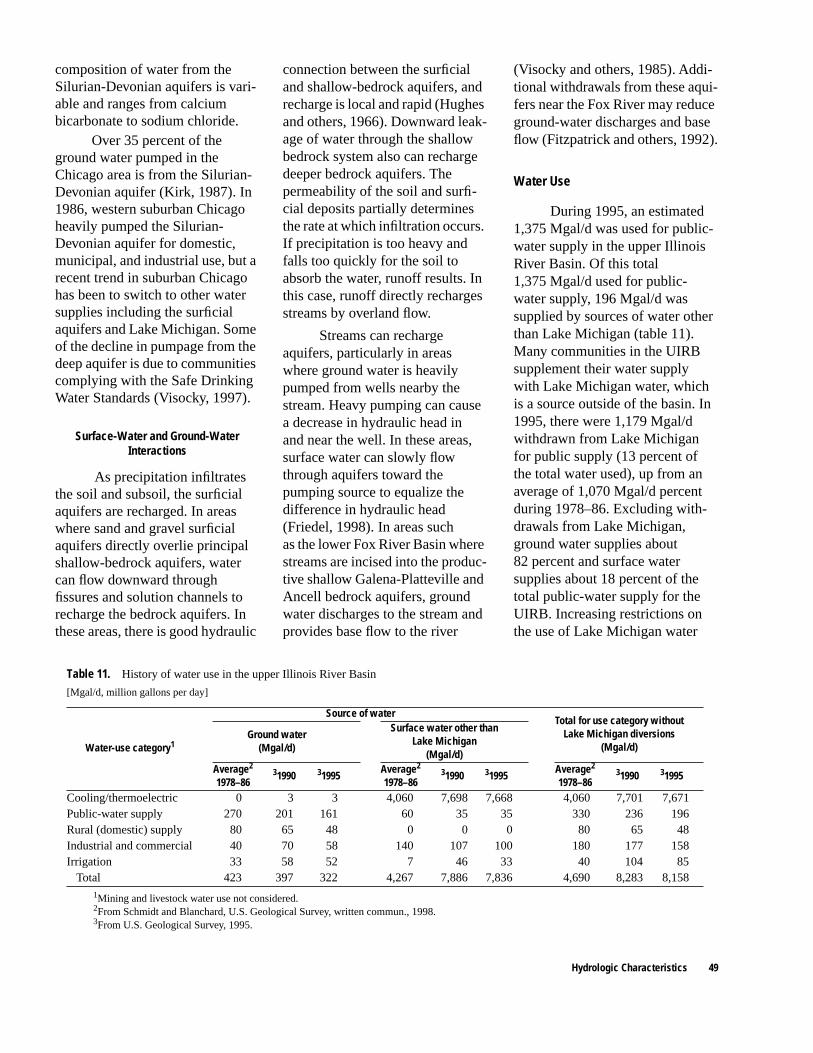
composition of water from the Silurian-Devonian aquifers is vari-able and ranges from calcium bicarbonate to sodium chloride.
Over 35 percent of the ground water pumped in the Chicago area is from the Silurian-Devonian aquifer (Kirk, 1987). In 1986, western suburban Chicago heavily pumped the Silurian-Devonian aquifer for domestic, municipal, and industrial use, but a recent trend in suburban Chicago has been to switch to other water supplies including the surficial aquifers and Lake Michigan. Some of the decline in pumpage from the deep aquifer is due to communities complying with the Safe Drinking Water Standards (Visocky, 1997).
Surface-Water and Ground-Water Interactions
As precipitation infiltrates the soil and subsoil, the surficial aquifers are recharged. In areas where sand and gravel surficial aquifers directly overlie principal shallow-bedrock aquifers, water can flow downward through fissures and solution channels to recharge the bedrock aquifers. In these areas, there is good hydraulic
connection between the surficial and shallow-bedrock aquifers, and recharge is local and rapid (Hughes and others, 1966). Downward leak-age of water through the shallow bedrock system also can recharge deeper bedrock aquifers. The permeability of the soil and surfi-cial deposits partially determines the rate at which infiltration occurs. If precipitation is too heavy and falls too quickly for the soil to absorb the water, runoff results. In this case, runoff directly recharges streams by overland flow.
Streams can recharge aquifers, particularly in areas where ground water is heavily pumped from wells nearby the stream. Heavy pumping can cause a decrease in hydraulic head in and near the well. In these areas, surface water can slowly flow through aquifers toward the pumping source to equalize the difference in hydraulic head (Friedel, 1998). In areas such as the lower Fox River Basin where streams are incised into the produc-tive shallow Galena-Platteville and Ancell bedrock aquifers, ground water discharges to the stream and provides base flow to the river
(Visocky and others, 1985). Addi-tional withdrawals from these aqui-fers near the Fox River may reduce ground-water discharges and base flow (Fitzpatrick and others, 1992).
Water Use
During 1995, an estimated 1,375 Mgal/d was used for public-water supply in the upper Illinois River Basin. Of this total 1,375 Mgal/d used for public-water supply, 196 Mgal/d was supplied by sources of water other than Lake Michigan (table 11). Many communities in the UIRB supplement their water supply with Lake Michigan water, which is a source outside of the basin. In 1995, there were 1,179 Mgal/d withdrawn from Lake Michigan for public supply (13 percent of the total water used), up from an average of 1,070 Mgal/d percent during 1978–86. Excluding with-drawals from Lake Michigan, ground water supplies about 82 percent and surface water supplies about 18 percent of the total public-water supply for the UIRB. Increasing restrictions on the use of Lake Michigan water
Table 11. History of water use in the upper Illinois River Basin
[Mgal/d, million gallons per day]
Water-use category1
1Mining and livestock water use not considered.
Source of waterTotal for use category without
Lake Michigan diversions(Mgal/d)
Ground water(Mgal/d)
Surface water other thanLake Michigan
(Mgal/d)Average2
1978–86
2From Schmidt and Blanchard, U.S. Geological Survey, written commun., 1998.
31990
3From U.S. Geological Survey, 1995.
31995Average2
1978–8631990 31995
Average2
1978–8631990 31995
Cooling/thermoelectric 0 3 3 4,060 7,698 7,668 4,060 7,701 7,671Public-water supply 270 201 161 60 35 35 330 236 196Rural (domestic) supply 80 65 48 0 0 0 80 65 48Industrial and commercial 40 70 58 140 107 100 180 177 158Irrigation 33 58 52 7 46 33 40 104 85
Total 423 397 322 4,267 7,886 7,836 4,690 8,283 8,158
Hydrologic Characteristics 49

indicate that more ground water may be utilized in the future.
Thermoelectric power generation is the single largest use of water in the basin. In 1995, water used to cool electric power generating equipment accounted for 94 percent of the water with-drawn from all sources inside the UIRB. Surface water from inside the UIRB provided almost 100 percent of the water used for this purpose in 1995; less than 1 percent of the water was supplied by ground-water resources (U.S. Geological Survey, 1995).
When all water-supply sources, including Lake Michigan, are considered, ground water accounted for 19 percent and surface water accounted for 81 percent of all water used in 1995 for public and domestic supply, commercial, industrial, mining, livestock, and irrigation in the UIRB. Excluding Lake Michi-gan water, the percentages increase to 64 percent for ground water and decrease to 36 percent for surface water (U.S. Geological Survey, 1995).
In 1995, an estimated total of 329 Mgal/d, including water used for thermoelectric, was with-drawn from ground-water sources inside the basin (53 percent from surficial aquifers and 47 percent from bedrock aquifers). These percentages indicate that the amount of ground water used from these two aquifer types is similar and substantiates the decrease in water used from bedrock aquifers and the consequent increase in water used from the surficial aquifers. McHenry County, west of Chicago, relies totally on the surficial sand and gravel aquifer for its water supply. Continued
50 Environmental Setting of the Upper Illinois
urban expansion of Chicago is likely to increase the total urban use of the surficial aquifer in the near future. In general, there has been a major decline in water use from bedrock aquifers in the UIRB since 1986, but there has been an increase in withdrawals from surfi-cial aquifers.
Forty-one percent of the surface water supplied from within the basin is used for indus-try; in contrast, only 14 percent of ground water is used for industry. Forty-nine percent of ground water supplied from within the basin is used for public drinking water; in contrast, only 19 percent of the surface water is used for this purpose. A large proportion of surface- and ground-water supply is used for irrigation, 18 percent and 16 percent, respectively (fig. 23).
IMPLICATIONS OF ENVIRONMENTALSETTING FOR WATER QUALITY
Study Area Stratification by Natural and Human Factors
The quantity and quality of surface waters in the UIRB prior to settlement were undoubtedly much different than at present. Vast areas of wetlands have been drained for agriculture and urban develop-ment; Chicago, one of the Nation’s largest metropolitan areas, has developed and continues to grow rapidly; the flow of the Chicago River has been reversed; and water diversions from Lake Michigan have been added.
The effect of natural and human factors on surface- and ground-water quantity and quality
River Basin and Implications for Water Quality
is one of the many topics studied by scientists in the NAWQA program (Hirsch and others, 1988). Previous sections of this report describe the natural and human factors that make up the general environmental setting of the upper Illinois River Basin. Important natural factors in the UIRB include bedrock geol-ogy, physiography and surficial geology, soils, vegetation, and climate. Important human factors in the UIRB include land use, urbanization, and hydrologic modifications.
In an attempt to isolate the effects of the natural and human factors that are thought to be most important in affecting water quan-tity and quality, an environmental framework called “stratification” was established for the UIRB. This stratification was accom-plished by overlaying thematic maps of human and natural envi-ronmental factors. A similar approach has been used by other NAWQA study units. Two stratification schemes were developed—one for surface-water and one for ground-water sampling designs. Using the resulting strati-fication schemes, the study area can be divided into subunits with similar natural characteristics and land use.
Surface-water stratification for the UIRB was based primarily on physiography (fig. 10), with further subdivisions based on surfi-cial geology (fig. 8) and associated soil permeability (fig. 13), and land use/land cover (fig. 16) and associated population density. This stratification, termed level-3 because of the three basic factors used, resulted in 13 subunits of the UIRB: four in the Wheaton Morainal Plain; one in the Chicago Lake Plain; three in the

PUBLIC, 19%
COMMERCIAL, 14%
DOMESTIC, 0%
INDUSTRIAL, 41%
MINING, 7%
LIVESTOCK, 1%
Surface-wateruse
Estimated total without thermoelectric andLake Michigan is
181 million gallons per day
IRRIGATION, 18%
PUBLIC, 49%
COMMERCIAL, 4%
DOMESTIC, 15%
INDUSTRIAL, 14%
MINING, LESS THAN 0.2%
LIVESTOCK, 2%
Ground-wateruse
Estimated total without thermoelectric andLake Michigan is
327 million gallons per dayIRRIGATION, 16%
Figure 23. Surface- and ground-water use in the upper Illinois River Basin, 1995 (U.S. Geological Survey, 1995).
Implications of Environmental Setting for Water Quality 51

Bloomington Ridged Plain; four in the Kankakee Till Plain; and one in the Steuben Morainal Lake Area (fig. 24). Major surface-water issues, mainly related to differ-ences in urban and agricultural land use, in the UIRB will be examined within the stratification scheme. Surface-water issues related to urbanization include point and nonpoint sources of sediment, nutrients, trace elements, and organic compounds; stream-flow alterations; and the health and community structure of aquatic biota. Surface-water issues related to agriculture include nonpoint sources of sediment, nutrients, trace elements, and pesticides; drainage modifications; and the health and community structure of aquatic biota.
Ground-water stratification was similar to the surface-water stratification but also included bedrock geology (fig. 4A). The ground-water stratification, termed level-4 because of the four basic factors used, was preliminary and resulted in 23 subunits: six in the Wheaton Morainal Plain, one in the Chicago Lake Plain, eight in the Bloomington Ridged Plain, seven in the Kankakee Till Plain; and one in the Steuben Morainal Lake Area. Major ground-water issues in the UIRB will be examined within the stratification scheme (fig. 25). Ground-water-quality assessments will be conducted where surficial sand, and sand and gravel aquifers overlie principal bedrock aquifers. The surficial aquifers being assessed are those aquifers that underlie areas transitioning from agricultural to urban land use and that overlie the carbonate Silurian-Devonian aquifer in the Great Lakes physiographic section (Wheaton Morainal Plain), and
52 Environmental Setting of the Upper Illinois
those aquifers that underlie agricultural land use and overlie the carbonate Silurian-Devonian aquifer in the Till Plains physio-graphic section (Kankakee Till Plain) (fig. 25).
Surface Water and Aquatic Biota
Historical and ongoing urban land-use practices have resulted in a continuing problem of nonpoint and point source contam-ination of streambed sediment and aquatic biota. In addition to point sources, constituents from urban nonpoint runoff may be derived from residues from gasoline, motor oil, tires, brake linings, galvanized metal, nails, building materials, painted surfaces, pesticides, and fertilizers (Moore and Ramamoor-thy, 1984; Striegl and Cowan, 1987; Leed and Belanger, 1981; Kelly and Hite, 1981, 1984). For example, streambed sediments from several urban streams of the UIRB exceeded USEPA National Sediment Inventory reference levels for trace elements (Cd, Cr, Hg, Ni, Pb, Zn) and synthetic organic compounds (heptachlor epoxide, polychlorinated byphe-nols (PCB’s), chlordane, dichloro-diphenyl-trichloroethane (p,p’-DDT), dichloro-diphenyl-dichloroethane (p,p’-DDD), and dichloro-diphenyl-dichloroethyl-ene (p,p’-DDE) (Fitzpatrick and others, 1995; Sullivan and others, 1998; U.S. Environmental Protec-tion Agency, 1994). These refer-ence levels were selected to represent concentrations above which might be an appreciable threat to either aquatic life or human health. The USEPA also identified four urban subbasins in the UIRB (out of 96 nationwide) as
River Basin and Implications for Water Quality
Areas of Probable Concern (APC’s), on the basis of the National Sediment Inventory data (U.S. Environmental Protec-tion Agency, 1997a). The UIRB subbasins identified as APC’s are the Little Calumet, Chicago, Des Plaines, and upper Fox Rivers. Synergistic effects of these constituents on aquatic biota also are of concern because correla-tions were found among trace organic compounds and Cr, Cu, Hg, and Zn in streambed sediment. Concentrations of p,p’-DDE, chlordane, and dieldrin in whole fish from some sites in the UIRB exceeded various guidelines for protection of fish and fish-consuming wildlife and humans (Sullivan and others, 1998). Concentrations in whole fish from sites on the Des Plaines and Illinois Rivers in and down-stream from Chicago exceeded U.S. Food and Drug Administra-tion fish flesh consumption advisory levels for PCB’s (Sullivan and others, 1998).
The effects of the continued expansion of Chicago suburbs into the Fox and upper Des Plaines River Basins (fig. 17) has raised several issues, including the poten-tial for accelerated erosion and channel instability, increased flooding, increased nonpoint sources of contaminants, and further loss of aquatic habitat and biological integrity. Physical changes in streamflow and channel characteristics are primarily the result of increases in the amount of impervious surface in the drainage basin, which also has a direct effect on biological commu-nities (Schueler, 1995).
Large navigational and hydroelectric dams are located on the Illinois, Fox, Des Plaines, and
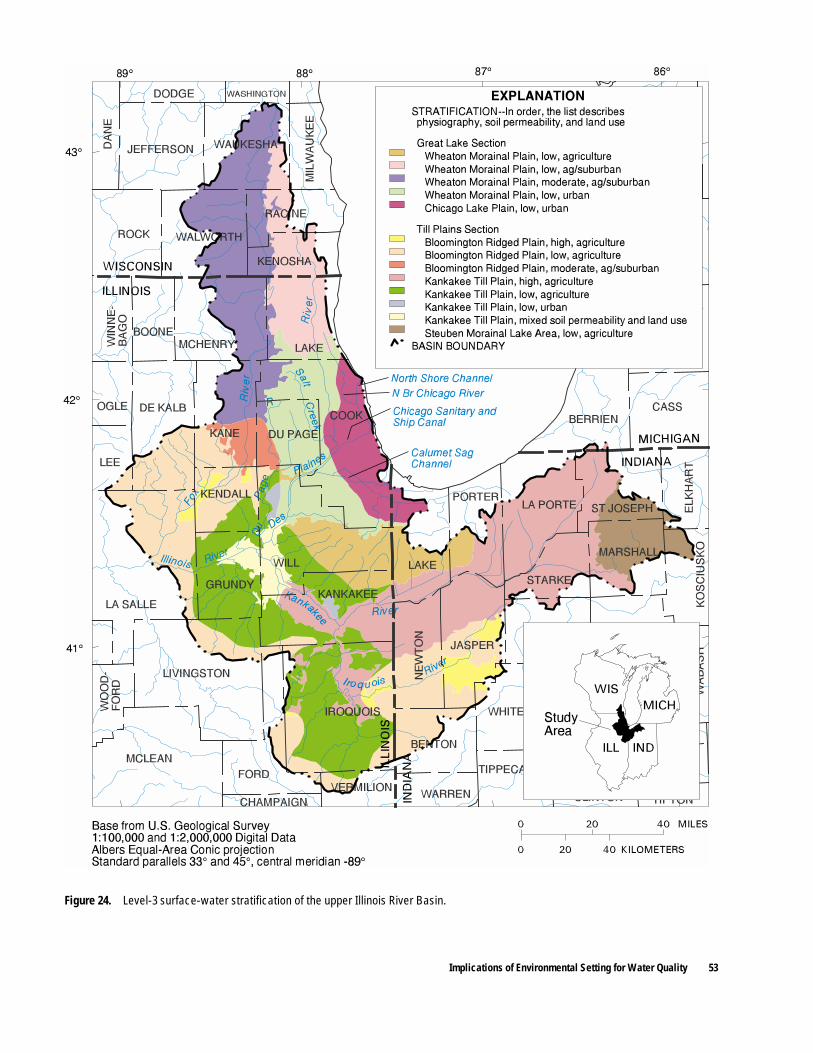
Figure 24. Level-3 surface-water stratification of the upper Illinois River Basin.
Implications of Environmental Setting for Water Quality 53
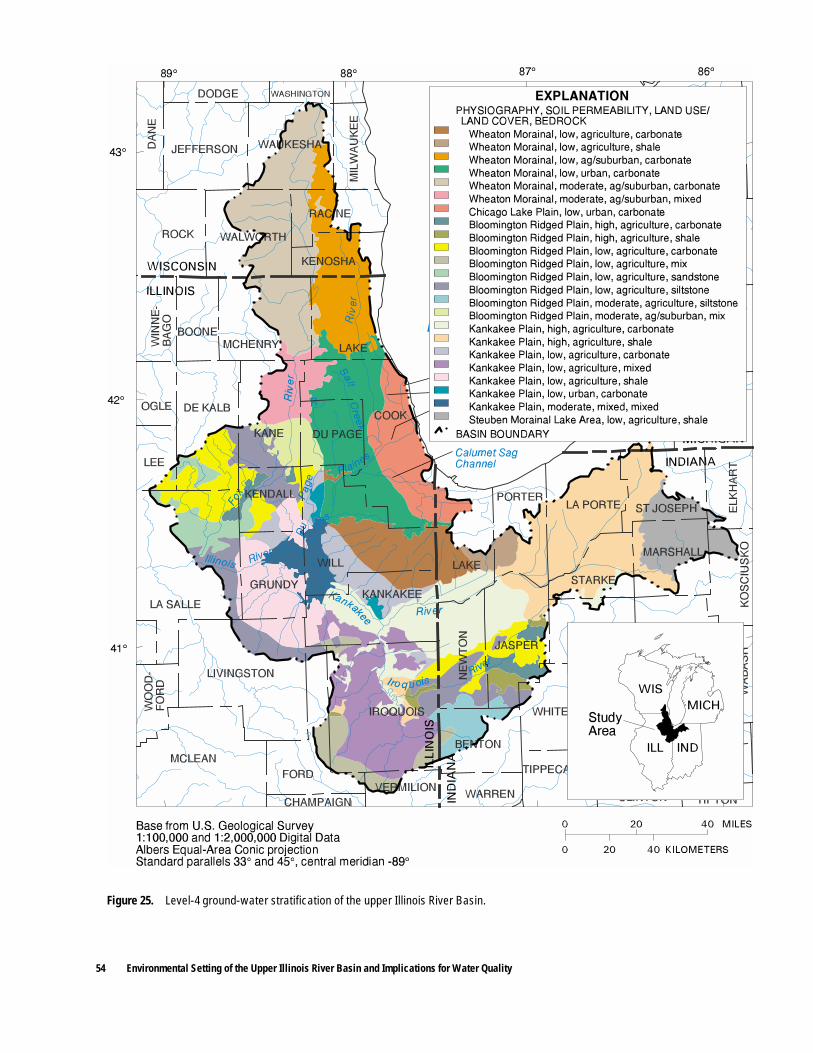
Figure 25. Level-4 ground-water stratification of the upper Illinois River Basin.
54 Environmental Setting of the Upper Illinois River Basin and Implications for Water Quality

Kankakee Rivers. These dams cause unnatural variations in streamflow characteristics and accumulations of fine-grained sediment upstream from the dam (U.S. Army Corps of Engineers, Chicago District, 1987). In addi-tion, fish migrations are restricted by dams, and mussels are affected by sedimentation and by decreases in fish hosts critical to their repro-duction.
The effects of agricultural activities on water quality in the UIRB has included changes to hydrologic conditions caused by drainage of wetlands, channel-ization of streams, and reduction of riparian vegetation. These changes have resulted in increased loads of suspended sediment to streams and associated turbidity caused by runoff from farm fields (fig. 21). Increased sedimentation and water turbidity reduces the food supply for fish (Bellrose and others, 1977), decreases the visibility needed by sight predators to find food, and interferes with reproduc-tive activities (Sparks and Lerczak, 1993). In addition, disruption of the natural hydrologic regime may exacerbate these problems by affecting spawning and rearing habitats associated with backwater lakes along the lower Illinois River. The INHS is currently conducting research that focuses on character-izing relations between hydrologic regime and fish-community composition in the UIRB (Sparks, 1984; Illinois Natural History Survey, oral commun., 1998).
Elevated arsenic concentra-tions in sediment, fish, and clams in the Kankakee River Basin above the confluence of the Iroquois River (Coleman and Sanzolone, 1991; Fitzpatrick and others, 1995) may be related to multiple and
interacting natural and human factors. Agricultural use of arsenical-based chemicals (for example, cacodylic acid) is a potential source; however, elevated arsenic concentrations were not found in the Iroquois River Basin, which is more inten-sively farmed than the Kankakee River Basin. Highly permeable soils (fig. 13) in the Kankakee River Basin generally require more irrigation than the fine-grained soils of the Iroquois River Basin. Shallow ground water used for irrigation in the Kankakee River Basin generally is enriched in arsenic and may contribute arsenic to streams in that basin (John Winters, Indiana Department of Environmental Management, oral commun., 1992). Weathering of shale bedrock in the region is a potential source of arsenic to ground water (Yarling, 1992; Fenelon and others, 1995).
The effect of channelization on aquatic ecosystems was discussed earlier in this report. Loss of habitat because of channel-ization, drainage of wetlands, and clearance of riparian vegetation has altered the characteristics of the streams in agricultural areas. The extent of these changes is unknown because agricultural activities began before water-quality conditions were docu-mented.
Ground Water
Ground-water issues in the UIRB include water levels and water quality. Heavy withdrawals in the Chicago area beginning about 1950 caused water levels in the Cambrian-Ordovician aquifer to decline by more than 1,000 ft (Sasman and others, 1982). The
Implications
effect of water-level declines were noticed as far away as Wisconsin. In 1980, the western Chicago suburbs began switching their water source to Lake Michigan or more shallow bedrock and surficial aquifers, which reduced ground-water withdrawals closer to natural recharge rates (Visocky, 1997). At the current pumpage rate, water levels are expected to recover as much as 650 ft by 2010 (Illinois Department of Energy and Natural Resources and the Nature of Illinois Foundation, 1994).
The water quality of the Silurian-Devonian aquifer is more likely to be affected by increased urbanization than the Cambrian-Ordovician aquifer. The Cambrian-Ordovician aquifer is confined by the Maquoketa Shale and is deeper than the Silurian-Devonian aquifer. Because of this relation, urbaniza-tion probably would not affect the Cambrian-Ordovician aquifer as much as it might affect the Silurian-Devonian aquifer. Volatile organic compounds (VOC’s) have been detected in water supplies of communities that pump water from the Silurian-Devonian aquifer. In 1994, there was an increase in the amount of VOC and other synthetic organics detected, although the number of wells with VOC detections did not increase (Illinois Environmental Protection Agency, 1994). In addition, water-quality data indi-cate that the Cambrian-Ordovician aquifer contains concentrations of naturally occurring radium and barium in excess of standards set by USEPA (U.S. Environmental Protection Agency, 1975).
Arsenic in ground water in the UIRB may be considered a problem at a regional scale. Yarling (1992) found arsenic
of Environmental Setting for Water Quality 55
concentrations in ground water near Wakarusa, Indiana (Elkhart County), that were above the USEPA maximum contaminant level (50 ug/L). These high arsenic concentrations were detected in ground water from the deep lower Mahomet aquifer, which is composed of unconsoli-dated quaternary deposits. Yarling (1992) concluded that the high arsenic concentrations were probably related to chemical weathering of black shales in the area. Extensive areas of these same shale bedrock types are present in parts of the Kankakee River Basin and in east-central Illinois. These shales include the Antrim, New Albany, and Ellsworth Shales (fig. 4B), and they are generally black, enriched in metal content, and were deposited in strongly reducing conditions. Glaciers deposited black shale fragments in proglacial outwash and tills in northern Indiana. A study of aqui-fers in the St. Joseph River Basin near South Bend, Indiana (immedi-ately adjacent to the headwaters of the Kankakee Basin), showed that arsenic concentrations in the deep aquifer were significantly higher than in the shallow aquifer (Fenelon and others,1995). These higher concentrations were attrib-uted to chemical weathering of shale in the aquifer. In Illinois, Holm and Curtiss (1988) also found high arsenic concentrations in ground water. A study conducted by Warner (U.S. Geological Sur-vey, written commun.,1998) in the LIRB NAWQA study unit found arsenic concentrations above the USEPA maximum contaminant level in some wells in the deep Mahomet aquifer, a major water resource in east-central Illinois. Elevated arsenic concentrations are
56 Environmental Setting of the Upper Illinois
present in streambed sediment and ground-water discharge areas.
SUMMARY
The U.S. Geological Survey’s National Water-Quality Assessment (NAWQA) program was established, in part, to assess the status and trends of the Nation’s water quality. The program objec-tives are accomplished through study units that encompass areas that represent a large part of the Nation’s surface- and ground-water resources. The upper Illinois River Basin (UIRB) study of the NAWQA program that began in 1996 is an assessment of surface- and ground-water quality and biology. An environmental frame-work of human and natural factors is used to describe the similarities and differences in the hydrologic characteristics of the UIRB.
The UIRB drains a 10,949 mi2 area upstream from Ottawa, Illinois, in northeastern Illinois, northwestern Indiana, and southeastern Wisconsin. The following major subbasins are within the UIRB: Kankakee River, Iroquois River, Fox River, Des Plaines River, Chicago River, and Illinois River.
The Silurian-Devonian limestones and dolomites form the principal shallow bedrock aquifer. The underlying Cambrian-Ordovician sandstone forms the dominant deep bedrock aquifer. Ground-water levels in the deep bedrock aquifer have changed over time. In 1986, western suburban Chicago heavily pumped the aqui-fer for domestic, municipal and industrial use, but a recent trend of suburban Chicago has been to switch to other water supplies such
River Basin and Implications for Water Quality
as those of shallow aquifers and Lake Michigan.
The UIRB lies in the Central Lowlands physiographic province which is subdivided into two physiographic sections: the Great Lake Section and the Till Plains Section. The subdivisions of these two sections are based on the geomorphology of the landforms in the basin, which are mostly a result of Wisconsinan glaciation. The surficial unconsolidated sand and gravel deposits form the major surficial aquifers in the UIRB. Surficial deposits are the parent material of most of the soils in the basin.
The climate of the UIRB is humid continental and large daily fluctuations in temperature and precipitation can result throughout the basin. The normalized average annual temperature for the UIRB (1961–90) ranged from 46° F in the northern part of the basin to 51° F in the southern part of the basin. Average annual precipitation for the period 1961–90 ranged from 32 in. to 38 in.
Most of the UIRB is in the Central Corn Belt Plains ecore-gion. Parts of the upper Fox and upper reaches of the Des Plaines River Basins are classified in the Southeastern Wisconsin Till Plains ecoregion. The upper reaches of the Kankakee River Basin are classified as Southern Michigan/Northern Indiana Till Plains ecoregion.
The UIRB contains Chicago, Illinois, one of the largest metro-politan areas in the United States. Urban areas around Chicago have been expanding into previously agricultural and forested areas. Subbasins within the UIRB that are mainly affected by urban expan-sion from the Chicago area include
the Des Plaines, Du Page, and Fox River Basins. The primary crops grown in the agricultural areas of the basin are corn and soybeans.
Five major changes in the upper Illinois River Basin have altered the quality of surface waters. These changes are construction of navigable water-ways, diversion of Lake Michigan water, construction of wastewater-treatment plants, drainage of wetlands, and agricultural activities. Results of historical water-quality data analysis indicate that the primary factor affecting water quality in the UIRB is land use. Distinct chemical signatures are found in streams that drain urban land compared with streams that drain agricultural land.
Aquatic biota is affected by the glacial history of the UIRB, land use, manmade modifications to water bodies and streams, and invasion of nonidigenous species. One of the consequences of past glaciation is that aquatic fauna of the UIRB has relatively few endemic species. The original aquatic communities of the UIRB were diverse and productive. During the last 150 years, aquatic communities of the UIRB have been significantly affected by human activities.
In an attempt to isolate the effects of the natural and human factors that are thought to have the most effect on water quantity and quality, an environmental frame-work called “stratification” was established for the UIRB. The stratification scheme divides the study area into subunits with simi-lar natural characteristics and land use, and will be used during the UIRB study to design a framework for where to collect water and biology samples.
Surface-water issues related to urbanization include point and nonpoint sources of sediment, nutrients, trace elements, and organic compounds; streamflow alterations; and the health and community structure of aquatic biota. Surface-water issues related to agriculture include nonpoint sources of sediment, nutrients, trace elements, and pesticides; drainage modifications; and the health and community structure of aquatic biota. Ground-water issues include declining water levels and degraded water quality, and elevated arsenic concentra-tions in ground water.
REFERENCES CITED
Anderson, J.R., Hardy, E.E., and Roach, J.T., 1976, A land use and land cover classification system for use with remote sensor data: U.S. Geological Survey Profes-sional Paper 964, 28 p.
Battaglin, W.A., and Goolsby, D.A., 1995, Spatial data in geographic information system format on agricultural chemical use, land use, and cropping practices in the United States: U.S. Geological Survey, Water-Resources Investi-gations Report 94–4176, 87 p.
Becker, George C., 1983, Fishes of Wisconsin: Madison, Wisc., University of Wisconsin Press, 1052 p.
Bellrose, F.C., 1976, Ducks, geese, and swans of North America: A completely new and expanded version of the classic work by F.H. Kortwright (2d ed.): Harrisburg, Pa., Stackpole Books, 543 p.
Bellrose, F.C., Sparks, R.E., Paveglio, F.L., Jr., Steffeck, D.W., Thomas, R.C., Weaver, R.A., and Moll, D., 1977, Fish and wildlife habitat changes resulting from the
construction of a nine-foot navigation channel in the Illinois Waterway from La Grange Lock and Dam upstream to Lockport Lock and Dam: Chicago, U.S. Army Corps of Engineers District, 150 p.
Bertrand, W.A., 1984, Des Plaines River Basin fisheries assessment: Illinois Department of Conserva-tion, Division of Fish and Wild-life Resources, 43 p.
Bertrand, W.A., Hite, R.L., and Day, D.M., 1996, Biological stream characterization (BSC) - biological assessment of Illinois stream quality through 1993: Illinois Environmental Protection Agency Division of Water Pollu-tion Control, IEPA/BOW/96-058, 44 p.
Burr, B.M., 1991, The fishes of Illinois: An overview of a dynamic fauna: Bulletin of the Illinois Natural History Survey 34, p. 417–427.
Burr, Brooks M., and Page, Lawrence M., 1986, Zoogeography of fishes of the lower Ohio - upper Mississippi Basin, in Charles H. Hocutt (ed.) The Zoogeography of North American Freshwater Fishes: New York, John Wiley and Sons, p. 287–324.
Changnon, S.A., Jr., 1968, Precipita-tion climatology of Lake Michi-gan Basin: Illinois State Water Survey, Bulletin 92, 46 p.
City of Chicago and Illinois Environ-mental Protection Agency, 1989, Lake Michigan water quality report, 1987: City of Chicago and Illinois Environmental Protection Agency Cooperative Report, p. 140.
Cohn, T.A., DeLong, L.L., Gilroy, E.J., Hirsch, R.M., and Wells, D.K., 1989, Estimating constituent loads: Water Resources Research, v. 25, no. 5, p. 937–942.
Colman, J.A., and Sanzolone, R.F., 1991, Surface-water-quality assessment of the upper Illinois River Basin in Illinois, Indiana,
References Cited 57
and Wisconsin—Geochemical data for fine-fraction streambed sediment from high- and low-order streams, 1987: U.S. Geological Survey Open-File Report 90–571, 108 p.
Conzen, M.P., and Morales, M.J., 1989, Settling the upper Illinois valley—patterns of changes in the I & M Canal corridor, 1830–1900 in Studies on the Illinois and Michigan Canal Corridor No. 3: Chicago, University of Chicago Committee on Geographical Studies, 171 p.
Dennison, Samuel G., Sedita, Salvador J., Zenz, David R., Tata, Prakasam, and Lue-Hing, Cecil, 1997, Fish populations in Chicago’s waterways benefit from improved wastewater collection and treatment prac-tices: Proceedings of WEFTEC ‘97, 70th Annual Conference and Exposition of the Water Environ-ment Federation, v. 7, p. 449–457.
Espey, W.J., Jr., Barnes, H.H., Jr., and Svein, Vigander, 1981, Lake Michigan diversion—Findings of the technical commit-tee for review of diversion flow measurements and accounting procedures: Chicago, U.S. Army Corps of Engineers, 138 p.
Fago, Don, 1984, Distribution and relative abundance of fishes in Wisconsin: Wisconsin Depart-ment of Natural Resources Technical Bulletin No. 147, 128 p.
Fegeas, R.G., Claire, R.W., Guptill, S.C., Anderson, K.E., and Hallam, C.A., 1983, Land use and land cover digital data, USGS Digital Cartographic Data Stan-dards: U.S. Geological Survey Circular 895-E, 21 p.
Fehrenbacher, J.B., Alexander, J.D., Jansen, I.J., Darmody, R.G., Pope, R.A., Flock, M.A., Voss, E.E., Scott, J.W., Andrews, W.F., and Bushue, L.J., 1984, Soils of Illinois: University of Illinois, College of Agricul-
58 Environmental Setting of the Upper Illinois
ture, Agricultural Experiment Station, and U.S. Department of Agriculture, Soil Conservation Service, 85 p.
Fenelon, J.M., Bobay, K.E., and others, 1994, Hydrogeologic atlas of aquifers in Indiana: U.S. Geological Survey Water-Resources Investigations Report 92–4142, 197 p.
Fenelon, J.M., Bayless, E.R., and Watson, L.R., 1995, Ground-water quality in northeastern St. Joseph County, Indiana: U.S. Geological Survey Water-Resources Investigations Report 95–4092, 50 p.
Fenneman, N.M., 1938, Physiography of the eastern United States: New York, McGraw-Hill Book Co., 714 p.
Finley, R.W., 1976, Original vegeta-tion cover of Wisconsin: compiled from U.S. General Land Office notes, scale 1:500,000.
Fitzpatrick, F.A., Larson, T.H., McFadden, S.S., and Gilkeson, R.H., 1992, Hydrogeo-logic environments along the Fox River Valley in Kane County, Illinois: Illinois State Geological Survey Open-File Series 1992–6, 24 p.
Fitzpatrick, F.A., Scudder, B.C., Crawford, J.K., Schmidt, A.R., Sieverling, J.B, and others, 1995, Water-quality assessment of the upper Illinois River Basin in Illinois, Indiana, and Wiscon-sin—Major and trace elements in water, sediment, and biota, 1978–1990: U.S. Geological Survey Water-Resources Investigations Report 95–4045, 254 p.
Fitzpatrick-Lins, K., 1980, The accu-racy of selected land use and land cover maps at scales of 1:250,000 and 1:100,000: U.S. Geological Survey Circular 829, 24 p.
Florida Caribbean Science Center, 1998, Nonindigenous aquatic species: U.S. Geological Survey, from URL http://nas.nfrcg.gov/
River Basin and Implications for Water Quality
nas.htm, accessed September 28, 1998, HTML format
Forbes, S.A., and Richardson, R.E., 1913, Studies on the biology of the upper Illinois: Illinois State Natural History Survey Bulletin, v. 9, p. 481–573.
Forbes, S.A., and Richardson, R.E., 1919, Some recent changes in Illinois River biology: Illinois State Natural History Survey Bulletin, v. 13, p. 139–156.
Friedel, M.J., 1998, National water-quality assessment program—Upper Illinois River Basin: U.S. Geological Survey Fact Sheet 072–98, 4 p.
Gilbert, Carter R., 1980, Zoogeo-graphic factors in relation to biological monitoring of fish, in Hocutt, C.H. and J.R. Stauffer, eds., Biological Monitoring of Fish: Lexington, Ky, Lexington Books, p. 309–355.
Gilliom, R.J., Alley, W.M., and Gurtz, M.E., 1995, Design of the National water-quality assess-ment program—Occurrence and distribution of water-quality conditions: U.S. Geological Survey Circular 1112, 33 p.
Gray, H.H., comp., 1989, Quaternary geologic map of Indiana: Indiana Geological Survey, scale 1:500,000.
Gray, H.H., Ault, C.H., and Keller, S.J., comps., 1987, Bedrock geologic map of Indiana: Indiana Geological Survey, scale 1:500,000.
Hansel, A.K., and Johnson, W.H., 1996, Wedron and Mason groups: Lithostratigraphic reclassifica-tion of deposits of the Wisconsin episode, Lake Michigan lobe area: Illinois State Geological Survey Bulletin 104, p. 11.
Hirsch, R.M., Alley, W.M., and Wilber, W.G., 1988, Concepts for a national water-quality Assessment Program: U.S. Geological Survey Circular 1021, 42 p.
Hitt, K.J., 1992, Digital map file of 1990 population and housing

data for census of population and housing, 1990: U.S. Geological Survey, unpublished digital data.
Hitt, K.J., 1995, Refining 1970’s land- use data with 1990 population data to indicate new residential development: U.S. Geological Survey Water-Resources Investi-gations Report 94–4250, 15 p.
Holm, T.R., and Curtiss, C.D., III, 1988, Arsenic contamination in east-central Illinois ground waters: Final report to the Illinois Department of Energy and Natu-ral Resources: Champaign, Ill., Illinois State Water Survey, Aquatic Chemistry Section, Report ILENR/RE-WR-88/16, 74 p.
Horsley, A.D., 1986, Illinois—A Geography: Boulder, Colo., Westview Press, Inc., 218 p.
Hughes, G.M., Kraatz, Paul, and Landon, R.A., 1966, Bedrock aquifers of northeastern Illinois: Illinois State Water Survey Circular 406, 15 p.
Illinois Department of Energy and Natural Resources, 1994, The changing Illinois environ-ment: critical trends: technical report of the critical trends assessment project: v. 3, ILENR/RE-EA-94-05(3), 242 p.
Illinois Department of Energy and Natural Resources and The Nature of Illinois Foundation, 1994, The changing Illinois envi-ronment: critical trends: execu-tive summary of the critical trends assessment project: Springfield, Ill., Illinois Depart-ment of Energy and Natural Resources, [4] p.
Illinois Department of Public Works and Buildings, 1969, Report for recreational development–Illinois River backwater areas: Springfield, Ill., Division of Waterways, 100 p.
Illinois Environmental Protection Agency, 1987, An intensive survey of the Fox River Basin from the Wisconsin State line to Ottawa, Illinois, 1982: Division
of Water Pollution Control, IEPA/WPC/88-003, 95 p.
———1988a, An intensive survey of the Des Plaines River basin from the Wisconsin State line to Joliet, Illinois, 1983–84: Division of Water Pollution Control, IEPA/WPC/88-014, 95 p.
———1988b, An intensive survey of the Du Page River Basin-1983: Division of Water Pollution Control, IEPA/WPC/88-010, 61 p.
———1994, Illinois water quality report 1992–1993: Springfield, Ill., Illinois Environmental Protection Agency Bureau of Water, v. 1, IEPA/WPC/94-160, 89 p.
———1996a, Illinois water quality report, 1994–1995: Springfield, Ill., Illinois Environmental Protection Agency, Bureau of Water Report 96–060a, v. 1, 240 p.
———1996b, Illinois water quality report, 1994–1995: Springfield, Ill., Illinois Environmental Protection Agency, Bureau of Water Report 96-060b, v. 2, 182 p.
———1996c, The condition of Illinois water resources, 1972–1996: Illinois Environmen-tal Protection Agency, Bureau of Water Report 96–067, 8 p.
Illinois Natural History Survey, 1998, State of Illinois Endangered and Threatened Fish: Illinois Natural History Survey, from URL http://www.inhs.uiuc.edu/cbd/main/TnE/fishte.html, accessed October 26, 1998, HTML format
Illinois State Geological Survey, 1973, Pleistocene glaciations in Illinois: Illinois State Geological Survey, Educational Extension Publica-tions, 10 p., 5 maps (revised 1988)
———1991, Point locations of active or abandoned coal mines as of 1-1-91: Illinois State Geological Survey, digital data.
Indiana Department of Natural Resources, 1998, Indiana’s Endangered Wildlife: Indiana Department of Natural Resources, from URL http://www.state.in.us/dnr/fish-wild/nongame/fish.htm, accessed October 26, 1998, HTML format
Ivens, J.L., Bhowmik, N.G., Brigham, A.R., and Gross, D.L., 1981, The Kankakee River yes-terday and today: Illinois Depart-ment of Energy and Natural Resources, Illinois State Water Survey Miscellaneous Publica-tion 60, 24 p.
Jackson, Donald A., and Harvey, Harold H., 1989, Biogeographic associations in fish assemblages - local vs. regional processes: Ecology, v. 70, no. 5, p. 1472–1484.
Jude, D.J., and Crawford, G., 1995, Impact and expansion of the latest exotic fish invaders, the tubenose and round gobies: East Lansing, Mich., Proceedings of the 38th Conference of the Inter-national Association of Great Lakes Research, p. 61.
Karr, J.R., 1995, Protecting aquatic ecosystems: Clean water is not enough, in Davis, W.S., and Simon, T.P., eds., Biological assessment and criteria: tools for water resource planning and decision making: Boca Raton, Lewis Publishers, p. 7–13.
Karr, J.R., Fausch, K.D., Angermeier, P.L., Yant, P.R., and Schlosser, I.J. 1986, Assessing biological integrity in running waters; a method and its ratio-nale: Champaign, Ill., Illinois Natural History Survey, Illinois Natural History Survey Special Publication Number 5, 28 p.
Kelly, M.H., and Hite, R.L., 1981, Chemical analysis of surficial sediments from 63 Illinois lakes, summer, 1979: Illinois Environ-mental Protection Agency, Investigations of Illinois Surface Waters, 92 p.
References Cited 59

———1984, Evaluation of Illinois stream sediment data, 1974–1980: Illinois Environmental Protection Agency, Division of Water Pollution Control, IEPA/WPC/84-004, 103 p.
Kirk, J.R., 1987, Water withdrawals in Illinois, 1986: Illinois State Water Survey Circular 167, 43 p.
Küchler, A.W., 1964, Potential natural vegetation of the conterminous United States: New York, Ameri-can Geographical Society Special Publication No. 36.
Kwak, T.J., 1991, Ecological charac-teristics of a northern population of the pallid shiner: Transactions of the American Fisheries Soci-ety, v. 120, no. 1, p. 106–115.
Lanfear, K.J., 1993, 1980 point population coverage for the conterminous United States: U.S. Geological Survey, unpublished digital data
Lee, David S., Gilbert, Carter R., Hocutt, Charles H., Jenkins, Robert E., McAllister, Don E., and Stauffer, Jay R. Jr., 1980, Atlas of North American Freshwater Fish: Publication #1980-12 of the North Carolina Biological Survey, 867 p.
Leed, J.A., and Belanger, T.V., 1981, Selected trace metals in the upper St. Johns River and their land use relationships: Florida Scientist, v. 44, no. 3, p. 136–150.
Leighton, M.M., Ekblaw, G.E., and Horberg, C.L., 1948, Physio-graphic divisions of Illinois: Illinois State Geological Survey Report of Investigation 129, 19 p.
Lineback, J.A., Bleuer, N.K., Mickelson, D.M., Farrand, W.R., and Goldthwait, R.P., comps., 1983, Quaternary geologic map of the Chicago 4°x6° quadrangle, United States: U.S. Geological Survey Miscellaneous Investiga-tions Series Map I-420 (NK-16), 1:1,000,000
Lyons, J., Cochran, P.A., and Sneen, M.E., 1997, Taxonomic status and distribution of the
60 Environmental Setting of the Upper Illinois
lamprey Ichthyomyzon cf. gagei: American Midland Naturalist, v. 138, no. 1, p. 69.
Mades, D.M., 1987, Surface-water-quality assessment of the upper Illinois River Basin in Illinois, Indiana, and Wisconsin—Project description: U.S. Geological Survey Open-File Report 87–473, 35 p.
Mayer, H.M., and Wade, R.C., 1969, Chicago—Growth of a Metropo-lis: Chicago, University of Chicago Press, 510 p.
Metropolitan Sanitary District of Greater Chicago, 1982, Annual report of the maintenance and operations department—1982: Chicago, 151 p.
Meyer, A.H., 1936, The Kankakee “marsh” of northern Indiana and Illinois: Papers of the Michigan Academy of Science Arts and Letters, v. 21, p. 359–396.
Mickelson, D.M., Clayton, L., Baker, R.W., Mode, W.N., Schneider, A.F., 1984, Pleis-tocene stratigraphic units of Wisconsin: Wisconsin Geology and Natural History Survey, Miscellaneous Paper 84-1, 82 p.
Midewin National Tallgrass Prairie, 1998, Midewin National Tallgrass Prairie—a gift to future generations: Midewin National Tallgrass Prairie, from URLhttp://www.fs.fed.us/mntp, accessed August 31, 1998, HTML format
Mills, H.B., Starrett, W.C., and Bellrose, F.C., 1966, Man’s effect on the fish and wildlife of the Illinois River: Illinois Natural History Survey Biological Notes No. 57, 24 p.
Mitsch, W.J., and Gosselink, J.G., 1993, Wetlands (Second ed.): New York, Van Nostrand Reinhold, 722 p.
Moore, J.W., and Ramamoorthy, S., 1984, Heavy metals in natural waters: New York, Springer-Verlag, 268 p.
Muller, R.A., and Oberlander, T.M., 1984, Physical geography
River Basin and Implications for Water Quality
today—portrait of a planet (3rd ed.): New York, Random House, 591 p.
National Oceanic and Atmospheric Administration, 1995, Monthly station normals of temperature, precipitation, and heating and cooling degree days 1961–1990—Climatology of the United States No. 81: National Oceanic and Atmospheric Administration, National Climatic Data Center, digital data, variously paged.
Neves, R.J., Gatenby, C., and Parker, B., 1996, The exotic zebra mussel in North America: A dire prognosis for native freshwater mussels (Unionidae): Journal of Shellfish Research, v. 15, no. 2, p. 486.
Omernik, J.M., 1987, Ecoregions of the conterminous United States: Annals of the Association of American Geographers, v. 77, no. 1, p. 118–125.
Omernik, J.M., and Gallant, A.L., 1988, Ecoregions of the Upper Midwest States: U.S. Environ-mental Protection Agency, Envi-ronmental Research Laboratory EPA/600/3-88/037, September. 56 p. plus map.
Page, L.M., Cummings, K.S., Mayer, C.A., Post, S.L., and Retzer, M.E., 1992, Biologically signifi-cant Illinois streams—an evalua-tion of the streams of Illinois based on aquatic biodiversity: Illinois Natural History Survey Center for Biodiversity Technical Report, v. 1992, no. 1, 485 p.
Piskin, K., and Bergstrom, R.E., 1975, Glacial drift in Illinois—thick-ness and character: Illinois State Geological Survey, Circular 490, 35 p., 2 plates.
Reznicek, A.A., 1994, The disjunct coastal plain flora in the Great Lakes region: Biological Conser-vation, v. 68, no. 3, p. 203–215.
Richardson, R.E., 1928, The bottom fauna of the middle Illinois River, 1913–1925—Its distribution, abundance, valuation, and index value in the study of stream

pollution: Illinois State Natural History Survey, v. 7, no. 2, p. 189–192.
Robertson, Robert, 1979, Water qual-ity and species composition of the Little Kankakee River, LaPorte County, July 26–27, 1979: India-napolis, Ind., Report of Indiana Department of Natural Resources, 12 p.
Ruhl, P.M., 1995, Surface-water-quality assessment of the upper Illinois River Basin in Illinois, Indiana, and Wisconsin—Analysis of relations between fish-community structure and environmental conditions in the Fox, Des Plaines, and Du Page River basins in Illinois: U.S. Geo-logical Survey Water-Resources Investigations Report 94–4094, 50 p.
Sasman, R.T., Benson, C.R., Ludwig, R.S., Williams, T.L., 1982, Water-level trends, pump-age, and chemical quality in the deep sandstone wells in Northern Illinois: Illinois State Water Survey, Circular 154, 64 p.
Schmidt, A.R., and Blanchard, S.F., 1997, Surface-water-quality assessment of the upper Illinois River Basin in Illinois, Indiana, and Wisconsin—Results of investigations through April 1992: U.S. Geological Survey Water-Resources Investigations Report 96–4223, 63 p.
Schneider, A.F., 1966, Physiography: The Indiana Sesquicentennial Volume, Natural Features of Indiana, Indiana Academy of Science, State Library, Indianap-olis, Indiana, ? p. (reprinted [n.d.], Indiana Geological Survey, p. 15)
Schodek, Daniel L., 1987, Landmarks in American Civil Engineering: Cambridge, Mass., MIT Press, 383 p.
Schueler, T., 1995, The importance of imperviousness: Watershed Protection Techniques, v. 1, no. 3, p. 100–111.
Seaber, P.R., Kapinos, F.P., and Knapp, G.L., 1984, State hydrologic unit maps: U.S. Geological Survey Open-File Report 84–708, p. 7–8
Simon, T.P., 1992, New ichthyofaunal records for the Calumet, Kanka-kee, and Iroquois drainages of Indiana: Proceedings of the Indiana Academy of Sciences, v. 101, no. 3–4, p. 279–291.
Smith, P.W., 1971, Illinois streams—A classification based on their fishes and an analysis of factors responsible for the disappearance of native species: Illinois Natural History Survey Biological Note, v. 76, p. 1–14.
Smith, P.W., 1979, The fishes of Illinois: Champaign, Ill., Univer-sity of Illinois Press, 314 p.
Smith, R.A., Alexander, R.B., and Wolman, M.G., 1987, Water-quality trends in the Nation’s rivers: Science, v. 235, p. 1607–1615.
Soller, D.R., 1998, Map showing the thickness and character of Quaternary sediments in the glaciated United States east of the Rocky Mountains—total thickness of quaternary sedi-ments: U.S. Geological Survey Digital Data Series DDS-38, digital data.
Sparks, R.E., 1984, The role of contaminants in the decline of the Illinois River—Implications for the upper Mississippi, in Weiner, J.G., Anderson, R.V., and McConville, D.R., eds., Contami-nants in the upper Mississippi River: Boston, Mass., Butter-worth Publishers, p. 25–66.
Sparks, Richard E. and Lerczak, Thomas V., 1993, Recent trends in the Illinois River indicated by fish populations: Havana, Illinois, Illinois Natural History Survey River Research Labora-tory of the Forbes Biological Station, November, 1993, 34 p.
Sparks, R.E., and Starrett, W.C., 1975, An electrofishing survey of the Illinois River, 1959-1974: Illinois
Natural History Survey Bulletin No. 31, p. 317–380.
Starrett, W.C., 1971, A survey of the mussels (Unionacea) of the Illinois River—A polluted stream: Illinois Natural History Survey Bulletin, v. 30, article 5, p. 267–403.
Steffeck, Donald W., and Striegl, Robert G., 1989, An inventory and evaluation of biological investigations that relate to stream-water quality in the upper Illinois River basin of Illinois, Indiana, and Wisconsin: U.S. Geological Survey Water-Resources Investigations Report 89–4041, 54 p.
Steingraeber, M.T., Runstrom, A.L., and Thiel, P.A., 1997, Round Goby (Neogobius melanostro-mus) distribution in the Illinois waterway system of metropolitan Chicago, in: Jensen, D.A., ed., International Symposium on Biology and Management of Ruffe Symposium Abstracts, Ann Arbor, Michigan (USA), Mar., 1997, p. 52.
Striegl, R.G., and Cowan, E.A., 1987, Relations between quality of urban runoff and quality of Lake Ellyn at Glen Ellyn, Illinois: U.S. Geological Survey Water-Supply Paper 2301, 59 p.
Sugden, D.E., and John, B.S., 1976, Glaciers and Landscape: London, Edward Arnold publisher, p. 134
Sullivan, D.J., Stinson, T.W., Crawford, J.K., and Schmidt, A.R., and Colman, J.A., 1998, Surface-water quality assessment of the upper Illinois River basin in Illinois, Indiana, and Wiscon-sin—Pesticides and other synthetic organic compounds in water, sediment, and biota, 1975–1990: U.S. Geological Survey Water-Resources Investigations Report 96–4135, 131 p.
Sullivan, J., [n.d.], Chicago Wilder-ness, an atlas of biodiversity, 64 p.
References Cited 61

Taylor, C.A., and Redmer, M., 1996, Dispersal of the crayfish Orconectes rusticus in Illinois, with note on species displace-ment and habitat preference: Journal of Crayfish Biology, v. 16, no. 3, p. 547–551.
Terrio, P.J., 1994, Relations of changes in wastewater-treatment practices to changes in stream-water quality during 1978-88 in the Chicago area, Illinois, and impli-cations for regional and national water-quality assessments: U.S. Geological Survey Water-Resources Investigations Report 93–4188, 56 p.
———1995, Water-quality assess-ment of the upper Illinois River Basin in Illinois, Indiana, and Wisconsin—Nutrients, dissolved oxygen, and fecal-indicator bacteria in surface water, April 1987 through August 1990: U.S. Geological Survey Water-Resources Investigations Report 95–4005, 79 p.
U.S. Army Corps of Engineers, Chicago District, 1987, Charts of the Illinois waterway from the Mississippi River at Grafton, Illinois, to Lake Michigan at Chicago and Calumet Harbors: U.S. Government Printing Office 1987–743–672, 77 p.
U.S. Bureau of the Census, 1991, Census of population and housing, 1990—Public law 94–171 data, Washington D.C., U.S. Bureau of the Census.
U.S. Department of Agriculture, Soil Conservation Service, 1994, State Soil Geographic (STATSGO) data base: U.S. Department of Agriculture, Soil Conservation Service, digital data.
U.S. Environmental Protection Agency, 1975, National priority drinking water regula-tions: Federal Register, Dec. 24, 1975, v. 40, 248 p.
U.S. Environmental Protection Agency, 1979, Construction grants program for municipal
62 Environmental Setting of the Upper Illinois
wastewater treatment works: Washington, D.C., MCD-03, variously paged.
U.S. Environmental Protection Agency, 1989, 1988 Needs survey report to Congress— Assessment of needed publicly owned wastewater-treatment plants in the United States: Washington, D.C., Office of Municipal Pollution Control, Report EPA 430/09S-89-001, 31 p. plus appendixes.
U.S. Environmental Protection Agency, 1994, The National Sediment Inventory:—prelimi-nary evaluation of sediment chemistry data, Volume 1, Approach and national results: USEPA, Office of Science and Technology, Standards and Applied Science Division, 63 p. plus appendixes.
U.S. Environmental Protection Agency, 1997a, The incidence and severity of sediment contam-ination in surface waters of the United States, Volume 1— National sediment quality survey: U.S. Environmental Protection Agency Report 823-R-97-006, variously paged.
———1997b, USEPA regulated facil-ities point locations from Enviro-facts for conterminous US: U.S. Environmental Protection Agency, digital data.
U.S. Fish and Wildlife Service, 1998, Endangered species: U.S. Fish and Wildlife Service, from URL http://www.fws.gov/r3pao/eco_serv/endangrd/index.html, accessed October 26, 1998, HTML format
U.S. Geological Survey, 1970, The national atlas of the United States of America: U.S. Geological Survey, 417 p.
U.S. Geological Survey, 1991, National water summary 1988-89—Hydrologic events and floods and droughts: U.S. Geological Survey Water-Supply Paper 2375, 591 p.
River Basin and Implications for Water Quality
U.S. Geological Survey, 1995, Water use in the United States: U.S. Geological Survey from, URL http://water.usgs.gov/pub-lic/watuse, accessed October 3, 1998, HTML format
U.S. Geological Survey, [n.d.], Digital Elevation Model—30-arc second: U.S. Geological Survey, digital data.
U.S. Geological Survey, 1998, Ground water atlas of the United States: U.S. Geological Survey, from URL http://www-capp.er.usgs.gov/publicdocs/gwa/index.html, accessed December 4, 1998, HTML format.
Visocky, A.P., Sherrill, M.G., and Cartwright, Keros, 1985, Geol-ogy, hydrology, and water quality of the Cambrian and Ordovician systems in northern Illinois: Illinois State Geological Survey, Cooperative Ground Water Report 10, 136 p.
Visocky, Adrian P., 1997, Water-Level Trends and Pumpage in the Deep Bedrock Aquifers in the Chicago Region, 1991–1995: Illinois State Water Survey Circular 182, 45 p.
Walton, W.C., and Csallany, Sandor, 1962, Yields of deep sandstone aquifers in Northern Illinois: Illinois State Water Survey, 47 p.
Warner, K.L., 1998, Water-Quality Assessment of the Lower Illinois River Basin: Environmental Setting: U.S. Geological Survey Water-Resources Investigations Report 97–4165, 50 p.
Willman, H., Atherton, E., Buschbach, T., Collinson, C., Frye, J., Hopkins, M., Lineback, J., and Simon, J., 1975, Handbook of Illinois Stratigra-phy: Illinois State Geological Survey Bulletin 95, 261 p.
Willman, H.B., and Frye, J.C., 1970, Pleistocene Stratigraphy of Illinois, Illinois State Geological Survey Bulletin 94, 204 p.
Wisconsin Department of Natural Resources, 1998, Endangered and threatened species informa-

tion: Wisconsin Department of Natural Resources, from URLhttp://www.dnr.state.wi.us/org/land/er/factsheets/etindex.htm, accessed October 26, 1998, HTML format.
Wisconsin Geological and Natural History Survey, 1981, Bedrock
Geology of Wisconsin (revised 1995): Madison, Wisc., Wisconsin Geological and Natural History Survey, scale unknown.
Yarling, Michael, 1992, Anomalous concentrations of arsenic in the ground water at Wakarusa,
Indiana—a byproduct of chemical weathering of shales: Indiana Department of Environ-mental Management, 11 p.
References Cited 63


APPENDIX


APPENDIX 1. BIBLIOGRAPHY OF U.S. GEOLOGICAL SURVEY REPORTS FROM THE UPPER ILLINOIS RIVER BASIN PILOT STUDY OF THE NATIONAL WATER-QUALITY ASSESSMENT PROGRAM
Colman, J.A., and Sanzolone, R.F., 1991, Surface-water-quality assessment of the upper Illinois River Basin in Illinois, Indiana, and Wisconsin: Geochemical data for fine-fraction streambed sediment from high- and low-order streams, 1987: U.S. Geological Survey Open-File Report 90–571, 108 p.
Fitzpatrick, F.A., and Colman, J.A., 1993, Surface-water-quality assessment of the upper Illinois River Basin in Illinois, Indiana, and Wisconsin: Data on manmade nonagricultural volatile and semivolatile organic chemicals in water, May 1988 through March 1990: U.S. Geological Survey Open-File Report 92–467, 70 p.
Fitzpatrick, F.A., Scudder, B.C., Crawford, J.K., Schmidt, A.R., Sieverling, J.B., and others, 1995, Water-quality assessment of the upper Illinois River Basin in Illinois, Indiana, and Wisconsin: Major and trace elements in water, sediment, and biota, 1978–90: U.S. Geological Survey Water-Resources Investigations Report 95–4045, 254 p.
Mades, D.M., 1987, Surface-water-quality assessment of the upper Illinois River Basin in Illinois, Indiana, and Wisconsin: Project description: U.S. Geological Survey Open-File Report 87–473, 35 p.
Marron, D.C., and Blanchard, S.F., 1995, Surface-water-quality assessment of the upper Illinois River Basin in Illinois, Indiana, and Wisconsin: Cross-sectional and depth variation of water-quality constituents and properties in the upper Illinois River Basin, 1987–88: U.S. Geological Survey Water-Resources Investigations Report 95–4021, 19 p.
Ruhl, P.M., 1995, Surface-water-quality assessment of the upper Illinois River Basin in Illinois, Indiana, and Wisconsin: Analysis of relations between fish-community structure and environmental conditions in the Fox, Des Plaines, and Du Page River Basins in Illinois 1982–84: U.S. Geological Survey Water-Resources Investigations Report 94–4094, 50 p.
Schmidt, A.R., and Blanchard, S.F., 1997, Surface-water-quality assessment of the upper Illinois River Basin in Illinois, Indiana, and Wisconsin—Results of investigations through April 1992: U.S. Geological Survey Water-Resources Investigations Report 96–4223, 63 p.
Steffeck, D.W., and Striegl, R.G., 1989, An inventory and evalua-tion of biological investigations that relate to stream-water quality in the upper Illinois River Basin of Illinois, Indiana, and Wisconsin: U.S. Geological Survey Water-Resources Investigations Report 89–4041, 54 p.
Sullivan, D.J., and Blanchard, S.F., 1994, Surface-water-quality assessment of the upper Illinois River Basin in Illinois, Indiana, and Wisconsin: Fixed-station network and selected water-quality data for April 1987–August 1990: U.S. Geological Survey Open-File Report 91–175, 213 p.
Sullivan, D.J., and Terrio, P.J., 1994, Surface-water-quality assessment of the upper Illinois River Basin in Illinois, Indiana, and Wisconsin: Data on agricultural organic compounds, nutrients, and sediment in water, 1988–90: U.S. Geological Survey Open-File Report 93–421, 61 p.
Sullivan, D.J., Stinson, T.W., Crawford, J.K., and Schmidt, A.R., 1998, Surface-water-quality assessment of the upper Illinois River Basin in Illinois, Indiana, and Wisconsin—Pesticides and other synthetic organic compounds in water, sediment, and biota, 1975–90 with a section on Historical conditions by John A. Colman: U.S. Geological Survey Water-Resources Investigations Report 96–4135, 131 p.
Terrio, P.J., 1994, Relations of changes in wastewater-treatment practices to changes in stream-water quality during 1978–88 in the Chicago area, Illinois, and implications for regional and national water-quality assessments: U.S. Geological Survey Water-Resources Investigations Report 93–4188, 56 p.
Terrio, P.J., 1995, Water-quality assessment of the upper Illinois River Basin in Illinois, Indiana, and Wisconsin: Nutrients, dissolved oxygen, and fecal-indicator bacteria in surface water, April 1987 through August 1990: U.S. Geological Survey Water-Resources Investigations Report 95–4005, 79 p.
Zogorski, J.S., Blanchard, S.F., Romack, R.D., and Fitzpatrick, F.A., 1990, Availability and suitability of municipal wastewater information for use in a national water-quality assessment: A case study of the upper Illinois River Basin in Illinois, Indiana, and Wisconsin: U.S. Geological Survey Open-File Report 90–375, 68 p.
Appendix 1. 67

U.S. Geological Survey, WRD221 Broadway Ave.Urbana, Illinois 61801
Arnold and others—
ENVIRO
NM
ENTA
L SETTING
OF TH
E UPPER ILLIN
OIS RIVER B
ASIN
AN
D IM
PLICATIO
NS FO
R WATER Q
UA
LITY—U
.S. Geological Survey W
ater-Resources Investigations Report 98–4268