Embed Size (px)
Citation preview


Environmental Role of Wetlands in Headwaters

NATO Science SeriesA Series presenting the results of scientific meetings supported under the NATO ScienceProgramme.
The Series is published by IOS Press, Amsterdam, and Kluwer Academic Publishers in conjunctionwith the NATO Scientific Affairs Division
Sub-Series
I. Life and Behavioural Sciences IOS PressII. Mathematics, Physics and ChemistryIII. Computer and Systems Science IOS PressIV. Earth and Environmental Sciences
The NATO Science Series continues the series of books published formerly as the NATO ASI Series.
The NATO Science Programme offers support for collaboration in civil science between scientists ofcountries of the Euro-Atlantic Partnership Council. The types of scientific meeting generally supportedare “Advanced Study Institutes” and “Advanced Research Workshops”, and the NATO Science Seriescollects together the results of these meetings.The meetings are co-organized bij scientists from NATOcountries and scientists from NATO’s Partner countries – countries of the CIS and Central and EasternEurope.
Advanced Study Institutes are high-level tutorial courses offering in-depth study of latest advances ina field.Advanced Research Workshops are expert meetings aimed at critical assessment of a field, andidentification of directions for future action.
As a consequence of the restructuring of the NATO Science Programme in 1999, the NATO ScienceSeries was re-organized to the four sub-series noted above. Please consult the following web sites forinformation on previous volumes published in the Series.
http://www.nato.int/science
http://www.iospress.nl
Series IV: Earth and Environmental Series – Vol. 63
Springer
Springer
http://www.springer.com

Environmental Role of Wetlands inHeadwaters
edited by
Josef KrecekCzech Technical University,Prague, Czech Republic
Martin HaighOxford Brookes University,U.K.
Published in cooperation with NATO Public Diplomacy Division
and

ISBN-13 978-1-4020-4228-7 (PB)ISBN-10 1-4020-4226-4 (HB)
ISBN-10 1-4020-4227-2 (e-book) ISBN-13 978-1-4020-4227-0 (e-book)
Published by Springer,P.O. Box 17, 3300 AA Dordrecht, The Netherlands.
Printed on acid-free paper
All Rights Reserved© 2006 SpringerNo part of this work may be reproduced, stored in a retrieval system, or transmitted in anyform or by any means, electronic, mechanical, photocopying, microfilming, recording orotherwise, without written permission from the Publisher, with the exception of anymaterial supplied specifically for the purpose of being entered and executed on acomputer system, for exclusive use by the purchaser of the work
Printed in the Netherlands.
www.springer.com
A C.I.P. Catalogue record for this book is available from the Library of Congress.
ISBN-13 978-1-4020-4226-3 (HB)
Marienbad, Czech Republic
Proceedings of the NATO Advanced Research Workshop onThe Environmental Role of Wetlands
ISBN-10 1-4020-4228-0 (PB)
23--28 November 2003

CONTENTS
Preface ix
HEADWATER WETLANDS J. Krecek and M. J. Haigh
MAPPING WETLANDS IN EUROPEAN HEADWATER AREASM. L. Paracchini and J.V. Vogt
THE ROLE OF FOREST ON THE HYDROLOGY OF HEADWATER WETLANDS Y. Fukushima
ROLE OF GRASSLAND ECOSYSTEMS IN PROTECTION OF FORESTED WETLANDS J. Krecek, Z. Horicka and J. Novakova
E. Beheim
IMPACT OF HERBACEOUS VEGETATION ON RECOVERY OF
J. Novakova and J. Krecek
LEACHING OF NITROGEN FROM UPLAND FOREST-
E. Kubin
HYDROLOGY OF DISTURBED PEAT-LAND, HEADS OF THE VALLEYS, WALES M. Haigh and M. P. Kilmartin
1
7
17
49
77
87
95
REGENERATION SITES INTO WETLAND AREAS
A HARVESTED HEADWATER CATCHMENT
AFFORESTATION ON RUNOFF DYNAMICS:59Retracted: THE EFFECT OF PEAT LAND DRAINAGE AND
Consequences on Floods in the Glomma River*
*Please see Erratum after page 338.

vi
ESTIMATION OF WATER BUDGET IN THE FORESTED PEAT-LANDS OF WESTERN IRELAND R. Chandran, J.F. Collins and T. Cummins
ROLE OF THE PLANKTONIC COMUNITIES IN THE REGULATION AND INDICATION OF EUTROFICATION PROCESSES IN SHALLOW MOUNTAIN WETLANDS I. Traykov, M. Asenova, D. Slavova and B. Boyanovsky
NEW WETLAND FORMATION IN SUBSIDENCE HOLLOWS OF WESTERN DONBASS, UKRAINE I. M. Loza and N.N. Nazarenko
INTEGRATING WETLANDS INTO WATERSHED MANAGEMENT: Effectiveness of Constructed Wetlands to Reduce
Impacts from Urban Stormwater
J. Brydon, M.C. Roa , S.J. Brown and H. Schreier
DISASTERS AND CLIMATE CHANGE - THEIR RELATION WITH WETLAND HEADWATERS A. Ho evar, L. Kajfež-Bogataj and Z. repinšek
THE ALLEGHE LAKE (DOLOMITES, ITALY):Environmental Role and Sediment Management
L. Marchi, F. Michieli and G.M. Zuppi
LAND-BASED RISK PREVENTION:The Case of Pian Di Spagna, Italy
A. Valentinelli
HEADWATER RESOURCES AND HEADWATER HAZARDS: PERSPECTIVES FROM ENVIRONMENTAL EDUCATIONCase Study Galtür, Austria
A. M. Hama, A. Sansone, M. Seitz and J. Stötter
107
117
135
143
155
161
ALPINE WETLANDS FROM ECOLOGICAL NETWORK TO 173
181
Contents

vii
HYDROLOGY OF WETLANDS IN THE HEADWATERS OF GREAT AFRICAN RIVERS J. Balek
HEADWATER WETLANDS IN EASTERN AND SOUTHERN AFRICAThe Evolving Debate
A. Wood
ECONOMIC CONTRIBUTION OF HEADWATER WETLANDS:
A. Wood
THE LAKE KINNERET DRAINAGE BASIN:Headwater Discharges, Hydrology and Nutrient Dynamics in the
Hula Valley Wetland
M. Gophen
ENVIRONMENTAL CHANGE IN HEADWATER PEAT WETLANDS, UK.M. Haigh
ENVIRONMENTAL PROBLEMS OF HEADWATER WETLANDS IN HUNGARYA. Kertesz, M. Csutak and J. Tardy
HEADWATER WETLANDS IN THE CZECH REPUBLIC J. Krecek
ANALYSIS OF THE WATER BALANCE OF SMALL PÁRAMO CATCHMENTS IN SOUTH ECUADOR W. Buytaert, V. Iñiguez, R. Celleri, B. De Bièvre, G. Wyseure and J. Deckers
203
211
221
233
237
257
265
271
Contents
Experience from Western Ethiopia

viii
SUMMARY REPORTS:, Slovenia and Canada
S. Markova, A. Ho evar, K. Haponiuk-Winiczenko, N. Zeliankevich , I. Berniakovich and G. Peter Kershaw
HEADWATER AND WETLAND PROTECTION:The Italian Legal Framework
A. Valentinelli
NEXT GENERATION OF WATERSHED MANAGEMENT PROGRAMMES:Objectives and Expected Results
M. Achouri
CONCLUSION – WETLANDS IN CONTEXTM. Haigh and J. Krecek
List of Contributors 339
Index 347
283
297
301
313
Contents
Wetlands in Slovakia, Poland, Belarus
Erratum E1
PREFACE
The NATO Advanced Research Workshop (ARW) on the “Environmental
Role of Wetlands”, the second NATO –ARW organised under the umbrella of the International Association for Headwater Control (IAHC), arose from the “Nairobi Declaration for the International year of Freshwaters”. This was an outcome from the Fifth International Conference on Headwater Control,which was promoted by the United Nations University with five other UN Agencies and a cluster of NGOs including the IAHC and World Association for Soil and Water Conservation. Sincere thanks go to all involved. The Declaration responded to concerns about water supply and declining river flow in Africa and to wider concerns that the role of wetland areas, especially those in upstream areas, had been neither fully explored nor appreciated. It argued that the significance of these headwater wetlands needed more systematic examination and advocated a special workshop to focus on the role of headwater wetlands in their contexts, both biophysical and socio-economic. In fulfilment of this direction, this publication offers a multi-disciplinary, multi-functional overview of the role played by, and management problems associated with, wetlands in headwater areas. It also examines their place in future strategies of integrated watershed management. The organisers and participants of this workshop send their deep thanks and appreciation to the NATO Science Division for helping the headwater control movement achieve this goal. Thanks go also for their patient facilitation of this exploration of wetlands in context, especially their helpful support during the development, financing and delivery of this event. Sincere thanks are also due to the IAHC for their tireless engagement with the logistics of fielding the workshop and enabling participant travel and liaison with our kind hosts in the City of Marienbad and its excellent Park Hotel Golf. The IAHC support of the preparation of these proceedings is also warmly acknowledged, especially the editorial contributions of David Hardekopf. We hope that this book, the outcome of this work, the first that strives to understand wetlands in their headwater contexts, will support the sustainable management and development of watersheds around the world.
Martin Haigh and Josef KrecekTeplice, April 2005.
ix

HEADWATER WETLANDS
J. KRECEK1 and M. J. HAIGH2
1 Department of Hydrology, Czech Technical University in Prague
Prague, Czech Republic 2 Department of Geography, Oxford Brookes University,
Oxford, United Kingdom
KEYWORDS / ABSTRACT: Headwaters / wetlands / conservation / environmentally sound management / Ramsar convention / downstream impacts / surface water chemistry / global climate change /
A gulf remains between the practical concerns of environmental managers and the research interests of most academic environmental scientists. There is a scarcity of published work that integrates the wider concerns of environmental managers with academic research into the hydrological and hydro-chemical functioning of catchments at different scales. This volume is devoted to attempts by those, mainly concerned with environmental management in practice at the local and regional scale, to see the headwater wetlands in their context. The main issue addressed is- if a headwater regions contains wetland, what are the implications of this fact for environmental management and how does the wetland affect the management of the basin as a whole.
1. Introduction
Generally, wetlands are considered as lands where saturation with water is the dominant factor determining the nature of soil development and the types of plant and animal communities living in the soil and on its surface [1]. Often, their hydrological attributes have commanded pride of place in lists of functions and values [5]. Wetlands include swamps, marshes, bogs and similar areas, varying widely because of regional and local differences in soils, topography, climate, hydrology, water chemistry, vegetation, and other factors, including human disturbance [8]. Nowadays, one of the main priorities of several national water programmes is restoring and protecting wetlands recognized as important water sources [11]. In the case of the drinking water programme, the
J. Krecek and M. Haigh (eds.),
© 2006 Springer. Printed in the Netherlands.
1
Environmental Role of Wetlands in Headwaters, 1–6.

2
treatment possibilities are limited; the effort to protect quality of headwaters (sources of the water) is increasing. Therefore, ensuring not net loss of headwater wetlands will remain a basic priority, not only to meet Clean Water Act goals and requirements, but also to advance source water protection. Currently, the minimum global estimate of wetlands is considered to be 7.8 million sq. km (Conference on Parties to the Convention on Wetlands, 1999, [11]) but the number will be still increasing.
2. Ramsar Convention
Figure 1. Wetlands of International Importance in Europe: 736 Ramsar Sites.
The Convention on Wetlands, signed in Ramsar, Iran, in 1971, is an intergovernmental treaty which provides the framework for national action and international cooperation for the conservation and wise use of wetlands and their resources. There are presently 144 Contracting Parties
J. Krecek and M. J. Haigh

3
to the Convention; 1421 w etland sites, covering 123.9 million hectares, are designated in the Ramsar List of Wetlands of International Importance. Most of the Ramsar sites are lowland wetlands (floodplains). However, from the total area of wetlands (5.7 million sq. km: 6% of the Earth’s land surface) registered by the World Conservation Monitoring Centre [8], 30% are headwater peat bogs while 15% of wetlands are found on floodplains. In Europe, 736 Ramsar sites (Figure 1) were established to conserve unique example of natural or near-natural wetlands supporting extraordinary biodiversity (ecological communities and species, especially water birds or fish). Unfortunately, the biocentric approach of Ramsar conservation (even when supported by national governments) does not reflect the global problems and environmental threats (global climate change, acid atmospheric deposition etc) that headwater wetlands are facing now.
3. Headwater control
Headwater control is an integrating approach. It seeks to combine the perspectives, resolve the conflicts and satisfy the needs of all stakeholders. This book seeks to examine the special role played by headwater wetlands within the wider contexts of environmental management. These can be very significant, even when the actual area of such wetland is small, which is often the case in lower latitudes. The value of the service provided by headwater wetlands value is estimated as an economic benefit of 2.8 trillion USD/year [11]. These wetlands providing benefits in the fields of:
water supply, retention and flood mitigation control of water quality timber production wildlife and biodiversity conservation tourismcultural heritage source of aesthetic inspiration, local tradition and religion
Headwater wetlands (peat-bogs and fens) rank among the world’s ecosystems most threatened by human actions. They face the local impacts of development and land use conversion (especially drainage, forestation, over-exploitation (e.g. mining), point or non/point pollution)
Headwater Wetlands

4
and also the larger scale effects of global climatic change, air pollution, acid atmospheric deposition and so forth. Headwater peat-bogs are unique ecological communities that can be destroyed in a matter of days, but require hundreds of years to form naturally. Generally, bogs are associated with low temperatures and short growing seasons where ample precipitation and high humidity cause excessive moisture to accumulate. Therefore, most bogs are found in the northern states where they often form in old glacial lakes. They may have either considerable amounts of open water surrounded by floating vegetation or vegetation may have completely filled the lake (terrestrialisation). The sphagnum peats of northern bogs cause especially acidic waters. The result is a wetland ecosystem with a very specialized acidophile flora and fauna. These lands support many species of plants in addition to the characteristic sphagnum moss, including cotton grass, cranberry, blueberry, pine, Labrador tea, and tamarack. Moose, deer, and lynx are a few of the animals that can be found in northern bogs. Headwater fens are peat-forming wetlands that receive nutrients from sources other than precipitation: usually from upslope sources through drainage from surrounding mineral soils and from groundwater movement. Fens differ from bogs because they are less acidic and have higher nutrient levels. Fens may be dominated by woody or herbaceous vegetation.
4. Management
Although special policies may be required for the effective management of headwater wetlands, a priori, it seems likely that these strategies should be guided by the wider frameworks of headwater control. The factors that affect this book’s concern to examine wetlands in a headwater context include:
trying to achieve the sustainable use of wetlands by addressing development issues whilst minimizing environmental impacts through the:
o involvement of local communities, o limitation of forest and agriculture practices, o rehabilitation of degraded wetlands;
including headwater wetlands within integrated watershed management programmes in order to:
J. Krecek and M. J. Haigh

5
- consider their down-stream benefits and impacts, as well as their local effects in a headwater context,
- secure ethical management by building respect for local stakeholder needs and rights,
- foster a concern for sustainable environmental stewardship amongst local communities and among all environmental managers,
- build a function partnership between stakeholders (land users, landowners, enterprises, local through national legislatures, communities and NGOs, perhaps through the creation of watershed councils
5. Policy
Frequently, headwater wetlands are controlled by a fragmented system of legislature in the frame of many disparate aspects of national policy. Typically, this administrative framework is more oriented to regulating the services provided by headwater wetlands than to the well being of the headwater environments themselves. Commonly, this framework includes:
Forest Acts (protective forest stands, commercial forest production),Water Acts (protected headwater regions, streams and reservoirs of drinking water supply), Public Health Acts (hygienic buffer zones in drinking water catchments),Nature Conservation Acts (national parks, protected landscapes, nature reserves or monuments), Acts on the Environment (EIA and SEA procedures, managing spots of ecological stability)
The fact that current legislation is still based on the concept of a ministerial approach, which is not well suited to ensuring sustainable development, is a serious problem. Generally, the existing legislative is effective in the conservation of limited spots. Unfortunately, the integrating approach reflecting global aspects of environmental problems is still missing. This book is devoted to the examination of headwater wetland sin their wider context.
Headwater Wetlands

6
6. References
1. Black, P. E. (1991) Watershed Hydrology. Englewood Cliffs, NJ, Prentice Hall.
2. Frazier, S. (ed.) (1999) A Directory of Wetlands of International Importance.NHBS Environment Bookstore, Devon (UK).
3. Haigh, M.J. and J. Krecek (1991) Headwater management: problems and policies. Land Use Policy, 8: 191-205.
4. Haigh, M.J. and J. Krecek (eds.) (2000) Environmental Reconstruction in
Headwater Areas. Dordrecht, Kluwer Academic. 5. Hughes, J.M.R. and Heathwaite, A.L. (eds ) (1995) Hydrology and
Hydrochemistry of British Wetlands. Chichester, J. Wiley. 6. IPCC (2001) Climate Change. Intergovernmental Panel on Climate Change,
3rd Assessment Report. 7. Krecek, J. and Z. Horicka (2001) Degradation and recovery of mountain
watersheds in the Jizera Mountains, Czech Republic. Unasylva, 37: 247-259. 8. Niering, W. A. (1998) Wetlands. Knopf, Chicago. 9. Soulsby, C., P. Rodgers, et al. (2003) A tracer-based assessment of
hydrological pathways at different spatial scales in a mesoscale Scottish catchment. Hydrological Processes, 17: 759-777.
Ecosystems to Environmental Changes. Elsevier Science, London.11. US EPA (2004) National Water Program Guidance: fiscal year 2005. United
States Environmental Protection Agency, Office of Water.12. Welsch, D. J. (1995) Forested Wetlands: functions, benefits and the use of best
management practices. United States Department of Agriculture, NA-PR-01-95.
10. Teller, A., Mathy, P. and J.N.R. Jeffers (eds.) (1992) Response of Forest
J. Krecek and M. J. Haigh

MAPPING WETLANDS IN EUROPEAN HEADWATER AREAS
M.L. PARACCHINI and J.V. VOGT European Commission’s Joint Research Centre,
Ispra, Italy
KEYWORDS / ABSTRACT: Europe / wetlands / headwaters / mapping
The paper describes the first approach to wetlands mapping in headwater areas at the continental scale. Given the size of the minimum mapping unit it is evident that a class like wetlands is underestimated in the final assessment, as it is often characterized by objects smaller than 25 ha. It is known that this is a drawback affecting in particular the “water” classes of the CORINE classification. The following assessment has been carried out on the area covered by CORINE data, covering the EU15 Countries (excluding Sweden) plus Poland, Estonia, Latvia, Lithuania, Czech Republic, Slovakia, Slovenia, Hungary, Bulgaria, Romania, Bosnia and Herzegovina, Albania, Macedonia, for a total of 4,650,000 ha. Using a 250-meter resolution DEM, only headwater areas larger than 1 km2 are reported in the presented map of headwaters in south-western Europe. The process of mapping can be further developed by deeper characterising the identified areas, for example by assigning them to corresponding drainage basins, altitudinal areas, landscape or administrative units. The results are based on the data available. Updating and improvement will be possible in the short term with the delivery of the new CORINE 2000 system (based on satellite images acquired between 1999 and 2001) and using more detailed Digital Elevation Models (e.g. Shuttle Radar Topography Mission).
1. Introduction
Over the last century or so, wetlands in Europe have undergone thorough changes. Many of them have been drained, exploited and/or converted to arable land or settlements. Only during the last decades of the 20th century has the importance of wetlands been highlighted by the scientific community and recognised by the general public. An important role in this process was played by NGOs active in the field of environmental protection. The value of wetlands as habitat for many endangered species
J. Krecek and M. Haigh (eds.),
© 2006 Springer. Printed in the Netherlands.
7
Environmental Role of Wetlands in Headwaters, 7–16.

8
or as rest sites for migrating birds, for example, is highlighted in an extended body of literature. At the same time, it has been recognised that wetlands are particularly sensitive areas and that European and national policies, especially in the agricultural sector, are likely to result in continued pressure on these precious resources. If the protection of wetlands in Europe is to be efficient, a first step should be an exhaustive survey of their distribution and characteristics across Europe. This is a non-trivial task, since relevant information is not always easily accessible and needs to be updated on a regular basis. This paper describes a first attempt to map wetlands in headwater areas across Europe. It is based on the analysis of CORINE land cover data in combination with data on European rivers and catchments elaborated in the framework of the CCM Activity of the Institute for Environment and Sustainability at the European Commission’s Joint Research Centre.
2. Developing a GIS for European environmental data
European-wide spatial datasets with relevant information for assessing the state of the environment have been collected by Eurostat since 1992. Eurostat, for example, elaborated geographical layers and statistical information on land use, soils, hydrography, natural resources and transportation networks through its GISCO (Geographic Information System for the European Community) project. These layers correspond to mapping scales between 1:500,000 and 1:3,000,000 and are useful for a general overview and for overall assessments. More detailed data exist at national, regional and local levels and efforts for harmonization, integration and management of these data through a modern spatial data infrastructure are bundled under the so-called INSPIRE (Infrastructure for Spatial Information in Europe) initiative of the European Commission. The study presented in this paper is based on the work carried out within the Catchment Characterisation and Modelling (CCM) activity of JRC’s EuroLandscape Project (now part of the Agri-Environment Action of the Soil and Waste Unit of the Institute for Environment and Sustainability - IES, for the development of a European-wide database of drainage networks and catchment boundaries. The aim of the CCM project is the development of algorithms for the analysis of Digital Elevation Models (DEM) and ancillary data in order to produce a pan-European database of river networks and catchment boundaries at a mapping scale of 1:250,000 to 1:500,000, using highly automated processing tools. Version 1.0 of the
M. L. Paracchini and J. V. Vogt

9
database is available, covering the area from Scandinavia to the terranean and from Portugal to 38 degrees Longitude East.
3. The critical contributing area and headwaters
A central question in all studies dealing with the extraction of rivers from DEMs is the location of the channel head. Analyses at the field scale show that related processes are very complex. In general terms, however, a channel head is located where linear fluvial processes start to dominate over diffuse slope processes. Depending on the prevailing geomorphic processes, this condition may be met at a variety of scales, which means that the drainage area for a channel head can vary to a large degree, depending on local conditions [1], [8]. When deriving drainage networks from digital elevation data, the spatial resolution of the DEM is the key characteristic, determining the level of detail at which geomorphic processes can be inferred from the DEM. Using DEMs of high spatial resolution, detailed information on hill-slope processes and channel formation can be derived. At coarse grid resolutions (> 100 m), detailed geomorphic processes and channel initiation cannot be modelled. As an alternative, particularly for studies covering extended areas, a critical contributing area can be defined for deriving the approximate position of channel heads [6], [11], [10], [5], [12], [3]. This critical contributing area can be derived from the analysis of the relationship between contributing area and local slope. If values of local slope versus contributing area for each grid cell are plotted, a graph of the so-called scaling response can be determined (Figure 1). On this graph characteristic changes in the scaling response can be identified, corresponding to changes in the dominance of the prevalent processes. In particular, two points are interesting for defining channel heads:
(a) the point where dS/dA turns from positive to negative, indicating the critical contributing area corresponding to the change of dominance form hill-slope to fluvial processes, and
(b) the point where dS/dA becomes stable, identifying the value of critical contributing area above which all points are channelised. Point (a) is detectable only when the DEM grid cell size is smaller than approx. 30 m. Point (b) can still be identified from coarse DEMs.
Given the extent of the area covered by CCM and the 250-meter grid cell size of the available DEM, the analysis of the local slope – contributing
Medi-
Mapping Wetlands

10
area relationship for deriving the critical contributing area was theevident choice. In order to overcome the drawback of using a single critical contributing area for all of Europe, representing a large variety of landscapes with highly varying drainage densities, a landscape stratification has been elaborated, and for each landscape type a dedicated critical contributing area was derived from the analysis of the corresponding local slope – contributing area plot.
Figure 1. The local slope plotted versus contributing area in logarithmic scale.
In order to elaborate a suitable landscape stratification, five variables have been identified on the basis of a literature survey as the most important factors governing drainage density: relief type, vegetation cover, soil transmissivity, rock erodibility, and climate. Each variable has been classified into three to seven classes and a Landscape Drainage Density Index has been derived from a weighted combination of these variables, using a multi-criteria evaluation technique [16]. In short, the variables have been parameterised following:
Relief type has been considered through relative relief, defined as the
a
b1
b2
M. L. Paracchini and J. V. Vogt

11
cells [9], [13]. The percentage vegetation cover was derived from CORINE land cover data with a grid cell size of 250 m, reclassified in 14 classes to which an average value of yearly surface cover was assigned on the basis of the scheme derived for Europe by Kirkby [7]. As a proxy indicator of soil transmissivity, soil texture was selected as the main soil factor affecting channel initiation [2], [15]. Soil texture was derived from the Soil Map of Europe [4]. Rock erodibility was estimated according to the Gisotti’s scale based on the parent material as given in the Soil Map of Europe.
Figure 2. European Drainage Network as derived by the CCM project.
The climate factor was synthetised by the mean annual precipitation, derived from the daily meteorological database of the European MARS project, covering the period 1977-1999 on a 50 km grid [16], [14]. A critical contributing area has then been assigned to each landscape class by analysing the specific relationship between local slope and contributing
maximum altitude difference in a moving window of 3 by 3 grid
Mapping Wetlands
12
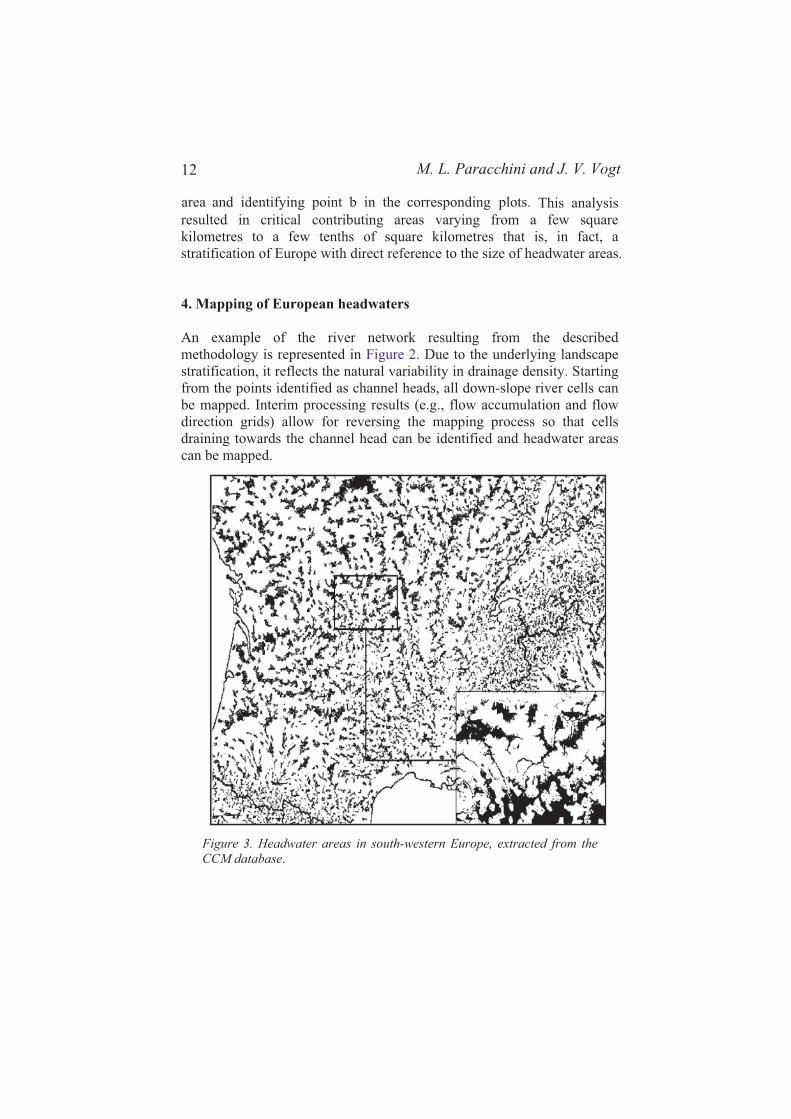
area and identifying point b in the corresponding plots. This analysis resulted in critical contributing areas varying from a few square kilometres to a few tenths of square kilometres that is, in fact, a stratification of Europe with direct reference to the size of headwater areas.
4. Mapping of European headwaters
An example of the river network resulting from the describedmethodology is represented in Figure 2. Due to the underlying landscape stratification, it reflects the natural variability in drainage density. Starting from the points identified as channel heads, all down-slope river cells can be mapped. Interim processing results (e.g., flow accumulation and flow direction grids) allow for reversing the mapping process so that cells draining towards the channel head can be identified and headwater areas can be mapped.
Figure 3. Headwater areas in south-western Europe, extracted from the
CCM database.
M. L. Paracchini and J. V. Vogt

13
A resulting map of headwaters in a part of south-western Europe is shown in Figure 3. It must be stressed that from a 250-meter resolution DEM not all headwater areas can be mapped. In our study only headwater areas larger than 1 km2 are reported. On the other hand, sometimes very large areas are mapped as headwaters. This is due to the fact that the critical contributing area can be quite large, especially in flat areas such as the north European continental planes. In such areas headwaters with a surface as large as 50 to 60 km2 may be mapped. As a result of this analysis over the entire mapped area, a total surface of about 6,500,000 km2, 27% or 1,750,000 km2 have been assigned to headwater areas
5. Wetlands in headwater areas
The main homogeneous source of data on land cover for Europe is CORINE Land Cover (CLC), a data layer realised by the European Commission in the frame of the CORINE programme (Co-ordination of Information on the Environment). The principal sources of information are Landsat Thematic Mapper images recorded in 1985-1994, that have been analysed using photo-interpretation techniques. Given the resolution of the images (10 to 30 m pixel), a minimum mapping unit of 25 ha and a minimum width of 100 m for linear elements have been retained. The CLC legend is hierarchically structured in three levels, with 44 classes in the most detailed level. At level 1 a main class “wetlands” exists, that is sub-divided at level 2 in “inland” and “coastal” wetlands. At level 3 inland wetlands (defined as “Non-forested areas either partially, seasonally or permanently
waterlogged; the water may be stagnant or circulating”) are further detailed into inland marshes and peat bogs, and it is on these two classes that the attention has been focused. Inland marshes are defined as “Low-lying land usually flooded in winter, and more or less saturated by water all year round. Marshes may be made up of river ox-bows, areas in which waterways shift from their course, depressions where the ground water table reaches the surface permanently or seasonally, or basins where run off or drainage water accumulates “. The peat bogs are defined as “Peat-land consisting mainly of decomposed moss and vegetable matter. May or may not be exploited – peat-bogs are peaty ecosystems populated by hygrophilous plants and developing either in flooded hollows in plains (lowland bogs, raised or flat) or at altitude in very rainy countries (blanket or sloping upland bogs).
Mapping Wetlands

14
Under the effect of biochemical and mechanical factors, the accumulated vegetal mass is transformed into a compact, combustible matter made up of over 50% carbon: peat. To qualify as a peat-bog, the accumulated deposits must contain at least 30% organic matter if they are argillaceous and at least 20% in all other cases, and must be more than 40 cm thick. Peat-bogs will remain active (produce peat) for as long as the water supply remains adequate. Any water shortage will kill them. Both categories - active bogs and dead bogs - can be exploited”.
Figure 4. Wetlands in headwaters in Ireland and the UK.
Given the size of the minimum mapping unit, it is evident that a class like wetlands is underestimated in the final assessment because it is often characterized by objects smaller than 25 ha. It is known that this is a drawback affecting many of the “water” classes in the CORINE
M. L. Paracchini and J. V. Vogt

15
classification. The following assessment has been carried out on the area covered by CORINE data, covering the EU15 Countries (excluding Sweden) plus Poland, Estonia, Latvia, Lithuania, Czech Republic, Slovakia, Slovenia, Hungary, Bulgaria, Romania, Bosnia and Herzegovina, Albania, Macedonia, for a total of 4,650,000 ha. Inland wetlands cover some 36,000 ha in this area, that is, less than 1% of the total surface. For the same area, headwaters amount to 1,000,000 ha, and wetlands in headwaters to 10,600 ha, which is about 1% of the headwater area. Figure 4 shows the wetlands in headwater areas in Ireland and the UK, mapped with the described methodology.
This paper describes the first approach to wetlands mapping in headwater areas at the continental scale. The process of mapping can be further developed by deeper characterizing the identified areas, for example by assigning them to corresponding drainage basins, altitudinal areas, landscape or administrative units. The results are based on the data available. Updating and improvement will be possible in the short term with the delivery of the new CORINE 2000 system (based on satellite images acquired between 1999 and 2001) and using more detailed Digital Elevation Models (e.g. Shuttle Radar Topography Mission). It has been clearly stated that the limits of the approach are due to the resolution of data. In fact, at this scale, isolated wetlands below the 25 ha threshold or even complex systems of small elements are neglected; it is clear that a more detailed approach is needed for the management at the medium/large scale.
1. Dietrich, W. E. and T. Dunne (1993) The channel head. In: K. Beven and M.J. Kirkby (eds.), Channel network hydrology, Wiley, Chichester, 175-219.
2. Dietrich, W.E., C.J. Wilson, D.R. Montgomery, McKean, J. and R. Bauer (1992) Erosion thresholds and land surface morphology. Geology, 20: 675-679.
3. Döll P. and B. Lehner (2002) Validation of a new global 30-min drainage direction map. J. Hydrol., 258: 214-231.
4. ESBSC European Soil Bureau Scientific Committee (1998) Georeferenced soil
Mapping Wetlands
6. Conclusions
7. References

16
data-base for Europe, Manual of Procedures. EUR 16393 EN, CEC-JRC, Ispra, 184 p.
5. Graham, S.T., J.S. Famiglietti and D.R. Maidment (1999) Five-minute, 1/2, and 1 degree data sets of continental watersheds and river networks for use in regional and global hydrologic and climate system modelling studies. Water
Resour. Res., 35: 583-587.6. Hutchinson, M.F. and T.I. Dowling (1991) A continental hydrological
assessment of a new grid-based digital elevation model of Australia. Hydrol.
Proc., 5: 45-58.7. Kirkby, M.J. (1999) Definition and practical demonstration of a pre-
operational system for desertification monitoring in the Mediterranean Basin
based on remote sensing methods. 1st Annual Report, MODEM Project, JRC-Space Applications Institute, Ispra (Va), Italy.
8. Montgomery, D.R. and E. Foufoula-Georgiou (1993) Channel network source representation using Digital Elevation Models, Water Resour. Res., 29: 3925-3934.
9. Oguchi, T. (1997) Drainage density and relative relief in humid steep mountains with frequent slope failure. Earth Surf. Proc. Landforms, 22: 107-120.
10. Oki, T. and Y.C. Sud (1998) Design of Total Runoff Integrating Pathways (TRIP) - a global river channel network. Earth Interact, 2 (2-001), 53 pp.
11. Verdin, K. L. and S.K. Jenson (1996) Development of continental scale DEMs and extraction of hydrographic features. 1996. In: Third International
Conference on Integrating GIS and Environmental Modeling, CD-ROM. Santa Fe, USA.
12. Renssen, H. and J. Knoop (2000) A global river routing network for use inhydrological modeling. J. Hydrol., 230: 230-243.
13. Roth, G., P. La Barbera and M. Greco (1996) On the description of the basin effective drainage structure. J. Hydrol., 187: 119-135.
14. Terres, J.M. (2000) The Crop Growth Monitoring System implemented by the JRC/ARIS unit for the information needs of the EC DG VI – Agriculture. In: C. Conese and M.A. Falchi (eds.), Proceedings of the 7th International
Congress on Computer Technology in Agricultural Management and Risk
Prevention, 15th – 18th November 1998, Florence (Italy), 225-230.15. Tucker, G.E. and R.L. Bras (1998) Hillslope processes, drainage density, and
landscape morphology. Water Resour. Res., 34: 2751-2764.16. Van der Voet, P., C.A. Van Diepen and J. Oude Voshaar (1994) Spatial
interpolation of daily meteorological data: a knowledge-based procedure for
the region of the European Communities. Report 53.3, Winand Staring Centre for Integrated Land, Soil and Water Research, Wageningen, 105p.
M. L. Paracchini and J. V. Vogt

THE ROLE OF FOREST ON THE HYDROLOGY OF HEADWATER WETLANDS
Y. FUKUSHIMA Research Institute for Humanity and Nature, MEXT, Japan
KEYWORDS / ABSTRACT: Forest hydrology / headwater wetlands / Japan
The worth of forest coverage is discussed by the comparison of both devastated and well-grown forested headwaters through sediment yields, flood control function, water budget and heat budget. Many hydrological and micro-meteorological observations from slopes to headwaters have been carried out in Japan, at hilly mountain underlain by weathered granite and other geology. In order to analyze the observed data and to explain the results, needed models have been developed. Finally, it has become clear that the worth of forest coverage emerges 50-60 years after initial reforestation. In headwater wetlands, the knowledge attained is effective for the explanation of the role and the planning of conservation.
1. Introduction
Whether headwater area has a wetland or not is determined climatically by the balance between precipitation and evaporation. Potential evaporation amount corresponds to the condition when the resistance of land surface is zero (by Penman-Monteith’s equation [21]), represented by evaporation on shallow open water or wet grass land without trees. Generally, factors controlling evaporation are energy balance, air temperature, vapor water, wind velocity and physiology of vegetation. As energy balance and air temperature have a tendency to decrease in higher latitude regions compared to lower latitude regions, there are many wetlands at high latitudes. Otherwise, wetlands are seen in areas of high altitude in middle latitude regions and in tropical rainforest regions. In Japan, headwater wetlands are located at rather high altitude in mountainous area. A special feature of wetlands in Japan is abundance in
17
J. Krecek and M. Haigh (eds.),
© 2006 Springer. Printed in the Netherlands.
Environmental Role of Wetlands in Headwaters, 17–47.

18
sometimes seen, in the case of remote area, far from human living areas. Some areas are now in crisis due to the invasion of humans, because these lands are able to be changed to agricultural fields by reclamation and drain works. In this chapter, the hydrological role of headwater wetlands is discussed by the comparison between forested and devastated headwaters.
2. Sediment yield
2.1 GENERAL REMARKS
Headwaters are thought to be important and essential areas for producing safe and stable water, not only as irrigation supply but also as a drinking source for people living downstream. Recently, we have realized that these areas have another worth in maintaining diversity of biosphere and humans have started to be aware of this real meaning. Developed countries never paid attention to this worth until the end of the 18th
century, and developing countries have begun to understand this worth nowadays. The increase, however, of human population and the demands of food production have made the situation difficult. Nevertheless, the environment of source areas has to be maintained with natural vegetation with long-life view in the eco-hydrological aspect.
2.2 SEDIMENT YIELD IN DEVASTATED HEADWATER AREA
The Lake Biwa, located in central Japan, is the largest lake of Japan with 670km2 in area. South of the lake, the Tanakami mountain range is situated, which was devastated by heavy use as supply areas for wood, fuel and fertilizer of forest production situated close to villages in the 19th century. Another reason contributing to the devastation is that the Tanakami Mountaions are underlain by weathered granite and easily eroded soil, as the particle size is rather small and loose. As it supplied a great volume of sediment downstream, disasters due to flood and sediment deposit attacked villages downstream. Since the beginning of the 20th century, conservation works of headwater areas began in the source area of large rivers with big cities downstream. As the river water of Lake Biwa flows down to Osaka, Kyoto and Kobe city, the Tanakami Mountains became an objective area for conservation works. The
rare species of grasses, insects and animals. Migratory birds are
Y. Fukushima

19
conservation works are separated into two parts. One is hillslope works aimed at the fixation of soil by reforestation with mainly pine tree species mixed with other plant species able to fix air nitrogen as fertilizer. The other is check-dam works on the river bed aimed at the prevention of riverbed scoring. In order to evaluate these effects, various kinds of investigations and observations were carried out in the Tanakami Mountains.
Figure 1. The inter-annual change of sediment yield between bare and reforested area
observed in the Tanakami Mountains (granite massive in Central Japan), [27].
2.3 SEDIMENT PRODUCTION AND TRANSPORT
Generally, sediment yield has been observed by following methods: 1) peg method at a slope 2) trap method at a slope or source area
Figure 1 shows clearly that annual sediment yields at bare slopes are almost in the range of 5,000 to10,000 m3km-2yr-1 despite the difference in method, and that the sediment yields from reforested slopes show almost 10 m3km-2yr-1. The decrease is equal to two to three orders lower than that
Hydrology of Headwater Wetlands
20
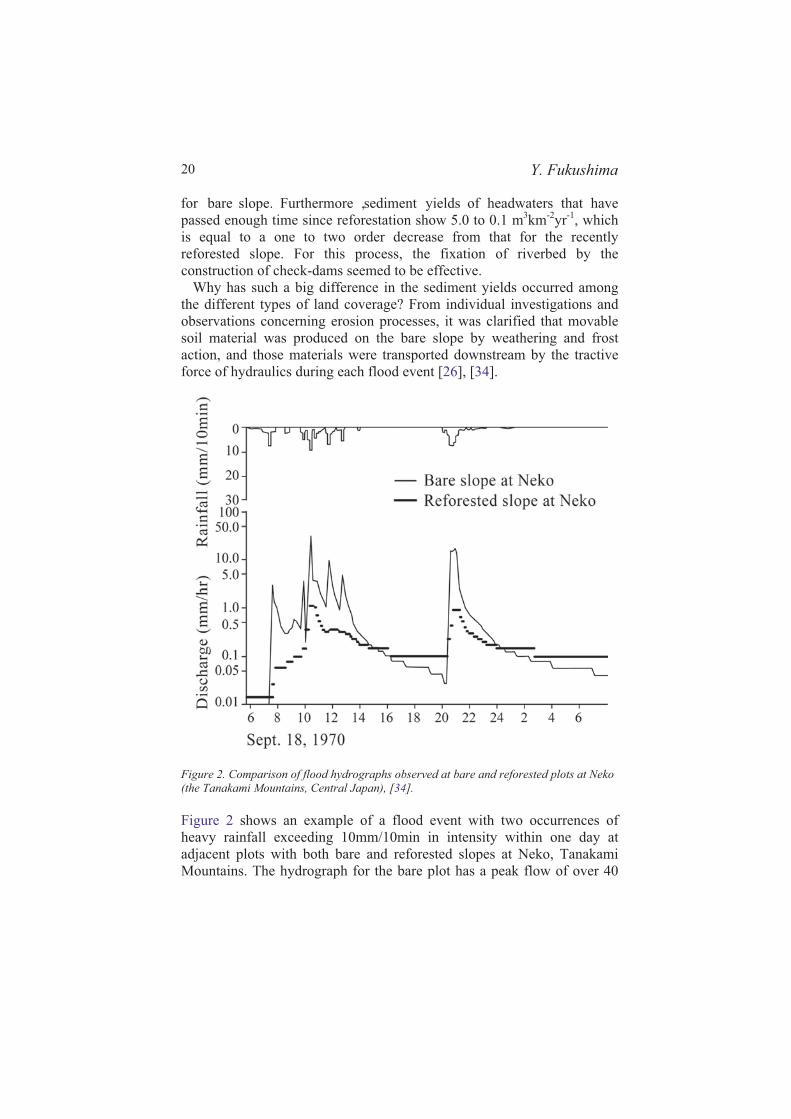
for bare slope. Furthermore , sediment yields of headwaters that have passed enough time since reforestation show 5.0 to 0.1 m3km-2yr-1, which is equal to a one to two order decrease from that for the recently reforested slope. For this process, the fixation of riverbed by the construction of check-dams seemed to be effective. Why has such a big difference in the sediment yields occurred among the different types of land coverage? From individual investigations and observations concerning erosion processes, it was clarified that movable soil material was produced on the bare slope by weathering and frost action, and those materials were transported downstream by the tractive force of hydraulics during each flood event [26], [34].
Figure 2. Comparison of flood hydrographs observed at bare and reforested plots at Neko
(the Tanakami Mountains, Central Japan), [34].
Figure 2 shows an example of a flood event with two occurrences of heavy rainfall exceeding 10mm/10min in intensity within one day at adjacent plots with both bare and reforested slopes at Neko, Tanakami Mountains. The hydrograph for the bare plot has a peak flow of over 40
Y. Fukushima