Embed Size (px)
Citation preview

Environmental Requirements of Abalone
C.M. Burke, J. O. Harris, S.M. Hindrum, S.J. Edwards and G.B. Maguire
Project No. 97/323
Environmental requirements of abalone.
Burke, C. M., Harris, J. O., Hindrum, S.M., Edwards, S.J. and Maguire, G.B. Environmental Requirements of Abalone. Copyright 2001
The work is copyright. Except as permitted under the Copyright Act 1968 (Cth), no part of this publication may be reproduced by any process, electronic or otherwise, without the specific written permission of the copyright owners. Neither may information be stored electronically in any form whatsoever without such permission. ISBN 0-85901-849-0 1. Aquaculture. 2. Abalone. 3. Environment. 4. Water quality.
University of Tasmania School of Aquaculture Locked Bag 1-370, Launceston Tasmania 7250 Australia
TABLE OF CONTENTS 1. Project Details 1 2. Non-technical summary 2 3. Background 4 4. Need 7 5. Objectives 8 6. Detailed Results: 9
1. Effect of pH on juvenile greenlip and blacklip abalone. 9 2. Effect of dissolved oxygen and temperature on juvenile
greenlip and blacklip abalone 32 3. Low dissolved oxygen and ammonia (chronic) 47 4. Low dissolved oxygen and ammonia (pulsed) 58 5. Refuges and stocking density 68 6. Nitrite and respiratory physiology for juvenile
greenlip and blacklip abalone 80 7. Effect of salinity on survival and haemolymph
parameters for greenlip abalone. 90 8. Effect of salinity on oxygen consumption in greenlip
and blacklip abalone. 104 9. Recovery and growth effects of anaesthetics on
greenlip and blacklip abalone. 111 7. General discussion 124 8. Benefits 131 9. Further development 134 10. Conclusion 135 11. References 137 Appendices 149
1: Intellectual property 2: Staff

1
1: PROJECT DETAILS
Project title: Environmental requirements of abalone Project number: 97/323 Principal investigator: Dr Chris Burke Formerly Dr Greg Maguire Organisation: School of Aquaculture University of Tasmania Locked Bag 1-370 Launceston 7250 Tasmania Collaborators: Mr Miles Cropp Marine Shellfish Hatcheries PO Box 45 Bicheno 7215 Tasmania

FRDC 97/323: Environmental requirements of abalone
2
2: NON-TECHNICAL SUMMARY FRDC 97/323 Environmental requirements of abalone The natural habitat of abalone is in fully marine waters on exposed coasts, usually at depths of less than 40 m. Thus; they typically experience good water quality that does not vary greatly over short time scales, although there may be seasonal changes in temperature. For example, at Bicheno on the east coast of Tasmania where this project was carried out, the measured ranges of environmental parameters in the farm intake waters were: temperature (10 - 21°C), salinity (34 - 36‰), total ammonia (<0.1 mg L-1), nitrite (<0.001 mg L-1) and pH (8.2 - 8.3). In contrast, culture systems can differ considerably from the natural environment, particularly because the stocking densities are much higher. As a consequence, the volume of water available to the stock is smaller and there is a greater chance that deleterious changes to water quality will occur. This will be exacerbated in poorly managed systems or during mechanical breakdown of pumps. If the water quality is poor, then abalone, will become stressed and grow slowly, which increases the cost of production. In the worst case, the water quality can deteriorate to the extent of causing mortalities. A major cost for land-based, abalone growout systems is water exchange. Decreasing tank volumes and the rate of water flow can reduce the cost of water exchange. However, this will greatly increase the risk of producing poor water quality that reduces growth rates or even survival of the abalone. Hence, it is imperative that a compromise is made between water exchange and water quality. Culture systems can only be rationally developed if the optimal ranges are known for environmental parameters. This project examined the important environmental parameters for greenlip and, in some cases for blacklip, abalone and reports optimal ranges for temperature, dissolved oxygen, pH, ammonia and nitrite in relation to stocking density and the amount of shelter provided in tank systems. As poor water quality is likely to be reflected in more than one parameter (e.g. high ammonia together with low dissolved oxygen) experiments were designed to examine the interaction of environmental parameters on growth and survival of greenlip and blacklip abalone. Two experimental approaches were taken: growth bioassays and respirometry to determine rates of oxygen consumption as a measure of metabolic activity. Growth bioassays were conducted over periods of at least 8 weeks, to examine the growth of abalone under different environmental conditions. From these experiments, data on the increases in weight and length of the abalone were calculated and ranges of values of environmental parameters that produced the best growth were determined. Where the data allowed it, the optimal ranges were defined as those values that gave less than a 5% reduction in growth when compared to controls (the EC5). pH In respect of pH, greenlip abalone grew best if pH was in the range 7.78 to 8.77. Outside this range growth is likely to be reduced by more than 5%. Blacklip abalone had a more restricted range of 7.93 to 8.46. Both of these ranges closely bracket typical values of good quality marine waters, and significant mortalities occurred at pH less than 7.16 or greater than 9.01. Salinity

FRDC 97/323: Environmental requirements of abalone
3
Greenlip and blacklip abalone tolerate salinity within the range 25 to 40‰ with a margin of 2‰ outside of this range likely to induce mortality. Mortality rates were greatly increased if abalone were exposed to low salinity before they were fully attached to a substrate. Altering salinity from 35‰ appeared to reduce the metabolic activity of both species, which implies that food consumption and growth rates may be reduced. Temperature and dissolved oxygen concentration To ascertain whether growth could be improved by increasing temperature or oxygen saturation, both species were grown at 17 and 19°C with 99%, 107% or 123% saturation with respect to dissolved oxygen (DO). Neither raising temperature nor DO saturation enhanced growth. Thus, there is little value in growers increasing temperature or oxygen saturation. Greenlip abalone survived and grew well in all treatments. In contrast, blacklip abalone, which have a cooler optimum temperature, showed best growth at 17°C and 99% saturation. Growth and survival were reduced at 19°C for all of the levels of saturation tested. In the event of temperature increasing, then DO could be increased to 107% supersaturation as survival was best, however, careful monitoring of DO would be necessary to avoid increasing mortality. Ammonia and dissolved oxygen Significant reductions in growth of both greenlip and blacklip abalone occurred when they were chronically exposed to ammonia and to subsaturation with DO over 8 weeks. However, the combined effect was not simply the sum of the individual effects. Abalone exposed to free ammonia (FAN) in the range 38 - 59 µg L-1 and 56 or 64% DO grew faster than abalone exposed to 40 µg L-1 FAN and 76% DO. In contrast to chronic exposure, abalone were reasonably robust to repeated, eight-hour pulses of ammonia and DO subsaturation over 7 weeks. This suggests that intermittent problems, such as pump failure, are less of a problem than poorly designed or managed systems that produce chronically bad water quality. Stocking density versus shelter provision This experiment examined the effect of stocking density and provision of shelters on abalone growth. Consequently, it integrated the effects of several environmental factors, because there was a potential for water quality to change. The highest growth rate (up to 68 µm d-1) was attained at the lowest stocking density (14 kg m-3). However, the greatest biomass increase (3.7 kg per tank) was obtained at the highest stocking density (40 kg m-3) with the highest number of shelters (1 shelter per 30 abalone). Current commercial stocking density is about 20 kg m-3. The shelters provided refuge for the abalone and also increased the effective surface area of substrate available for grazing by the abalone. Importantly, the shelters did not greatly reduce the water quality whilst water exchange was maintained. Anaesthesia All anaesthetics tested were found to cause reductions in subsequent growth rates of both species. Therefore, disturbance of the abalone should be kept to a minimum. Benzocaine had the least effect on growth, but ethanol and potassium chloride caused the least reduction in respiration rates during recovery. If abalone have to be moved, then these agents are likely to cause the least amount of side effects. Benefits to the abalone industry Benefits to the industry are described in section 8 on page 136. KEYWORDS: Abalone, aquaculture, environment, Haliotis, water quality

FRDC 97/323: Environmental requirements of abalone
4
3: BACKGROUND The Australian abalone aquaculture industry is expanding rapidly. At a recent FRDC/CRC Abalone Aquaculture workshop in Port Lincoln, industry projected farmed abalone to be worth about $AUS 40 million ex-farm by the year 2000 (850 tonnes). Although this may take longer to achieve, investment is growing rapidly with several thousand new growout farms being established in South Australia, Tasmania and Western Australia. Presently, the husbandry of abalone is not well described, with little knowledge of the environmental requirements of abalone, particularly in relation to maximising commercial productivity. Greenlip abalone are found in Victoria, Tasmania and Western Australia. They inhabit two main types of habitats, either on rocks at depths of 5-40 m, usually associated with seagrass communities, or in rougher water, at the base of steep cliffs in gutters and clefts from 10-25 m. In calmer waters, greenlip abalone can inhabit shallower depths (Shepherd, 1975). In warmer waters of WA, SA and NSW blacklip abalone inhabit caves, fissures and crevices at depths usually below 5 m, but rarely exceeds 10 m. In the cooler waters of NSW, Victoria and Tasmania, blacklip abalone occur to greater depths, exceeding 30 m, and can occur on both vertical or horizontal rock surfaces (Shepherd, 1975). In comparison, culture systems presently in use differ greatly from the natural environment, in terms of depth, light intensity and photoperiod, water quality, water flow and the substrate type. Also, the culture environment can impose additional pressures on the animals, by ingress of pathogens, high stocking density and alterations to the suspended solids content of the water (Tomasso 1996). Both greenlip (Haliotis laevigata) and blacklip abalone (Haliotis rubra) are cultured in a several states of Australia. Thus, the animals are subjected to a wide range of environmental conditions, depending upon the location and the climate of the farm and the culture system used in the farm. Water quality The first phase of the FRDC Abalone Aquaculture Subprogram (November 1993-November 1996) demonstrated that a major operating cost for land-based growout systems was water exchange (Hindrum et al. 1996). To minimise costs and improve profitability, water exchange rates and tank volumes can be reduced. However, this greatly increases the risk that suboptimal water quality within the tanks will reduce growth rates, or even affect survival. It is imperative that farmers be in a position to relate water quality readings within the tanks to the performance of abalone, especially as abalone are proving to be quite sensitive to chronic deterioration in water quality (Harris 1999a). The environmental parameters that could affect abalone health or growth include: temperature, salinity, dissolved oxygen (DO), ammonia, nitrite, sulfide, pH, photoperiod, current speed, turbulence and the available surface area for feeding and for refuge. The impact of these may range in severity from causing mortality to sublethal effects that induce stress and compromise growth rates. Indirect effects may also occur, such as suboptimal water quality enhancing growth of pathogenic bacteria that cause disease in abalone. Furthermore, the values that cause an effect could be different for greenlip versus blacklip abalone. Perhaps more importantly, water quality problems in culture systems commonly involve the combined effects of two or more variables, rather than just one variable.
FRDC 97/323: Environmental requirements of abalone
5
One of the most common interactions that abalone could experience is varying concentrations of dissolved oxygen at different water temperatures. Another common interaction of interest is high ammonia in oxygen-depleted water. If DO is maintained at appropriate levels, then the toxicity of nitrogenous wastes is likely to be the factor most limiting to increased production (Colt and Armstrong 1981). The speciation, and hence toxicity, of nitrogenous forms is affected by the pH of the water. Molluscs, such as oysters, are sensitive to pH below 7. Specifically, we found that shell growth is very sensitive to any change in water quality and this is likely to occur at low pH. A characteristic of recirculating water systems, or those that use partial recirculation, is that pH declines over time. Such relationships were examined in this report, as it is important that the research can be applied to farming systems in Tasmania and also to warmer states such as South Australia. An early achievement of the Subprogram was the establishment of a bioassay system at a commercial abalone culture site (Marine Shellfish Hatcheries (MSH), Bicheno, Tasmania, E148°18', S41° 53'). This allowed us to subject abalone to precise concentrations of various water quality variables and to measure the resultant growth over 2-3 months. We showed that juvenile abalone were very sensitive to dissolved oxygen (DO) (Harris et al. 1998b), ammonia (Harris et al. 1998a) and to nitrite concentrations (Harris et al. 1997). Not only do animals consume oxygen during respiration, but also faeces and decaying food accumulate in tanks and produce ammonia and nitrite, as well as consuming additional oxygen. The bioassay system provided very consistent results, so that we can now determine maximum safe levels of ammonia and nitrite. Thus we have been able to quantify the effects of nitrite at low concentrations less than 0.5 mg nitrite-nitrogen L-1. Another variable of interest to sea-based producers is the effect of low salinity. It is important that we understand this variable, as it will aid in site selection. Specifically, sea-based farmers are experiencing major problems with mudworm (spionid polychaetes) (Hindrum et al. 1996). This could be due to a complex set of factors including current flow, suspended solids and salinity. Land-based farms could also experience serious lowering of salinity during heavy rainfall events. We need to assess some of these factors in isolation before researchers can unravel interactions that are more complex. Stocking density and refuge provision The environment of abalone is not only a question of water quality. In the first phase of the Subprogram, we showed that abalone in tanks, not kept in the dark, must have refuges supplied or growth rates of juvenile greenlip abalone can be halved. Moreover, growth rates of abalone were shown to decrease with increasing stocking density. What is the critical factor in terms of stocking density? Is it general tank area for feeding, or is it the refuge area that limits the allowable stocking density? Few variables have more influence on profitability in aquaculture systems than stocking density. In relation to the above research, water quality generally decreases as density increases.

FRDC 97/323: Environmental requirements of abalone
6
Indicators of stress in abalone This type of research should be seen as part of a broader thrust into stressors that compromise the health status of abalone. Involved in this research area are the Department of Primary Industries, Water and Environment (Tasmania) and the CRC for Aquaculture Ltd. In association with the bioassays conducted we have sampled the tissues of abalone exposed to ranges of values of water quality variables, to develop a set of specific indicators. This has assisted health workers identify the specific stress, which has compromised the health status of abalone in commercial facilities. Anaesthesia Abalone farmers have previously relied on a powerful chemical, Benzocaine, to anaesthetise abalone so that they can be removed from refuges and tanks. The safety margin for the survival of animals under anaesthesia with this chemical is very low, and mortalities often result. There are also concerns that this chemical may impact on growth of the animals. Several suggested alternative methods, including temperature and other anaesthetics need to be assessed in terms of their effectiveness, and subsequent survival and growth rates.
FRDC 97/323: Environmental requirements of abalone
7
4: NEED
The rapid expansion of the Australian abalone culture industry is being underpinned by advances in research and development that have seen tank designs and formulated diets become far more cost effective (Lorkin et al. 1999). Market prospects are excellent (Johnston, 1996) and investment capital and available sites do not seem to be limiting factors. The hatchery sector is performing very well and its capacity is expanding rapidly. The major threat to this optimistic scenario is a decline in the health status of abalone and the most likely cause is inadequate water quality (Snieszko 1974). Based on results obtained from our previous FRDC-funded environmental requirements research, this threat is real. The 30% reduction in growth rate noted earlier would be enough to destroy profit margins in most aquaculture industries. In light of increasing competition even smaller production losses could have severe economical effects. We need to determine safe levels of more of the water quality variables that threaten abalone health, and to refine estimates for the variables so far assessed. Greenlip abalone appear to be more sensitive to ammonia and nitrite than initially expected. In some states there is a greater emphasis on growing blacklip abalone, so they too must be included in health assessments. Successful culture also requires diagnostic tools that enable accurate determination of morbidity and mortality. Here, it is necessary to determine the direct effects of water quality variables on the anatomy, physiology and biochemistry of abalone to help veterinarians diagnose problems. Research on the effects of environmental water quality on abalone health and growth fits within the FRDC strategic plan. It is commercially attractive (prevents loss of profitability), it is feasible (the experimental system, methods and expertise have already been developed), it is collaborative (hosted by industry), it relates strongly to growth and survival within aquaculture development, and the species involved are primarily being introduced for the Asia-Pacific market. Additionally, it contributes to export technology (live holding) and ecosystem protection by defining tolerances of two key commercial and recreational species.
FRDC 97/323: Environmental requirements of abalone
8
5: OBJECTIVES 1. The overall objective is to provide the information needed for industry to reduce its
operating costs (water exchange) or increase production (through higher stocking densities) in a manner that does not compromise the health of the abalone through inadequate water quality
2. To establish safe operating levels for a range of water quality variables. 3. We also aim to identify stress-specific changes in the structure or biochemistry of abalone in
relation to particular water quality problems. This will improve the diagnostic tools available to veterinary staff.
4. Finally, we plan to convey this information in a prompt and user friendly form for industry. The specific milestones agreed for this project were: 1. To determine the effect of pH on juvenile greenlip and blacklip abalone. 2. To determine the combined effect of varying dissolved oxygen concentration and
temperature on juvenile greenlip and blacklip abalone. 3. To determine the combined effect of low dissolved oxygen and high ammonia on juvenile
greenlip and blacklip abalone. 4. To determine the relationships between water quality, stocking density and refuge provision
for greenlip abalone. 5. To determine the effect of nitrite on the respiratory physiology of juvenile greenlip and
blacklip abalone. 6. To determine the effect of salinity on survival and on haemolymph parameters of greenlip
abalone. 7. To determine the recovery and growth effects of different anaesthetics on juvenile greenlip
and blacklip abalone. All the objectives have been met. The milestones were modified slightly during the course of the project. FRDC and the abalone subprogram agreed to the modified milestones as listed above. The order of some of the milestones was altered and the specific milestone examining the effect of low concentrations of ammonia on both species was deleted.

FRDC 97/323: Environmental requirements of abalone
9
6.1: EFFECT OF pH ON TWO AUSTRALIAN ABALONE SPECIES
Nontechnical summary In this experiment the effect of pH on juvenile greenlip and blacklip abalone was examined. The acidity or alkalinity (i.e. the pH) of the environment can affect both the survival and the growth of abalone. This can occur as a result of: physiological or anatomical changes to the body of the abalone, or altered shell structure. Groups of greenlip and blacklip abalone were exposed for 57 - 68 days to different values of pH: 9.01, 8.27, 7.76, 7.46, 7.16 or 6.79. The increases in whole wet body weight and shell length were recorded. After this the rate of oxygen consumption (which indicates the overall metabolism of the animals) was measured at similar values of pH. The maximum rate of growth of greenlip abalone (specific growth rate for length was 0.2 - 0.25% d-1) occurred at pH = 8.27 and a 5% reduction in growth was predicted to occur at values of pH outside the range, 7.78 - 8.77. The maximum rate of growth of blacklip abalone (specific growth rate for length was 0.15 - 0.17% d-1) occurred at pH = 7.76. Because of the wide variability in the data it was difficult to predict the optimum growth range for blacklip abalone. However, it appears that growth of blacklip abalone will be reduced outside the pH range 7.93 - 8.46. The depressed growth that occurs outside the optimum range of pH results from a reduced metabolic rate that, in turn, reduces the conversion of food into tissue. Significant mortalities of both greenlip and blacklip abalone occurred at values of pH ≤ 6.79. Survival was also reduced at pH = 9.01 and at pH = 7.16. Survival of blacklip abalone was lower and more variable than for greenlip abalone. Published as Harris, J.O., Maguire, G.B., Edwards, S.J. and Hindrum, S.M., 1999. Effect of pH on growth rate, oxygen consumption rate, and histopathology of gill and kidney tissue for juvenile greenlip abalone, Haliotis laevigata Donovan and blacklip abalone, Haliotis rubra Leach. Journal of Shellfish Research 18; 611 - 619.

FRDC 97/323: Environmental requirements of abalone
10
6.1 EFFECT OF pH ON TWO AUSTRALIAN ABALONE SPECIES
James O. Harris, Greg B. Maguire, Stephen J. Edwards and Stephen M. Hindrum Introduction With the demand for premium abalone products rising steadily (Oakes and Ponte 1996), abalone culture is expanding in both land and sea-based culture systems (Fleming and Hone 1996). With land-based culture, some recirculation of water is often employed to reduce costs, and a variety of conditions can be experienced with sea-based culture depending on site (Hindrum et al. 1996). In both cases, abalone may be exposed levels of ammonia, nitrite, pH and dissolved oxygen that may, at least, vary from their optima. Biochemical, physiological and/or morphological changes can occur as a response to water quality levels that are in excess of those tolerated in aquatic animals (Meyers and Hendricks 1985). Often the gills are among the organs most affected by waterborne pollutants (Mallat 1985), as the respiratory surface provides an extensive interface with the aquatic environment. In many fish, the kidney often forms a site of histological changes in response to toxicants (Russo 1985). In a previous study, both gill and kidney tissue of greenlip abalone provided some indicators of environmental stress (Harris et al. 1998a). The current emphasis towards water reuse for land-based abalone culture systems is likely to affect pH levels. The process of nitrification, central to biofilter operations in recirculating water systems, causes pH levels to decline (Wickins 1983). Both respiration by the abalone and nitrification in a biofilter will depress the water pH. However, photosynthetic activity by benthic diatoms will cause increase pH to increase (In abalone culture systems, diatoms on surfaces are often used for juvenile rearing (Fleming and Hone 1996)). Values of pH outside a range of 5-9 are lethal to many aquatic animals (Randall 1991). Additionally, pH variation can also have secondary effects, such as altering ammonia toxicity (Thurston and Russo 1981). However, limited information is currently available regarding the effects of pH on molluscs, and is mostly concerned with bivalves (Calabrese and Davis 1966, Bamber 1987, Bamber 1990). Oxygen uptake has been widely used to help indicate the health of animals and their overall energy expenditure or activity levels (Innes and Houlihan 1985). It is also a critical factor in assessments of stress in aquatic organisms (Beitinger and McAuley 1990, Willows 1994), including abalone (Harris et al. 1997, 1999a). Wells et al. (1998) demonstrated the New Zealand abalone, Haliotis iris and Haliotis australis, to have reversed Bohr and Root effects at low pH, leading to an increase in the binding affinity of the respiratory pigment, haemocyanin, and oxygen, and subsequent decrease in released oxygen. Wickins (1976 modelled chronic toxicity data to determine estimated concentrations at which growth reductions will occur and reported these as expected concentration (EC) values. These estimates are given as ECx, where a growth reduction of x% is expected to occur. Commonly, the values EC5 and EC50 are used. This approach is directly applicable
FRDC 97/323: Environmental requirements of abalone
11
to commercial situations where growth reductions are balanced against pumping costs. Previous bioassays on Australian greenlip abalone have determined the effects of some aspects of water quality to abalone, such as the chronic toxicity of nitrite (Harris et al. 1997), ammonia (Harris et al. 1998b) and dissolved oxygen (Harris et al. 1999a). The aim of this research was to determine the effects of chronic exposure to a variety of pH levels on growth, survival, food consumption, oxygen consumption and histopathology of gill and kidney tissue of the greenlip abalone, Haliotis laevigata, and the blacklip abalone, Haliotis rubra. Materials and methods The juvenile greenlip abalone used in these experiments were approximately two years old and were obtained from a commercial hatchery at Bicheno, Tasmania, Australia, where the research was conducted (E148'18", S41' 53"). The juvenile blacklip abalone were approximately 12 months old and were obtained from a commercial farm at Swansea, Tasmania, Australia. The initial mean length and mass of the greenlip and blacklip abalone were 26.49±2.83 mm and 2.30±0.73 g and 22.92±2.92 mm and 1.56±0.64 g, respectively (mean±SD; n = 561 and 559). For 2-3 months before experimentation, the greenlip abalone were maintained on a mixture of formulated abalone feed and benthic diatoms, and the blacklip abalone had been maintained on a formulated abalone feed (Adam & Amos). Blacklip abalone were initially removed using a spatula prior to transport to the experimental site, and acclimatised for 3 days in flowing, aerated seawater prior to further handling. All abalone were anaesthetised (0.1% benzocaine) until they could be easily removed from the tank surfaces. Subsequently, they were weighed to the nearest 0.01 g, measured with callipers to 0.1 mm, tagged (Hallprint, Adelaide, Australia) and randomly distributed to 18 bioassay units to give 30 of each species within each tank. Mortalities from pH 7.76 resulted in the stocking of this treatment 15 days after the trial commenced, using more from the initial group of blacklip abalone. Bioassay system Seawater from an exposed coastline, free from freshwater run-off, was filtered through a commercial sand filter and delivered to six 1100 l reservoirs. pH was adjusted using AR grade NaOH or HCl, thoroughly dissolved in each reservoir. Each reservoir was connected to a constant head chamber (150 mm diameter, vertical PVC pipe, operating volume 30 l) which supplied constant flow to three bioassay chambers via standard lengths of black 4 mm polypropylene tubing that entered the bioassay tanks. These tanks were cylindrical with a conical base to concentrate solid wastes. In each 70 l bioassay tank, there were two cages (100 mm x 35 cm PVC tube with 6 mm mesh floor and 8 mm mesh wall sections) suspended vertically, containing greenlip and blacklip abalone. Daily flow rates averaged 193±1.4 ml.min-1 (n=108; 18 tanks on six occasions) giving an effective replacement rate of 90% of bioassay tank volume in 10-12 h. This was within the recommended flow rates for aquatic toxicological studies by Sprague (1969) of 90% replacement in 8-12 h. Identical 5 W submersible pumps were placed in each tank to stimulate similar current flow (8.7 l.min-1 output at zero head). The experiment was conducted using 200 and 300 W aquarium heaters in the bioassay tanks and constant head chambers, respectively, to
FRDC 97/323: Environmental requirements of abalone
12
maintain relatively uniform daily temperature at 19.0±1.0oC (mean±SD) (n=71 days) (range 16.5-21.7oC) (Table 1). Water quality analysis The pH, temperature, salinity and DO in all tanks were measured on all days (Table 1). A pH meter and combination glass electrode (TPS) were calibrated with phosphate (pH=7.00) and borate (pH=9.28) buffers daily before use (Bruno and Svoronos 1989). A TPS oxygen electrode, used for daily measurements, was calibrated before use in 'air-saturated' seawater. The efficiency of this calibration was validated occasionally using Winkler's titration. Water samples were collected in acid-washed glassware, and ammonia was measured using the indophenol blue spectrophotometric method (Solórzano 1969, as modified by Dal Pont et al. 1974). The concentration of ammonia was measured as total ammonia-nitrogen (TAN), while free ammonia-nitrogen (FAN) was calculated from appropriate temperature, pH and salinity tables (Bower and Bidwell 1978) (Table 1). Nitrite was measured occasionally, using the diazotisation method (Grasshoff 1989). Chronic pH exposure Six experimental treatments were established (Table 1); average pH ranged from 9.01-6.79. The abalone were acclimatised to the bioassay system for 4-6 days before pH adjustment commenced. pH adjustment occurred over several days, with a gradual increase in chemical levels (HCl or NaOH) each day until the desired level was attained. All cages were checked daily for mortality. All tanks were fed a proprietary, formulated abalone diet (ABCHOW) every two to three days. The feeding ration was adjusted in response to food consumption data as the trial progressed. Food consumption was estimated on four occasions from uneaten food removed from the base of the cages after two days and drying it for 24-48 hours at 55-60oC. Residual food mass was not corrected for soluble and particulate nutrient losses over the two days. Apparent food consumption (amount of food supplied minus residual food as g dry mass) was divided by the initial tank biomass, less the mass of any mortalities to that point, and expressed as g dry mass food remaining per g whole wet body mass per day. A valve in the base of each bioassay tank was opened daily to remove organic wastes. Tanks were also cleaned more thoroughly, on average, every 9 days. Cleaning involved lowering the water level, siphoning enough water from the bioassay tank into a 20 l bucket to cover the cages, removing cages to the bucket, draining the tank, scrubbing the tanks and cages, refilling the tanks directly from the reservoirs and returning the cages to the tanks. This took less than 10 minutes for any tank. Abalone remained in the bioassay system for 50-68 days, and were removed in staggered groups for respirometry over 14 days. This is unlikely to be sufficient time for significant differences in growth due to stocking density to arise. All abalone were weighed and measured for the final growth data. Specific Growth Rate (SGR) data were calculated for mass and length of each abalone as SGR = [ln(final)-ln(initial)].100.days-1.
FRDC 97/323: Environmental requirements of abalone
13
Oxygen consumption rates at end of the chronic bioassay The respirometer system included five elliptical perspex chambers (of 2.3 l) normally set up with two replicate chambers for each treatment and one chamber as a control (no animals), as described in Harris et al. (1997). Commencing on day 57, abalone from the bioassay system were transferred to respirometer chambers for a series of three day experiments. All abalone remaining in two of the three replicate bioassay tanks for each treatment level were transferred to the respirometer system so that data could be obtained for duplicate tanks of each species at each nominal treatment level. These animals had been fed before removal. Abalone that did not attach to transferable plastic strips in the cages within the bioassay units were removed manually, either by sliding them directly from the substrate or by inserting a thin, plastic card underneath each abalone's foot. Temperature and pH levels were measured within the constant head chambers (Table 2). Histological sample preparation Five abalone were sampled from two of the triplicate bioassay tanks for each treatment. These abalone were dissected to remove the posterior portion of the viscera containing the gills and kidney. This tissue was fixed in phosphate-buffered formalin at room temperature (15-18°C) then dehydrated through a graded ethanol series to xylene in a Tissue-Tek II tissue processor. Dehydrated tissue samples were embedded in paraffin resin on a Shandon Histocentre 2 and sectioned on a Microm HM 340 microtome at 4 µm. Routine Harris' Haematoxylin and Eosin (H & E) staining were carried out on all tissues processed using a Shandon Linistain GLX automatic tissue stainer. All sections were mounted in DPX and examined under a light microscope. Insufficient animals remained in pH 6.79 for histological analysis, so abalone from pH 7.16 were the most extreme treatment considered. The tissue sample from each abalone was examined and scored regarding several aspects of gill and kidney structure (Table 3). Haemolymph sampling and analysis Haemolymph was removed from individual abalone via the cephalic arterial sinus, a known site that is effective for sampling abalone haemolymph (Ainslie 1980). The samples (<1 mL) were immediately centrifuged for several minutes to remove haemocytes, the haemolymph was removed, immediately frozen in liquid nitrogen and stored at -80°C for subsequent analysis. Measurement of all ions except copper took place on a Roche Cobas-MIRA automatic chemical analyser. In order to determine haemolymph sodium, potassium, chloride and calcium, the haemolymph needed to be diluted 1:4, and for magnesium, a further dilution to 1:40 was required. Both sodium and potassium were directly measured using ion-selective electrodes. Chloride ion concentration was determined spectrophotometrically using the thiocyanate method. Calcium ion concentration was determined spectrophotometrically using the arsenazo III method, while magnesium was similarly determined using the arsenazo method. Copper concentration was determined on a Varian Atomic Absorption
FRDC 97/323: Environmental requirements of abalone
14
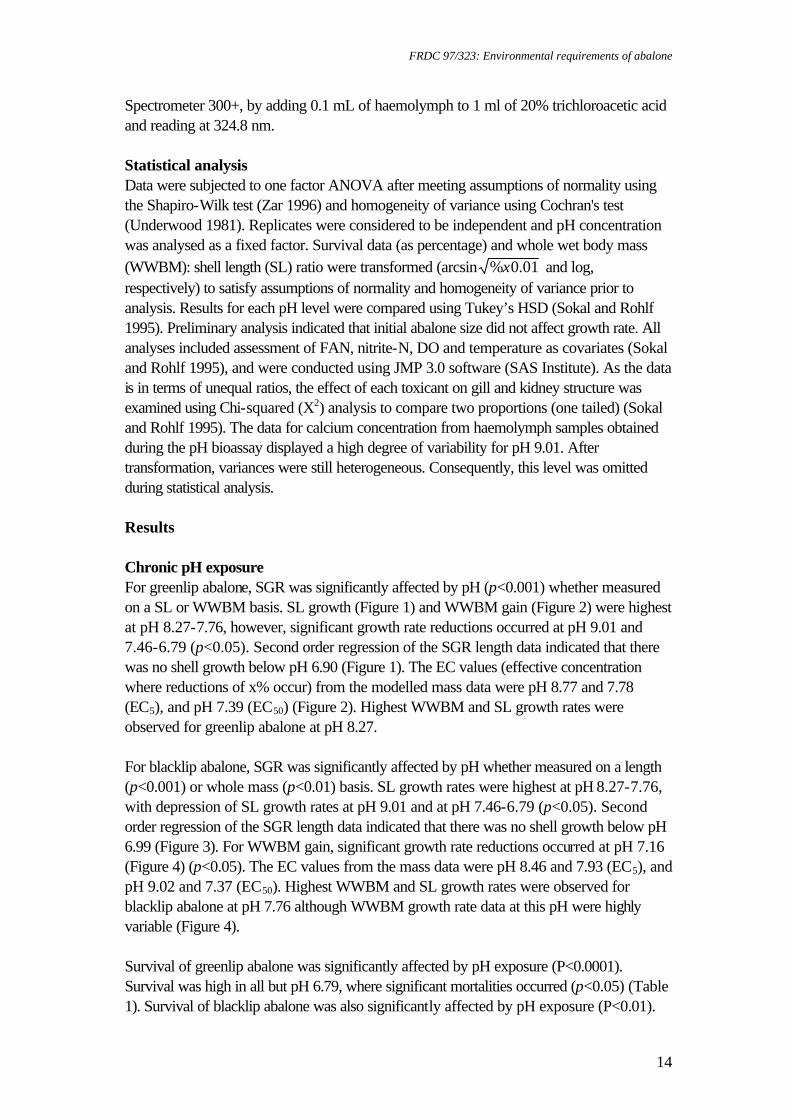
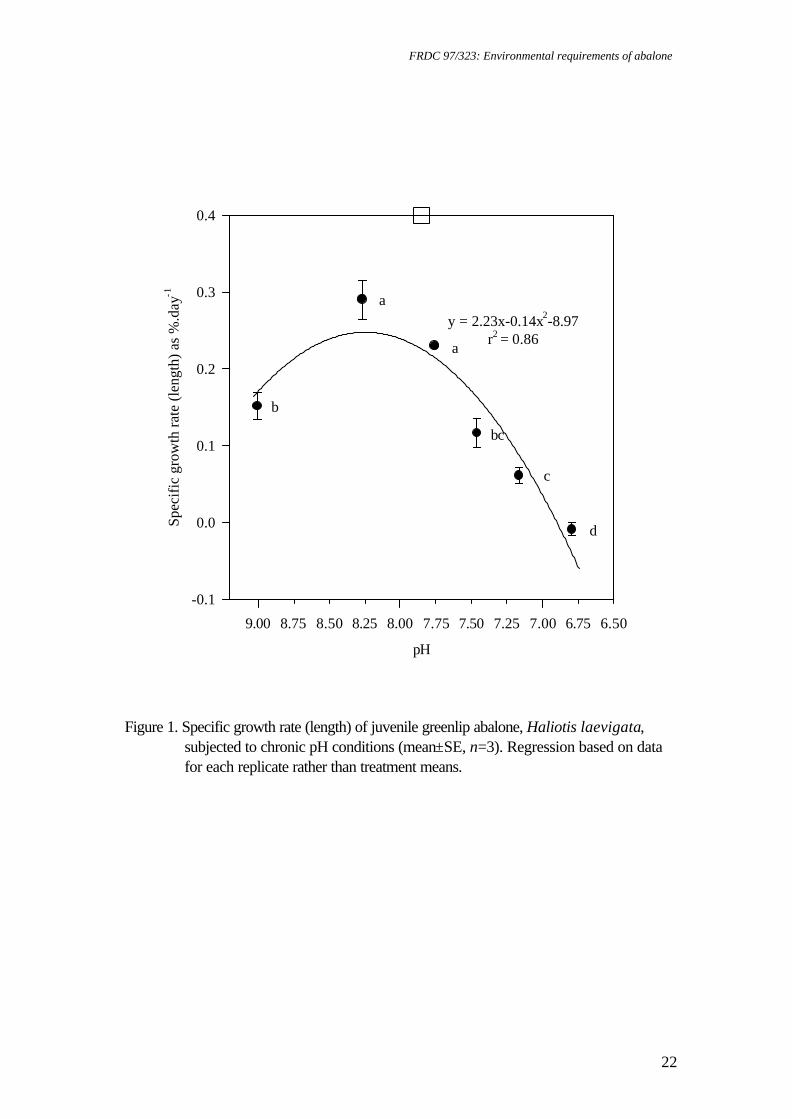
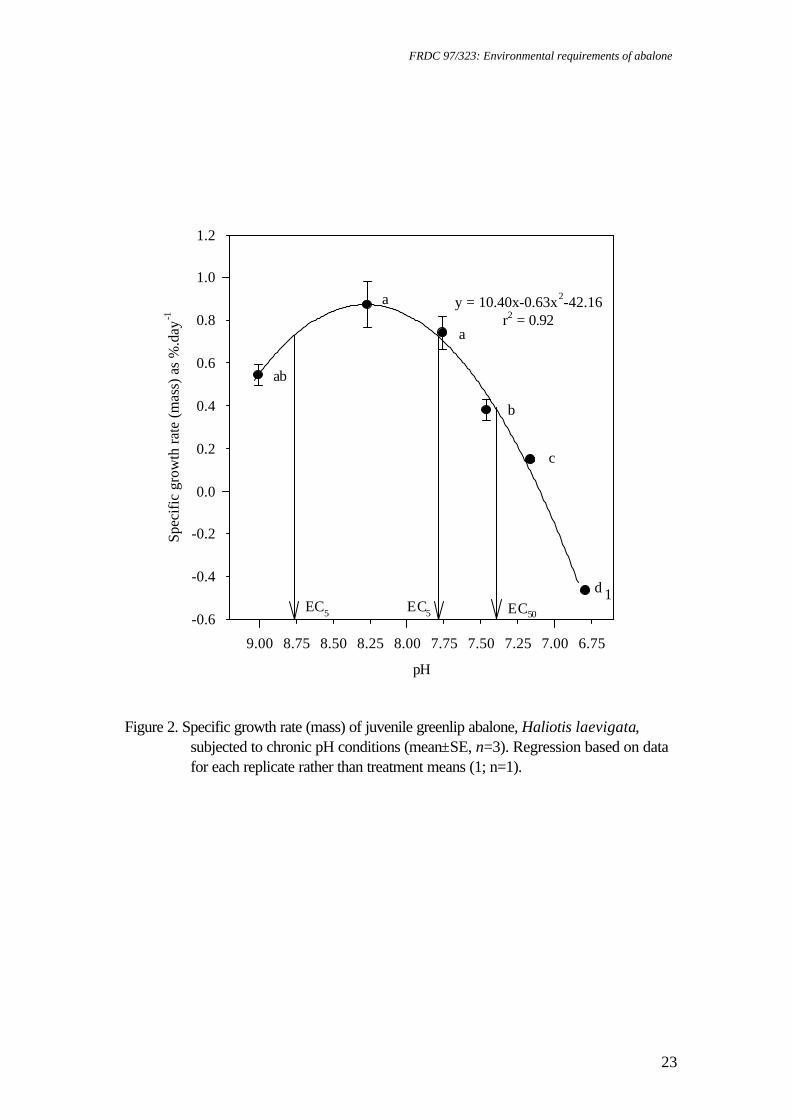
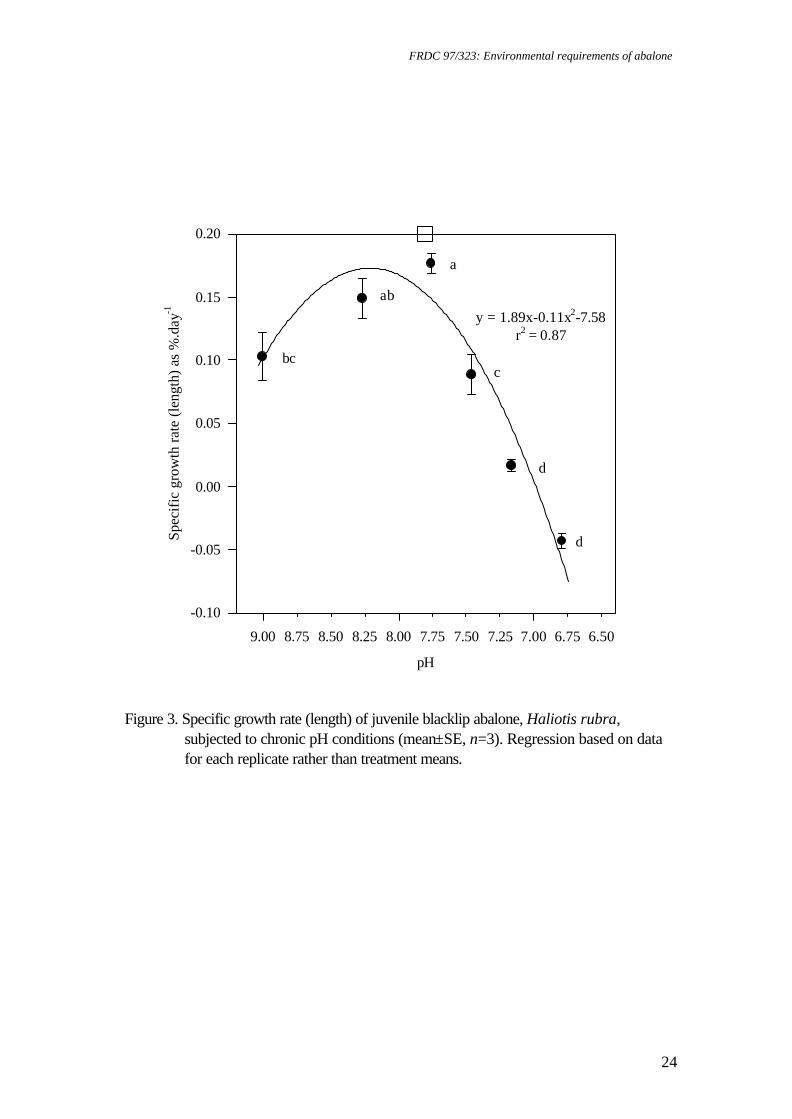
Spectrometer 300+, by adding 0.1 mL of haemolymph to 1 ml of 20% trichloroacetic acid and reading at 324.8 nm. Statistical analysis Data were subjected to one factor ANOVA after meeting assumptions of normality using the Shapiro-Wilk test (Zar 1996) and homogeneity of variance using Cochran's test (Underwood 1981). Replicates were considered to be independent and pH concentration was analysed as a fixed factor. Survival data (as percentage) and whole wet body mass (WWBM): shell length (SL) ratio were transformed (arcsin % .x0 01 and log, respectively) to satisfy assumptions of normality and homogeneity of variance prior to analysis. Results for each pH level were compared using Tukey’s HSD (Sokal and Rohlf 1995). Preliminary analysis indicated that initial abalone size did not affect growth rate. All analyses included assessment of FAN, nitrite-N, DO and temperature as covariates (Sokal and Rohlf 1995), and were conducted using JMP 3.0 software (SAS Institute). As the data is in terms of unequal ratios, the effect of each toxicant on gill and kidney structure was examined using Chi-squared (X2) analysis to compare two proportions (one tailed) (Sokal and Rohlf 1995). The data for calcium concentration from haemolymph samples obtained during the pH bioassay displayed a high degree of variability for pH 9.01. After transformation, variances were still heterogeneous. Consequently, this level was omitted during statistical analysis. Results Chronic pH exposure For greenlip abalone, SGR was significantly affected by pH (p<0.001) whether measured on a SL or WWBM basis. SL growth (Figure 1) and WWBM gain (Figure 2) were highest at pH 8.27-7.76, however, significant growth rate reductions occurred at pH 9.01 and 7.46-6.79 (p<0.05). Second order regression of the SGR length data indicated that there was no shell growth below pH 6.90 (Figure 1). The EC values (effective concentration where reductions of x% occur) from the modelled mass data were pH 8.77 and 7.78 (EC5), and pH 7.39 (EC50) (Figure 2). Highest WWBM and SL growth rates were observed for greenlip abalone at pH 8.27. For blacklip abalone, SGR was significantly affected by pH whether measured on a length (p<0.001) or whole mass (p<0.01) basis. SL growth rates were highest at pH 8.27-7.76, with depression of SL growth rates at pH 9.01 and at pH 7.46-6.79 (p<0.05). Second order regression of the SGR length data indicated that there was no shell growth below pH 6.99 (Figure 3). For WWBM gain, significant growth rate reductions occurred at pH 7.16 (Figure 4) (p<0.05). The EC values from the mass data were pH 8.46 and 7.93 (EC5), and pH 9.02 and 7.37 (EC50). Highest WWBM and SL growth rates were observed for blacklip abalone at pH 7.76 although WWBM growth rate data at this pH were highly variable (Figure 4). Survival of greenlip abalone was significantly affected by pH exposure (P<0.0001). Survival was high in all but pH 6.79, where significant mortalities occurred (p<0.05) (Table 1). Survival of blacklip abalone was also significantly affected by pH exposure (P<0.01).

FRDC 97/323: Environmental requirements of abalone
15
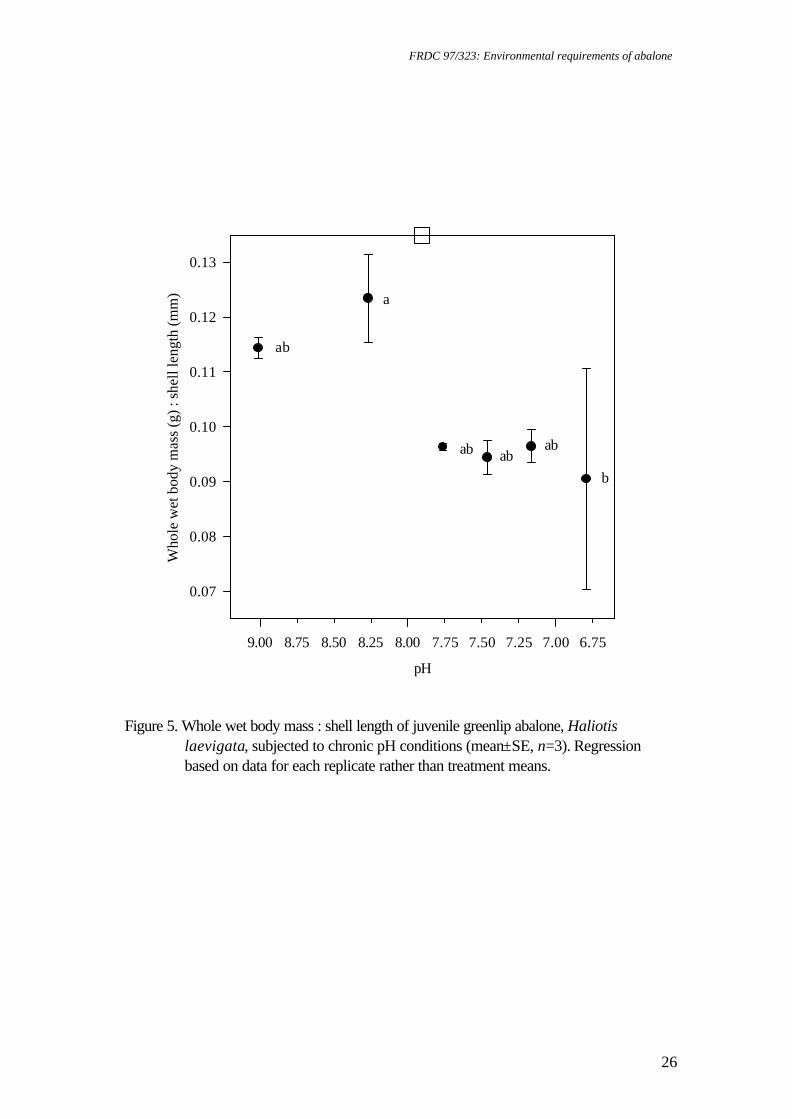
Survival was high in all but pH 7.76 and 6.79, where significant mortalities occurred (p<0.05) (Table 1). During the experiment, if the pH fell below 6.2, significant mortalities for both species followed for up to 7 days. Abalone exposed to these conditions lost attachment and collected towards the bottom of the cages. At the end of the experiment, all blacklip abalone at pH 6.79, all greenlip abalone in two replicates at pH 6.79 and all blacklip abalone of one replicate at pH 7.76 had died, so only length measurements until their day of removal were calculated, not mass data. pH had a significant effect on WWBM:SL for both greenlip abalone (Figure 5) (p<0.001) and blacklip abalone (p<0.05) (Figure 6). Greenlip abalone from pH 6.79 had significantly lower ratios than abalone from pH 8.27 (p<0.05). For blacklip abalone, pH 7.16 produced a significantly (p<0.05) lower ratio than pH 7.76. There was a significant effect of pH on food consumption by greenlip abalone (p<0.01), where abalone from pH 7.76 had significantly higher food consumption than abalone from pH 7.16 (p>0.05) (Table 1). The variability of the data for abalone in treatments that also had significant mortality rates prevented the conditions of homogeneity of variance being satisfied for statistical analysis. These treatments (pH 7.76 for blacklip abalone and pH 6.79 for both species) were omitted from analysis. A significant effect of pH on food consumption by blacklip abalone was observed (p<0.05), with abalone held at pH 7.16 demonstrating significantly lower rates than abalone from pH 9.01 (Table 1). Significantly lower temperatures were recorded at pH 9.01 and 7.46 than in other treatments (p<0.001). However, the absolute differences of mean temperatures among treatments were small (18.6 - 19.3°C). DO levels were also significantly different between treatments (p<0.001), although average treatment oxygen saturation was 96.7±0.2%. Salinity was also significantly different between pH treatments (P<0.001) within a small range of 33.8 to 34.6 ‰. The salinity at pH 9.01 was significantly lower than the controls (Table 1) (p<0.05). Statistical analysis of log-transformed ammonia levels determined all treatments to be significantly different to the control (p<0.05). Nitrite levels were at or below 0.005 mg NO2-N L-1. Oxygen consumption rates at end of chronic bioassay Oxygen consumption rate of juvenile greenlip abalone was significantly affected by pH (p<0.001), with greenlip abalone of pH 9.25 and 6.72-6.08 recording significantly lower (p<0.05) oxygen consumption rates than the controls (pH 8.45) (Figure 7). Oxygen consumption rate for blacklip abalone was significantly lower (p<0.05) for all pH levels compared with the controls (pH 8.02) (Figure 8). However, mortality among blacklip abalone before and during respirometry limited the statistical analysis for this species. Histological sample examination Alterations to several tissue types of both blacklip and greenlip abalone occurred as a result of the exposure to pH (Table 4). Chi-squared analysis of histological observations from greenlip abalone exposed to slightly acidified sea water (pH 7.16) demonstrated significantly different kidney definition (X2 calc. = 8.57; v=1, p<0.005) and tubule enlargement (X2 calc. = 8.57; p<0.005, v=1) (Figure 9). Kidney lumen size was also

FRDC 97/323: Environmental requirements of abalone
16
significantly larger in greenlip abalone from pH 6.79 (X2 calc. = 15; v=1, p<0.001). Analysis of gill structure in greenlip abalone revealed significant increases in hyperplasia (X2 calc. = 4.29; v=1, p<0.05) and abnormalities (X2 calc. = 6.2; v=1, p<0.005) with exposure to pH approaching acidity (pH 7.16) (Figure 10). Blacklip abalone exposed to pH 7.16 demonstrated similar significant differences in kidney definition (X2 calc. = 4.8; v=1, p<0.05), kidney lumen size (X2 calc. = 4.8; v=1, p<0.05) (Figure 11) and gill definition (X2 calc. = 8.24; v=1, p<0.005) (Figure 12). High pH did not induce any detectable alterations to the structure of the gill or kidney tissue of the abalone examined. Haemolymph sample analysis Chronic exposure to a range of pH conditions resulted in no significant differences in haemolymph sodium, potassium, chloride, copper and magnesium levels. A significant difference was noted in calcium levels (p<0.01), with increasing haemolymph calcium with increasing acidity occurring (Fig. 13). After the data for pH 9.01 were omitted due to high variability, significantly higher haemolymph calcium concentrations were observed in abalone from pH 7.76-7.16 as compared to the controls (p<0.05). Discussion The fastest growth rates of greenlip abalone (SGR mass = 0.87±0.11 %.day-1; SGR length = 0.29±0.03 %.day-1) and blacklip abalone (SGR mass = 0.97±0.22 %.day-1; SGR length = 0.18±0.01 %.day-1) in this experiment were much higher in comparison to a previous bioassay conducted at a similar temperature in the same experimental system with greenlip abalone only (Harris et al. 1997) (SGR mass = 0.48±0.04 %.day-1; SGR length = 0.12±0.01 %.day-1). One difference in the system design involved the incorporation of small submersible pumps into the tanks to improve water flow, as increased water movement stimulates feeding for Australian abalone (Shepherd 1973, Higham et al. 1998). The abalone studied appear to be less tolerant to alterations in pH than other marine species. From the EC values, greenlip abalone have a wider range of pH over which whole body growth is not inhibited, although outside this pH range, growth inhibition appears more severe than for blacklip abalone. In comparison, bivalves exhibited slightly higher levels of tolerance to pH than the abalone in this study. Ostrea edulis and Crassostrea gigas grown for 30-60 days lost shell at pH 6.0 and 7.0, respectively (Bamber 1990) and young Venerupis decussata grown for up to 30 days also lost shell at pH 7.0 (Bamber 1987). The flatfish Paralichthys orbignyanus demonstrated no adverse effects at pH 6.0 (Wasielesky et al. 1997), and the pH level where a 5% growth reduction occurred for the marine shrimp Penaeus monodon was pH 5.9 (Allan and Maguire 1992), both substantially lower than for abalone. The greenlip abalone also demonstrated a different pattern of shell growth inhibition than blacklip abalone. The drop in WWBM:SL for greenlip abalone to a plateau is in contrast with the data for blacklip abalone, which demonstrated a pattern more similar to previous studies for greenlip abalone (Harris et al. 1998b). Shell and body mass growth rates of greenlip abalone both appear affected in similar patterns by pH, as indicated by levels
FRDC 97/323: Environmental requirements of abalone
17
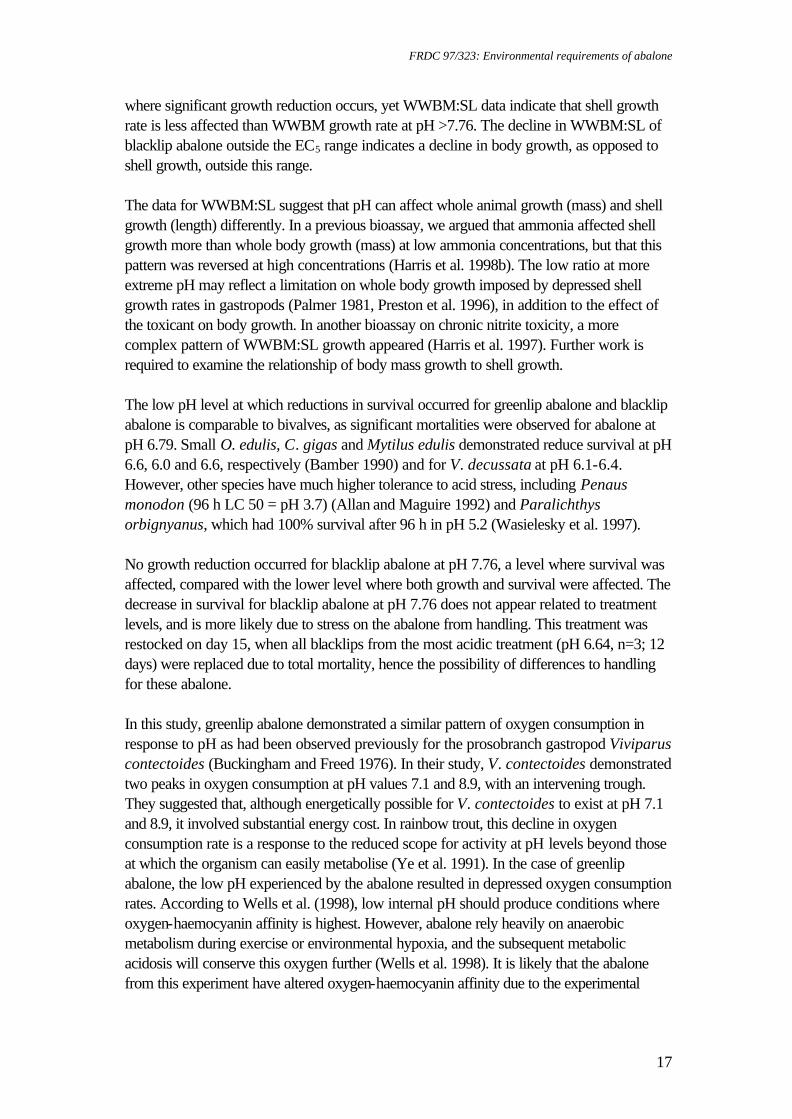
where significant growth reduction occurs, yet WWBM:SL data indicate that shell growth rate is less affected than WWBM growth rate at pH >7.76. The decline in WWBM:SL of blacklip abalone outside the EC5 range indicates a decline in body growth, as opposed to shell growth, outside this range. The data for WWBM:SL suggest that pH can affect whole animal growth (mass) and shell growth (length) differently. In a previous bioassay, we argued that ammonia affected shell growth more than whole body growth (mass) at low ammonia concentrations, but that this pattern was reversed at high concentrations (Harris et al. 1998b). The low ratio at more extreme pH may reflect a limitation on whole body growth imposed by depressed shell growth rates in gastropods (Palmer 1981, Preston et al. 1996), in addition to the effect of the toxicant on body growth. In another bioassay on chronic nitrite toxicity, a more complex pattern of WWBM:SL growth appeared (Harris et al. 1997). Further work is required to examine the relationship of body mass growth to shell growth. The low pH level at which reductions in survival occurred for greenlip abalone and blacklip abalone is comparable to bivalves, as significant mortalities were observed for abalone at pH 6.79. Small O. edulis, C. gigas and Mytilus edulis demonstrated reduce survival at pH 6.6, 6.0 and 6.6, respectively (Bamber 1990) and for V. decussata at pH 6.1-6.4. However, other species have much higher tolerance to acid stress, including Penaus monodon (96 h LC 50 = pH 3.7) (Allan and Maguire 1992) and Paralichthys orbignyanus, which had 100% survival after 96 h in pH 5.2 (Wasielesky et al. 1997). No growth reduction occurred for blacklip abalone at pH 7.76, a level where survival was affected, compared with the lower level where both growth and survival were affected. The decrease in survival for blacklip abalone at pH 7.76 does not appear related to treatment levels, and is more likely due to stress on the abalone from handling. This treatment was restocked on day 15, when all blacklips from the most acidic treatment (pH 6.64, n=3; 12 days) were replaced due to total mortality, hence the possibility of differences to handling for these abalone. In this study, greenlip abalone demonstrated a similar pattern of oxygen consumption in response to pH as had been observed previously for the prosobranch gastropod Viviparus contectoides (Buckingham and Freed 1976). In their study, V. contectoides demonstrated two peaks in oxygen consumption at pH values 7.1 and 8.9, with an intervening trough. They suggested that, although energetically possible for V. contectoides to exist at pH 7.1 and 8.9, it involved substantial energy cost. In rainbow trout, this decline in oxygen consumption rate is a response to the reduced scope for activity at pH levels beyond those at which the organism can easily metabolise (Ye et al. 1991). In the case of greenlip abalone, the low pH experienced by the abalone resulted in depressed oxygen consumption rates. According to Wells et al. (1998), low internal pH should produce conditions where oxygen-haemocyanin affinity is highest. However, abalone rely heavily on anaerobic metabolism during exercise or environmental hypoxia, and the subsequent metabolic acidosis will conserve this oxygen further (Wells et al. 1998). It is likely that the abalone from this experiment have altered oxygen-haemocyanin affinity due to the experimental
FRDC 97/323: Environmental requirements of abalone
18
conditions, which is further exacerbated by the products of anaerobic metabolism, thus causing the decline in oxygen consumption. The alterations to gill epithelium that were observed in this study for both greenlip and blacklip abalone are of note, as similar changes are known to occur in fish, as the cells become damaged through accumulation of bicarbonate (from the exchange of H+/HCO3
-) in the mucus layer (Randall 1991). The decrease in kidney definition and increased lumen size noted for both species of abalone indicate that pH can alter kidney structure. A decrease in nuclear size and staining intensity was observed in kidney cells of the brook trout, Salvelinus fontinalis at pH 4.0 (Mudge et al. 1977). The variations in water quality experienced during this experiment are not believed to have influenced the results. Although a significant reduction in salinity was observed at pH 9.01, the reduction was in the order of 0.5 ‰ from the overall mean of all other treatments (1.5% reduction). Short-term survival of greenlip abalone is known to be affected at 23 ‰, and at 28 ‰ if inappropriately fed (Boarder 1997). The daily temperature average of 19.0°C is little different to the preferred temperature of greenlip abalone (18.3°C) and blacklip abalone (17.0°C) (Edwards 1996a). FAN levels were higher at increased pH due to the influence of pH on ammonia ionisation (Bower and Bidwell 1978), though they were below 0.041 mg FAN.l-1, the EC5 for greenlip abalone (Harris et al. 1998b). The pattern of increased calcium concentration in greenlip abalone haemolymph with decreasing pH is known to occur for other molluscs. The decrease in pH is believed to cause dissolution of CaCO3 from the shell, and the subsequent rise in calcium in the extrapallial fluid is countered by a rise in haemolymph calcium levels (Burton 1983). A localised decline in pH is usually associated with anaerobic respiration, and an accumulation of organic metabolites in molluscs (Burton 1983), including abalone (Wells and Baldwin 1995). Visible erosion of abalone shells that occurred in the acidic treatments (this study) supports this view of shell dissolution influencing haemolymph calcium levels. Within recirculation systems, there is greater likelihood of a combination of adverse water quality factors occurring, rather than just one factor deteriorating. As nitrification is a complex of processes by which ammonia is converted first to nitrite then nitrate, with concomitant acidification (Collins et al. 1975, Wickins 1983), then studying the effects of all these parameters in combination would provide much greater understanding of the tolerances of abalone to recirculating systems. Presently, the effect of chronic exposure to ammonia (Harris et al. 1998b), nitrite (Harris et al. 1997), dissolved oxygen (Harris et al. 1999a) and pH (this study) are known, although this knowledge would be enhanced though subsequent combination studies. Acknowledgements The authors would like to thank the Fisheries Research and Development Corporation, the Australian Research Council's small grants scheme and the School of Aquaculture for research funding, the Tasmania Research Council for scholarship funding, Marine Shellfish Hatcheries for hosting this work, and Mr. Deon Johns for technical assistance. We would

FRDC 97/323: Environmental requirements of abalone
19
like to thank Mr Rob Scharkie of Tas. Aqua Co. for the supply of the blacklip abalone. We also thank Dr. Natalie Moltschaniwskyj for critical assessment of the manuscript.
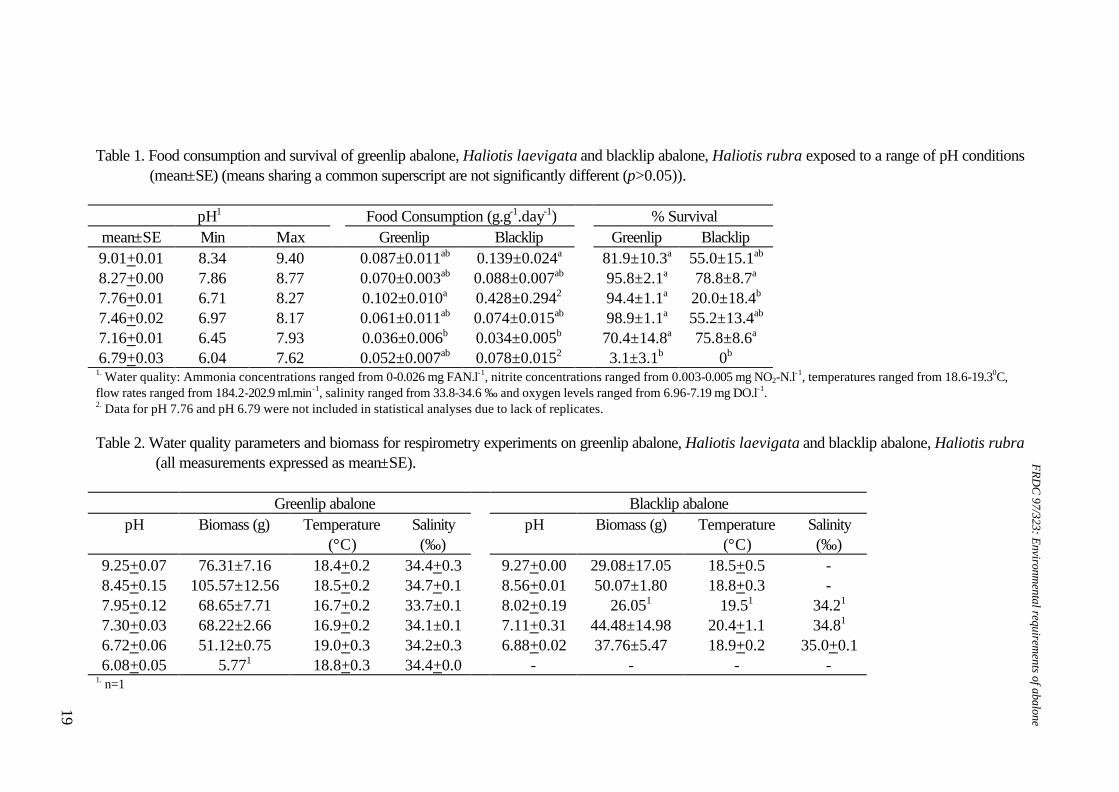
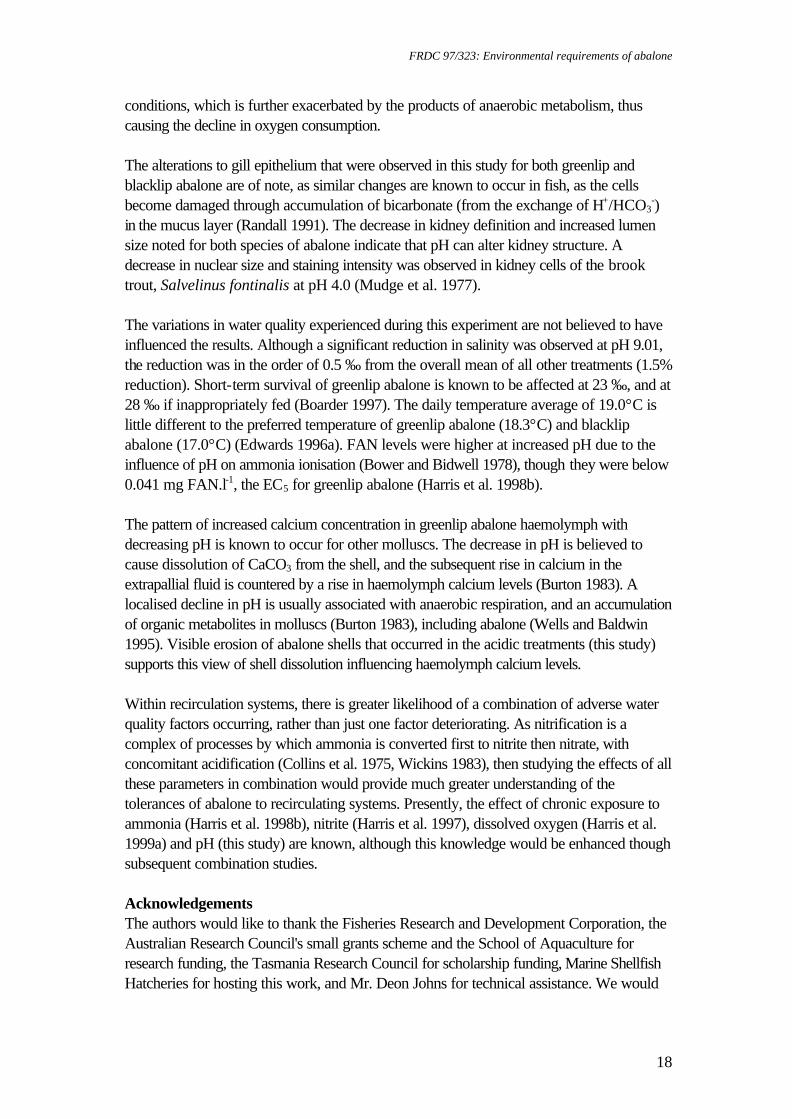
Table 1. Food consumption and survival of greenlip abalone, Haliotis laevigata and blacklip abalone, Haliotis rubra exposed to a range of pH conditions
(mean±SE) (means sharing a common superscript are not significantly different (p>0.05)).
pH1 Food Consumption (g.g-1.day-1) % Survival mean±SE Min Max Greenlip Blacklip Greenlip Blacklip 9.01+0.01 8.34 9.40 0.087±0.011ab 0.139±0.024a 81.9±10.3a 55.0±15.1ab 8.27+0.00 7.86 8.77 0.070±0.003ab 0.088±0.007ab 95.8±2.1a 78.8±8.7a 7.76+0.01 6.71 8.27 0.102±0.010a 0.428±0.2942 94.4±1.1a 20.0±18.4b 7.46+0.02 6.97 8.17 0.061±0.011ab 0.074±0.015ab 98.9±1.1a 55.2±13.4ab 7.16+0.01 6.45 7.93 0.036±0.006b 0.034±0.005b 70.4±14.8a 75.8±8.6a 6.79+0.03 6.04 7.62 0.052±0.007ab 0.078±0.0152 3.1±3.1b 0b
1. Water quality: Ammonia concentrations ranged from 0-0.026 mg FAN.l-1, nitrite concentrations ranged from 0.003-0.005 mg NO2-N.l-1, temperatures ranged from 18.6-19.30C, flow rates ranged from 184.2-202.9 ml.min-1, salinity ranged from 33.8-34.6 ‰ and oxygen levels ranged from 6.96-7.19 mg DO.l-1. 2. Data for pH 7.76 and pH 6.79 were not included in statistical analyses due to lack of replicates. Table 2. Water quality parameters and biomass for respirometry experiments on greenlip abalone, Haliotis laevigata and blacklip abalone, Haliotis rubra
(all measurements expressed as mean±SE).
Greenlip abalone Blacklip abalone pH Biomass (g) Temperature
(°C) Salinity (‰)
pH Biomass (g) Temperature (°C)
Salinity (‰)
9.25+0.07 76.31±7.16 18.4+0.2 34.4+0.3 9.27+0.00 29.08±17.05 18.5+0.5 - 8.45+0.15 105.57±12.56 18.5+0.2 34.7+0.1 8.56+0.01 50.07±1.80 18.8+0.3 - 7.95+0.12 68.65±7.71 16.7+0.2 33.7±0.1 8.02+0.19 26.051 19.51 34.21 7.30+0.03 68.22±2.66 16.9+0.2 34.1±0.1 7.11+0.31 44.48±14.98 20.4+1.1 34.81 6.72+0.06 51.12±0.75 19.0+0.3 34.2±0.3 6.88+0.02 37.76±5.47 18.9+0.2 35.0+0.1 6.08+0.05 5.771 18.8+0.3 34.4+0.0 - - - -
1. n=1
FRDC
97/323: Environmental requirem
ents of abalone
19
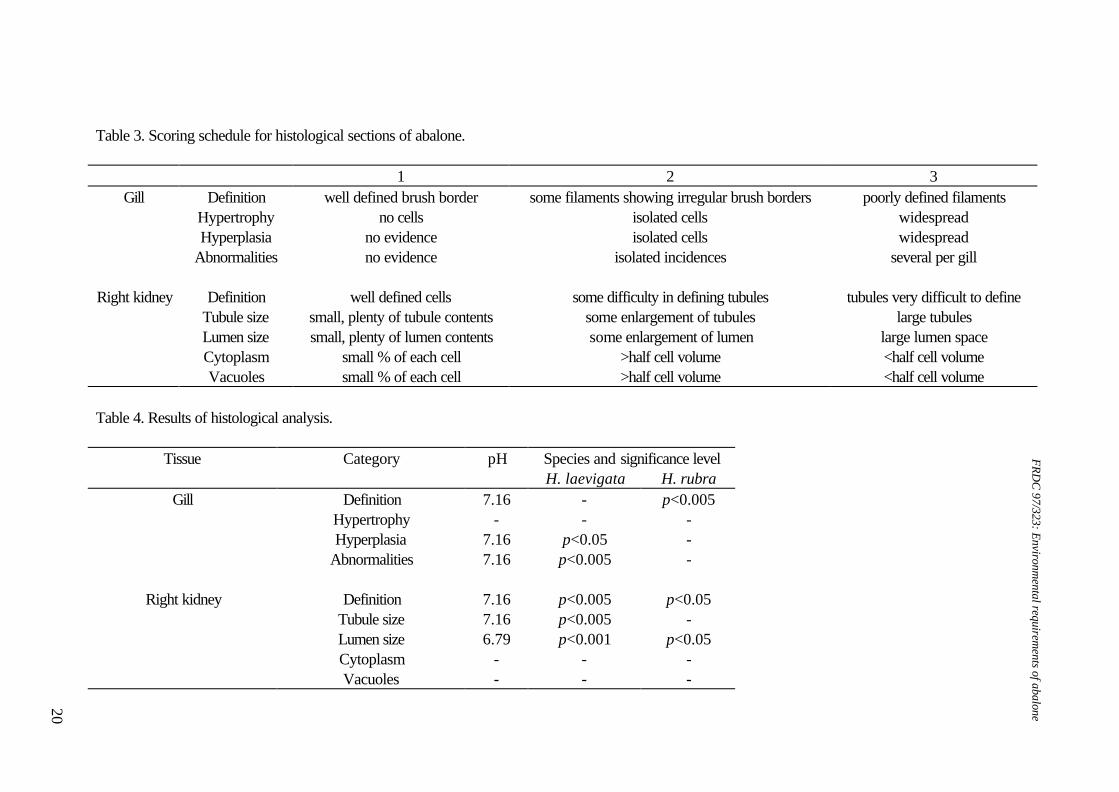
Table 3. Scoring schedule for histological sections of abalone.
1 2 3 Gill Definition well defined brush border some filaments showing irregular brush borders poorly defined filaments
Hypertrophy no cells isolated cells widespread Hyperplasia no evidence isolated cells widespread Abnormalities no evidence isolated incidences several per gill
Right kidney Definition well defined cells some difficulty in defining tubules tubules very difficult to define Tubule size small, plenty of tubule contents some enlargement of tubules large tubules Lumen size small, plenty of lumen contents some enlargement of lumen large lumen space Cytoplasm small % of each cell >half cell volume <half cell volume Vacuoles small % of each cell >half cell volume <half cell volume
Table 4. Results of histological analysis.
Tissue Category pH Species and significance level H. laevigata H. rubra
Gill Definition 7.16 - p<0.005 Hypertrophy - - - Hyperplasia 7.16 p<0.05 - Abnormalities 7.16 p<0.005 -
Right kidney Definition 7.16 p<0.005 p<0.05 Tubule size 7.16 p<0.005 - Lumen size 6.79 p<0.001 p<0.05 Cytoplasm - - - Vacuoles - - -
FRDC
97/323: Environmental requirem
ents of abalone
20
FRDC 97/323: Environmental requirements of abalone
22
pH
6.506.757.257.507.758.258.508.75 7.008.009.00
Spec
ific
gro
wth
rate
(len
gth)
as
%.d
ay-1
-0.1
0.0
0.1
0.2
0.3
0.4
y = 2.23x-0.14x2-8.97r2 = 0.86
a
a
b
bc
c
d
Figure 1. Specific growth rate (length) of juvenile greenlip abalone, Haliotis laevigata,
subjected to chronic pH conditions (mean±SE, n=3). Regression based on data for each replicate rather than treatment means.
FRDC 97/323: Environmental requirements of abalone
23
pH
6.757.257.507.758.258.508.75 7.008.009.00
Spec
ific
grow
th ra
te (m
ass)
as
%.d
ay-1
-0.6
-0.4
-0.2
0.2
0.4
0.6
0.8
1.2
0.0
1.0
1
y = 10.40x-0.63x2-42.16r2 = 0.92
EC5 EC5 EC50
a
ab
a
b
c
d
Figure 2. Specific growth rate (mass) of juvenile greenlip abalone, Haliotis laevigata,
subjected to chronic pH conditions (mean±SE, n=3). Regression based on data for each replicate rather than treatment means (1; n=1).
FRDC 97/323: Environmental requirements of abalone
24
pH
6.506.757.257.507.758.258.508.75 7.008.009.00
Spec
ific
gro
wth
rate
(len
gth)
as
%.d
ay-1
-0.10
-0.05
0.00
0.05
0.10
0.15
0.20
y = 1.89x-0.11x2-7.58r2 = 0.87
bcc
ab
a
d
d
Figure 3. Specific growth rate (length) of juvenile blacklip abalone, Haliotis rubra,
subjected to chronic pH conditions (mean±SE, n=3). Regression based on data for each replicate rather than treatment means.

FRDC 97/323: Environmental requirements of abalone
25
pH
7.257.507.758.258.508.75 7.008.009.00
Spec
ific
gro
wth
rate
(mas
s) a
s %
.day
-1
0.2
0.4
0.6
0.8
1.2
0.0
1.0
EC5 EC5EC50
y = 10.70x-0.65x2-42.94r2 = 0.64
EC50
a
a
ab ab
b
Figure 4. Specific growth rate (mass) of juvenile blacklip abalone, Haliotis rubra,
subjected to chronic pH conditions (mean±SE, n=3). Regression based on data for each replicate rather than treatment means.
FRDC 97/323: Environmental requirements of abalone
26
pH
6.757.257.507.758.258.508.75 7.008.009.00
Who
le w
et b
ody
mas
s (g
) : s
hell
leng
th (m
m)
0.07
0.08
0.09
0.10
0.11
0.12
0.13
ab
a
ab abab
b
Figure 5. Whole wet body mass : shell length of juvenile greenlip abalone, Haliotis
laevigata, subjected to chronic pH conditions (mean±SE, n=3). Regression based on data for each replicate rather than treatment means.

FRDC 97/323: Environmental requirements of abalone
27
pH
7.257.507.758.258.508.75 7.008.009.00
Who
le w
et b
ody
mas
s (g
) : s
hell
leng
th (m
m)
0.065
0.070
0.075
0.080
0.085
0.090
0.095
0.100
y = 0.30x - 0.018x2 - 1.14r2 = 0.69
ab
ab
a
ab
b
Figure 6. Whole wet body mass : shell length of juvenile blacklip abalone, Haliotis rubra,
subjected to chronic pH conditions (mean±SE, n=3). Regression based on data for each replicate rather than treatment means.

FRDC 97/323: Environmental requirements of abalone
28
pH
6.57.58.5 6.07.08.09.0
Oxy
gen
cons
umpt
ion
rate
(mg
O2.k
g-1.h
-1)
-20
0
20
40
60
80
100
120
bc bc
c
y=415.76x-26.32x2-1551.63r2=0.80
ab
aa
Figure 7. Oxygen consumption rate of juvenile greenlip abalone, Haliotis laevigata,
subjected to a range of pH conditions (mean±SE, n=2). Regression based on data for each replicate rather than treatment means.

FRDC 97/323: Environmental requirements of abalone
29
pH
6.75 7.25 7.50 7.75 8.25 8.50 8.75 9.25 9.507.00 8.00 9.00
Oxy
gen
cons
umpt
ion
rate
(mg.
kg-1
.h-1
)
-100
0
100
200
300
400
500
*
y=2736.96x-172.84x2-10560r2=0.69
Figure 8. Oxygen consumption rate of juvenile greenlip abalone, Haliotis rubra, subjected
to a range of pH conditions (mean±SE, n=2). Regression based on data for each replicate rather than treatment means.

FRDC 97/323: Environmental requirements of abalone
30
Figure 9. Right kidney of Haliotis laevigata exposed to pH 7.16. Magnification 400X. A-
Expanded lumen; B- enlarged tubule.
FRDC 97/323: Environmental requirements of abalone
31
Figure 10. Gill lamellae of Haliotis laevigata exposed to pH 7.16. Magnification 100X. A- Fused lamellae; B- expanded distal gill lamellar tip with dilated haemolymph channel (aneurism); C- hyperplasia.
Figure 11. Right kidney of Haliotis rubra exposed to pH 7.16. Magnification 400X. A-
Enlarged lumen of kidney tubule.

FRDC 97/323: Environmental requirements of abalone
32
Figure 12. Gill lamellae of Haliotis rubra exposed to pH 7.16. Magnification 400X. A-
Poorly defined brush border.
pH
7.25 7.50 7.75 8.25 8.50 8.757.00 8.00 9.00
Hae
mol
ymph
cal
cium
con
cent
ratio
n (
mm
ol.l-1
)
8.5
9.5
10.5
8.0
9.0
10.0
11.0
**
*
y=16.63-0.86xr2=0.78
* = significantly different to control (p<0.05)
1
Figure 13. Haemolymph calcium concentration in juvenile greenlip abalone, Haliotis
laevigata, exposed to a range of pH conditions (mean±SE). Regression based on individual tank values rather than treatment means (n=3). 1This treatment was excluded from statistical analysis due to high variability.

FRDC 97/323: Environmental requirements of abalone
32
6.2: The effect of dissolved oxygen supersaturation and
temperature on juvenile greenlip and blacklip abalone. Nontechnical summary Abalone are known to be sensitive to low dissolved oxygen concentrations. However, there is also evidence that slight supersaturation of oxygen may increase growth rates. Excessively high supersaturation, on the other hand, will cause disease: for example, gas bubble disease or increased bacterial infections. Obviously, growth rates will increase as temperature increases to the optimum for a species, but beyond this growth rates will be reduced and mortalities will increase. Thus, abalone culture systems are likely to have a relatively narrow window in which to operate for maximum production and cost effectiveness. The research described here examined the survival and growth of greenlip and blacklip abalone under 6 experimental treatments composed of 2 temperatures and 3 levels of oxygen saturation. Nominally, these were 17°C and 19°C and 100%, 110% and 120% saturation. Greenlip abalone tolerated this range of conditions well. There was no significant difference in either survival, growth (ranged over 0.07 to 0.1% d-1, specific growth rate for length) or food consumption for any of the experimental treatments. Therefore, greenlips are not likely to be adversely affected by natural fluctuations in temperature or oxygen within this range. However, there is no value in deliberately increasing temperature to 19°C or oxygen saturation above 100%. In contrast, blacklip abalone were significantly affected by some of the experimental treatments. Blacklips grew fastest (0.06% d-1, specific growth rate for length) at 17°C and 99% saturation. Growth was reduced under mild supersaturation (107%) at 17°C and at all levels of saturation at 19°C. More important was the effect on survival. At 19°C and either 99% or 123% mortality was approximately 50%. The survival rate was improved to 90% at mild supersaturation (107%). Survival at 17°C was above 70% for all levels of saturation and was best at 107% saturation (>90%). Hence, there is a strong requirement for temperature to be maintained close to 17°C for blacklip abalone. There is no value in increasing saturation of oxygen at 17°C, but, in the event of temperature increasing to 19°C, it would be useful to increase oxygen to 107% saturation to improve survival. However, this would need to be carefully monitored, as higher saturation levels may increase mortality.
FRDC 97/323: Environmental requirements of abalone
33
6.2 Effect of dissolved oxygen supersaturation and temperature on juvenile greenlip and blacklip abalone.
James O. Harris, Christopher M. Burke, Stephen J. Edwards and Deon R. Johns Introduction Recent research on water quality has revealed greenlip abalone to be sensitive to low dissolved oxygen in terms of growth, while demonstrating that growth increases may be possible at slight supersaturation (Harris et al. 1999a). Other research has similarly demonstrated that growth increases may occur in abalone held at up to 115% dissolved oxygen saturation (Leitman 1992). DO levels in excess of this are known to increase the incidence of gas bubble disease, bacterial infection and subsequent mortality (Elston 1983, Elston and Lockwood 1983). Almost all species in the young stages typically show a rapid increase in growth rate as temperature increases, passing through a peak of optimum temperature, followed by rapid decline as higher temperatures become adverse (Brett 1979). There are some data on the effects of temperature and DO saturation on the growth of abalone. Gilroy and Edwards (1998) examined the optimum temperature for growth and the temperature that abalone preferentially moved to within a gradient. They found that for greenlip abalone, the optimum temperatures for growth and for movement were 18.3 and 18.9 respectively. For blacklip abalone the optimum temperatures were 17.0°C and 16.9°C respectively. Greenlip abalone grown at a constant temperature of 20.1°C, 36 ‰ salinity and average DO saturation of 120% demonstrated shell length growth rates up to 165 µm/day, giving a Specific Growth Rate (SGR) of 0.59% (Coote et al. 1996). In another experimental system, and using greenlip abalone of similar size grown at a constant temperature of 19.0°C, 34 ‰ salinity and average DO saturation of 97%, Coote et al (1996) demonstrated shell length growth rates of up to 86 µm/day, or an SGR of 0.87%. Recent research on the environmental requirements of Australian abalone has demonstrated numerous areas where growth rate improvements can be made, in terms of water flow (Higham et al. 1998) and habitat requirements (Maguire et al. 1996). Temperature affects the solubility of oxygen in water. In view of this and the previous studies of supersaturation, the potential for increasing commercial growth rates by culturing abalone under oxygen supersaturation at different temperatures was examined. Materials and Methods Bioassay system The bioassay system consisted of six 1100 L reservoirs, each connected to a head adjustment column and three bioassay tanks, as described in Harris et al. (1999b). In each 70 L bioassay tank, there were two cages (100 mm x 35 cm PVC tube with 6 mm mesh floor and 8 mm mesh wall sections) suspended vertically, containing 30 greenlip or 30 blacklip abalone. Daily flow rates averaged 239.4±2.2 ml.min-1 (n=90; 18 tanks on 5 occasions) giving an effective replacement rate of 90% of bioassay tank volume in 10-12 h.

FRDC 97/323: Environmental requirements of abalone
34
This was within the recommended flow rates for aquatic toxicological studies (Sprague 1969). Identical 5 W submersible pumps were placed in each tank to produce a similar current flow (8.7 L min-1 output at zero head). The experiment was conducted using 200 and 300 W aquarium heaters in the bioassay tanks and constant head chambers, respectively, to maintain temperature. Bottled oxygen was used to control oxygen levels, with 6 treatments of 2 temperatures (17°C and 19°C) x 3 oxygen saturation levels (nominally 100%, 110% and 120%) in triplicate. The abalone were exposed to these conditions for 44-68 days. The juvenile greenlip abalone used in these experiments were approximately two years old and were obtained from a commercial hatchery at Bicheno, Tasmania, Australia, where the research was conducted (E148'18", S41' 53"). The juvenile blacklip abalone were of similar age and were obtained from a commercial farm at Swansea, Tasmania, Australia. The initial mean length and weight of the greenlip and blacklip abalone were 39.03±3.80 mm and 7.67±2.11 g and 31.92±4.19 mm and 4.87±1.65 g, respectively (mean±SD; n = 524 and 531). For 2-3 months before experimentation, the greenlip abalone were maintained on formulated abalone feed (FRDC Diet #6), and the blacklip abalone had been maintained on a similar formulated abalone feed (Adam & Amos). Blacklip abalone were acclimatised for 3 days in flowing, aerated seawater prior to further handling. All abalone were anaesthetised (0.1% benzocaine) until they could be easily removed from the tank surfaces. Subsequently, they were weighed to the nearest 0.01 g, measured with callipers to 0.1 mm, tagged (Hallprint, Adelaide, Australia) and randomly distributed to 18 bioassay units to give 30 of each species within each tank. Water quality analysis The pH, temperature, salinity and DO in all tanks were measured on all days (Table 2). A pH meter and combination glass electrode (TPS) were calibrated with phosphate (pH=7.00) and borate (pH=9.28) buffers daily before use (Bruno and Svoronos, 1989). A TPS oxygen electrode, used for daily measurements, was calibrated before use in 'air-saturated' seawater. The efficiency of this calibration was validated occasionally using Winkler's titration. Water samples were collected in acid-washed glassware, and ammonia was measured using the indophenol blue spectrophotometric method (Solórzano, 1969, as modified by Dal Pont et al. 1974). The concentration of ammonia was measured as total ammonia-nitrogen (TAN), while free ammonia-nitrogen (FAN) was calculated from appropriate temperature, pH and salinity tables (Bower and Bidwell, 1978) (Table 2). Nitrite was occasionally measured by the diazotisation method (Grasshoff, 1989). Chronic exposure to supersaturated seawater at two temperatures Six experimental treatments were established (Table 1). Abalone were acclimatised to the bioassay system for 4-6 days before adjustment commenced. All cages were checked daily for mortality. Abalone were fed a proprietary, formulated abalone diet (ABCHOW) every two to three days. The feeding ration was adjusted in response to food consumption data as the trial progressed. Food consumption was estimated from uneaten food removed from the base of the cages after two days and dried for 24-48 hours at 55-60oC. Residual food weight was not corrected for soluble and particulate nutrient losses over the two days.

FRDC 97/323: Environmental requirements of abalone
35
Apparent food consumption (amount of food supplied minus residual food as g dry weight) was divided by the initial tank biomass, less the weight of any mortalities to that point. A valve in the base of each bioassay tank was opened daily to remove organic wastes. Tanks were also cleaned more thoroughly, on average, every 9 days. Cleaning involved lowering the water level, siphoning enough water from the bioassay tank into a 20 l bucket to cover the cages, removing cages to the bucket, draining the tank, scrubbing the tanks and cages, refilling the tanks directly from the reservoirs and returning the cages to the tanks. This took less than 10 minutes for any tank. Abalone were removed for respirometry in groups over 14 days. This is unlikely to have been sufficient time for significant differences in growth due to stocking density to have arisen. All abalone were weighed and measured for the final growth data. Oxygen consumption rates at end of the chronic bioassay The respirometer system included five elliptical perspex chambers (of 2.3 l) normally set up with two replicate chambers for each treatment and one chamber as a control (no animals), as described in Harris et al. (1997). Commencing on day 57, abalone from the bioassay system were transferred to respirometer chambers for three days. These animals had been fed before removal. Abalone that did not attach to transferable plastic strips in the cages within the bioassay units were removed manually, either by sliding them directly from the substrate or by inserting a thin, plastic card underneath the foot. Temperature and pH levels were measured within the constant head chambers (Table 2). Statistical analysis Data were subjected to two factor ANOVA after meeting assumptions of normality with the Shapiro-Wilk test (Zar, 1996) and homogeneity of variance with Cochran's test (Underwood, 1981). Replicates were considered to be independent and oxygen saturation and temperature were analysed as fixed factors. If ANOVA provided a significant result, further comparisons were made between treatments with Tukey’s HSD (Sokal and Rohlf, 1995). Survival data (as percentage) and whole wet body weight (WWBW): shell length (SL) ratio were transformed (arcsin % .x0 01 and log, respectively) to satisfy assumptions of normality and homogeneity of variance prior to analysis. Preliminary analysis indicated that initial abalone size did not affect growth rate. All analyses included assessment of FAN, nitrite-N, DO and temperature as covariates (Sokal and Rohlf, 1995), and were conducted using JMP 3.0 software (SAS Institute). Results Chronic exposure to supersaturated seawater at two temperatures There were no significant relationships between temperature and oxygen saturation for greenlip abalone in terms of either SGR length (Figure 1) or weight (Figure 2) (p>0.05). The ANOVA of blacklip abalone SGR length revealed that saturation (p<0.05) and temperature (p<0.05) significantly affected growth (Table 3). When the means were compared, blacklip abalone held at 17°C and 99% oxygen saturation grew significantly

FRDC 97/323: Environmental requirements of abalone
36
faster than all other treatments of blacklip abalone held at 19°C, and significantly faster than blacklip abalone maintained at 114% oxygen saturation and 17°C (p<0.05). SGR weight for blacklip abalone (Figure 4) was not significantly affected by temperature or oxygen saturation within the range tested (p>0.05). There was a significant effect of saturation on food consumption for blacklip abalone (p<0.05) (Figure 5), with food consumption rate at 19°C and 98% oxygen saturation higher (sometimes significantly) than at all other treatments. At 17°C there was no difference in food consumption over the range of saturation tested. Survival of blacklip abalone was also significantly affected (p<0.005) by both temperature (p<0.01) and oxygen saturation (p<0.01) (Figure 6). When the means were compared, blacklip abalone held at 19°C had significantly higher mortalities for both 98% and 123% oxygen saturation, compared to mortality at 107% oxygen saturation. There were no significant differences in survival of greenlip abalone for any treatments. Oxygen consumption rates at end of the chronic bioassay Oxygen consumption rate was compared against temperature, saturation and species in a three-way ANOVA. This model provided a significant overall result (p<0.01), but only saturation produced a significant individual effect (p<0.001). A one-way ANOVA was used with pooled data for species and temperature, in order that saturation could be compared against oxygen consumption rate. This was similarly significant (p<0.001), while further analysis using Student’s t-test showed that oxygen consumption was significantly depressed for the two higher levels of oxygen saturation (p<0.05) (Figure 7). Discussion The highest growth rate for blacklip abalone was recorded at 17°C in this experiment. This species appears more tolerant of moderate supersaturation at the higher temperature, although growth rates at 19°C were all slower than for 17°C. The optimum temperature for growth of this species is 17°C, while for greenlips it is 18.3°C(Gilroy and Edwards, 1998). Abalone appear to be tolerant of moderate oxygen supersaturation. Growth and survival of greenlip abalone were not significantly different over the range of temperature and dissolved oxygen tested. The results for greenlip abalone are similar to Haliotis rufescens, where growth increases occurred up to 115% oxygen saturation, but decreased at higher saturations (Leitman, 1992). Previous research on H. laevigata revealed that growth increases may be possible at moderate supersaturation (Harris et al., 1999a), but this was not found here. Good survival for blacklip abalone was attained at moderate supersaturation. However, although WWBM growth was not affected, shell growth was reduced in supersaturation. For greenlip abalone, the lower variability of the survival data at 107% oxygen saturation indicates that a similar pattern may apply. The decline in blacklip abalone growth rate with increasing oxygen saturation suggests a lower tolerance to moderate supersaturation than for greenlip abalone. Elston (1983) reported that oxygen levels in excess of 150% caused depigmentation, lethargy and swelling of juvenile H. rufescens tissue, with emboli present throughout the muscle and connective tissue. These are known to result in bacterial infection and
FRDC 97/323: Environmental requirements of abalone
37
subsequent mortality (Elston and Lockwood, 1983). However, small juvenile greenlip abalone appear to have a much higher tolerance for supersaturated conditions (Loipersberger, 1996). Newly settled greenlip abalone exposed to oxygen saturations of up to 300% suffered no mortality after 22 days (Loipersberger, 1997). No studies that investigated the direct effect of supersaturation on oxygen consumption rate in aquatic animals could be located in the literature. However, the haemocyanin of greenlip and blacklip abalone have been studied in detail (Ainslie, 1980a, b). As oxygen approaches 100% saturation within the blood, the rate of association of oxygen with haemocyanin declines. This would in turn explain the decline in oxygen consumption rate observed in this study at supersaturated conditions. In addition, the correlation in this study between this decline and the drop in food consumption rate suggests that metabolism is affected in these conditions. Whether this is due to a reduced requirement for activity, or is caused by a compromise to normal metabolism is unclear. However, the net result is an initial reduction in food and oxygen consumption rates, and as oxygen supersaturates further, growth rates begin to decline for blacklip abalone. A previous bioassay regarding dissolved oxygen levels and growth rates for greenlip abalone, in the same experimental system, produced low growth rates, in spite of 100% oxygen saturation (SGR weight = 0.21±0.03 %.day-1; SGR length = 0.01±0.003 %.day-1) (Harris et al. 1999a). In a subsequent bioassay, submersible pumps were included in the tanks to stimulate current flow, and improvement in growth rates occurred (SGR weight = 0.87±0.11 %.day-1; SGR length = 0.21±0.03 %.day-1) (Harris et al. 1998). However, growth rates in this bioassay were low (highest SGR weight = 0.36±0.06%.day-1, SGR length = 0.11±0.01), although SGR length has improved on the previous dissolved oxygen experiment. It may be possible that the type of oxygen used in these experiments is of insufficient quality to maintain high growth rates over extended periods, however, comparisons between medical and industrial oxygen supplies in growth trials are required for confirmation. Alternatively, the low growth rates may indicate individual variability among cohorts of abalone. More important than growth effects was the effect of treatments on survival of blacklip abalone. At 19°C and either 99% or 123% mortality was approximately 50%. The survival rate was improved to 90% at mild supersaturation (107%). Survival at 17°C was above 70% for all levels of saturation and was best at 107% saturation (>90%). Hence, there is a strong requirement for temperature to be maintained close to 17°C for blacklip abalone. There is no value in increasing saturation of oxygen at 17°C, but, in the event of temperature increasing to 19°C, it would be useful to increase oxygen to 107% saturation to improve survival. However, this would need to be carefully monitored, as higher saturation levels may increase mortality.
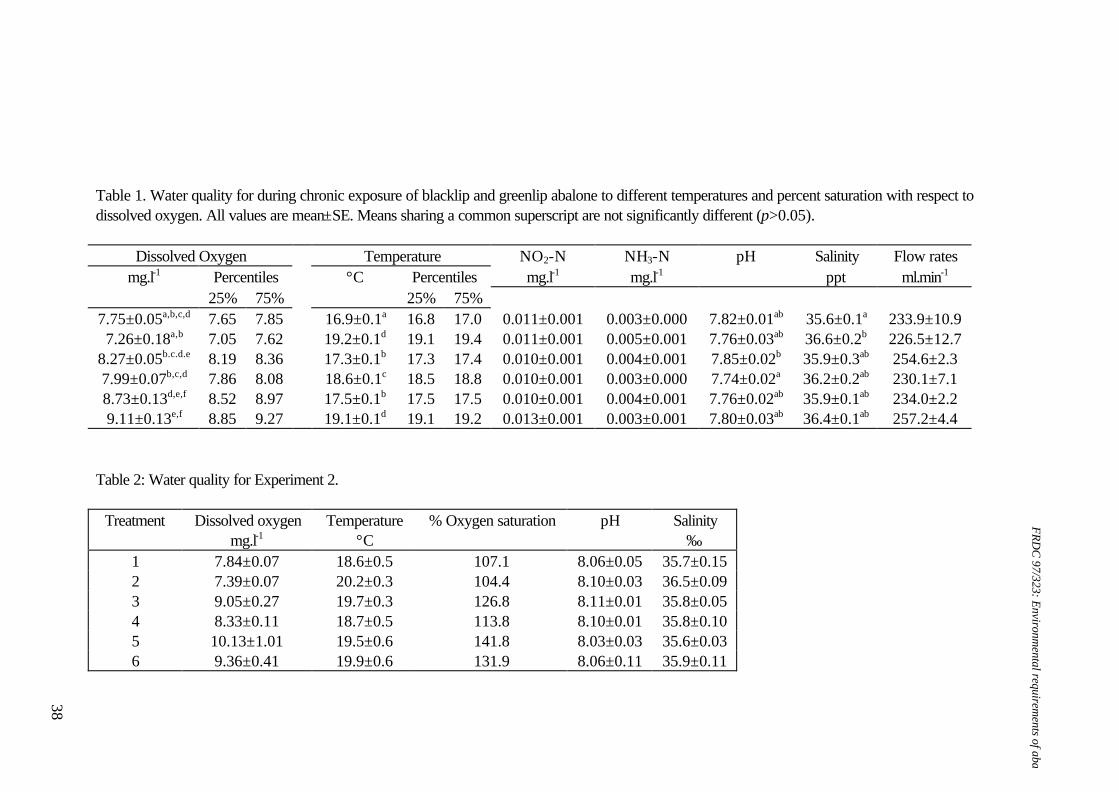
Table 1. Water quality for during chronic exposure of blacklip and greenlip abalone to different temperatures and percent saturation with respect to dissolved oxygen. All values are mean±SE. Means sharing a common superscript are not significantly different (p>0.05).
Dissolved Oxygen Temperature NO2-N NH3-N pH Salinity Flow rates mg.l-1 Percentiles °C Percentiles mg.l-1 mg.l-1 ppt ml.min-1
25% 75% 25% 75% 7.75±0.05a,b,c,d 7.65 7.85 16.9±0.1a 16.8 17.0 0.011±0.001 0.003±0.000 7.82±0.01ab 35.6±0.1a 233.9±10.9 7.26±0.18a,b 7.05 7.62 19.2±0.1d 19.1 19.4 0.011±0.001 0.005±0.001 7.76±0.03ab 36.6±0.2b 226.5±12.7
8.27±0.05b.c.d.e 8.19 8.36 17.3±0.1b 17.3 17.4 0.010±0.001 0.004±0.001 7.85±0.02b 35.9±0.3ab 254.6±2.3 7.99±0.07b,c,d 7.86 8.08 18.6±0.1c 18.5 18.8 0.010±0.001 0.003±0.000 7.74±0.02a 36.2±0.2ab 230.1±7.1 8.73±0.13d,e,f 8.52 8.97 17.5±0.1b 17.5 17.5 0.010±0.001 0.004±0.001 7.76±0.02ab 35.9±0.1ab 234.0±2.2 9.11±0.13e,f 8.85 9.27 19.1±0.1d 19.1 19.2 0.013±0.001 0.003±0.001 7.80±0.03ab 36.4±0.1ab 257.2±4.4
Table 2: Water quality for Experiment 2.
Treatment Dissolved oxygen mg.l-1
Temperature °C
% Oxygen saturation
pH Salinity ‰
1 7.84±0.07 18.6±0.5 107.1 8.06±0.05 35.7±0.15 2 7.39±0.07 20.2±0.3 104.4 8.10±0.03 36.5±0.09 3 9.05±0.27 19.7±0.3 126.8 8.11±0.01 35.8±0.05 4 8.33±0.11 18.7±0.5 113.8 8.10±0.01 35.8±0.10 5 10.13±1.01 19.5±0.6 141.8 8.03±0.03 35.6±0.03 6 9.36±0.41 19.9±0.6 131.9 8.06±0.11 35.9±0.11
38
FRDC
97/323: Environmental requirem
ents of abalone

FRDC 97/323: Environmental requirements of abalone
39
Table 3: ANOVA results for exposure of abalone to different temperatures and levels of saturation with respect to oxygen. SGRL and SGRW are the specific growth rates with respect to length and weight respectively. Numbers indicate level of probability at which factors or their interaction had a significant effect on a variable.
Species Variable Temperature
A Saturation
B Interaction
A X B SGRL #NS NS NS SGRW NS NS NS Food consumption NS NS NS
Greenlip abalone
Survival NS NS NS SGRL 0.05 0.05 NS SGRW NS NS NS Food consumption NS 0.05 NS
Blacklip abalone
Survival <0.01 <0.01 NS Both species Oxygen consumption NS <0.001 NS
#NS not significant.

FRDC 97/323: Environmental requirements of abalone
40
% Oxygen saturation
95 100 105 110 115 120 125
Spec
ific
Gro
wth
Rat
e (l
engt
h) a
s %
.day
-1
0.00
0.02
0.04
0.06
0.08
0.10
0.12
17oC 19oC
Figure 1. Specific growth rate (length) of juvenile greenlip abalone, Haliotis laevigata,
subjected to oxygen supersaturated conditions at two temperatures (mean±SE, n=3).

FRDC 97/323: Environmental requirements of abalone
41
% Oxygen saturation
95 100 105 110 115 120 125
Spec
ific
Gro
wth
Rat
e (w
eigh
t) as
%.d
ay-1
0.00
0.05
0.10
0.15
0.20
0.25
0.30
0.35
0.40 17 oC 19oC
Figure 2. Specific growth rate (weight) of juvenile greenlip abalone, Haliotis laevigata,
subjected to oxygen supersaturated conditions at two temperatures (mean±SE, n=3).

FRDC 97/323: Environmental requirements of abalone
42
% Oxygen saturation
95 100 105 110 115 120 125
Spec
ific
Gro
wth
Rat
e (l
engt
h) a
s %
.day
-1
0.00
0.01
0.02
0.03
0.04
0.05
0.06
0.07
17 oC 19 oC a
ab
b bb
b
Figure 3. Specific growth rate (length) of juvenile blacklip abalone, Haliotis rubra,
subjected to oxygen supersaturated conditions at two temperatures (mean±SE, n=3). Means sharing a common superscript are not significantly different (p>0.05).

FRDC 97/323: Environmental requirements of abalone
43
% Oxygen saturation
95 100 105 110 115 120 125
Spec
ific
Gro
wth
Rat
e (w
eigh
t) as
%.d
ay-1
0.00
0.05
0.10
0.15
0.20
0.25
0.30
0.35
17 oC 19 oC
Figure 4. Specific growth rate (weight) of juvenile blacklip abalone, Haliotis rubra,
subjected to oxygen supersaturated conditions at two temperatures (mean±SE, n=3).

FRDC 97/323: Environmental requirements of abalone
44
% Oxygen saturation
95 100 105 110 115 120 125
Food
con
sum
ptio
n ra
te
g (d
ry w
eigh
t).g
(who
le w
et b
ody
wei
ght)-1
.day
-1
0.0
0.1
0.2
0.3
0.4
0.5
17oC19oC
ab
a
abbb
b
Figure 5. Food consumption rate of juvenile blacklip abalone, Haliotis rubra, subjected to
oxygen supersaturated conditions at two temperatures (mean±SE, n=3). Means sharing a common superscript are not significantly different (p>0.05).
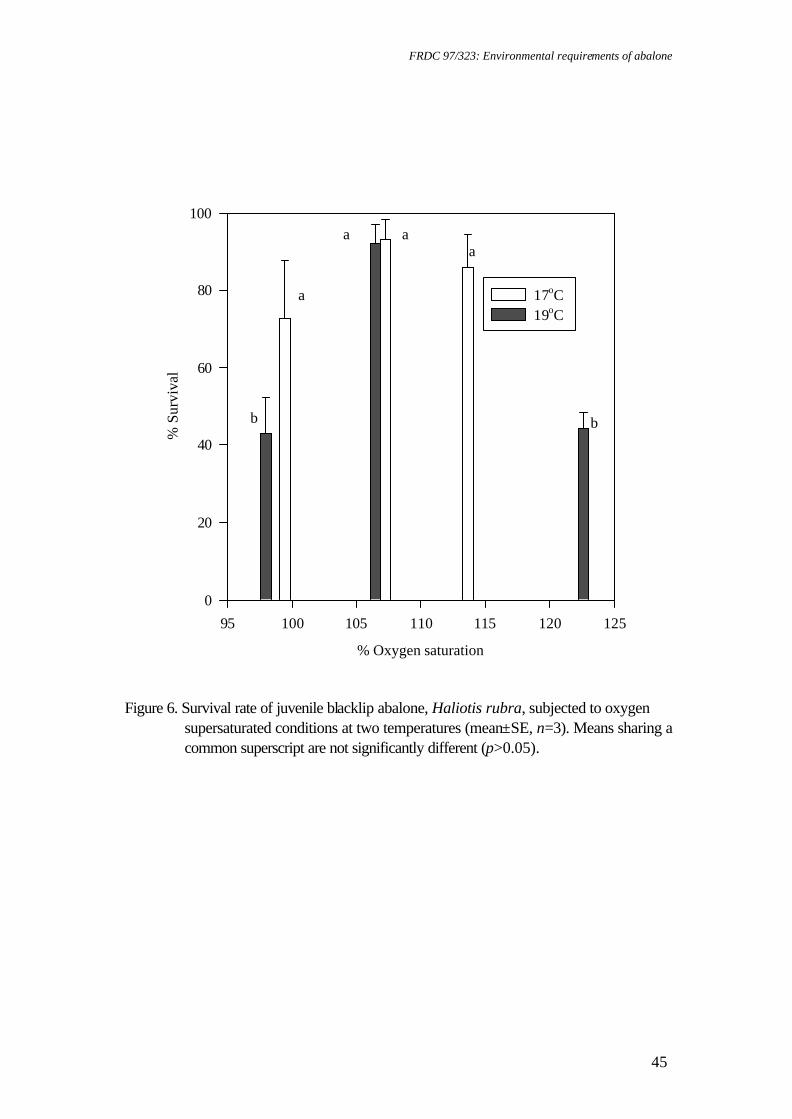
FRDC 97/323: Environmental requirements of abalone
45
% Oxygen saturation
95 100 105 110 115 120 125
% S
urvi
val
0
20
40
60
80
100
17oC 19oC
a
aaa
b b
Figure 6. Survival rate of juvenile blacklip abalone, Haliotis rubra, subjected to oxygen
supersaturated conditions at two temperatures (mean±SE, n=3). Means sharing a common superscript are not significantly different (p>0.05).

FRDC 97/323: Environmental requirements of abalone
46
% Oxygen saturation
100 105 110 115 120 125 130 135 140 145
Oxy
gen
cons
umpt
ion
rate
(mg.
kg-1
.h-1
)
20
30
40
50
60
70
80
90
ab
a
bb
b
Figure 7. Oxygen consumption rate of juvenile abalone subjected to oxygen supersaturated
conditions at two temperatures (mean±SE, n=3). Means sharing a common superscript are not significantly different (p>0.05). Data for species and temperature are pooled.
FRDC 97/323: Environmental requirements of abalone
47
6.3 Growth reductions in greenlip (Haliotis laevigata) and blacklip (H. rubra) abalone resulting from chronic exposure to sublethal combinations of elevated ammonia and low dissolved oxygen levels.
Nontechnical summary In a poorly managed culture system, waste products such as ammonia may increase and dissolved oxygen may decrease if it is consumed faster than it is supplied. Both of these may adversely affect the health of the abalone. However, it is likely that both parameters will vary together in commercial growout systems. The experiment described here evaluated the combined effect of chronic exposure to high ammonia (as free ammonia-nitrogen, FAN) and low DO on abalone growth. Although temperature and pH varied throughout the trial, the variations were not likely to be biologically significant. Thus these parameters probably did not cause the differences observed between treatments. Groups of greenlip and blacklip abalone were exposed to one of the following treatments for up to 65 days: ♦ Control: 7.16 mg L-1 DO (96% saturation) and 5.22 µg L-1 FAN. ♦ Treatment 2: 6.19 mg L-1 DO (83%) and 24.04 µg L-1 FAN. ♦ Treatment 3: 5.58 mg L-1 DO (76%) and 40.01 µg L-1 FAN. ♦ Treatment 4: 6.26 mg L-1 DO (85%) and 197.25 µg L-1 FAN. ♦ Treatment 5: 4.89 mg L-1 DO (64%) and 38.70 µg L-1 FAN. ♦ Treatment 6: 4.29 mg L-1 DO (56%) and 59.00 µg L-1 FAN. Overall, the growth of greenlip abalone was mediocre (<47 µm d-1 for the control) and was poor for the blacklip abalone (<11 µm d-1 for the control). This made it difficult to observe statistically significant differences between the controls and treatments. However, the control animals mostly grew better than animals subjected to low DO and high FAN. Indeed abalone maintained at either 76% DO saturation with 40 µg L-1 FAN or at 85% DO saturation with 197.25 µg L-1 FAN grew significantly worse than the control animals. For blacklips, animals in both of these treatments actually lost weight. Paradoxically, greenlip abalone held at 38 - 59 µg L-1 FAN grew significantly better with respect to weight gain, when exposed to 64 or 56% DO saturation, than did greenlips held at 76% DO saturation. This may have been a result of higher concentrations of nitrite that were observed at 76% DO. Thus, subjecting either greenlip or blacklip abalone to 0.04 mg L-1 FAN and 76% DO greatly reduced growth. However, a further reduction in DO to 56 to 64% saturation, together with a similar concentration of FAN, enabled growth to recover to approximately the same as controls.
FRDC 97/323: Environmental requirements of abalone
48
6.3: Growth reductions in greenlip (Haliotis laevigata) and blacklip (H. rubra) abalone resulting from chronic exposure to sublethal combinations of elevated ammonia and low dissolved oxygen levels.
Stephen Hindrum, Chris Burke and Stephen Edwards Introduction Previous research has shown that greenlip abalone are extremely sensitive to poor water quality, with growth depression being detected at modest declines in dissolved oxygen or slight increases in free ammonia nitrogen (FAN) (Harris et al. 1998b, 1999a). Although there is little information about water quality in commercial grow out tanks, it is probable that low DO and elevated ammonia are more likely to occur together rather than alone. This raises the question of whether these factors in combination have a greater impact than the sum of the individual effects. Furthermore, if abalone are chronically exposed to low dissolved oxygen and elevated ammonia, then it is possible that their response to a more severe exposure may differ from non-exposed abalone. This has significant commercial implications for managing water quality, and may provide an indication of how badly tanks will be affected by accidental systems failure. This trial was designed to answer some of these questions. A growth trial was conducted, using 2 species of abalone, based on exposure to 2 dissolved oxygen (DO) levels at either 2 or 3 different concentrations of free ammonia-nitrogen (FAN). A challenge exposure was then used to see if exposure history altered the effect of an episode of more severe deterioration in water quality. Boarder (1997) showed that nutritional history affected abalone response to altered water quality (lowered salinity). The potential effects of the chronic exposure, and of the subsequent challenge, on oxygen consumption, histology and serum ion regulation were investigated. Methods and materials Bioassay system The trial was conducted at a research facility at Bicheno, (E148°1', S41°5'). The bioassay system used is described by Harris et al. in section 6.1 and by Harris et al. (1997, 1998b). Average water flow through the units, measured at the outlet, was 199.77 + 33.22 mL min-1 (mean + sd, n=157), which gave 90% replacement of water within 15 h. Greenlip and blacklip abalone were held in separate circular cages, suspended in the water column. The bioassay units were cleaned every 7-10 d by placing cages in a replicate unit, while the destocked unit was drained, brushed out, hosed with fresh water, and refilled from the appropriate header column. The cages were fully submerged when placed in the bottom of the bioassay unit. By sequentially cleaning the triplicate tanks of each treatment disturbance to the pre-set DO level was minimised. A valve in the bottom of the lower cone was opened daily to remove accumulated particulate wastes. The 4-mm tubing connecting units to the header column was replaced with clean tubing every 15 to 20 days.
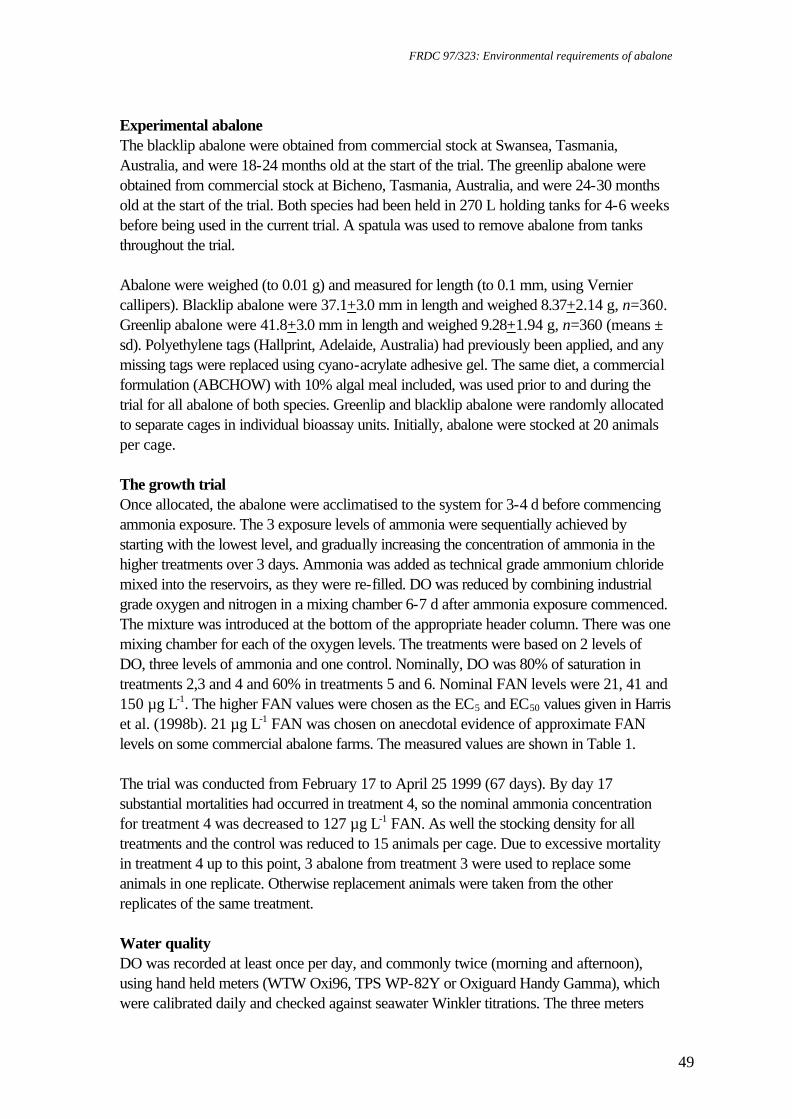
FRDC 97/323: Environmental requirements of abalone
49
Experimental abalone The blacklip abalone were obtained from commercial stock at Swansea, Tasmania, Australia, and were 18-24 months old at the start of the trial. The greenlip abalone were obtained from commercial stock at Bicheno, Tasmania, Australia, and were 24-30 months old at the start of the trial. Both species had been held in 270 L holding tanks for 4-6 weeks before being used in the current trial. A spatula was used to remove abalone from tanks throughout the trial. Abalone were weighed (to 0.01 g) and measured for length (to 0.1 mm, using Vernier callipers). Blacklip abalone were 37.1+3.0 mm in length and weighed 8.37+2.14 g, n=360. Greenlip abalone were 41.8+3.0 mm in length and weighed 9.28+1.94 g, n=360 (means ± sd). Polyethylene tags (Hallprint, Adelaide, Australia) had previously been applied, and any missing tags were replaced using cyano-acrylate adhesive gel. The same diet, a commercial formulation (ABCHOW) with 10% algal meal included, was used prior to and during the trial for all abalone of both species. Greenlip and blacklip abalone were randomly allocated to separate cages in individual bioassay units. Initially, abalone were stocked at 20 animals per cage. The growth trial Once allocated, the abalone were acclimatised to the system for 3-4 d before commencing ammonia exposure. The 3 exposure levels of ammonia were sequentially achieved by starting with the lowest level, and gradually increasing the concentration of ammonia in the higher treatments over 3 days. Ammonia was added as technical grade ammonium chloride mixed into the reservoirs, as they were re-filled. DO was reduced by combining industrial grade oxygen and nitrogen in a mixing chamber 6-7 d after ammonia exposure commenced. The mixture was introduced at the bottom of the appropriate header column. There was one mixing chamber for each of the oxygen levels. The treatments were based on 2 levels of DO, three levels of ammonia and one control. Nominally, DO was 80% of saturation in treatments 2,3 and 4 and 60% in treatments 5 and 6. Nominal FAN levels were 21, 41 and 150 µg L-1. The higher FAN values were chosen as the EC5 and EC50 values given in Harris et al. (1998b). 21 µg L-1 FAN was chosen on anecdotal evidence of approximate FAN levels on some commercial abalone farms. The measured values are shown in Table 1. The trial was conducted from February 17 to April 25 1999 (67 days). By day 17 substantial mortalities had occurred in treatment 4, so the nominal ammonia concentration for treatment 4 was decreased to 127 µg L-1 FAN. As well the stocking density for all treatments and the control was reduced to 15 animals per cage. Due to excessive mortality in treatment 4 up to this point, 3 abalone from treatment 3 were used to replace some animals in one replicate. Otherwise replacement animals were taken from the other replicates of the same treatment. Water quality DO was recorded at least once per day, and commonly twice (morning and afternoon), using hand held meters (WTW Oxi96, TPS WP-82Y or Oxiguard Handy Gamma), which were calibrated daily and checked against seawater Winkler titrations. The three meters
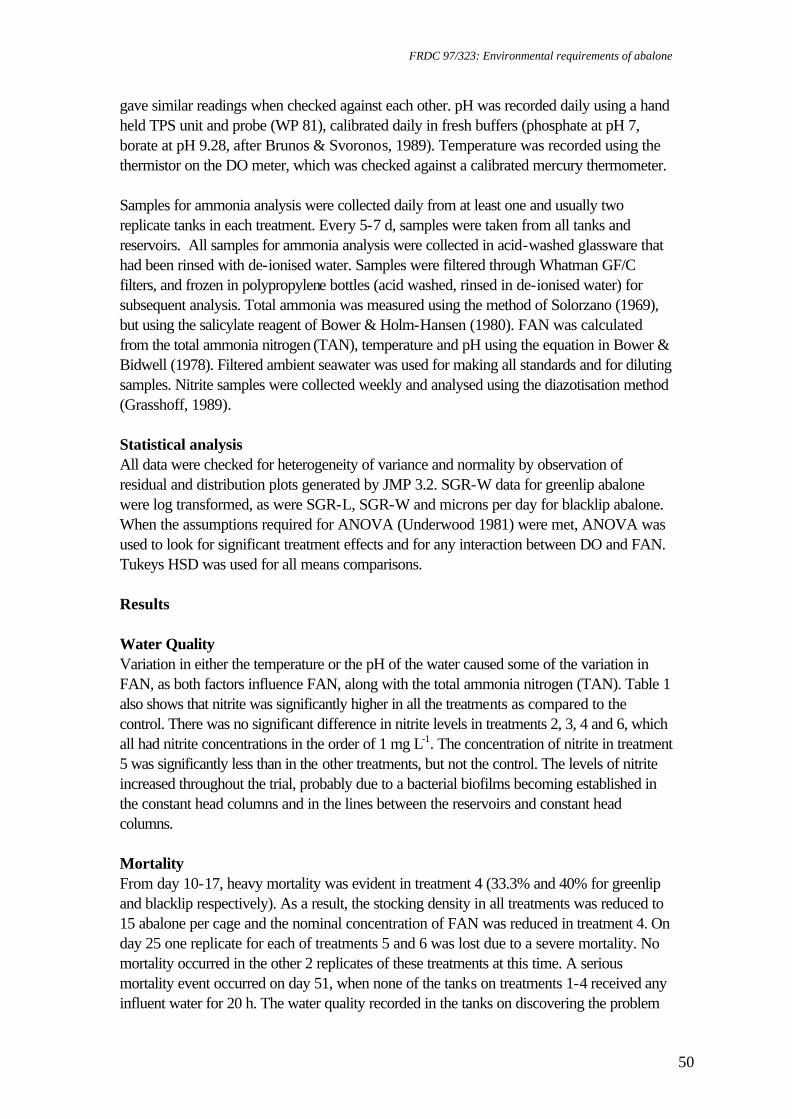
FRDC 97/323: Environmental requirements of abalone
50
gave similar readings when checked against each other. pH was recorded daily using a hand held TPS unit and probe (WP 81), calibrated daily in fresh buffers (phosphate at pH 7, borate at pH 9.28, after Brunos & Svoronos, 1989). Temperature was recorded using the thermistor on the DO meter, which was checked against a calibrated mercury thermometer. Samples for ammonia analysis were collected daily from at least one and usually two replicate tanks in each treatment. Every 5-7 d, samples were taken from all tanks and reservoirs. All samples for ammonia analysis were collected in acid-washed glassware that had been rinsed with de-ionised water. Samples were filtered through Whatman GF/C filters, and frozen in polypropylene bottles (acid washed, rinsed in de-ionised water) for subsequent analysis. Total ammonia was measured using the method of Solorzano (1969), but using the salicylate reagent of Bower & Holm-Hansen (1980). FAN was calculated from the total ammonia nitrogen (TAN), temperature and pH using the equation in Bower & Bidwell (1978). Filtered ambient seawater was used for making all standards and for diluting samples. Nitrite samples were collected weekly and analysed using the diazotisation method (Grasshoff, 1989). Statistical analysis All data were checked for heterogeneity of variance and normality by observation of residual and distribution plots generated by JMP 3.2. SGR-W data for greenlip abalone were log transformed, as were SGR-L, SGR-W and microns per day for blacklip abalone. When the assumptions required for ANOVA (Underwood 1981) were met, ANOVA was used to look for significant treatment effects and for any interaction between DO and FAN. Tukeys HSD was used for all means comparisons. Results Water Quality Variation in either the temperature or the pH of the water caused some of the variation in FAN, as both factors influence FAN, along with the total ammonia nitrogen (TAN). Table 1 also shows that nitrite was significantly higher in all the treatments as compared to the control. There was no significant difference in nitrite levels in treatments 2, 3, 4 and 6, which all had nitrite concentrations in the order of 1 mg L-1. The concentration of nitrite in treatment 5 was significantly less than in the other treatments, but not the control. The levels of nitrite increased throughout the trial, probably due to a bacterial biofilms becoming established in the constant head columns and in the lines between the reservoirs and constant head columns. Mortality From day 10-17, heavy mortality was evident in treatment 4 (33.3% and 40% for greenlip and blacklip respectively). As a result, the stocking density in all treatments was reduced to 15 abalone per cage and the nominal concentration of FAN was reduced in treatment 4. On day 25 one replicate for each of treatments 5 and 6 was lost due to a severe mortality. No mortality occurred in the other 2 replicates of these treatments at this time. A serious mortality event occurred on day 51, when none of the tanks on treatments 1-4 received any influent water for 20 h. The water quality recorded in the tanks on discovering the problem
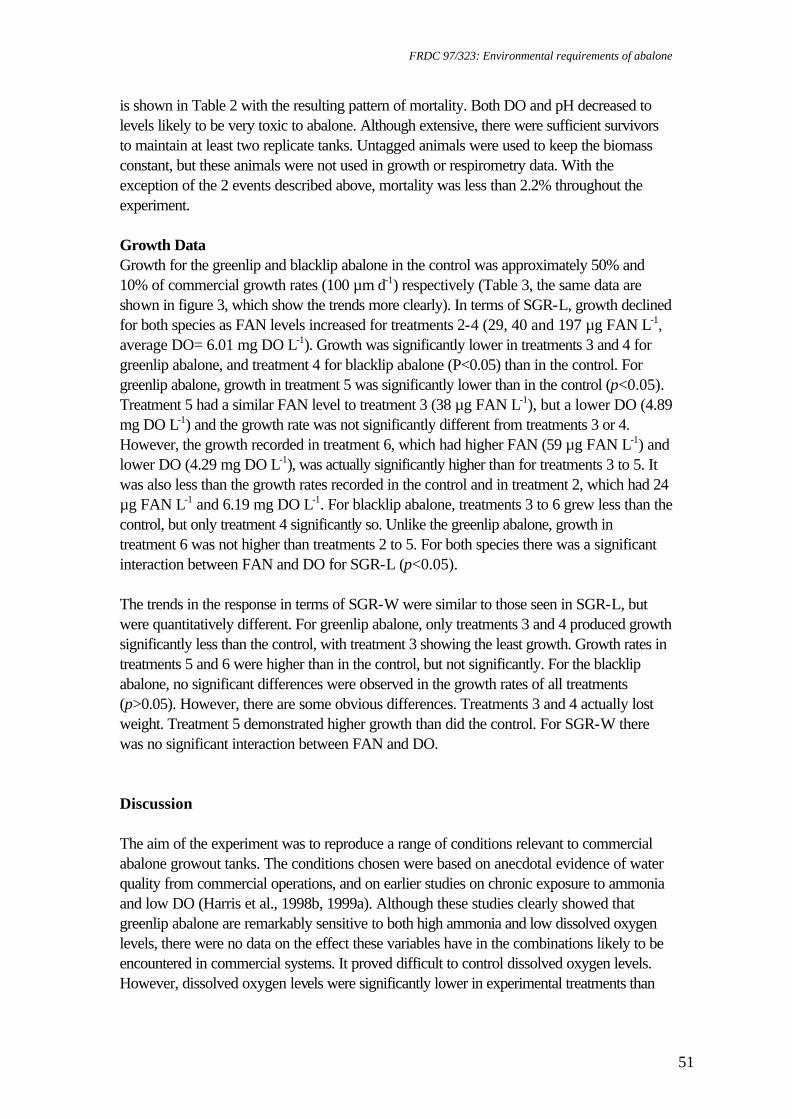
FRDC 97/323: Environmental requirements of abalone
51
is shown in Table 2 with the resulting pattern of mortality. Both DO and pH decreased to levels likely to be very toxic to abalone. Although extensive, there were sufficient survivors to maintain at least two replicate tanks. Untagged animals were used to keep the biomass constant, but these animals were not used in growth or respirometry data. With the exception of the 2 events described above, mortality was less than 2.2% throughout the experiment. Growth Data Growth for the greenlip and blacklip abalone in the control was approximately 50% and 10% of commercial growth rates (100 µm d-1) respectively (Table 3, the same data are shown in figure 3, which show the trends more clearly). In terms of SGR-L, growth declined for both species as FAN levels increased for treatments 2-4 (29, 40 and 197 µg FAN L-1, average DO= 6.01 mg DO L-1). Growth was significantly lower in treatments 3 and 4 for greenlip abalone, and treatment 4 for blacklip abalone (P<0.05) than in the control. For greenlip abalone, growth in treatment 5 was significantly lower than in the control (p<0.05). Treatment 5 had a similar FAN level to treatment 3 (38 µg FAN L-1), but a lower DO (4.89 mg DO L-1) and the growth rate was not significantly different from treatments 3 or 4. However, the growth recorded in treatment 6, which had higher FAN (59 µg FAN L-1) and lower DO (4.29 mg DO L-1), was actually significantly higher than for treatments 3 to 5. It was also less than the growth rates recorded in the control and in treatment 2, which had 24 µg FAN L-1 and 6.19 mg DO L-1. For blacklip abalone, treatments 3 to 6 grew less than the control, but only treatment 4 significantly so. Unlike the greenlip abalone, growth in treatment 6 was not higher than treatments 2 to 5. For both species there was a significant interaction between FAN and DO for SGR-L (p<0.05). The trends in the response in terms of SGR-W were similar to those seen in SGR-L, but were quantitatively different. For greenlip abalone, only treatments 3 and 4 produced growth significantly less than the control, with treatment 3 showing the least growth. Growth rates in treatments 5 and 6 were higher than in the control, but not significantly. For the blacklip abalone, no significant differences were observed in the growth rates of all treatments (p>0.05). However, there are some obvious differences. Treatments 3 and 4 actually lost weight. Treatment 5 demonstrated higher growth than did the control. For SGR-W there was no significant interaction between FAN and DO. Discussion The aim of the experiment was to reproduce a range of conditions relevant to commercial abalone growout tanks. The conditions chosen were based on anecdotal evidence of water quality from commercial operations, and on earlier studies on chronic exposure to ammonia and low DO (Harris et al., 1998b, 1999a). Although these studies clearly showed that greenlip abalone are remarkably sensitive to both high ammonia and low dissolved oxygen levels, there were no data on the effect these variables have in the combinations likely to be encountered in commercial systems. It proved difficult to control dissolved oxygen levels. However, dissolved oxygen levels were significantly lower in experimental treatments than

FRDC 97/323: Environmental requirements of abalone
52
the control treatment, and treatments 5 & 6 were significantly lower than treatments 2, 3 and 4. Although the overall mortality was low (<2 %), on several occasions high mortalities occurred in some tanks. This suggests that the experimental conditions were close to the limits of the abalone, which were thus likely to be under chronic stress. The pattern of mortality listed in Table 3 suggests that, in this trial, greenlip abalone were more sensitive to severely low DO and pH than were blacklip abalone. Further analysis of the variation in water quality variables, rather than study of mean values, may enable us to determine the causes of the mortalities. Growth for both species was lower than in a concurrent trial on animals from the same cohort, conducted in conventional round fibreglass tanks. However, growth rates for greenlips in the control treatment were similar to growth rates from controls in other trials using this bioassay system (Harris et al. 1997, 1998b), so comparisons can be drawn between the different studies. Despite the low growth rates, significant growth depression was detected in some treatments for both species (p<0.05). Analysing data for treatments 5 and 6 was difficult due to the loss on day 25 of one replicate tank in each of these treatments, and also because of the high variation in growth rates for the replicate tanks in treatment 5. Such variation is also evident in earlier bioassays using this system (Harris et al. 1997), and makes it difficult to draw conclusions as to the effects of different treatments. Abalone response in terms of weight gain was, at times, different from their length response. It is clear that treatments 3 and 4 had the most severe impact on growth of both species. However, the responses seen in treatments 5 and/or 6 indicate that in the presence of 40 to 60 µg FAN L-1, decreasing the DO saturation to 56% significantly increased the growth over animals exposed to 76% DO, to the extent that growth was even greater than seen in the controls. This contrasts with Harris et al. (1999a) who reported a significant reduction in growth at 55% DO saturation. Are abalone able to compensate for the detrimental effects of DO when they are exposed to FAN? Part of the variation in growth response may lie in the individual ranges of values of the water quality parameters (Figures 1 and 2). These indicate that the abalone were exposed to a wide range of conditions for variable lengths of time. Mean values of these parameters are quoted in Table 1, but transient extreme values as well as the chronic conditions may have affected growth. An alternative explanation involves nitrite. With the exception of treatment 5, all treatments had nitrite exceeding the level required to reduce growth of greenlip abalone significantly (Harris et al. 1997). The concentration of nitrite was higher in treatment 3 (40 µg FAN L-1 + 76% DO) than in either of treatments 5 or 6 (similar FAN + 64% or 56% DO respectively), which may explain the lower growth rate obtained in treatment 3. However, the difference in nitrite concentration between treatments 3 and 6 was not large. Because the concentration of nitrite was not directly related to the concentration of ammonia, it was not possible to predict from the ammonia concentration if nitrite would develop into a problem. The production of nitrite presents a two-fold problem: the direct toxicity of nitrite and also increased consumption of oxygen during the bacterial respiration.

Table 1 - Mean water quality during chronic exposure of greenlip and blacklip abalone to high FAN and low DO.
Treatment Dissolved Oxygen (mg L-1)
Dissolved Oxygen (%sat)
Temperature (oC)
pH Nitrite (mg L-1)
TAN (mg L-1)
FAN (µg L-1)
1 (Control) 7.16±0.03a 96 ± 0.1a 18.80±0.28a 7.90±0.01a 0.00±0.00a 0.24±0.02a 5.23±0.40a 2 6.19±0.12b 83 ± 1.9b 18.54±0.02b 7.91±0.00a 0.93±0.08b 1.06±0.05b 24.04±1.17a 3 5.58±0.07c 76 ± 0.9c 19.12±0.02c 7.84±0.01b 1.33±0.09b 1.88±0.09c 40.02±2.33a
4 6.27±0.16b 85 ± 2.2b 19.03±0.02c 7.92±0.01a 1.10±0.13b 8.07±0.20d 197.25±9.77b 5 4.89±0.10d 64 ± 1.8d 18.93±0.00a 7.98±0.00c 0.40±0.06c 1.44±0.04b 38.70±0.81a 6 4.29±0.09d 56 ± 1.3d 18.88±0.05a 7.91±0.00a 1.08±0.03b 2.48±1.08d 59.01±2.50c Values are means±SE for replicate tanks, n=3 for treatments 1-4, n=2 for Treatments 5,6. Different superscripts indicate significantly different means (p<0.05) Table 2: Water quality* and mortality** of greenlip and blacklip abalone during a pump failure on day 51 of the growth trial evaluating the effects of
chronic exposure to high FAN and low DO. Treatment Dissolved
Oxygen (mg L-1)
Dissolved Oxygen (%sat)
Temperature (oC)
pH TAN (mg L-1)
FAN (µg L-1)
Greenlip Mortality
Blacklip Mortality
1 (Control) 7.42±0.13 99 ± 0.6 17.83±0.35 7.81±0.07 0.52±0.13 9.02±2.74 0,0,0 0,0,0 2 0.39±0.20 5 ± 2.4 17.26±0.58 7.20±0.09 0.17±0.02 0.72±0.22 12,8,0 2,2,1 3 0.47±0.04 6 ± 0.8 17.86±0.20 7.13±0.02 1.37±0.10 4.95±0.20 9,9,10 3,1,2 4 0.48±0.09 6 ± 0.1 17.96±0.30 7.21±0.02 7.25±0.88 31.69±1.84 6,0,0 2,1,0 * = treatment means±SD, n=3. ** = figures from individual replicate tanks
53
FRDC
97/323: Environmental requirem
ents of abalone
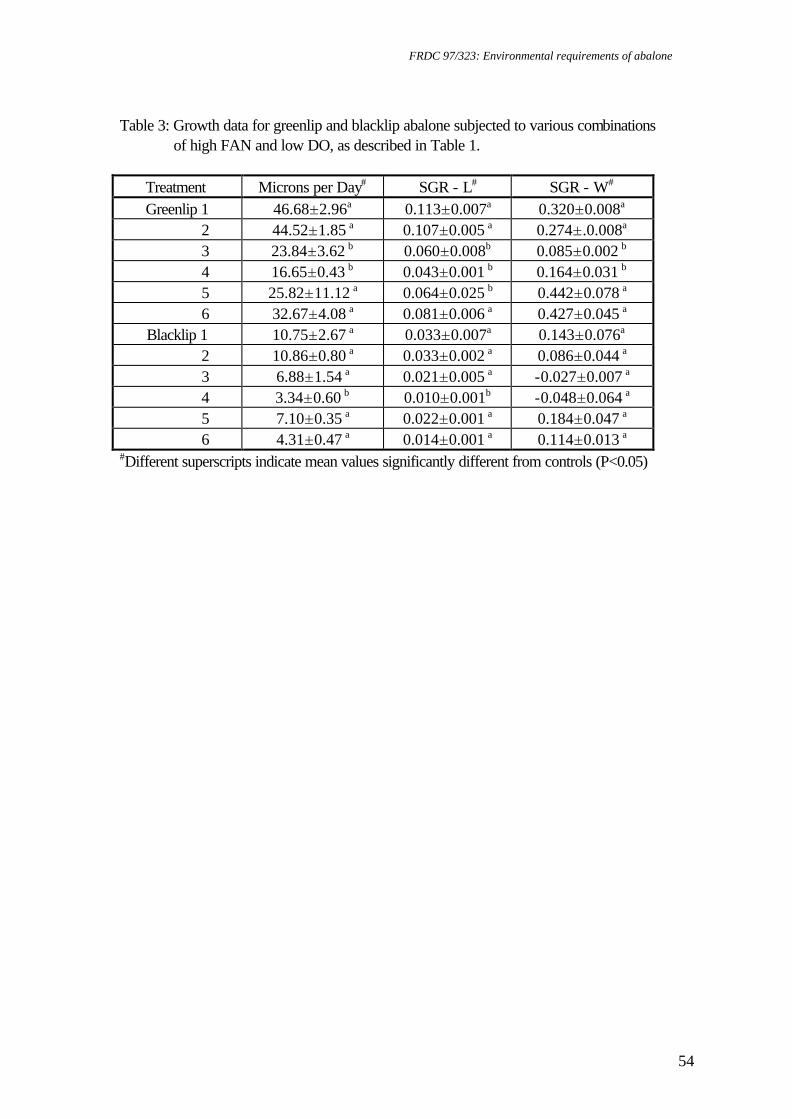
FRDC 97/323: Environmental requirements of abalone
54
Table 3: Growth data for greenlip and blacklip abalone subjected to various combinations
of high FAN and low DO, as described in Table 1.
Treatment Microns per Day# SGR - L# SGR - W# Greenlip 1 46.68±2.96a 0.113±0.007a 0.320±0.008a
2 44.52±1.85 a 0.107±0.005 a 0.274±.0.008a 3 23.84±3.62 b 0.060±0.008b 0.085±0.002 b 4 16.65±0.43 b 0.043±0.001 b 0.164±0.031 b 5 25.82±11.12 a 0.064±0.025 b 0.442±0.078 a 6 32.67±4.08 a 0.081±0.006 a 0.427±0.045 a
Blacklip 1 10.75±2.67 a 0.033±0.007a 0.143±0.076a 2 10.86±0.80 a 0.033±0.002 a 0.086±0.044 a 3 6.88±1.54 a 0.021±0.005 a -0.027±0.007 a 4 3.34±0.60 b 0.010±0.001b -0.048±0.064 a 5 7.10±0.35 a 0.022±0.001 a 0.184±0.047 a 6 4.31±0.47 a 0.014±0.001 a 0.114±0.013 a
#Different superscripts indicate mean values significantly different from controls (P<0.05)

FRDC 97/323: Environmental requirements of abalone
55
Figure 1: Measured variation in dissolved oxygen during chronic exposure of greenlip and
blacklip abalone to different concentrations of FAN and DO saturation.
1
2
3
4
5
6
7
8
9
10
Dis
solv
ed O
xyge
n
(mg
L-1
)
1 2 3 4 5 6
Treatment
Minimum DOMaximum DO
75th percentile25th percentileMedian DO

FRDC 97/323: Environmental requirements of abalone
56
0
10
20
30
40
50
60
70
80
90
100
110
120
130
140
150
160
170
180
190
200
210
220
230
FAN
(µg L-1)
0 1 2 3 4 5 6
Treatment
minimummaximum
75th percentile25th percentilemedian
x460
Figure 2: Measured variation in free ammonia (FAN) during chronic exposure of greenlip and
blacklip abalone to different concentrations of FAN and DO.

FRDC 97/323: Environmental requirements of abalone
57
10
15
20
25
30
35
40
45
50
Microns
per day for
greenlipabalone
0
0.05
0.1
0.15
0.2
0.25
0.3
0.35
0.4
0.45
0.5
0.55
Specific growthrates for
length and weight
for greenlip abalone
2
3
4
5
6
7
8
9
10
11
12
13
14
Microns
per day for
blacklipabalone
-0.125-0.1
-0.075-0.05
-0.0250
0.0250.05
0.0750.1
0.1250.15
0.1750.2
0.2250.25
Specific growth
rates forlength and weight
for blacklip abalone
1 2 3 4 5 6
Treatment
Microns per Day
Specific Growth Rate for weightSpecific Growth Rate for Length
Figure 3: Growth of greenlip and blacklip abalone during chronic exposure to FAN and to
low DO saturation.

FRDC 97/323: Environmental requirements of abalone
58
6.4: The effect of pulses of raised ammonia and low dissolved oxygen on the growth of greenlip (Haliotis laevigata) and blacklip (H. rubra) abalone.
Nontechnical summary This experiment simulated a systems failure in a growout system, resulting in exposure of the abalone to poor water quality. If water is not recirculated, then the ammonia will likely increase and dissolved oxygen decrease in concentration as a result of abalone and microbial metabolism. Consequently, the abalone will become stressed, which could result in reduced growth rates, or even death of the animals. Thus, it is important for farmers to know just how fast these detrimental effects will occur, so that they can properly plan their response to systems malfunctions. In this experiment we exposed greenlip and blacklip abalone to 8-hour pulses of ammonia and low dissolved oxygen over a 7-week period. Different groups of abalone had 0, 1, 2, 3 or 6 pulse exposures, during which the water quality was:
v Dissolved oxygen ≈ 4.2 to 4.5 mg L-1 (58 to 61%). v pH ≈ 7.6 to 7.8. v Temperature ≈ 18.7 to 22.23 °C. v Free ammonia nitrogen ≈ 60 to 180 µg L-1.
In comparison good water quality for abalone would have DO close to 100% saturation, pH above 8, temperature in the range of 15 to 20 °C and free ammonia nitrogen < 2 µg L-1. Greenlip abalone grew at rates similar to commercial rates (90 to 97 µm d-1) and none of the pulse exposures caused a reduction in growth. The blacklip abalone grew poorly in both the treatments and the control (9 to 16 µm d-1). However, although the 6-pulse treatment did produce lower growth in the blacklip abalone, none of the treatments produced growth significantly different from the control. Therefore, the abalone appeared resilient to transient exposure to low DO and to FAN levels that have been shown to cause growth reductions during chronic long-term exposure. Accepted for publication in the Journal of Shellfish Research as Effects of combined exposure to elevated ammonia and low dissolved oxygen levels in greenlip (Haliotis laevigata Donovan) and blacklip (H. rubra Leach) abalone. 1. Growth and mortality data from simulated systems failure. Hindrum, S.M., Burke, C.M., Edwards, S.J. and Johns, D.R.

FRDC 97/323: Environmental requirements of abalone
59

FRDC 97/323: Environmental requirements of abalone
60
6.4: The effect of pulses of raised ammonia and low dissolved oxygen on the growth of greenlip (Haliotis laevigata) and blacklip (H. rubra) abalone.
Stephen Hindrum, Chris Burke, Stephen Edwards and Deon Johns Introduction A major risk on commercial abalone farms is periodic interruption to the supply of water and/or aeration due to power or equipment failure. In this situation, water quality will deteriorate rapidly, possibly for extended periods, with total and free ammonia increasing, oxygen and pH declining and temperature possibly increasing because there is little or no water exchange. There is now sufficient evidence in the literature to show that abalone are sensitive to chronic exposure to even small amounts of free ammonia nitrogen or to modest declines in dissolved oxygen (Harris et al. 1998b, 1999a). However, there are very little data available on the combined effects of free ammonia-nitrogen (FAN) and low dissolved oxygen (DO) for episodes of acute poor water quality as distinct from chronic exposure to suboptimal conditions. Knowledge of what effect such events have on abalone health and growth has considerable value for farmers. Firstly, how long can abalone survive abnormal operating conditions without any immediate health effects? Secondly, what long-term effects on growth do episodes of equipment failure have? Lingering stress effects can lead to the establishment of secondary infections and/or to reduced growth rates. A trial was conducted on two species of abalone cultured in Tasmania to answer some of these questions. Following a 6-week growth trial, in which abalone were exposed at different intervals to combinations of low DO and elevated FAN, community respirometry was used to assess whether previous exposure influenced the response to a more severe pulse exposure. Methods and materials The trial was conducted at a research facility at Bicheno, (E148° 18’, S41° 53’). The experimental tanks were round fibreglass units (diameter = 70 cm., volume = 55 L), with a central standpipe and slotted endcap on the outlet to contain the abalone. The 30 tanks used in the trial were enclosed within an area covered with 100% shade cloth to prevent the development of algal biofilms. Each tank was individually supplied with through-flowing sand-filtered oceanic seawater, drawn from sub-surface intakes from exposed coastline. The water was free of freshwater run-off and was aerated with airstones per tank. Experimental abalone The experimental abalone were obtained from commercial stock from two separate abalone farms. Blacklip abalone, 18-24 months old, were obtained from Swansea, Tasmania. These abalone had a mean initial length +sd of 42.9+3.6 mm and a mean initial weight +sd of 13.00+4.45 g (n=600). Greenlip abalone, 24-30 months old, were obtained from Bicheno, Tasmania, Australia. Both species had been held in 270 L holding tanks for 3-6 weeks before being randomly allocated to individual tanks after being
FRDC 97/323: Environmental requirements of abalone
61
weighed (to 0.01 g) and measured for length (to 0.1 mm, using Vernier callipers). They had a mean initial length of 45.8+3.9 mm, and a mean initial weight of 12.21+3.01 g, n=600+SD. Polyethylene tags (Hallprint, Adelaide, Australia) had previously been applied, and any missing tags were replaced using a cyanoacrylate adhesive gel. Abalone were loaded at 40 animals per tank in triplicate tanks of each species for each treatment. The abalone for each treatment were weighed and measured at intervals of 6-7 d. They were removed from tanks with a spatula. The diet used prior to and during the trial for all abalone was based on a commercial formulation (ABCHOW) and had 10% algal meal included. The tanks were cleaned every 4-5 days by siphoning the bulk of the organic wastes, spinning the water gently, and then siphoning off the remaining wastes, which collected in the centre of the tank. The abalone were not exposed to air during cleaning. Fresh food was supplied every 2 days, and the ration was adjusted to demand. Growth trial The growth trial ran for 49 days and tanks were cleaned prior to starting the exposure. On the days indicated in Table 1, the tanks were nominally exposed to 60% of the ambient dissolved oxygen level, and to 150 µg L-1 FAN; the actual conditions during these exposures are shown in Table 2. The first exposure for Treatment 5 was only 4 hours; all subsequent exposures were 8 h (starting between 8.30 and 11.30 am). Water quality was recorded and then wastes were siphoned from the tanks prior to a challenge. The change from ambient conditions was achieved by diverting influent water, bubbling industrial grade nitrogen into the tanks and adding 2.5 L of ammonia stock solution (0.33 g L-1 of technical grade ammonia chloride in filtered seawater). Preliminary trials had showed that this would achieve the desired FAN concentration. Submersible aquarium pumps were placed in each tank immediately prior to altering the water quality to ensure that the ammonia solution was uniformly mixed throughout the tank for the duration of the exposure. Initially, nitrogen was bubbled through the water to reduce the oxygen level rapidly; 60% saturation was achieved within 3 minutes. This concentration was subsequently maintained by combining nitrogen and air through separate fifty-mm airstones. The return to ambient conditions was achieved by restoring influent water flow and removing the nitrogen. The pumps were left running in the tank for one hour post-exposure to expedite the return to ambient conditions. Time-course sampling at the start of the trial showed that DO returned to ambient levels within 1 hour, and ammonia within 6 hours. Both the control and the treatment tanks had the same pumps and pumping regimes. Challenge exposure On day 45 of the growth trial, the remaining 2 tanks for each species and treatment were cleaned and challenged. The challenge, which consisted of an 8-h pulse of higher FAN and lower DO than all previous pulses, was nominally 600 µg L-1 FAN and DO at 30% of the ambient concentration. Actual exposure conditions are shown in Table 3. The alteration in conditions was achieved as described above, using 1.33 g L-1 of technical grade ammonium chloride in seawater as the stock solution.

FRDC 97/323: Environmental requirements of abalone
62
Water quality DO, pH, ammonia and temperature for both pulse and challenge exposures were recorded before any alteration to conditions in the tank (T = 0 h). pH and ammonia were then measured after 15-20 min (T = 15 min), at 8 hours (before restoring ambient conditions) and the morning following exposure (T = 24 h.). Once DO had stabilised, it was checked on average every 30-40 min and adjusted as required. DO, temperature and pH were recorded for all tanks every 2-3 days throughout the trial. Samples for ammonia analysis were taken from two tanks on each treatment not being exposed each week. DO was measured using hand held meters (WTW Oxi96, TPS WP82-Y or Oxiguard Handy Gamma), which were calibrated daily and checked against seawater with Winkler titrations. The three meters gave similar readings when checked against each other. pH was recorded on a handheld TPS meter and probe (WP 81), calibrated daily in fresh buffers (phosphate at pH 7, borate at pH 9.28, after Brunos & Svoronos, 1989). Temperature was recorded using the thermistor on the DO meter, and was checked against a calibrated mercury thermometer. All samples for ammonia analysis were collected in acid-washed glassware rinsed with de-ionised water. Samples were filtered through Whatman GF/C filters and frozen in polypropylene bottles (acid washed, rinsed in de-ionised water) for subsequent analysis. Total ammonia was measured by the method of Solorzano (1969), but using the salicylate reagent of Bower & Holm-Hansen (1980). FAN was calculated from pH and temperature using the equation in Bower & Bidwell (1978). Where necessary, samples were diluted with the filtered seawater. Nitrite was analysed by the diazotization method of Grashoff (1989). Statistical analysis The raw data were tested for homogeneity of variance by examination of residual plots, generated by JMP 3.2 (SAS Institute). Normality was assessed by observation of the distribution plotted by JMP 3.2. No transformations were required to meet the assumptions of ANOVA, as given in Underwood (1981). One-way ANOVA, using the replicate means for each treatment, was used to look for significant treatment effects, and Tukeys HSD was used to compare means. Results Behavioral observations and food consumption Although quantitative data on food consumption were not collected, ration was adjusted on a demand basis for each tank. No difference in consumption between treatments was observed. However, consumption declined the night following pulse exposure, but returned to normal the following night. Following the challenge exposure, the reduction in consumption was even more marked. Under ambient conditions, species-specific behavioural differences were observed. Blacklips clustered in one or two spots in the tank, but greenlip abalone tended to gather in smaller groups dispersed more evenly over the available surfaces. Most blacklip abalone were inactive and greenlips were rarely observed to be active during the day. For both species inactive animals had all tentacles withdrawn and shells clamped tightly onto the substrate. During the pulse exposure (no influent water for 8 hours) no change in behaviour was observed.
FRDC 97/323: Environmental requirements of abalone
63
Some differences in behaviour were observed during the challenge exposure at the end of the growth trial. In both species, the animals tended to separate from the clusters within 40 to 60 minutes, but once separated, they did not continue moving. Rather, the shells were lifted off the substrate, and sensory tentacles were extended. It was possible that the water current from the submersible pumps may have modified response of the abalone to the stress induced by the pulses of poor quality water. In order to clarify this, a pulse without the pumps was performed on the tanks in Treatment 3 at the end of the growth trial. No difference in response was observed, compared to pulse exposures with pumps. Mortality Overall mortality was 0.8% for greenlips and 2% for blacklips during the trial. The higher figure for blacklips was due to their tendency to crawl out of the tank. No tank lost more than 2 abalone throughout the trial. No mortality was observed as a result of the pulse or challenge exposures. There was some degree of tag loss, which precluded the calculation of growth data for every animal in each tank. Water quality Tables 1 shows the ambient water quality for days when DO and ammonia were not artificially manipulated. Table 2 shows the water quality achieved during pulses of ammonia and low DO. Table 3 shows the water quality achieved during the final challenge. Nitrite was always undetectable. The initial and final data collected collected for each pulse (i.e. at T=0 and T=24) were always consistent with ambient conditions and so were included in the ambient water quality in Table 1. It proved difficult to precisely control the ammonia level at the start of the pulse and challenge exposures, however, a large initial increase in FAN was achieved. Although TAN levels did not change greatly during the exposure period, the decline in pH significantly reduced the FAN level. A consequence of removing influent water during the exposure treatments was that temperature increased in line with the air temperature of the day. Growth data The growth data are shown in Table 4. For greenlip abalone, growth rates (≈ 100 µm d-1) were close to commercial growth rates. The blacklip abalone growth rates (≈ 15 µm d-1) were approximately 15% of commercial growth rates. In terms of both length and weight, no significant difference was observed in growth of either species under any of the treatments performed (p> 0.05). For blacklip abalone, treatment 5 reduced growth, especially in terms of weight, but the variability in data meant that a statistically significant difference could not be detected. Discussion The primary aim of this trial was to simulate a major systems failure, with an extended period of no influent water and little if any supplementary aeration. Establishing the alteration in water quality as rapidly as possible exacerbated the impact of the failure. Although dissolved oxygen and ammonia were the primary water quality variables being manipulated, the lack of influent water flow also resulted in temperature and pH changes over 8 h. Temperature reflected the ambient temperature, as it was not controlled during the experiment.
FRDC 97/323: Environmental requirements of abalone
64
During ambient conditions just prior to each exposure, the abalone were generally inactive, with shells clamped firmly to the substrate and all sensory tentacles withdrawn. During the pulse exposures the rapid change in water quality did not immediately disturb the abalone. After 8 hours, some animals exhibited signs of mild distress. In contrast, during the final challenge exposures, the abalone showed signs of distress within 90 minutes of the water quality being altered. Food consumption was not obviously affected following the pulse exposures, but there was a marked reduction in consumption following the challenge exposure. Following the challenge, abalone were much less active than in unchallenged tanks during the next nocturnal foraging period. However, activity and consumption were similar to abalone in unchallenged tanks for the subsequent nocturnal foraging period. These observations indicate that the final challenge was more stressful than were the pulse exposures. The pulses were only mildly stressful, producing minor alterations in foraging activity. All effects were transient and no mortality was observed during either the pulse or final challenge exposures. The stress resulting from the pulse exposure was insufficient to produce statistically significant differences in growth for either species, in terms of length or weight. For blacklip abalone, growth was lower for treatment 5 than in the other treatments, both in terms of length and weight. Greenlip abalone showed no such decrease for this treatment, and growth in terms of SGR-L was actually higher than the other treatments. These findings indicate that greenlip and blacklip abalone are more robust to short-term exposure to poor water quality than they are to chronic exposure. Harris et al. (1997, 1998b, 1999a) found that greenlip abalone were more sensitive than fish and other invertebrate species when chronically exposed to elevated FAN, nitrite or deceased DO. For DO and FAN, growth declined through the whole experimental range (25-188 µg FAN L-1 and 8.9-4.2 mg DO L-1 (117-55% saturation). These levels of FAN and DO were achieved in the pulse exposure without producing a significant growth suppression. It is possible that a significant impact on growth may have been observed if the pulse exposures had been conducted during the active foraging period. Potentially, the altered water quality would then have had a more direct effect on the metabolic processes of the abalone. During the inactive daylight period, the rate of metabolism is presumably lower, and external water quality therefore has less impact. However, the observed behavioural changes indicate that the change in water quality was still detected by the inactive abalone. It was stressful, particularly during the challenge exposure. In a similar study looking at the effects of a single exposure to 0.5-1.1 mg DO L-1 for up to 12 hours in prawns (Penaeus monodon), Allan and Maguire (1991) found no significant effects on growth after 3 weeks. The same study established a 96h LC50 of 0.9 mg DO L-1 for this species. As with abalone in the current study, short-term exposure to conditions that would have significant effects over a longer exposure did not result in significant growth depression. Conclusion The results indicate that the two abalone species were remarkably resilient to periodic short-term exposures to poor water quality that, will reduce growth significantly if present continuously. The
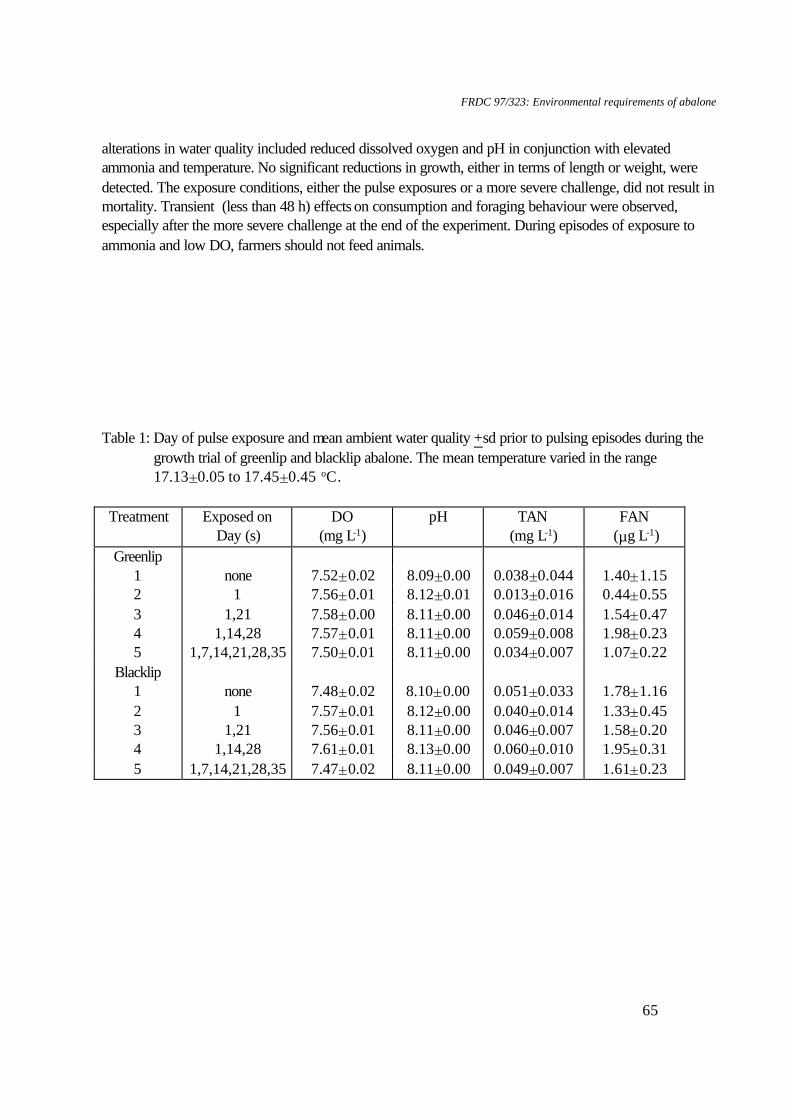
FRDC 97/323: Environmental requirements of abalone
65
alterations in water quality included reduced dissolved oxygen and pH in conjunction with elevated ammonia and temperature. No significant reductions in growth, either in terms of length or weight, were detected. The exposure conditions, either the pulse exposures or a more severe challenge, did not result in mortality. Transient (less than 48 h) effects on consumption and foraging behaviour were observed, especially after the more severe challenge at the end of the experiment. During episodes of exposure to ammonia and low DO, farmers should not feed animals. Table 1: Day of pulse exposure and mean ambient water quality +sd prior to pulsing episodes during the
growth trial of greenlip and blacklip abalone. The mean temperature varied in the range 17.13±0.05 to 17.45±0.45 oC.
Treatment Exposed on
Day (s) DO
(mg L-1) pH TAN
(mg L-1) FAN
(µg L-1) Greenlip
1 none 7.52±0.02 8.09±0.00 0.038±0.044 1.40±1.15 2 1 7.56±0.01 8.12±0.01 0.013±0.016 0.44±0.55 3 1,21 7.58±0.00 8.11±0.00 0.046±0.014 1.54±0.47 4 1,14,28 7.57±0.01 8.11±0.00 0.059±0.008 1.98±0.23 5 1,7,14,21,28,35 7.50±0.01 8.11±0.00 0.034±0.007 1.07±0.22
Blacklip 1 none 7.48±0.02 8.10±0.00 0.051±0.033 1.78±1.16 2 1 7.57±0.01 8.12±0.00 0.040±0.014 1.33±0.45 3 1,21 7.56±0.01 8.11±0.00 0.046±0.007 1.58±0.20 4 1,14,28 7.61±0.01 8.13±0.00 0.060±0.010 1.95±0.31 5 1,7,14,21,28,35 7.47±0.02 8.11±0.00 0.049±0.007 1.61±0.23
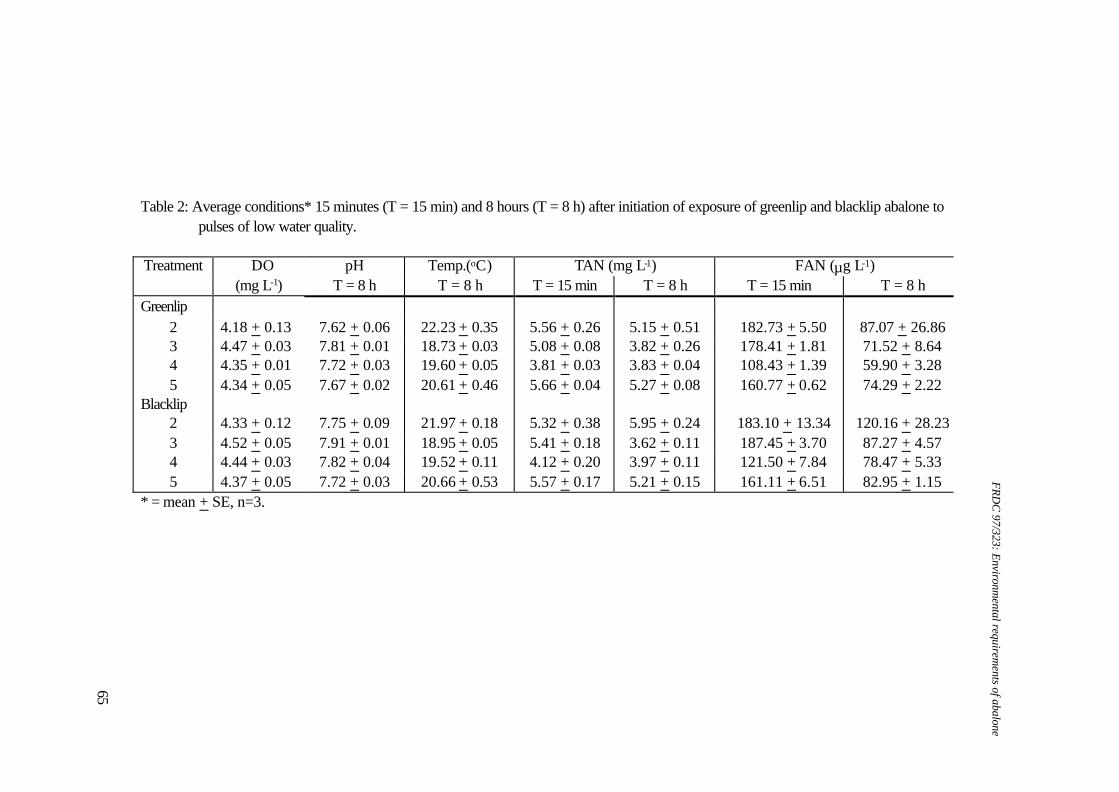
Table 2: Average conditions* 15 minutes (T = 15 min) and 8 hours (T = 8 h) after initiation of exposure of greenlip and blacklip abalone to
pulses of low water quality. Treatment DO pH Temp.(oC) TAN (mg L-1) FAN (µg L-1)
(mg L-1) T = 8 h T = 8 h T = 15 min T = 8 h T = 15 min T = 8 h Greenlip
2 4.18 + 0.13 7.62 + 0.06 22.23 + 0.35 5.56 + 0.26 5.15 + 0.51 182.73 + 5.50 87.07 + 26.86 3 4.47 + 0.03 7.81 + 0.01 18.73 + 0.03 5.08 + 0.08 3.82 + 0.26 178.41 + 1.81 71.52 + 8.64 4 4.35 + 0.01 7.72 + 0.03 19.60 + 0.05 3.81 + 0.03 3.83 + 0.04 108.43 + 1.39 59.90 + 3.28 5 4.34 + 0.05 7.67 + 0.02 20.61 + 0.46 5.66 + 0.04 5.27 + 0.08 160.77 + 0.62 74.29 + 2.22
Blacklip 2 4.33 + 0.12 7.75 + 0.09 21.97 + 0.18 5.32 + 0.38 5.95 + 0.24 183.10 + 13.34 120.16 + 28.23 3 4.52 + 0.05 7.91 + 0.01 18.95 + 0.05 5.41 + 0.18 3.62 + 0.11 187.45 + 3.70 87.27 + 4.57 4 4.44 + 0.03 7.82 + 0.04 19.52 + 0.11 4.12 + 0.20 3.97 + 0.11 121.50 + 7.84 78.47 + 5.33 5 4.37 + 0.05 7.72 + 0.03 20.66 + 0.53 5.57 + 0.17 5.21 + 0.15 161.11 + 6.51 82.95 + 1.15
* = mean + SE, n=3.
FRDC
97/323: Environmental requirem
ents of abalone
65

Table 3: Average conditions* 15 minutes and 8 hours after initiation of the final challenge exposure of greenlip and blacklip abalone previously
exposed to pulses of low water quality. Treatment DO pH Temp.(oC) TAN (mg L-1) FAN (µg L-1)
(mg L-1) T = 8 h T = 8 h T = 15 min T = 8 h T = 15 min T = 8 h Greenlip 1 2.13 + 0.08 7.77 + 0.04 20.85 + 0.55 11.60 + 1.98 9.24 + 0.64 392.75 + 73.65 177.92 + 35.20 2 2.35 + 0.04 7.71 + 0.02 20.45 + 0.75 23.23 + 1.42 17.92 + 2.24 842.26 + 131.14 553.99 +196.13 4 2.35 + 0.03 7.65 + 0.04 17.40 + 0.60 29.13 + 1.30 24.65 + 0.83 905.97 + 123.46 611.88 + 357.49 5 2.62 + 0.13 7.81 + 0.01 19.80 + 0.30 12.63 + 0.43 10.31 + 2.58 362.12 + 5.87 194.11 + 42.43 Blacklip 1 2.16 + 0.03 7.87 + 0.01 20.85 + 0.65 10.48 + 1.72 10.18 + 0.47 374.44 + 63.78 239.83 + 25.10 2 2.41 + 0.08 7.88 + 0.03 20.35 + 0.85 20.75 + 2.83 24.06 + 6.60 773.38 + 158.10 690.47 + 74.49 4 2.33 + 0.09 7.84 + 0.02 17.35 + 0.75 21.82 + 1.18 18.93 + 2.77 640.14 + 6.02 324.42 + 44.41 5 2.50 + 0.01 7.82 + 0.01 19.90 + 0.50 12.97 + 0.95 12.03 +0.43 403.52 + 22.26 235.02 + 2.45 * = mean + SE, n=3.
FRDC
97/323: Environmental requirem
ents of abalone
66
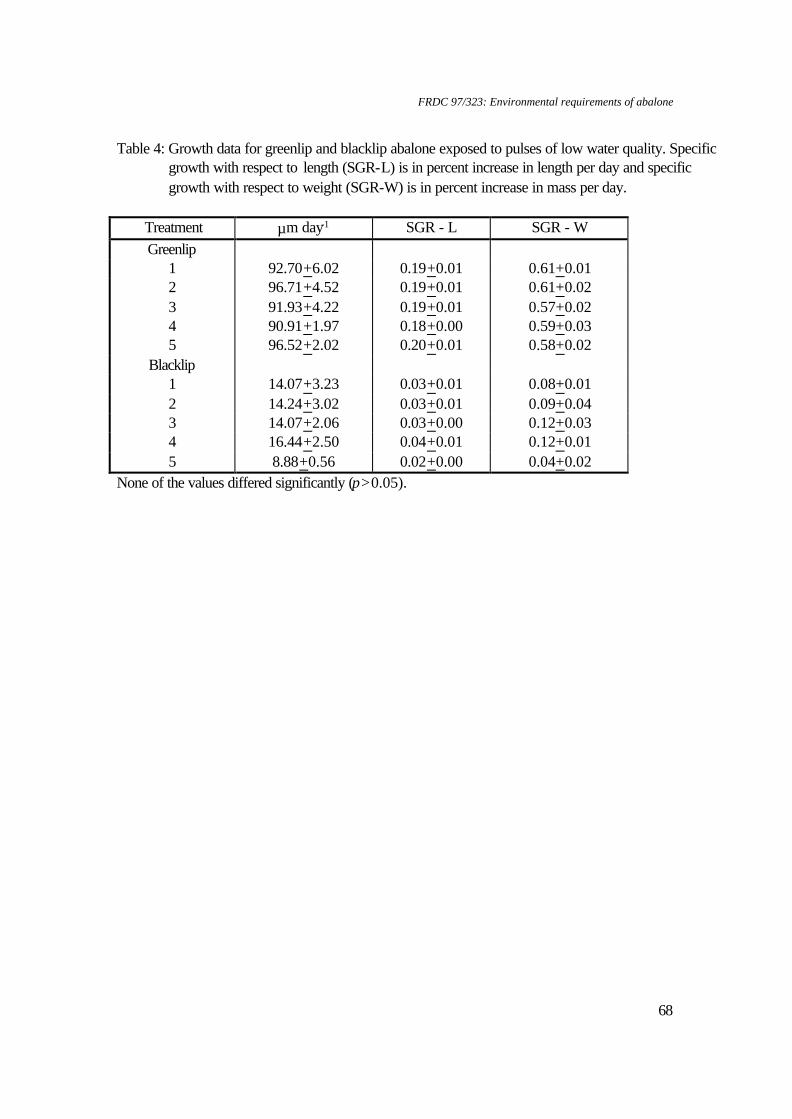
FRDC 97/323: Environmental requirements of abalone
68
Table 4: Growth data for greenlip and blacklip abalone exposed to pulses of low water quality. Specific growth with respect to length (SGR-L) is in percent increase in length per day and specific growth with respect to weight (SGR-W) is in percent increase in mass per day.
Treatment µm day-1 SGR - L SGR - W Greenlip
1 92.70+6.02 0.19+0.01 0.61+0.01 2 96.71+4.52 0.19+0.01 0.61+0.02 3 91.93+4.22 0.19+0.01 0.57+0.02 4 90.91+1.97 0.18+0.00 0.59+0.03 5 96.52+2.02 0.20+0.01 0.58+0.02
Blacklip 1 14.07+3.23 0.03+0.01 0.08+0.01 2 14.24+3.02 0.03+0.01 0.09+0.04 3 14.07+2.06 0.03+0.00 0.12+0.03 4 16.44+2.50 0.04+0.01 0.12+0.01 5 8.88+0.56 0.02+0.00 0.04+0.02
None of the values differed significantly (p>0.05).

FRDC 97/323: Environmental requirements of abalone
68
6.5: Exploring the dynamic relationship between water quality, stocking density and refuge provision for greenlip abalone (Haliotis laevigata).
Nontechnical summary Commercial stocking densities for juvenile abalone are approximately 20 kg m-3. Abalone commonly inhabit crevices in the wild, so providing refuges in tanks that otherwise had smooth surfaces might reduce stress and increase growth rates. The provision of shelters will necessarily also increase the surface area of substrate available to the abalone, which also may increase growth rates. In this trial abalone were grown in circular tanks stocked at 14, 28 and 40 kg m-3 and with either 1 refuge per 30 abalone, 1 per 60 or none. The influent water flow rate was 1.8 L min-1 for tanks with 120 abalone, 3.4 L min-1 for tanks with 240 abalone and 5.2 L min-1 for tanks with 360 abalone. This kept the exchange rate of water constant for abalone biomass. The internal flow rate in each tank was also kept constant at 12 L min-1 by inserting pumps into the tanks. The fastest growth rates were attained at the lowest stocking density and ranged up to 68 µm d-1. This may have been because the effective surface area per abalone of these tanks was twice as large as in tanks containing higher stocking densities. Growth at the 2 higher densities was not significantly different from each other. Provision of shelters at the 2 higher stocking densities improved growth rates compared to the same stocking density without shelters. With the exception of DO, the water quality under shelters and away from shelters remained acceptable throughout the trial, so this does not appear to be a factor affecting growth in this experiment. DO was commonly at concentrations previously shown to cause small, but statistically significant reductions in growth of greenlip abalone. Despite the fastest growth rates occurring at the lowest stocking density, the increase in abalone biomass per tank was highest at the highest stocking density.
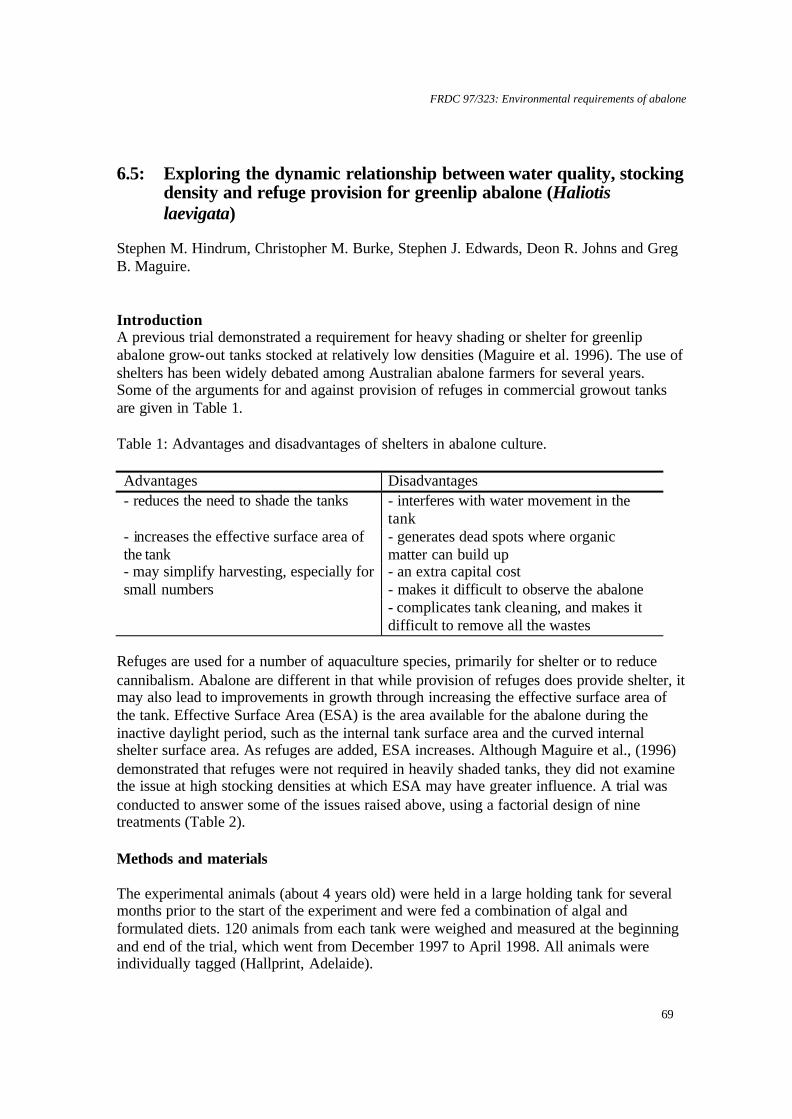
FRDC 97/323: Environmental requirements of abalone
69
6.5: Exploring the dynamic relationship between water quality, stocking
density and refuge provision for greenlip abalone (Haliotis laevigata)
Stephen M. Hindrum, Christopher M. Burke, Stephen J. Edwards, Deon R. Johns and Greg B. Maguire. Introduction A previous trial demonstrated a requirement for heavy shading or shelter for greenlip abalone grow-out tanks stocked at relatively low densities (Maguire et al. 1996). The use of shelters has been widely debated among Australian abalone farmers for several years. Some of the arguments for and against provision of refuges in commercial growout tanks are given in Table 1. Table 1: Advantages and disadvantages of shelters in abalone culture. Advantages Disadvantages - reduces the need to shade the tanks - interferes with water movement in the
tank - increases the effective surface area of the tank
- generates dead spots where organic matter can build up
- may simplify harvesting, especially for small numbers
- an extra capital cost - makes it difficult to observe the abalone
- complicates tank cleaning, and makes it difficult to remove all the wastes
Refuges are used for a number of aquaculture species, primarily for shelter or to reduce cannibalism. Abalone are different in that while provision of refuges does provide shelter, it may also lead to improvements in growth through increasing the effective surface area of the tank. Effective Surface Area (ESA) is the area available for the abalone during the inactive daylight period, such as the internal tank surface area and the curved internal shelter surface area. As refuges are added, ESA increases. Although Maguire et al., (1996) demonstrated that refuges were not required in heavily shaded tanks, they did not examine the issue at high stocking densities at which ESA may have greater influence. A trial was conducted to answer some of the issues raised above, using a factorial design of nine treatments (Table 2). Methods and materials The experimental animals (about 4 years old) were held in a large holding tank for several months prior to the start of the experiment and were fed a combination of algal and formulated diets. 120 animals from each tank were weighed and measured at the beginning and end of the trial, which went from December 1997 to April 1998. All animals were individually tagged (Hallprint, Adelaide).
FRDC 97/323: Environmental requirements of abalone
70
Experimental system The tanks were circular, fibreglass tanks holding 220 L, with central outlets and supplied with three air-stones. Black plastic covers were fitted to the tanks, which were located outside. Covers were briefly partially removed during feeding and tank cleaning. Water, which was drawn from a good quality inshore marine area, was set to flow in at 1.8 L min-1 per 120 animals. Submersible aquarium pumps, attached to the side of each tank, were used to standardise the internal water flow in each tank to 12 L min-1 to avoid confounding the growth data with different flow rates (Fleming et al. 1997). Each tank had 3 airstones for aeration. Lengthwise half-sections of 150 mm PVC (280 mm long) pipe were used for the shelters. The shelters were arranged symmetrically in each tank, with equal numbers perpendicular and parallel to the clockwise, circular water current. Weighted polypropylene rings attached to the top of the shelters prevented shelters moving. Tank maintenance The tanks were fed daily, in the afternoon, with feeding rates adjusted on demand for each tank. The most recent formulation of ABCHOW (FRDC 6) was used, being prepared on site as required every 2-3 weeks. The tanks were cleaned every 4 days by draining the water through a central outlet, hosing out the wastes with ambient seawater and refilling the tank rapidly with ambient seawater from the same source. The tops of the shelters, which covered approximately 95% of the animals in each tank, were submerged within 5 min of the tank being drained. If cleaning was postponed due unfavourable weather conditions (rain or high air temperature), the tanks were also not fed. Water quality Temperature and dissolved oxygen were monitored routinely in the morning (9 – 10 am) and afternoon (3 – 5 pm). Samples for measuring water quality under the hides were collected using a 50 mL syringe, with a standard length of 4 mm polypropylene tubing attached to ensure that the centre of each refuge was always sampled. Aeration was maintained in tanks during sampling. A bulk water sample was taken from the tank at the same time, using the same method. On removing the syringe from the water, the 4 mm tubing was crimped. Dissolved oxygen (DO) and pH were recorded within 5 min of sampling. The samples were then filtered through GF/C filters for ammonia analysis. Care was taken to minimise disturbance to the environment under the hide during insertion and removal of the tubing. A small volume of tank water was used to rinse the syringe before collecting the sample, which allowed a bubble free sample to be taken. Any samples containing bubbles were not tested for DO. If a sample was rejected, then that hide was not re-sampled at that time. Total ammonia was measured using the method of Solorzano (1969). FAN was calculated from the total ammonia nitrogen (TAN), temperature and pH using the equation in Bower & Bidwell (1978). Filtered ambient seawater was used for making all standards and for diluting samples. Nitrite samples were collected weekly and analysed using the diazotisation method (Grasshoff, 1989).

FRDC 97/323: Environmental requirements of abalone
71
Distribution of abalone in tanks On 2-7 occasions each treatment (at least once for each tank on each treatment) was photographed and then the shelters were removed, inverted and also photographed. The position of the shelters was traced onto the photo to determine how many abalone were under each shelter. Care was taken to return the shelters to exactly the same position in the tank after being photographed. Table 2: Summary of experimental design evaluating the effects of stocking density and
shelter provision.
Treatment Stocking density*
Number of
shelters
Initial kg biomass
(m-3)
Effective surface area
(m2)**
Water inflow rate (L min -1)
Additional pump rate (L min-1)
1 120 0 14.12 1.70 1.8 10.2 2 120 2 13.42 1.8 1.8 10.2 3 120 4 13.91 1.93 1.8 10.2 4 240 0 28.82 1.68 3.6 8.4 5 240 4 27.75 1.96 3.6 8.4 6 240 8 28.23 2.23 3.6 8.4 7 360 0 40.96 1.70 5.4 6.6 8 360 6 42.33 2.11 5.4 6.6 9 360 12 40.46 2.50 5.4 6.6
* average size 57.23 ± 4.40 mm, 27.02 ± 5.79 g ** tank floor + submerged tank walls + inner curved shelter surface. Statistical analysis All data were checked for heterogeneity of variance and normality by observation of residual and distribution plots generated by JMP 3.2. SGR-W data for greenlip abalone were log transformed, as were SGR-L, SGR-W and microns per day for blacklip abalone. When the assumptions required for ANOVA (Underwood 1981) were met, ANOVA was used to look for significant treatment effects and for any interaction between DO and FAN. Tukeys HSD was used for all means comparisons. Results The medium stocking density used in this trial (240 abalone per tank, 28 kg biomass m-3) is reasonably close to a commercial stocking density (20 kg biomass m-3) for juvenile abalone. However, the growth rates at this density (40-50 µm d-1) were approximately 50% of what are accepted as commercial growth rates (100 µm d-1). The difference may be due to limitations of the experimental-scale tanks used in this trial. However, significant treatment effects on growth were still detected. Growth was highest (60-68 µm d-1) at the lowest density. Mortality was less than 3.5% for any one tank, and averaged 0.6% over the whole trial. The growth data are shown in Table 3 and Figure 1, which demonstrates the trends among treatments. Growth data in terms of weight (SGR-W) were confounded by a mass spawning
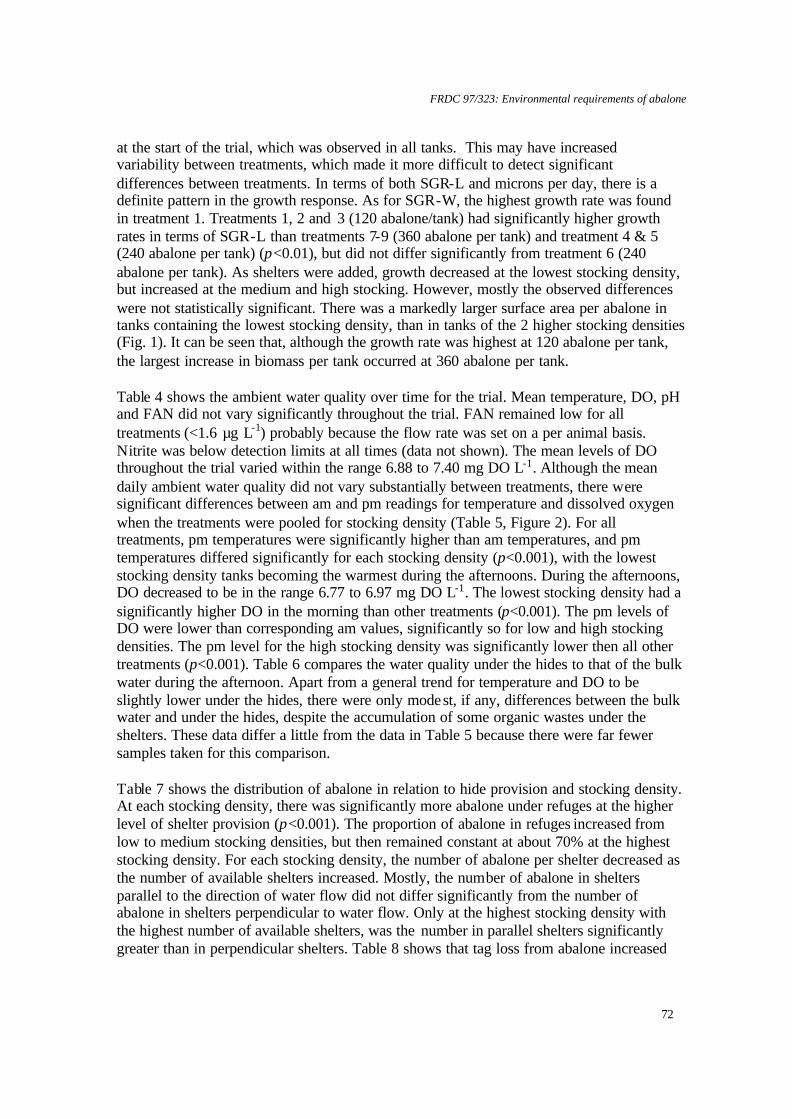
FRDC 97/323: Environmental requirements of abalone
72
at the start of the trial, which was observed in all tanks. This may have increased variability between treatments, which made it more difficult to detect significant differences between treatments. In terms of both SGR-L and microns per day, there is a definite pattern in the growth response. As for SGR-W, the highest growth rate was found in treatment 1. Treatments 1, 2 and 3 (120 abalone/tank) had significantly higher growth rates in terms of SGR-L than treatments 7-9 (360 abalone per tank) and treatment 4 & 5 (240 abalone per tank) (p<0.01), but did not differ significantly from treatment 6 (240 abalone per tank). As shelters were added, growth decreased at the lowest stocking density, but increased at the medium and high stocking. However, mostly the observed differences were not statistically significant. There was a markedly larger surface area per abalone in tanks containing the lowest stocking density, than in tanks of the 2 higher stocking densities (Fig. 1). It can be seen that, although the growth rate was highest at 120 abalone per tank, the largest increase in biomass per tank occurred at 360 abalone per tank. Table 4 shows the ambient water quality over time for the trial. Mean temperature, DO, pH and FAN did not vary significantly throughout the trial. FAN remained low for all treatments (<1.6 µg L-1) probably because the flow rate was set on a per animal basis. Nitrite was below detection limits at all times (data not shown). The mean levels of DO throughout the trial varied within the range 6.88 to 7.40 mg DO L-1. Although the mean daily ambient water quality did not vary substantially between treatments, there were significant differences between am and pm readings for temperature and dissolved oxygen when the treatments were pooled for stocking density (Table 5, Figure 2). For all treatments, pm temperatures were significantly higher than am temperatures, and pm temperatures differed significantly for each stocking density (p<0.001), with the lowest stocking density tanks becoming the warmest during the afternoons. During the afternoons, DO decreased to be in the range 6.77 to 6.97 mg DO L-1. The lowest stocking density had a significantly higher DO in the morning than other treatments (p<0.001). The pm levels of DO were lower than corresponding am values, significantly so for low and high stocking densities. The pm level for the high stocking density was significantly lower then all other treatments (p<0.001). Table 6 compares the water quality under the hides to that of the bulk water during the afternoon. Apart from a general trend for temperature and DO to be slightly lower under the hides, there were only modest, if any, differences between the bulk water and under the hides, despite the accumulation of some organic wastes under the shelters. These data differ a little from the data in Table 5 because there were far fewer samples taken for this comparison. Table 7 shows the distribution of abalone in relation to hide provision and stocking density. At each stocking density, there was significantly more abalone under refuges at the higher level of shelter provision (p<0.001). The proportion of abalone in refuges increased from low to medium stocking densities, but then remained constant at about 70% at the highest stocking density. For each stocking density, the number of abalone per shelter decreased as the number of available shelters increased. Mostly, the number of abalone in shelters parallel to the direction of water flow did not differ significantly from the number of abalone in shelters perpendicular to water flow. Only at the highest stocking density with the highest number of available shelters, was the number in parallel shelters significantly greater than in perpendicular shelters. Table 8 shows that tag loss from abalone increased

FRDC 97/323: Environmental requirements of abalone
73
with increasing stocking density. Tag loss was significantly lower at the lowest stocking density than the loss at the highest stocking density (p<0.05). At the end of the growth experiment, food dye was used to observe the patterns of water flow in relation to the number and arrangement of refuges. Qualitatively, the water flow, and hence exchange, was greater in refuges that were parallel to the water flow than in refuges perpendicular to the flow. Discussion Mortality was low through out the trial, even in treatments stocked at twice the commercial stocking rate (40 kg m-3). Growth rates at this density did not differ significantly from tanks stocked at about commercial rates (28 kg m-3). This indicates that, given sufficient water exchange, stocking densities higher than commercial densities will not necessarily be detrimental in the short term. This is supported by higher biomass gains recorded at the higher stocking densities, despite lower growth rates. However, it is likely that tanks at high stocking density are at a higher risk of a mortality event from either systems failure or microbial activity. This is primarily because of the higher density of abalone present. Maguire et al., (1996) obtained growth at about commercial rates of 100 µm day-1 in a trial that examined the effect of shelters in heavily shaded tanks stocked at a low density. The slower growth rates obtained in our experiment could have resulted from variability in different cohorts of abalone, or because different diets were fed to the abalone or because they were stocked at different densities, or a combination of these factors. In terms of length, a similar growth response was observed for both SGR-L and microns per day. Growth at the lowest stocking density declined as the level of refuge provision increased. In contrast, at both medium and high densities, growth increased as the level of refuge provision increased, although the differences were mostly not statistically significant. The number of refuges in each tank may explain the observed response in SGR-L to some extent. As the number of refuges provided per tank increases, so does the effective surface area of the tank. Thus, shelters provide refuge and concomitantly increase the area of substrate available to abalone, which can allow for greater dispersal of the abalone and also for increased diatom growth. Both could lead to improved growth rates, at least in terms of SGR-L. However, the effective surface area per abalone was twice as large at the lowest stocking density than at the 2 higher densities. This may have contributed to the higher growth rate at the lowest stocking density. It also shows that the shelters contribute relatively little to the ESA per abalone of a tank. The stocking density was more important. The results of our study agree with Maguire et al., (1996) who found that shelters did not have a significant effect on growth at low stocking density. The average number of abalone per shelter decreased as the number of shelters increased for each stocking density. The growth rates also increased with the number of shelters. This suggests that shelters are attractive to abalone and that there is a maximum density of animals that should not be exceeded. In table 7 it can be seen that at the medium and high stocking densities the average number of abalone per shelter decreased as the number of shelters increased. There would then be fewer interactions between abalone. The significantly greater tag loss at the higher densities suggests more contact between

FRDC 97/323: Environmental requirements of abalone
74
individuals, but the amount of shell abrasion was not observed to be greater than at low density. Thus, the increased contact may not have induced much stress in the animals. With the exception of DO, it is unlikely that water quality greatly affected the growth rates observed, because the temperature, pH and FAN (Table 6) were all within the optimum range for H. laevigata (Harris, et al. 1998b, 1999a, this report). FAN remained low for all treatments probably because the flow rate was set on a per animal basis. The water quality underneath refuges did not vary greatly from the bulk water, despite the observation that water exchange in refuges parallel to the water flow was faster than in refuges perpendicular to the flow (Tables 4, 5 and 6). The water quality was determined primarily by the quality of the bulk water, not as a consequence of using shelters. The tanks with the lowest stocking density were the warmest during afternoons, because of the lower water exchange rate (Tables 2, 5). But again the maximum temperature was still within the optimal range for greenlip abalone. Of greatest concern was the concentration of DO. The mean levels of DO throughout the trial were commonly at concentrations shown to reduce growth in greenlip abalone (Harris et al. 1999a). During the afternoons, DO decreased further so that there may have been pulses of low DO for short periods each day. DO appears to be the most likely water quality parameter to influence growth. The lowest values of DO occurred at higher stocking densities, which had the lowest growth rates. Greenlip abalone are synchronous spawners (Shepherd & Laws, 1974) that normally aggregate together for spawning (Shepherd, 1986). In the wild, reproductive maturation and spawning in this species commences within the size range 80-100 mm (Shepherd & Laws, 1974). However, there is considerable anecdotal evidence that farmed stock can mature and spawn at 50-60 mm. Although handling stress may have been a factor in the spawning event observed at the start of this trial, it also coincided with the natural spawning season for this species at this site. Although spawning was observed in all tanks, it can not be ascertained if all animals in each tank spawned. The effect on weight gain associated with changes in condition before and after makes it difficult to analyse the growth data in terms of weight with any certainty. Conclusion Increasing the effective surface area of experimental-scale abalone culture tanks by increasing the level of refuge provision improved growth in terms of SGR-L and microns per day. Growth data in terms of weight (SGR-W) did not show the same response as the length data, but may have been confounded by a mass spawning at the start of the growth trial. The stocking density was more influential than refuge provision, as the highest stocking density produced the highest biomass gain per tank.

FRDC 97/323: Environmental requirements of abalone
75
Table 3: Growth data for greenlip abalone grown at different stocking densities with different levels of refuge provision. SGR-W = specific growth rate – with respect to weight. SGR – L = specific growth rate with respect to length.
Treatment SGR - W SGR - L µm day-1
1 2.68±0.15a 2.07±0.09a 68.50±1.15a 2 2.02±0.06b 1.63±0.11a 63.30±1.56a 3 2.16±0.09b 1.72±0.07a 61.96±0.41a 4 2.00±0.34b 1.34±0.20b 40.78±5.75b 5 2.05±0.04b 1.50±0.01b 45.61±0.77b 6 2.21±0.02b 1.68±0.01a 52.07±1.06a,b 7 1.98±0.10b 1.34±0.03b 41.61±2.88b 8 1.80±0.12c 1.41±0.13b 45.06±3.91b 9 1.96±0.05b 1.53±0.06b 53.14±2.12a,b
Values are means±SE (n=2) Means with different superscripts are significantly different (p<0.05 for SGR-W, p<0.01 for SGR-L)
Table 4: Mean ambient water quality pooled over a growth trial of greenlip abalone at different stocking densities and levels of refuge provision.
Treatment Temperature DO
(mg L-1) pH FAN
(µg L-1) 1 17.59±0.11 7.25±0.01 7.99±0.01 1.57±0.06 2 17.52±0.09 7.40±0.01 7.98±0.02 1.51±0.03 3 17.66±0.14 7.15±0.13 7.97±0.03 1.43±0.18 4 17.58±0.07 7.12±0.12 7.96±0.01 1.42 5 17.65±0.20 7.13±0.12 7.96±0.01 1.41 6 17.50±0.08 7.26±0.09 7.96±0.01 1.23 7 17.51±0.09 6.88±0.05 7.97±0.02 1.34±0.07 8 17.40±0.01 7.17±0.02 7.98±0.01 1.55±0.02 9 17.36±0.08 7.03±0.02 7.97±0.01 1.47±0.03
Values are means±SE (n=2) for replicate tanks.
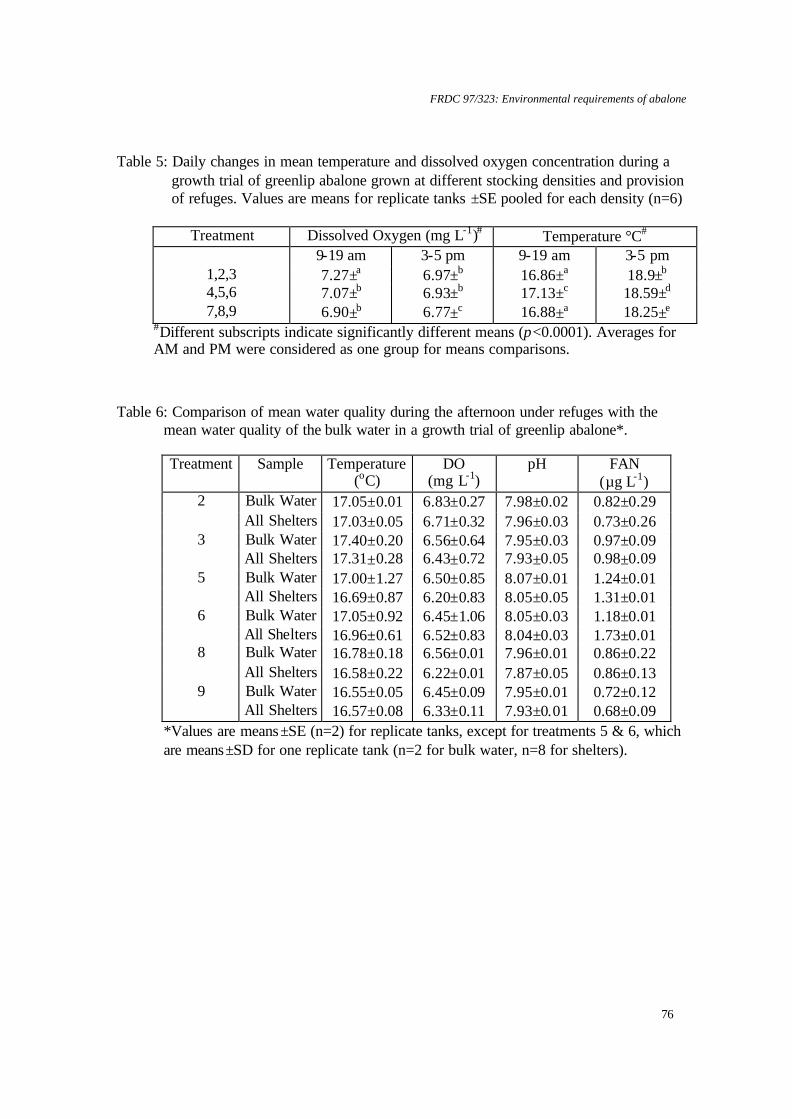
FRDC 97/323: Environmental requirements of abalone
76
Table 5: Daily changes in mean temperature and dissolved oxygen concentration during a
growth trial of greenlip abalone grown at different stocking densities and provision of refuges. Values are means for replicate tanks ±SE pooled for each density (n=6)
Treatment Dissolved Oxygen (mg L-1)# Temperature °C#
9-19 am 3-5 pm 9-19 am 3-5 pm 1,2,3 7.27±a 6.97±b 16.86±a 18.9±b 4,5,6 7.07±b 6.93±b 17.13±c 18.59±d 7,8,9 6.90±b 6.77±c 16.88±a 18.25±e
#Different subscripts indicate significantly different means (p<0.0001). Averages for AM and PM were considered as one group for means comparisons.
Table 6: Comparison of mean water quality during the afternoon under refuges with the
mean water quality of the bulk water in a growth trial of greenlip abalone*.
Treatment Sample Temperature (oC)
DO (mg L-1)
pH FAN (µg L-1)
2 Bulk Water 17.05±0.01 6.83±0.27 7.98±0.02 0.82±0.29 All Shelters 17.03±0.05 6.71±0.32 7.96±0.03 0.73±0.26
3 Bulk Water 17.40±0.20 6.56±0.64 7.95±0.03 0.97±0.09 All Shelters 17.31±0.28 6.43±0.72 7.93±0.05 0.98±0.09
5 Bulk Water 17.00±1.27 6.50±0.85 8.07±0.01 1.24±0.01 All Shelters 16.69±0.87 6.20±0.83 8.05±0.05 1.31±0.01
6 Bulk Water 17.05±0.92 6.45±1.06 8.05±0.03 1.18±0.01 All Shelters 16.96±0.61 6.52±0.83 8.04±0.03 1.73±0.01
8 Bulk Water 16.78±0.18 6.56±0.01 7.96±0.01 0.86±0.22 All Shelters 16.58±0.22 6.22±0.01 7.87±0.05 0.86±0.13
9 Bulk Water 16.55±0.05 6.45±0.09 7.95±0.01 0.72±0.12 All Shelters 16.57±0.08 6.33±0.11 7.93±0.01 0.68±0.09
*Values are means±SE (n=2) for replicate tanks, except for treatments 5 & 6, which are means±SD for one replicate tank (n=2 for bulk water, n=8 for shelters).
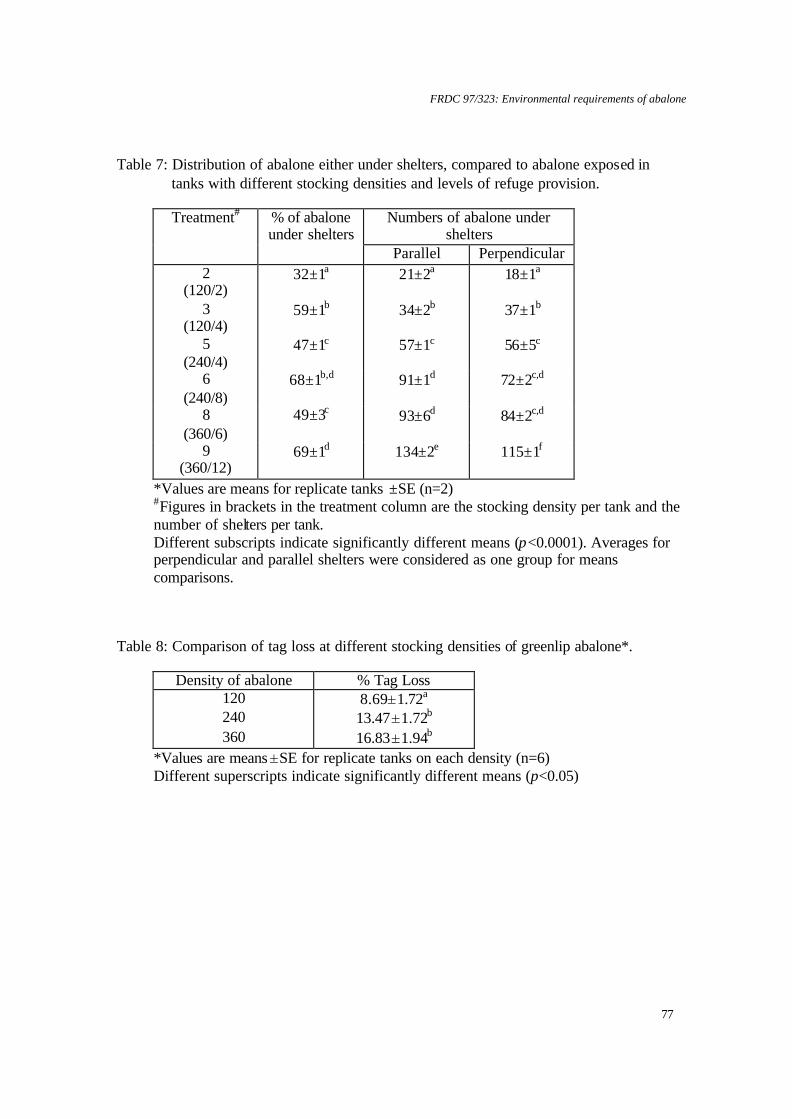
FRDC 97/323: Environmental requirements of abalone
77
Table 7: Distribution of abalone either under shelters, compared to abalone exposed in
tanks with different stocking densities and levels of refuge provision.
Numbers of abalone under shelters
Treatment# % of abalone under shelters
Parallel Perpendicular 2
(120/2) 32±1a 21±2a 18±1a
3 (120/4)
59±1b 34±2b 37±1b
5 (240/4)
47±1c 57±1c 56±5c
6 (240/8)
68±1b,d 91±1d 72±2c,d
8 (360/6)
49±3c 93±6d 84±2c,d
9 (360/12)
69±1d 134±2e 115±1f
*Values are means for replicate tanks ±SE (n=2) #Figures in brackets in the treatment column are the stocking density per tank and the number of shelters per tank. Different subscripts indicate significantly different means (p<0.0001). Averages for perpendicular and parallel shelters were considered as one group for means comparisons.
Table 8: Comparison of tag loss at different stocking densities of greenlip abalone*.
Density of abalone % Tag Loss 120 8.69±1.72a 240 13.47±1.72b 360 16.83±1.94b
*Values are means±SE for replicate tanks on each density (n=6) Different superscripts indicate significantly different means (p<0.05)

FRDC 97/323: Environmental requirements of abalone
78
0.004
0.005
0.006
0.007
0.008
0.009
0.01
0.011
0.012
0.013
0.014
0.015
0.016
0.017
Eff
ectiv
e su
rfac
e ar
ea p
er a
balo
ne (m
2 aba
lone
-1)
0
0.5
1
1.5
2
2.5
3
3.5
4
Bio
mas
s ga
in ta
nk-1
(kg)
1 2 3 4 5 6 7 8 9Treatment
Effective surface areaper abalone
Biomass weight gain
120 240 360DensityShelters 0 2 4 0 4 8 0 6 12
aa
aa,c
a,c a,c
b
b,c
b
Figure 1: Histogram of the gain in abalone biomass over 3 months for different stocking
densities and levels of refuge provision. Individual points show the nominal amount of substrate surface area available to each abalone. Values are means ± SE, n=2. Different superscripts indicate significantly different means (p<0.01).
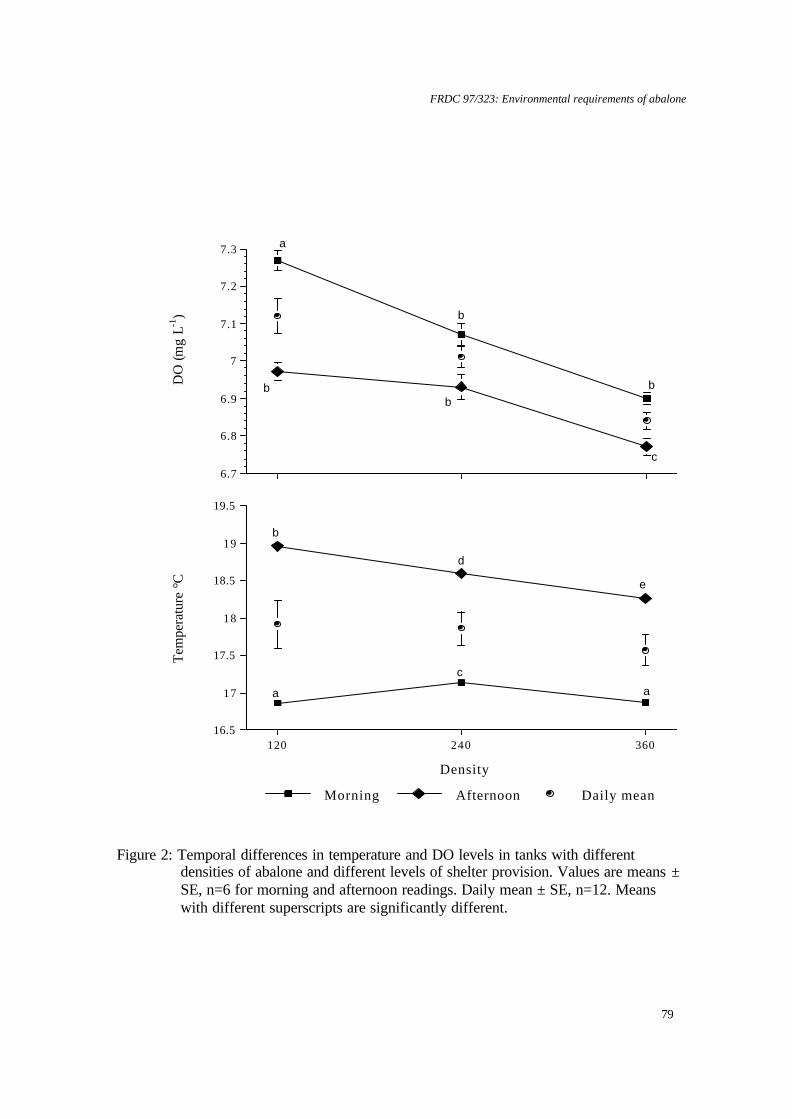
FRDC 97/323: Environmental requirements of abalone
79
Figure 2: Temporal differences in temperature and DO levels in tanks with different
densities of abalone and different levels of shelter provision. Values are means ± SE, n=6 for morning and afternoon readings. Daily mean ± SE, n=12. Means with different superscripts are significantly different.
6.7
6.8
6.9
7
7.1
7.2
7.3
16.5
17
17.5
18
18.5
19
19.5
Tem
pera
ture
°C
120 240 360
Density
Daily meanAfternoonMorning
a
b
bbb
c
a
c
a
b
d
e
DO
(mg
L-1)
FRDC 97/323: Environmental requirements of abalone
80
6.6: The effect of nitrite on the respiratory physiology of juvenile greenlip and blacklip abalone
Nontechnical summary Previous research had found that low concentrations of nitrite significantly reduced the growth rate of juvenile greenlip abalone. In order to determine why this occurred, juvenile greenlip and blacklip abalone were exposed to different concentrations of nitrite (0.056 to 0.453 µg NO2
--N L-1) for 3 days. After this the haemocyanin concentration and the pH of the haemolymph were determined. Haemocyanin is the molecule that carries oxygen around the abalone's body. At a nitrite concentration of 0.453 µg NO2
--N L-1 the concentration of haemocyanin was significantly reduced. This indicates a reduced capacity to transport oxygen, which may explain why growth is reduced in the presence of nitrite. The effect was likely to have been exacerbated by the deoxygenation of haemocyanin, which occurs in the presence of nitrite. Deoxygenated haemocyanin can then react with nitrite to form methaemocyanin, especially if haemolymph pH falls. Thus, not only is the total haemocyanin concentration reduced by nitrite, but also its ability to carry oxygen is also reduced.
FRDC 97/323: Environmental requirements of abalone
81
6.6: The effect of nitrite on the respiratory physiology of juvenile greenlip and blacklip abalone
James O. Harris and Chris M. Burke
Introduction The major source of nitrogenous compounds in aquaculture systems is usually from catabolism of protein contained within feed, with ammonia being the major end-product (Colt and Armstrong, 1981). In aerobic environments, nitrifying bacteria oxidise ammonia to nitrogen oxides, including nitrite and finally nitrate. In flow-through systems, ammonia will be the principal toxic metabolite by-product, but in recirculating systems, both ammonia and nitrite may occur at toxic levels (Colt and Armstrong, 1981). The conversion of nitrite to nitrate can be the rate-limiting step when conditioning biofilters, as ammonia can inhibit this conversion and cause a subsequent elevation of nitrite levels (Anthionsen et al., 1976; de Guingand and Maguire, 1992). Nitrite decreases growth for many aquaculture species (Wickins, 1976; Colt et al., 1981; Liu and Avault, 1996; Harris et al., 1997). Nitrite can form complexes with respiratory pigments, hence affecting oxygen transport (Jensen, 1995). Growth depression for greenlip abalone and other aquaculture species that use Hcy as their respiratory pigment indicate that lower levels of nitrite cause similar depressions to higher, more acutely toxic concentrations (Harris et al., 1997, Wickins, 1976). Nitrite is known to accumulate in the extracellular fluid of marine fish and crustaceans (Eddy et al., 1983, Chen and Chen, 1992a; 1992b; 1992c; Jensen, 1996), although to much less extent than in freshwater species (Gutzmer and Tomasso, 1985; Jensen et al., 1987). In previous bioassay experiments on juvenile greenlip abalone, recommended water quality levels for aquaculture were determined for ammonia (Harris et al., 1998b), dissolved oxygen (Harris et al., 1999a) and pH (Harris et al. 1999c). The low levels of nitrite that affected growth for this species, with little further growth depression with increased nitrite concentration, suggest that another approach is required to determine the ‘safe’ limits for abalone aquaculture. Determining the effects of low levels of nitrite on abalone respiratory physiology will allow more accurate predictions of the effects of nitrite on abalone, a species of increasing importance to Australian aquaculture (Hone and Maguire, 1996). Materials and methods The juvenile greenlip abalone used in these experiments were approximately three years old and were obtained from a commercial hatchery at Bicheno, Tasmania, Australia, where the research was conducted (E148'18", S41' 53"). The mean lengths and weights of the greenlip and blacklip abalone were 53.6±0.4 mm, 21.1±0.5 g (n=155), and 45.3±0.3 mm, 15.5±0.4 g (mean+ SE, n=155), respectively. For 2-3 months prior to experimentation, these abalone were maintained on a commercial formulated abalone feed (FRDC Diet #6). Abalone used for this experiment were removed from tank surfaces with a thin plastic card.
FRDC 97/323: Environmental requirements of abalone
82
Bioassay system Abalone were held in cages (100 mm diameter x 35 cm PVC tubes, with 6 mm mesh floor and 8 mm mesh wall sections) suspended vertically within 70 L bioassay tanks (Harris et al., 1997). Twenty abalone of each species were randomly placed into cages (separate cages for each species) in each tank and acclimatised for 3 days prior to experimentation. Oceanic seawater was filtered through a commercial sand filter and delivered to six 1100 L reservoirs. The reservoirs were drained and refilled each day with seawater dosed with the appropriate amounts of sodium nitrite (NaNO2). Each reservoir was connected to a constant head chamber, suppling three bioassay chambers via standard lengths of black 4 mm polypropylene tubing (Harris et al., 1997). The bioassay tanks had conical ends to concentrate solid wastes and to avoid air spaces. The experiment was conducted using 200-300 W aquarium heaters in the bioassay tanks and head adjustment columns, respectively, to maintain a constant temperature. Acute nitrite exposure One control (with no added nitrite) and five experimental treatments were established (Table 1); average nitrite concentrations ranged from 0.056-0.453 mg NO2-N.L-1. All cages were checked daily for mortality. Five blacklip and five greenlip abalone were randomly sampled from tanks on the following occasions. On day 0, three tanks were randomly sampled. On day 1, duplicate tanks for treatments 4 and 6 were sampled; single tanks were sampled for treatments 2, 3 and 4. On day 2, samples were taken from duplicate tanks at all treatment levels except for treatment 5, which had three tanks sampled. On day 3, duplicate tanks were sampled for treatments 4 and 6, while single tanks were sampled for treatments 1, 2, 3 and 5. The abalone were blotted and weighed to the nearest 0.01 g (whole wet body weight; WWBW) and measured with callipers to 0.1 mm. Haemolymph samples were removed from the cephalic arterial sinus via 2.5 mL syringes with 25 gauge needles (Ainslie 1980b, Russell and Evans 1989). The pH of each sample was immediately measured with a TPS 4 mm tip combination pH electrode and 100 µL of each sample was added to 900 µL of deionised water in a 10 mm quartz cuvette and the absorbance was measured spectrophotometrically at 345 nm. Haemolymph oxyhaemocyanin concentration was determined according to Nickerson and Van Holde (1971), and converted to mg.mL-1. The remainder of the samples were transferred to the centrifuge and spun at approximately 5000 rpm for 10 minutes before being frozen for later analysis. In vitro haemocyanin study Three-mL samples of haemolymph were added to a tonometer and spun with air, oxygen or nitrogen flooding the tonometer. 0.5 mL samples were transferred to cuvettes containing 1.5 mL of buffer (TRIS-HCl 0.025 mol L-1, NaCl 0.5 mol L-1, pH =7.25) or buffer and NaNO2. Solutions of NaNO2 and buffer were prepared in concentrations of 0.001, 0.01, 0.1, 0.3 and 0.5 mg NO2-N L-1. Absorbance was measured at 345 nm, with the neat buffer as the blank for all samples. Absorbance values were converted to mg mL1 using an extinction coefficient of 3.3 (Nickerson and Van Holde 1971). Water quality analysis

FRDC 97/323: Environmental requirements of abalone
83
The nitrite concentration of all tanks from each treatment was measured each day (Table 1). Water samples were collected in acid-washed glassware, and nitrite was measured by the diazotization method (Grasshoff, 1989). The pH meter and combination glass electrode (TPS) were calibrated with phosphate (pH=7.00) and borate (pH=9.28) buffers daily before use (Bruno and Svoronos, 1989). A TPS oxygen electrode was used for daily measurements. The mean±SE values for temperature, salinity and pH were 17.7±0.1°C, 33.0±0.2 ‰ and 7.79±0.02 (n=18), respectively. Statistical analyses Data were subjected to one way ANOVA after meeting assumptions of normality using the Shapiro-Wilk test (Zar, 1996) and homogeneity of variance using Cochran's test (Underwood, 1981). A complete 3-way ANOVA could not be performed because there were insufficient samples. Replicates were considered to be independent and nitrite concentration, days and species were analysed as fixed factors. Values of pH were transformed (10-pH) prior to analysis. Results for each nitrite concentration were compared against each other using Student’s t-test (Sokal and Rohlf, 1995). All analyses were conducted using JMP 3.0 software (SAS Institute). Results The data were initially analysed to determine if there were differences between species. The concentration of Hcy was significantly higher (p<0.01) in greenlip abalone (0.65±0.04 mg.ml-1) than for blacklip abalone (0.49±0.04 mg.ml-1). Haemolymph pH was not significantly different between greenlip (pH 7.25±0.02) and blacklip (7.29±0.02) abalone (p>0.05). Data for both species were pooled for haemolymph pH analysis (Figure 1), while haemolymph Hcy levels were analysed separately for each species. Blacklip abalone showed a significant depression in their Hcy concentration over time (p<0.05), with readings from day 3 significantly different to days 0, 1 and 2 (p<0.05). Mean Hcy concentrations on day 2 were 83% of values for day 0, and mean Hcy concentrations on day 3 were 45% of values for day 0 (Figure 2). Blacklip abalone Hcy levels were also depressed with nitrite concentration, with Hcy concentrations from abalone held at 0.453 mg NO2-N.L-1 significantly lower than for abalone held at 0.056 mg NO2-N.L-1 (p<0.05) (Figure 3). The average haemolymph haemocyanin concentration for greenlip abalone was 7.71±0.22 mg mL-1. There were no significant differences (p>0.05) in the haemocyanin concentration in greenlip abalone haemolymph among different concentrations of nitrite or for day. The concentrations of oxyHcy for air and oxygen were similar, however, depression of oxyHcy occurred after exposure to nitrogen at the highest nitrite concentration (0.257 mg NO2-N L1) (Figure 4). No statistical analyses were carried out on these data due to insufficient samples. Discussion The Hcy levels encountered within the abalone haemolymph were considerably lower than previous studies on Australian abalone (Ainslie 1980a, Ainslie 1980b). Ainslie (1980b)

FRDC 97/323: Environmental requirements of abalone
84
reported Hcy concentrations in the region of 2.4-14.2 mg.mL-1 for greenlip and 1.0-9.9 mg.mL-1 for blacklip abalone. Although the concentrations determined in this study were below these ranges, the relative concentration of mean blacklip abalone Hcy was 78.2% of greenlip abalone, whereas from Ainslie’s (1980b) data, blacklip abalone had a mean relative Hcy concentration at 69.5% of greenlip abalone. Greenlip abalone are more tolerant of oxygen-supersaturated conditions than blacklip abalone (Harris et al. 1999b), which may be a reflection of this higher level of Hcy. In a recent paper by Harris et al. (1997), greenlip abalone were exposed to seawater containing nitrite for 2-3 months, then their growth rates and oxygen consumption rates measured. The pattern for growth was an initial, rapid depression of growth rates at low nitrite concentration (<1 mg NO2-N.L-l), with little further depression of growth rate at higher concentrations (<8 mg NO2-N.L-l). However, oxygen consumption rates decreased with increasing nitrite concentration, suggesting that respiratory physiology was compromised. Previous research on the effect of nitrite on crustacean Hcy has revealed that oxyHcy (the proportion of total Hcy that is oxygenated) decreases with exposure to nitrite (Jensen 1990, Chen and Cheng 1995a, b, Cheng and Chen 1999). Tahon et al. (1988) reported that the reaction rate of deoxyHcy (the proportion of total Hcy that is deoxygenated) with nitrite was 15 times faster than that of oxyHcy, and produced metHcy at pH 5.7. Abalone are known to employ a reverse Bohr and Root effect in their respiratory physiology (Wells et al. 1998), meaning that at lower physiological pH, oxygen affinity is higher. This phenomenon has been linked to conservation of oxygen in a hypercapnic environment (Brix et al. 1979, Mangum and Burnett 1986). Thus, when deoxyHcy is formed, the concomitant presence of nitrite is likely to cause the formation of metHcy, which further depletes the oxygen carrying capacity of the haemolymph. Research on marine prawns revealed that haemolymph oxygen partial pressure increased with nitrite exposure, from which the authors concluded a decreased oxygen affinity of unoxidised Hcy (Chen and Cheng 1995b). It is also apparent from the data in the second part of this study that nitrite has a more severe effect on deoxyHcy than oxyHcy in abalone. The rate of consumption of oxygen in H. laevigata declines with increasing nitrite concentration, although food consumption remains the same (Harris et al. 1997). Thus, the compromise in respiratory physiology as a result of the reaction of nitrite with Hcy is likely to be in some way alleviated by an increase in the use of available energy. It follows that growth will in turn be affected this re-direction of available energy. The decrease in oxyHcy concentration with increasing nitrite concentration observed in the in vitro study supports this hypothesis. It may also be that anaerobic respiration has some function in supplementing tissue electron acceptors in the event of a suppression of aerobic respiration. This would also have the effect of lowering haemolymph pH, in turn exacerbating the nitrite-deoxyhcy combination. The lower pH observed at the highest nitrite concentration suggests that nitrite is also influencing abalone physiology. Hypoxia is known to produce a decrease in intracellular pH of the red abalone, Haliotis rufescens (Tjeerdema et al. 1991). It is possible that either the action of nitrite on deoxyHcy causes the abalone to increase activity to maintain arterial oxygen levels, or that activity increases as a direct result of nitrite exposure, causing a decline in pH and subsequent enhancement of nitrite-deoxyHcy binding. The uptake of nitrite into haemolymph is

FRDC 97/323: Environmental requirements of abalone
85
balanced by Cl- and HCO3- exchange in most species, and also by nitrate in the freshwater
crayfish, Astacus astacus (Jeberg and Jensen 1994). Harris (1999) observed that haemolymph chloride of greenlip abalone declined significantly at 7.80 mg NO2-N.L-1 but not at lower concentrations, so it is unlikely that the active efflux of ions to balance the rise in nitrite was sufficient in this study to control internal pH. Acknowledgements The authors would like to thank Ms. Kerri van der Meer for technical assistance and MSH for hosting the research. Table 1. Nitrite concentrations from the three-day exposure period for H. laevigata and H. rubra, and associated haemocyanin and pH levels (mean±SE). Nitrite concentration
mg NO2-N.L-1 Greenlip (n=30)
(Haliotis laevigata) Blacklip (n=32) (Haliotis rubra)
(n=37) Hcy pH Hcy pH 0.056±0.043 0.61±0.13 7.22±0.04 0.71±0.08 7.28±0.04 0.234±0.031 0.91±0.19 7.43±0.05 0.44±0.07 7.44±0.03 0.284±0.013 0.67±0.29 7.34±0.05 0.64±0.06 7.34±0.03 0.322±0.053 0.63±0.08 7.23±0.04 0.46±0.06 7.27±0.04 0.451±0.001 0.65±0.10 7.25±0.06 0.44±0.04 7.33±0.06 0.453±0.002 0.54±0.10 7.18±0.04 0.21±0.08 7.22±0.06
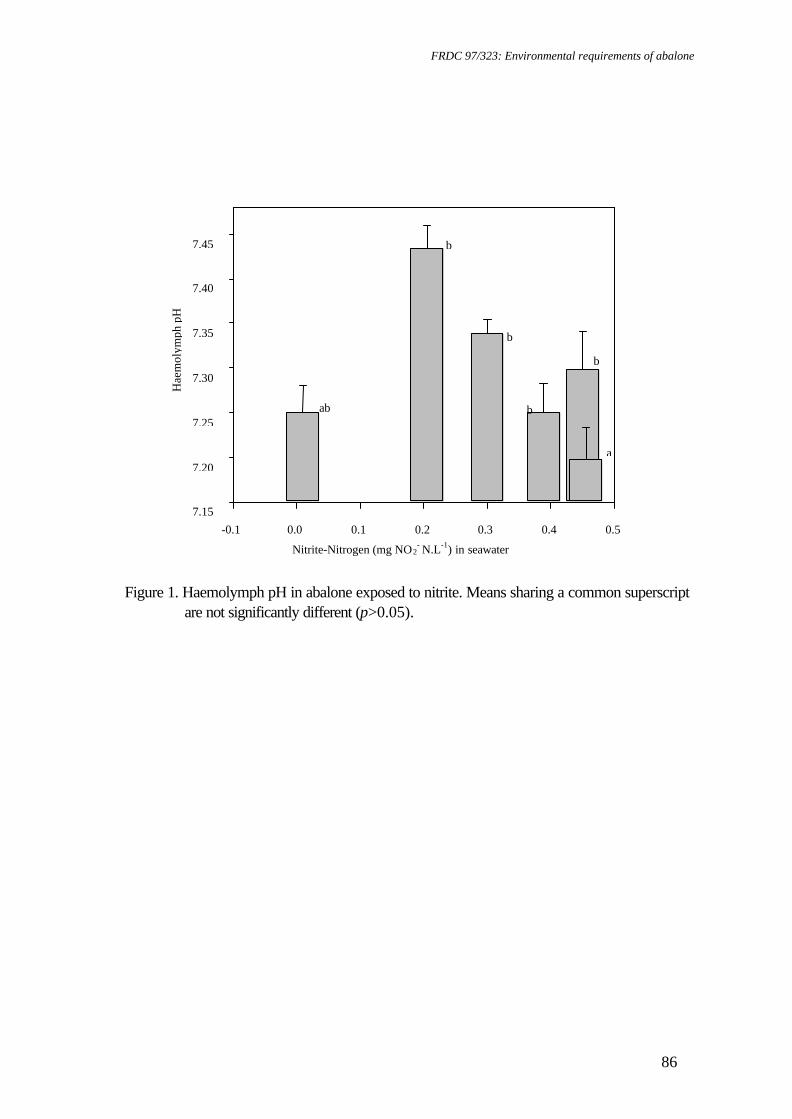
FRDC 97/323: Environmental requirements of abalone
86
Figure 1. Haemolymph pH in abalone exposed to nitrite. Means sharing a common superscript are not significantly different (p>0.05).
Nitrite-Nitrogen (mg NO2- N.L-1) in seawater
-0.1 0.0 0.1 0.2 0.3 0.4 0.5
Hae
mol
ymph
pH
7.15
7.20
7.25
7.30
7.35
7.40
7.45
a
ab
b
b
b
b
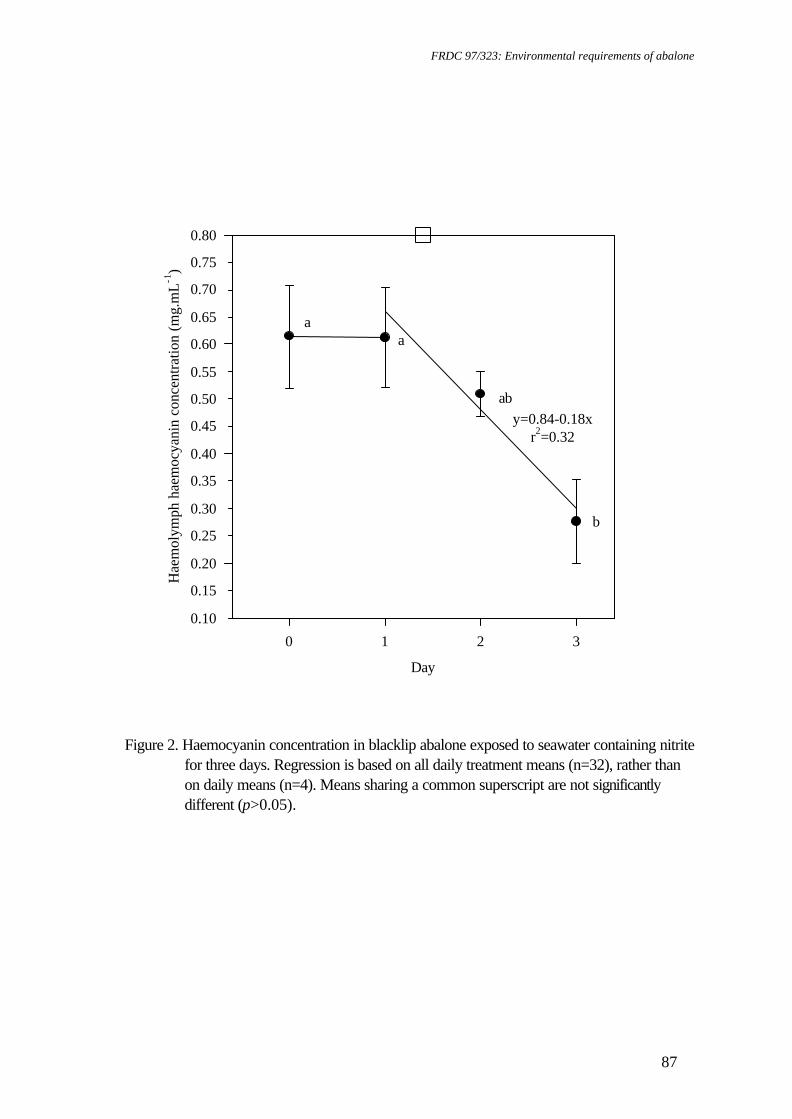
FRDC 97/323: Environmental requirements of abalone
87
Day
0 1 2 3
Hae
mol
ymph
hae
moc
yani
n co
ncen
tratio
n (m
g.m
L-1
)
0.10
0.15
0.25
0.30
0.35
0.45
0.50
0.55
0.65
0.70
0.75
0.20
0.40
0.60
0.80
aa
ab
b
y=0.84-0.18xr2=0.32
Figure 2. Haemocyanin concentration in blacklip abalone exposed to seawater containing nitrite
for three days. Regression is based on all daily treatment means (n=32), rather than on daily means (n=4). Means sharing a common superscript are not significantly different (p>0.05).

FRDC 97/323: Environmental requirements of abalone
88
Nitrite-nitrogen (mg NO2-N.L -1)
0.0 0.0 0.2 0.3 0.4 0.5
Hae
mol
ymph
hae
moc
yani
n co
ncen
tratio
n (m
g.m
L-1
)
0.1
0.2
0.3
0.4
0.5
0.6
0.7
0.8
0.9
1.0
a
a
bb b
c
Figure 3. Haemocyanin concentration in blacklip abalone haemolymph with increasing nitrite
concentration. Means sharing a common superscript are not significantly different (p>0.05).
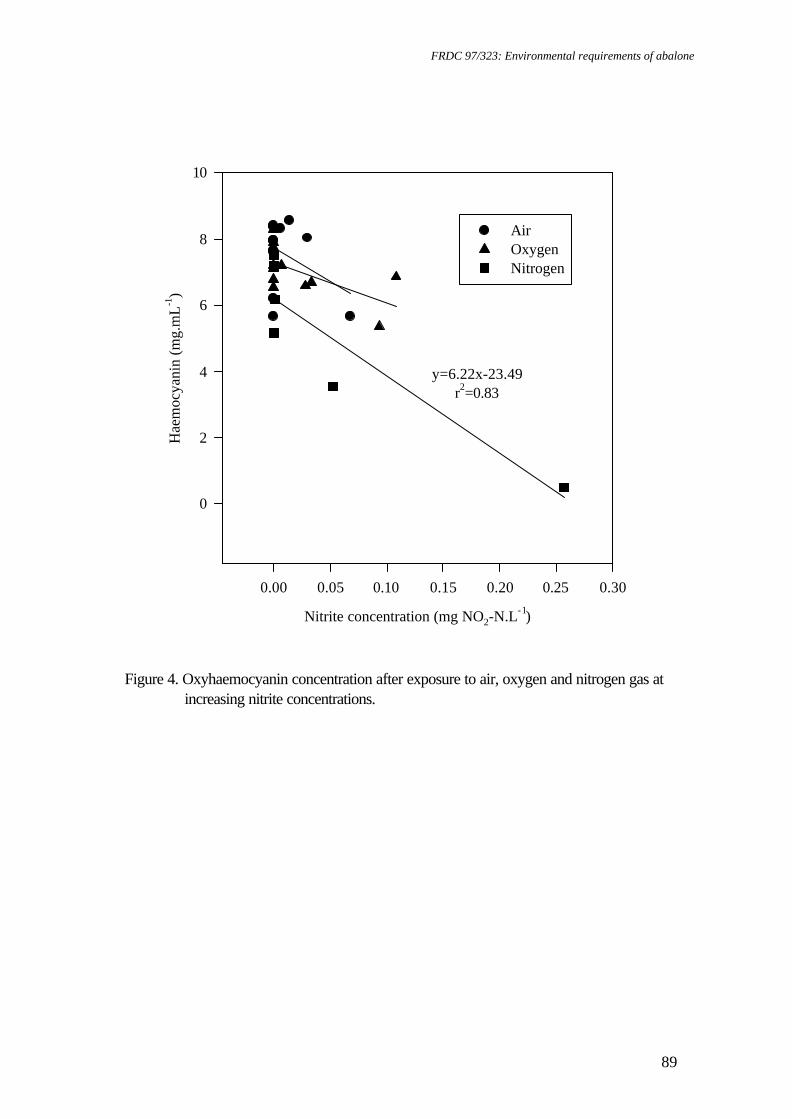
FRDC 97/323: Environmental requirements of abalone
89
Nitrite concentration (mg NO2-N.L-1)
0.00 0.05 0.10 0.15 0.20 0.25 0.30
Hae
moc
yani
n (m
g.m
L-1
)
0
2
4
6
8
10
Air Oxygen Nitrogen
y=6.22x-23.49r2=0.83
Figure 4. Oxyhaemocyanin concentration after exposure to air, oxygen and nitrogen gas at
increasing nitrite concentrations.
FRDC 97/323: Environmental requirements of abalone
90
6.7: Effect of salinity on survival and haemolymph parameters for greenlip abalone
Nontechnical summary Abalone usually inhabit exposed coasts and, therefore, commonly experience stable salinity of approximately 35‰. However, the expansion of abalone farming may increase the likelihood of exposure to lower salinities from estuarine intakes or freshwater runoff. Decreased salinity can stress animals and decrease growth rates or survival. Salinity-induced stress is likely to be a serious problem for abalone as their body has a large permeable surface. Furthermore, their diet may influence their ability to respond (and cope with) stress. This experiment examined the acute effects of low salinity on greenlip abalone that had been fed different levels of vitamins and minerals in ABCHOW diet. Greenlip abalone died rapidly when exposed to 20‰ salinity or less. At 25‰ all animals survived for 25 hours, but this was reduced to 80% by 30 hours. Doubling the normal vitamin content increased survival to 90%, but increasing mineral content decreased survival. Detachment and death rates were increased if abalone were not given sufficient time at 35‰ to properly attach to the substrate. Several hours were allowed in this experiment. As abalone are osmoconformers, we found that the osmolality of the haemolymph was always equivalent to the osmolality of the external medium, irrespective of salinity. This means that if, for example, the salinity of the water is reduced, the abalone respond by taking in water, which reduces the concentration of solutes in the haemolymph. However, although the total amounts of solutes were equivalent, the concentration of some of the ions differed (some were increased, some decreased) from the external water. Greenlip abalone regulate potassium ions to always maintain a higher haemolymph concentration, and regulate sodium ions to maintain a lower haemolymph concentration. By regulating potassium concentration, the abalone attempt to control the osmotic pressure in their neurons to maintain proper function of their nervous system. It is when this regulatory system is overwhelmed (e.g. if salinity is less than 25‰), that the abalone die. As mortality patterns in response to low salinity closely matched growth data in response to dietary history, a salinity challenge appears to be a promising stress test.
FRDC 97/323: Environmental requirements of abalone
91
6.7: Effect of salinity on survival and haemolymph parameters for greenlip abalone.
Sam J. Boarder, Greg B. Maguire, James O. Harris Introduction As abalone possess a large permeable surface area they require a large energy expenditure to osmoregulate (Burton 1983). Thus, abalone are osmoconforming marine gastropods in which fluctuations in salinity directly affect the ionic concentration of abalone blood (Brix 1983, Somero and Bowlus 1983). Large or sudden fluctuations in salinity cause abalone blood to equilibrate with the external medium over an extended period (Burton 1983). Typically, abalone are found in exposed sections of the coastline with relatively stable salinity. However, blacklip abalone inhabit the Huon estuary, which is prone to salinity variation, and is being used for pilot scale abalone production (Hindrum et al. 1996). Salinity stress in gastropods usually causes the animal to attach firmly to the substratum in an attempt to prevent equilibration with the external environment. Sealing themselves also traps a quantity of water that can act as a buffer from the external environment. Burton (1983) describes some gastropods that can remain attached for days before internal and external ion concentrations equilibrate. However, animals that have been previously stressed may have an impaired response to altered salinity. Nutritional deficiency symptoms are usually seen as a display of poor growth (Halver 1989). Prior to this, specific biochemical reactions dependent on the deficient nutrient begin to break down. The degeneration of these biochemical reactions finally impairs cellular function and in some way prevents the normal growth or behaviour of the affected animal (Smith et al. 1974). By definition, a deterioration of overall robustness will be one of the first manifestations of nutrient deficiency. This can be tested through the application of an external stressor and animals from different nutritional backgrounds can be compared. This chapter assesses the influence of preceding nutritional history on the response of juvenile greenlip abalone, H. laevigata, to acute salinity alterations. This research was undertaken in response to assessments, made by abalone farmers, in which they attributed mortality to the interaction of nutritional and environmental stresses. The acute toxicity experiment was conducted in conjunction with a concurrent Aquaculture CRC project on abalone feeds and nutrition. In this case, the acute response to salinity was determined for abalone fed different vitamin and mineral combinations. Materials and Methods Preliminary salinity test Prior to the commencement of the salinity challenge, a preliminary test was undertaken to ensure that the chosen salinities would stress, but not kill, all of the experimental animals
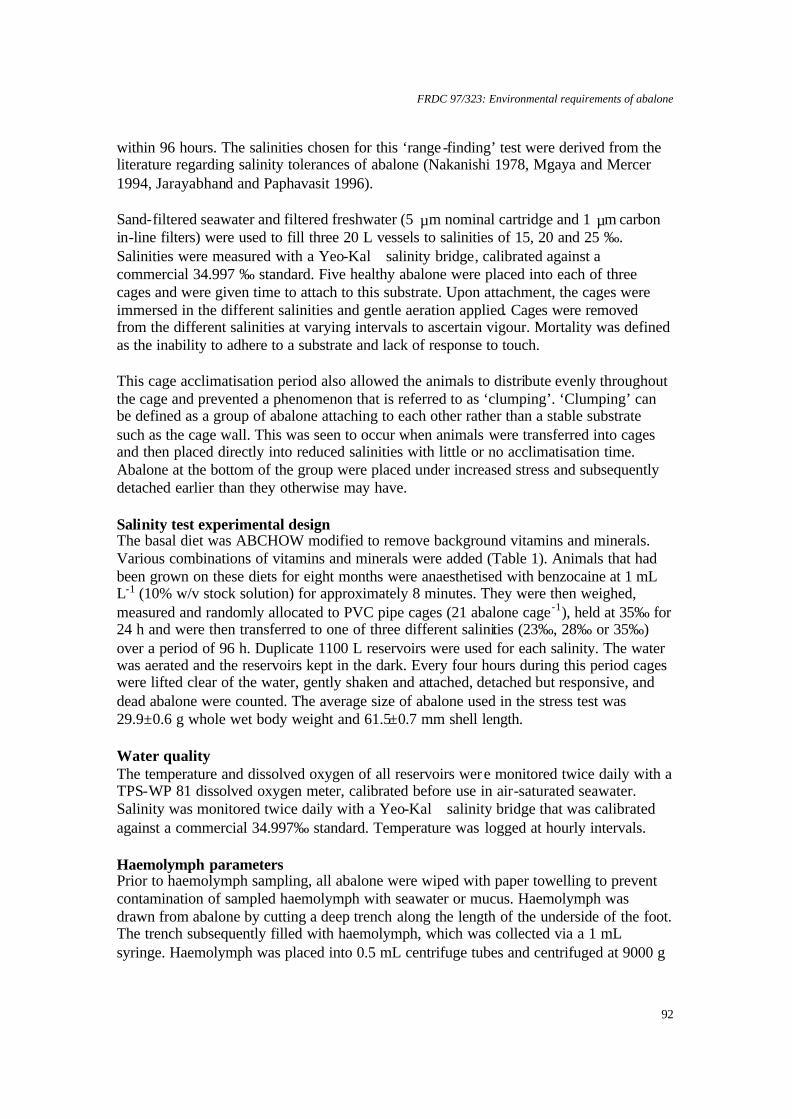
FRDC 97/323: Environmental requirements of abalone
92
within 96 hours. The salinities chosen for this ‘range-finding’ test were derived from the literature regarding salinity tolerances of abalone (Nakanishi 1978, Mgaya and Mercer 1994, Jarayabhand and Paphavasit 1996). Sand-filtered seawater and filtered freshwater (5 µm nominal cartridge and 1 µm carbon in-line filters) were used to fill three 20 L vessels to salinities of 15, 20 and 25 ‰. Salinities were measured with a Yeo-Kal salinity bridge, calibrated against a commercial 34.997 ‰ standard. Five healthy abalone were placed into each of three cages and were given time to attach to this substrate. Upon attachment, the cages were immersed in the different salinities and gentle aeration applied. Cages were removed from the different salinities at varying intervals to ascertain vigour. Mortality was defined as the inability to adhere to a substrate and lack of response to touch. This cage acclimatisation period also allowed the animals to distribute evenly throughout the cage and prevented a phenomenon that is referred to as ‘clumping’. ‘Clumping’ can be defined as a group of abalone attaching to each other rather than a stable substrate such as the cage wall. This was seen to occur when animals were transferred into cages and then placed directly into reduced salinities with little or no acclimatisation time. Abalone at the bottom of the group were placed under increased stress and subsequently detached earlier than they otherwise may have. Salinity test experimental design The basal diet was ABCHOW modified to remove background vitamins and minerals. Various combinations of vitamins and minerals were added (Table 1). Animals that had been grown on these diets for eight months were anaesthetised with benzocaine at 1 mL L-1 (10% w/v stock solution) for approximately 8 minutes. They were then weighed, measured and randomly allocated to PVC pipe cages (21 abalone cage-1), held at 35‰ for 24 h and were then transferred to one of three different salinities (23‰, 28‰ or 35‰) over a period of 96 h. Duplicate 1100 L reservoirs were used for each salinity. The water was aerated and the reservoirs kept in the dark. Every four hours during this period cages were lifted clear of the water, gently shaken and attached, detached but responsive, and dead abalone were counted. The average size of abalone used in the stress test was 29.9±0.6 g whole wet body weight and 61.5±0.7 mm shell length. Water quality The temperature and dissolved oxygen of all reservoirs were monitored twice daily with a TPS-WP 81 dissolved oxygen meter, calibrated before use in air-saturated seawater. Salinity was monitored twice daily with a Yeo-Kal salinity bridge that was calibrated against a commercial 34.997‰ standard. Temperature was logged at hourly intervals. Haemolymph parameters Prior to haemolymph sampling, all abalone were wiped with paper towelling to prevent contamination of sampled haemolymph with seawater or mucus. Haemolymph was drawn from abalone by cutting a deep trench along the length of the underside of the foot. The trench subsequently filled with haemolymph, which was collected via a 1 mL syringe. Haemolymph was placed into 0.5 mL centrifuge tubes and centrifuged at 9000 g
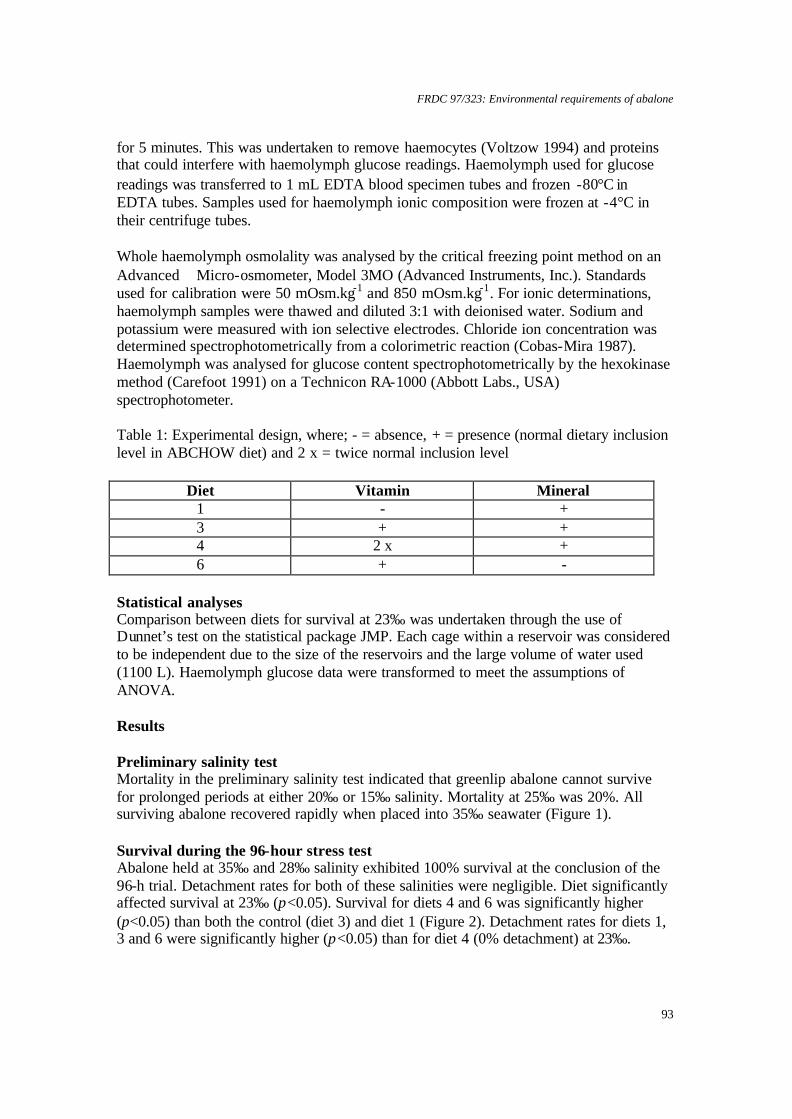
FRDC 97/323: Environmental requirements of abalone
93
for 5 minutes. This was undertaken to remove haemocytes (Voltzow 1994) and proteins that could interfere with haemolymph glucose readings. Haemolymph used for glucose readings was transferred to 1 mL EDTA blood specimen tubes and frozen -80°C in EDTA tubes. Samples used for haemolymph ionic composition were frozen at -4°C in their centrifuge tubes. Whole haemolymph osmolality was analysed by the critical freezing point method on an Advanced Micro-osmometer, Model 3MO (Advanced Instruments, Inc.). Standards used for calibration were 50 mOsm.kg-1 and 850 mOsm.kg-1. For ionic determinations, haemolymph samples were thawed and diluted 3:1 with deionised water. Sodium and potassium were measured with ion selective electrodes. Chloride ion concentration was determined spectrophotometrically from a colorimetric reaction (Cobas-Mira 1987). Haemolymph was analysed for glucose content spectrophotometrically by the hexokinase method (Carefoot 1991) on a Technicon RA-1000 (Abbott Labs., USA) spectrophotometer. Table 1: Experimental design, where; - = absence, + = presence (normal dietary inclusion level in ABCHOW diet) and 2 x = twice normal inclusion level
Diet Vitamin Mineral 1 - + 3 + + 4 2 x + 6 + -
Statistical analyses Comparison between diets for survival at 23‰ was undertaken through the use of Dunnet’s test on the statistical package JMP. Each cage within a reservoir was considered to be independent due to the size of the reservoirs and the large volume of water used (1100 L). Haemolymph glucose data were transformed to meet the assumptions of ANOVA. Results Preliminary salinity test Mortality in the preliminary salinity test indicated that greenlip abalone cannot survive for prolonged periods at either 20‰ or 15‰ salinity. Mortality at 25‰ was 20%. All surviving abalone recovered rapidly when placed into 35‰ seawater (Figure 1). Survival during the 96-hour stress test Abalone held at 35‰ and 28‰ salinity exhibited 100% survival at the conclusion of the 96-h trial. Detachment rates for both of these salinities were negligible. Diet significantly affected survival at 23‰ (p<0.05). Survival for diets 4 and 6 was significantly higher (p<0.05) than both the control (diet 3) and diet 1 (Figure 2). Detachment rates for diets 1, 3 and 6 were significantly higher (p<0.05) than for diet 4 (0% detachment) at 23‰.
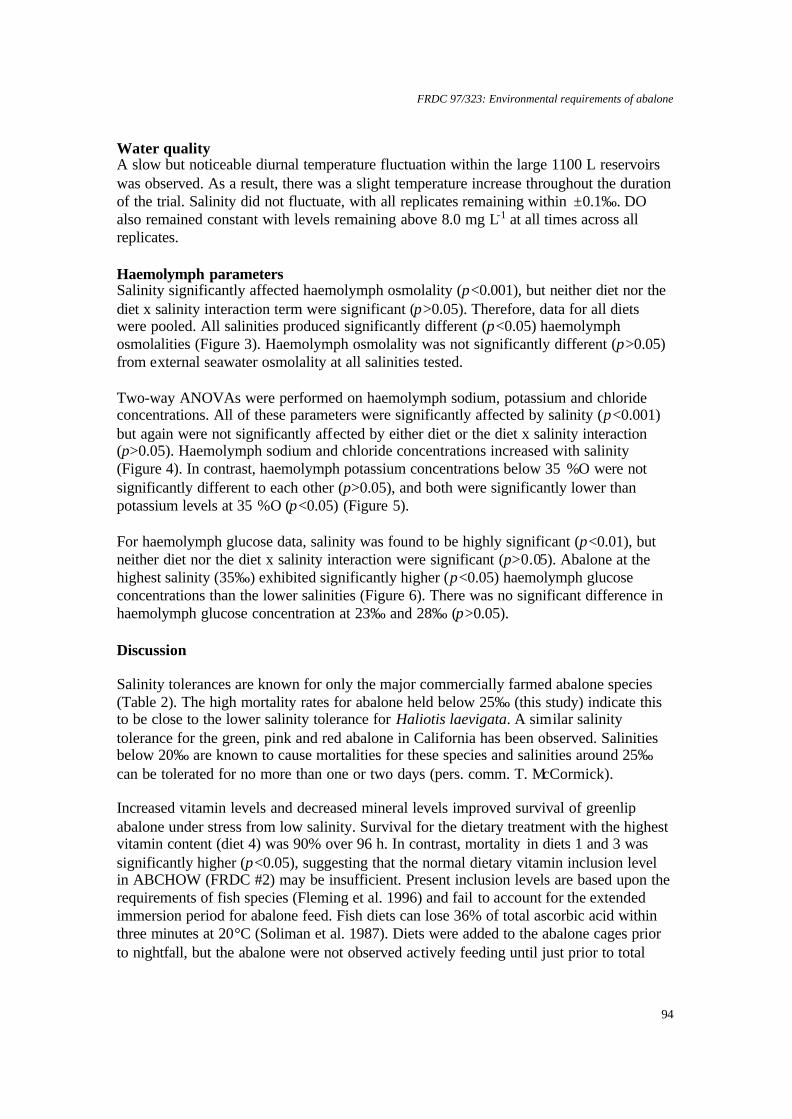
FRDC 97/323: Environmental requirements of abalone
94
Water quality A slow but noticeable diurnal temperature fluctuation within the large 1100 L reservoirs was observed. As a result, there was a slight temperature increase throughout the duration of the trial. Salinity did not fluctuate, with all replicates remaining within ±0.1‰. DO also remained constant with levels remaining above 8.0 mg L-1 at all times across all replicates. Haemolymph parameters Salinity significantly affected haemolymph osmolality (p<0.001), but neither diet nor the diet x salinity interaction term were significant (p>0.05). Therefore, data for all diets were pooled. All salinities produced significantly different (p<0.05) haemolymph osmolalities (Figure 3). Haemolymph osmolality was not significantly different (p>0.05) from external seawater osmolality at all salinities tested. Two-way ANOVAs were performed on haemolymph sodium, potassium and chloride concentrations. All of these parameters were significantly affected by salinity (p<0.001) but again were not significantly affected by either diet or the diet x salinity interaction (p>0.05). Haemolymph sodium and chloride concentrations increased with salinity (Figure 4). In contrast, haemolymph potassium concentrations below 35 %O were not significantly different to each other (p>0.05), and both were significantly lower than potassium levels at 35 %O (p<0.05) (Figure 5). For haemolymph glucose data, salinity was found to be highly significant (p<0.01), but neither diet nor the diet x salinity interaction were significant (p>0.05). Abalone at the highest salinity (35‰) exhibited significantly higher (p<0.05) haemolymph glucose concentrations than the lower salinities (Figure 6). There was no significant difference in haemolymph glucose concentration at 23‰ and 28‰ (p>0.05). Discussion Salinity tolerances are known for only the major commercially farmed abalone species (Table 2). The high mortality rates for abalone held below 25‰ (this study) indicate this to be close to the lower salinity tolerance for Haliotis laevigata. A similar salinity tolerance for the green, pink and red abalone in California has been observed. Salinities below 20‰ are known to cause mortalities for these species and salinities around 25‰ can be tolerated for no more than one or two days (pers. comm. T. McCormick). Increased vitamin levels and decreased mineral levels improved survival of greenlip abalone under stress from low salinity. Survival for the dietary treatment with the highest vitamin content (diet 4) was 90% over 96 h. In contrast, mortality in diets 1 and 3 was significantly higher (p<0.05), suggesting that the normal dietary vitamin inclusion level in ABCHOW (FRDC #2) may be insufficient. Present inclusion levels are based upon the requirements of fish species (Fleming et al. 1996) and fail to account for the extended immersion period for abalone feed. Fish diets can lose 36% of total ascorbic acid within three minutes at 20°C (Soliman et al. 1987). Diets were added to the abalone cages prior to nightfall, but the abalone were not observed actively feeding until just prior to total
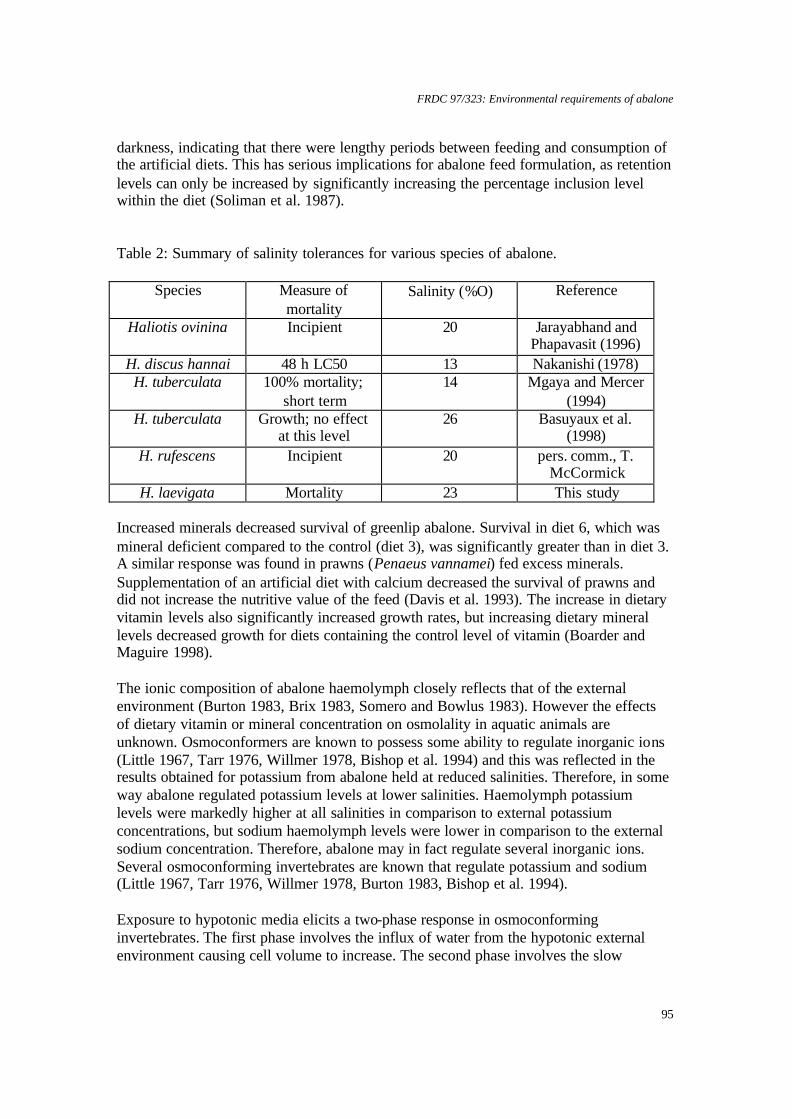
FRDC 97/323: Environmental requirements of abalone
95
darkness, indicating that there were lengthy periods between feeding and consumption of the artificial diets. This has serious implications for abalone feed formulation, as retention levels can only be increased by significantly increasing the percentage inclusion level within the diet (Soliman et al. 1987). Table 2: Summary of salinity tolerances for various species of abalone.
Species Measure of mortality
Salinity (%O) Reference
Haliotis ovinina Incipient 20 Jarayabhand and Phapavasit (1996)
H. discus hannai 48 h LC50 13 Nakanishi (1978) H. tuberculata 100% mortality;
short term 14 Mgaya and Mercer
(1994) H. tuberculata Growth; no effect
at this level 26 Basuyaux et al.
(1998) H. rufescens Incipient 20 pers. comm., T.
McCormick H. laevigata Mortality 23 This study
Increased minerals decreased survival of greenlip abalone. Survival in diet 6, which was mineral deficient compared to the control (diet 3), was significantly greater than in diet 3. A similar response was found in prawns (Penaeus vannamei) fed excess minerals. Supplementation of an artificial diet with calcium decreased the survival of prawns and did not increase the nutritive value of the feed (Davis et al. 1993). The increase in dietary vitamin levels also significantly increased growth rates, but increasing dietary mineral levels decreased growth for diets containing the control level of vitamin (Boarder and Maguire 1998). The ionic composition of abalone haemolymph closely reflects that of the external environment (Burton 1983, Brix 1983, Somero and Bowlus 1983). However the effects of dietary vitamin or mineral concentration on osmolality in aquatic animals are unknown. Osmoconformers are known to possess some ability to regulate inorganic ions (Little 1967, Tarr 1976, Willmer 1978, Bishop et al. 1994) and this was reflected in the results obtained for potassium from abalone held at reduced salinities. Therefore, in some way abalone regulated potassium levels at lower salinities. Haemolymph potassium levels were markedly higher at all salinities in comparison to external potassium concentrations, but sodium haemolymph levels were lower in comparison to the external sodium concentration. Therefore, abalone may in fact regulate several inorganic ions. Several osmoconforming invertebrates are known that regulate potassium and sodium (Little 1967, Tarr 1976, Willmer 1978, Burton 1983, Bishop et al. 1994). Exposure to hypotonic media elicits a two-phase response in osmoconforming invertebrates. The first phase involves the influx of water from the hypotonic external environment causing cell volume to increase. The second phase involves the slow

FRDC 97/323: Environmental requirements of abalone
96
regulatory decrease of this cell volume. Potassium is known to play an integral role in controlling or limiting the initial phase of swelling (Scemes and Cassola 1995). It has been shown that short-term changes in the osmotic pressure of body fluids can cause irreparable damage to neurons. Potassium is involved in the maintenance of osmotic pressure within neuron cells, which in turn allows the nervous system to function normally under hypoosmotic stress (Prior and Pierce 1981). Willmer (1978) suggested that the pathway used to regulate solute concentrations within the neural cells is a membrane-embedded transport pathway called a Na+/K+ exchange pump. This was supported by Scemes and Cassola (1995) who considered that an ion-exchange pump, called the Na+-2Cl--K+ co-transporter, is responsible for solute balance and volume regulation within the nerves of an osmoconformer, Aplysia brasiliana (Mollusca: Gastropoda). The role of the Na+/K+ exchange pump is, therefore, to establish a net efflux of sodium and a net influx of potassium in an attempt to protect neural cells at reduced salinities. The active extrusion of sodium by nerve cells is essential, under constant conditions, for the maintenance of sodium and potassium gradients in Mytilus edulis (Willmer 1978). Thus, regulation of potassium in abalone may be a short-term stress response that allows normal behaviour to be maintained under hypoosmotic stress. An impairment of this function through the deficiency of essential vitamins could thus greatly increase mortality under salinity stress through an inability to protect the nervous system from damage. The use of blood glucose as an indicator of stress has been investigated for various aquatic species (Hattingh 1976, Spicer et al. 1990, Carefoot et al. 1993). However, investigations as to whether long-term acclimatisation to stress can reduce blood glucose levels have rarely been undertaken (Carefoot 1994). The normal response to an environmental stress involves an increase of blood glucose in the short-term (Hattingh 1976, Carefoot 1994). This could not be verified for H. laevigata , as our experiment examined longer-term stress response (96 h). An overall decrease in haemolymph glucose levels was observed. It has been suggested that lower salinities may decrease blood glucose because of increased utilisation of glucose by osmoregulatory tissues for energy (Spaargaren and Haefner 1987). This may not hold true for abalone, however, as they osmoconform rather than osmoregulate (Brix 1983). The means by which abalone maintain shell closure is through contraction of the right retractor muscle. The shape of the abalone shell means that clamping firmly to the substrate for long periods is not required for protection from predators (Barnes 1987). Thus, the period of firm attachment exhibited in the salinity stress trial was abnormally prolonged in comparison to normal subs trate adherence. The resulting increase in energy costs could have caused the reduced haemolymph glucose levels observed at lower salinities. Another explanation for the high detachment rates that were observed at 23‰ could be the method of attachment utilised by gastropod species. Limpets are believed to attach via Stefan adhesion, which is the force that resists the separation of two surfaces connected by a viscous fluid (Simkiss 1988). The strength of this adhesion is directly proportional to

FRDC 97/323: Environmental requirements of abalone
97
the viscos ity of the fluid (Grenon and Walker 1980). Adhesion between substrate and animal is achieved through the use of a very thin sheet of water; thus water flow in or out of the epithelium can cause major problems for substrate adhesion (Simkiss 1988). One of the first responses to hypotonic media is rapid swelling (Tarr 1976, Pierce and Amende 1981, Scemes and Cassola 1995), therefore, a sudden influx of water could cause changes in the viscosity of adhesive mucus and in turn increase detachment rates. An important point that arose from the use of the PVC cages was that of cage acclimatisation time. The definition of mortality used for this trial was an inability to adhere to a substrate and a lack of response to touch. A test conducted prior to the preliminary stress trial indicated that this definition could be greatly affected if animals were not given sufficient time at 35‰ to attach to the insides of the cage. The initial attempt involved the immersion of cages in reduced salinities immediately after abalone were placed into the cage. All abalone died within 45 minutes, as insufficient time was given for adhesion to the new substrate. This contrasts with the results obtained from the preliminary stress test, where several hours were given for cage acclimatisation at 35‰ salinity. Acknowledgments Thanks go to MSH for providing the facilities, the CRC and University of Tasmania for financial assistance, Deon Johns and Stephen Hindrum for sage advice and technical assistance and Graeme Dunstan and Tom Coote for advice on dietary/experimental design.
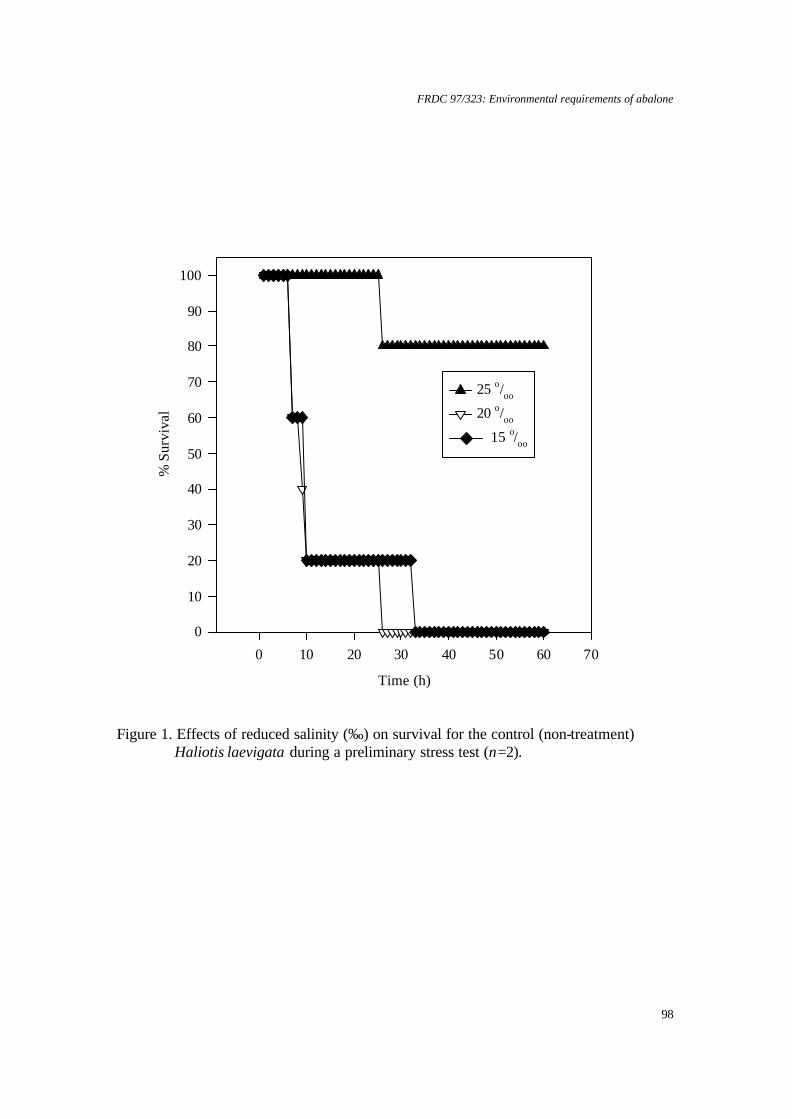
FRDC 97/323: Environmental requirements of abalone
98
Time (h)
0 10 20 30 40 50 60 70
% S
urvi
val
0
10
20
30
40
50
60
70
80
90
100
25 o/oo
20 o/oo
15 o/oo
Figure 1. Effects of reduced salinity (‰) on survival for the control (non-treatment)
Haliotis laevigata during a preliminary stress test (n=2).

FRDC 97/323: Environmental requirements of abalone
99
Diet
1 2 3 4 5 6
Surv
ival
(%)
40
50
60
70
80
90
100
*
*
0 0.3 0.6 0.3Vitamin inclusion (% Dry weight)
0.2 0.2 0.2 0Mineral inclusion (%Dry weight)
Figure 2. Effects of diet on % survival at 23‰ over 48 h for Haliotis laevigata fed dietary
treatments for 8 months (n=2). *=significantly different to diet 3 (p<0.05).

FRDC 97/323: Environmental requirements of abalone
100
Salinity
18 20 22 24 26 28 30 32 34 36 38 40
Osm
olal
ity (m
Osm
.kg-1
)
600
700
800
900
1000
1100
Haemolymph osmolalitySeawater osmolality
a
b
c
Figure 3. Effect of salinity (‰) of haemolymph osmolality in Haliotis laevigata held at
three salinities for 96 h (n=2; 21 abalone per group). Data for different dietary histories pooled. Salinities sharing a common superscript are not significantly different (p>0.05).
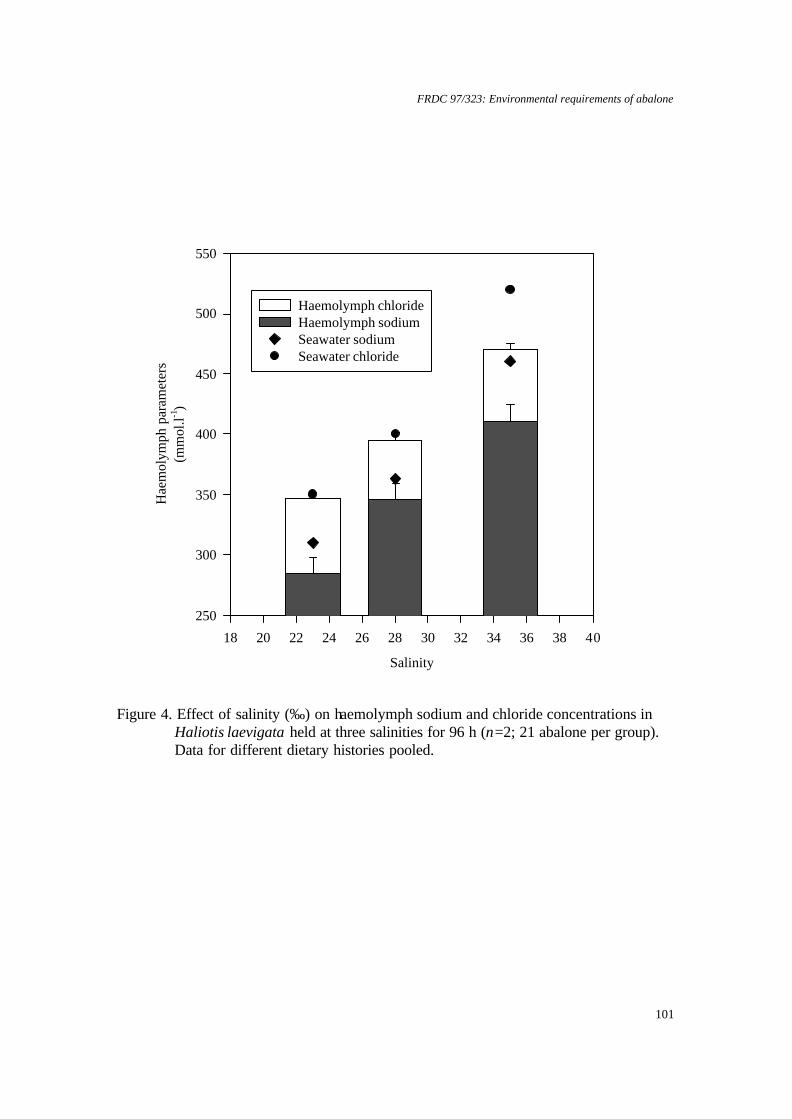
FRDC 97/323: Environmental requirements of abalone
101
Salinity
18 20 22 24 26 28 30 32 34 36 38 40
Hae
mol
ymph
par
amet
ers
(mm
ol.l-1
)
250
300
350
400
450
500
550
Haemolymph chlorideHaemolymph sodiumSeawater sodiumSeawater chloride
Figure 4. Effect of salinity (‰) on haemolymph sodium and chloride concentrations in
Haliotis laevigata held at three salinities for 96 h (n=2; 21 abalone per group). Data for different dietary histories pooled.
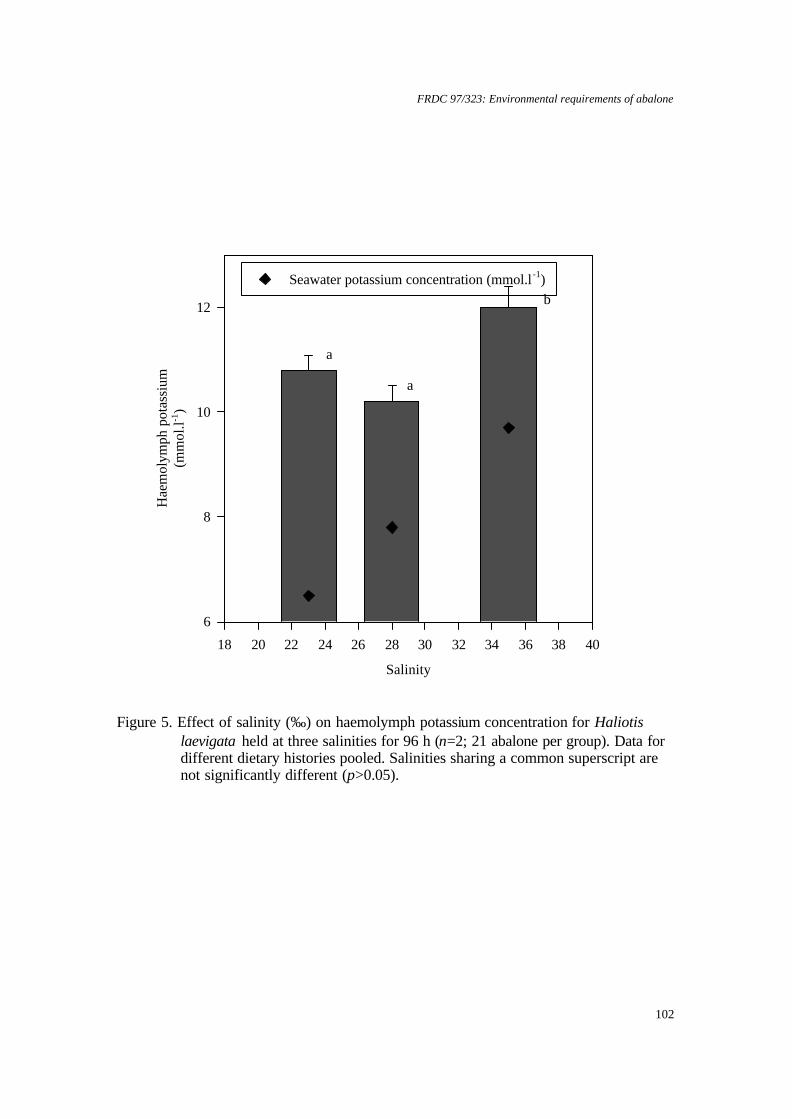
FRDC 97/323: Environmental requirements of abalone
102
a
a
b
Salinity
18 20 22 24 26 28 30 32 34 36 38 40
Hae
mol
ymph
pot
assi
um(m
mol
.l-1)
6
8
10
12
Seawater potassium concentration (mmol.l -1)
a
a
b
Figure 5. Effect of salinity (‰) on haemolymph potassium concentration for Haliotis
laevigata held at three salinities for 96 h (n=2; 21 abalone per group). Data for different dietary histories pooled. Salinities sharing a common superscript are not significantly different (p>0.05).

FRDC 97/323: Environmental requirements of abalone
103
Salinity
18 20 22 24 26 28 30 32 34 36 38 40
Hae
mol
ymph
glu
cose
(mm
ol.l-1
)
0.00
0.25
0.50
0.75
1.00
a
a
b
Figure 6. Effect of salinity (‰) on mean blood glucose concentration for Haliotis laevigata held at varying
salinity for 96 h (n=2; 21 abalone per group). Data for different dietary histories pooled. Groups sharing a common superscript are not significantly different (p >0.05).
FRDC 97/323: Environmental requirements of abalone
104
6.8: Salinity effects on respiration of greenlip abalone (Haliotis
laevigata) and blacklip abalone (Haliotis rubra).
Nontechnical summary.
The effects of salinity extremes (25 and 40 g L-1) on the oxygen consumption rates (i.e. the metabolism) and on behaviour of greenlip and blacklip abalone were assessed. Both species survive increased salinity up to 40 g L-1 for short periods. In concordance with the earlier study (experiment 7) on greenlips, it was found that blacklips also survived in salinity reduced to 25 g L-1. Hence, the range of salinity tolerance for greenlip and blacklip abalone is 25-40 g L-1, with a margin of 2 g L-1 outside of that likely to cause mortality. In the short-term, abalone respond to reduced salinity by increasing their volume of haemolymph, by as much as 25%. In high salinity, haemolymph volume may be reduced. Although there appeared to be little change in the basal rate of oxygen consumption after a change in salinity, changes in behaviour were noted and may be related to alterations in the support function of the haemolymph within pedal tissue. Animals exposed to a low salinity regime (25 g L-1) showed reduced activity for at least one day after the salinity was changed. Animals at high salinity (40 g L-1) did not show recovery of activity levels over 3 days. This suggests that feeding may be reduced. Consequently, growth rates may be decreased if the animals are exposed to altered salinity, but overall greenlip and blacklip abalone will have little trouble tolerating low salinity environments.

FRDC 97/323: Environmental requirements of abalone
105
6.8: Salinity effects on respiration of greenlip abalone (Haliotis
laevigata) and blacklip abalone (Haliotis rubra).
Steve Edwards, Deon Johns and Chris Burke Introduction Building on the short-term (acute) stress tests already conducted we examined the effect of salinity alteration on greenlip and blacklip abalone. The early physiological response (3 days) to a single abrupt change in salinity was monitored by respirometry to determine the effect on the abalone and their recovery time. Data were compiled with previous studies to provide recommendations on the appropriate salinity range for these species. Materials and Methods Respirometry The animals used were taken from the control groups of the previous trial (the effect of anaesthetic - experiment 9). For each salinity experiment, duplicate samples of 10 animals of both greenlip blacklip abalone were transferred to the respirometer, with food (for details of respirometry and food type and allocation see the anaesthetics trial: experiment 9). The animals were allowed to settle at normal (34 g L-1) salinity for 3 days. The tanks were then briefly opened for cleaning and placement of fresh food, closed again under normal salinity conditions and then subjected to a rapid alteration of salinity to either of two levels (25 or 40 g L-1). Animals were also studied at 30 g L-1, but data were lost due to an oxygen electrode failure. The animals were maintained at the altered salinity for a further 3 days while their oxygen consumption was monitored in the respirometer. Water was provided from 1100 L reservoirs that were sufficient to last one day for each batch. Salinity in each batch was adjusted by addition of filtered freshwater at appropriate rates to achieve 25 g L-1 and by addition of sea salt (Cheetham Salts Ultra-Fine) to achieve 40 g L-1. Salinity was checked using a conductivity probe and adjustments were made if necessary prior to use of the batch. Flow to the respirometer was via a header column with a float valve, which enabled a constant head to be provided regardless of the reservoir levels. This also allowed flow to continue while fresh batches of altered seawater were made each day. Reservoirs were held at 17°C and aeration was maintained with an airstone in each reservoir. Weight gain In order to establish the magnitude and speed of alterations to serum and wet cell volume as salinity was changed, a number of animals were subjected to rapid salinity change and their weight monitored. This was conducted in a small recirculating system set up in the School of Applied Science of the University of Tasmania, Launceston. Animals were transferred from Bicheno in a polystyrene shipping container and placed in pre-weighed plastic mesh (1.5 cm square) pockets that were closed using a cable tie to ensure no animals could escape during the trial. Each
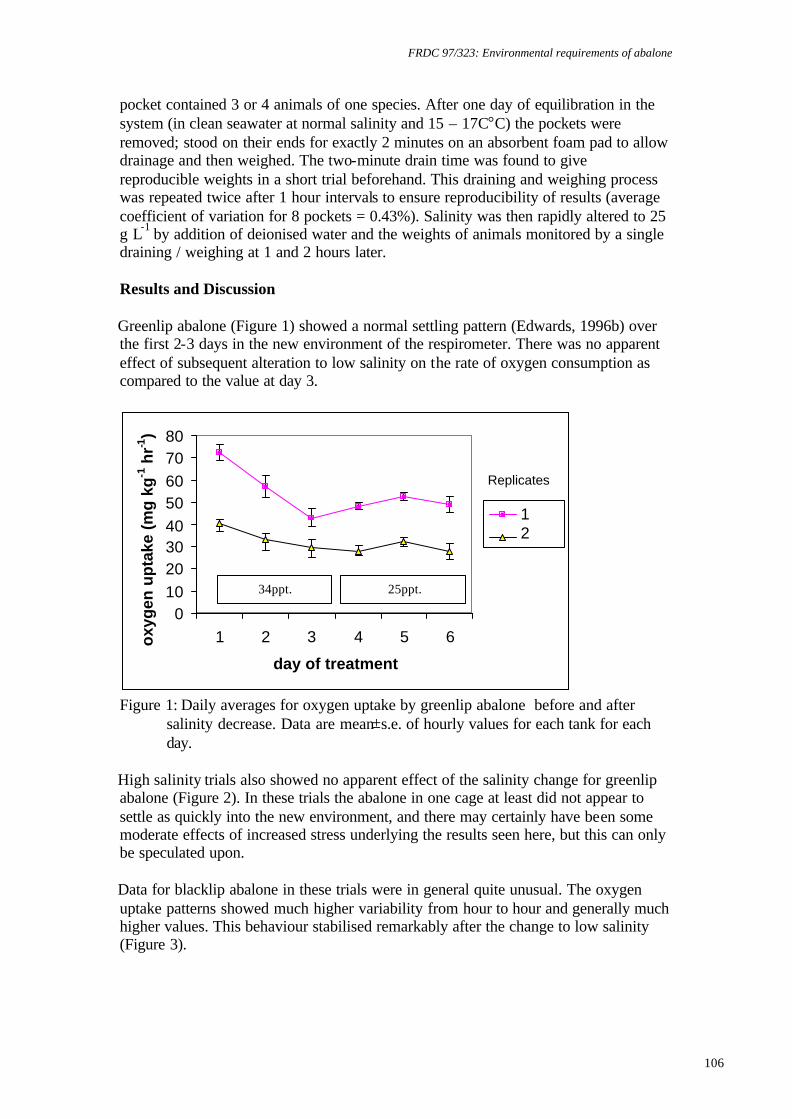
FRDC 97/323: Environmental requirements of abalone
106
pocket contained 3 or 4 animals of one species. After one day of equilibration in the system (in clean seawater at normal salinity and 15 – 17C°C) the pockets were removed; stood on their ends for exactly 2 minutes on an absorbent foam pad to allow drainage and then weighed. The two-minute drain time was found to give reproducible weights in a short trial beforehand. This draining and weighing process was repeated twice after 1 hour intervals to ensure reproducibility of results (average coefficient of variation for 8 pockets = 0.43%). Salinity was then rapidly altered to 25 g L-1 by addition of deionised water and the weights of animals monitored by a single draining / weighing at 1 and 2 hours later. Results and Discussion Greenlip abalone (Figure 1) showed a normal settling pattern (Edwards, 1996b) over the first 2-3 days in the new environment of the respirometer. There was no apparent effect of subsequent alteration to low salinity on the rate of oxygen consumption as compared to the value at day 3.
01020304050607080
1 2 3 4 5 6
day of treatment
oxy
gen
up
take
(m
g k
g-1
hr-1
)
12
Replicates
Figure 1: Daily averages for oxygen uptake by greenlip abalone before and after
salinity decrease. Data are mean±s.e. of hourly values for each tank for each day.
High salinity trials also showed no apparent effect of the salinity change for greenlip abalone (Figure 2). In these trials the abalone in one cage at least did not appear to settle as quickly into the new environment, and there may certainly have been some moderate effects of increased stress underlying the results seen here, but this can only be speculated upon. Data for blacklip abalone in these trials were in general quite unusual. The oxygen uptake patterns showed much higher variability from hour to hour and generally much higher values. This behaviour stabilised remarkably after the change to low salinity (Figure 3).
25ppt. 34ppt.

FRDC 97/323: Environmental requirements of abalone
107
0
20
40
60
80
100
1 2 3 4 5 6
day of treatment
oxyg
en u
ptak
e (m
g kg
-1 h
r-1)
12
Replicates
Figure 2: Daily averages for oxygen uptake by greenlip abalone before and after
salinity increase. Data are mean±s.e. of hourly values for each tank for each day.
020406080
100120140160
1 2 3 4 5 6
day of treatment
oxy
gen
up
take
(mg
/kg
/hr)
blackblack
Figure 3: Daily averages for oxygen uptake by blacklip abalone before and after
salinity decrease. Data are mean±s.e. of hourly values for each tank for each day.
The blacklip abalone in the high salinity trial (Figure 4) displayed extremely high results in one instance, normally indicative of animals under significant stress. Nonetheless, in this case also the animals’ behaviour stabilised after the salinity change. Although there are clear changes between day 3 and subsequent days, we suspect that these changes are not representative of normal physiological responses, but rather are behavioural. The reduction in activity shown in figure 4 is consistent with other observations at the time of data gathering. Animals subjected to the same conditions (alongside these animals – same cohort, same water) were used for serum sampling (a separate trial). These animals displayed no real effect of low salinity in terms of handling behaviour. Removal from the substrate using a spatula, foot
40ppt. 34ppt.
34ppt.
25ppt.
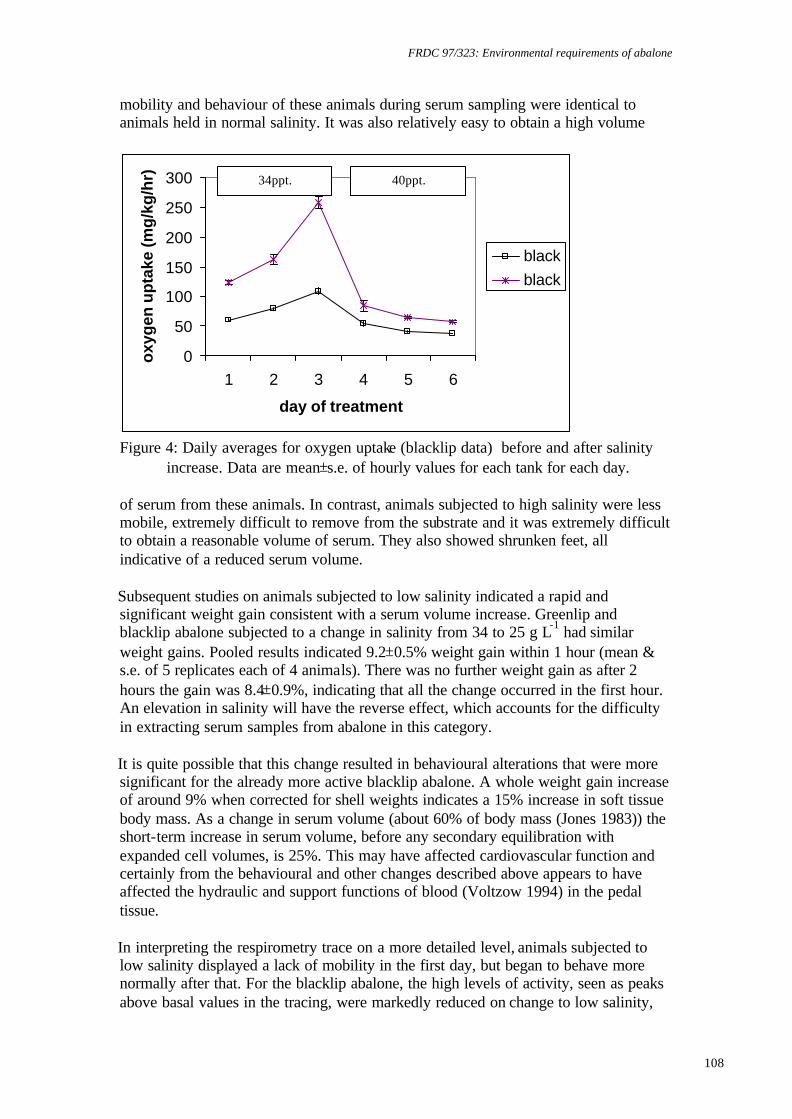
FRDC 97/323: Environmental requirements of abalone
108
mobility and behaviour of these animals during serum sampling were identical to animals held in normal salinity. It was also relatively easy to obtain a high volume
0
50
100
150
200
250
300
1 2 3 4 5 6
day of treatment
oxy
gen
up
take
(mg
/kg
/hr)
blackblack
Figure 4: Daily averages for oxygen uptake (blacklip data) before and after salinity
increase. Data are mean±s.e. of hourly values for each tank for each day. of serum from these animals. In contrast, animals subjected to high salinity were less mobile, extremely difficult to remove from the substrate and it was extremely difficult to obtain a reasonable volume of serum. They also showed shrunken feet, all indicative of a reduced serum volume. Subsequent studies on animals subjected to low salinity indicated a rapid and significant weight gain consistent with a serum volume increase. Greenlip and blacklip abalone subjected to a change in salinity from 34 to 25 g L-1 had similar weight gains. Pooled results indicated 9.2±0.5% weight gain within 1 hour (mean & s.e. of 5 replicates each of 4 animals). There was no further weight gain as after 2 hours the gain was 8.4±0.9%, indicating that all the change occurred in the first hour. An elevation in salinity will have the reverse effect, which accounts for the difficulty in extracting serum samples from abalone in this category. It is quite possible that this change resulted in behavioural alterations that were more significant for the already more active blacklip abalone. A whole weight gain increase of around 9% when corrected for shell weights indicates a 15% increase in soft tissue body mass. As a change in serum volume (about 60% of body mass (Jones 1983)) the short-term increase in serum volume, before any secondary equilibration with expanded cell volumes, is 25%. This may have affected cardiovascular function and certainly from the behavioural and other changes described above appears to have affected the hydraulic and support functions of blood (Voltzow 1994) in the pedal tissue. In interpreting the respirometry trace on a more detailed level, animals subjected to low salinity displayed a lack of mobility in the first day, but began to behave more normally after that. For the blacklip abalone, the high levels of activity, seen as peaks above basal values in the tracing, were markedly reduced on change to low salinity,
34ppt. 40ppt.

FRDC 97/323: Environmental requirements of abalone
109
but increased again after a day (Figure 5). The end of the dormant period is at 7pm, around the normal time for the evening activity cycle of moving and feeding. This one-day dormancy is similar to the response seen after mechanically removing the animals from their tanks (refer to experiment 9 on anaesthetics in this final report). This amounts to a single suppressed nighttime activity cycle before recovering on the next nighttime activity cycle. Even the greenlip abalone tracings, which display less activity, suggest they became dormant during this period. Consistent with the lack of any change for average results (as seen for greenlip abalone) - one can see little subsequent alteration to the underlying basal oxygen uptake levels seen after the first 2 days (settling period).
Figure 5: Hourly values for oxygen uptake before and after salinity decrease. Data are single points of hourly values for each tank.
Reduced mobility in animals subjected to high salinity was obvious from observations (and from the difficulty in removing animals from substrate in the anaesthetics trial). Hourly tracings also showed a marked reduction in bouts of activity for both species, but instead of recovering, the decline continued (as evidenced by the continuing decline over days 4-6 seen in figures 2 and 4). From observations of recirculating holding systems at Launceston, we know that animals can survive bouts of 40 g L-1 in the long-term, but also that significant mortality occurs at around 42 g L-1. The animals at 40 g L-1 in this trial showed no sign of recovery in activity levels over three days, but their mobility may have been enough, or recovered enough, to ensure feeding and survival in the longer term. At the completion of the trial all animals were returned to normal housing systems and suffered no additional mortality (noted over the next month) as a result of their inclusion in the trial.
Active
Salinity trial - 25ppt
-100
-50
0
50
100
150
200
12:0
2
0:02
12:0
2
0:02
12:0
2
0:02
12:0
2
0:02
12:0
2
0:02
12:0
2
0:02
12:0
2
0:02
oxy
gen
up
take
(m
g/h
r/kg
)
greengreenblackblack
25 ppt.
dormant
FRDC 97/323: Environmental requirements of abalone
110
In the earlier report on salinity behaviour (section 6.7) it was noted that survival was variable at 23 g L-1 depending upon dietary history. I had full survival at 25 g L-1 in this study, a difference of only 2 g L-1. This margin is identical to the upper level margin between 40 and 42 g L-1 mentioned above from less rigorous observations. This suggests that, like temperature sensitivity (Gilroy & Edwards, 1998; Hahn, 1989) the margin between survival and death can be very small for these animals. Nonetheless their range of full survival is 25-40 g L-1 and, clearly shown in this study, their ability to adapt is far greater at reduced rather than elevated salinity. This is hardly a surprise given their normal habitat. Conclusions The previous study on salinity (section 6.7) indicated that greenlip abalone would survive reduced salinity well and had clearly defined physiological mechanisms for doing so. Now it has been shown that greenlips also survive increased salinity up to 40 g L-1 for short periods and that blacklips have a similar salinity tolerance. From these results and other observations discussed above we can say: • The range of salinity tolerance for both species is 25-40 g L-1 with a margin of 2 g
L-1 outside of that causing mortality. • Serum characteristics are clearly altered by reduced salinity and most likely by
increased salinity also. Indicators are that serum volume under reduced salinity may be increased as much as 25% in the short term, with equilibration of the concomitant whole body weight increase (9.2±0.5%) occurring within 1 hour. Serum volume appears to be decreased at high salinity.
• There is little underlying change in basal oxygen usage levels, but significant
behavioural changes that may affect overall oxygen consumption. Both high and low salinity appear to reduce activity. Animals in low salinity exhibit partial recovery of activity levels after one day in a manner similar to other stress responses. Animals at high salinity (40 g L-1) did not show recovery of activity levels over 3 days.
• Overall these results suggest that greenlip and blacklip abalone will have little
trouble tolerating low salinity environments down to 25 g L-1 for short periods. However, the effects on growth rate during extended exposure have yet to be assessed.
Acknowledgements Funding was provided by the Fisheries Research Development Council and the Australian Research Council's small Grants scheme.

FRDC 97/323: Environmental requirements of abalone
111
6.9: Recovery and growth effects of anaesthetics on greenlip and blacklip abalone.
Nontechnical summary It is common practice that abalone are removed from tanks at sometime during their culture. This may be done to transfer them to other tanks, to measure them or for tank maintenance. Abalone can be removed mechanically with a spatula, by temperature shock or by application of an anaesthetic. The latter two agents induce abalone to detach from the substrate. However, little is known about the long-term effects of removal on the growth or health of abalone. This experiment examined the effects of benzocaine, 2-phenoxyethanol, ethanol, clove oil, Aqui-S, capsaicin (Tabasco sauce), nitrous oxide, potassium chloride and Saffan on greenlip and blacklip abalone. The impact on growth over 6 weeks after treatment as well as the effect on the rate of respiration over 1 week post treatment were studied. All treatments affected the growth of animals. Greenlip abalone treated with an anaesthetic had growth rates in the range of 48 to 83 µm d-1, whereas control animals had a growth rate of 116 µm d-1. Blacklip abalone treated with an anaesthetic had growth rates in the range of 1.4 to 12 µm d-1, whereas control animals had a growth rate of 24 µm d-1. Therefore, the best method of husbandry would use a system that minimises animal detachment from tank surfaces prior to harvest, for example by adding movable refuges to tanks. The chemical agents that had the least effect on respiration in the short-term were normal metabolites - ethanol and KCl. However, benzocaine had the least effect on growth, especially in relation to weight gain.
FRDC 97/323: Environmental requirements of abalone
112
6.9: Recovery and growth effects of anaesthetics on greenlip and
blacklip abalone. Steve Edwards, Deon Johns and Chris Burke Introduction Anaesthesia of abalone is required for processes such as sorting and grading stocks, for measurement of animals to track growth performance and health, for removal of animals for tank and for system maintenance. As well as the obvious functional requirements of an anaesthetic, concern has recently been expressed over the long-term growth effects of this potentially stressful event. Anaesthesia has been accomplished using chemical anaesthetics and / or physiological modification involving temperature. Earlier studies such as those of Prince and Ford (1985) had the specific purpose of functional anaesthesia such as for population sampling, surgical operations and weighing and measuring in short term experiments. Hahn (1989) has reviewed these. Much of this review is of limited use now due to alterations in workplace practices, including the acknowledged harmful effects of the agents used. More detailed physiological studies such as White et al. (1996) have built on these, but have still not studied long-term effects. The longer-term effect on growth was studied here. Commonly, smaller numbers of animals are transferred by mechanical removal (sliding a spatula or similar object under the foot) and this has been included in the study, even though it is unlikely to become part of mainstream abalone culture in this country. Additional restrictions due to limitations in space, meant a number of agents were not studied. These included: • Temperature shock, the use and performance of which is highly variable depending on location,
season, species and farmer's preferences. • Magnesium (as sulphate or chloride) is also in use in other countries and now in Australia. It was
not studied in this experiment due to the large mass required for some production systems. Agricultural grade magnesium sulphate has been used to reduce costs, but there are risks associated with these low purity grades, proven in recent times to be of concern in at least one instance. This is most likely because of the less well known components present in the preparation.
Behavioural perturbations are also of interest in abalone farming, but here the relevance of any information gained depends on location, season, species, and on tank design, water flow rates and other water conditions all of which may be site specific. Covering all these variables was well beyond the scope of the trial. However, we were able to monitor short-term recovery in terms of behaviour and underlying oxygen uptake. Oxygen uptake is generally directly related to metabolic rate and has been widely used to help indicate the health of animals and their overall energy expenditure or activity levels (e.g. Innes and Houlihan, 1985). Oxygen uptake indicates an animal's capacity for growth (expressed as the balance between energy uptake, as food, and energy expenditure). It also indicates metabolic adaptation to the variety of environments encountered by both terrestrial and aquatic organisms (see for example, Costa 1988, Houlihan and Allan 1982,
FRDC 97/323: Environmental requirements of abalone
113
Jobling 1981, Storey and Storey 1990). Measurement of oxygen uptake is a critical factor in assessments of stress in fishes (Beitinger and McAuley 1990). Our aim was to determine the most appropriate anaesthetic for farm use. We focussed on three sections (in bold, described below) to select a combination of minimal growth disturbance (Growth trial), fast knock down (preliminary screen) and fast recovery (physiological recovery). Materials and Methods
Experimental design • Experiments were conducted from November 1998 to January 1999 at Marine Shellfish
Hatcheries (MSH) at Bicheno, on the east coast of Tasmania. Animals were housed inside in heavily shaded tanks with water temperature held at 17C (Gilroy and Edwards 1998b) for the duration of the trial.
• Two series of tanks were used, one for greenlip, another for blacklip abalone. Both tank series were of the same type and held in the same room for the duration of the trial and preconditioning period.
• Animals were initially transferred to the tanks using mechanical removal. Blacklip abalone were kindly loaned by Tasmanian Abalone Farms and transferred in one batch of two standard polystyrene shipping containers from this site by road (1 hour) to MSH and weighed and measured prior to placement in the experimental tanks. Greenlip abalone were part of standard stock at the MSH site and were transferred to the experimental tanks in several batches. As far as possible we attempted to ensure all animals were from a single cohort. Additionally, as we had little control over the history of the animals we ensured that the animals provided in each batch were mixed into individual experimental tanks.
• Tanks were round (80 cm diam.) fibreglass, with a sloping base and central outlet, tangential inlet, white gel coat finish.
• About 80 juvenile abalone were placed in each tank (blacklip abalone 41.93±0.13mm, 11.32±0.1g, n=960: greenlip abalone 39.71±0.2mm, 8.14±0.11g, n=960) and fed on FRDC diet to excess twice weekly at 1800 hrs.
Animals were held for three to four weeks under these conditions prior to any treatment. A subset of animals that had been held under the same conditions was kept for prescreening trials to determine the efficacy of candidate treatments. Preliminary screen Benzocaine, Aqui-s and its parent clove oil, 2-phenoxyethanol, ethanol, capsaicin, nitrous oxide, potassium chloride and a steroidal anaesthetic (Saffan) were all trialed. Nitrous oxide had no apparent effect even in gas-saturated seawater. Saffan had effect only at levels where it was clear that the surfactant present in the proprietary preparation was affecting the animals' mucus secretion and coating. Of the remaining anaesthetics, each was applied to 5 animals at two or three dose levels (fresh animals at each dose level). Ethanol, potassium chloride and 2-phenoxyethanol were dispersed directly into seawater prior to immersing animals. Freshly prepared stock solutions of Benzocaine (10% in ethanol), Aqui-s (10% in water) and clove oil (20% in ethanol) were prepared for use each day. Capsaicin in its pure form was too expensive for the trial and we used instead Tabasco sauce that had been pre-purified by low speed centrifugation. The supernatant is expected

FRDC 97/323: Environmental requirements of abalone
114
(Edwards et al. 1990) to contain high levels of capsaicin, a topical anaesthetic agent which also affects metabolic rate via the nervous system (Edwards et al., 1992). Stressed animals of many species do not respond well to anaesthetics and all animals were transferred to metabolic cages three days prior to the preliminary screen (Edwards, 1996). This enabled the animals to be shifted without detaching them from the substrate by moving the entire mesh cage - the response was then assumed to be more representative of animals that would be physically undisturbed in normal farm processes. Preliminary screening was conducted over two days on greenlips only (due to animal availability). Anaesthetic mixtures were made up in fresh seawater in plastic buckets. Behaviour was observed prior to transferring to the buckets containing anaesthetic and continued until all animals were anaesthetised, or 1 hour had elapsed (whichever occurred sooner). Anaesthetised animals were then returned to normal seawater within clear polycarbonate chambers, with some upside down to check for righting response. Recovery time was monitored by viewing behaviour from below the animals.
Growth effects trials Greenlip and blacklip abalone were treated separately in duplicate tanks each containing 80 animals (34 g L-1, 100% DO, 17°C). Abalone were fully anaesthetised, the dose being previously determined from the screening trials. Water flow to the tank was stopped and the anaesthetic agent added with rapid mixing either from a stock solution (as above) or after first dispersing in a little seawater. Once detached from the tank surface, animals were transferred to clean seawater (on a mesh surface to prevent attachment) in a 5 L bucket for weighing and measuring. All animals were weighed and measured after being anaesthetised. A sample of 10 animals from each anaesthetised tank was transferred to a single chamber of the respirometer and monitored over 3 days (details below). These animals were not returned to the growth trial tanks. Animals from control tanks were not disturbed at all during the treatment period. Tanks were emptied, rinsed to remove anaesthetic traces and refilled with clean seawater. The animals were then returned as quickly as possible to their tank for a growth trial period of a further six weeks. Growth was determined from length and weight measurements of all animals after the trial compared to measurements on the day of treatment, thus giving a growth rate for the six-week period post treatment. Data for controls were calculated from the day they were first placed into the preconditioning tanks and corrected for the preconditioning period using average data from all other tanks for that species. Duplicate tanks for each treatment for each species were treated as replicates and analysed by ANOVA and Tukey’s HSD on SPSS 9.0 for Windows software. Only one set of results for final measures of clove oil-treated animals was available for greenlip abalone and this limited the analysis of this treatment.
Physiological recovery trials The respirometer system has been described elsewhere (Harris et al. 1997, 1998b). It included 5 elliptical perspex chambers (of 2.31 L) normally set up with 2 chambers for each treatment and one chamber as a control (no animals). Oceanic water flowed continuously from each reservoir and entered each chamber near the base. Flow was controlled by a rotameter and was measured manually twice daily. Flow exiting the top of each chamber was diverted by solenoids either to waste (50 min. each hour) or to a flow cell (containing a WTW oxygen electrode) for 10 min. per

FRDC 97/323: Environmental requirements of abalone
115
hour for data recording. Ten minutes in each hour was used to automatically calibrate the electrode in fully aerated seawater. The overall design of the system is similar to that used by McLean and Tobin (1987) for terrestrial organisms. Data from the oxygen electrode were collected by a datalogger every second, averaged every minute and downloaded to a computer at the end of each experiment. The data logger also stored water temperature data from thermocouples placed throughout the system. Final mV outputs were converted to the data seen here using a LOTUS spreadsheet where drift between calibrations was assumed to be linear (for both flow and oxygen). The amount of oxygen used in each tank was calculated as the percentage of the full saturation value using mV output. Values for tanks containing animals were corrected for the oxygen uptake of the control tank and the final values divided by the wet weight of animals to provide mg kg-1h-1. Results and Discussion Preliminary screen Animals were successfully removed from the tanks within 20 minutes of using ethanol (3%), 2-phenoxyethanol (1mL L-1), benzocaine (100 mg L-1), clove oil (0.5-1.5 mL L-1), KCl (10 g L-1) and capsaicin (Tabasco 10 mL L-1). Aqui-S (5 – 500 ppm) failed to result in reliable removal of animals from substrate even though animals showed clear signs of sedation. In most cases, animals recovered physical mobility and adherence to substrate fairly rapidly. This was not the case for clove oil. The trials were conducted during the day so these animals were dormant at the start of each session. For ease of analysis I have separated the agents used into 3 categories based on their expected pharmacological properties.
Group 1: Alkoxy – phenyl derivatives. While Aqui-S shares the same active ingredient as clove oil it is of synthetic origin and does not contain what are likely to be thousands of other compounds extracted from the plant material in the clove oil extract. The active ingredient also shares structural similarities with 2-phenoxyethanol and animal behaviour can be grouped accordingly. Both 2-phenoxyethanol and Aqui-S caused extreme relaxation of all tentacles in the animals with main (head) tentacles (MT), auxiliary or peripheral tentacles (AT) and tentacles extending out through the gill pores (GT) all fully extended and flaccid as a result of treatment. Aqui-S also produced early relaxation of mouthparts, which became visible below the animals (normally withdrawn during the day). The mantle also became flaccid and extended. 2-phenoxyethanol was apparently a slight irritant, resulting in some animals rising and twisting on their foot with eventual detachment. This torsion response was also noted for animals under stress just prior to detachment in temperature trials (Gilroy and Edwards 1998). Aqui-S showed few of these signs, which only appeared prominently at higher doses (50 ppm and greater). It seems that Aqui-S is an excellent sedative, giving extreme relaxation of all tentacles and mantle at lower doses without any torsion appearing as evidence of stress. Although one may expect similar responses for clove oil, there is in fact a clear and notable irritability of the clove oil extracts (to humans) compared with the other two compounds in this group. This irritability may have extended to the abalone. Tentacles (MT and AT) took much longer to extend and GT did not extend at all. Relaxation of the mouthparts also occurred only at, or close to, the time of detachment from the substrate. By the time of detachment, the foot and mantle adopted a
FRDC 97/323: Environmental requirements of abalone
116
wavy appearance and lost their smooth feel. The water became quite cloudy at this time indicative of mucus loss from the foot. Subsequent behaviour during recovery time showed strands of excess mucus being produced by the animals. It seems likely, therefore, that clove oil also exhibited some surfactant effect. Animals from the most rapidly anaesthetised clove oil group suffered the highest mortality in the screening trials.
Group 2: Phenyl/benzyl amines/amides and esters Benzocaine and capsaicin also share similarities in structure, with nitrogen, a carbonyl group and an ether- or ester-linked oxygen in close proximity to a benzene ring in these relatively small molecular weight structures. Capsaicin (Tabasco) also carries a methoxybenzene moiety similar to the above group of structures. Animals subjected to benzocaine displayed various amounts of torsion. Tentacles, mantles or mouthparts did not extend. Animals subjected to Tabasco at 20 mL L-1 lost adherence to the substrate within 1 minute and displayed relaxation of MT. At half that dose they exhibited torsion in varying degrees and released from substrate within 6 minutes, with feet appearing to have shrunk. Whereas abalone anaesthetised with these agents released quickly from the substrate, they had the most prolonged recovery period of all agents used. No mortality resulted, however.
Group 3: Normal processes (knifing-off) and metabolites (ethanol and KCl) Both the chemical agents are quick and clean. They can be expected to display short clearance times, primarily because of their high solubility, and are both available in highly pure form. Additionally, and perhaps far more importantly, each is a normal component of metabolism, either circulating in serum (KCl) or as a byproduct of metabolic processes (ethanol). In 3% ethanol all animals detached from substrate within 8 minutes. Recovery was equally quick, with animals exhibiting coherent AT movement very early in the recovery phase and relaxed and extended MT and AT after they completed righting and attachment. Ethanol at 0.3% and 1% was ineffective. KCl is a muscle-contracting agent in-vitro and as expected it produced uncontrolled contractions of the foot in these animals. At 10 g L-1 all animals detached within 10 minutes and righted and reattached within 5 minutes of being returned to clean seawater. Again, as might be expected from a contractile agent, the AT and mouthparts remained withdrawn. At lower doses of KCl (1 and 3 g L-
1) all tentacles were withdrawn, however, consistent detachment was not achieved, even over longer time periods up to 1 hour. A similar concentration of NaCl used on another batch of animals was ineffective, confirming that the effect of KCl was not due to osmotic shock. Physiological recovery trials Respirometry trials were conducted on samples of animals anaesthetised for the growth trial and on others (from the same cohorts) for agents that could not be accommodated in the full growth trial. Apart from first hour suppression (ethanol) or stimulation (clove oil and Aqui-S) of oxygen uptake, most agents did not cause any short term disturbances. Rather, the animals had shifted normal patterns (high or low) of oxygen uptake that settled to normal values for animals of this size range (~55 mg O2 kg-1 h-1) over 3-5 days (see Figure 1).
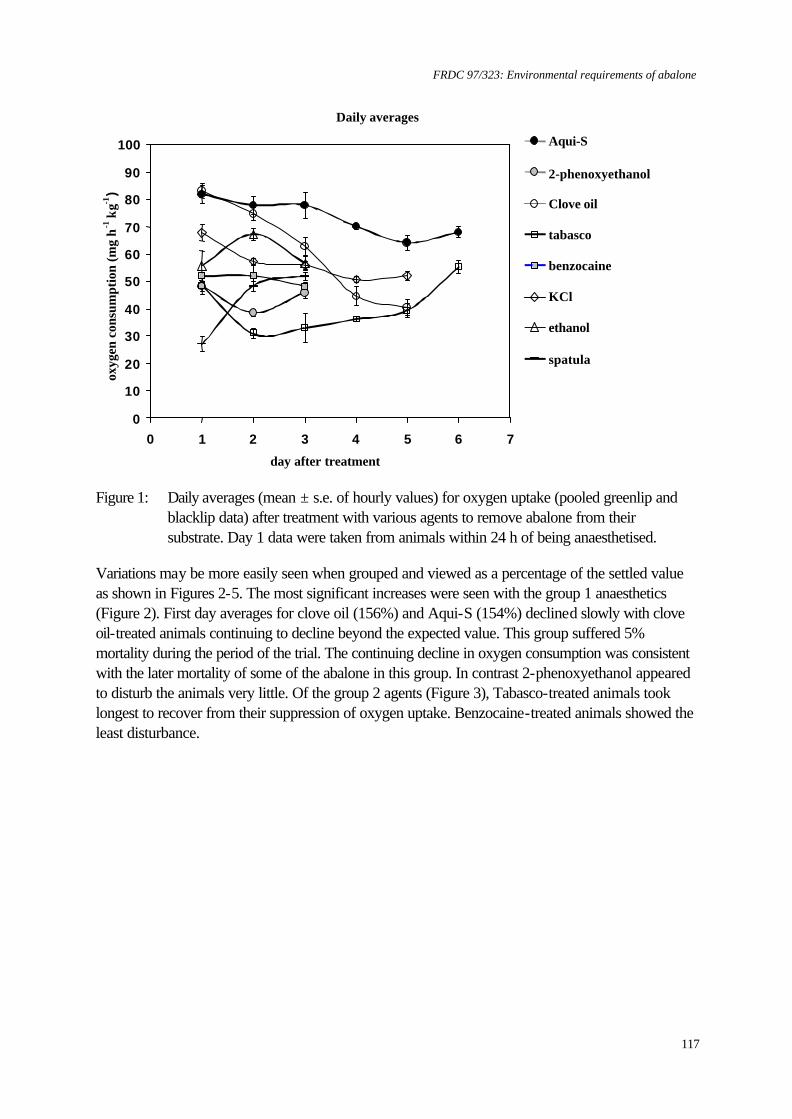
FRDC 97/323: Environmental requirements of abalone
117
Daily averages
0
10
20
30
40
50
60
70
80
90
100
0 1 2 3 4 5 6 7
day after treatment
oxyg
en c
onsu
mpt
ion
(mg
h-1
kg-1
)
Aqui-S
2-phenoxyethanol
Clove oil
tabasco
benzocaine
KCl
ethanol
spatula
Figure 1: Daily averages (mean ± s.e. of hourly values) for oxygen uptake (pooled greenlip and
blacklip data) after treatment with various agents to remove abalone from their substrate. Day 1 data were taken from animals within 24 h of being anaesthetised.
Variations may be more easily seen when grouped and viewed as a percentage of the settled value as shown in Figures 2-5. The most significant increases were seen with the group 1 anaesthetics (Figure 2). First day averages for clove oil (156%) and Aqui-S (154%) declined slowly with clove oil-treated animals continuing to decline beyond the expected value. This group suffered 5% mortality during the period of the trial. The continuing decline in oxygen consumption was consistent with the later mortality of some of the abalone in this group. In contrast 2-phenoxyethanol appeared to disturb the animals very little. Of the group 2 agents (Figure 3), Tabasco-treated animals took longest to recover from their suppression of oxygen uptake. Benzocaine-treated animals showed the least disturbance.

FRDC 97/323: Environmental requirements of abalone
118
Daily averages
0%
20%
40%
60%
80%
100%
120%
140%
160%
180%
0 1 2 3 4 5 6 7day after treatment
oxyg
en c
onsu
mpt
ion
(% o
f set
tled)
Aqui-S
2-phenoxyethanol
clove oil
Figure 2: Percentage of normal oxygen uptake (pooled greenlip and blacklip data) after treatment
with group 1 agents (means only, for clarity).
Daily averages
0%
20%
40%
60%
80%
100%
120%
140%
160%
180%
0 1 2 3 4 5 6 7day after treatment
oxyg
en c
onsu
mpt
ion
(% o
f set
tled)
tabasco
benzocaine
Figure 3: Percentage of normal oxygen uptake (pooled greenlip and blacklip data) after treatment
with group 2 agents.

FRDC 97/323: Environmental requirements of abalone
119
Group 3 agents all showed very rapid recoveries (Figure 4). KCl showed the greatest first day increase, although still relatively small (127%). Mechanical removal gave a first-day suppression of 50% of oxygen usage. This followed an interesting pattern, showing an apparent unusual dormancy of the animals during their normal nighttime activity period immediately following removal, continuing normal values during the subsequent daytime dormant period and returning to normal activity with the second evening activity cycle. As described above, rapid clearance of the chemical agents in this group was expected so that rapid recoveries and low levels of effect are no surprise. Certainly from the above it would appear that 2-phenoxyethanol, benzocaine and all the group 3 agents were good candidates for the long-term growth trial.
Daily averages
0%
20%
40%
60%
80%
100%
120%
140%
160%
180%
0 1 2 3 4 5 6 7day after treatment
oxyg
en c
onsu
mpt
ion
(% o
f set
tled)
KCl
ethanol
spatula
Figure 4: Percentage of normal oxygen uptake (pooled greenlip and blacklip data) after treatment
with ungrouped agents.
Growth effects trials Significantly more time was needed for this part of the trial, and only a limited number of agents could be assessed. Choices were made consistent with the preliminary screen, rather than the respirometry and it was heartening to note consistency between them. The only choice that was not consistent with the above paragraph was the substitution of KCl by clove oil, a choice made in large part because of the unorthodox nature of the use of KCl and the very high degree of interest from industry and researchers in clove oil. Use of KCl also suffers, on first glance, from the same mass and cost limitations as magnesium sulphate and as such may be impractical in some production systems (but certainly not all).
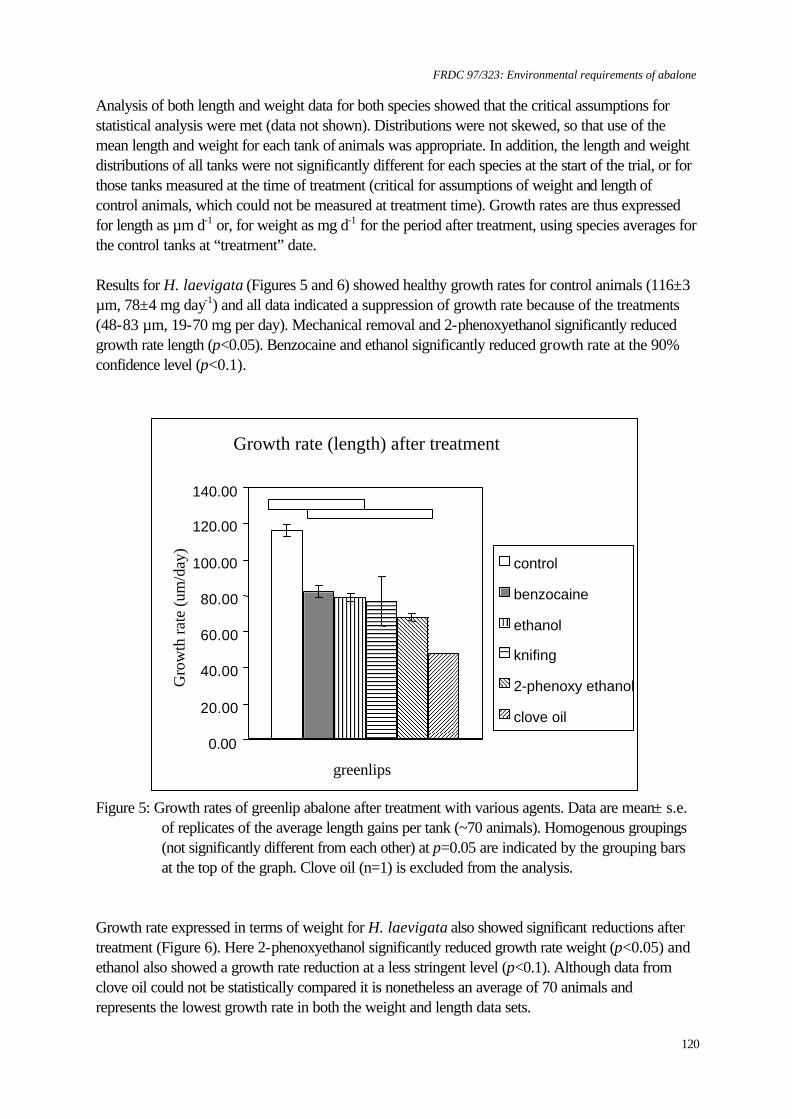
FRDC 97/323: Environmental requirements of abalone
120
Analysis of both length and weight data for both species showed that the critical assumptions for statistical analysis were met (data not shown). Distributions were not skewed, so that use of the mean length and weight for each tank of animals was appropriate. In addition, the length and weight distributions of all tanks were not significantly different for each species at the start of the trial, or for those tanks measured at the time of treatment (critical for assumptions of weight and length of control animals, which could not be measured at treatment time). Growth rates are thus expressed for length as µm d-1 or, for weight as mg d-1 for the period after treatment, using species averages for the control tanks at “treatment” date. Results for H. laevigata (Figures 5 and 6) showed healthy growth rates for control animals (116±3 µm, 78±4 mg day-1) and all data indicated a suppression of growth rate because of the treatments (48-83 µm, 19-70 mg per day). Mechanical removal and 2-phenoxyethanol significantly reduced growth rate length (p<0.05). Benzocaine and ethanol significantly reduced growth rate at the 90% confidence level (p<0.1).
Growth rate (length) after treatment
0.00
20.00
40.00
60.00
80.00
100.00
120.00
140.00
greenlips
Gro
wth
rate
(um
/day
)
control
benzocaine
ethanol
knifing
2-phenoxy ethanol
clove oil
Figure 5: Growth rates of greenlip abalone after treatment with various agents. Data are mean± s.e.
of replicates of the average length gains per tank (~70 animals). Homogenous groupings (not significantly different from each other) at p=0.05 are indicated by the grouping bars at the top of the graph. Clove oil (n=1) is excluded from the analysis.
Growth rate expressed in terms of weight for H. laevigata also showed significant reductions after treatment (Figure 6). Here 2-phenoxyethanol significantly reduced growth rate weight (p<0.05) and ethanol also showed a growth rate reduction at a less stringent level (p<0.1). Although data from clove oil could not be statistically compared it is nonetheless an average of 70 animals and represents the lowest growth rate in both the weight and length data sets.

FRDC 97/323: Environmental requirements of abalone
121
Growth rate (weight) after treatment
0.00
10.00
20.00
30.00
40.00
50.00
60.00
70.00
80.00
90.00
greenlips
Gro
wth
rate
(mg/
day) control
benzocaine
knifing
ethanol
2-phenoxy ethanol
clove oil
Figure 6: Growth rates of greenlip abalone after treatment with various agents. Data are mean± s.e.
of replicates of the average weight gains per tank (~70 animals). Homogenous groupings (not significantly different from each other) at p=0.05 are indicated by the grouping bars at the top of the graph. Clove oil (n=1) is excluded from the analysis.
For H. rubra control growth rates were much lower (24±1 µm d-1) and weight gain was erratic (34±10 mg d-1). Nonetheless lower growth rates (length 1.4-12.1 µm d-1) were obtained for all treatments (Figure 7), but only the growth rate for ethanol-treated animals approached significant difference from control animals (p=0.066). All but one treatment also had lower weight gain than control animals (Figure 8). Animals anaesthetised with benzocaine grew more than the controls, but the increase was not significant. Animals subjected to clove oil had the lowest weight gain. Clove oil-treated animals were significantly different from control (p<0.05) as were ethanol-treated animals at a less stringent level (p<0.1). Growth after ethanol was significantly different from the growth of benzocaine treated animals (p<0.05).

FRDC 97/323: Environmental requirements of abalone
122
Growth rate (length) after treatment
-10.00
-5.00
0.00
5.00
10.00
15.00
20.00
25.00
30.00
blacklips
Gro
wth
rat
e (u
m/d
ay)
controlethanol
2-phenoxy ethanol
benzocaine
clove oil
knifing
Figure 7: Growth rates of blacklip abalone after treatment with various agents. Data are mean ±
s.e. of the length gains per tank (~70 animals). Homogenous groupings at P=0.05 are indicated by the grouping bars at the top of the graph.
Growth rate (weight) after treatment
-10.00
0.00
10.00
20.00
30.00
40.00
50.00
blacklips
Gro
wth
rate
(mg/
day) benzocaine
control
knifing
2-phenoxy ethanol
ethanol
clove oil
Figure 8: Growth rates of blacklip abalone after treatment with various agents. Data are mean ±
s.e. of the weight gains per tank (~70 animals). Homogenous groupings at P=0.05 are indicated by the grouping bars at the top of the graph.
FRDC 97/323: Environmental requirements of abalone
123
The poor growth exhibited by H. rubra deserves separate consideration. It may have resulted from an inadequate diet, as animals from the same cohort, but grown in outside tanks, were about 30 mm in length, compared to 10 mm for the experimental animals grown inside. We speculate that the darker environment of the experimental animals restricted diatom growth in these tanks and that, as they grow in shallower water than greenlip abalone, blacklip abalone require a diatom component in their diets. Other tank environment factors may also have affected growth (M. Cropp, personal communication). Conclusions Anaesthetic effects on behaviour and recovery can be reasonably grouped on the basis of structure and expected pharmacology. Based on behaviour and respirometry studies, the fastest short-term recovery follows agents that constitute normal metabolites and/or events. This, however, is not necessarily an indication of long-term growth rate effects. Removal of animals from their housing tanks does affect growth rate. Clove oil, ethanol, 2-phenoxyethanol and mechanical removal all significantly reduced growth at p<0.05 in at least one aspect of the trial (i.e. either length or weight for greenlip or blacklip abalone). All agents reduced growth in one aspect or another of the trial at p<0.1 with the most dramatic effects on length of animals. Overall weight gain appeared to be more robust than gain in length, with benzocaine especially affecting this little if at all. It is notable that benzocaine is the anaesthetic with which these animals are familiar and that may be a confounding, but unavoidable factor in this trial. The difference in effect between the parameters of length and weight may point to underlying behavioural alterations in the populations of animals in each tank, rather than, or in concert with, direct physiological effects, and these data will be analysed further. The best husbandry option appears to be to move animals as little as possible, if at all, in any way prior to harvest. From our data it appears that the preferred anaesthetic when considering the effect on growth is Benzocaine. Removing animals at harvest would best be done with ethanol or potassium chloride. For shipping animals, capsaicin may be best because it lowered the metabolic rate of the abalone the most. Acknowledgements Funding was provided by the Fisheries Research Development Corporation and the Australian Research Council small grants scheme.

FRDC 97/323: Environmental requirements of abalone
124
7: GENERAL DISCUSSION Australian abalone, like all organisms, have a natural environmental range determined by their sensitivity to physical, chemical and biological factors. For abalone, water flow, water quality and photoperiod are likely to be significant factors that affect their distribution. Part of the success of all organisms in their habitat is their ability to grow and reproduce. Clearly, anything that adversely affects either of these can potentially cause a reduction or loss of a population. This context is of course, applicable to aquaculture, which seeks to increase the rate and reliability of production of the cultured species in order to maximise profit. The two issues of production, rate and reliability, may not have the same environmental requirements, so that a compromise may be required. To determine the optimum commercial system for an organism to be grown in necessitates a strong understanding of the biology of the organism, and in particular of the effect of environmental variables on the growth and health of the organism. As commercial aquaculture seeks to increase the population density in artificial environments, environmental problems are potentially exacerbated. The research described in this report has expanded our knowledge of how two species of abalone, Haliotis laevigata and H. rubra, respond to water quality variables. Thus, it provides data to support the rational development of husbandry systems suitable for large-scale culture of abalone. Previous research has looked at some water quality variables in relation to culture of H. laevigata: nitrite (Harris et al. 1997, 1998a), ammonia (Harris et al. 1998a,b) and low dissolved oxygen (Harris et al. 1999a). Typically, these studies have examined the effect of one variable in otherwise optimal water quality. Although this is of interest, it is far more likely that certain variables will in fact interact, and change together. Thus, it was pertinent to determine the effect of these variables together. Studies examining the interaction of temperature and dissolved oxygen, of low DO and elevated free ammonia nitrogen (FAN) were carried out in our project. Additionally, single factor experiments on the effects of salinity, nitrite, pH and anaesthesia were also carried out to expand the database of variables. Because a second species of abalone is cultivated in Australia, the trials included H. rubra wherever possible. Throughout this and an earlier project, methods were developed that enabled us to examine not only acute effects, such as mortality, but also more subtle short-term effects on metabolic rates and on the anatomy and physiology of abalone, as well as long-term growth effects. Consequently, a bioassay tank system and an experimental growout system were developed as reliable and sensitive experimental techniques for evaluation of growth, health and metabolic effects of water quality variables on abalone. Respirometry was also developed in whole-tank systems that were used in growth studies. Environmental variables discussed in this report are: nitrite, ammonia, dissolved oxygen, pH, salinity, temperature, provision of shelters, the effective surface area of the tank and stocking density. Additionally, the effects of anaesthetics on the short-term metabolism and on growth rates are also considered. From our work the ranges of values for these variables to give the best production of abalone are summarised in tables 1 to 4. Note that, in these tables the term significant difference refers to a statistical difference. This is not
FRDC 97/323: Environmental requirements of abalone
125
necessarily the same as saying a biologically significant effect does, or does not, exist. In some experimental treatments growth was reduced, but, because the data were highly variable, it was not possible to detect a statistically significant effect. The variability in data has occurred because populations are composed of individual animals that can show a wide range of responses to environmental variables. Individual variety in response may also partly explain why some experimental treatments with poorer quality water gave better growth rates than did treatments with better quality water. For example, Harris et al. (1999a) found slower growth rates and higher mortality in greenlip abalone held at 81% DO saturation compared to 73% saturation. Biological systems are inherently complex and so drawing conclusions on the appropriateness of a particular treatment can be difficult. These variables were chosen because of their relevance to abalone health. In the wild, abalone typically inhabit fully marine waters, thus they are likely to be exposed to good water quality. This could be defined as:
• Constant salinity. • Constant or only slowly varying temperature. • Constant or only slowly varying pH at about 8, because of the buffering capacity of
the marine waters. • Strong current flows that dilute waste products and supply oxygen. • 100% saturation of dissolved oxygen. • Low levels of waste products such as ammonia. • Low levels of secondary products derived from microbial metabolism (e.g. nitrite). • Low stocking density.
In contrast, the high stocking density and much smaller volume of water in commercial culture systems means that the likelihood of any of these variables deviating from the optimum range is high. Although there is some overlap the optimum ranges of the 2 species of abalone, it is clear from our results that differences exist. Hence, the better option is to study both species, rather than extrapolate optimum values from H. laevigata to H. rubra. The relatively small volume of culture systems means that they will be susceptible to altered temperature (especially diurnal fluctuations), which in turn alters oxygen solubility. If tanks have insufficient water exchange, then waste products such as ammonia will accumulate. Furthermore, microbial communities that metabolise ammonia, and other waste products or uneaten food, will grow. These can generate toxic nitrite from ammonia and will consume oxygen. Microbial metabolism will also likely cause pH to decrease. Poor water quality may also enhance the likelihood of bacterial disease in abalone as the bacterial biomass will increase in the presence of excreta and uneaten food. Thus, in poorly designed or maintained systems, there is a very good chance that abalone health and therefore growth, will be reduced, which will have an impact on commercial viability. During the evaluation of our data it was apparent that poor water quality could have different effects on growth in terms of length gain versus weight gain. When free ammonia was combined with subsaturation of DO, then at the lowest DO levels growth was reduced with respect to length, but increased with respect to weight compared to the controls. If the
FRDC 97/323: Environmental requirements of abalone
126
additional mass is meat, then the abalone were not actually being seriously affected by low DO. If, however, the increase in mass was caused by production of a smaller, but denser shell, then this could restrict meat mass. The two possibilities must be distinguished. So just how sensitive are abalone to environmental changes? In terms of salinity, abalone are robust, surviving over a range from 25 to 40 g L-1, especially if they are allowed to securely attach to a substrate at 35 g L-1 prior to changing the salinity. However, at the extremes of this range activity and, therefore, possibly food consumption, is reduced. This raises the possibility that growth rates will also be reduced at the extreme values of salinity. Where farms have access to fully marine water, salinity is only likely to be a problem if heavy precipitation or terrestrial runoff dilutes tank water. Farms extracting water from or near estuaries may well have problems with low salinity. For temperature, greenlip and blacklip abalone had different responses. Greenlips grew equally well when held at either 17 or 19°C together with 99, 106, 114 or 123% oxygen saturation. Blacklip abalone grew better at 17°C than they did at 19°C and this was statistically significant for length but not for weight. In terms of growth, there is no advantage to be gained by supersaturating the water with oxygen. However, in the event that the temperature of a culture system increases to 19°C, there may be a short-term benefit in bubbling oxygen to achieve 106% saturation, because survival of blacklips was better at 106% than at either 99 or 123% saturation. Low levels of oxygen have been shown to cause growth reductions and mortality in greenlip abalone (Harris et al. 1999a). In this study, in otherwise optimal water quality, growth of greenlip abalone was decreased by 5% at 96% saturation. At 73% saturation and lower, growth was reduced by a least 50% of the value for the control. Likewise, Harris et al. (1998b) found that ammonia as free ammonia-nitrogen (FAN) reduced growth by 5% at 0.04 mg L-1 and at 0.158 mg L-1. Therefore, when DO is low and FAN is present, a situation that would not be uncommon, is the combined effect worse for the abalone? We found that the response of both species to combinations of low DO and several concentrations of FAN was complex. As expected (Harris et al. 1998b) the highest concentration of FAN, 0.197 mg L-1 seriously affected growth and induced 50% mortality. However, the effect of DO subsaturation was less clear. With FAN at 0.04 - 0.06 mg L-1, 56 and 64% DO saturation gave higher growth (weight gain), than did 76% saturation. The trend was less obvious for length, but still apparent. Does this mean that subsaturation with DO has less of an impact than does FAN? When tested alone, similar levels of DO caused decreased growth in greenlip abalone. So perhaps once FAN has reduced oxygen uptake by directly affecting the gills, lowering DO saturation will have a variable influence. A confounding feature here was the presence of up to 1.3 mg L-1 of nitrite formed from ammonia via microbial nitrification. At this concentration nitrite can reduce growth and induce higher rates of mortality in greenlip abalone (Harris et al. 1997). Nitrite toxicity may explain the lower growth rate obtained in one treatment that had a higher level of oxygen saturation than two others. To further complicate matters in our experiment examining the combined effects of low DO with FAN, the concentration of nitrite was not directly related to the concentration of ammonia. This is probably indicative of variation in the microbial

FRDC 97/323: Environmental requirements of abalone
127
communities in different tanks. Therefore, it was not possible to predict nitrite from the ammonia concentration. Low concentrations of ammonia could well result from high rates of microbial nitrification, which leads to two problems: nitrite toxicity and low DO as the microbes consume oxygen. An aspect that warrants further study is the variability in water quality throughout the exposure period, as distinct from the average water quality discussed here. Conceivably, some of the growth data could result from short-term events in which FAN or nitrite reached very high levels, or DO reached low levels. Such incidences may be masked if only the average values are considered. Counterbalanced against this is the fact that up to six 8-h pulses of FAN and low DO did not have any impact on greenlip abalone. Growth of blacklip abalone was reduced, but the difference was not statistically significant. This suggests that both species are reasonably tolerant of poor water quality over short time periods. It is only when water quality is chronically poor over extended periods that the growth and survival of abalone is seriously affected. Assessment of blacklip growth was confounded in this trial as the pH was 7.72 and the temperature was 20.7 °C. Both of these factors could have influenced the growth of blacklip abalone during the pulse trial. The length of time that water is of poor quality thus becomes the important issue. In this context the series of mortality events that occurred in our experiment on chronic FAN and low DO exposure suggest that the system was being operated at the limit. The animals were sufficiently stressed for sudden and high mortalities to occur when the poor water quality was exacerbated by a lack of recirculation and aeration. It is notable that the control system, which only had ambient levels of FAN and did remain aerated, had very little mortality. By its design, the experiment examining the effects of stocking density and refuge provision on the growth of greenlip abalone, integrated several environmental factors (section 6.5). The potential existed for poor quality water to develop within the refuges, producing either chronic or pulse exposures to temperatures or levels of DO, pH, FAN or nitrite that were less than optimal. However, ammonia, nitrite and pH did not reach levels likely to be toxic to abalone or inhibitory to their growth. Temperature varied between the morning and afternoon readings, but stayed within the optimum range for greenlips (Harris et al. this report, section 6.2 and references therein). The most likely limiting factor was DO, which was commonly at concentrations likely to reduce growth rates to some degree (Harris et al. 1999a). Although there was no significant difference in the mean daily DO between treatments, there was a significant difference in DO between treatments during the afternoon, with the highest stocking density having the lowest DO. Conceivably, this could have engendered daily pulsing of poor water quality to the abalone. Because the decline in DO was most extreme at high stocking density, it had a greater effect on growth at this density. Overall, low DO may have been a contributing factor in the mediocre growth rates attained in this trial.
FRDC 97/323: Environmental requirements of abalone
128
Anaesthesia is essentially a pulse event rather than being chronically present. However, the effect of anaesthesia or of knifing-off is long-term. Growth rates are reduced, often considerably, even if the variability in the data prevented us detecting a statistically significant decrease for some anaesthetics. Clearly, abalone should be disturbed as little as possible during growout. A potentially confounding feature in several of our experiments was the poor growth demonstrated by control animals. This was especially noticeable in blacklip abalone, but was also seen in greenlips. The implication is that some unknown factor was affecting the growth rates. Possibilities include that: the tank environment was inappropriate or the diet was insufficient or some cohorts of animals were inherently slow growing. If the effect was equivalent for the control and all treatments, then conclusions drawn on the impact of the treatments are valid. If it was not equivalent, or was very large in comparison to the effect of an individual treatment, then the treatment effect could be difficult to discern. It is possible that, because the tanks were mostly indoors and were regularly cleaned, insufficient diatom biomass was available to the abalone. However, at least one indoor trial for both species demonstrated growth rates in the controls equivalent to commercial rates. Harris et al. (1999a) suggested that enhancing water flow rates in tanks would improve growth rates by stimulating feeding, but when pumps were installed to do this, the effect was not uniform. The possible interactions that affect growth are manifold and complex. Because poor water quality demonstrably increases the likelihood of mortality, these results are relevant to live-holding facilities. In this case stocking densities will be very high and system failure could result in a rapid decrease in water quality to lethal levels. Thus, our summary data includes both growth and mortality effects. The management of abalone culture systems is now better defined, because it can be grounded in a broader knowledge of how the environment affects abalone. Thus, it is possible to more efficiently use water within a farm, and to manage tanks for optimum production. Having a larger total biomass available for sale is likely to outweigh the cost of slight reductions in water quality that can arise from increasing production levels. The importance of this research lies in knowing how husbandry can be manipulated to increase stocking density without significantly decreasing growth rates as a result of lower water quality.
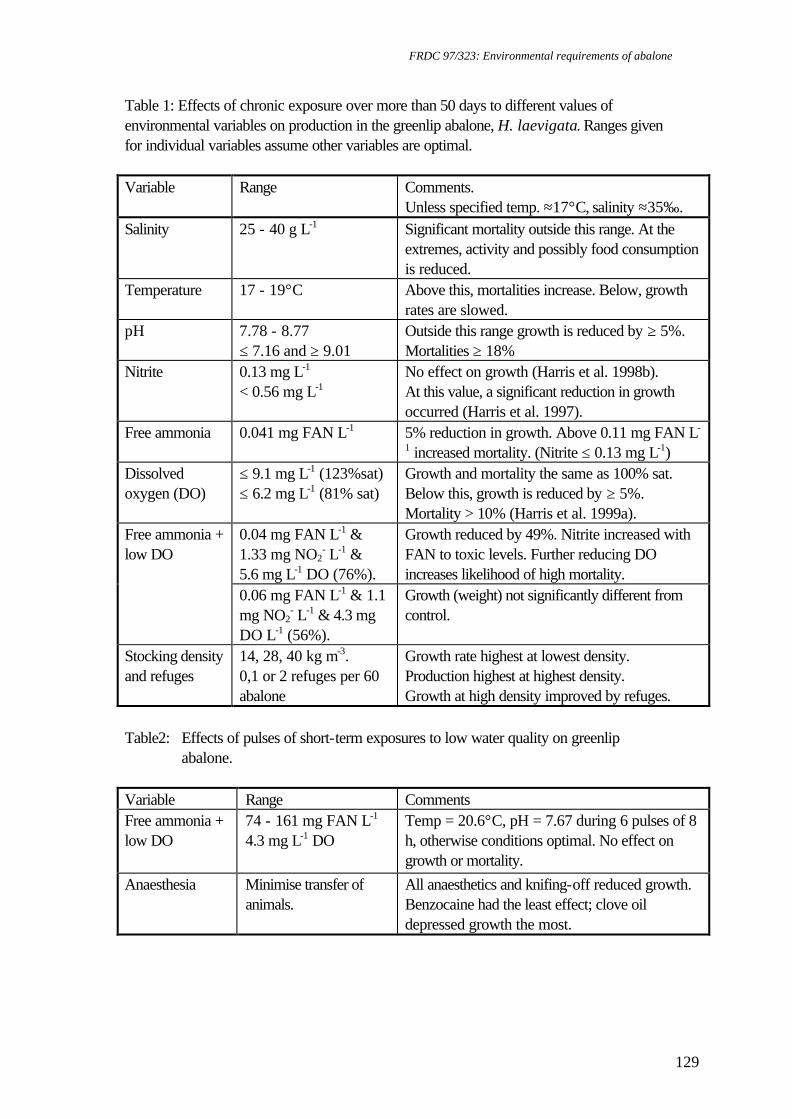
FRDC 97/323: Environmental requirements of abalone
129
Table 1: Effects of chronic exposure over more than 50 days to different values of environmental variables on production in the greenlip abalone, H. laevigata. Ranges given for individual variables assume other variables are optimal. Variable Range Comments.
Unless specified temp. ≈17°C, salinity ≈35‰. Salinity 25 - 40 g L-1 Significant mortality outside this range. At the
extremes, activity and possibly food consumption is reduced.
Temperature 17 - 19°C Above this, mortalities increase. Below, growth rates are slowed.
pH 7.78 - 8.77 ≤ 7.16 and ≥ 9.01
Outside this range growth is reduced by ≥ 5%. Mortalities ≥ 18%
Nitrite 0.13 mg L-1 < 0.56 mg L-1
No effect on growth (Harris et al. 1998b). At this value, a significant reduction in growth occurred (Harris et al. 1997).
Free ammonia 0.041 mg FAN L-1 5% reduction in growth. Above 0.11 mg FAN L-
1 increased mortality. (Nitrite ≤ 0.13 mg L-1) Dissolved oxygen (DO)
≤ 9.1 mg L-1 (123%sat) ≤ 6.2 mg L-1 (81% sat)
Growth and mortality the same as 100% sat. Below this, growth is reduced by ≥ 5%. Mortality > 10% (Harris et al. 1999a).
0.04 mg FAN L-1 & 1.33 mg NO2
- L-1 & 5.6 mg L-1 DO (76%).
Growth reduced by 49%. Nitrite increased with FAN to toxic levels. Further reducing DO increases likelihood of high mortality.
Free ammonia + low DO
0.06 mg FAN L-1 & 1.1 mg NO2
- L-1 & 4.3 mg DO L-1 (56%).
Growth (weight) not significantly different from control.
Stocking density and refuges
14, 28, 40 kg m-3. 0,1 or 2 refuges per 60 abalone
Growth rate highest at lowest density. Production highest at highest density. Growth at high density improved by refuges.
Table2: Effects of pulses of short-term exposures to low water quality on greenlip
abalone. Variable Range Comments Free ammonia + low DO
74 - 161 mg FAN L-1 4.3 mg L-1 DO
Temp = 20.6°C, pH = 7.67 during 6 pulses of 8 h, otherwise conditions optimal. No effect on growth or mortality.
Anaesthesia Minimise transfer of animals.
All anaesthetics and knifing-off reduced growth. Benzocaine had the least effect; clove oil depressed growth the most.
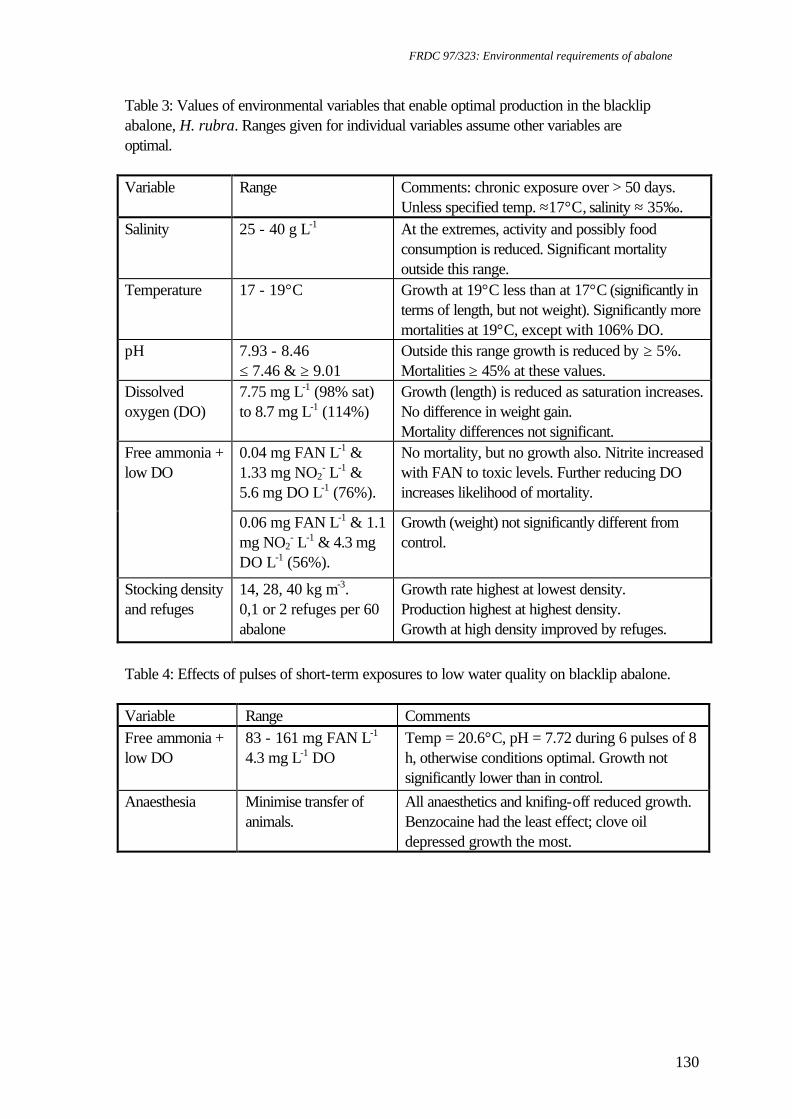
FRDC 97/323: Environmental requirements of abalone
130
Table 3: Values of environmental variables that enable optimal production in the blacklip abalone, H. rubra. Ranges given for individual variables assume other variables are optimal. Variable Range Comments: chronic exposure over > 50 days.
Unless specified temp. ≈17°C, salinity ≈ 35‰. Salinity 25 - 40 g L-1 At the extremes, activity and possibly food
consumption is reduced. Significant mortality outside this range.
Temperature 17 - 19°C Growth at 19°C less than at 17°C (significantly in terms of length, but not weight). Significantly more mortalities at 19°C, except with 106% DO.
pH 7.93 - 8.46 ≤ 7.46 & ≥ 9.01
Outside this range growth is reduced by ≥ 5%. Mortalities ≥ 45% at these values.
Dissolved oxygen (DO)
7.75 mg L-1 (98% sat) to 8.7 mg L-1 (114%)
Growth (length) is reduced as saturation increases. No difference in weight gain. Mortality differences not significant.
0.04 mg FAN L-1 & 1.33 mg NO2
- L-1 & 5.6 mg DO L-1 (76%).
No mortality, but no growth also. Nitrite increased with FAN to toxic levels. Further reducing DO increases likelihood of mortality.
Free ammonia + low DO
0.06 mg FAN L-1 & 1.1 mg NO2
- L-1 & 4.3 mg DO L-1 (56%).
Growth (weight) not significantly different from control.
Stocking density and refuges
14, 28, 40 kg m-3. 0,1 or 2 refuges per 60 abalone
Growth rate highest at lowest density. Production highest at highest density. Growth at high density improved by refuges.
Table 4: Effects of pulses of short-term exposures to low water quality on blacklip abalone. Variable Range Comments Free ammonia + low DO
83 - 161 mg FAN L-1 4.3 mg L-1 DO
Temp = 20.6°C, pH = 7.72 during 6 pulses of 8 h, otherwise conditions optimal. Growth not significantly lower than in control.
Anaesthesia Minimise transfer of animals.
All anaesthetics and knifing-off reduced growth. Benzocaine had the least effect; clove oil depressed growth the most.

FRDC 97/323: Environmental requirements of abalone
131
8: BENEFITS 1. Direct beneficiaries of this research Industry, the community and research organisations are all likely to benefit from this research. This research has contributed to our knowledge about the habitat and water quality requirements of two important commercial and recreational mollusc species. The abalone culture industry is likely to gain the most benefit from this research, through being able to avoid situations in which water quality could decrease the growth rate of their abalone. Avoiding this type of situation maximises the profit potential of stock. Additionally, the appropriate environmental conditions for holding tanks have been better defined. Abalone health is significantly adversely affected if water quality is allowed to deviate from narrow ranges (Tables 7.1-4). This is unlike bivalves, which can often grow in eutrophic conditions. Thus, abalone are less likely to be found in coastal regions containing high nutrient loads. As a result, less regulation is required to monitor the health status of the wild abalone than for wild-caught bivalves. The knowledge of water quality tolerances for these abalone species allows research organisations to achieve greater control over experimental conditions, hence achieving greater precision with experiments. 2. Price advantages from research The price obtained for farmed abalone products is in the range of $AUS 45-54.kg-1, with the better prices achieved for higher quality stock. (Johnston 1996). Live abalone attract a premium price, and are often maintained in restaurant aquaria prior to sale. Our data can be used to determine the requisite water quality for maintaining live, healthy abalone. In turn, this increases the shelf life of abalone. Also, consumer acceptance of the abalone is likely to be enhanced as a result of the healthier condition of abalone. 3. Productivity 3.1 Habitat Provision of shelters in tanks could increase production at high stocking density. Abalone are resistant to episodes of bad water quality. 3.2 pH The pH range defined for each species is an estimation of the values of pH outside of which growth could be decreased by 5% compared to the maximum rate (EC5). This range is from 7.78 - 8.77 for greenlip abalone and is 7.93 - 8.46 for blacklip abalone. Furthermore, significant mortalities will occur in both greenlip and blacklip abalone at pH < 6.8. 3.3 DO x Temperature Blacklip abalone demonstrated less tolerance for DO concentrations above 100% saturation than did greenlip abalone. Blacklip abalone grew fastest (in terms of length) when held at 99% oxygen saturation and 17°C. Their growth was reduced as oxygen became supersaturated. At 19°C, blacklips grew significantly slower in both saturated and
FRDC 97/323: Environmental requirements of abalone
132
supersaturated water in comparison to abalone held at 17°C. However, the survival of blacklips was best at either 17°C or 19°C for DO at 106% supersaturation. Good survival was also achieved at 100% and 114% saturation at 17°C. In tanks where algae are present, DO can increase during daylight hours. Although fluctuating DO levels were not directly investigated, it is reasonable to expect that growth reductions will occur for blacklip abalone in this situation. However, greenlip abalone are not as sensitive to an increase in oxygen concentration in culture tanks from photosynthesis. Therefore, supersaturation is less likely to impact on growth rates for greenlip abalone. 3.4 Nitrite The low level of nitrite that deleteriously affects abalone is a cause for concern, as commercial operations will be limited in the amount of water that can be re-used. However, there is a trade off between the effects of nitrite and the cost of not re-using water. Background environmental nitrite levels are in the vicinity of 0.001 mg NO2-N L-1. 3.5 Anaesthetics The removal of abalone from tanks is likely to cause a reduction in subsequent growth rates, irrespective of the method of removal. Furthermore, there is an increased risk of mortality in anaesthetised animals. Therefore, the best method of husbandry would use a system that did not require animals to be removed from substrate prior to harvest. For example, the use of movable refuges to which abalone could attach. If this is not possible, then the chemical agents that had the least effect on respiration in the short-term were normal metabolites - ethanol and KCl. However, benzocaine had the least effect on growth, especially in relation to weight gain. 4. Non-market benefits 4.1 Recreational fishery This research, and the preceding work on environmental requirements of abalone, is likely to lead to increased confidence in abalone as a recreationally caught species. The knowledge that abalone require such high water quality means that it is highly unlikely that they will thrive in areas of pollution, or even increased nutrient runoff. Thus, the wild fishery is less likely to require disease management strategies to the extent that the bivalve industry requires. 4.2 Coastal development Community acceptance of abalone farms is likely to benefit from this research, with the knowledge that abalone require high water quality to successfully produce stock. The development of abalone farms may serve to prevent the proliferation of polluting industries, as this would directly impact on the profitability of the abalone farms. This also means that pollution from farms is not in their interest, as local alterations to water quality will impact directly on farm profitability. This is likely to make them more attractive as a commercial industry in areas of restricted development, such as coastal regions. 5. Flow of benefits
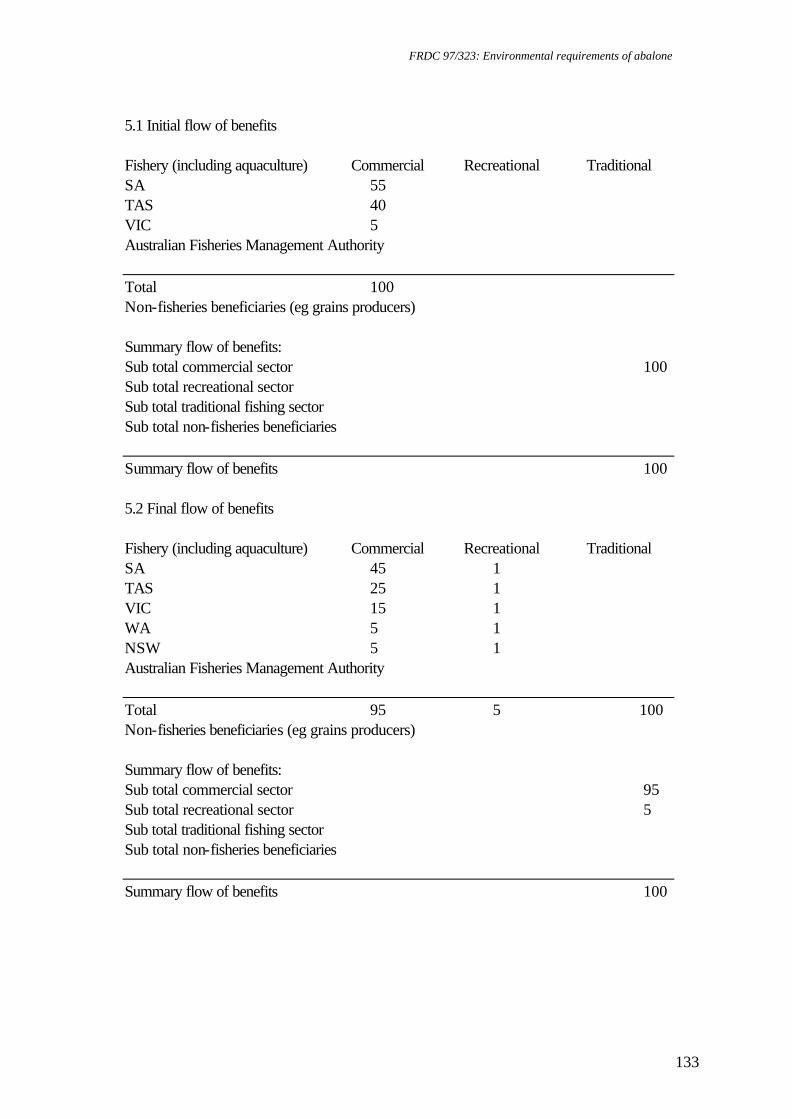
FRDC 97/323: Environmental requirements of abalone
133
5.1 Initial flow of benefits Fishery (including aquaculture) Commercial Recreational Traditional SA 55 TAS 40 VIC 5 Australian Fisheries Management Authority Total 100 Non-fisheries beneficiaries (eg grains producers) Summary flow of benefits: Sub total commercial sector 100 Sub total recreational sector Sub total traditional fishing sector Sub total non-fisheries beneficiaries Summary flow of benefits 100 5.2 Final flow of benefits Fishery (including aquaculture) Commercial Recreational Traditional SA 45 1 TAS 25 1 VIC 15 1 WA 5 1 NSW 5 1 Australian Fisheries Management Authority Total 95 5 100 Non-fisheries beneficiaries (eg grains producers) Summary flow of benefits: Sub total commercial sector 95 Sub total recreational sector 5 Sub total traditional fishing sector Sub total non-fisheries beneficiaries Summary flow of benefits 100
FRDC 97/323: Environmental requirements of abalone
134
9: FURTHER DEVELOPMENT The environmental requirements for greenlip and blacklip abalone are now broadly known. However, there are areas in which further study could be done. The optimum pH range for blacklip abalone could be better defined, particularly at the upper end of the range. The data on appropriate temperatures for abalone are still limited. We assessed 17 and 19°C for both species. Greenlip abalone grew equally well at both so the optimum temperature may be higher yet, it could be useful to extend the experiment to cover the range 15 to 25°C. In culture systems that do not control temperature, then diurnal variations in temperature could have significant effects on growth. Nitrite at even low concentrations affects abalone. However, the mechanism(s) of action appear complex. Further study could be made of the effect of nitrite on respiratory physiology could be done to fully elucidate the mechanism of action. Similarly, the mechanism of action of low dissolved oxygen concentration on respiratory physiology could also be examined. Short-term effects of salinity on survival and respiration have been described, but growth experiments could also be performed. With respect to anaesthetics, a possible candidate that could be assessed is magnesium sulphate. Furthermore, the effect of potassium chloride on growth remains to be assessed. As live-holding facilities are stocked at high density, the environmental parameters described in this report are relevant to these. Although growth is not an issue, mortality is. Our work on chronic exposure of abalone to low DO combined with FAN could be extended to higher stocking densities to more accurately delineate conditions likely to cause significant mortality. From this, appropriate flow rates, temperatures and aeration could be determined. Our work used round tanks, so it may be useful to repeat some experiments in other tank shapes, particularly shallow raceway tanks. We showed that episodes of poor water quality during the daytime had little effect on abalone. However, it would be pertinent to reassess this during the active foraging periods at night. The research contained within this grant and the preceding grant on environmental requirements of abalone (a linked part of the manufactured diet development grant, regarding the effect of diet on tank environment) could be readily combined in the form of a growout guide for farmers.
FRDC 97/323: Environmental requirements of abalone
135
10: CONCLUSION OBJECTIVE 1: to provide the information needed for industry to reduce its operating
costs (water exchange) or increase production (through higher stocking densities) in a manner that does not compromise the health of the abalone through inadequate water quality
In terms of pH, a range for best growth rates has been developed. The study on the effect of nitrite on the growth of abalone detailed in the preceding grant indicated that a low level of nitrite affects abalone. The results of this study further illustrate the problems that abalone have with this compound. The effects of short-term changes to ammonia are now known, and so can be used in management of abalone in restricted water bodies, such as tanks. Slight supersaturation of dissolved oxygen has little effect on greenlip abalone, although blacklip abalone may experience increased survival, but declining growth rates with increased oxygen supersaturation. The short-term effects of salinity variation are also known, and can be used as a management tool for site selection and water quality management. The need for increased surface area and for shelters as stocking density is increased has been clearly demonstrated. This needs attention from farmers so that the maximum growth rates of abalone are achieved. We have shown that the level of interaction for individual abalone increases with stocking density and that this may cause shell damage. The percentage decrease in growth rates with increasing stocking density is important management information. The decrease in growth rate is likely to be more than counterbalanced by the increased production resulting from the higher biomass in a well-managed system. OBJECTIVE 2: to establish safe operating levels for a range of water quality variables. Tolerance ranges are defined for pH and salinity The effects of the interaction between DO and ammonia, and DO and temperature are now clarified. The safe operating level for nitrite was further investigated. OBJECTIVE 3: aim to identify stress-specific changes in the structure or biochemistry of
abalone in relation to particular water quality problems. This will improve the diagnostic tools available to veterinary staff.
The pH bioassay revealed alterations to tissue at low pH Haemolymph analysis from the pH bioassay demonstrated alterations to calcium metabolism. Both nitrite and the salinity research were investigated in terms of haemolymph parameters. The deleterious effects of anaesthetics on respiration and growth have been described. Tables 7.1 to 7.4 give values for environmental parameters that optimise growth.

FRDC 97/323: Environmental requirements of abalone
136
OBJECTIVE 4: we plan to convey this information in a prompt and user friendly form for industry.
Annual presentations have been made at the FRDC Abalone Aquaculture Annual workshops, in Hobart (July 1998), and in Sydney (April 1999). All members of the research team made or contributed to presentations at the workshops. Most abalone aquaculture companies send representatives to these workshops and these presentations are now very well documented. Written versions of these presentations are available in the workshop notes, published for each year. Other popular or scientific publications are being used as well; articles have appeared in Austasia Aquaculture and the Journal of Shellfish Research. Regular contributions have been made to the Developments in Abalone Aquaculture newsletter, which is a forum for disseminating recent research within Australia. Nontechnical summaries have been made of all experiments and also of the whole project. Some of the experiments were presented in Cape Town, South Africa in February 2000 for the 4th International Abalone Symposium. OUTCOMES: As a consequence of this research, the effects of the majority of water quality variables on greenlip and blacklip abalone are now known. This has direct and indirect benefits for all involved in maintaining abalone, whether at commercial abalone farms, research institutions or restaurant aquaria all will all find it easier to maintain live and healthy abalone. The knowledge on the environmental requirements for abalone gained in this project, together with earlier studies, will enable the rational development of commercial abalone aquaculture. In consideration of water quality, industry now has sufficient information to properly site farms and design tank systems to maximise production while controlling costs.

FRDC 97/323: Environmental requirements of abalone
137
11 REFERENCES Ainslie, R. 1980a. Haemocyanin concentrations in field populations of three species of southern Australian abalone. Aust. J. Freshw. Res. 31(5):627-633. Ainslie, R.C. 1980b. The quantitative role of Hcy in the respiration of abalone (genus Haliotis). J. Exp. Zool. 211:87-99. Allan, G.L. and Maguire, G.B. 1991. Lethal levels of low dissolved oxygen and effects of short-term oxygen stress on subsequent growth of juvenile Penaeus monodon. Aquaculture, 94: 27-37. Allan, G.L. and Maguire, G.B. 1992. Effects of stocking density on production of Penaeus monodon Fabricius in model farming ponds. Aquaculture, 107: 49-66. Allan, G., Maguire, G. and Hopkins, S. 1990. Acute and chronic toxicity of ammonia to juvenile Metapenaeus macleayi and Penaeus monodon and the influence of low dissolved oxygen levels. Aquaculture 91: 265-280. Anthionsen, A. C., Loehr, R. C., Prakasam, T. B. S. and Srinath, E. G. 1976. Inhibition of nitrification by ammonia and nitrous acid. J. Wat. Poll. Control Fed., 48(5):835-852. Bamber, R. N. 1987. The effects of acidic seawater on young carpet-shell clams Venerupis decussata (L.) (Mollusca: Veneracea). J. Exp. Mar. Biol. Ecol. 108(3):241-260. Bamber, R. N. 1990. The effects of acidic seawater on three species of lamellibranch mollusc. J. Exp. Mar. Biol. Ecol. 143:181-191. Barnes, R. 1987. Invertebrate Zoology. Saunders College Publishing, Fort Worth, p 893. Basuyaux, O., Mathieu, M. and Day, C., 1998. Effects of salinity on diet and growth of the sea urchin Paracentrotus lividus and the abalone Haliotis tuberculata. Bull. Soc. Zool. Fr., 123(2):141-150. Beitinger, T. L. and R. W. McAuley. 1990. Whole animal physiological approaches for the assessment of stress in fishes. J. Great Lakes Res. 16(4):542-575. Bengston, D. A., Beck, A. D. and Simpson, K. L. 1985. Standardization of the nutrition of fish in aquatic toxicological testing. In: Cowey, C. B., Mackie, A.M. and Bell, J.G. (Eds.), Nutrition and Feeding in Fish. Academic Press, Sydney, pp. 431-446. Betzer, S.B. and Pilson, M.E.Q. 1974. The seasonal cycle of copper concentration in Busycon canaliculatum. Biol. Bull. (Woods Hole, Mass.) 146:165-175.

FRDC 97/323: Environmental requirements of abalone
138
Bishop, C., Lee, K. and Watts, S., 1994. A comparison of osmolality and specific ion concentrations in the fluid compartments of the regular sea urchin Lytechinus variegatus Lamarck (Echinodermata: Echinoidea) in varying salinities. Comp. Biochem. Physiol. 108A(4):497-502. Boarder, S. J. 1997. Effects of dietary vitamin and mineral inclusion levels on the greenlip abalone Haliotis laevigata Donovan. Unpublished Honours thesis, University of Tasmania, 125 pp. Boarder, S. J. and Maguire, G.B. 1998. Evaluation of vitamin and mineral requirements for greenlip abalone Haliotis laevigata - a progress report. In: Hone, P. W. (Ed.), Proceedings of the 5th Abalone Aquaculture Workshop, July 3-6 1998, Hobart. FRDC, Henley Beach, pp. 75-86. Bower, C. E. and Bidwell J. P. 1978. Ionisation of ammonia in seawater: effects of temperature, pH, and salinity. J. Fish. Res. Board Can. 35(7):1012-1017. Bower, C. E. and Holm-Hanson, T. 1980. A salicylate-hypochlorite method for determining ammonia in seawater. Can. J. Fish. Aquat. Sci. 37: 794-798. Brett, J. R. 1979. Environmental factors and growth. In: Hoar, W. S., Randall, D. J. and Brett J. R. (Eds), Fish Physiology, Volume 8. Bioenergetics and Growth. Academic Press, New York, pp. 599-675. Brix, O. 1983. Blood respiratory properties in marine gastropods. In: Hochachka, P. W. (Ed.), The Mollusca Vol. 2: Environmental Biochemistry and Physiology. Academic Press, New York, pp. 51-75. Brix, O., Lykkeboe, G. and Johansen, K. 1979. Reversed Bohr and Root shifts in hemocyanin of the marine prosobranch, Buccinum undatum: adaptations to a periodically hypoxic habitat. J. Comp. Physiol. 129:97-103. Bruno, T. J. and Svoronos, P. D. N. (Eds.). 1989. CRC Handbook of Basic Tables for Chemical Analysis. CRC Press, Boca Raton. Buckingham, M. J. and Freed, D. E. 1976. Oxygen consumption in the prosobranch snail Viviparus contectoides (Mollusca: Gastropoda)-II. Effects of temperature and pH. Comp. Biochem. Physiol. 53A:249-252. Burton, R. F. 1983. Ionic regulation and water balance. In: Saleuddin, A. S. M. and Wilbur, K. M., The Mollusca Vol. 5, Physiology Part 2. Academic Press, Sydney, pp. 291-352. Calabrese, A. and. Davis, H. C. 1966. The pH tolerance of embryos and larvae of Mercenaria mercenaria and Crassostrea virginica. Biol. Bull. Woods Hole 131:427-436.

FRDC 97/323: Environmental requirements of abalone
139
Carefoot, T. 1991. Blood glucose levels in the sea hare Aplysia dactylomela: interrelationships of activity, diet choice and food quality. J. Exp. Mar. Biol. Ecol. 154:231-244. Carefoot, T. 1994. Effects of environmental stressors on blood glucose levels in sea hares, Aplysia dactylomela. Mar. Biol. 118:579-583. Carefoot, T., Qian, P, Taylor, B., West, T. and Osborne, J., 1993. Effect of starvation on energy reserves and metabolism in the northern abalone, Haliotis kamtschatkana. Aquaculture 118:315-325. Chen, J.C. and Chen, S-F. 1992a. Accumulation of nitrite in the haemolymph of Penaeus japonicus. Mar. Ecol. Prog. Ser., 83(2-3):305-308. Chen, J-C. and Chen, S-F. 1992b. Accumulation of nitrite on in the haemolymph of Penaeus monodon exposed to ambient nitrite. Comp. Biochem. Physiol., 103C(3):477-481. Chen, J-C. and Chen, S-F. 1992c. Effects of nitrite on growth and molting of Penaeus monodon juveniles. Comp. Biochem. Physiol., 101C(3):453-458. Chen, J-C. and Cheng, S-H. 1995a. Changes of oxyhaemocyanin and protein levels in the haemolymph of Penaeus japonicus exposed to ambient nitrite. Aquat. Toxicol. 33:215-226. Chen, J-C. and Cheng, S-H. 1995b. Hemolymph oxygen content, oxyhemocyanin, protein levels and ammonia excretion in the shrimp Penaeus monodon exposed to ambient nitrite. J. Comp. Physiol. B. 164:530-535. Cobas-MIRA, 1987. Roche: Cobas-MIRA - Scientific Methods - Manual. Roche Inc., New York, 293 pp. Collins, M. T., Gratzek, J. B., Shotts, Jr E. B., Dawe, D. L., Campbell, L. M. and Senn, D. R. 1975. Nitrification in an aquatic recirculating system. J. Fish. Res. Board Can. 32(11):2025-2031. Colt, J. E. and Armstrong, D. A. 1981. Nitrogen toxicity to crustaceans, fish, and molluscs. In: Allen, L. J. and Kinney, E. C., (Eds.). Proceedings of the Bioengineering Symposium for Fish Culture, Fish Culture Section of the American Fisheries Society (FCS Publication 1), pp. 34-47. Colt, J., Ludwig, R., Tchobanoglous, G. and Cech, J. J., Jr. 1981. The effects of nitrite on the short term growth and survival of channel catfish, Ictalurus punctatus. Aquaculture, 24:111-122.
FRDC 97/323: Environmental requirements of abalone
140
Coote, T. A., Hone, P. W., Kenyon, R. and Maguire, G. B. 1996. The effect of different combinations of dietary calcium and phosphorus on the growth of juvenile Haliotis laevigata. Aquaculture, 145:267-279. Costa, D.P. (1988) Methods for studying the energetics of freely-diving animals. Canadian Journal of Zoology 66 (1), 45-52. Dal Pont, G., Hogan, M. and Newell, B. 1974. Laboratory techniques in marine chemistry II. Determination of ammonia in sea water and the preservation of samples for nitrate analysis. CSIRO Division of Fisheries and Oceanography Report No. 55, Cronulla, Sydney, 8pp. Davis, A., Lawrence, A. and Gatlin III, D., 1993. Responses of Penaeus vannamei to dietary calcium, phosphorous and calcium: phosphorous ration. J. World. Aquaculture Soc. 24(4):504-515. de Guingand, P. and Maguire, G. B. 1992. Does temperature affect start-up time for biofilters? Austasia Aquaculture, 6(4):38-39. Dunstan, G. A., Brown, M. R., Augerinos, M., Johns, D. R. and Knuckey, R. 1998. Formulated feeds for juvenile abalone; based on natural feeds (diatoms and crustose coralline algae). In: Hone, P. W. (Ed.), Proceedings of the 5th Abalone Aquaculture Workshop, July 3-6 1998, Hobart. FRDC, Henley Beach, pp. 13-21. Eddy, F. B., Kunzlik, P. A. and Bath, R. N. 1983. Uptake and loss of nitrite from the blood of rainbow trout, Salmo gairdneri Richardson, and Atlantic salmon, Salmo salar L. in fresh water and in dilute sea water. J. Fish Biol. 23, 105-116. Edwards, S. J. 1996a. Thermal preferences and tolerances of greenlip and blacklip abalone. pp. 65-67 .In: P. W. Hone (Ed.). Proceedings of the 3rd Annual Abalone Aquaculture Workshop, July 1996, Port Lincoln, SA. SARDI, Adelaide. Edwards S.J. 1996b Effects of handling on oxygen consumption of blacklip abalone. Proceedings of the 3rd Annual Abalone Aquaculture Workshop, July 1996, Port Lincoln, SA. SARDI, Adelaide. Edwards, S.J., Colquhoun, E.Q. and Clark, M.G. 1990. Levels of pungent principles in chilli sauces and capsicum fruit in Australia. Food Australia 42(9), 432-435. Edwards, S.J, Montgomery, I.M., Colquhoun, E.Q., Jordan, J. and Clark, M.G. 1992. Spicy meal disturbs sleep: An effect of thermoregulation? International Journal of Psychophysiology 13, 97-100. Elston, R. 1983. Histopathology of oxygen intoxication in the juvenile red abalone, Haliotis rufescens Swainson. J. Fish Dis., 6:101-110.
FRDC 97/323: Environmental requirements of abalone
141
Elston, R. and Lockwood, G. S. 1983. Pathogenesis of vibriosis in cultured juvenile red abalone, Haliotis rufescens Swainson. J. Fish Dis., 6:111-128. Fellows, P. J. 1990. Food Processing Technology, Principles and Practice. Ellis Horwood Ltd., Sydney, pp. 221-249. Fleming, A. E. and Hone, P. W. 1996. Abalone aquaculture. Aquaculture 140(1-2):1-4. Fleming, A., Hone, P. and Higham, J. 1997. The effect of water velocity on consumption and growth of greenlip abalone in tanks. In: Hone, P. W. (Ed.), Proceedings of the 4th Annual Abalone Aquaculture Workshop, July 1997, Port Fairy, Victoria. SARDI, Adelaide, pp. 16-23. Fleming, A.E., Van Barneveld, R.J. and Hone, P.W., 1996. The development of artificial diets for abalone: a review and future directions. Aquaculture 140:5-53. Gilroy, A. and Edwards, S. J. 1998. Optimum temperature for growth of Australian abalone: preferred temperature and critical thermal maximum for blacklip abalone, Haliotis rubra (Leach), and greenlip abalone (Leach). Aquaculture Res., 29:481-485. Grasshoff, K. 1989. Methods of Seawater Analysis. Velag Chemie, New York, pp. 134-137. Grenon, J. and Wlker, G. 1979. Biochemical and rheological properties of the pedal mucus of the limpet, Patella vulgata L. Comp. Biochem. Physiol. 66B:451-458. Gutzmer, M. P. and Tomasso, J. R. 1985. Nitrite toxicity to the crayfish Procambarus clarkii. Bull. Environ. Contam. Toxicol., 34:369-376. Hahn, K.O. (1989) Biotic and abiotic factors affecting the culture of abalone. In: Handbook of culture of abalone and other marine gastropods. CRC Press, Boca Raton, Florida, pp 113-134. Halver, J.E., 1989. The Vitamins. In: J.E. Halver (Ed.), Fish Nutrition, 2nd edn. Academic Press, San Diego, pp 32-102. Harris, J.O. 1999a. Environmental requirements of Australian abalone. Austasia Aquaculture 13(4):51-54. Harris, J.O., 1999b. Chronic effects of adverse water quality on the greenlip abalone, Haliotis laevigata Donovan. Ph. D. Thesis, University of Tasmania, 128 pp. Harris, J. O., Maguire, G. B., Edwards, S. J. and Hindrum, S. M. 1997. Effect of nitrite on growth and oxygen consumption for juvenile greenlip abalone, Haliotis laevigata Donovan. J. Shellfish Res. 16(2):395-401.

FRDC 97/323: Environmental requirements of abalone
142
Harris, J. O., Maguire, G. B. and Handlinger, J. H. 1998a. Effects of chronic exposure of greenlip abalone, Haliotis laevigata Donovan, to high ammonia, nitrite and low dissolved oxygen concentrations on gill and kidney structure. J. Shellfish Res. 17(3):683-687. Harris, J. O., Maguire, G. B., Edwards, S. J. and Hindrum, S. M. 1998b. Effect of ammonia on growth rate and oxygen consumption rate for juvenile greenlip abalone, Haliotis laevigata Donovan. Aquaculture 160 (3/4), 259-272. Harris, J. O., Maguire, G. B., Edwards, S. J. and Johns, D. R. 1999a. Low dissolved oxygen reduces growth rate and oxygen consumption rate for juvenile greenlip abalone, Haliotis laevigata Donovan. Aquaculture, 174:265-278. Harris, J.O, Burke, C.M. and Johns, D.R. 1999b. The effect of dissolved oxygen and temperature on juvenile greenlip and blacklip abalone. In: P.W. Hone, (Ed.), Proceedings of the 6h Abalone Aquaculture Workshop, April 28 1999, Sydney. Harris, J.O., Maguire, G.B,. Edwards, S.J. and Hindrum, S.M. 1999c. Effect of pH on growth rate and oxygen consumption rate of juvenile greenlip, Haliotis laevigata, and blacklip abalone, Haliotis rubra. J. Shellfish Res., 18(2): . Hattingh, J. 1976. Blood sugar as an indicator of stress in the freshwater fish, Labeo capensis (Smith). J. Fish Biol. 10:191-195. Higham, J., Hone, P., Clarke, S., Baudinette, R. and Geddes, M. 1998. The effect of flow on growth in juvenile greenlip abalone, Haliotis laevigata (Donovan). pp. 115-122. In: P. W. Hone (Ed.). Proceedings of the 5th Abalone Aquaculture Workshop, July 3-6 1998, Hobart. FRDC, Henley Beach. Hindrum, S. M., Cropp, M., O’Brien, D., Savva, N., Maguire, G. B. and Johns, D. R. 1996. Performance of greenlip (Haliotis laevigata) and blacklip*greenlip hybrid abalone in land-based or sea-based production systems. pp. 15-38. In: P. W. Hone (Ed.). Proceedings of the 3rd Annual Abalone Aquaculture Workshop, August 1996, SARDI, Adelaide, South Australia. SARDI, Adelaide. Hone, P. W. and Maguire, G. B. 1996. Prospects for the Australian abalone culture industry in relation to nutrition research. In: Hone, P. W. (Ed.), Proceedings of the 3rd Annual Abalone Aquaculture Workshop, Port Lincoln, South Australia, August 1996, South Australian Research and Development Institute, Adelaide, pp. 3-9. Houlihan, D.F. and Allan, D. (1982) Oxygen consumption of some Antarctic and British gastropods: An evaluation of cold adaptation. Comp. Biochem. Physiol. 73a: 383-387. Innes, A. J. and Houlihan, D. F. 1985. Aerobic capacity and cost of locomotion of a cool temperate gastropod: A comparison with some Mediterranean species. Comp. Biochem. Physiol. 80A(4):487-493.
FRDC 97/323: Environmental requirements of abalone
143
Jarayabhand, P. and Phapavasit, N., 1996. A review of the culture of tropical abalone with special reference to Thailand. Aquaculture, 140:159-168. Jeberg, M.V. and Jensen, F.B. 1994. Extracellular and intracellular ionic changes in crayfish Astacus astacus exposed to nitrite at two acclimation temperatures. Aquat. Toxicol. 29: 65 -72. Jensen, F.B. 1990. Sublethal physiological changes in freshwater crayfish, Astacus astacus, exposed to nitrite: haemolymph and muscle tissue electrolyte status, and haemolymph acid-base and gas transport. Aquat. Toxicol. 18:51-60 Jensen, F. B. 1995. Uptake and effects of nitrite and nitrate in animals. In: Walsh, P. J. and Wright, P. (Eds.), Nitrogen Metabolism and Excretion. CRC Press, Boca Raton, pp. 289-303. Jensen, F. B. 1996. Physiological effects of nitrite in teleosts and crustaceans. In: Taylor, E. W. (Ed.), Toxicology of Aquatic Pollution. Physiological, Cellular and Molecular Approaches. Cambridge University Press, Cambridge, pp. 169-186. Jensen, F. B., Anderson, N. A. and Heisler, N. 1987. Effects of nitrite exposure on blood respiratory properties, acid-base and electrolyte regulation in the carp (Cyprinus carpio). J. Comp. Physiol. B., 157:533-541. Jobling, M. (1981) The influences of feeding on the metabolic rate of fishes: a short review. J. Fish Biol. 18: 385-400. Johnston, T. 1996. Marketing workshop notes. In: P.W. Hone (Ed.), Proceedings of the 3rd Annual Abalone Aquaculture Workshop, Marketing Workshop Notes, August 1996, Port Lincoln, South Australia. Jones, H.D. 1983. The circulatory system of gastropods and bivalves. In: A.S.W. Saleuddin and K.M. Wilbur (eds) The Mollusca vol. 5. Physiology, Part 2. Academic Press, NY pp189 - 238. Leitman, A. 1992. The effects of gas supersaturation on the behaviour, growth and mortality of red abalone, Haliotis rufescens (Swainson). In: Shepherd, S. A., Tegner, M. J. and Guzman del Proo, S. A. (Eds.), Abalone of the World: Biology, Fisheries and Culture. Fishing News Books, pp. 75-85. Little, C. 1967. Ionic regulation in the queen conch, Strombus gigas (Gastropoda, Prosobranchia). J. Exp. Biol. 46:459-474. Liu, H. and Avault, J. W., Jr. 1996. Effect of nitrite on growth of juvenile red swamp crawfish, Procambarus clarkii. J. Shellfish Res., 15(3):759-761.
FRDC 97/323: Environmental requirements of abalone
144
Lorkin, M.E., Hone, P.W., Fleming, A.E. and Vanderpeer, M. 1999. Economics of on farm feeding strategies and recommended practices. In: P.W. Hone, (Ed.), Proceedings of the 6th Abalone Aquaculture Workshop, April 28 1999, Sydney. SARDI Adelaide. Loipersberger, M. 1997. SAABDEV tank report. In: P.W. Hone, (ed.), Proceedings of the 4th Abalone Aquaculture Workshop, July 1997 Port Fairy, Victoria. SARDI, Adelaide pp 2 - 4. Maguire, G. B. and Hone, P. 1997. Port Lincoln abalone culture workshop - R and D aids impressive industry expansion. Austasia Aquaculture, 11(2):37-39. Maguire, G. B., Johns, D. R., Hindrum, S. M. and Cropp, M. 1996. Effects of shading and refuges on the growth of juvenile greenlip abalone Haliotis laevigata. In: Hone, P. W. (Ed.), Proceedings of the 3rd Annual Abalone Aquaculture Workshop, Port Lincoln, South Australia, August 1996, pp. 44-49. Mallat, J. 1985. Fish gill structural changes induced by toxicants and other irritants: a statistical review. Can. J. Fish. Aquat. Sci. 42:630-648. Mangum, C.P. and Burnett, L.E. 1986. The CO2 sensitivity of the hemocyanins and its relationship to Cl- sensitivity. Biol. Bull. (Woods Hole) 171:248-263. McLean, J.A. and Tobin, G. 1987. Animal and Human Calorimetry. Cambridge University Press, Cambridge UK. Meyers, T. R. and J. D. Hendricks. 1985. Histopathology. pp. 283-331. In: G. M. Rand and S. R. Petrocelli (Eds.). Fundamentals of Aquatic Toxicology. Hemisphere Publishing, Washington. Mgaya, Y.D. and Mercer, J.P. 1994. A review of the biology, ecology, fisheries and mariculture of the European abalone Haliotis tuberculata Linnaeus 1758 (Gastropoda: Haliotidae). Proc. Roy. Irish Acad. 94B(3):285-304. Mudge, J. E., Dively, J. L., Neff, W. H. and Anthony, A. 1977. Interrenal histochemistry of acid-exposed brook trout, Salvelinus fontinalis (Mitchill). Gen. Comp. Endocrinol. 31:208-215. Nakanishi, T. 1978. Studies on the effects of the environment on the heart rate of shellfishes. II. Effects of temperature, low salinity and hypoxia on the heart rate of abalone Haliotis (Nordotis) discus hannai Ino. Bull. Hokkaido Reg. Fish. Res. Lab., 43:59-68. Nickerson, K.W. and Van Holde, K.E. 1971. A comparison of molluscan and arthropod hemocyanin - I. Circular dichroism and absorption spectra. Comp. Biochem. Physiol. 39B:855-872.
FRDC 97/323: Environmental requirements of abalone
145
Oakes, F. R. and Ponte, R. D. 1996. The abalone market: Opportunities for cultured abalone. Aquaculture 140:187-195. Palmer, A. R. 1981. Do carbonate skeletons limit the rate of body growth? Nature 292:150-152. Pierce, S. and Amende, L. 1981. Control mechanisms of amino acid-mediated cell volume regulation in salinity-stressed molluscs. J. Exp. Zool. 215:247-257. Preston, S. J., Roberts, D. and Montgomery, W. I. 1996. Crab predation as a selective agent on shelled gastropods: a case study of Calliostoma zizyphinum (Prosobranchia: Trochidae). pp. 313-325. In: J. Taylor (Ed.). Origin and Evolutionary Radiation of the Mollusca. Oxford University Press, Oxford. Prince, J.D., and Ford, W.B. 1985. Use of anaesthetics to standardize efficiency in sampling abalone populations. Aust. J. Mar. Freshw. Res, 36, 701-6. Prior, D. and Pierce, S. 1981. Adaptation and tolerance of invertebrate nervous to osmotic stress. J. Exp. Zool. 215:237-245. Rand, G. M. and Petrocelli, S. R. 1985. Introduction. In: Rand, G. M. and Petrocelli, S. R., Fundamentals of Aquatic Toxicology. Hemisphere Publishing Corporation, New York, pp. 1-30. Randall, D. 1991. The impact of variations in water pH on fish. pp. 90-104. In: D. E. Brune and J. R. Tomasso (Eds.). Aquaculture and Water Quality. World Aquaculture Society, Baton Rouge. Russell, C.W. and Evans, B.K. 1989. Cardiovascular anatomy and physiology of the blacklip abalone, Haliotis ruber. J. Exp. Zool. 252:105-117. Russo, R. C. 1985. Ammonia, nitrite, and nitrate. pp. 455-471. In: G. M. Rand and S. R. Petrocelli (Eds.). Fundamentals of Aquatic Toxicology. Hemisphere Publishing, Washington. Scemes, E. and Cassola, A. 1995. Regulatory volume decrease in neurons of Aplysia brasiliana. J. Exp. Zool. 272:329-337. Shepherd, S.A. 1973. Studies on southern Australian abalone (genus Haliotis). I. Ecology of five sympatric species. Aust. J. Mar. Freshwat. Res. 24:217-257. Shepherd, S.A. 1975. Distribution, habitat and feeding habits of abalone. Aust. Fisheries. January 12-15. Shepherd, S.A. 1986. Studies on southern Australian abalone (genus Haliotis) VII. Aggregative behaviour of H. laevigata in relation to spawning. Mar. Biol. 90:231-236.

FRDC 97/323: Environmental requirements of abalone
146
Shepherd, S.A. and Laws, H.M., 1974. Studies on Australian abalone (genus Haliotis) II. Reproduction of five species. Aust. J. Mar. Freshw. Res. 25:49-62. Simkiss, K. 1988. Molluscan skin (excluding cephalopods). In: O. Brix (Ed.), The Mollusca (Vol 11); Form and function. Academic Press, London, pp 11-35. Smith, C.E., Brin, M. and Halver, J.E. 1974. Biochemical, physiological and pathological changes in pyridoxine-deficient rainbow trout (Salmo gairdneri). J. Fish. Res. Bd. Can. 31(12):1893-1898. Snieszko, S.F. 1974. The effects of environmental stress on the outbreaks of infectious diseases of fishes. J. Fish Biol. 6:197-208. Sokal, R. R. and J. F. Rohlf. 1995. Biometry. The Principles and Practice of Statistics in Biological Research. W.H. Freeman, New York. Soliman, A.K., Jauncey, K. and Roberts, R.J. 1987. Stability of L-ascorbic acid (vitamin c) and its forms in fish feeds during processing, storage and leaching. Aquaculture 60:73-83. Solórzano, L. 1969. Determination of ammonia in natural waters by the phenolhypochlorite method. Limnol. Oceanogr., 14:799-801. Somero, G. N. and Bowlus, R. D. 1983. Osmolytes and metabolic end product s of molluscs: the design of compatible solute systems. In: Hochachka, P. W. (Ed.), The Mollusca Vol. 2: Environmental Biochemistry and Physiology. Academic Press, New York, pp. 77-100. Spaargaren, D. and Haefner, P. 1987. The effect of environmental osmotic conditions on blood and tissue glucose levels in the brown shrimp, Crangon crangon. Comp. Biochem. Physiol 87A(4):1045-1050. Spicer, J., Hill, A., Taylor, A. and Strang, R. 1990. Effect of aerial exposure on concentrations of selected metabolites in blood of the Norwegian lobster Nephrops norvegicus (Crustacea; Nephropidae). Mar. Biol. 105:129-135. Sprague, J. B. 1969. Measurement of pollutant toxicity to fish. I. Bioassay methods for acute toxicity. Water Res., 3:793-821. Sprague, J. B. 1990. Aquatic toxicology. In: Schreck, C. B. and Moyle, P. B. (Eds.), Methods for Fish Biology. American Fisheries Society, Bethesda, Maryland, pp. 491-527. Storey, K.B. and Storey J.M. (1990) Metabolic rate depression and biochemical adaptation in anerobiosis, hibernation and estivation. Q. Rev. Biol. 65 (2), 145-174.

FRDC 97/323: Environmental requirements of abalone
147
Tahon, J.-P., Van Hoof, D., Vinckier, C., Witters, R., De Ley, M. and Lontie, R. 1988. The reaction of nitrite with the haemocyanin of Astacus astacus. Biochem. J. 249:891-896. Tarr, K. 1976. An analysis of water-content regulation in osmoconforming limpets (Mollusca: Patellacea). J. Exp. Zool. 201:259-268. Thurston, R.V. and Russo, R.C. 1981. Ammonia toxicity to fishes. Effect of pH on the toxicity of the un-ionized ammonia species. Environ. Sci. Technol. 15(7):837-840 Tomasso, J. R. 1996. Environmental requirements of aquaculture animals - a conceptual summary. World Aquaculture, 27(2):27-31. Tomasso, J. R. and Brune, D. E. 1991. Aquacultural water quality: the emergence of an applied discipline. In: Brune, D. E. and Tomasso, J. R. (Eds.), Aquaculture and Water Quality, World Aquaculture Society, Baton Rouge, pp. 11-20. Underwood, A. J. 1981. Techniques of analysis of variance in experimental marine biology and ecology. Oceanogr. Mar. Biol. Ann. Rev. 19:513-605. Voltzow, J. 1994. Gastropoda: prosobranchia. In: Harrison, F. W. and Kohn, A. J. (Eds.), Microscopic Anatomy of Invertebrates, Volume 5: Mollusca I. Wiley-Liss, Inc., pp. 111-252. Wasielesky, W., Jr., Bianchini, A., Santon, M. H. S. and Poersch, L. H. 1997. Tolerance of juvenile flatfish Paralichthys orbignyanus to acid stress. J. World Aquaculture Soc. 28(2):202-204. Weischer, M.L. 1965. Staffwechselphysiologische untersucheungen zur bedentung de haemocyanins bei Helix pomatia L. Zool. Beitr. 11:517-540. Weiss, R.F. 1970. The solubility of nitrogen, oxygen and argon in water and seawater. Deep Sea Res., 17:721-735. Wells, R.M.G. and Baldwin, J. 1995. A comparison of metabolic stress during air exposure in two species of New Zealand abalone, Haliotis iris and Haliotis australis: implications for the handling and shipping of live animals. Aquaculture, 134:361-370. Wells, R.M.G., Baldwin, J., Speed, S.R. and Weber, R.E. 1998. Haemocyanin function in the New Zealand abalones Haliotis iris and H. australis: relationships between oxygen-binding properties, muscle metabolism and habitat. Aust. J. Mar. Freshw. Res. 49:143-149. White, A., Handler, P., Smith, E.L., Hill, R.L. and Lehman, R.I. Principles of Biochemistry 6th edition 1978.
FRDC 97/323: Environmental requirements of abalone
148
Wickins, J. F. 1976. The tolerance of warmwater prawns to recirculated water. Aquaculture, 9:19-37. Wickins, J. F. 1983. Studies on marine biological filters. Model filters. Water Res. 17(12):1769-1780. Willmer, P. 1978. Sodium fluxes and exchange pumps: further correlates of osmotic conformity in the nerves of an estuarine bivalve (Mytilus edulis). J. Exp. Biol. 77:207-223. Willows, R. I. 1994. The ecological impact of different mechanisms of chronic sub-lethal toxicity on feeding and respiratory physiology. pp. 88-97. In: D. W. Sutcliffe (Ed.). Water Quality and Stress Indicators in Marine and Freshwater Ecosystems. Freshw. Biol. Assoc., 6-7 Sept. 1993, Edinburgh. White, H.I., Hecht, T. and Potgeiter, B. 1996. The effect of four anaesthetics on Haliotis midae and their suitability for application in commercial abalone culture. Aquaculture, 140, 145-151. Ye, X., Randall, D. J. and He, X. 1991. The effect of acid water on oxygen consumption, circulating catecholamines and blood ionic and acid-base status in rainbow trout (Salmo gairdneri, Richardson). Fish Physiol. Biochem. 9(1)23-30. Zall, D.M., Fisher, M.D. and Garner, Q.M. 1956. Photometric determination of chloride in water. Anal. Chem. 28: 1665-1678. Zar, J. H. 1996. Biostatistical Analyses. Prentice-Hall of Australia, Pty. Ltd., Sydney.

FRDC 97/323: Environmental requirements of abalone
149
12 APPENDICES 12.1 INTELLECTUAL PROPERTY The focus of this research was to conduct public domain research so that all stakeholders could benefit. No patents or commercial intellectual property have arisen from this project. All results will be widely disseminated. 12.2 STAFF Mr. Sam Boarder Fremantle Maritime Centre, 1 Fleet St., Fremantle, Western Australia. Dr. Christopher M. Burke School of Aquaculture, University of Tasmania, Locked Bag 1-370, Launceston, Tasmania, 7250. Ms. Elizabeth Cox School of Aquaculture, University of Tasmania, Locked Bag 1-370, Launceston, Tasmania, 7250. Mr. Miles Cropp Marine Shellfish Hatcheries, PO Box 45, Bicheno, Tasmania, 7215. Dr. Stephen J. Edwards School of Biomedical Sciences, University of Tasmania, Locked Bag 1-320, Launceston, Tasmania, 7250. Ms. Kylie Freeman School of Aquaculture, University of Tasmania, Locked Bag 1-370, Launceston, Tasmania, 7250. Dr. James O. Harris School of Aquaculture, University of Tasmania, Locked Bag 1-370, Launceston, Tasmania, 7250. Mr. Stephen M. Hindrum School of Aquaculture, University of Tasmania, Locked Bag 1-370, Launceston, Tasmania, 7250. Now ABTAS Seafoods, P.O.Box 382 Beauty Point 7270 Mr. Deon Johns School of Aquaculture, University of Tasmania, Locked Bag 1-370, Launceston, Tasmania, 7250. CRC for Aquaculture, Broadway, Sydney, 2007 Dr. Greg B. Maguire

FRDC 97/323: Environmental requirements of abalone
150
Fisheries Western Australia, Marine Research Laboratories, PO Box 20, North Beach, WA, 6020.


![The Novel ABALONE Photosensor Technology - sensl.comsensl.com/.../irp/2017_Ferenc_The_Novel_ABALONE_Photosensor_Technology.pdf · The novel ABALONE Photosensor Technology [1] has](https://img.dokumen.tips/doc/110x75/5d5a3f8888c993d7478bb96c/the-novel-abalone-photosensor-technology-sensl-the-novel-abalone-photosensor.jpg)