Embed Size (px)
Citation preview

ENVIRONMENTALMONTHLY REPORT
QHSSESM-HSSE-L4-410R0 19-09-2013
General Information
Company Name: Salalah Methanol Company L.L.C (SFZ)Ind. License No: Oman-MFG-LND-22/01/07-003
Activity: Methanol process / production & exportationTel. No:
23218800
Fax No:
23219478
No. of Employees: 255
Man-hours:
1631095.89 hrs
As on 31.10.2014
Reporting Period:
October-14
1.0 Permits and Approvals
Sr.No. Permit DescriptionPermit
No.Validity
DateRemarks / Status
1.1Environmental license to operate the sources of combustion 02/2014 26
thMarch 2017 Valid
1.2
Validity Certificate of firefighting equipment (Fire hydrants’’)من ا-3س/دفاع مدني
/423/2014
21st
October2016 Valid
1.3
Licensing the security and safety of SMCمن ا-3س/دفاع مدني
/423/2014 17th
July 2016 Valid
1.4
SMC Clinic License 1306
thDecember2015 Valid
1.5
Final Environmental Permit 88929
thOctober
2015 Valid
1.6
Discharge of treated water for irrigation 0/3/624
6th
September2015 Valid
1.7
License Of Climate Affairs 11/112/2013-ف .ظ 10
thFebruary2015 Valid
1.8
Re-using of treated water for irrigation 0/3/5987
thFebruary2015 Valid
1.9
Chemicals Warehouse Licenseمن 1-3س/دفاع مدني
/25/201319
thJanuary
2015 Valid

ENVIRONMENTALMONTHLY REPORT
QHSSESM-HSSE-L4-410R0 19-09-2013
2.0 Chemical Inventory
Chemical Name
Balance Qty.,(solid – kg;liquid – liter)
StorageDetails Permit No. Issue Date Expiry Date
2.1
2.2
APPENDIX-A: SMC-CHEMICAL CONCEPTION DETAILS:
Note: Nil = Nothing, zero
Appendix – B: Domestic waste and STP (Sewage) tankers trip sheet from contractor are attached.
3.0 Environmental Incidents
3.1 Spill/Release/Discharge to land
Nil 3.4 Accidental harmto animal species
Nil
3.2 Spill/Release/Discharge to water
Nil 3.5 Others (pls.specify)
Nil
3.3 Spill/Release/Discharge to atmosphere
Nil 3.6 RemarksNil
4.0 Resource Consumption
4.1 Domestic WaterConsumption
m3
1998.284.4 Power Consumption kWh
5994097.14
4.2 Process WaterConsumption
m3
127746.61.
4.5 Paper Consumption no. ofsheets 6000 Approx
4.3 Fuel Consumption Liter14200
(Diesel)
4.6 Remarks:
5.0 Waste Details
WasteSolid/Liquid
Quantity(solid – kg;liquid – liter)
Source of WasteContractor
NameDisposalMethod
5
Non-hazardous Waste Solid
32000 Kg
General Waste OIG To Salalah Municipality
waste collection site by
Trucks
5.1
STP Disposal
Liquid
155000 Gallons
Sewage Water khames Saeed
Mubarak & sons
TRDG.CO
To Salalah Sanitary
Drainage Services by Trucks
5.2Hazardous
Waste
Liquid NIL Used Oil SINAA
AL-ARABIA TRD.
& services
Lifting, transport
& disposed of sludge Oil
from SMC plant by trucks

ENVIRONMENTALMONTHLY REPORT
QHSSESM-HSSE-L4-410R0 19-09-2013
6.0 Ambient Air Quality (AAQ)
Parameters
EquipmentMake
EquipmentModel
GPS Location /UTM
Results,ug/m3
AveragingPeriod Remarks
6.1 ParticulateMatter 10(PM10)
Thermo
Scientific
FH 62C-14 E-818444, N-1875090 In Appendix-C
24 hrs
6.2 ParticulateMatter 2.5(PM2.5)
N/A N/A N/A
6.3 Sulfur Dioxide
(SO2)
Model 450i E-818444, N-1875090 In Appendix-C
6.4 Nitrogen Dioxide(NO2)
Model 17i E-818444, N-1875090 In Appendix-C
6.5 Nitrogen Oxide(NO)
Model 17i E-818444, N-1875090 In Appendix-C
6.6 Nitrogen oxidesNo& No2
(NOx)
Model 17i E-818444, N-1875090 In Appendix-C
6.7 Hydrogen sulfide(H2S)
Model 450i E-818444, N-1875090 In Appendix-C
6.8 Carbon monoxide(CO)
Model 48i E-818444, N-1875090 In Appendix-C
8 hrs6.9 Ozone (O3) Model 49i E-818444, N-1875090 In Appendix-C
6.9 HydrocarbonsNon-methane
(HCNM)
Model 55i E-818444, N-1875090 In Appendix-C
3 hrs
Appendix-C: AAQMS data report and Equipment's calibration report.
.
7.0 Flue Gas Quality (FGQ)
ParametersEquipment
Name/ModelUnit
Stack ID Stack ID Stack ID
RemarksAUX.
BOILER (A)
AUX.
BOILER (B) REFORMER
7.1 Nitrogen OxidesNO, NO2(NOx).
mg/m3 In Appendix-D
7.2 Sulfur Oxide SO, SO2, SO3
(Sox).mg/m
3 In Appendix-D
7.3 Carbon Monoxide (CO). mg/m3 In Appendix-D
7.4 Particulate Matter (PM10). mg/m3 In Appendix-D
APPENDIX-D: STACKS CALIBRATION & FLARED GASES REPORT:

ENVIRONMENTALMONTHLY REPORT
QHSSESM-HSSE-L4-410R0 19-09-2013
8.0 Noise Level
A. Environmental Noise
Monitoring Location/Description
GPS Location / UTM
MonitoringDate and Time Results dB (A) Remarks
Northing Easting Start Finish Leq Lmax
8.1
Site entry 819295.008 1876288.053
10.9.2014After 10:30AM
10.9.2014 57.9 58.1
8.2
Nr. Fence Discharge line 819405.29 1876181.83
10.9.2014 10.9.2014 60.5 61.1
8.3
Nr. Fence Product line 819520.874 1876059.3
10.9.2014 10.9.2014 65.5 65.8
8.4
Admin corner 819691.234 1875816.687
10.9.2014 10.9.2014 64.3 64.5
8.5
POS corner 819532.52 1875738.563
10.9.2014 10.9.2014 63.9 64.0
8.6
SMC South gate 819618.295 1875559.562
10.9.2014 10.9.2014 61.1 61.2
8.7
Desl. corner 819501.68 1875507.499
10.9.2014 10.9.2014 64.5 64.9
8.8
Electro Chlorination 819361.61 1875448.85
10.9.2014 10.9.2014 55.9 56.4
8.9PGSS 819167.925 1875379.768
10.9.2014 10.9.2014 57.2 57.5
8.10
South fence line 819060.72 1875487.59
10.9.2014 10.9.2014 61.5 61.7
8.11
UTM 818953.52 1875588.35
10.9.2014 10.9.2014 58.5 58.7
8.12
West Gate 818953.52 1875773.79
8.8.2014 8.8.2014 60.0 60.2
8.13
Nr. Wadi 818953.52 1876015.35
8.8.2014 8.8.2014 57.3 57.5
8.14
Gas Metering Station 818953.52 1876288.057
8.8.2014 8.8.2014 52.2 52.4
8.15
Octal side fence 819131.264 1876288.055
8.8.2014 8.8.2014 57.7 58.1
8.16
SW Out fall 819570.359 1876298.077
8.8.2014 8.8.2014 53.1 53.7

ENVIRONMENTALMONTHLY REPORT
QHSSESM-HSSE-L4-410R0 19-09-2013
8.17
SWI 819779.652 1874932.802
8.8.2014 8.8.2014Before 16:00PM
59.9 60.1
A. Occupational Noise
Monitoring Location/Description
ShiftDuration,
hrs. No. ofWorkers
Monitoring
Date and Time Results dB (A)Remarks
Start Finish Lex Leq
Fin Fan PR-5
12hrs 2 Approx 9.9.2014 After11:30 AM
9.9.2014
76 74.7
Fin Fan PR-4
12hrs 2 Approx 9.9.2014 9.9.2014
82 80.1
Plant Air
12hrs 2 Approx 9.9.2014 9.9.2014
81 79
Nitrogen
12hrs 2 Approx 9.9.2014 9.9.2014
83 81.6
Boiler
12hrs 2 Approx 9.9.2014 9.9.2014
82 80.4
STG
12hrs 2 Approx 9.9.2014 9.9.2014
83 81.2
Syn. Gas Compressor
12hrs 2 Approx 9.9.2014 9.9.2014
92 90
Feed Gas Compressor
12hrs 2 Approx 9.9.2014 9.9.2014
88 86.4
Desaturator.
12hrs 2 Approx 9.9.2014 9.9.2014
100 98.2
Reformer North
12hrs 2 Approx 9.9.2014 9.9.2014
103 100.6
Reformer South
12hrs 2 Approx 9.9.2014 9.9.2014
87 84.8
Electrical Workshop
8 hrs 4 Approx 9.9.2014 9.9.2014
59 59
Mechanical Workshop
8 hrs 4 Approx 9.9.2014 9.9.2014
61.2 61.2
Ware House
8 hrs 4 Approx 9.9.2014 9.9.2014
53.8 53.8
SWI
12hrs 2 Approx 9.9.2014 9.9.2014
65 61.5
SW Out fall
12hrs 2 Approx 9.9.2014 9.9.2014Before 16:00
59.2 59.2

ENVIRONMENTALMONTHLY REPORT
QHSSESM-HSSE-L4-410R0 19-09-2013
Attachments:
Attached N/A
MECA issued Environmental permits
• Chemical permits
Waste Manifest /proof or official receipt from contractor, andwastewater discharge analysis report
Monitoring equipment's calibration report
- Ambient Air Quality Monitoring Equipment
- Flue Gas Analyzer
- Noise Level Meter
Duly accomplished Climate Affairs Report based on form # 2
Declaration
I declare that all the given information in this report is true and correct.
Name & Signatureof Authorized Person
CompanyStamp
Date
For SFZ Official Use Only
Encoded by: Reviewed by:
Name: Name:
Signature/Date: Signature/Date:
Remarks:

ENVIRONMENTALMONTHLY REPORT
QHSSESM-HSSE-L4-410R0 19-09-2013
APPENDIX-A: .SMC-CHEMICAL CONCEPTION DETAILS:
System Chemical Consumption Closing Stock Remarks
Boiler Water
GE Cortrol OS 5601 190 780
GE Steamate NA 0880 1135 100
GE Optisperse HP 3100 195 120
Desalination Unit
Belgard EV2050 1600 640
Belite M8 40 240
Sodium Metabisulphite 310 750
Remineralization Unit
Calcium Chloride 150 600
Sodium Bicarbonate 200 1800
Calcium hypochlorite grans 20 205
Secondary CoolingWater
GE Spectrus NX 1164 (Sec CW Biocide) 0 23
GE Corrshield NT 4292 (Sec CW CorrosionInhibitor)
0 0
Fire Water GE Spectrus NX 1104 (Fire Water Biocide) 529 0
ETP/STP
GE Dearborn AE 1138 (Flocculant) 0 0
Klaraid IC 1176 (Coagulant) 790 2590
Phosphoric Acid 0 0
Calcium hypochlorite tablets 10 120
Sea Water Spectrus OX1201 0 420
DM PlantHydrochloric Acid 81300 60900
Caustic Soda 58630 39380
EDG/Fire Water/
Air CompressorDiesel (in litres) 14200 38000 Stock in 20-TK2902 (at EDG)
Nitrogen Plant Liquid Nitrogen (in litres) 0Only the Reciept & Consumption from the reciept isshown.

ENVIRONMENTALMONTHLY REPORT
QHSSESM-HSSE-L4-410R0 19-09-2013
APPENDIX-B: DOMESTIC WASTE & STP SEWAGE TANKERS TRIP SHEET FROM CONTRACTOR

ENVIRONMENTALMONTHLY REPORT
QHSSESM-HSSE-L4-410R0 19-09-2013

ENVIRONMENTALMONTHLY REPORT
QHSSESM-HSSE-L4-410R0 19-09-2013
APPENDIX-C: AAQMS DATA FOR THE MONTH OF OCT-14 & STACKS CALIBRATION REPORT.24hr Gaseous Gaseous & Dust
H2S_ug NO2_ug PM10 SO2_ug CO_ug NM_ug OZONE_ug
UG/M3 UG/M3 UG/M3 UG/M3 UG/M3 UG/M3 UG/M3
S.No. Date 24hr 24hr 24hr 24hr 00:00 08:00 16:00 00:00 03:00 06:00 09:00 12:00 15:00 18:00 21:00 00:00 08:00 16:00
1 10/1/2014 1.896 7.5 63.6 2.233 0.038 0.256 0.22 0 0 0 0 0 0 0 230 11.9 17.7 9.6
2 10/2/2014 2.006 8.1 78.8 2.473 0.009 0.047 -0.018 30 0 0 0 0 0 0 2 1.4 19.6 12.7
3 10/3/2014 2.098 9.3 71.3 2.618 0.032 0.043 0.003 0 0 0 0 0 0 0 0 2.8 14.9 7.6
4 10/4/2014 1.945 6.2 47 2.489 0.019 0.053 0.014 0 0 0 0 0 0 0 48 4 19.3 22.6
5 10/5/2014 2.16 7.4 51.5 2.375 0.033 0.058 0.018 0 0 0 0 0 0 0 0 3.5 17.7 11.8
6 10/6/2014 1.84 2.4 34.6 2.244 -0.008 0.024 -0.017 0 0 0 0 0 0 0 0 13 19.5 19.1
7 10/7/2014 2.555 0.8 33.1 2.228 -0.003 0.037 -0.024 0 0 0 0 0 0 0 0 14 17.9 17.2
8 10/8/2014 2.981 1.8 33.3 2.431 0.01 0.04 -0.012 0 0 0 0 0 0 0 0 12.8 13.9 13.1
9 10/9/2014 2.741 4 42.7 2.35 0.026 0.06 -0.007 0 0 0 0 0 0 0 0 8.3 17.1 20.1
10 10/10/2014 2.446 3.6 48.7 2.358 0.056 0.061 -0.007 0 14 0 0 0 0 0 0 6.5 21.4 27.7
11 10/11/2014 2.445 -0.4 38.8 2.282 0.004 0.055 0.003 0 0 0 0 0 0 0 0 21.9 20.8 21.9
12 10/12/2014 3.434 2.8 125.4 2.804 0.128 0.091 0.025 0 0 0 0 0 0 0 0 9.9 18.2 18
13 10/13/2014 3.79 4.6 104.9 3.193 0.119 0.094 0.032 0 0 0 0 0 0 0 0 8.6 19.5 17.9
14 10/14/2014 3.452 3.3 69.6 3.293 0.094 0.104 0.054 0 0 0 0 0 0 0 0 8.4 24.9 21.6
15 10/15/2014 2.864 6 78 2.894 0.105 0.12 0.053 0 0 0 0 0 0 0 0 8.5 31.6 22.6
16 10/16/2014 2.178 9.9 195.9 2.84 0.128 0.089 0.069 0 0 0 0 0 0 0 0 11 37.2 28
17 10/17/2014 2.148 8.9 150.4 3.076 0.114 0.105 0.068 0 0 0 0 0 0 0 0 7.3 37.5 33.4
18 10/18/2014 2.092 8.8 128.4 3.364 -0.029 -0.045 -0.064 0 6 0 0 0 0 0 0 12.2 40.5 30.7
19 10/19/2014 2.402 7.8 139.8 3.108 -0.065 -0.012 -0.046 0 0 0 0 0 0 0 0 11.1 36.5 41.3
20 10/20/2014 3.129 8.5 122.7 3.133 0.022 0.186 0.273 0 0 0 0 0 0 0 0 14.7 31.6 20
21 10/21/2014 2.163 12.5 107.5 3.052 0.265 0.331 0.231 0 0 0 0 0 0 0 0 8.1 38 23.3
22 10/22/2014 1.875 11.3 109.6 2.817 -0.061 0.002 -0.035 0 0 0 0 0 0 0 0 16.5 40.5 23.5
23 10/23/2014 2.63 17.3 112.5 3.06 -0.018 0.168 0.236 0 0 0 0 0 0 0 0 10.2 40.2 19.9
24 10/24/2014 2.005 22 214.2 3.162 0.015 -0.014 0.048 0 0 0 0 0 0 0 0 6.5 39.2 20.5
25 10/25/2014 1.938 20.9 154.5 3.411 0.063 0.003 0.045 0 0 13 0 0 0 0 0 11.6 35.8 19.3
26 10/26/2014 2.275 24.7 149.9 3.473 -0.095 -0.045 0.02 0 0 0 0 0 0 0 0 16.3 46 23.1
27 10/27/2014 2.174 23.6 208.2 3.222 -0.061 0.013 0 0 0 5 0 0 0 0 22 58.4 46.3
28 10/28/2014 1.521 8.2 206.1 1.414 0 0 0 0 0 0 0 0 29.8 50.6 55.3
29 10/29/2014 2.994 11.4 130.6 40.888 0 0 0 19 263 0 0 0 24.5 41.8 39
30 10/30/2014 0.511 16.8 139.6 0.501 0 0 0 0 0 0 0 0 28.4 41.8 25.8
10/31/2014 0.708 6.8 89 -0.043 0.146 0.029 0.046 48 8 0 0 0 0 0 0 5.2 34 37.7
Average 2.3030968 9.2516129 105.8129 3.8304194 0.0387857 0.06975 0.0454815 2.516129 0.9032258 0.4193548 0.7741935 8.483871 0 0 9.0322581 11.964516 30.43871 24.212903
Max 3.79 24.7 214.2 40.888 0.265 0.331 0.273 48 14 13 19 263 0 0 230 29.8 58.4 55.3
Min 0.511 -0.4 33.1 -0.043 -0.095 -0.045 -0.064 0 0 0 0 0 0 0 0 1.4 13.9 7.6
P= POWER FAILURE
HCNM issue is under investigation with technical team & vendor.For PM 10 high records this observation already noticed to SFZ on the amounts of sand east of the station next to the port of Salalah.

ENVIRONMENTALMONTHLY REPORT
QHSSESM-HSSE-L4-410R0 19-09-2013
Appendix-D: Stacks Data & Flared Gases Report: Stacks Data:
AUX. BOILER -A STACK AUX. BOILER -B STACK REFORMER STACK
Nox CO Sox PM10 Nox CO Sox PM10 Nox CO
Date
20AI25003AA.PV 20AI25003AB.PV 20AI25003AC.PV 20AI25004A.PV 20AI25003BA.PV 20AI25003BB.PV 20AI25003BC.PV 20AI25004B.PV 10AI12002A.PV 10AI12002B.PV
DACA.PV DACA.PV DACA.PV DACA.PV DACA.PV DACA.PV DACA.PV DACA.PV DACA.PV DACA.PV
mg/m3 mg/m3 mg/m3 mg/m3 mg/m3 mg/m3 mg/m3 mg/m3 mg/m3 mg/m3
0.15 0.05 0.035 0.1 0.15 0.05 0.035 0.1 0.15 0.05
01-Oct-14 0.095997851 0.003167876 0.001405492 0.001826941 0.08639867 0.00089565 0.000591425 0.019276487 0.107332286 0.005602944
02-Oct-14 0.095000023 0.005043364 -8.75576E-05 0.002909022 0.083223171 0.001122579 -0.000118395 0.031441143 0.105039152 0.005617977
03-Oct-14 0.092490577 0.007159887 -8.74296E-05 0.003387844 0.083676765 0.000572399 -4.9779E-05 0.031439863 0.101670719 0.005936168
04-Oct-14 0.087791915 0.008067559 0.000107211 0.003076419 0.08404672 0.000186317 -0.000121324 0.03155712 0.101442023 0.005888767
05-Oct-14 0.093941298 0.009171007 1.36043E-05 0.004039249 0.084234053 0.000537275 -0.000121565 0.031781168 0.101066891 0.006383067
06-Oct-14 0.081300231 0.008014881 0.000145963 0.004493549 0.081315467 0.000466713 -9.27383E-05 0.031948588 0.09977753 0.006268527
07-Oct-14 0.08727583 0.003257794 -8.66293E-05 0.002821914 0.084558911 0.000120005 -0.000120188 0.031575975 0.100260539 0.006184747
08-Oct-14 0.09506389 0.005790577 0.000116815 0.00199149 0.082959204 0.000350728 4.97445E-05 0.031403594 0.102096228 0.006228305
09-Oct-14 0.093928189 0.00508531 -8.81658E-05 0.002274904 0.084444015 -2.86317E-05 -0.000119788 0.031413518 0.102833599 0.005947358
10-Oct-14 0.094873243 0.005973053 1.33961E-05 0.00241749 0.083097967 0.000299998 -6.30157E-05 0.031463871 0.102862177 0.006267302
11-Oct-14 0.093410927 0.006268495 -8.73815E-05 0.002017453 0.084209459 0.000656069 -6.19754E-05 0.031556737 0.100669796 0.006966405
12-Oct-14 0.0926782 0.003507281 -4.48359E-05 0.002988767 0.086023107 0.000598929 -8.81127E-05 0.015691113 0.105616077 0.006705172
13-Oct-14 0.096159983 0.003827814 -7.28475E-05 0.003220223 0.085554947 0.001088871 -3.00921E-05 0.001964429 0.118835888 0.007102917
14-Oct-14 0.092923301 0.003249558 -5.83455E-05 0.002659607 0.084045936 0.000233134 -0.000114442 0.001938819 0.099043076 0.008115121
15-Oct-14 0.095163387 0.004077301 0.00028863 0.003665591 0.085812077 0.000120293 -7.16109E-05 0.001925503 0.099603979 0.008425748
16-Oct-14 0.10252399 0.003973722 0.000243827 0.003620356 0.089119833 0.000161828 -0.00011401 0.00196859 0.109819667 0.003603583
17-Oct-14 0.100851812 0.004908188 -7.65451E-05 0.004645356 0.089067903 0.000460375 -0.00011305 0.001966445 0.116199278 0.000716426
18-Oct-14 0.101223861 0.005788248 -6.15468E-05 0.004564971 0.090248916 0.000982057 -4.32168E-05 0.002005979 0.114806693 0.001514341
19-Oct-14 0.101165485 0.00589951 -8.91903E-05 0.002890422 0.089223974 0.000298125 -9.9925E-05 0.002036934 0.110276506 0.002009073
20-Oct-14 0.101769415 0.005740156 -8.68696E-05 0.002474667 0.087711996 -7.81764E-07 -0.000115386 0.001981011 0.10650436 0.002289227
21-Oct-14 0.103851237 0.004915799 -8.02114E-05 -6.48567E-06 0.085091941 -9.69123E-05 -0.000119068 0.001997433 0.100475666 0.002768422
22-Oct-14 0.100935119 0.007705249 8.28967E-06 0.001827071 0.087992543 0.000399105 -4.64979E-05 0.001982675 0.105621624 0.002555767
23-Oct-14 0.106811276 0.006073198 6.98194E-05 0.003501715 0.092645395 0.00078209 -2.91478E-05 0.001969679 0.11287534 0.002817433
24-Oct-14 0.109884427 0.007700087 4.38438E-06 0.00612107 0.094729953 0.000631796 -0.000114618 0.002044585 0.116404271 0.002775675
25-Oct-14 0.102181464 0.00536805 -8.93344E-05 0.004536895 0.094104604 0.000527287 5.57305E-05 0.002045033 0.113666847 0.003013376
26-Oct-14 0.099075317 0.001117957 0.000144987 0.003768609 0.099378267 0.000362828 -8.51357E-05 0.002003547 0.117876995 0.003018347
27-Oct-14 0.113018138 0.003195464 -5.93656E-07 0.003948332 0.098303971 0.000797023 -0.000113802 0.001973296 0.117795287 0.003055831
28-Oct-14 0.10331022 0.003571099 4.33925E-05 0.004021866 0.090948775 0.001220918 -0.00011457 0.001857287 0.11228575 0.002838805
29-Oct-14 0.09598816 0.004417666 -8.58131E-05 0.004603483 0.08758562 0.00114846 5.48022E-05 0.001960299 0.050816798 0.00091303
30-Oct-14 0.103159349 0.004002534 -8.61172E-05 0.00489666 0.088545129 0.000282736 -4.33288E-05 0.00197336 0.003145481 -0.000282064
31-Oct-14 0.104561104 0.00320915 -8.94143E-05 0.003058363 0.092417054 0.003726188 -4.35689E-05 0.001929792 0.053549754 0.000429043

ENVIRONMENTALMONTHLY REPORT
QHSSESM-HSSE-L4-410R0 19-09-2013
Flared Gases:
Date
(20FI33002.PV+20FI33003.PV)
( 24 hour - Average)
T/HR
01-Oct-14 0.218413486
02-Oct-14 0.226360209
03-Oct-14 0.23544948
04-Oct-14 0.238353085
05-Oct-14 0.238754266
06-Oct-14 0.24317163
07-Oct-14 0.242585915
08-Oct-14 0.24870585
09-Oct-14 0.253681369
10-Oct-14 0.254080197
11-Oct-14 0.254050862
12-Oct-14 0.2581617
13-Oct-14 0.258193123
14-Oct-14 0.260664466
15-Oct-14 0.261187851
16-Oct-14 0.264589875
17-Oct-14 0.265424214
18-Oct-14 0.272039346
19-Oct-14 0.270614869
20-Oct-14 0.277386232
21-Oct-14 0.276578471
22-Oct-14 0.270611073
23-Oct-14 0.274538603
24-Oct-14 0.288786053
25-Oct-14 0.278182219
26-Oct-14 0.285418706
27-Oct-14 0.291659483
28-Oct-14 0.295401342
29-Oct-14 0.297470624
30-Oct-14 0.294348413
31-Oct-14 0.289834483
SUM 8.184697496
MEAN 0.2640225
MAX 0.297470624
MIN 0.218413486

ENVIRONMENTALMONTHLY REPORT
QHSSESM-HSSE-L4-410R0 19-09-2013
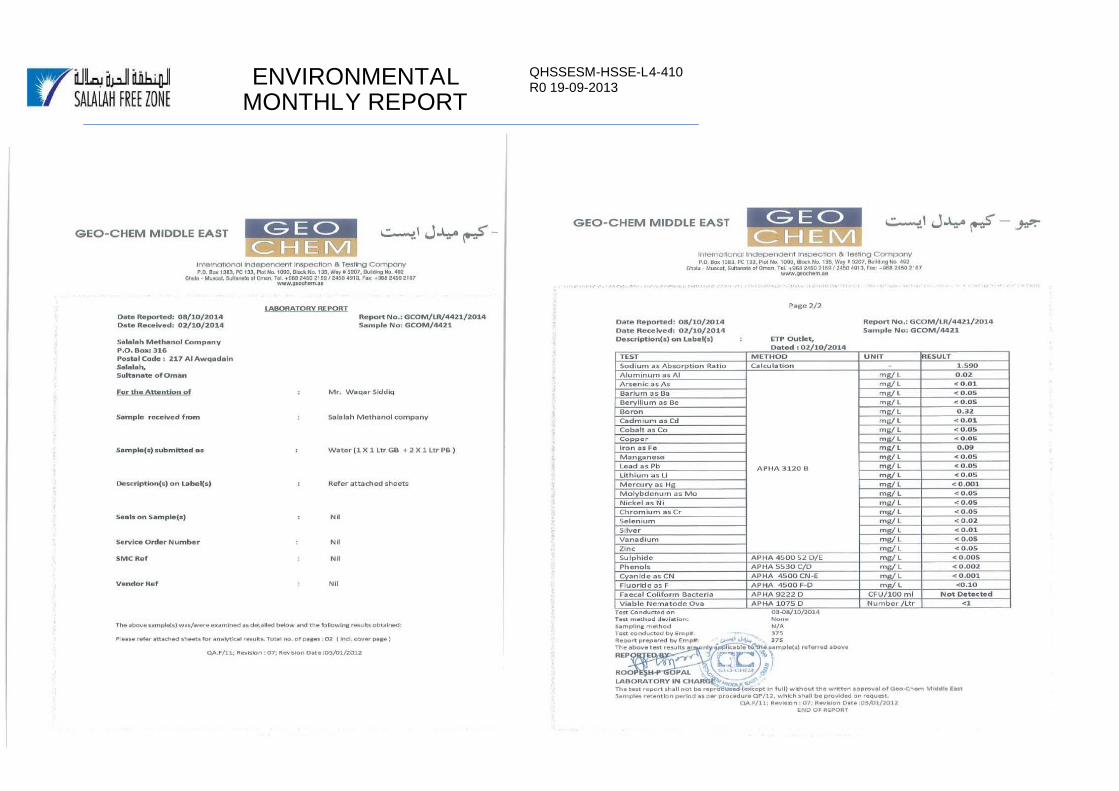
APPENDIX-E: THIRD PARTY REPORT OF SEA WATER INTAKE MARINE WATER OUTFALL AND ETP (GO - CHEM.):

ENVIRONMENTALMONTHLY REPORT
QHSSESM-HSSE-L4-410R0 19-09-2013

ENVIRONMENTALMONTHLY REPORT
QHSSESM-HSSE-L4-410R0 19-09-2013
ENVIRONMENTALMONTHLY REPORT
QHSSESM-HSSE-L4-410R0 19-09-2013

ENVIRONMENTALMONTHLY REPORT
QHSSESM-HSSE-L4-410R0 19-09-2013
Appendix-F: SMC-Lab test of ETP and marine out fall:
MARINE WATER OUTFALL:
MARINE WATER OUTFALL
DATEpH Temperature TSS Oil & Grease
- °C mg/liter mg/liter
STD Values 6.0 - 9.0Not greater than 10°c above the
ambient receiving sea watertemperature
Max. 30 Max.15
1-Oct-2014 7.75 28.8 13 NT
2-Oct-2014 7.77 28.8 12 NT
3-Oct-2014 7.70 29.0 14 NT
4-Oct-2014 7.78 29.8 13 NT
5-Oct-2014 7.70 28.0 12 NT
6-Oct-2014 7.80 30.0 12 NT
7-Oct-2014 7.76 32.0 13 NT
8-Oct-2014 7.70 31.0 12 NT
9-Oct-2014 7.74 29.0 11 NT
10-Oct-2014 7.69 29.0 12 NT
11-Oct-2014 7.70 29.7 11 NT
12-Oct-2014 7.67 31.9 12 NT
13-Oct-2014 7.90 31.6 11 NT
14-Oct-2014 7.92 31.2 12 NT
15-Oct-2014 7.93 30.0 13 NT
16-Oct-2014 7.90 32.0 12 NT
17-Oct-2014 7.88 32.0 12 NT
18-Oct-2014 7.82 33.4 11 NT
19-Oct-2014 7.78 30.2 12 NT
20-Oct-2014 7.75 31.3 12 NT
21-Oct-2014 7.83 30.0 14 NT
22-Oct-2014 7.86 30.5 14 NT
23-Oct-2014 7.83 30.0 13 NT
24-Oct-2014 7.85 30.0 13 NT
25-Oct-2014 7.80 31.0 12 NT
26-Oct-2014 7.84 31.0 12 NT
27-Oct-2014 7.90 33.2 11 NT
28-Oct-2014 7.82 33.8 12 NT
29-Oct-2014 7.73 33.9 12 NT
30-Oct-2014 7.88 31.0 13 NT
31-Oct-2014 7.82 31.0 13 NT
ENVIRONMENTALMONTHLY REPORT
QHSSESM-HSSE-L4-410R0 19-09-2013
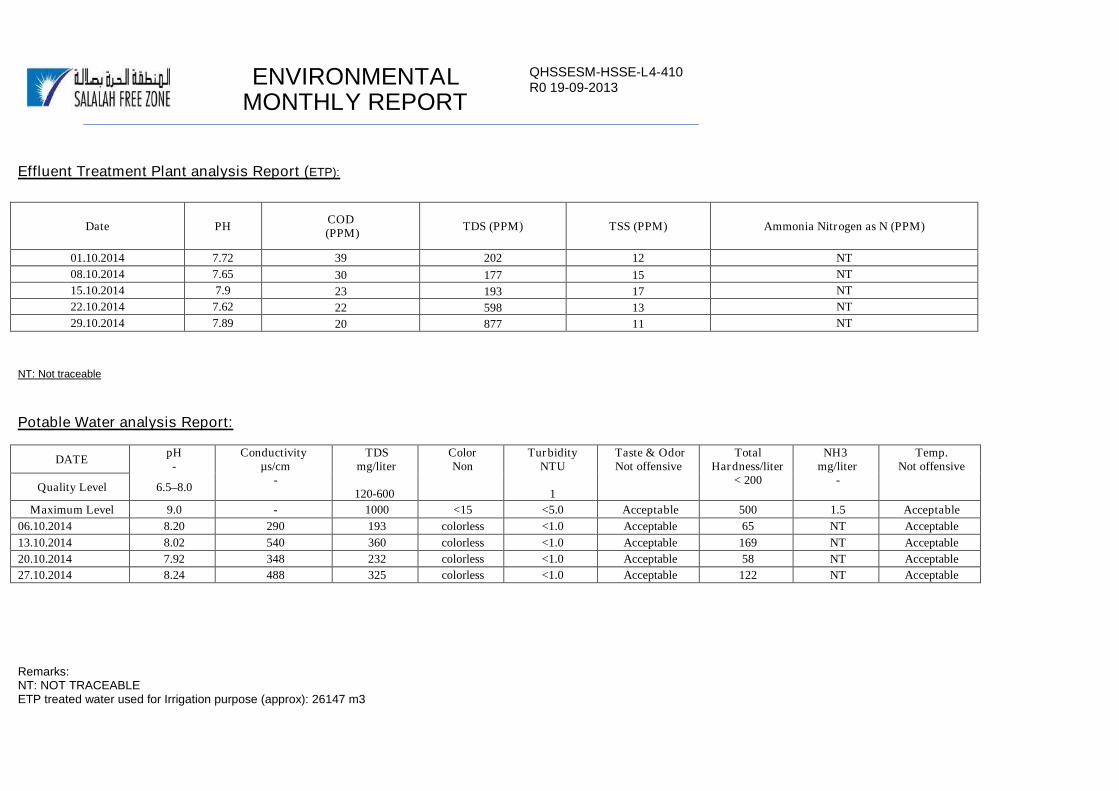
Effluent Treatment Plant analysis Report (ETP):
NT: Not traceable
Potable Water analysis Report:
Remarks:NT: NOT TRACEABLEETP treated water used for Irrigation purpose (approx): 26147 m3
Date PHCOD(PPM)
TDS (PPM) TSS (PPM) Ammonia Nitrogen as N (PPM)
01.10.2014 7.72 39 202 12 NT
08.10.2014 7.65 30 177 15 NT
15.10.2014 7.9 23 193 17 NT
22.10.2014 7.62 22 598 13 NT
29.10.2014 7.89 20 877 11 NT
DATEpH-
Conductivityµs/cm
-
TDSmg/liter
120-600
ColorNon
TurbidityNTU
1
Taste & OdorNot offensive
TotalHardness/liter
< 200
NH3mg/liter
-
Temp.Not offensive
Quality Level 6.5–8.0
Maximum Level 9.0 - 1000 <15 <5.0 Acceptable 500 1.5 Acceptable
06.10.2014 8.20 290 193 colorless <1.0 Acceptable 65 NT Acceptable
13.10.2014 8.02 540 360 colorless <1.0 Acceptable 169 NT Acceptable
20.10.2014 7.92 348 232 colorless <1.0 Acceptable 58 NT Acceptable
27.10.2014 8.24 488 325 colorless <1.0 Acceptable 122 NT Acceptable


