Embed Size (px)
Citation preview

1
Environmental Policy Tools and
Firm-level Management Practices in Hungary
Dr. Sándor Kerekes, Gábor Harangozó, Patrícia Németh, Ágnes Nemcsicsné Zsóka Budapest University of Economic Sciences and Public Administration (BUESPA)
Department of Environmental Economics and Technology
in cooperation with OECD Environment Directorate
The views expressed in this report are those of the authors and do not necessarily reflect those of the institutes with which they are affiliated, or the OECD.

2
TABLE OF CONTENTS
ENVIRONMENTAL POLICY TOOLS AND ................................................................. 1
FIRM-LEVEL MANAGEMENT PRACTICES IN HUNGARY .................................. 1
TABLE OF CONTENTS...................................................................................................... 2
1. INTRODUCTION .............................................................................................................. 4
2. OVERVIEW OF THE SAMPLE .................................................................................... 5
3. CHARACTERISTICS OF HUNGARIAN ENVIRONMENTAL POLICY ........ 12
3.1. The Costs of Environmental Approximation ........................................................ 12 EU Legislation that requires Private Sector Investments ........................................ 13
3.2. Environmental Policy Tools..................................................................................... 14 Product fee and/or fee for the use of the environment? ........................................... 15
3.3. Perspectives for the Hungarian industry and its environmental consequences16
Financial obstacles in cleaner production investments at SMEs ........................... 17 Missing public and regulatory pressure ...................................................................... 18
Unmatched demand and supply for environmental technologies .......................... 18
4. ENVIRONMENTAL MANAGEMENT AND PERFORMANCE ........................ 20
4.1. Environmental management systems and tools.................................................... 20
4.2 Environmental measures, innovation and performance ............................... 30
5. INFLUENCE OF STAKEHOLDERS AND IMPORTANCE OF MOTIVATIONS ................................................................................................................... 37
5.1. Environmental stakeholders ..................................................................................... 37
5.2. Environmental motives ............................................................................................. 40
5.3. Environmental obstacles ........................................................................................... 41
6. THE ROLE OF PUBLIC ENVIRONMENTAL POLICY ....................................... 43
7. ENVIRONMENTAL AND COMMERCIAL PERFORMANCE .......................... 47

3
8. CONCLUSIONS .............................................................................................................. 49
REFERENCES ...................................................................................................................... 51

4
1. INTRODUCTION
The objective of this report is to explore companies’ commercial motivations, decision-making procedures, and organisational structure when designing and implementing environmental policy. On one hand, companies are under regulatory pressure regarding their environmental activity, but on the other hand, the growing importance of voluntary initiatives is also influencing corporate environmental performance. In particular, the introduction of environmental management as a voluntary decision is expected to help firms reduce their environmental impacts significantly. This survey was designed to assess the determinants of the probability of their adoption (including public policy determinants), as well their potential benefits. We structured our study in order to examine the importance and nature of the following issues:
• Overview of the sample (Chapter 2) • A brief overview of Hungarian environmental policy (Chapter 3) • The role of environmental management practices (Chapter 4) • The influence of a certified environmental management system (EMS) on corporate environmental
performance (Chapter 4) • The role of stakeholders in firms’ environmental activity (Chapter 5) • An assessment of environmental policy instruments (Chapter 6) • The use of environmental policies and programmes to encourage EMS (Chapter 6) • The relationship between economic and environmental performance (Chapter 7)
5
2. OVERVIEW OF THE SAMPLE
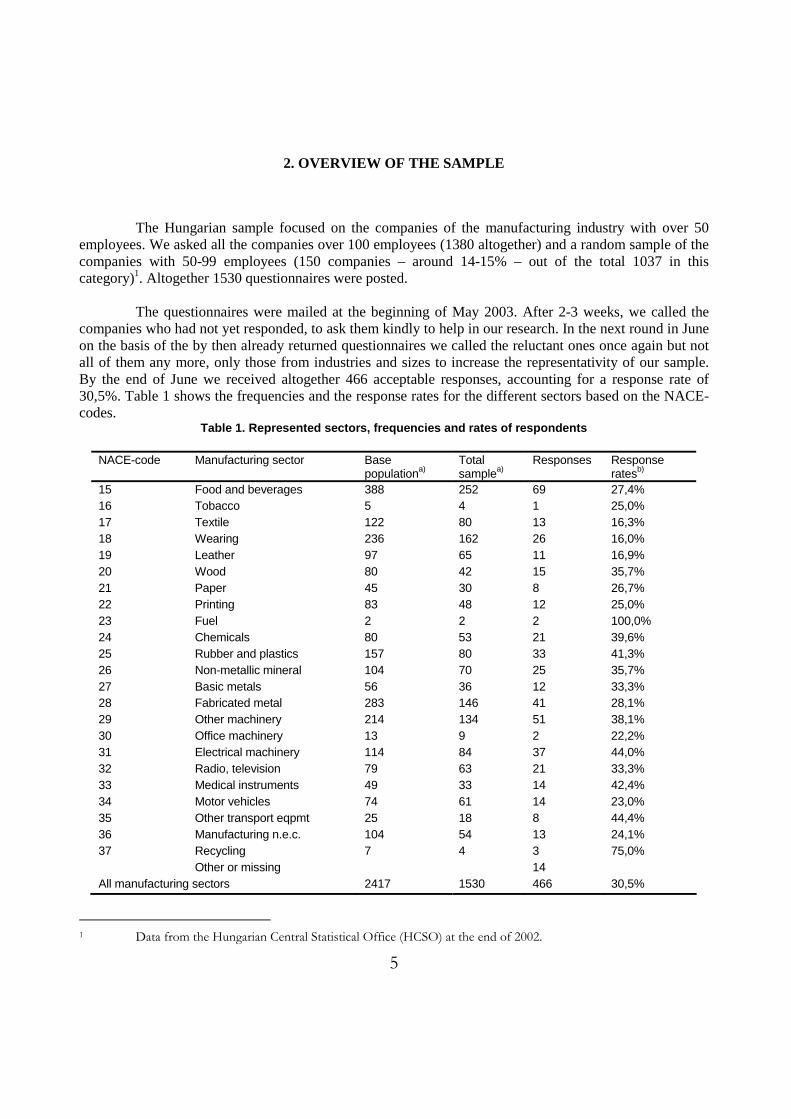
The Hungarian sample focused on the companies of the manufacturing industry with over 50 employees. We asked all the companies over 100 employees (1380 altogether) and a random sample of the companies with 50-99 employees (150 companies – around 14-15% – out of the total 1037 in this category)1. Altogether 1530 questionnaires were posted. The questionnaires were mailed at the beginning of May 2003. After 2-3 weeks, we called the companies who had not yet responded, to ask them kindly to help in our research. In the next round in June on the basis of the by then already returned questionnaires we called the reluctant ones once again but not all of them any more, only those from industries and sizes to increase the representativity of our sample. By the end of June we received altogether 466 acceptable responses, accounting for a response rate of 30,5%. Table 1 shows the frequencies and the response rates for the different sectors based on the NACE-codes.
Table 1. Represented sectors, frequencies and rates of respondents
NACE-code Manufacturing sector Base populationa)
Total samplea)
Responses Response ratesb)
15 Food and beverages 388 252 69 27,4% 16 Tobacco 5 4 1 25,0% 17 Textile 122 80 13 16,3% 18 Wearing 236 162 26 16,0% 19 Leather 97 65 11 16,9% 20 Wood 80 42 15 35,7% 21 Paper 45 30 8 26,7% 22 Printing 83 48 12 25,0% 23 Fuel 2 2 2 100,0% 24 Chemicals 80 53 21 39,6% 25 Rubber and plastics 157 80 33 41,3% 26 Non-metallic mineral 104 70 25 35,7% 27 Basic metals 56 36 12 33,3% 28 Fabricated metal 283 146 41 28,1% 29 Other machinery 214 134 51 38,1% 30 Office machinery 13 9 2 22,2% 31 Electrical machinery 114 84 37 44,0% 32 Radio, television 79 63 21 33,3% 33 Medical instruments 49 33 14 42,4% 34 Motor vehicles 74 61 14 23,0% 35 Other transport eqpmt 25 18 8 44,4% 36 Manufacturing n.e.c. 104 54 13 24,1% 37 Recycling 7 4 3 75,0% Other or missing 14 All manufacturing sectors 2417 1530 466 30,5%
1 Data from the Hungarian Central Statistical Office (HCSO) at the end of 2002.

6
a) As mentioned the total sample is the base population for firms with 100 or more employees, and thus the difference is attributable to firms with 50-99 employees who were not in the sample.b) Response rate: responses compared to the total sample.
As we can see from the data, in most of the sectors the response rate was well over 20% (in some cases 40% or more). Only in three sectors (the textile, wearing apparel and leather industries) was the response rate lower (16-17%) but even in these three relatively similar sectors we received 50 responses. For ease of comparison, we aggregated some sectoral categories and will use these as independent variable in the following analysis. Figure 1 shows the distribution of the base population and the total sample. This comparison can help to review how our responses represent the total population.
Figure 1. Distribution of the different populations by sectors
15%
11%
8%
12%
6%
12%
28%
5%
4%
17%
20%
8%
9%
5%
12%
21%
5%
4%
16%
19%
9%
10%
4%
14%
5%
19%
4%
0% 10% 20% 30%
15-16 Food, beverage andtobacco
17-19 Textiles, leatherand footwear
20-22 Wood, paper andprinting
23-25 Chemicals
26 Other non-metallicmineral
27-28 Basic andfabricated metals
29-33 Machinery andequipment
34-35 Transportequipment
36-37 N.e.c. and recycling
Responses Sample Ground population
7
As can be seen, in most cases the relative frequencies within the responses are very similar to those of the ground population and the total sample. However, the textile industry is under- represented (11% instead of 19%). This lower response rate also corresponds to our findings that this sector might perceive the environmental challenge less serious than the others. On the other hand the machinery industry seems to be a bit over-represented (28% instead of 19%). Altogether we can say that the responses cover representatively the total population of the Hungarian manufacturing companies regarding industrial sectors2. After examining the distribution by sector Table 2 represents some figures about the frequencies and distributions by size of the companies3.
Table 2. Number of respondents by size of the companies
No. of employees
Ground population (Xi)
Total sample (Ni)
Responses (ni)
Response rates (ni/Ni)
Ground population (Xi/X)
Total sample (Ni/N)
Responses
(ni/n)a)
R – TS (Ni/N - ni/n)b)
50-99 1037 150 31 20,7% 42,9% 9,8% 7,0% -2,9% 100-249 805 805 200 24,8% 33,3% 52,6% 44,8% -7,8% 250-999 497 497 186 37,4% 20,6% 32,5% 41,7% 9,2% >1000 78 78 29 37,2% 3,2% 5,1% 6,5% 1,4% Missing 20 Total 2417 1530 466 30,5% 100,0% 100,0% 100,0% 0,0%
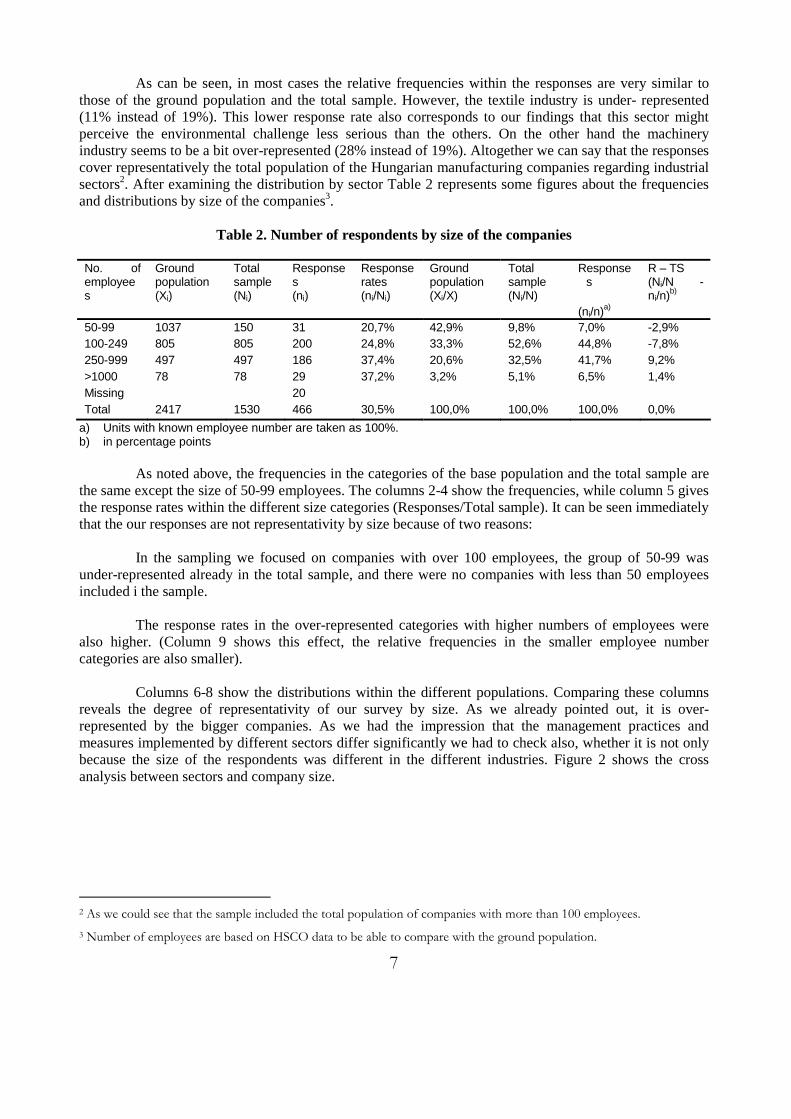
a) Units with known employee number are taken as 100%. b) in percentage points As noted above, the frequencies in the categories of the base population and the total sample are the same except the size of 50-99 employees. The columns 2-4 show the frequencies, while column 5 gives the response rates within the different size categories (Responses/Total sample). It can be seen immediately that the our responses are not representativity by size because of two reasons: In the sampling we focused on companies with over 100 employees, the group of 50-99 was under-represented already in the total sample, and there were no companies with less than 50 employees included i the sample. The response rates in the over-represented categories with higher numbers of employees were also higher. (Column 9 shows this effect, the relative frequencies in the smaller employee number categories are also smaller). Columns 6-8 show the distributions within the different populations. Comparing these columns reveals the degree of representativity of our survey by size. As we already pointed out, it is over-represented by the bigger companies. As we had the impression that the management practices and measures implemented by different sectors differ significantly we had to check also, whether it is not only because the size of the respondents was different in the different industries. Figure 2 shows the cross analysis between sectors and company size.
2 As we could see that the sample included the total population of companies with more than 100 employees. 3 Number of employees are based on HSCO data to be able to compare with the ground population.
8
Figure 2. Distribution of the company size in the different sectors among the respondents
9%
6%
15%
4%
8%
8%
6%
0%
0%
7%
46%
38%
53%
35%
38%
44%
39%
79%
33%
43%
9%
2%
3%
9%
13%
6%
6%
5%
0%
6%
36%
54%
29%
53%
42%
42%
16%
67%
44%
49%
0% 20% 40% 60% 80% 100%
15-16 Food,beverage, tobacco
17-19 Textiles,leather, footwear
20-22 Wood, paper,printing
23-25 Chemicals
26 Other non-metallic mineral
27-28 Basic andfabricated metals
29-33 Machineryand equipment
34-35 Transportequipment
36-37 N.e.c. andrecycling
Other and missing
1000- empl.
250-999 empl.
100-249 empl.
50-99 empl.
The figures (and also the subsequent statistical analysis) show that there is no significant connection between distribution by sector and size, so we can evaluate our findings separately. Thus far we have taken company level data as the basis of comparison with the characteristics of the base population. Figure 3 shows the distribution of the respondents by facility size (we did not have any data about the facility size of the ground population to compare). Around 10% of the responding facilities have 50-99 employees, 44% between 100 and 249, 39% of them between 250 and 999, 7% over 1000.

9
Figure 3.Distribution of the respondents by facility size
10,5%
22,6% 22,6%
44,3%
0%
10%
20%
30%
40%
50%
50-99 a) 100-249 250-499 500-
a) Very few facilities reported to have between 30-50 employees (where the company had more than 50 employees), they are also listed in this category.
Figure 4. Spatial scope of the market of the facilites
3,1%
45,4%35,5%
16,0%
0%
10%
20%
30%
40%
50%
local national regional global
Figure 4 summarises the primary spatial scope of market of the respondents. Over 61% reported to focus on international (regional and global) markets and only 3% considered the local market as the most important.

10
Figure 5. Primary customers of the responding facilities
53%
36%
10%1%
0%
10%
20%
30%
40%
50%
60%
othermanufacturing
firms
wholesailers orretailers
households other facilitieswithin the firm
We can see in Figure 5 that the majority of the facilities mainly produce their output for downstream manufacturing processes (53% for other firms and 1% for other facilities within the same firm). 36% of the respondents have trading companies as the major customers, and only 10% the households themselves.
Figure 6. Changes in the values of shipments of the respondents in the last 3 years
6,2%
24,4% 24,2%
35,9%
9,3%
0%
10%
20%
30%
40%
significantlydecreased
decreased stayed thesame
increased significantlyincreased
11
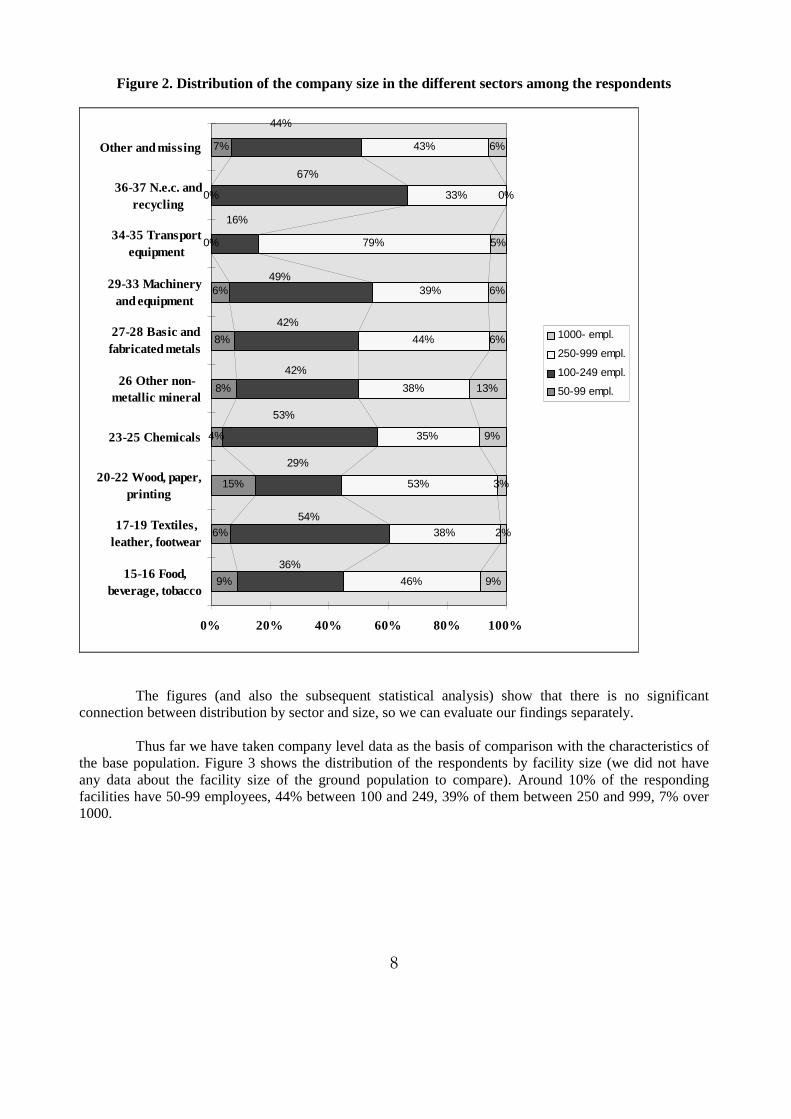
Figure 7. Overall business performance of the responding facilities
3,8%12,8%
7,4%
59,3%
16,8%
0%
20%
40%
60%
large losses insufficient tocover costs
break even small profit well in excess ofcosts
Figures 6 and 7 provide a summary of the economic performance of the responding facilities. 45% of the respondents have increased their shipments in the last 3 years, while in 31% of the cases it decreased, and in 24% remained unchanged. 77% of the facilities reported to be profitable and only around 17% of them had losses, and 7% of them broke even. These data indicate a relatively stable state for the manufacturing industry.

12
3. CHARACTERISTICS OF HUNGARIAN ENVIRONMENTAL POLICY
In recent years Hungary has made considerable progress towards aligning its laws and institutions with the EU. It has had a new framework Environmental Act since 1995 and published a medium term programme for national environment in 1997, and the second one in 2003. However, the field of environment presents particular challenges for several reasons. First, the scale and scope of the EU legislation concerning environment is broad, by its very nature it touches on all sectors of the economy and all sections of society. Compliance requires substantial investment. Hungary would make these or similar investments at some stage in the future, even without the imperative of EU directives. Accession accelerates the investments and reduces the scope for flexibility. Second, the benefits of the necessary investments will only be seen in the very long term. The costs will, however, affect each Hungarian household. The public will need to be convinced that the investments will bring tangible benefits in terms of improved services, better health, amenity or productivity outcomes. In the short term, environmental investment may have to be considered a price of joining the Union. Third, the requirements of EU directives, particularly as they relate to transboundary environmental impacts, do not necessarily correspond with Hungary’s immediate national priorities at this stage in its development. The challenge is to identify actions which will have both domestic and transboundary benefits and, where this is not possible, to clearly delineate the trade-offs that are being made. Fourth, the expenditure programmes required to upgrade infrastructure could exacerbate existing regional disparities in income and employment. Therefore capital programmes should be examined carefully for their local and regional as well as their national costs and benefits.
3.1. The Costs of Environmental Approximation
In the last few years Hungary has devoted around 1% of its GDP to capital investment for environmental purposes from both the public and private sectors. A further 0.6% of GDP has been devoted to current environmental expenditure or operating expenses. A recent study has estimated that if Hungary were to continue these levels of expenditure and GDP grows at 3-4% a year, Hungary could reach full compliance with EU directives by 2010. These estimates seem highly optimistic, for a number of reasons. First, the estimates of the additional costs of compliance do not include the costs of operation and maintenance, which are extremely high. Second, the expenditure estimates assume that there is no future change in per capita resource consumption or pollution production, and these assumptions have enormous effects on estimates of investment requirements. Evidence from other countries suggests that both of these indicators are strongly
13
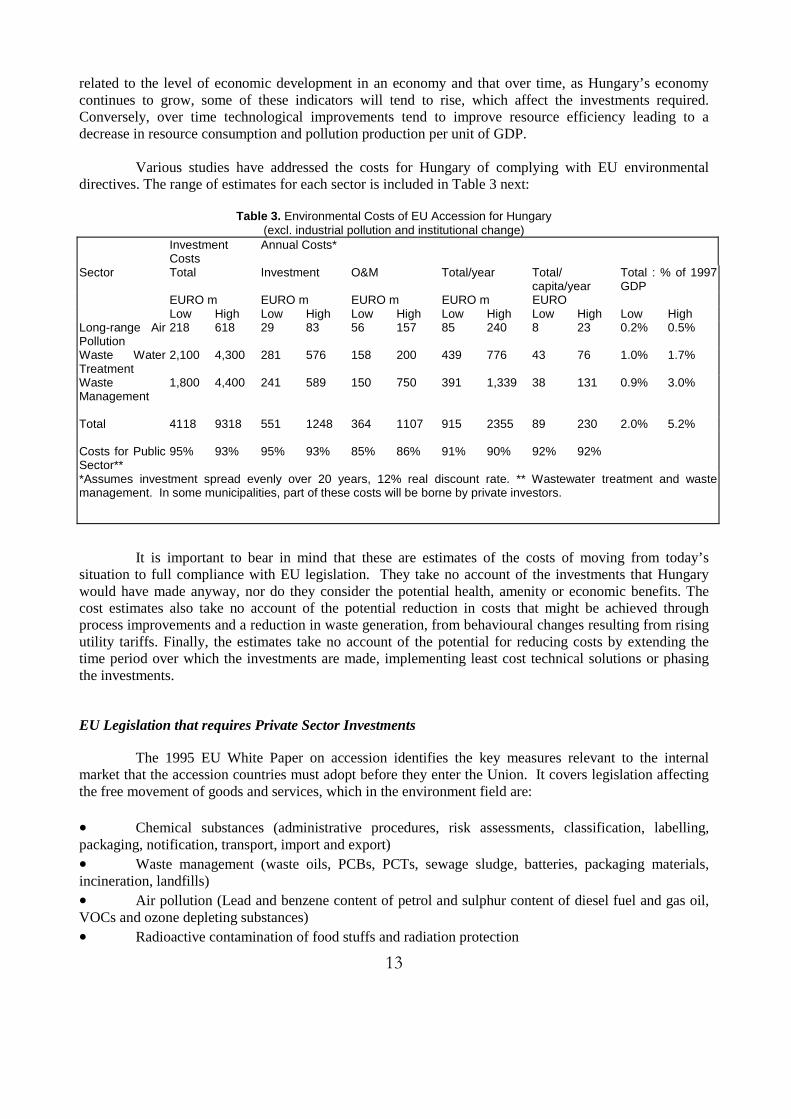
related to the level of economic development in an economy and that over time, as Hungary’s economy continues to grow, some of these indicators will tend to rise, which affect the investments required. Conversely, over time technological improvements tend to improve resource efficiency leading to a decrease in resource consumption and pollution production per unit of GDP. Various studies have addressed the costs for Hungary of complying with EU environmental directives. The range of estimates for each sector is included in Table 3 next:
Table 3. Environmental Costs of EU Accession for Hungary (excl. industrial pollution and institutional change)
Investment Costs
Annual Costs*
Sector Total Investment O&M Total/year Total/ capita/year
Total : % of 1997 GDP
EURO m EURO m EURO m EURO m EURO Low High Low High Low High Low High Low High Low High Long-range Air Pollution
218 618 29 83 56 157 85 240 8 23 0.2% 0.5%
Waste Water Treatment
2,100 4,300 281 576 158 200 439 776 43 76 1.0% 1.7%
Waste Management
1,800 4,400 241 589 150 750 391 1,339 38 131 0.9% 3.0%
Total 4118 9318 551 1248 364 1107 915 2355 89 230 2.0% 5.2% Costs for Public Sector**
95% 93% 95% 93% 85% 86% 91% 90% 92% 92%
*Assumes investment spread evenly over 20 years, 12% real discount rate. ** Wastewater treatment and waste management. In some municipalities, part of these costs will be borne by private investors.
It is important to bear in mind that these are estimates of the costs of moving from today’s situation to full compliance with EU legislation. They take no account of the investments that Hungary would have made anyway, nor do they consider the potential health, amenity or economic benefits. The cost estimates also take no account of the potential reduction in costs that might be achieved through process improvements and a reduction in waste generation, from behavioural changes resulting from rising utility tariffs. Finally, the estimates take no account of the potential for reducing costs by extending the time period over which the investments are made, implementing least cost technical solutions or phasing the investments.
EU Legislation that requires Private Sector Investments
The 1995 EU White Paper on accession identifies the key measures relevant to the internal market that the accession countries must adopt before they enter the Union. It covers legislation affecting the free movement of goods and services, which in the environment field are: • Chemical substances (administrative procedures, risk assessments, classification, labelling, packaging, notification, transport, import and export) • Waste management (waste oils, PCBs, PCTs, sewage sludge, batteries, packaging materials, incineration, landfills) • Air pollution (Lead and benzene content of petrol and sulphur content of diesel fuel and gas oil, VOCs and ozone depleting substances) • Radioactive contamination of food stuffs and radiation protection
14
The Hungarian 1995 Act on Environmental Protection contains principles which are similar to those of IPPC, including the requirement to obtain permits, the scope of installations covered and the use of best available techniques. For new greenfield sites the permitting process is similar to that specified by the EU legislation, but Hungary will need to change its procedures so that all existing processes are required to apply for the new type permits. Of Hungary’s 50,000 point sources of industrial pollution, around 400-500 are expected to fall within the scope of the new Hungarian legislation to implement IPPC. The Hungarian National Environment Programme identifies ‘processing industry’, which includes chemicals, engineering, food manufacturing and light industry, as the major problem sector. The most important sectors of ‘processing industry’ in terms of contribution to economic value-added are (in descending order) the engineering industry, the food manufacturing industry, and the chemical sector. However, in terms of their polluting potential, the chemicals industry, which in Hungary includes the pesticides, petrochemicals, cosmetics, pharmaceuticals and plastics sectors, has the highest pollution potential per unit of output. In Hungary, output from these sectors is highly concentrated with a large proportion being accounted for by a few firms. Moreover, since privatisation, foreign companies, which now own a high proportion of the sector, have injected significant amounts of capital to improve production facilities suggesting that additional environmental compliance costs to conform with EU standards will not be great. The same can be said of the vehicle and vehicle parts manufacturing sector, which although less concentrated has a high proportion of foreign ownership and received a significant amount of new capital investment. The main concern in future is not that companies will have difficulties complying with IPPC, as these are primarily large, principally foreign owned enterprises. Rather, the concern is that other environmental legislation and improved enforcement will place a burden on small and medium sized enterprises.
3.2. Environmental Policy Tools
As environmental protection requirements became stricter, the claim to improve the cost- efficiency of environmental protection has gained more field. In the past ten years, as one of such tools, so-called indirect or economic tools played an important role in handling externalities. These tools gained field especially fast in the Hungarian environment policy. Given the country’s development level of economic tools, product fees implemented in environmental policy at first were applied with the express aim to generate revenues. Compared to international experience, the product fee legislation elaborated for fuels, storage batteries car tires and packaging materials has triggered less resistance than expected. Perhaps because they were introduced when the economy was in a phase of depression, when revenues from product fees seemed to have a marginal significance in the state budget and when financing environment protection from other tax revenues did not seemed realistic. The situation is best described by the fact that at that time the budget for environment protection amounted to about 0.5 % of GDP. In its present form, the packaging product fee does not serve adequately either environmental or economic efficiency, partly because in the absence of price flexibility the fee does not urge to take back the lavish consumption of packaging materials, and partly because economic efficiency also deteriorates as an outcome of budget centralisation and redistribution later.

15
It is a shortcoming of the packaging product fee that it is discriminating in the sense that the products of other activities, causing eventually larger environmental loads - construction materials, metallurgical products, chemical products, paints, etc. do not come under the effect of the product fee. While we do not contest that it is justified to pay a price for the use of the environment (either as a source for raw materials, or accommodating waste) it is our conviction that it is unjustified to name some of the actors in the economy who are made pay for the use of the environment while others remain unaffected by this burden. This discriminating selection will unavoidably lead to structural consequences. It takes away resources from industrial sectors the products of which are liable for product fee and because a large chunk of the product fee is redistributed in the form of subsidy, and with the subsidy it keeps alive activities that would perhaps be unprofitable according to market logic, deteriorating thereby the productive capacity of the economy. For the practice, the logic in the calculation of the product fee for packaging materials is convincing and even perhaps sufficient as well, while in a theoretical context it is unfortunate to contract external marginal costs justifying taxation with two marginal cost elements that are destined to cover the costs of genuine activities. The product fee imposed on fuels demonstrates best that the product fee is not efficient in terms of the environment either, because its impact on fuel consumption is negligible. Its environment protecting yield has a significance beyond fee revenue inasmuch it made the society accept that the environment cannot be used free of charge. The criticism of domestic product fee enactment does not question if it is justified to impose a product fee if it aims to protect the environment but the manner it is assessed and applied. Because environmental policy is also a function of a bargain where interests are reconciliated, efficiency-deteriorating compromises reached in terms where product fees are applied and fee revenues are redistributed, can be regarded as an internal stage of development, and as such, we can just as well accept them.
Product fee and/or fee for the use of the environment?
In the upgrading of environmental policy definite efforts can be felt to expand the range of tools capable to regulate the economy. Already in 1998 a law was proposed in Hungary to introduce fees related to the use of the environment and environmental load contributions. The introduction of environment load fees and charges for the use of the environment can be regarded as a step forward, in several respects. The principle of making the polluter pay is explicitly asserted, they are less discriminating, because a wider circle of pollution emitters come under their effect than in the case of the product fee and once they are introduced we may genuinely hope the performance of environment protection and the state of the environment both improve and in addition, they can press for innovation in environment protection and within this, for the dissemination of preventive environmental solutions. The list of fundamental benefits could be continued at length. We can however immediately forget several environment policy benefits if we look into the impact of environment load fees to the international competitiveness of enterprises, or the external payment account. Because product fee must be paid on imported products as well, this environmental tax, dispensing with its discriminating effect already mentioned before, is neutral in terms of competition in other respects. The case of the environment load fee is already different because it must be paid on pollution emitted in Hungarian territory thus it does not affect imports. As an impact of environment load fee our export products become more expensive and will therefore be at a competitive disadvantage in

16
foreign markets. Domestic products getting into the domestic market also become more expensive while import is not affected by the tax, and this means a competitive disadvantage for domestic products in the domestic market as well. We have seen that the two manners the tax is imposed (product fee and environment load fee) lead to different consequences in foreign trade. After this, the situation is rather sad: while assessing product fee does not really make sense in terms of the environment, if environment loan fees were unilaterally (unlike in international practice) imposed even if they were desirable in terms of environment protection, they could not be perceived to make sense in terms of national economy. In connection with the introduction of environment load fees there is the strange paradox of “wishing good and acting bad”. From product fee imposed on packaging materials currently about 20% serves to finance public purposes while 80% is returned in the form of subsidies to finance the resolution of waste management work. Translating the legislator’s explicit intention to the language of theory it can be said that 20% of the product fee may be seen as a tax that internalises externalities while 80% is destined to cover the costs of waste collection and neutralisation. As we have mentioned before, the system is not really efficient, still, in our opinion the already mentioned anomalies could be eliminated. To generate a tax revenue that can be distributed for public aims is in the interest of the budget and the Ministry of Environment Protection and Water Management (KvVM) (this is 20 % of the already mentioned product fee revenue), out of which the resolution of environment protecting “public works” can be financed. Even at this moment, however, 80 % of the product fee is redistributed to resolve waste management tasks. This 80% should not and must not be collected centrally and then redistributed, as it happens now, but it should be entrusted to the market perhaps (surely) it can resolve tasks related to waste management cheaper than it is costing now. Terminating the practice of imposing a discriminating tax is, as the saying goes, an additional benefit. The frameworks of the system are determined by three initial basic principles, not because their validity is unquestionable in terms of economics but because OECD and EU documents also treat them as basic principles: 1. Asserting the principle of making the polluter pay 2. In the interest of economical efficiency market mechanisms should be allowed to allocate
resources. 3. depending on how much its activity burdens the environment every user of the environment
should contribute to the public costs of environment protection (protection of biodiversity, protection of the nature, running of risk-averting systems, education in environment protection, etc.)
3.3. Perspectives for the Hungarian industry and its environmental consequences
According to reports examining international competitiveness, the "de-industrialisation" of Europe and the United States is all but inevitable. In other words, production will be shifted to third-world countries, primarily due to lower costs. These tendencies raise an interesting question. With its relatively still low wages, how attractive is Hungary as a destination for technology transfer, how can our real or imagined advantages be turned to our benefit? Technology, as a store of knowledge for the creation of new products and services, is highly dependent on culture and values. We have reason to hope that the Hungarian economy may absorb with relative ease leading-edge western technology that requires a highly developed, professional background.

17
It remains to be seen whether in a world of growing specialisation, where East-Asia appears to become the centre of mass production, Hungary will be in a position to preserve its competitive edge or whether it will have to give up those traditional technologies that were developed in research institutes, achieving notable international success and where it still has highly-skilled technical expertise to draw on. Some positive examples indicate that we have a number of opportunities. Success in the engineering sector, thanks in large part to investment in the auto industry, was not foreseen. Available professional expertise and even the country's planned accession to the European Union, all played a vital role in attracting foreign investment. However, from the point of environmental impact, successes in the development of the auto industry have contradictory results. The production itself does not put significant burden on the environment; in fact, per-unit indicators are quite favourable. Indirectly, however, by encouraging the use of automobiles, it places a growing pressure on the environment. While in certain sectors practically all companies went out of business (i.e. light industrial sector), there are highly successful enterprises in the chemical industry and even in metallurgy. From an environmental point of view internal restructuring that took place in the chemical and aluminium processing industry can be welcomed. For instance, following a noticeable drop in fertiliser and base material production in heavy chemical plants around Budapest and the introduction of technologies suitable for the production of goods with higher value-added, pressure on the environment, as well as material and energy requirements have been significantly reduced. In the aluminium industry verticum, output in bauxite mining, aluminium oxide processing and metallurgy have been cut which, in turn, led to ease pollution of the environment. However, the sector is still saddled with a serious problem: with present rate of return on its products, the industry is unable to finance the safe disposal of waste material (primarily red sludge). The nation's 'assets' (i.e. people, infrastructure, technology, etc.), the foundation on which international competitiveness is built, are very important factors even if shaped by political and management forces, and made to appear attractive or unappealing in the eyes of the outside world. While some private businesses managed to benefit from Hungarian technical know-how, looking at the economy as a whole, we have to admit that with declining interest in engineering, a growing lack of appreciation for technical achievements and the failure of industrial research institutes all point to the fact that we are far from successful in taking advantage of our resources. Cleaner production is, per definition, more efficient solution than end of pipe technologies, in terms of both environmental and economic efficiency. Then, however, it is hardly understandable why the dissemination of these kinds of preventive technologies is so slow. We'll focus on obstacles drawn from market analysis and on certain aspects of the environmental policy at a limited extent. We would like to underline three types of obstacles in the environmental technology transfer problems:
• Shortage in financial capital available for SMEs. • Missing public and regulatory pressure. • The contradiction in the demand and the supply in environmental technologies.
Financial obstacles in cleaner production investments at SMEs
In the transition countries it was a necessity to become entrepreneurs for the big majority of the owners of SMEs. They lost their job during the period of recession which accompanied the process of transition and many of them tried their fortune as an entrepreneur. That's why the majority of the small and medium size enterprises are characterised by:
• the lack of financial capital for green field investment,

18
• the low profitability of the applied inefficient technologies often characterised by bottlenecks and overcapacities within the same firm,
• the high discount rate reflecting the high risk of the business. SMEs in the majority of developing countries are short of financial capital. Except from the hotel industry, the new entrepreneurs initiate their activity with ‘second hand’ equipment, even in the case of green field investments. The older but ‘cheaper’ technology and equipment economically and ecologically are not efficient. As a consequence the profitability of these industries is very low. The obsolete technologies having a high maintaining cost, are inappropriate in terms of energy efficiency and emission as well. Due to the low profitability SMEs bankrupt very often. Banks are unwilling to give loan to them, or asking high interest rate. SMEs very often improve their production line step by step and finance it from their own savings. The step by step investment creates three types of problems:
• The production line consist of different units according to the age of the equipment. Some parts or others are obsolete but they are never on the same development level.
• Merging them into one production line is extremely difficult, because they are different not only in terms of age but in production capacity, as well.
• The economy of scale is hardly beneficial for SMEs in environmental terms. For certain technologies (like painting) the cleaner and more efficient, more quality oriented solutions are economical only above a certain capacity level. (In some cases we suggested to the entrepreneur to outsource this type of activity, but they mainly insisted to develop their own capacity.)
This “step by step” development increases the production costs and decreases the material and energy efficiency and creates additional pollution, as well. Some part of the production line might be state of the art, but even those are combined with inappropriate fittings etc. which spoils the overall environmental performance. Cleaner production solutions reduce unit costs, but mainly demand higher investment costs which is not affordable for the SMEs because of the conflict between the short run and the long run interests.
Missing public and regulatory pressure
SMEs are mainly diffuse polluters, so there is no regulatory or public pressure forcing them toward implementing environmental measures other than economic rationality in the form of cost reduction. There are no data available for the contribution of the SMEs to the total pollution in Hungary. We could hardly find such figures even in the OECD countries. Existing monitoring systems cannot handle this problem. The SMEs contribution to the pollution is much higher than their contribution to the GDP, while this pollution stays mainly out of control. Policy makers do not pay attention to this sector being a very difficult task: transaction costs are very high, and public support is very low because of the high number of people adversely affected via tax or cost increase.
Unmatched demand and supply for environmental technologies
In recent years the Hungarian Cleaner Production Centre organised several conferences and workshops in order to bring together Hungarian and foreign entrepreneurs. While these events were quite successful, the expected result very often flows away. The main obstacle obviously is that supply from the west and the demand inside of the country did not meet. As our practice shows typical technologies in the market tend to be end of pipe technologies. Among them the most frequent ones are waste incinerators, sewage treatment facilities and the soil clean up technologies, and certain waste management technologies.
19
These are the „industries” where new entrepreneurs are wanted by foreign investors or one can buy technology and equipment with good financial conditions. This market is totally supply driven. Among the supporters of these investors we can find multinational consultant companies as well as producers of these technologies. They seek to attract or establish an SME for this business while the other side for this activities the contractor is the local government or the Ministry of Environment with whom not easy to make business. The other type of technologies offered in the market include second hand technologies or technologies with high risk. The demand would be almost the opposite. SMEs raise a huge demand for small scale technologies and for low costs end of pipe technologies. Also there is a huge demand for state of the art technologies for producing consumer goods ie. food products. The discrepancy in supply and demand exists in the consulting business as well. Experts coming from US and Western Europe are specialists in end of pipe but not in cleaner production. Probably the only exemption is the energy field where positive examples exist as well.
20
4. ENVIRONMENTAL MANAGEMENT AND PERFORMANCE
4.1. Environmental management systems and tools
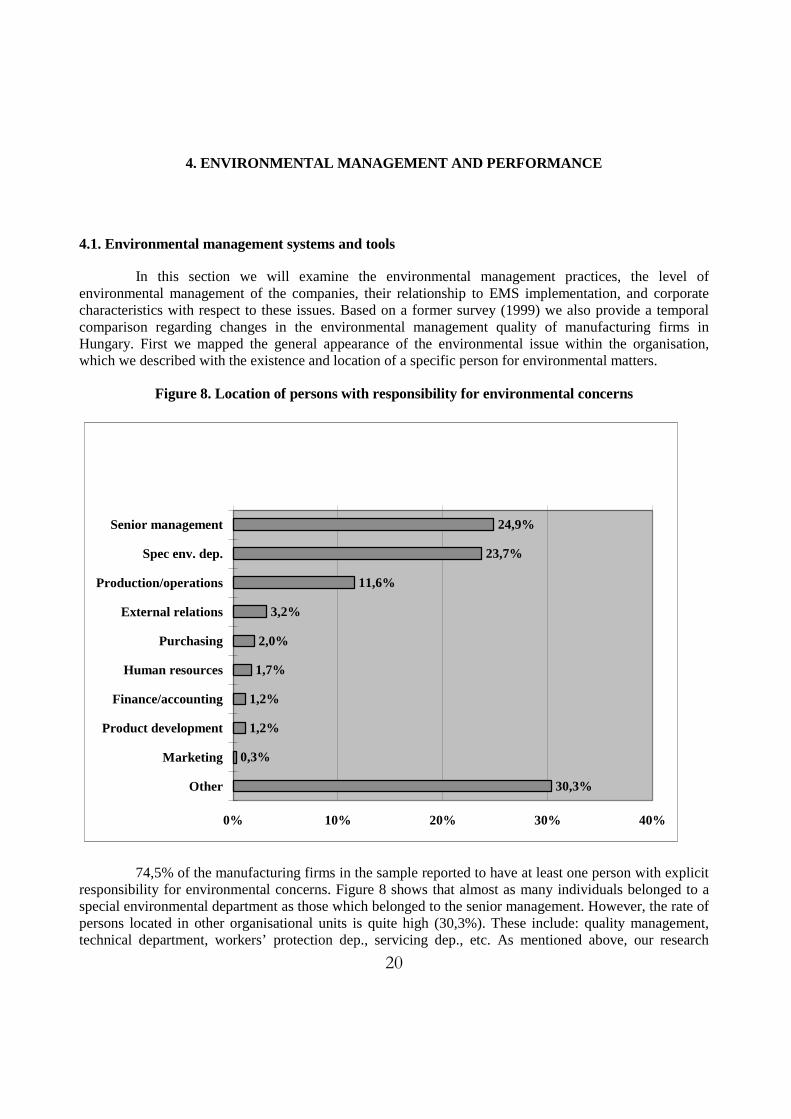
In this section we will examine the environmental management practices, the level of environmental management of the companies, their relationship to EMS implementation, and corporate characteristics with respect to these issues. Based on a former survey (1999) we also provide a temporal comparison regarding changes in the environmental management quality of manufacturing firms in Hungary. First we mapped the general appearance of the environmental issue within the organisation, which we described with the existence and location of a specific person for environmental matters.
Figure 8. Location of persons with responsibility for environmental concerns
24,9%
23,7%
11,6%
3,2%
2,0%
1,7%
1,2%
1,2%
0,3%
30,3%
0% 10% 20% 30% 40%
Senior management
Spec env. dep.
Production/operations
External relations
Purchasing
Human resources
Finance/accounting
Product development
Marketing
Other
74,5% of the manufacturing firms in the sample reported to have at least one person with explicit responsibility for environmental concerns. Figure 8 shows that almost as many individuals belonged to a special environmental department as those which belonged to the senior management. However, the rate of persons located in other organisational units is quite high (30,3%). These include: quality management, technical department, workers’ protection dep., servicing dep., etc. As mentioned above, our research

21
group carried out a similar survey among 146 manufacturing firms in 1999 where we focused on different indicators of the corporate environmental performance. The most important indicator categories were:
• Environmental management practices • Environmental sensitivity of the technology • Environmental organisation of the firms • Environmental communication • Environmental marketing • Environmental risks • Concrete environmental measures taken • Internal and external obstacles regarding environmental activity • Motivation factors in order to take environmental measures
The data analysis methods and the results of that survey are to some extent comparable with those of our contemporary research, so we are able to draw some conclusions about temporal tendencies. In order to implement environmental management companies have established environmental practices with the following frequency in their facility in 2003 and in 1999 (where the two questionnaires are compatible):
Figure 9. Environmental practices in order to implement EM (1999 and 2003)
12,5%
15,2%
32,7%
42,6%
42,9%
44,8%
49,9%
50,1%
54,3%
24,7%
23,2%
36,9%
23,3%
19,2%
26,3%
0% 10% 20% 30% 40% 50% 60%
Env. accounting
Env. criteria used to evaluate/compensateemployees
Benchmark env. performance
Env. training programme for employees
External env. audits
Env. performance indicators/goals
Public env. report
Internal env. audits
Written env. policy
2003 1999
22
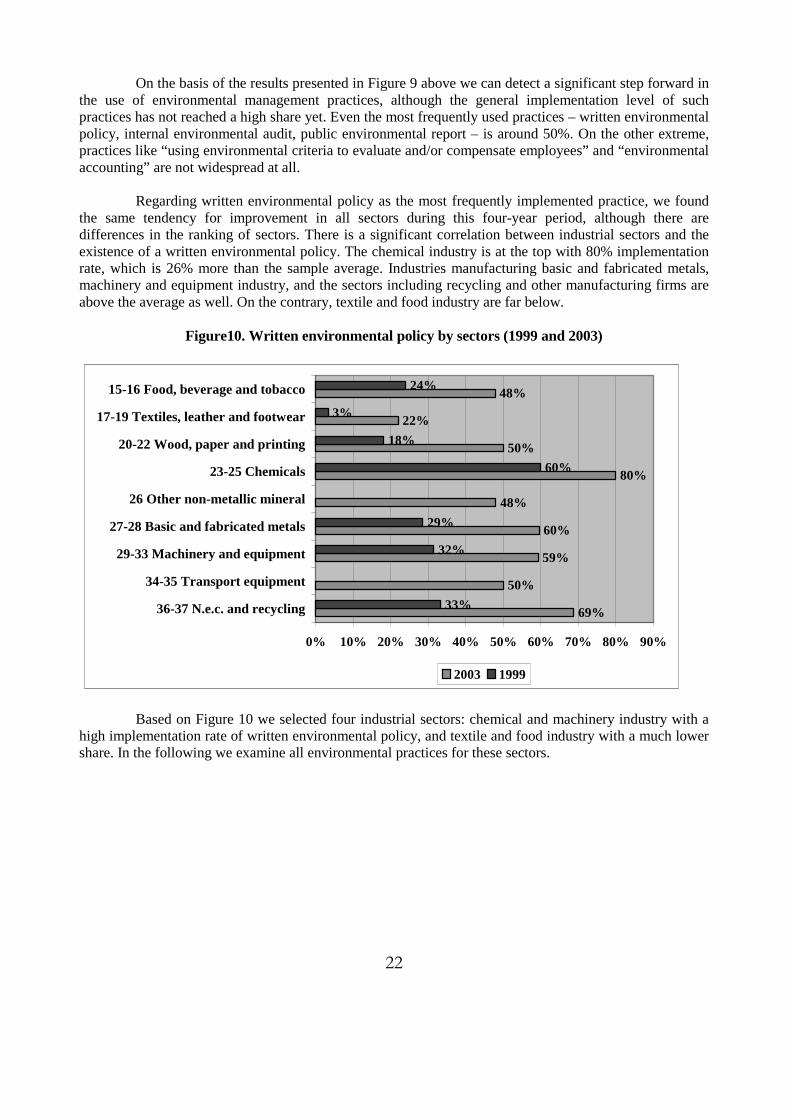
On the basis of the results presented in Figure 9 above we can detect a significant step forward in the use of environmental management practices, although the general implementation level of such practices has not reached a high share yet. Even the most frequently used practices – written environmental policy, internal environmental audit, public environmental report – is around 50%. On the other extreme, practices like “using environmental criteria to evaluate and/or compensate employees” and “environmental accounting” are not widespread at all. Regarding written environmental policy as the most frequently implemented practice, we found the same tendency for improvement in all sectors during this four-year period, although there are differences in the ranking of sectors. There is a significant correlation between industrial sectors and the existence of a written environmental policy. The chemical industry is at the top with 80% implementation rate, which is 26% more than the sample average. Industries manufacturing basic and fabricated metals, machinery and equipment industry, and the sectors including recycling and other manufacturing firms are above the average as well. On the contrary, textile and food industry are far below.
Figure10. Written environmental policy by sectors (1999 and 2003)
69%
50%
59%
60%
48%
80%
50%
22%
48%
33%
32%
29%
60%
18%
3%
24%
0% 10% 20% 30% 40% 50% 60% 70% 80% 90%
36-37 N.e.c. and recycling
34-35 Transport equipment
29-33 Machinery and equipment
27-28 Basic and fabricated metals
26 Other non-metallic mineral
23-25 Chemicals
20-22 Wood, paper and printing
17-19 Textiles, leather and footwear
15-16 Food, beverage and tobacco
2003 1999
Based on Figure 10 we selected four industrial sectors: chemical and machinery industry with a high implementation rate of written environmental policy, and textile and food industry with a much lower share. In the following we examine all environmental practices for these sectors.
23
Figure 11. Environmental practices in selected sectors
0% 10% 20% 30% 40% 50% 60% 70% 80% 90%
Env. performance indicators/goals
Public environmental report
Environmental accounting
Benchmark environmental performance
Internal environmental audits
External environmental audits
Environmental training programmes for employees
Env. criteria used to evaluate/compensate employees
Written environmental policy
29-33 Machinery and equipment 23-25 Chemicals
17-19 Textile, leather and footwear 15-16 Food, beverage and tobacco
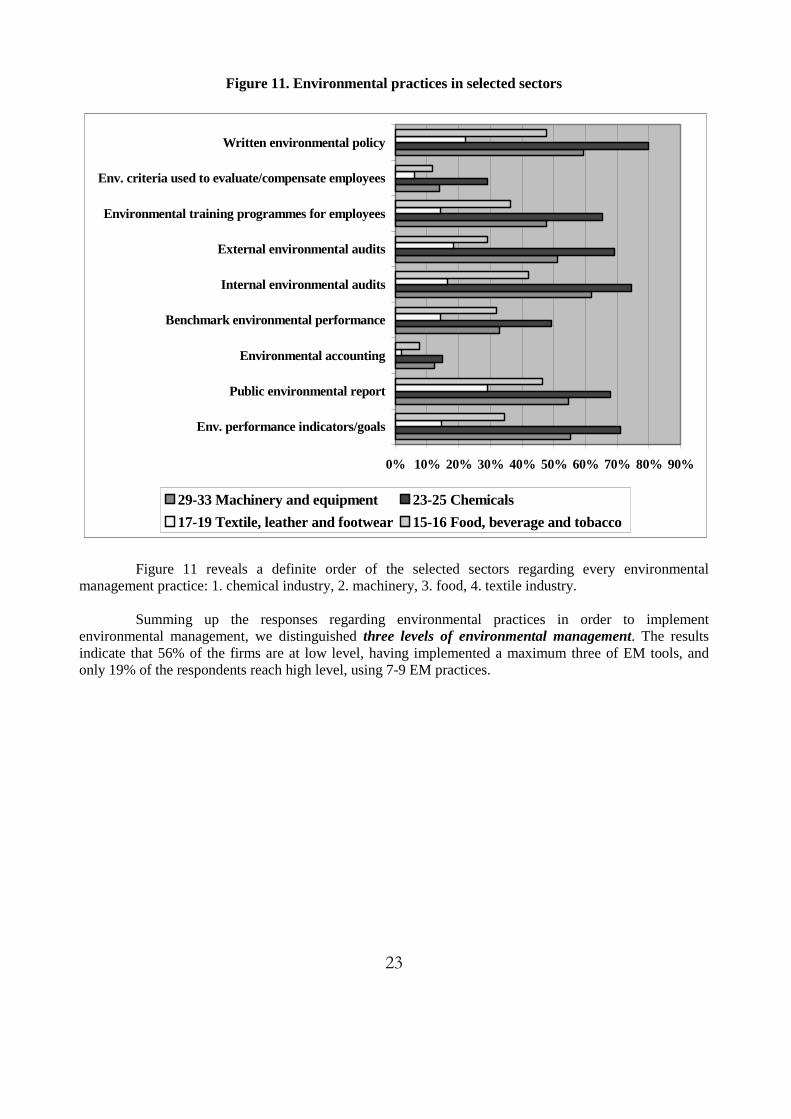
Figure 11 reveals a definite order of the selected sectors regarding every environmental management practice: 1. chemical industry, 2. machinery, 3. food, 4. textile industry. Summing up the responses regarding environmental practices in order to implement environmental management, we distinguished three levels of environmental management. The results indicate that 56% of the firms are at low level, having implemented a maximum three of EM tools, and only 19% of the respondents reach high level, using 7-9 EM practices.
24
Figure 12. Level of EM in 1999 and in 2003 in %
4740
13
3929 32
01020304050
low medium high
1999 2003
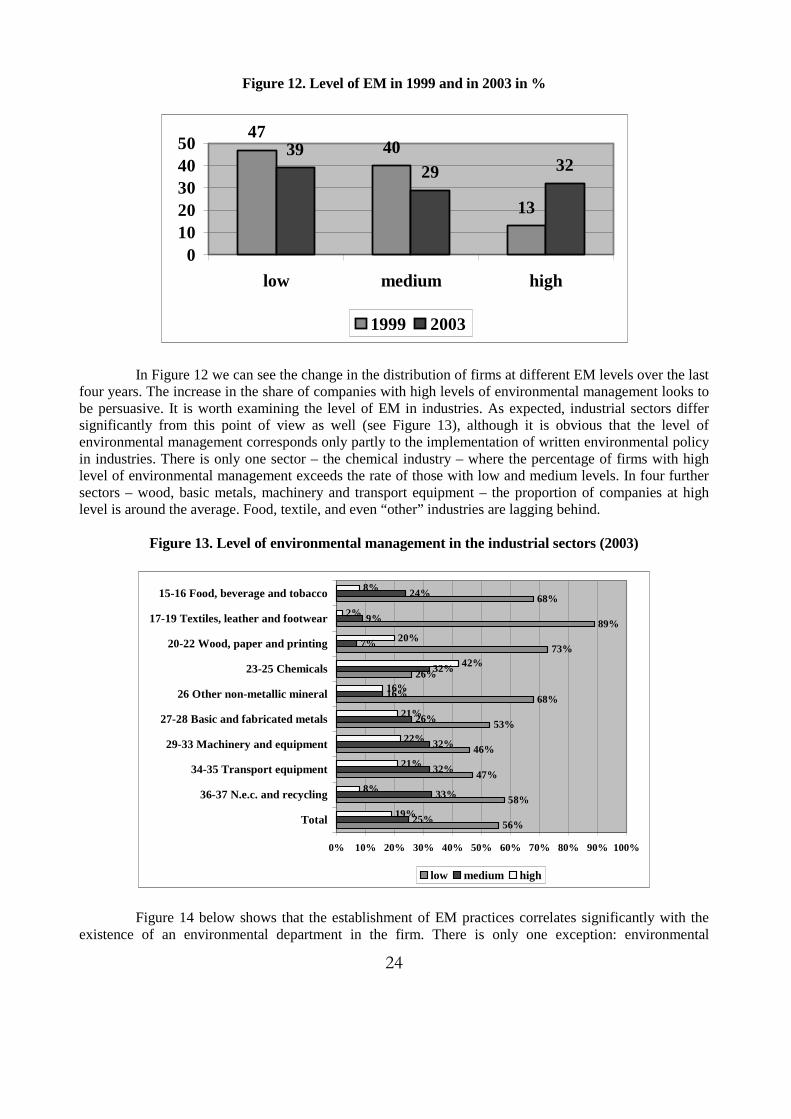
In Figure 12 we can see the change in the distribution of firms at different EM levels over the last four years. The increase in the share of companies with high levels of environmental management looks to be persuasive. It is worth examining the level of EM in industries. As expected, industrial sectors differ significantly from this point of view as well (see Figure 13), although it is obvious that the level of environmental management corresponds only partly to the implementation of written environmental policy in industries. There is only one sector – the chemical industry – where the percentage of firms with high level of environmental management exceeds the rate of those with low and medium levels. In four further sectors – wood, basic metals, machinery and transport equipment – the proportion of companies at high level is around the average. Food, textile, and even “other” industries are lagging behind.
Figure 13. Level of environmental management in the industrial sectors (2003)
56%
58%
47%
46%
53%
68%
26%
73%
89%
68%
25%
33%
32%
32%
26%
16%
32%
7%
9%
24%
19%
8%
21%
22%
21%
16%
42%
20%
2%
8%
0% 10% 20% 30% 40% 50% 60% 70% 80% 90% 100%
Total
36-37 N.e.c. and recycling
34-35 Transport equipment
29-33 Machinery and equipment
27-28 Basic and fabricated metals
26 Other non-metallic mineral
23-25 Chemicals
20-22 Wood, paper and printing
17-19 Textiles, leather and footwear
15-16 Food, beverage and tobacco
low medium high
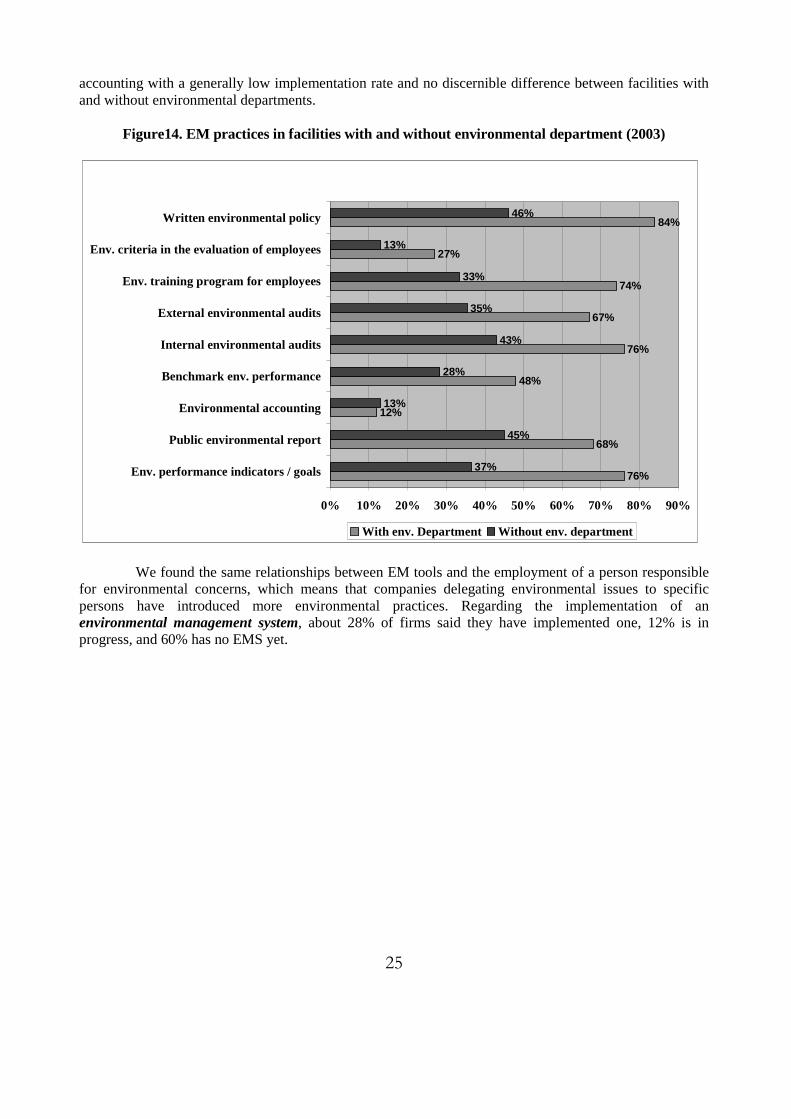
Figure 14 below shows that the establishment of EM practices correlates significantly with the existence of an environmental department in the firm. There is only one exception: environmental
25
accounting with a generally low implementation rate and no discernible difference between facilities with and without environmental departments.
Figure14. EM practices in facilities with and without environmental department (2003)
76%
68%
12%
48%
76%
67%
74%
27%
84%
37%
45%
13%
28%
43%
35%
33%
13%
46%
0% 10% 20% 30% 40% 50% 60% 70% 80% 90%
Env. performance indicators / goals
Public environmental report
Environmental accounting
Benchmark env. performance
Internal environmental audits
External environmental audits
Env. training program for employees
Env. criteria in the evaluation of employees
Written environmental policy
With env. Department Without env. department
We found the same relationships between EM tools and the employment of a person responsible for environmental concerns, which means that companies delegating environmental issues to specific persons have introduced more environmental practices. Regarding the implementation of an environmental management system, about 28% of firms said they have implemented one, 12% is in progress, and 60% has no EMS yet.
26
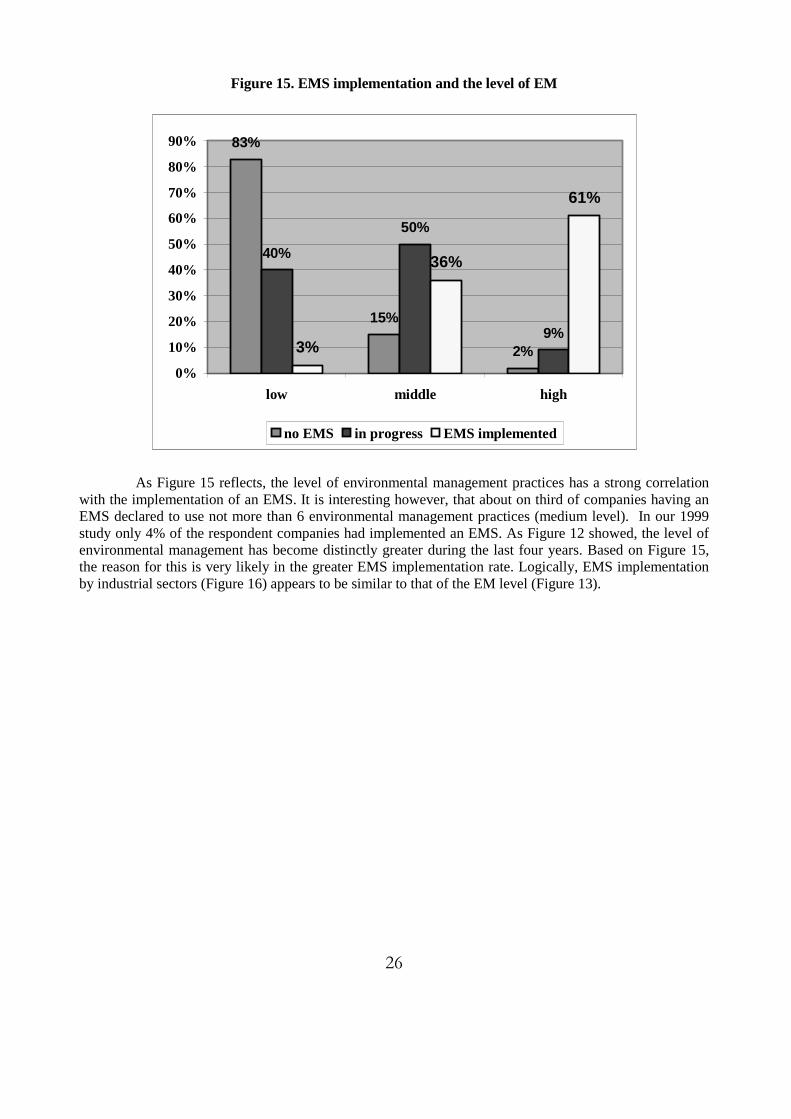
Figure 15. EMS implementation and the level of EM
83%
15%
2%
40%
50%
9%3%
36%
61%
0%
10%
20%
30%
40%
50%
60%
70%
80%
90%
low middle high
no EMS in progress EMS implemented
As Figure 15 reflects, the level of environmental management practices has a strong correlation with the implementation of an EMS. It is interesting however, that about on third of companies having an EMS declared to use not more than 6 environmental management practices (medium level). In our 1999 study only 4% of the respondent companies had implemented an EMS. As Figure 12 showed, the level of environmental management has become distinctly greater during the last four years. Based on Figure 15, the reason for this is very likely in the greater EMS implementation rate. Logically, EMS implementation by industrial sectors (Figure 16) appears to be similar to that of the EM level (Figure 13).

27
Figure 16. EMS implementation by sectors
28%
31%
32%
37%
29%
20%
50%
23%
4%
12%
0% 10% 20% 30% 40% 50% 60%
Average
36-37 N.e.c. and recycling
34-35 Transport equipment
29-33 Machinery and equipment
27-28 Basic and fabricated metals
26 Other non-metallic mineral
23-25 Chemicals
20-22 Wood, paper and printing
17-19 Textiles, leather and footwear
15-16 Food, beverage and tobacco
Among firms with certified EMS the ISO 14001 certification has absolute dominance: they amount 26,6% of all companies, while those with EMAS only 0,4%. In the following we examine the relationships between environmental management and some corporate characteristics. Figure 17 below indicates that an implemented EMS is associated with a much higher percentage in the use of environmental practices. In the case of written environmental policy, external and internal audits, environmental training for employees and environmental performance indicators/goals the implementation is almost self-evident, because these are included in the EMS standards. On the contrary, those practices which are rarely adopted – like environmental criteria for employees and environmental accounting – even certified firms have a relatively low implementation rate. Benchmarking and public environmental report as optional tools can be found at about two-third of companies with an EMS. It is remarkable that the most frequently used environmental management practice among firms without an EMS is the publication of a public environmental report, and the second one is written environmental policy. This means first that communication about environmental activities often appears to be more important than the activities themselves, and second that these practices are widely spread even without a management system.

28
Figure 17. EMS certificate and EM practices
20,2%
40,6%
9,0%
16,8%
26,4%
18,1%
17,0%
9,3%
27,8%
91,9%
67,2%
19,7%
67,5%
96,8%
93,8%
95,3%
32,8%
99,2%
0% 20% 40% 60% 80% 100%
Env. performance indicators/goals
Env. accounting
Internal env. audits
Env. training programmes for employees
Written env. policy
EMS
No EMS
As expected, EMS implementation and the size of the facility are in significant correlation (see Figure 18). The same is true for facility size and the level of EM, because EMS and EM level correlate very strongly (see above).
Figure 18. Facility size and EMS implementation
19,1% 20,6%30,7%
45,5%
6,4%12,4% 15,8% 10,9%
74,5%67,0%
53,5%43,6%
0%
20%
40%
60%
80%
1-99 employees 100-249 employees 250-499 employees 500 and moreemployees
implemented in progress no
While 45,5% of large companies have already implemented an EMS, this percentage is only about 20% in the case of firms under 250 employees. From a reverse point of view, 36,5% of enterprises with an EMS are large, about 24,6% are medium-size, and 38,8% are small companies.
29
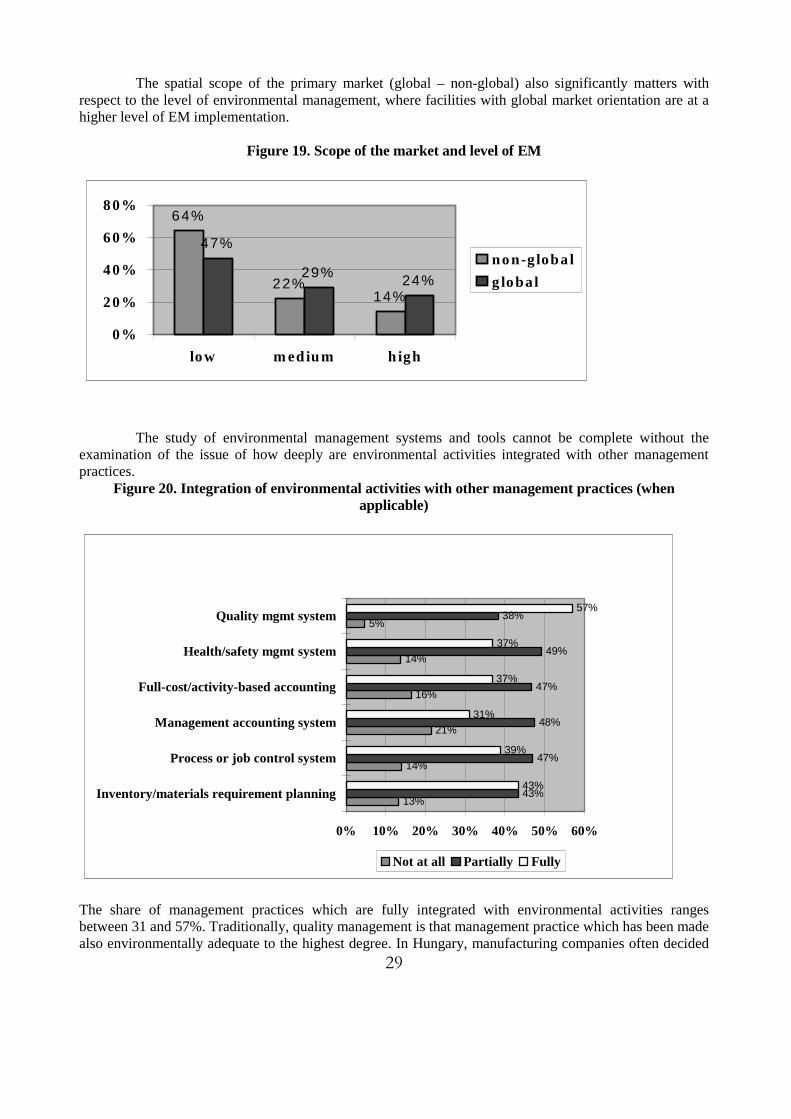
The spatial scope of the primary market (global – non-global) also significantly matters with respect to the level of environmental management, where facilities with global market orientation are at a higher level of EM implementation.
Figure 19. Scope of the market and level of EM
64%
22%14%
47%
29% 24%
0%
20%
40%
60%
80%
low m edium high
non-g loba l
g lobal
The study of environmental management systems and tools cannot be complete without the examination of the issue of how deeply are environmental activities integrated with other management practices.
Figure 20. Integration of environmental activities with other management practices (when applicable)
13%
14%
21%
16%
14%
5%
43%
47%
48%
47%
49%
38%
43%
39%
31%
37%
37%
57%
0% 10% 20% 30% 40% 50% 60%
Inventory/materials requirement planning
Process or job control system
Management accounting system
Full-cost/activity-based accounting
Health/safety mgmt system
Quality mgmt system
Not at all Partially Fully
The share of management practices which are fully integrated with environmental activities ranges between 31 and 57%. Traditionally, quality management is that management practice which has been made also environmentally adequate to the highest degree. In Hungary, manufacturing companies often decided

30
to implement ISO 14001 on the basis of an existing ISO 9000 QMS, although the viewpoint of the two standards is different. This research shows that 97% of firms which implemented an EMS fully integrated environmental elements with QMS, while this proportion is only 72% at companies without an EMS. Regarding other management practices, it has to be mentioned that there is no significant relationship between the integration of environmental practices and the implementation of an EMS. Moreover, in the case of full cost accounting and process/job control systems, a reverse tendency could be noticed which is confusing. It may be attributable to respondents’ bias or the lack of knowledge about the operation of the other management practices. In any event, it certainly indicates the need to interpret these results cautiously. Companies evaluated EMS implementation from the point of view whether expected benefits of adopting an EMS were as great as had been anticipated. 78% of the certified firms answered with “yes” which is a quite high satisfaction rate and may prove the necessity of implementing an EMS in order to realise special benefits from environmental activity for the companies.
4.2 Environmental measures, innovation and performance
Environmental management may be certified but it becomes valid only when it is getting filled with real environmental activities. Consequently, we have to study corporate environmental performance regarding environmental measures and innovation as well. In this chapter we focus on:
• monitoring of environmental performance measures, • concrete environmental actions and • changes in impacts per unit of output.
The analysis of these issues has been carried out in three dimensions:
• explanation of the frequency results; • searching for relationships between EMS and environmental measures • evaluation of correlation between corporate characteristics and environmental measures.
First we compare monitoring and realisation of environmental measures.
31
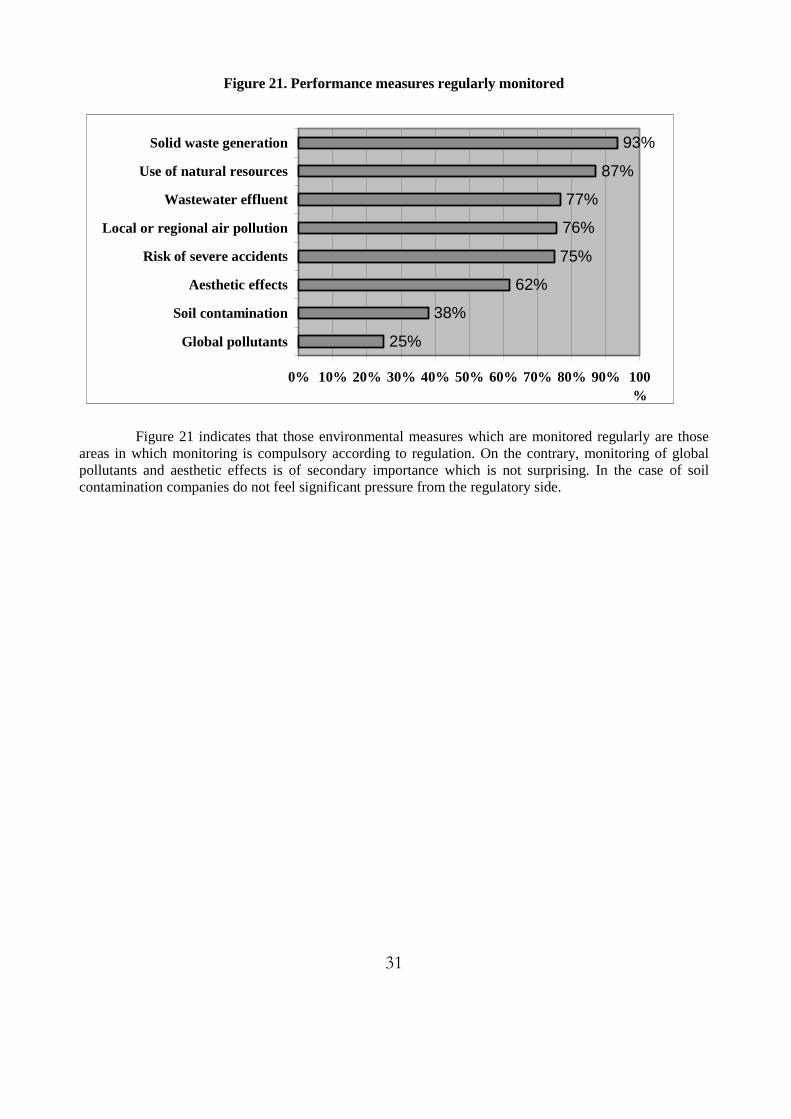
Figure 21. Performance measures regularly monitored
25%
38%
62%
75%
76%
77%
87%
93%
0% 10% 20% 30% 40% 50% 60% 70% 80% 90% 100%
Global pollutants
Soil contamination
Aesthetic effects
Risk of severe accidents
Local or regional air pollution
Wastewater effluent
Use of natural resources
Solid waste generation
Figure 21 indicates that those environmental measures which are monitored regularly are those areas in which monitoring is compulsory according to regulation. On the contrary, monitoring of global pollutants and aesthetic effects is of secondary importance which is not surprising. In the case of soil contamination companies do not feel significant pressure from the regulatory side.
32
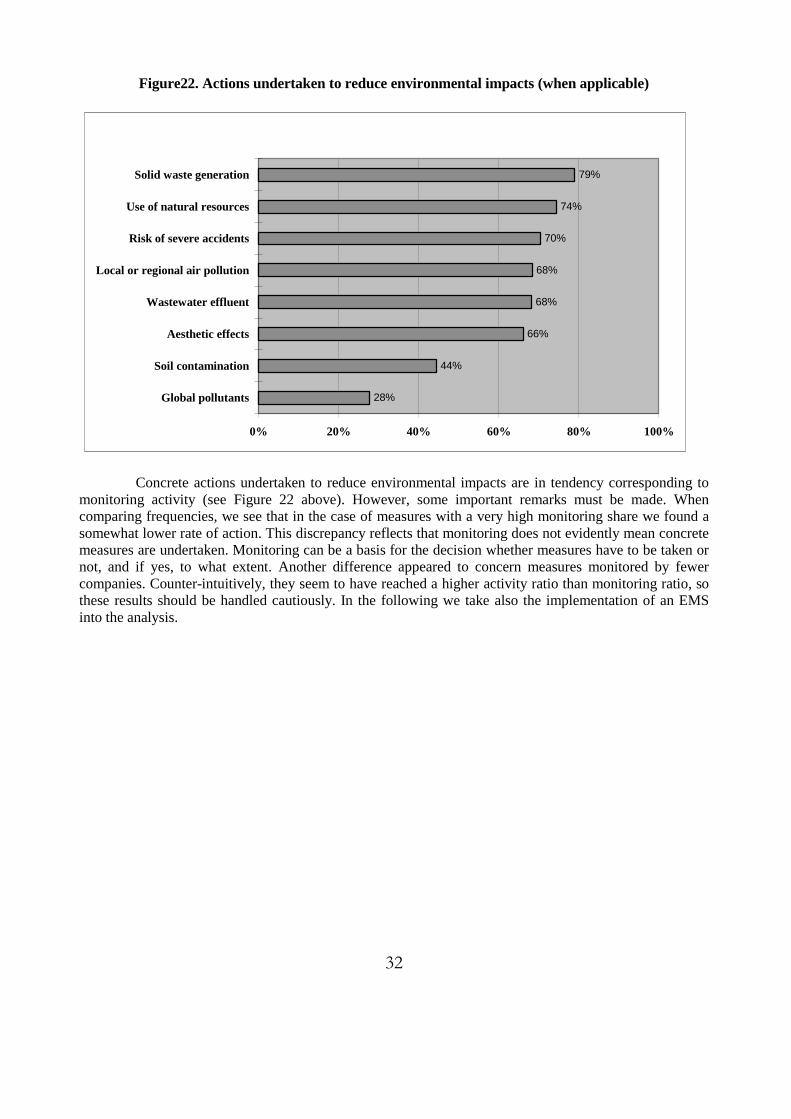
Figure22. Actions undertaken to reduce environmental impacts (when applicable)
28%
44%
66%
68%
68%
70%
74%
79%
0% 20% 40% 60% 80% 100%
Global pollutants
Soil contamination
Aesthetic effects
Wastewater effluent
Local or regional air pollution
Risk of severe accidents
Use of natural resources
Solid waste generation
Concrete actions undertaken to reduce environmental impacts are in tendency corresponding to monitoring activity (see Figure 22 above). However, some important remarks must be made. When comparing frequencies, we see that in the case of measures with a very high monitoring share we found a somewhat lower rate of action. This discrepancy reflects that monitoring does not evidently mean concrete measures are undertaken. Monitoring can be a basis for the decision whether measures have to be taken or not, and if yes, to what extent. Another difference appeared to concern measures monitored by fewer companies. Counter-intuitively, they seem to have reached a higher activity ratio than monitoring ratio, so these results should be handled cautiously. In the following we take also the implementation of an EMS into the analysis.
33
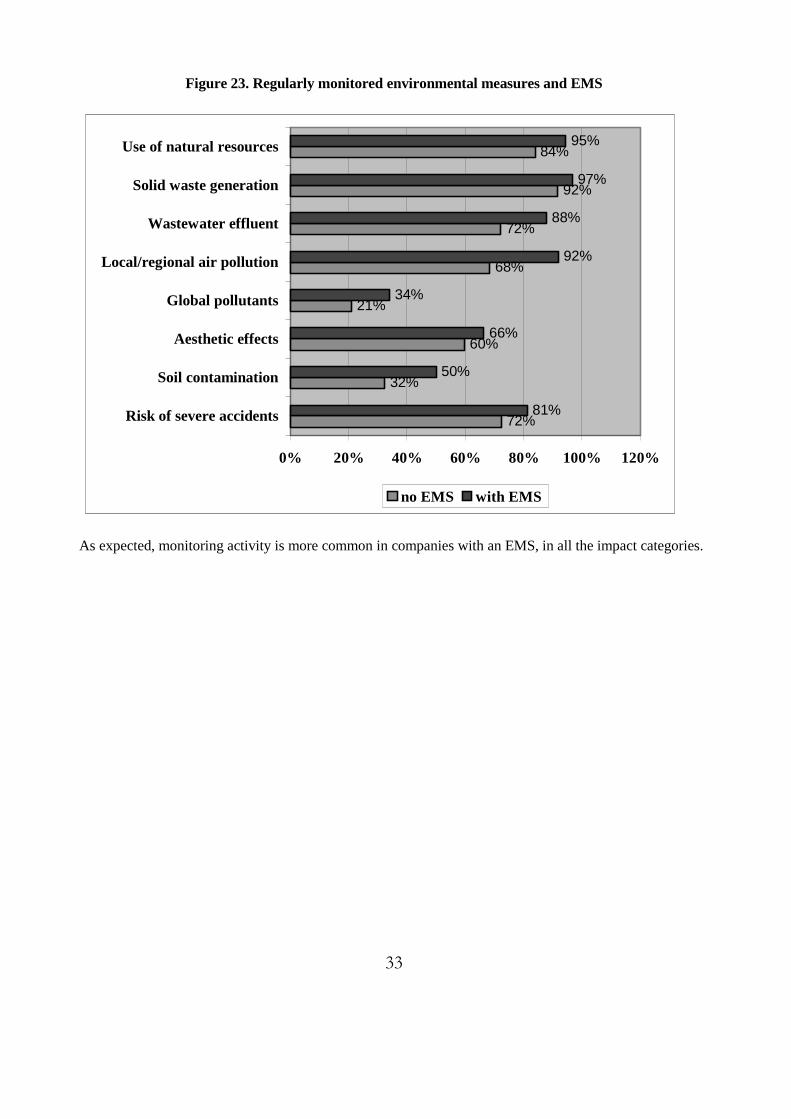
Figure 23. Regularly monitored environmental measures and EMS
72%
32%
60%
21%
68%
72%
92%
84%
81%
50%
66%
34%
92%
88%
97%
95%
0% 20% 40% 60% 80% 100% 120%
Risk of severe accidents
Soil contamination
Aesthetic effects
Global pollutants
Local/regional air pollution
Wastewater effluent
Solid waste generation
Use of natural resources
no EMS with EMS
As expected, monitoring activity is more common in companies with an EMS, in all the impact categories.

34
Figure 24. EMS implementation and concrete actions to reduce environmental impacts
64,8%
35,7%
65,2%
43,4%
62,5%
73,3%
69,2%
83,8%
64,8%
66,7%
21,6%
82,0%
92,9%
86,3%
0% 20% 40% 60% 80% 100%
Risk of severe accidents
Soil contamination
Aesthetic effects
Global pollutants
Local/regional air pollution
Solid waste generation
Use of natural resources
EMS
No EMS
From Figure 24 we can read that taking environmental measures correlates positively with implementation of an EMS. It confirms the expectation that adopting an environmental management system results in a higher corporate environmental performance. Apart from the implementation of an EM system, the level of environmental management is also in strong relationship with environmental measures, which means that independently from certification the integration of environmental issues into corporate process can be detected on both management and activity sides. Environmental measures appear in industrial sectors with considerably different frequency. In contrast with environmental management practices, where we could identify a clear ranking among industries based on the implementation rate of EM practices, here we can see a sector-specific differentiation of environmental problems.

35
Figure 25. Environmental measures at some industrial sectors
0% 20% 40% 60% 80% 100%
Global pollutants
Wastewater effluent
Solid waste generation
Use of natural resources
15-16 Food, beverage and tobacco
17-19 Textile, leather and footwear
23-25 Chemicals
29-33 Machinery and equipment
34-35 Transport equipment
For illustration, we selected five industrial sectors and four environmental issues (see Figure 25). In accordance with our previous findings, the textile industry is generally at a low level of environmental activity regarding these environmental problems. On the other hand, the absolute dominance of chemical industry cannot be detected. The food industry – with a relatively low level of environmental management – shows a much higher activity rate regarding the environmental measures indicated in Figure 25. We also found that facility size did play a determining role in all environmental areas. A positive relationship could be seen in the case of natural resources, wastewater effluent, local air pollution and soil contamination. On the other hand, measures regarding solid waste generation were spread almost evenly among size categories. We think, the reason for these results may originate on one hand in the characteristics of Hungarian environmental regulation, and on the other hand in the relative seriousness of the negative environmental impacts regarding the environmental issues examined. In order to have a broader view about environmental performance, we have to analyse the change in environmental impacts per unit of output according to the environmental issues.
36
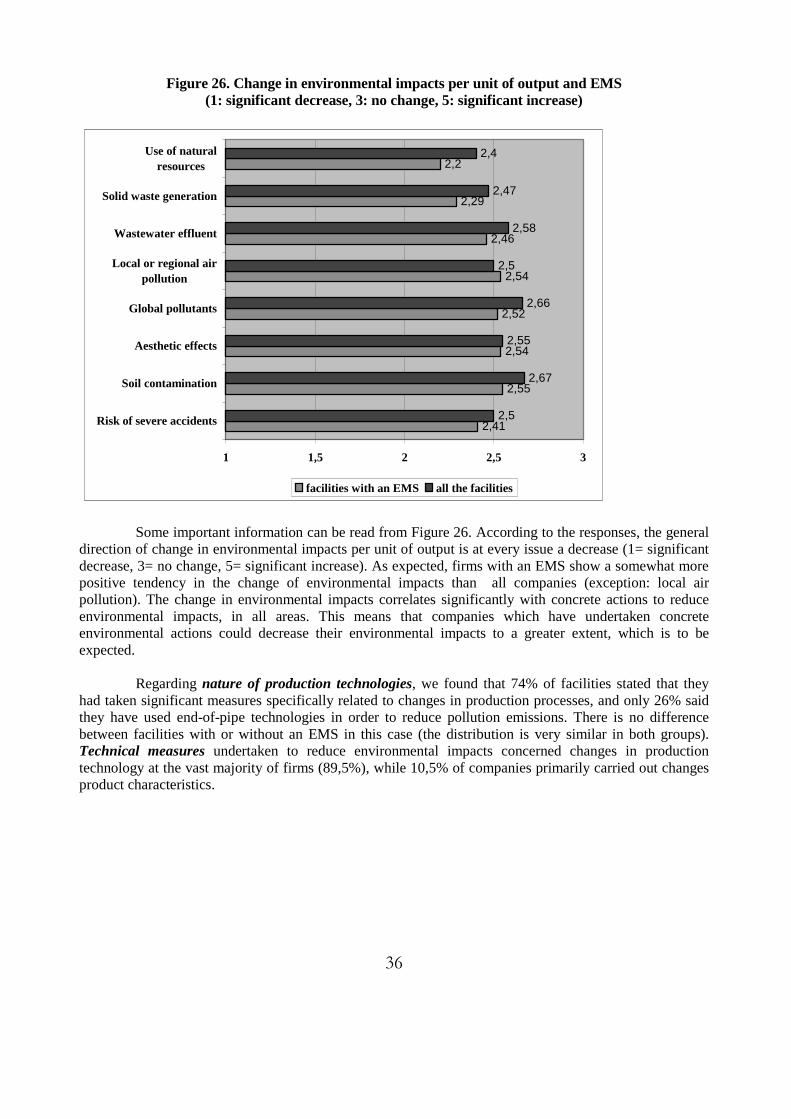
Figure 26. Change in environmental impacts per unit of output and EMS (1: significant decrease, 3: no change, 5: significant increase)
2,41
2,55
2,54
2,52
2,54
2,46
2,29
2,2
2,5
2,67
2,55
2,66
2,5
2,58
2,47
2,4
1 1,5 2 2,5 3
Risk of severe accidents
Soil contamination
Aesthetic effects
Global pollutants
Local or regional airpollution
Wastewater effluent
Solid waste generation
Use of naturalresources
facilities with an EMS all the facilities
Some important information can be read from Figure 26. According to the responses, the general direction of change in environmental impacts per unit of output is at every issue a decrease (1= significant decrease, 3= no change, 5= significant increase). As expected, firms with an EMS show a somewhat more positive tendency in the change of environmental impacts than all companies (exception: local air pollution). The change in environmental impacts correlates significantly with concrete actions to reduce environmental impacts, in all areas. This means that companies which have undertaken concrete environmental actions could decrease their environmental impacts to a greater extent, which is to be expected. Regarding nature of production technologies, we found that 74% of facilities stated that they had taken significant measures specifically related to changes in production processes, and only 26% said they have used end-of-pipe technologies in order to reduce pollution emissions. There is no difference between facilities with or without an EMS in this case (the distribution is very similar in both groups). Technical measures undertaken to reduce environmental impacts concerned changes in production technology at the vast majority of firms (89,5%), while 10,5% of companies primarily carried out changes product characteristics.

37
5. INFLUENCE OF STAKEHOLDERS AND IMPORTANCE OF MOTIVATIONS
5.1. Environmental stakeholders
The respondents considered the following stakeholder groups as the most important: public authorities, corporate headquarters, management employees and commercial buyers. Groups from whom the companies felt little pressure include: household consumers, non-management employees, banks and other lenders, industry or trade associations and labour unions. The pressure from shareholders/investment funds, community and environmental groups and suppliers was received to be moderately important.
Figure 27. The importance of the different stakeholder groups in environmental issues
Labour unions
Industry and trade associations
Banks/other lenders
Non-management employees
Household consumers
Suppliers
Environmantal organisations
Community groups
Shareholders/investment funds
Commercial buyers
Management employees
Corp.headquarters
Public authorities
Not important Moderately important Very important
In Table 4 we report on a comparison regarding the importance of the different stakeholder groups concerning environmental issues. The 1999 survey was carried out by Kerekes et. al., using a sample which included 152 Hungarian manufacturing companies. This table lists the different stakeholders
38
in a decreasing order of importance. We can see that the listed stakeholder groups are not exactly the some, but even though we can point out that the two orders are very similar, especially regarding the most important stakeholder groups.
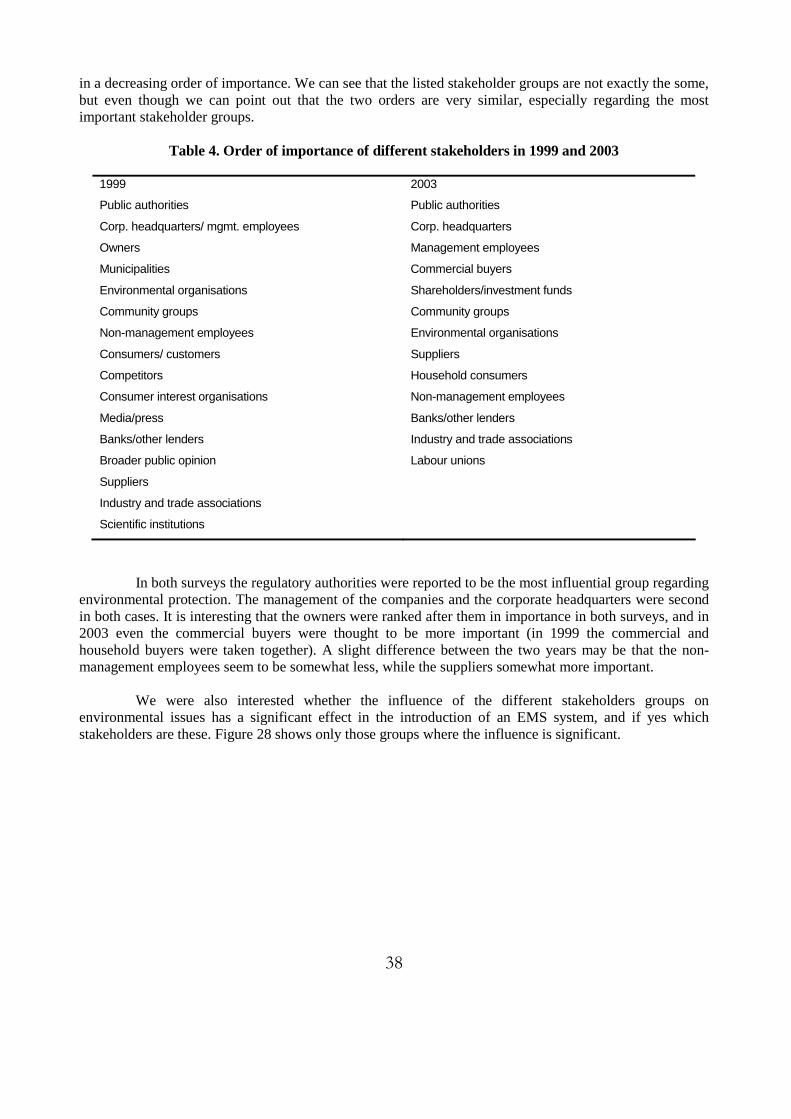
Table 4. Order of importance of different stakeholders in 1999 and 2003
1999 2003
Public authorities Public authorities
Corp. headquarters/ mgmt. employees Corp. headquarters
Owners Management employees
Municipalities Commercial buyers
Environmental organisations Shareholders/investment funds
Community groups Community groups
Non-management employees Environmental organisations
Consumers/ customers Suppliers
Competitors Household consumers
Consumer interest organisations Non-management employees
Media/press Banks/other lenders
Banks/other lenders Industry and trade associations
Broader public opinion Labour unions
Suppliers
Industry and trade associations
Scientific institutions
In both surveys the regulatory authorities were reported to be the most influential group regarding environmental protection. The management of the companies and the corporate headquarters were second in both cases. It is interesting that the owners were ranked after them in importance in both surveys, and in 2003 even the commercial buyers were thought to be more important (in 1999 the commercial and household buyers were taken together). A slight difference between the two years may be that the non-management employees seem to be somewhat less, while the suppliers somewhat more important. We were also interested whether the influence of the different stakeholders groups on environmental issues has a significant effect in the introduction of an EMS system, and if yes which stakeholders are these. Figure 28 shows only those groups where the influence is significant.
39
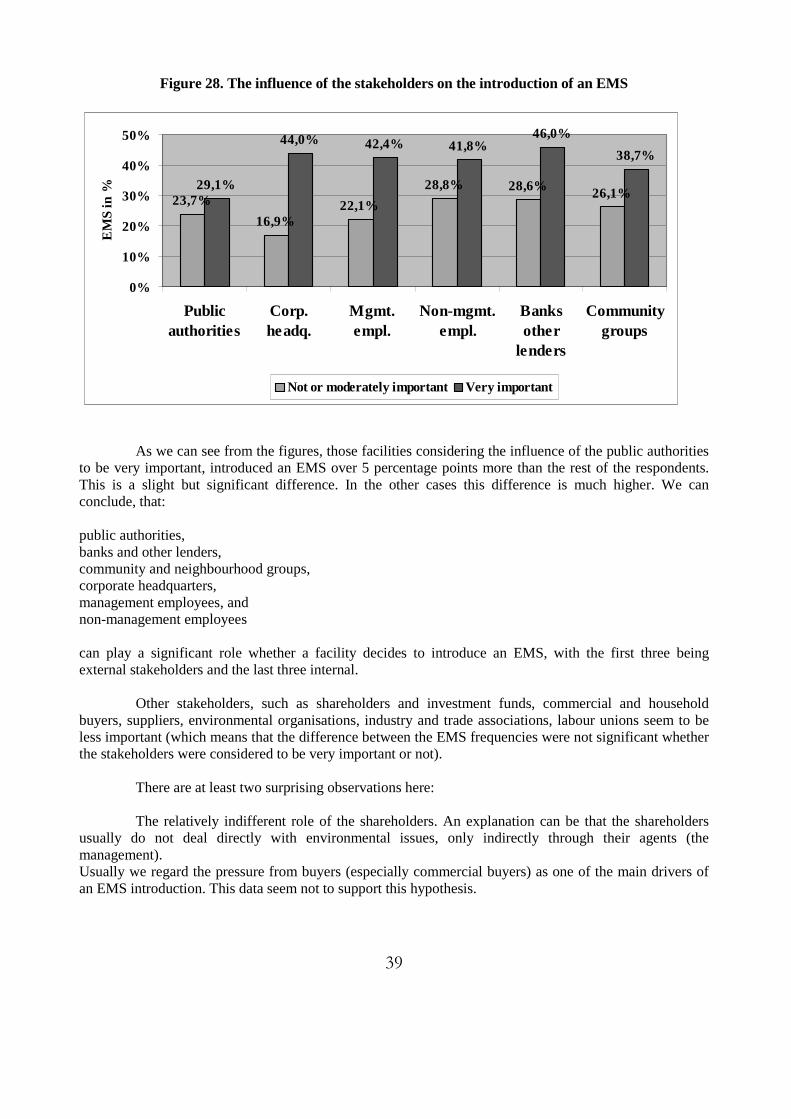
Figure 28. The influence of the stakeholders on the introduction of an EMS
23,7%
16,9%22,1%
28,8% 28,6% 26,1%29,1%
44,0% 42,4% 41,8%46,0%
38,7%
0%
10%
20%
30%
40%
50%
Publicauthorities
Corp.headq.
Mgmt.empl.
Non-mgmt.empl.
Banksother
lenders
Communitygroups
EM
S in
%
Not or moderately important Very important
As we can see from the figures, those facilities considering the influence of the public authorities to be very important, introduced an EMS over 5 percentage points more than the rest of the respondents. This is a slight but significant difference. In the other cases this difference is much higher. We can conclude, that: public authorities, banks and other lenders, community and neighbourhood groups, corporate headquarters, management employees, and non-management employees can play a significant role whether a facility decides to introduce an EMS, with the first three being external stakeholders and the last three internal. Other stakeholders, such as shareholders and investment funds, commercial and household buyers, suppliers, environmental organisations, industry and trade associations, labour unions seem to be less important (which means that the difference between the EMS frequencies were not significant whether the stakeholders were considered to be very important or not). There are at least two surprising observations here: The relatively indifferent role of the shareholders. An explanation can be that the shareholders usually do not deal directly with environmental issues, only indirectly through their agents (the management). Usually we regard the pressure from buyers (especially commercial buyers) as one of the main drivers of an EMS introduction. This data seem not to support this hypothesis.

40
5.2. Environmental motives
Figure 29 shows the main drivers of the environmental practices on average for the sample. The most important are regulatory compliance and technological issues (avoiding accidents). Corporate image is also considered to be very important. Market forces – developing new products and technologies or simply cut costs with the help of environmental practices – seem to be less important. A possible explanation for this can be that companies can lose a great deal with respect to the first three factors with a bad environmental performance, even in the short term. The benefits from the second three factors can only be realised in the middle or long run.
Figure 29. The most important motives with respect to environmental practices
Similar facilities do thesame
New product development
New technologydevelopment
Cost savings
Corporate profile/image
Prevent/control env.incidents
Regulatory complience
Not important M oderately important Very important
We also tried to examine the most important motives of companies to introduce an EMS. The data from Figure 30 support the findings of Figure 29. In this latter figure the most important factors are also the prevention of emissions, regulatory compliance, cost saving and the improvement of the companies’ image. When we move on to the analysis of the public environmental policy below, it is interesting to note that the motivation of regulatory authorities themselves is not really important based on our answers.

41
Figure 30. The most important motivation factors for introducing an EMS
To reduce applicability of some regulations
Regulators' incentives made it attractive
Other facilities are adopting similar systems
To create cost savings in terms of input use
To allow for differentiation of our products
To improve relations with regulatory authorities
To create cost savings in terms of waste mgmt.
To improve informations about facility's operation
To better identify future environmental liabilities
To improve facility's profile/image
To improve efforts to achieve regulatory compliance
To prevent/control pollution
Not important Moderately important Very important
5.3. Environmental obstacles
Beside the analysis of the different motivations, a brief summary regarding the obstacles of the environmental practices would also be very useful. Unfortunately there were not questions in the OECD questionnaire analysing this issue, however these data would be very useful for example when forming the public environmental policy. Here again we use the data from the 1999 survey (Kerekes et al.). Many possible inner an outer obstacles has been analysed there, the following Table 5 shows the 5 most important factors in both groups.
42
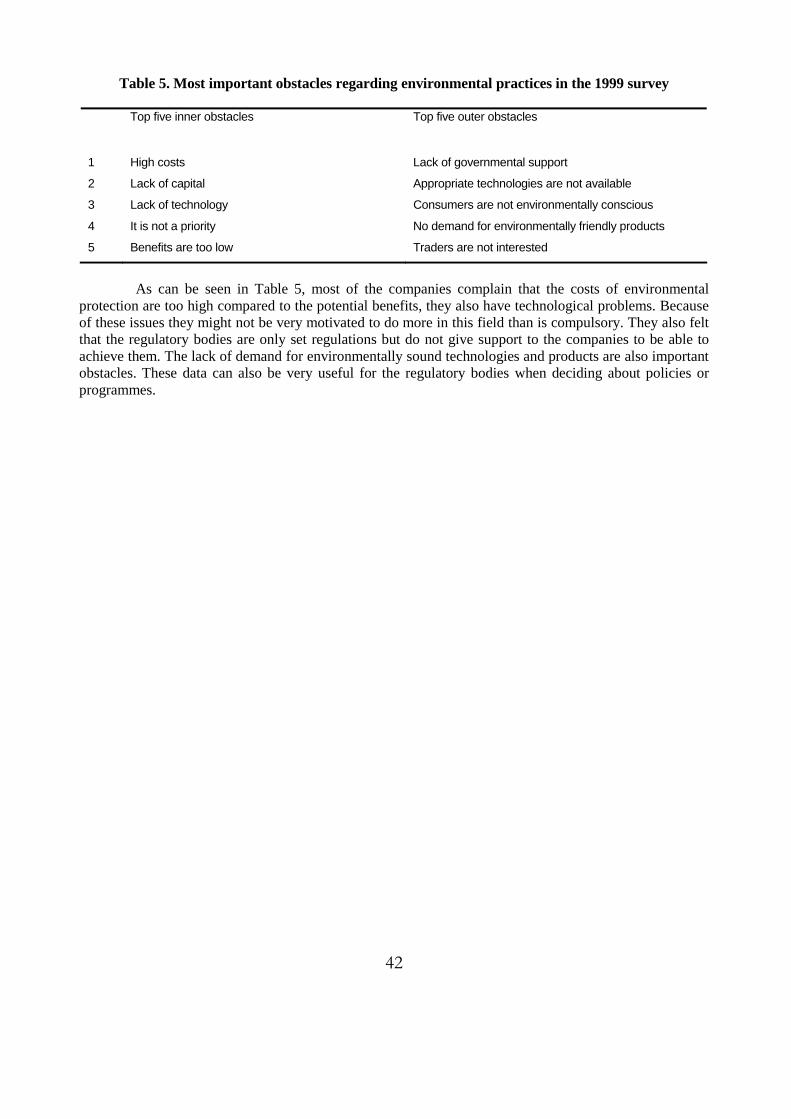
Table 5. Most important obstacles regarding environmental practices in the 1999 survey
Top five inner obstacles Top five outer obstacles
1 High costs Lack of governmental support
2 Lack of capital Appropriate technologies are not available
3 Lack of technology Consumers are not environmentally conscious
4 It is not a priority No demand for environmentally friendly products
5 Benefits are too low Traders are not interested
As can be seen in Table 5, most of the companies complain that the costs of environmental protection are too high compared to the potential benefits, they also have technological problems. Because of these issues they might not be very motivated to do more in this field than is compulsory. They also felt that the regulatory bodies are only set regulations but do not give support to the companies to be able to achieve them. The lack of demand for environmentally sound technologies and products are also important obstacles. These data can also be very useful for the regulatory bodies when deciding about policies or programmes.
43
6. THE ROLE OF PUBLIC ENVIRONMENTAL POLICY
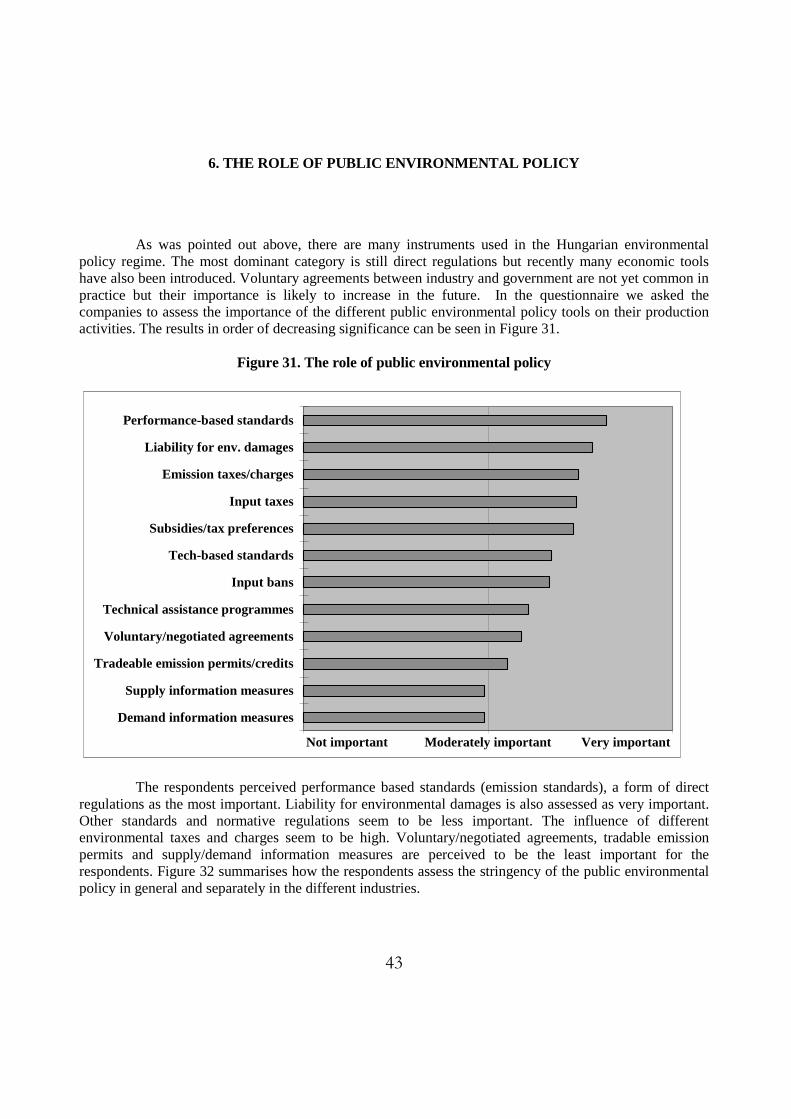
As was pointed out above, there are many instruments used in the Hungarian environmental policy regime. The most dominant category is still direct regulations but recently many economic tools have also been introduced. Voluntary agreements between industry and government are not yet common in practice but their importance is likely to increase in the future. In the questionnaire we asked the companies to assess the importance of the different public environmental policy tools on their production activities. The results in order of decreasing significance can be seen in Figure 31.
Figure 31. The role of public environmental policy
Demand information measures
Supply information measures
Tradeable emission permits/credits
Voluntary/negotiated agreements
Technical assistance programmes
Input bans
Tech-based standards
Subsidies/tax preferences
Input taxes
Emission taxes/charges
Liability for env. damages
Performance-based standards
Not important Moderately important Very important
The respondents perceived performance based standards (emission standards), a form of direct regulations as the most important. Liability for environmental damages is also assessed as very important. Other standards and normative regulations seem to be less important. The influence of different environmental taxes and charges seem to be high. Voluntary/negotiated agreements, tradable emission permits and supply/demand information measures are perceived to be the least important for the respondents. Figure 32 summarises how the respondents assess the stringency of the public environmental policy in general and separately in the different industries.
44
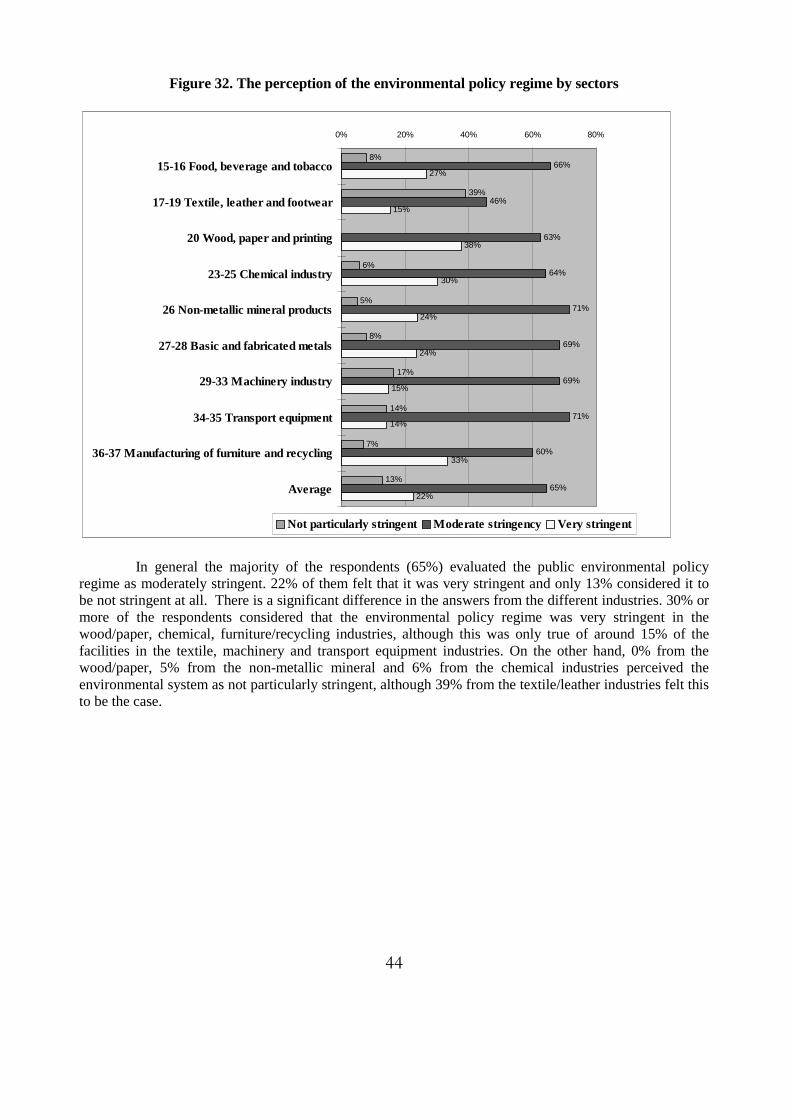
Figure 32. The perception of the environmental policy regime by sectors
8%
39%
6%
5%
8%
17%
14%
7%
13%
66%
46%
63%
64%
71%
69%
69%
71%
60%
65%
27%
15%
38%
30%
24%
24%
15%
14%
33%
22%
0% 20% 40% 60% 80%
15-16 Food, beverage and tobacco
17-19 Textile, leather and footwear
20 Wood, paper and printing
23-25 Chemical industry
26 Non-metallic mineral products
27-28 Basic and fabricated metals
29-33 Machinery industry
34-35 Transport equipment
36-37 Manufacturing of furniture and recycling
Average
Not particularly stringent Moderate stringency Very stringent
In general the majority of the respondents (65%) evaluated the public environmental policy regime as moderately stringent. 22% of them felt that it was very stringent and only 13% considered it to be not stringent at all. There is a significant difference in the answers from the different industries. 30% or more of the respondents considered that the environmental policy regime was very stringent in the wood/paper, chemical, furniture/recycling industries, although this was only true of around 15% of the facilities in the textile, machinery and transport equipment industries. On the other hand, 0% from the wood/paper, 5% from the non-metallic mineral and 6% from the chemical industries perceived the environmental system as not particularly stringent, although 39% from the textile/leather industries felt this to be the case.

45
Figure 33. The most frequently used environmental policies and programmes to encourage the use of an EMS
26%
33%
34%
36%
55%
61%
63%
64%
73%
73%
0% 20% 40% 60% 80%
W aiving env. regulations
Reduced frequency of inspections
Providing special recognition/award
Reducing stringency of regulatory thresholds
Providing preferences for public procurem ent
Providing information about the values of suchsystems
Providing technical assistance
Providing financial support
Expediting env. perm its
Consolidating env. perm its
We have already analysed the main motivations for the facilities to introduce an EMS. Here we examined the possibilities of the regulatory authorities to encourage the facilities to use an EMS. Only the minority of the respondents (18%), reported any encouragement from the authorities to introduce an EMS. These respondents assessed the importance (frequencies) of the different policies and programmes, as can be seen in Figure 33. In most cases the authorities show some flexibility in the administrative procedures, by expediting (73%) and consolidating (73%) environmental permits. The authorities can also give direct assistance for the introduction of an EMS: financial (64%), technical (63%). The least important practice is to ease the direct regulations. Perhaps the simplest possibility of the authorities is to provide positive marketing for the EMSs themselves and also for the companies applying for it. In spite of this, the latter measure does not seem to be very important in reality, although for example publishing a list of the companies applying such a system could also encourage their competitors to follow suit.

46
Figure 34. Frequency of inspections in the last three years
10%
18%19% 20%
5% 5% 6%
11%
7%
0%
5%
10%
15%
20%
25%
0 1 2 3 4 5 6 7-10 >11
Figure 34 shows the frequency of the inspections carried out by the environmental authorities. In the last 3 years 10% of the responding facilities were not inspected at all, 57% of them 1-3 times, 27% 5-10 times and only 7% more than 10 times. Although the number of the inspections depends on many factors (for example environmental risks and other characteristics of the activities, size of the facility) reducing their frequency might be an incentive for the companies to introduce an EMS, although this could generate strategic behaviour.
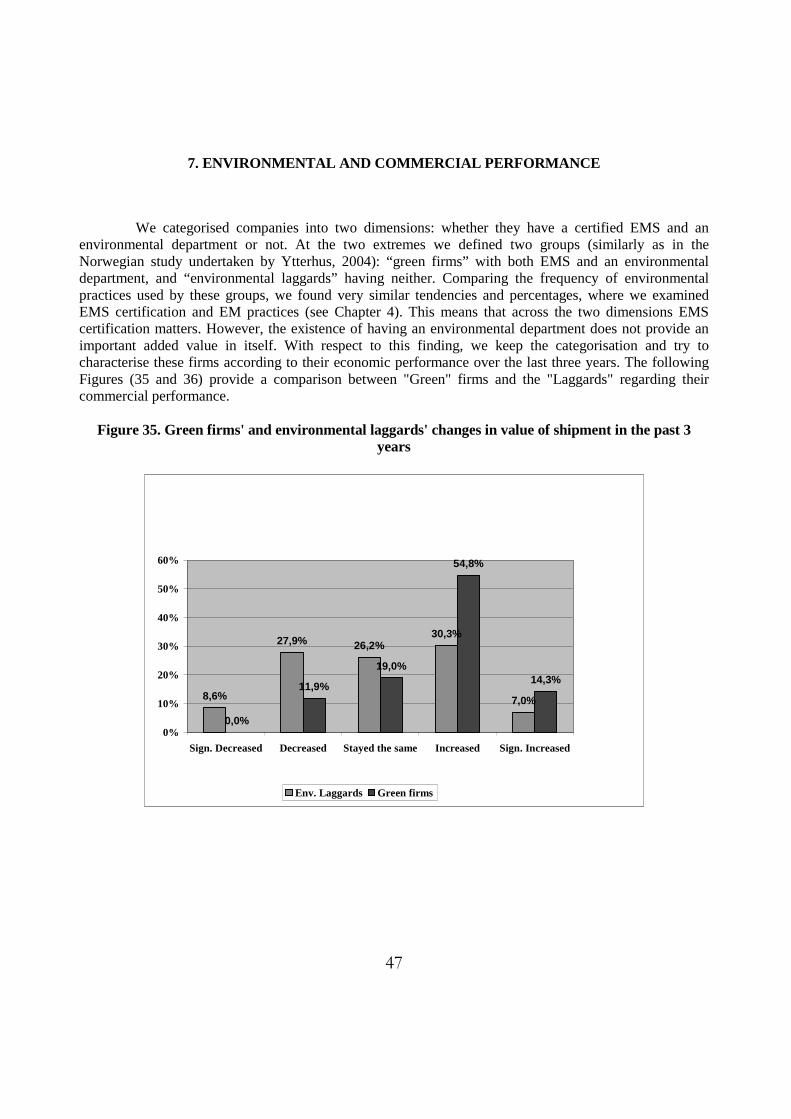
47
7. ENVIRONMENTAL AND COMMERCIAL PERFORMANCE
We categorised companies into two dimensions: whether they have a certified EMS and an environmental department or not. At the two extremes we defined two groups (similarly as in the Norwegian study undertaken by Ytterhus, 2004): “green firms” with both EMS and an environmental department, and “environmental laggards” having neither. Comparing the frequency of environmental practices used by these groups, we found very similar tendencies and percentages, where we examined EMS certification and EM practices (see Chapter 4). This means that across the two dimensions EMS certification matters. However, the existence of having an environmental department does not provide an important added value in itself. With respect to this finding, we keep the categorisation and try to characterise these firms according to their economic performance over the last three years. The following Figures (35 and 36) provide a comparison between "Green" firms and the "Laggards" regarding their commercial performance.
Figure 35. Green firms' and environmental laggards' changes in value of shipment in the past 3 years
8,6%
27,9% 26,2%30,3%
7,0%
0,0%
11,9%
19,0%
54,8%
14,3%
0%
10%
20%
30%
40%
50%
60%
Sign. Decreased Decreased Stayed the same Increased Sign. Increased
Env. Laggards Green firms

48
Figure 35 shows an even more apparent relationship between environmental management system certification and economic performance (reflected now in the value of shipments). In addition, from Figure 36 it is obvious that green firms were more likely to report earning profits than environmental laggards.
Figure 36. Green firms' and laggards' economic performance
4,6%
13,3%8,7%
62,2%
11,2%
0,0%
9,5% 9,5%
57,1%
23,8%
0%
10%
20%
30%
40%
50%
60%
70%
Large losses Small losses Break even Small profit Bigger profit
Env. Laggards Green firms
This data indicates that there is a tendency for firms with good environmental performance also to have better commercial performance. But we have to be aware that we cannot simply take any of these variables as independent and the other as dependent. The only thing we may conclude that these issues seem to move parallel together. More detailed econometric analysis is required to tease out the nature of the relationship.
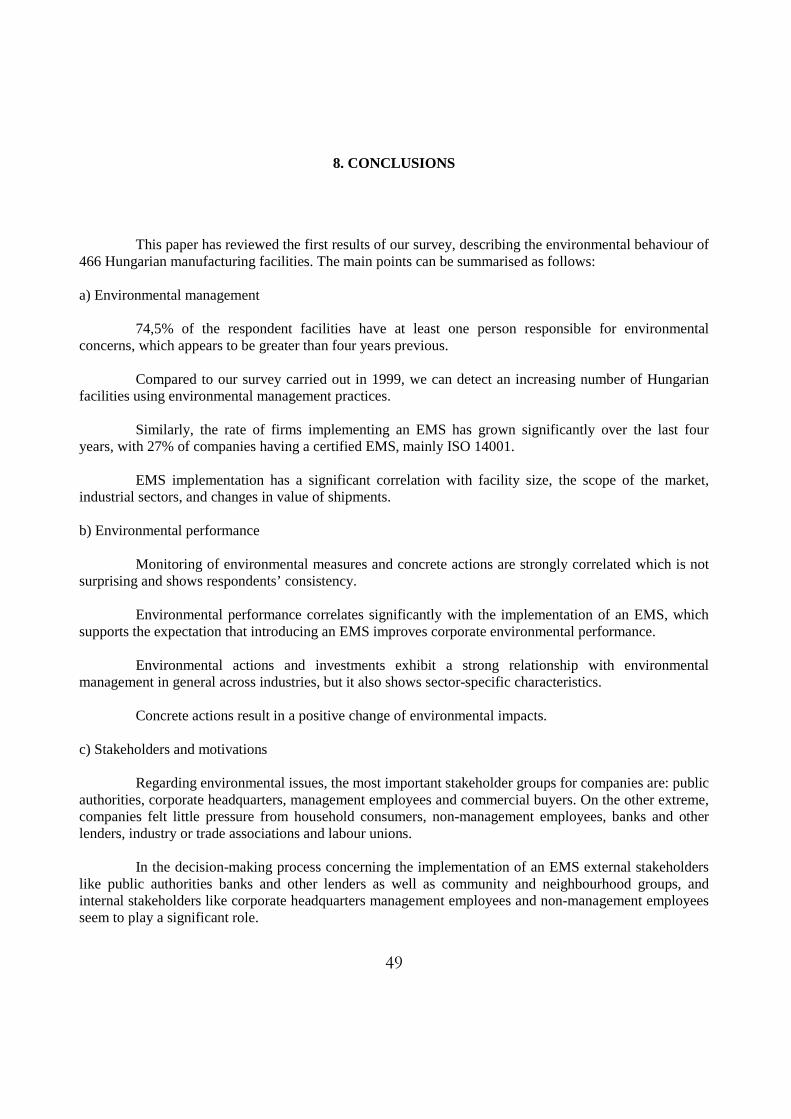
49
8. CONCLUSIONS
This paper has reviewed the first results of our survey, describing the environmental behaviour of 466 Hungarian manufacturing facilities. The main points can be summarised as follows: a) Environmental management 74,5% of the respondent facilities have at least one person responsible for environmental concerns, which appears to be greater than four years previous. Compared to our survey carried out in 1999, we can detect an increasing number of Hungarian facilities using environmental management practices. Similarly, the rate of firms implementing an EMS has grown significantly over the last four years, with 27% of companies having a certified EMS, mainly ISO 14001. EMS implementation has a significant correlation with facility size, the scope of the market, industrial sectors, and changes in value of shipments. b) Environmental performance Monitoring of environmental measures and concrete actions are strongly correlated which is not surprising and shows respondents’ consistency. Environmental performance correlates significantly with the implementation of an EMS, which supports the expectation that introducing an EMS improves corporate environmental performance. Environmental actions and investments exhibit a strong relationship with environmental management in general across industries, but it also shows sector-specific characteristics. Concrete actions result in a positive change of environmental impacts. c) Stakeholders and motivations Regarding environmental issues, the most important stakeholder groups for companies are: public authorities, corporate headquarters, management employees and commercial buyers. On the other extreme, companies felt little pressure from household consumers, non-management employees, banks and other lenders, industry or trade associations and labour unions. In the decision-making process concerning the implementation of an EMS external stakeholders like public authorities banks and other lenders as well as community and neighbourhood groups, and internal stakeholders like corporate headquarters management employees and non-management employees seem to play a significant role.
50
Surprisingly, the influence of shareholders and the pressure of buyers on EMS implementation is considered to be significantly lower than expected. The main drivers of the environmental practices are regulatory compliance, technological issues, and corporate image. When implementing an EMS, the most important factors are: prevention of emissions, regulatory compliance, cost saving and improving corporate image. Interestingly, motivation from regulatory authorities themselves is not really important, based on the answers. d) Obstacles The top five internal obstacles regarding environmental practices are: high costs, lack of capital, lack of technology, other priority, low benefits. The most frequently mentioned external obstacles are: lack of governmental support, appropriate technologies are not available, consumers are not environmentally conscious, there is no demand for environmentally friendly products, and traders are not interested. e) The role of public environmental policy Respondents perceived performance-based standards (emission standards) as the most important policy influence. Liability for environmental damages is also assessed as very important, and the influence of different environmental taxes and charges seem to be high as well. At the other extreme, voluntary/negotiated agreements, tradable emission permits and supply/demand information measures are perceived to be the least important for the respondents. The majority of the respondents (65%) evaluated the public environmental policy regime as moderately stringent, but we find a significant difference in the responses of differenet industries. The minority of the respondents (18%) felt any encouragement from the authorities to introduce an EMS. Most of them said the authorities show some flexibility in the administrative procedures, by expediting (73%) and consolidating (73%) environmental permits. Furthermore, authorities can give direct – financial (64%) or technical (63%) – assistance for the introduction of an EMS.
As a general conclusion we can say that the environmental performance of Hungarian firms has definetely improved during the last four years. Companies tend to use more and more environmental management practices, and are implementing EMS in greater numbers. When exploring the motivation structure – such as the influence of stakeholders, driving forces, obstacles and the role of public environmental policy – behind corporate actions regarding environmental issues, decision-makers can rethink the package of tools to make companies interested in improving their environmental performance in the future in Hungary. On-going analytical work undertaken in the context of this project will provide guidance in this area.
51
REFERENCES
Ekins Paul [1999] ‘European environmental taxes and charges: recent experience, issues and trends’ Ecological Economics 31 (1999) 39-62.
OECD [1996] Implementation Strategies for Environmental Taxes. OECD, Paris, 1996.
Kiss, Károly-Kerekes, Sandor [2000] ‘Basic environmental requirements for EU Accession: An impact study on Hungary’ Environment, development and sustainability 2: 59-74, 2000.
Környezetvédelmi szempontok az EU-val folytatandó csatlakozási tárgyalásokhoz [1998]: . Szerk. Láng István, Kerekes Sándor, Kiss Károly, Bulla Miklós, MTA Stratégiai kutatási programok, Zöld Belépõ, 1. sz. füzet, BKE Környezetgazdaságtani és technológiai tanszék 1998.
OECD Környezeti Adattár, 1997. KöM, [1998]: szerk. Szabó Elemér, Pomázi István, Buzás Kálmánné. Pp.168
Pomázi István [1998]: Az Európai Unió környezetpolitikája és a szabályozás várható tendenciái. MTA Stratégiai kutatások, Zöld Belépõ 44. sz. füzet, BKE Környezetgazdaságtani és Technológiai Tsz., 1998.
Török Ádám [1997]: Ipar- és versenypolitika az Európai Unióban és Magyarországon. Európai Tükör, Műhelytanulmányok, 2. Budapest.
Tyteca Daniel [?????] Using Environmental Indicators for Business? - A Literature Review and the Need for Standardisation and Aggregation of Data ?????????
World Bank [1998]. Hungary: Complying with EU Environmental Directives.