Embed Size (px)
Citation preview

Erasmus University Rotterdam
MSc in Maritime Economics and Logistics
2013/2014
Environmental performance for cruise port’s competitiveness: The case of Piraeus
by
Virginia Maria Chinti
Copyright © Virginia Maria Chinti

ii
‘Tell a great story that makes you distinct and different from competitors. An environmentally conscious road map is vital to start with’

1
Acknowledgements
The increased complexity in today’s world partially explains why one in two people hold a master, or even doctorate degree, in their hands. This is considered to be their ticket to a better future; however, it is more than the process of the degree accomplishment. There is a living energy in it; one you can probably feel only after it is over. As you hold it, it has the power to change your life for the better, unrelated if your future associates with its title or not. This past year was about ups and downs, great joys and great losses, yet, the outcome turned out to be positive with a lot new knowledge and interesting social interactions. In this context, this thesis is the last step to the completion of this academic year and a step closer to my own golden ticket.
It could not have been completed though, without the help of some very important and special people. Firstly, I am deeply thankful to my supervisor, Elvira Haezendonck, for the helpful feedback and her vital part in transforming the document into this thesis. I extend my gratitude to all my colleagues that contributed to make this experience memorable and valuable for future decisions. Finally, I would like to express my love and gratitude to my mother, not so much for the financial, but her loving support and last but not least is my wonderful Sophia, for her supportive words and love even she is here with me or not.

2
Abstract
Cruise has experienced substantial growth the last decades; it is though also generating major environmental challenges. In the context of implication that a cruise port with a good environmental track record, is also benefited compared to its competitors the general aim though is twofold. Firstly, to identify the role of environmental performance in cruise port competitiveness and to investigate how this might be a supportive competitive factor for the port of Piraeus. Six key areas of environmental challenges have been analyzed as essential for any approach towards a ‘greener’ port and then, port portfolio analysis technique and extensive literature review will be used in order to reach the first objective and a green portfolio with the aid of a questionnaire will provide the insights for the second one. Due to the fact that the existing academic literature on cruise ports is scarce and does not cover well the recent challenges, primary data will be use to gain a better understanding and formulate policy recommendations for the port of Piraeus. At last this paper will attempt to provide a deeper understanding of the cruise sector’s dynamics in the European port system, as well as the environmental issues arose from it.

3
Erasmus University Rotterdam ----------------------------------------------------------- i
Acknowledgements ------------------------------------------------------------------------ 1
Abstract --------------------------------------------------------------------------------------- 2
List of Tables -------------------------------------------------------------------------------- 6
List of Abbreviations ---------------------------------------------------------------------- 7
1 Introduction ---------------------------------------------------------------------------- 8 1.1. The aim of the study --------------------------------------------------------------------- 8 1.2. Research strategy ------------------------------------------------------------------------ 9 1.3. Limitations of the study --------------------------------------------------------------- 12
2 Theoretical part - Literature review ------------------------------------------- 13 2.1. Green stimulus -------------------------------------------------------------------------- 13 2.2. Cruise Stimulus ------------------------------------------------------------------------- 14 2.2.1. Issues & Impacts/ Key environmental challenges --------------------------------- 16
I. Resources and Waste -------------------------------------------------------------------- 17 II. Biodiversity ------------------------------------------------------------------------------- 17 III. Land Use and Soils ---------------------------------------------------------------------- 18 IV. Water-------------------------------------------------------------------------------------- 18 V. Atmosphere ------------------------------------------------------------------------------- 18 VI. Energy ------------------------------------------------------------------------------------ 19
2.3. List ------------------------------------------------------------------------------------------ 19
3 Cruising the Mediterranean Sea ------------------------------------------------- 23 3.1. Description of the market ------------------------------------------------------------ 23 3.2. Port of Piraeus -------------------------------------------------------------------------- 24 3.2.1. The port of Piraeus in the context of Greek port system -------------------------- 24 3.2.2. Characteristics of the Port of Piraeus ------------------------------------------------- 25
4 Empirical part of the thesis ------------------------------------------------------- 26 4.1. Port Portfolio Analysis (PPA) ------------------------------------------------------- 26 4.1.1. Identification of key ports -------------------------------------------------------------- 28 4.2. Level 1 ------------------------------------------------------------------------------------- 31 4.3. Level 2 ------------------------------------------------------------------------------------- 32 4.3.1. Port of Barcelona ------------------------------------------------------------------------- 33 4.3.2. Port of Civitavecchia --------------------------------------------------------------------- 34 4.3.3. Port of Venice ----------------------------------------------------------------------------- 35 4.3.4. Port of Piraeus ---------------------------------------------------------------------------- 36 4.3.5. Port of Marseille -------------------------------------------------------------------------- 37 4.3.6. Port of Balearic islands ------------------------------------------------------------------ 38 4.4. Level 3 ------------------------------------------------------------------------------------- 39 4.5. Level 4 ------------------------------------------------------------------------------------- 41 4.6. Conclusions on the four levels of PPA --------------------------------------------- 42
5 Green Analysis ----------------------------------------------------------------------- 44 5.1. Survey ------------------------------------------------------------------------------------- 44 5.1.1. The Questions ----------------------------------------------------------------------------- 44 5.1.2. The Respondents ------------------------------------------------------------------------- 45 5.1.3. Analysis ------------------------------------------------------------------------------------ 46 5.2. Green portfolio -------------------------------------------------------------------------- 47

4
5.3. Interviews -------------------------------------------------------------------------------- 50 5.4. What the future holds: Recommendations for the port of Piraeus -------- 51
6 Conclusions --------------------------------------------------------------------------- 53
Bibliography ------------------------------------------------------------------------------- 55
Appendices -------------------------------------------------------------------------------- 71 Appendix I ---------------------------------------------------------------------------------------- 71 Appendix II --------------------------------------------------------------------------------------- 72 Appendix III -------------------------------------------------------------------------------------- 75 Appendix IV -------------------------------------------------------------------------------------- 77

5
List of Figures Figure 1: Structure of the thesis.............................................................................. 11 Figure 2: Cruise key environmental areas .............................................................. 16 Figure 3:Global Passenger Growth 1990-2014 ....................................................... 23 Figure 4: Port industry matrix, own compilation based on Haezendonck (2001) ..... 27 Figure 5:Data selection criteria ............................................................................... 29 Figure 6: Mediterranean Cruise ports included in the analysis ................................ 30 Figure 7: Portfolio of ports for the total traffic .......................................................... 31 Figure 8: Traffic structure analysis for the port of Barcelona ................................... 33 Figure 9: Traffic structure analysis for the port of Civitavecchia .............................. 34 Figure 10: Traffic structure analysis for the port of Venice ...................................... 35 Figure 11: Traffic structure analysis for the port of Piraeus ..................................... 36 Figure 12: Traffic structure analysis for the port of Marseille ................................... 37 Figure 13: Traffic structure analysis for the Balearic Islands seaports .................... 38 Figure 14: Cruise Traffic Analysis for the six ports in the range .............................. 40 Figure 15:Cruise traffic versus Total Traffic for the six ports, 2010-2013 ................ 42 Figure 16: Green portfolio (adjusted in the fourth level of PPA) .............................. 48

6
List of Tables Table 1: Framework of green cruise port attractiveness, own compilation of the
author .............................................................................................................. 22 Table 2:Cruise Traffic Statistics for the six ports in the range Source: own
compilation based on throughput data respective port authorities ................... 40 Table 3:Composition of the respondents ................................................................ 46 Table 4:Cruise Ports per passengers' size. Category A (>130.000 pax), 2013 ....... 71 Table 5: Average Growth Rates and Market Shares for the port of Barcelona, years
2010-2013. ...................................................................................................... 72 Table 6: Average Growth Rates and Market Shares for the port of Civitavecchia,
years 2010-2013 ............................................................................................. 72 Table 7: Average Growth Rates and Market Shares for the port of Venice, years
2010-2013. ...................................................................................................... 73 Table 8: Average Growth Rates and Market Shares for the port of Piraeus, years
2010-2013. ...................................................................................................... 73 Table 9: Average Growth Rates and Market Shares for the port of Balearic islands,
years 2010-2013. ............................................................................................ 74 Table 10: Average Growth Rates and Market Shares for the port of Marseille, years
2010-2013. ...................................................................................................... 74

7
List of Abbreviations BCG Boston Consulting Group
EMS Environmental Management Systems
ESPO European Sea Ports Organization
ISO International Organization for Standardization
Med Mediterranean
OLP Organismos Limenos Piraeus
Pax Passengers
PERS Port Environmental Review System
PPA Port Portfolio Analysis
SPA Strategic Positioning Analysis
UNCTAD United Nation Conference on Trade and Development
WTO World Trade Organization

8
1 Introduction
While port discussion is preoccupied with container markets, the cruise segment continuous strengthening. Cruise tourism remains a major international area of growth, consisting one of the most dynamic tourism, as well as shipping, sectors with an average annual growth of approximately 8.5%. (Sweeting and Wayne, 2003; CLIA 2014) When we think of cruises, the majority considers a negative image regarding environmental issues – one of a polluting business, which is spilling oil and dumping garbage at sea. Cruise ships certainly have an environmental impact; and the sector’s growth may enhance this matter, though as always happens during hard times, several opportunities exist.
Rodrigue (2012) studied cruise itineraries and pointed out that companies pay a lot of attention to the process of selecting the ports they visit as a means of distinguishing themselves. In addition, Adams, Quinonez, Pallis & Wakeman, (2009) found that many of the undesirable effects on the environment directly associated with cruise ships can be harmful also for the ports they visit. The destinations included in cruise itineraries have a lot to gain or sometimes lose; either way though, ports provide a key interface between ship and destination, and for this reason the need to address many of the issues of importance to cruise ships is vital. In case ports themselves can result better off; then certainly the need to address these issues becomes particularly interesting.
The large increase in cruises and the number of ships involved in recent years led to my decision to investigate this sector. In addition, my involvement with the port of Piraeus since my BSc summer internships; and my interest in ports in general, gave the final shape to this decision.
The thesis starts with an introduction to the areas that must be considered in order to increase a cruise port’s attractiveness and further continuous with an empirical analysis thoroughly explained in next sections. Due to the fact that the existing academic literature on cruise ports is scarce and does not cover well the recent environmental challenges, this thesis aims at providing a deeper understanding of the cruise sector’s dynamics in the European port system, as well as the environmental issues arose from it.
1.1. The aim of the study
The general aim of this study is twofold; to identify the role of environmental performance in cruise port competitiveness and to investigate how this might be a supportive competitive factor for the port of Piraeus.
To achieve this; the first aim is to identify whether environmental performance of a cruise port really counts. Then, by positioning relevant competing ports based on their ‘greenness’, the second part of this thesis will empirically test Piraeus’ status. The focus of this analysis will be the Mediterranean region for two reasons. Namely, the answer to the first question is likely to differ per region as there is not a unique

9
way of dealing with environmental issues and secondly, in order to conduct a benchmarking analysis such limitations are required to be considered to frame the results.
This study has the intention to expand the existing knowledge on cruise port’s environmental performance as a supportive competitive factor, in order to answer thoroughly and legitimately each research sub question below. Taking into account the ambitions appeared towards understanding the environmental behavior of ports, the research questions are:
- What constitutes an attractive cruise destination?
- What are the key green determinants specifically influencing the cruise segment?
o Which are the most important?
- How important is environmental performance in a port’s competitiveness?
- Where is Piraeus positioned among its main competitors in the Mediterranean region?
- Which of the determinants, existing in leading cruise ports, could enhance
Piraeus’ position?
Our research strategy towards understanding the role of environmental performance is based on a survey on the current status of ports in the Mediterranean. To answer the first two questions, an in depth analysis of the existing literature is needed, concluding with a list that includes the critical ‘green’ determinants related to the cruise segment. The next question will be answered with the aid of a questionnaire, conducted online to cruise shipping lines and other cruise experts (mainly located in Greece). This method was chosen, as it is not practical or feasible to depend exclusively on what ports report for the answer.
To answer the fourth question a Port Portfolio Analysis will be performed. This method aims to the positioning the Port of Piraeus with respect to its rivals in Mediterranean, i.e. Barcelona; Civitavecchia; Venice; Marseille; and Balearic Islands. After the conduction of PPA technique, it will be possible to conclude whether the port of Piraeus is better or worse positioned against its competitors in terms of environmental performance.
Face-to-face interviews will provide a glance through environmental initiatives adopted by the port of Piraeus, as well as experts’ perceptions. Finally an in depth analysis of the criteria underlying Piraeus’ competitive position along with the aforementioned initiatives and strategies existing in leading cruise ports, will formulate the concluding policy recommendations.
1.2. Research strategy
The framework is based on a review of numerous documents and recent organization and port reports relating to key aspects of environmental cruise

10
challenges, including:
- Case study examples demonstrating best practice strategies which have been implemented in Europe and especially the North Sea region;
- Cruise line sustainability reports; publications on specific impacts of the cruise industry; publications associated with port’s management practices and publications regarding sustainable tourism in general;
- Environmental reports published by various ports worldwide.
- Annual reports of the respective ports from the last five years.
- Business plans 2010-2013.
- Press releases from 2013 until 2014.
- Presentations from executives of the Port of Piraeus and the Association of Mediterranean cruise ports. (Medcruise)
This paper contains an analysis of the environmental factors that influence cruise ports competitiveness, based on a literature review and expert interviews in the Mediterranean cruise industry. In addition, built on the portfolio analysis conducted, and coupled to the expert interviews, an assessment of the port of Piraeus positioning is presented in several levels. Another objective was to estimate the relative contribution of each determinant; and at the end to provide strategies and recommendations for the respective port. A more detailed illustration of this thesis structure, is presented in the following figure:

11
Figure 1: Structure of the thesis
Source: own compilation of the author
Introduction
Green Cruise Stimulus
Key Challenges
&List of green determinants
Cruising the Mediterranean Sea
•Description of the market
PPA
•Level1
•Level2
•Level3
•Level4Survey & Interviews
Green Portfolio
Recommendations for Piraeus
The end

12
1.3. Limitations of the study
As in every research, there are constraints on which method to use and characteristics that influence the application or interpretation of the results. In the same context, several limitations of the study regarding cruise ports’ environmental performance exist in order to establish validity of results.
First is the lack of available or reliable data that has led up to the exclusion of ports from the data selection process. The instabilities and current conditions that Egyptian ports have experienced in the recent past, led to absence of on time data collection. Whereas, the very limited availability of historic cruise passenger statistics accessible in Turkey was the reason of not considering these ports in the range development. Second, for the purpose of this paper, environmental performance is limited to traditional environmental concerns of the last century, i.e., water quality, air quality, land quality and hazardous materials handling. Third, the limited transparency of the data collection and the low rate of response on e-mails regarding this matter, made it impossible for the author of this study to develop an analysis of a ten years period. And for the same reason unfortunately, the 2008 crisis is not in the period considered, although it would be interesting to see the link between these two. Fourth, due to the very recent introduction of Black Sea ports into the cruise itineraries, they have not yet come across massive passenger numbers and therefore results on their environmental performance was not apparent or reliable at the time of analysis. Fifth, alternative choices i.e. air or land travel, have not been considered as it was not assumed to be useful for the findings of this paper. The aim of this study is to identify whether a cruise port’s environmental performance can benefit the port itself, and not measure this port’s harm on the environment. Last, since the design of this study relied on data collected mainly from a significant though local cruise market, the peculiarities of the particular market may be reflected on the findings of the case study and some bias might exist.
13
2 Theoretical part - Literature review
2.1. Green stimulus
Over the last few years, environmental and safety considerations are very prominent in community groups’ strategy. Authorities and international organizations began focusing on environmental issues last century, mostly as a result of some catastrophe. Today, it is widely accepted that environmental issues should be considered as strategic in a growing number of sectors; it is also generally claimed that a shift from a traditional reactive approach of environmental issues to a more proactive attitude is vital to benefit from business opportunities. (Hunt& Auster, 1990)
For quite some time, shipping industry has been off the environmental radar screen. However, ports play a pivotal role in human civilization and commerce by serving as catalysts for economic growth and development (World Bank, 2013). As shipping volumes are set to rise considerably over coming decades (ASCE 2012) and the importance of ports to the global economy will continue to grow (Levinson 2008), ports have reasonably become points of interest when setting environmental priorities.
Several related studies enhance the urgency of this matter. Notteboom (2007) noticed that as the economic value of a port development project is taken for granted; the argument concentrates on the environmental criteria. Similarly, recent studies discuss the fact that the last decades have seen an increasing awareness of port’s environmental impact and the negative effects they generate. (Lam & Notteboom 2014; Haezendonck 2004;) In 2007,Comtois and Slack report the green practices adopted by ports through the recent years. And in the same vein, Dooms and Haezendonck (2006) provide a green port portfolio analysis examining changes in strategies and environmental performance.
Among the crucial conflicts that ports confront, is the growing concern expressed by citizens in local communities about water; air quality; and from a broader perspective, about global warming and the respective contribution that shipping and port activities have. This new stream of research is therefore an addition in port’s agendas, seeking to distinguish gaps where new strategies might be developed towards the successful ‘greening’ of the port industry. It is noteworthy, at this point, to examine the motives and drivers that a port may invest on this matter.
Growing environmental concerns pose the biggest challenge for the sector. Thus, among the numerous and varied reasons that a port may invest in improving its environmental performance, regulatory compliance comes first. Due to the high price associated with negative externalities, port industry has to address its impacts and integrate them in their strategic planning and decision-making. Lam et. al (2014) as well, argue that social responsibility has become critical. In the last decade, as public is increasingly concerned; environmental aspects put additional pressure on ports to improve their performance as a matter of conscience. Consequently, in order to guarantee community support, ports must demonstrate a high performance level to result enjoying direct economics benefits. (Lekakou et. al, 2009) Another major motivation for investing in environmental management is in the process of attracting trading partners or potential investors. A port with a strong environmental

14
record and a high level of community support is likely to be favored from a one that does not. (Haezendonck, 2001)
Reasons also given, include operational issues and the gain of competitive advantage, as part of the stronger focus of many ports on improving their ‘green’ image (Adams, Quinonez, Pallis & Wakeman, 2009; Lam et. al, 2014) Adams et. al, (2009) that thoroughly examines this matter; states that meeting these challenges by improving a port’s environmental performance has been typically perceived as additional cost that hampers a port’s effort to compete and going beyond compliance in general, is not perceived as a strategy to gain a competitive advantage. Still, some have suggested that a port’s environmental compliance could benefit port’s competitiveness.
Nijkamp (1999) states that those ports that embark on environmentally friendly initiatives gain a competitive edge in relation to those that do not, likewise Verhoeven (2010) argues that ports which focus on improving their green image and developing environmental strategies are likely to be preferred. According to Haezendonck (2001), when failing to consider environmental impacts, strategic port decisions and actions could negatively affect the ability of the port to compete relative to others in the range. In addition, Slack (2010) addresses extensively the importance of being ‘green’ the day after crisis ends.
Up till now, for many ports around the world, environmental issues are not yet top of mind. It is a shame that the level of engagement in the issue by managers in ports seriously concerned, does not provide stronger guidance for port managers elsewhere. Nonetheless, the future suggests that there will continue to be regulations and more requirements to fulfill, therefore by not thinking in terms of competitive advantages, ports might be missing a business opportunity to improve their position.
2.2. Cruise Stimulus Cruises have been one of the most dynamic maritime sectors in recent years. A large increase in the number and size of vessels in consort with the expansion of destinations and itineraries are shaping the whole sector. However, this rapid growth over the last decades has not only created great success and opportunity for destinations, but also an initiate of major environmental challenges. (ESPO 2014) Likewise, the final choice has serious economic, social and environmental impacts on the ports they choose to visit. (Vaggelas, 2011) As stressed out in the previous section this might be uneasiness for seaports, but as regards cruise ports it certainly is problematic.
When we think of cruises, the majority considers the luxury ships themselves as the attraction — not the ports they visit. Rodrigue (2012) studied cruise itineraries from all over the world and found that companies pay a lot of attention to the selection process of visiting ports as a mean of distinguishing themselves. Therefore, as cruise ports act as the key interface between vessels and destination and the cruise port selection is of importance for the whole sector, each and every environmental issue arising could potentially influence all cruise activities and operations. Recent literature on cruise port selection criteria does not identify environmental
15
performance of destination as significant, although this thesis implies that is a crucial factor to consider. In this context, it would worth examining what constitutes an attractive cruise port and how environmental performance might influence this decision.
The principle of the scheduled and offered itineraries is not the transport service itself, but the provision of customer satisfaction. (Kendall, 1986) Yet passengers’ satisfaction is not the sole determinant, cruise ships must have access to numerous factors, in order to facilitate ships and passengers. As addressed by Marti (1990), the existing determinants are divided into site and situation characteristics. In particular, the former category refers to physical factors particularly significant for a cruise port such as, port infrastructures and superstructures. A port’s situation conditions, on the other hand, refer to physical or cultural qualities as cruise passengers’ proximity to markets and the regional attractiveness for cruising.
McCalla (1998), predominantly based on the aforementioned work, used the site and situation concept to examine the factors affecting the attractiveness of a port from the cruise ports point of view and concluded that site determinants are of major importance. Yet, Lekakou, Pallis, and Vaggelas (2009) argue that, cruise companies’ point of view is the most crucial to consider, and suggest that both “site” and “situation” factors are significant in the selection process. The findings of this study, to be discussed in later chapters, are particularly important. Independently of which side is the most accurate, there are empirical findings supporting that environmental performance of a port is not irrelevant.
Lam et al. (2014) report that shipping and cruise lines have expressed an interest in port environmental performance. Most importantly for Mediterranean region, Corres’ study concludes that as the size of cruise ships is growing, so does the public’s awareness of environmental issues. (Corres,2012) Therefore, as destinations that offer one-of-a-kind unspoilt environments are attractive to many tourists; conversely for that reason, as the availability of high quality natural assets is perceived as a contributing factor to cruise port selection, some of that responsibility lies with the destinations. Situation characteristics therefore; directly hamper a port’s effort to be attractive, yet site elements might also indirectly harm the natural magnetism of a port.
Having stated the above, it is obvious that the environmental issues related to the cruise segment should be considered from a port’s perspective, as it is considered as an industry highly dependent on natural environment quality. Cruise shipping lines have to comply with increasing number of environmental regulations; and that, in turn, puts higher pressure on the ports they use. On the landside, cruise ports are required to cope with more ships using their facilities; massive passenger influxes
and higher regulatory−societal requirements. In such a changing environment, port
authorities and related companies play a catalytic role in the ‘greening’ of port operations and management, though if both positive and negative impacts managed effectively; the most beneficial results for all actors involved, can be achieved.
Despite the increasing importance of environmental issues and the need for cruise ports to act pro-actively in today’s competitive environment, the majority of the cruise studies have neglected these matters. Relevant literature remains focused mainly on the economic impact of cruise operations for the port, the city, or even the

16
region. Building further upon the existing literature, this thesis focuses on environmental issues related to the cruise segment.
2.2.1. Issues & Impacts/ Key environmental challenges
Seaports consist of major sources of air, noise and water pollution, particularly due to the concentration of industrial and logistics activities in port areas. As natural resources become scarcer, every aspect of their operations and development has been placed under scrutiny. As regards cruise ports; the previous section enhanced the fact that they have an additional stimulus to integrate economic and environmental objectives, as natural environment is of high importance for this industry. It becomes, therefore, particularly interesting for this study to highlight the environmental issues arising and the way the factors involved are responding to the opportunities and challenges now and in the future.
For the purposes of this paper, the process of environmental challenges identification will focus on the European port sector. Port authorities, relevant organizations, cruise shipping lines and researchers have been examining the environmental priorities of port sector since back in 1996 through regular respective surveys. (ESPO 2013) Priorities vary with time but certain components retain their significance. Different sizes of ports confront different environmental challenges. Similarly, environmental priorities are influenced by the geographical characteristics of the port.
After extensively examining port’s documentation of the last five years and recent literature in port’s environmental priorities, six key areas of environmental challenges have been traced as essential for any approach towards a ‘greener’ port. The figure below illustrates the aforementioned challenges, which need to be addressed in order to improve a cruise port’s attractiveness.
Figure 2: Cruise key environmental areas
Source: own compilation of the author
Resources and Waste
Biodiversity
Land use and soils
Water
Atmosphere
Energy

17
I. Resources and Waste
Cruise ships generate huge volumes of non-hazardous solid waste on a daily basis, and this waste must be managed effectively. By all accounts, the scale of problem is immense; the average cruise ship generates seven tons of solid waste every day. (International Maritime Organization, 2014) Traditionally, important share of this waste has been dumped at sea, but recent years environmental regulations on this matter is becoming increasingly strict1. Regular forms of waste include glass, paper, plastics, aluminum, food et cetera. However, cruise ships also produce a range of hazardous wastes (such as batteries; dry cleaning fluids; and hospital wastes) that must be taken care in order to avoid further pollution.
Waste management requires following the waste hierarchy from the side of the cruise ship but it is also an important issue from a port’s perspective. Therefore, if appropriate strategies have been implemented to reduce waste production, reuse where feasible and recycle what has remained. In ports turn, they should provide adequate shore side facilities to deal with these wastes. Both ports and destinations also have to manage their own use of materials and wastes production. The reason to eliminate the use of materials and manage waste in a proper way has clear economic incentives and is an issue of increasing concern for the cruise industry today.
II. Biodiversity
This category includes issues that preserve biodiversity, such as the protection of species and the integrity of ecosystems. Cruise ships mostly affect biodiversity through ballast water or by generating waves that can harm nearby coastal destinations.
Cruise ships and other large vessels such as tankers and bulk carriers use large volumes of ballast water to stabilize the vessel. Ballast water is regularly taken on in the coastal waters of one region and discharged at the next port of call. It is estimated that ballast water transports at least 7,000 different marine species each day around the world. (ESPO, 2014) In such way, unrelated species are discharged into some of the most sensitive waters in the world, fact that can cause biological diversity loss. In addition to the loss of biodiversity and native species, ballast water also poses considerable health risks. Epidemic diseases, such as cholera, and various other illnesses are transported with ballast water. (Pierce, 2013)
Despite these massive impacts, regulations currently exempt ballast water discharges, “or any other discharge incidental to the normal operation of a vessel”. However, ballast water treatment is crucial as these impacts have to be managed and ports need to work together with cruise lines in order to ensure that natural species are protected and biodiversity impacts are minimized as much as possible.
1 MARPOL73/78 Annex V: prevention of pollution by garbage from Ships, international Maritime
Organization, http://www.imo.org/
18
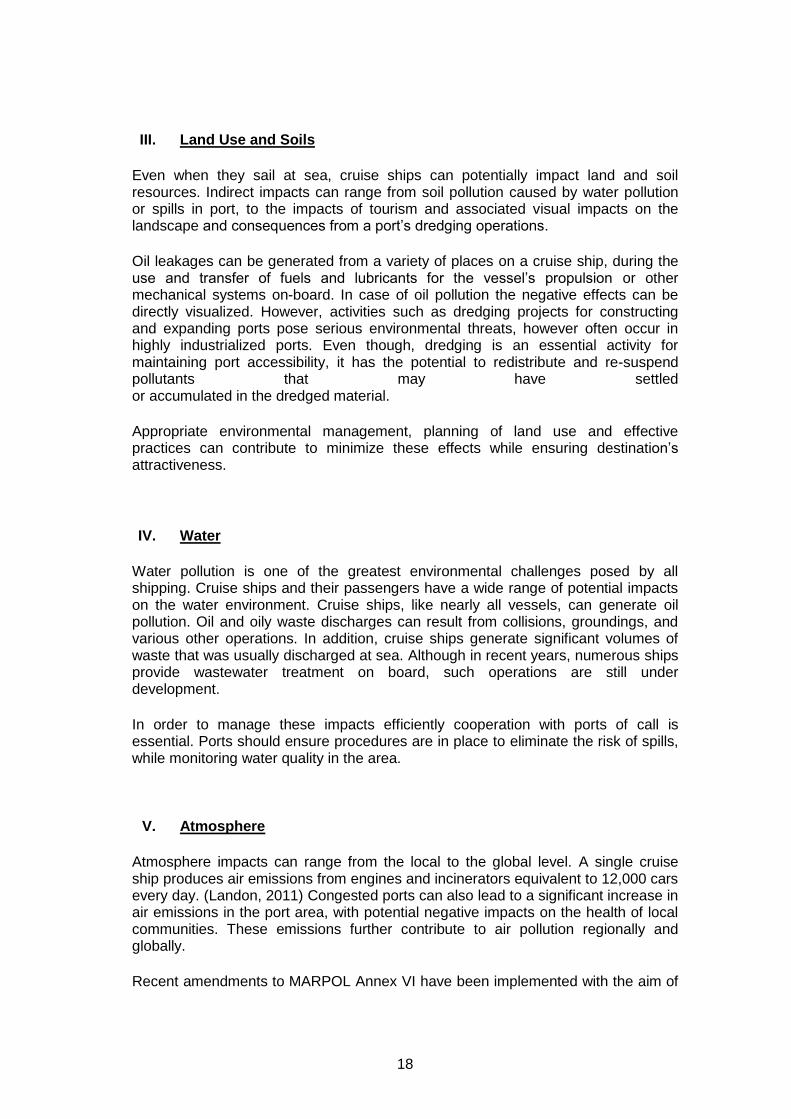
III. Land Use and Soils
Even when they sail at sea, cruise ships can potentially impact land and soil resources. Indirect impacts can range from soil pollution caused by water pollution or spills in port, to the impacts of tourism and associated visual impacts on the landscape and consequences from a port’s dredging operations.
Oil leakages can be generated from a variety of places on a cruise ship, during the use and transfer of fuels and lubricants for the vessel’s propulsion or other mechanical systems on-board. In case of oil pollution the negative effects can be directly visualized. However, activities such as dredging projects for constructing and expanding ports pose serious environmental threats, however often occur in highly industrialized ports. Even though, dredging is an essential activity for maintaining port accessibility, it has the potential to redistribute and re-suspend pollutants that may have settled or accumulated in the dredged material.
Appropriate environmental management, planning of land use and effective practices can contribute to minimize these effects while ensuring destination’s attractiveness.
IV. Water
Water pollution is one of the greatest environmental challenges posed by all shipping. Cruise ships and their passengers have a wide range of potential impacts on the water environment. Cruise ships, like nearly all vessels, can generate oil pollution. Oil and oily waste discharges can result from collisions, groundings, and various other operations. In addition, cruise ships generate significant volumes of waste that was usually discharged at sea. Although in recent years, numerous ships provide wastewater treatment on board, such operations are still under development.
In order to manage these impacts efficiently cooperation with ports of call is essential. Ports should ensure procedures are in place to eliminate the risk of spills, while monitoring water quality in the area.
V. Atmosphere
Atmosphere impacts can range from the local to the global level. A single cruise ship produces air emissions from engines and incinerators equivalent to 12,000 cars every day. (Landon, 2011) Congested ports can also lead to a significant increase in air emissions in the port area, with potential negative impacts on the health of local communities. These emissions further contribute to air pollution regionally and globally.
Recent amendments to MARPOL Annex VI have been implemented with the aim of

19
reducing atmospheric emissions of shipping related air pollutants. There is an urgent need for tighter limits over vessel air emissions in general and cruise ship emissions in particular.
VI. Energy
As it is obvious, energy use is associated with costs and impacts for all members of the cruise industry. For cruise ships this is mainly associated with fuel efficiency, in the same vein ports need to take actions that maximize energy efficiency and minimize total energy consumption.
After extensively looked into the key challenges in port’s agendas, some observations can be made. To begin with, this paper investigates the port from a wider perspective. The interaction of a cruise port and the rest of the cruise sector will be analyzed holistically. This approach is due to the belief that those determinants that influence a port’s attractiveness are intimately interconnected. Consequently, only by reference to the cruise segment as a whole, we will be able to infer significant results.
Regarding the influence of the port geography on environmental challenges, priorities that are common for all locations of ports appear to be air quality, energy consumption and port waste. As discussed above, environmental priorities are also dependent on the size of the port. Relationship with local community and energy consumption are two challenges shared by all sizes of ports. It is interesting that the two major priorities of small ports (less than 50 million tons of cargo annually) are related to waste, both from ships and from the port area. (ESPO, 2013) In fact port waste, ship waste; water quality and noise (air quality) appear consistently within their environmental priorities. In contrast, large ports (>50 million tons) are mainly concerned with land use issues and dredging operations.
Air quality is indicated as the current top environmental priority by the European port sector as a whole, independently from the size or the location of the port. (ESPO, 2013) This indicates the priority given to issues associated with the health of people around port areas. In the same context, waste management at destination is positioned high within the environmental priorities of the sector (Lekakou et al., 2009), while ship waste occurs more often in the last decades. (Vaggelas, 2011) Energy consumption is also recently discussed in port’s, gaining significance within the port priority list. In the same vein, noise management and air quality maintain a high ranking. Some environmental issues, namely dredging operations or port development projects in general, appear consistently within last decades port priorities in Europe.
2.3. List
The following part defines a range of tools that are available in order to enhance the environmental performance of a cruise port. As pointed out in section 2.2, a cruise port should enhance its environmental performance in order to achieve benefits for all involved. Different strategies though will be appropriate in different circumstances –which in order to be adopted effectively; local priorities need to be considered.

20
Therefore, similarly to the previous section the focus will be on the European port sector and the tools examined are already present in the broader Mediterranean region.
It should be noted that, after have examined the interactions between a cruise port and the cruise sector, the potential environmental factors that contribute to the attractiveness of a cruise port, are not always related with the port itself, but then they might affect multiple issues. Due to that fact, this study applies a holistic approach when distinguishing the determinants. In this context, the cruise port in a broader perspective is examined, to conclude with a list of ‘green tools’ essential to a cruise port’s effort to become friendlier to the environment.
A first issue of interaction between the needs of the cruise sector and the port specifically, is monitoring impacts. This can also be perceived as the initial step towards ‘greening’ the port. Addressing environmental issues effectively requires careful planning and ongoing management. An appropriate set of indicators should be developed, monitored and updated in an ongoing basis, in order to ensure continuous improvement. In addition, regular monitoring can help to detect problems at an early stage, allowing corrective actions to be taken quickly. Transparency in this context, should likewise help to more focused discussions on performance expectations, a common understanding of the issues and the enablement for the port to continuously benchmark itself.
The integration of cruise ports in intermodal transport chains was another field of research for identifying the environmental related factors that influence the attractiveness of a cruise port. Hence, a second indirect tool helpful in its attempt towards a ‘greener’ image; is the proper management of cruise touristic activities. This can range from providing good quality transport infrastructure to the demonstration of suitable capacity plans.
As regards the former, cruise tourism might be dedicated to sea transportation, but land transportation is equally important. Ports and destinations need to ensure efficient public transport connections that link directly to the port and integrate at the same time with key attractions nearby. In the same vein, increasing the use of environmentally friendly vehicles while ensuring that the potential negative impacts of transport are minimal, mostly in terms of traffic, noise, and air pollution. In that way proper management of touristic activities will enormously contribute to the attractiveness of destination. With respect to the demonstration of capacity plans assessments based on the number of passenger the destination could accept or the facilities that tourists are expected to visit will be an additive supportive factor.
Rather than this, we also include a range of port facilities provision to cruise ships and passengers. Comprehensive strategies and plans to manage waste in port in cooperation with local authorities will result to an attractive destination. These plans should take into consideration the type, capacity, and location of facilities required. Quantitative goals to reduce waste generation and maximize the proportion of the material recycled will further contribute to this. Ports, in addition, need to ensure adequate practices are in place for a better ballast water management. Continuous monitoring of these practices will ensure that effective treatment is employed in a way that avoids harm of the environment.
It was pointed out in the previous section that air quality appears to be a factor of significant importance for the European port sector, especially due to the

21
association with climate change issues. Therefore, actions to sustain a comprehensive monitoring program for the destination’s air quality, and to be transparent in terms of results, will mitigate problems if pollution exceeds acceptable limits. Furthermore, this can lead to earlier identification of air quality problems and the provision of incentives for better treatment of the pollutants originated from port activities. Another component in the same line regards greenhouse gas emissions resulting from port operations and development, as well as cruise tourism activities. The implementation of measures aiming to reduce and offset emissions, will minimize climate change impacts and at the same time enhance port’s attractiveness.
There are some issues that do not appear in each and every port’s environmental priorities, but they are important when analyzing by port size. This is the case of noise management, which is considered as a significant issue exclusively in larger ports in Europe. Ensure that noise exposure levels in surrounding residential areas are within acceptable limits, and establish a system aiming to manage noise associated with port operational activities within the acceptable limits. Measures to minimize noise will ensure maximum possible benefits for the destination; especially for those ports located in close proximity to residential areas.
In addition, largest ports give high priority to issues related to proper land use. A component of the cruise port attractiveness is to conduct dredging operations employing best management practices to mitigate impacts on natural resources. While dredging is essential for maintaining port accessibility, it has the potential for significant environmental impacts, thus appropriate controlling should be in place to preserve and support port’s green image.
Apart from the variety of services a port is interested in the cost and efficiency of all these operations. This can be better enhanced either by generating renewable energy on-site or by purchasing electricity generated from alternative sources. Options here range from the installation of photovoltaic solar panels or wind turbines to the generation of electricity from biogas. On this matter, lifecycle costs and payback periods should be further examined.
To sum up, Table 1 below illustrates an overview of tools identified to be important for a cruise port’s environmental performance in the Mediterranean region. Using a holistic approach, eight determinants occur consistently in port’s literature as the crucial that can influence a cruise port either in a direct or indirect way. A port’s regulatory framework is always an issue that needs attention, since this must support the start up of operations instead of construct barriers to improvement.

22
Table 1: Framework of green cruise port attractiveness
Source: own compilation of the author
Waste management /
Waste reception facilities
Environmental management of
dredging operations
Proper management of
touristic activities
Measures to minimize noise
Measures to minimize air
emissions
Energy management/Use
of renewable energy sources
Ballast water management
Monitoring impacts
23
3 Cruising the Mediterranean Sea
3.1. Description of the market
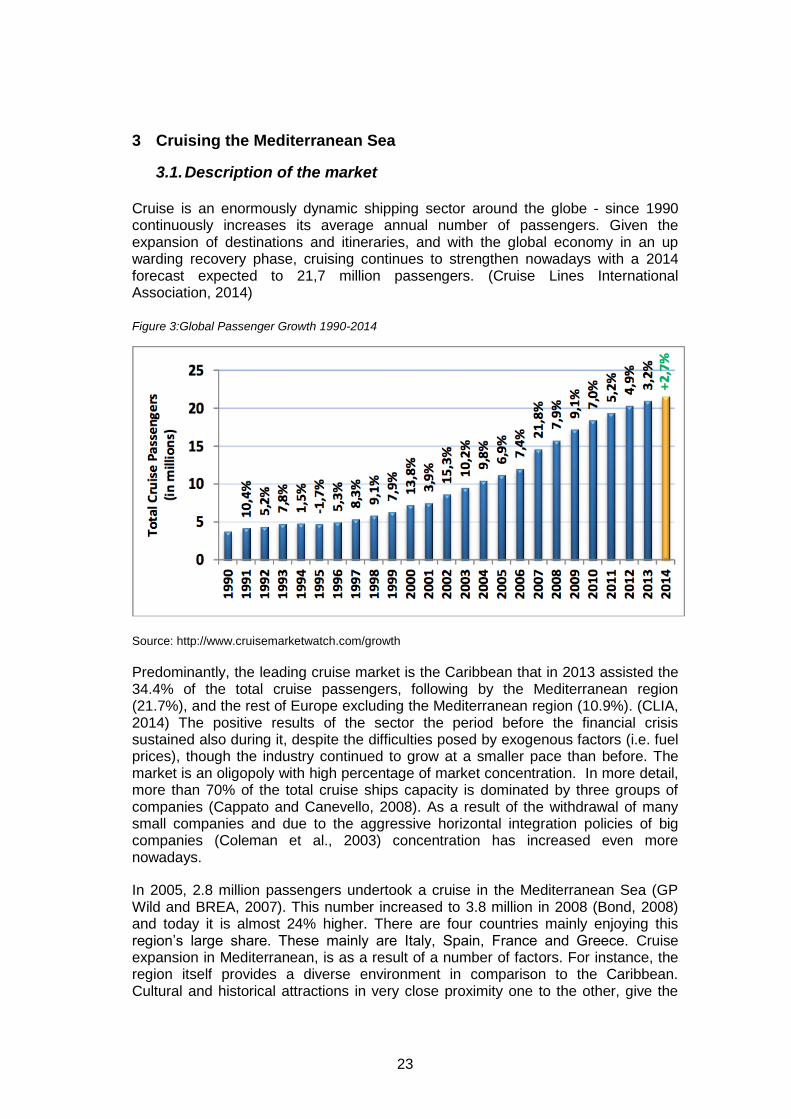
Cruise is an enormously dynamic shipping sector around the globe - since 1990 continuously increases its average annual number of passengers. Given the expansion of destinations and itineraries, and with the global economy in an up warding recovery phase, cruising continues to strengthen nowadays with a 2014 forecast expected to 21,7 million passengers. (Cruise Lines International Association, 2014)
Figure 3:Global Passenger Growth 1990-2014
Source: http://www.cruisemarketwatch.com/growth
Predominantly, the leading cruise market is the Caribbean that in 2013 assisted the 34.4% of the total cruise passengers, following by the Mediterranean region (21.7%), and the rest of Europe excluding the Mediterranean region (10.9%). (CLIA, 2014) The positive results of the sector the period before the financial crisis sustained also during it, despite the difficulties posed by exogenous factors (i.e. fuel prices), though the industry continued to grow at a smaller pace than before. The market is an oligopoly with high percentage of market concentration. In more detail, more than 70% of the total cruise ships capacity is dominated by three groups of companies (Cappato and Canevello, 2008). As a result of the withdrawal of many small companies and due to the aggressive horizontal integration policies of big companies (Coleman et al., 2003) concentration has increased even more nowadays.
In 2005, 2.8 million passengers undertook a cruise in the Mediterranean Sea (GP Wild and BREA, 2007). This number increased to 3.8 million in 2008 (Bond, 2008) and today it is almost 24% higher. There are four countries mainly enjoying this region’s large share. These mainly are Italy, Spain, France and Greece. Cruise expansion in Mediterranean, is as a result of a number of factors. For instance, the region itself provides a diverse environment in comparison to the Caribbean. Cultural and historical attractions in very close proximity one to the other, give the

24
potential to create innovative and diverse itineraries in a bigger cruising season.
The Mediterranean cruise area can be classified into four major distinctive submarkets; these are the Western Mediterranean; the Adriatic; Eastern Mediterranean; and the Black Sea with each of them revealing its own dynamics. Barcelona sustains a top position in the region with nearly 2,6 million passenger movements, and an 8% annual growth in 2013. (MedCruise, 2014) Civitavecchia; the port of Rome, as it is called, comes second, visited in 2013 by more than 2,5 million cruise passengers according to the annual statistics report presented this year by the Mediterranean Association of cruise ports. (Medcruise, 2014) Another Italian port, Venice stands as the third major in terms of total passenger movements. Balearic islands and Piraeus are following. It is worth to mention that Marseille, although ninth in the ranking in term of number of passengers, was the port that noted the highest annual growth among all. (33%)
An additional factor that worth examining is the concentration of the traffic. There are nine ports with more than a million passengers per year, with the two major of them, Barcelona and Civitavecchia exceeding 2,5 million passengers. As regards the major ports in terms of cruise calls, the setting is more complicated; mainly due to the fact that the increased cruise passenger movements are related with calls from bigger vessels, instead of more calls at the port. Civitavecchia, Barcelona, Piraeus, Balearic Islands, Venice and Marseille again retain positions in the top ten ports. In comparison with the concentration in terms of cruise traffic; cruise calls seem to record a lower level of concentration.
Particularly in line with this paper, it is worth mentioning that the cruise sector continues to seem efforts to better manage the environmental issues on board cruise ships and at the European ports in general. It does so by continuously examining challenges and, at the same time, involve port authorities in setting up an integrated system for the top priorities. More specifically, it is now at the stage of collecting and synthetizing the national regulatory framework concerning waste and emissions management; in order to finally implement national strategies and visions. Yet, some negative effects might not a priori excluded (i.e. capacity issues in specific ports, port development and dredging issues etc.), demanding considerations on the extent that the cruise ports might need to start acting proactively and in an innovative manner instead of tackling the already identified environmental issues.
3.2. Port of Piraeus
3.2.1. The port of Piraeus in the context of Greek port system
When talking about the Greek port system, one needs to distinguish between the major trans-European port organizations, ports of national interest, municipal and peripheral ports. The Port of Piraeus, located in the Eastern Mediterranean is one of the two major trans-European port organizations and one of the dozen Port Authorities that constitute the Greek port system. Therefore Piraeus Port Authority (OLP, which is the Greek acronym Organismos Limenos Piraews), runs and operates the largest port in Greece and the main hub connection of continental

25
Greece with the islands.
OLP, as also other ports of national interest, is a société anonyme with the state retaining 75% of its shares and maintaining significant controlling of the respective port authority. These ports actually operate as ‘private-sector’ businesses with the aim of developing infrastructure and offer quality and competitive services. (Pallis, 2007) The Ministry of Mercantile Marine, through the establishment of a Ports and Port Policy General Secretariat (PPPGS), coordinates and controls the efficiency of the ports, although they are autonomously operated by the individual port authorities. The objective is the better utilization of the public funds and other resources, and the provision of better service for residents and tourists.
3.2.2. Characteristics of the Port of Piraeus
The Port of Piraeus is located at the same area where it used to be the ancient Athenian port, currently serving almost all types of cargo and passenger maritime transportation. Piraeus is a port-city containing the largest Greek seaport and one of the largest seaports in the Mediterranean Sea.
It is worth to mention some statistical information, particularly interesting for this paper. Piraeus is the port with the second highest annual growth for the past year in terms of passenger traffic, fact that enabled it to be positioned 5th in the ranking of cruise passengers visits in Mediterranean. Almost half of this traffic is concentrated the trimester August-October. However, for the same five-year period it confronted a declining number of calls; an element which indicates more a structural change of the type of calls than a declining number in passenger traffic.
With a focus on the East Mediterranean, the region has in total four home-porting ports, though none of them satisfies all the selection criteria a homeport should follow through. Currently, Piraeus serves as the main homeport in the region, although it had to deal with declining numbers the last five years. These losses were partially counterbalanced by the rise of Turkish ports (ie. Kusadasi and Bodrum) which did not have any home- porting activities before. These statistics, to be discussed in the next chapter, are particularly important for the selection process of which data to include in the analysis.

26
4 Empirical part of the thesis
4.1. Port Portfolio Analysis (PPA)
In order to measure port competitiveness, one can use many different methodologies; and this partially explains the complex nature of the port sector. The decisive choice of the technique(s) to use depends on the availability of the data, the aim of the analysis conducted, as well as the context within which the analysis is performed. Therefore, considering the aforementioned and assuming the limited availability of time, Portfolio Analysis for ports (PPA) is the preferred method in the context of this thesis.
This method, especially in the context of this thesis, is considered as one with multiple advantages. The ease of data collection and the trustworthiness of the sources, consist of the major reasons for selecting PPA. Indeed this technique makes use of publicly available data in order to depict port’s positioning in micro-economic terms i.e average annual growth and market shares, and in this way of positioning allows port operators to gain significant insights while interpreting simple data sources. However, there is a possibility of exemplifying the interpretation of these findings. (Miles, 1986) While this technique allows visualization of port’s traffic structure compared to its rivals or even analyzes a certain traffic category, it contains a risk of losing the broader image, unless if it is combined with additional tools. Hence, in this respect, this thesis includes a portfolio along with green port portfolio considered as the basis of analysis, to build further upon it with the conduction of a questionnaire and experts interviews.
In general, Port portfolio analysis is an application of the well- known “growth-share matrix”, to the port industry. The initial matrix was first established by the Boston Consulting Group in 1968, for large and diversified business firms with multiple business units, in the context of their strategic planning (Henderson, 1979).
Haezendonck (2001) discuss that this is particularly interesting for ports. In more detail Strategic Position Analysis of ports is examined, and this method has been used for the competitive positioning of the Port of Antwerp in the Hamburg-Le Havre Range, in economic terms. This method contains three separate techniques, namely Port Portfolio Analysis (PPA), Shift-Share Analysis (SSA) and Product Diversification Analysis (PDA). By making use of this technique, not only it allows the positioning of a port compared to its rivals, but the initial technique is also applicable in order to identify the position of individual traffic categories within the same port. The application of this framework in detail can be found in Haezendonck (2001).
Moreover, aside from Haezendonck (2001) that first introduced this technique, SPA is further discussed and appreciated in recent literature. The trustworthiness of the elements used for the analysis in accordance with the clear outcomes produced, allows to be used from a wide range of academics. Particularly interesting for this thesis, was also the application of the portfolio analysis technique to identify the competitive positioning of the Port of Valencia in a chosen range. (Scaramelli, 2010) In the same context, and as this paper further considers, green port portfolio could be deceived as an important component towards understanding not only a port’s competitiveness, but also in order to gain understanding or even support formulating

27
a port’s environmental strategy analysis.
The prototype BCG matrix classifies four separate market positions, namely ‘Stars’, ‘Question Marks’, ‘Dogs’ and ‘Cash Cows’. When employed at the port industry though, this way of positioning is not suitable enough. A new categorization is proposed by Haezendonck (2001), which will also be used in this thesis, as describes the figure below:
Figure 4: Port industry matrix, own compilation based on Haezendonck (2001)
The matrix has been adjusted in Cartesian axes, with the X-axis indicating the total market share of each port as a percentage either of the total range or port traffic. The annual growth rate of the traffic is displayed on the Y-axis. The two bold lines frame the four quadrants of the matrix. The vertical one depicts the theoretical average market share and the horizontal bold line indicates the average annual growth rate of the entire range in the period considered in the analysis.
A unit can be positioned, as a ‘Star Performer’ if its average growth rate and market share is both high, even though this position cannot assure to be sustained. ‘High Potential’ position refer to those that have high growth rates but low market share. Here, if growth rates are observed over time, market share will possibly grow too and these units could fall into the former category. ’Minor Performer’ are those units that during the period of analysis, have registered a lower pace of growth and a non-significant market share in the range. These ports or activities are not performing well in the context of the respective analysis. To conclude, ‘Mature Leader’ units have a market share above the average line but pace of growth lower than average.
This fourth chapter contains the empirical part of this research, in which port portfolio analysis will be conducted in four distinct levels. These levels of analyses will include six ports, namely, Barcelona; Civitavecchia; Venice; Balearic Islands; Piraeus; and Marseille are covered. Even though descriptive, this technique will allow firstly to position the ports in relation to total traffic, then to further examine their traffic structure and as for the third and fourth level of this analysis, cruise traffic category has chosen to be the emphasis. In these two last levels for this chapter, the selected ports will be positioned in relation to their cruise traffic and by relating each port’s cruise traffic with the respective port’s total traffic. When
High Potential
Star Performer
Minor Performer
Mature leader
28
analyzing ports’ traffic structure the color of the units is similar (light blue), while for the other three levels of analysis different colors are chosen to depict distinct ports. The colors chosen to be used in the first, third and fourth level of PPA analysis, as well as on the green portfolio in the next chapter, in order to depict different ports clearly will be kept the same in all these levels
4.1.1. Identification of key ports
This paper applies the PPA technique to the cruise industry to identify the past and current competitive positions of cruise ports in the Mediterranean region, the position of each traffic category for individual ports and the categorization of ports according to their environmental performance. Therefore, to be able to conduct these analyses, some research to identify which are the key ports to include has to be undertaken.
Port Performance Analysis, as introduced by Haezendonck (2001), by definition considers ports located very close by. In addition, the considered ports should be in competition; in the context that one can take away the other port’s market share. For this study for instance, this would suggest that a cruise line is not capable of calling two competing ports in the same itinerary, which is absolutely incorrect. Therefore, in line with this thesis a re-definition of cruise port’s competition is essential.
As aforementioned, this sector’s actors form a clear oligopolistic structure.(Lekakou et. al., 2009) However, due to the complexity of itinerary system it becomes unfeasible to classify its ports in similar way. Cruise ports, in a sense, need each other to survive as in a ‘mutual benefit’ principle. (Bagis & Dooms, 2013) Ports too often perceive that they do not need one another, but in fact there is a mutual need that further benefits them all. Consequently, competition exists in the limits of particular geographic regions. These limits are mostly shaped in line with the location of the regional homeports. Particularly for this study, to better analyze competition and define the environmental issues in analogous itineraries, the focus of this thesis analyses is on the Mediterranean region and its adjoining seas.
The port selection process of the port portfolio analysis is mainly based on the current performances of the regional ports in relation to the cruise traffic category. More specific, it compares a number of ports in the Mediterranean that are all thriving in attracting cruise passengers’ traffic. This, due to the belief that cruise ports that cope with massive influx of passengers and significant growth rates in terms of passenger numbers; while at the same time have to deal other cargo traffic categories, are further stressed to take environmental issues into consideration. This of course does not imply that a port that exclusively relies on cruise traffic is less concerned about environmental impact. However, it is logical to believe, that when multiple traffic categories exist in a port, the number of requirements that need to be fulfilled is higher, as is possibly the number of stakeholders with each of them setting additional individual conditions.
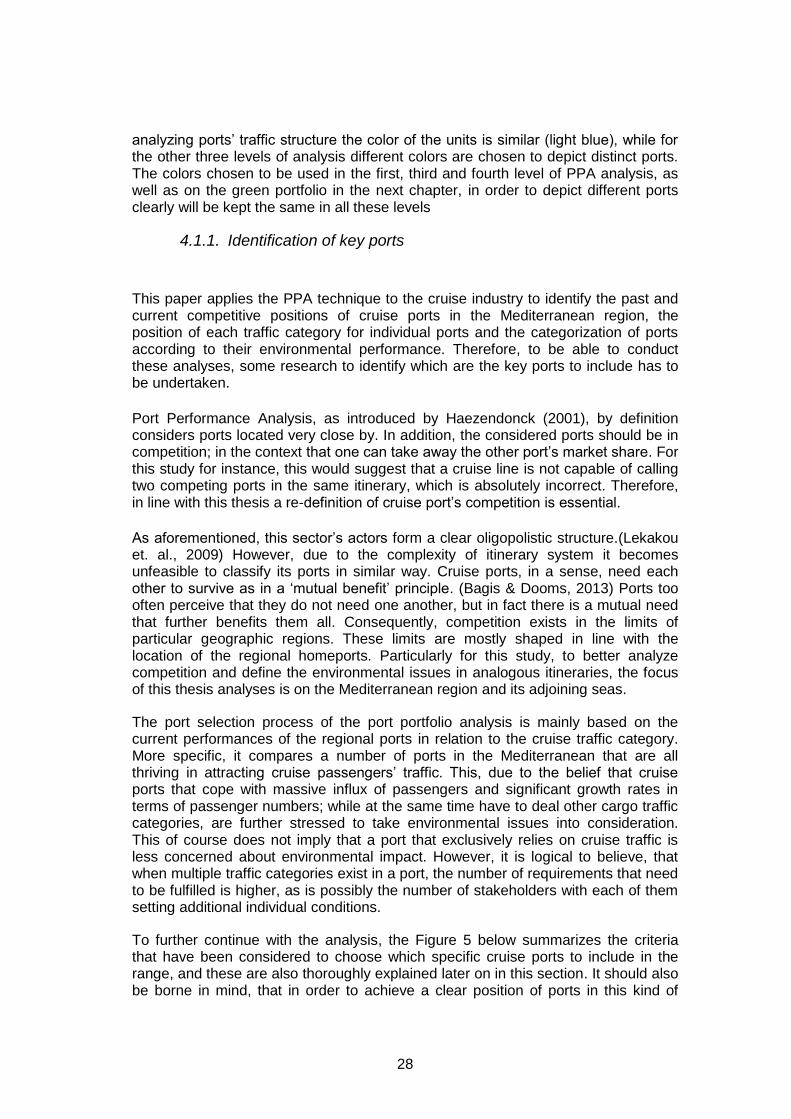
To further continue with the analysis, the Figure 5 below summarizes the criteria that have been considered to choose which specific cruise ports to include in the range, and these are also thoroughly explained later on in this section. It should also be borne in mind, that in order to achieve a clear position of ports in this kind of
29
analysis the selected port range should not include a great amount of port units (ie. less than ten ports) :
Figure 5:Data selection criteria
Source: own compilation of the author
In practice, the first level of the selection process was based on passenger throughput of cruise ports. Mediterranean cruise ports can be divided in two similar-sized categories based on the total cruise passenger movements per year. These two categories include ports with more and less than 130.000 cruise passenger traffic in 2013. Major ports (Category A) require both different managing and different growth strategies from the small ones. Therefore, thirty-five ports contained within the former category were chosen for being further sort out (see Appendix I for the list of ports included in this category). Twenty-five of the thirty-five ports in Category A are detected in the West Mediterranean. Among the top-five Mediterranean cruise ports in terms of passenger’s throughput, only two are not ports located in the West Med. These are Venice and Piraeus, an Adriatic and an East Med port, positioned as third and fifth major respectively. The other three, Barcelona; Civitavecchia; and Balearic Islands; are all West Med ports.
Aside from the major five cruise ports included in the range, the second level of the selection process considers recent years’ growth rates of importance. As cruise is a most dynamic industry in the East Med region with potential to grow further, it would worth to examine cruise ports that have showed a significant growth rate in the last five years. Consulting external data that will be used later in this chapter, it is worth to mention that Marseille, a port located also in West Med, was registered as the fastest growing cruise port in the region the last five years. (33% raise of passenger movements within year 2013 and 88% the variation in 2009/2013) Hence, together with the five ports selected according to cruise passengers’ throughput, port of Marseille is also worth to be considered in the empirical part of this study.
Mediterranean region & its adjoining seas
2013 pax throughput >130.000
Positive growth rates the period 2009-2013
Provision of other traffic categories
PPA

30
The last level of this data selection takes into consideration the provision of other kinds of traffic in the respective ports. For the reason that then, seaports confront more complex circumstances while, at the same time, need to meet ever-higher requirements to fulfill.
The time scale of the portfolio analysis was constrained to four years due to the difficulties on data collection in some ports. Egyptian ports would have had to be included in the range, but this was not possible due to the special conditions in Egypt and Syria. As for ports located in Turkey, which would also be useful to include, difficulties occurred on tracing traffic data for the period observed. Consequently, the ports depicted in Figure 6 as blue dots are those that have been finally selected for application of the PPA technique.
Figure 6: Mediterranean Cruise ports included in the analysis
Source: own compilation of the author
For the six selected ports, traffic data was collected through the ESPO (European Seaport Organisation) database, and verified through individual port reports online on respective port’s websites. It is worth to mention at this point, that these six ports considered for the analysis, concentrated more than 35% of the total passenger movements in 2013. By investigating the shares of the twenty major Med ports (see Appendix I), there stand nine ports that exceeded one million passengers, with the top-two, Barcelona and Civitavecchia, facilitating more than 2,5 million. The next ten ports, hosted more than 500.000 passengers within the previous year, while the rest ports included in the second category (Category B: 2013 pax throughput is less than 130.000) are smaller in terms of cruise passenger movements. This basically means that all the major ports are already in the analysis, while the rest of passengers’ traffic is spread as described above.

31
To conclude, aside from cruise traffic data, which is calculated in the number of passengers, the rest of traffic data exploited in this analysis is nominal, i.e. nominal tons. Haezendonck (2001) advocated that traditional portfolio analysis is certainly performed in “nominal tons”, fact that disregards the importance of the value added by different traffic categories. However, it should be noted that as regards the ecological effects of seaport operations, Haezendonck (2001) also suggests the use of absolute metric tons handled, instead of weighted tons. This certainly, due to the fact that a ton of high value added and a relatively less value added cargo are equally harmful, in terms of environmental impact.
4.2. Level 1 Regarding the first level of port portfolio analysis, the results acquired can be shown in Figure 7, where is illustrated the positioning of the considered portfolio as regards ports’ growth rates and market shares in the Y-axis and X-axis respectively. These results are corresponding to the total traffic the six ports considered in this analysis obtained in the period 2010 - 2013. As noticed, two bold lines (one vertical and one horizontal) are shaping the matrix described in the previous section, allowing four distinctive areas to be observed within the graph surface. The vertical one corresponds the theoretical average market share, while the other expresses the average annual growth rate for the respected ports
During the period 2010-2013, the horizontal line (average annual growth rate) for the six ports totals to 2.58%, whereas the vertical line intersects with the X-axis at 16.78%. These lines, as already mentioned, separate the graph area into the four quadrants that allows further analysis of the competitive positioning of the respective cruise ports.
Figure 7: Portfolio of ports for the total traffic
Source: own compilation of the author

32
Marseille is the only port positioned as a “Star Performer”, since it has the highest market share in the range as regards total traffic (32%). Moreover, as pointed out in section 4.2 concerning the data selection, this port continues to register as the most dynamic picture of all the ports in the range and possibly one of the most significant in the broader Mediterranean region.
Venice and Balearic islands obviously are depicted as “Minor Performer” units, since both obtained growth rates well below average. Venice recorded a relatively better position regarding its average market share of 14.6%, while Balearic Islands’ are worse positioned with a corresponding share of 7.9%. Growth rates in Venice recorded two consecutive years of negative trend, while the period’s 2010-2012 growth rates, which are respectively -7.4% and -0.1% had a negative effect on Balearic Islands’ positioning for this period of analysis.
Ports of Civitavecchia and Piraeus are both positioned as “High Potential” units; yet, at this point a distinction is necessary to be made. Civitavecchia has recorded a well higher growth rate (7.40%) with respect to Piraeus (3.70%), and the highest average annual growth rate of all the ports in the range. Piraeus, on the other hand, is positioned drastically better in terms of average market share (12.40% versus 11% of Civitavecchia).
Barcelona is the only port that appears as a ‘Mature Leader’ in the range. It has registered the second highest market share in the range (22.8%), though its respective growth (1.70%) positions it just below the average annual growth line (horizontal bold line).
4.3. Level 2
The second level of the port portfolio analysis is based on the traffic structure of each port. Five traffic categories (cruise passengers, containerized cargo, liquid bulk, dry bulk and general cargo) have been distinguished which constitute a portfolio for each of the considered six ports. The relative share of each of these categories corresponding to each port’s total traffic can be shown on the x-axis, while its respective growth rate is displayed on the y-axis. This level of analysis aims to position the traffic categories within each port, in order to better understand the relative significance of the cruise segment for each port individually. The outcomes of this second level of analysis are presented in the respective subsections below.

33
4.3.1. Port of Barcelona Figure 8: Traffic structure analysis for the port of Barcelona
Source: own compilation of the author
As regards this port, none of the traffic categories are identified as ‘Star Performer’; however, three of them are positioned inside ‘High Potential’ quadrant. General cargo, dry bulk and cruise are therefore the only categories registered with positive average growth over the period considered.
Containers are the most important in terms of share in the total traffic (38%), but the negative behavior of 2012 influenced heavily the whole of activity and positioned it as a ‘Mature Leader’. Liquid bulk falls also into ‘Mature Leaders’ with a significant share of total traffic but a lower than average annual growth. Liquid bulk is mostly affected by the overall drop in the consumption of oil products through the economic crisis, while Solid Bulk has the highest average annual growth of the five traffic categories,
Cruise’s position among the ‘Mature Leaders’ (6% share in total traffic), was due to its performance in 2012 (-9.4%), with 2,503,848 average cruise- goers passing through its facilities.

34
4.3.2. Port of Civitavecchia Figure 9: Traffic structure analysis for the port of Civitavecchia
Source: own compilation of the author
Civitavecchia is known more for its general cargo and cruise ship traffic than for container shipping or bulk cargo activities. None of the individual units though has been identified as ‘Star Performer’. However, it is possible to assert that if cruise gains market share, might in the near future be represented as a ‘Star Performer’. At the time of the analysis, cruise is positioned as “High Potential”, with positive average annual growth rate, but share in port traffic below average.
Containers are also positioned as “High Potential with the highest average annual growth rate of all port’s activities. Dry bulk and general cargo fall into ‘Mature Leaders’ with significant shares of total traffic but growths lower than the average. At last, general cargo has been the only unit that showed negative average growth, whereas the port in general increased its commercial traffic reaching a total average growth of 7.4%.

35
4.3.3. Port of Venice Figure 10: Traffic structure analysis for the port of Venice
Source: own compilation of the author
Dry bulk is a ‘Star Performer’ for the port of Venice with a growth rate (0.6%) above the average of the port’s total. Containers and cruise fall into ‘High Potential’ quadrant with significant growth over the years 2010-2013, but share in total port traffic well below average. General cargo, on the other hand, that used to play a key role for this port due to three consecutive years with negative growth rates along with the general performance of general cargo in global markets, is now positioned as a ‘Minor Performer’.
As regards Liquid bulk traffic unit, still plays a key role and is depicted as a “Mature Leader”, with a significant share of total traffic but a lower than average annual growth.

36
4.3.4. Port of Piraeus Figure 11: Traffic structure analysis for the port of Piraeus
Source: own compilation of the author
Containers are indeed a “Star Performer” in the Port of Piraeus, since albeit the economic crisis of the past years and the particular result it has in Greece, this unit has registered a significant annual growth and share in port’s total traffic. General cargo and Dry Bulk sector have shown negative average growth rates over the period, a fact that positions them as ‘Mature Leader’ and ‘Minor Performer’ accordingly.
On the other hand, cruise is categorized as a “High Potential” unit, although it is worth mentioning that the average annual growth of this category (6.3%) is close to the bold horizontal line that represents the average annual growth of the considered ports.

37
4.3.5. Port of Marseille Figure 12: Traffic structure analysis for the port of Marseille
Source: own compilation of the author
Liquid bulk, that constitutes the main voice of traffic of the French port (66%), has faced a reduction the past three years positioning it as a ‘Mature Leader’. Excluding the liquid bulk, the rest have seen a positive growth the period considered in this analysis. The increment over the years in containers and solid bulk fit them in between ‘High Potentials’ and ‘Minor Performers’ with growth rates that equal average, but low shares in each port’s total traffic. General cargo is definitely a “Minor Performer”, with both average annual growth and share in port traffic well below average.
Cruise sector is clearly fit into ‘High Potential’ quadrant, with almost 20% average growth rate. The 2013/2009 variation of cruise traffic in Marseille equals to an 88% growth, which is also the highest number seen in this portfolio. (Medcruise Statistics, 2014)

38
4.3.6. Port of Balearic islands
Figure 13: Traffic structure analysis for the Balearic Islands seaports
Source: own compilation of the author
Figure 13 shows that, in the Balearic ports, both cruise and dry bulk are positioned as “High Potentials”. Dry bulk has a higher growth rate, while their relative shares in respective port’s traffic are close enough. General cargo, on the other hand, is categorized as a ‘Star Performer’ unit, although it is worth mentioning that the average annual growth of this category is just above the average annual growth of the total traffic (horizontal bold line).
Liquid bulk and Containers are classified as ‘Minor Performers’, though one should bear in mind that these activities are clearly not the ones that these ports specialize.

39
4.4. Level 3 The third level of portfolio analysis examines the positioning of the six considered ports for a certain traffic category; the specific category examined in this paper is that of cruise traffic. It is worth to mention that, after conducting the second level of this portfolio analysis, this kind of traffic has appeared to be positioned as “High Potential” for all the considered ports in the range.
As pointed out in Chapter 3, the cruise sector is thriving in the Mediterranean region. Approximately a hundred ports in the region observed more than 23.5% market growth within a five years period (2009-2013), and a particularly high passenger growth (124%) within the decade 2004-2013. (Medcruise statistics, 2014) Moreover, in order to examine the adopted environmental strategies and respective performances of cruise ports in the region; the ports that have been selected for inclusion are those that own a significant share in the market. Therefore, these two reasons partially explain these results.
The average annual growth of cruise traffic for the six ports studied can be shown on the y-axis, while the average theoretical market share of each cruise port in the range is displayed on the x-axis as a percentage of the total range traffic. Moreover, a third dimension has been added in this level, which represents the average total number of passengers for the considered cruise ports. This extra dimension has a circular shape whose purpose is to indicate the ‘size’ of each cruise port in terms of passenger traffic, although this element is already included in the average annual growth axis. (Y-axis)
The horizontal bold line symbolizes the average annual growth of cruise traffic for all six ports analyzed, i.e. 7.58%. The vertical bold line represents the theoretical average market share of each seaport in the range, which is equal to 16.67%. This level of analysis, aims to the positioning of the considered ports in respect with their registered cruise traffic. Table 2 that used for this third level of Port Portfolio analysis is produced by secondary source data and the results obtained are depicted just below in Figure 14:

40
Figure 14: Cruise Traffic Analysis for the six ports in the range
Source: own compilation of the author
Table 2:Cruise Traffic Statistics for the six ports in the range
Source: own compilation based on throughput data respective port authorities
As obvious from the graph, Barcelona and Civitavecchia are the major players in this cruise field; retaining the largest market shares in the range. Barcelona remains the top port in terms of passenger throughput, however it is positioned as a ‘Mature Leader’, due to the lower pace of growing the respective period. While within the last year both ports increased in similar percentages (8% growth for Barcelona, while 6% for Civitavecchia), by looking the variation of the last five years Civitavecchia registers a comparatively higher growth. Therefore, in the matrix is depicted as a ‘Star Performer’, and at this point is worth mentioning that the port of Civitavecchia is also registered as the top port as regards the number of cruise calls in all the Mediterranean region.

41
Venice stands as the third major in terms of average market share, though during the period of the analysis has registered a growth below the average in the range. This mainly corresponds to the fact of two consecutive years of low trend (2012-2013), which are respectively -0.6% and 2.2%. The introduction of regulations imposing restrictions on cruise vessels have been negatively affect this period’s growth rates and have been positioned Venice as a ‘Minor Performer’. Its theoretical market share in the range equals average, for this reason it is possible to assert that in case Venice registers higher growth numbers in the future, may fall into the top two quadrants of this matrix.
Marseille is clearly positioned as ’High Potential’ unit, since not only had registered a 33% rise in number of passengers the previous year, but also the 2010/2013 variation of cruise passenger traffic equals to a notable 70% growth. All these contributed to the fact that Marseille has registered the most dynamic picture of all ports in the range for the considered period.
Piraeus is the other port in Mediterranean that has experienced significant growth rates in the range. However, in this level of analysis is depicted as a ‘Minor Performer’ unit. It is worth to mention that its average annual growth is drastically lower than the average in the range, while its market share by focusing on the 2010/2013 variation has registered significant growth. Along with Piraeus, Balearic Islands are also positioned in the same quadrant. As already mentioned above, this situation can be attributed to the fact that the two major ports, Barcelona and Civitavecchia hosted more than 2,5 million passengers in 2013.
4.5. Level 4 The fourth level of port portfolio analysis concludes this section by again examining the cruise traffic, this time, with regard to the average share in port traffic for individual ports. Again, a third dimension indicating the number of passengers has been added as a circular shape although this element is already included in the average annual growth axis. (Y-axis) The difference with the third level, which described above, is that here the X-axis indicates the average share of cruise traffic as a percentage of total port traffic, for each of the six ports. (The respective percentages for each port can be shown in the data labels after the commas) The Y-axis still shows the annual average growth rate of the number of passengers in the range. In addition, the two bold lines (one vertical and one horizontal) shaping the matrix, are corresponding to the theoretical average market share and average annual growth rate for the respected ports during the 2010-2013 period. The results of the fourth level of analysis are presented in Figure 15 below.
The gain of this last level in portfolio analysis is the fact that illustrates, at the same time, three different things. Particularly, the corresponding results of the second level of analysis (position of cruise traffic in each port); the categorization of the cruise ports per size (passenger traffic); and the growth rate of cruise traffic for the ports analyzed, can be observed at once.

42
Figure 15:Cruise traffic versus Total Traffic for the six ports, 2010-2013
Source: own compilation of the author The ‘Star Performer’ is certainly Civitavecchia. As it could already be seen from the first level, this port is not a ‘Star Performer’ in terms of total traffic. However, it is the greatest performer in terms of the relative significance of cruise traffic both as a percentage of total traffic, and vis-à-vis its rivals (This can be shown in the third level of analysis). As for Marseille, it is the only port classified as ‘High Potential’. This result comes to no surprise; as the variation of years 2010/2013 alone led to a 70% growth.
Barcelona is a ‘Minor Performer’ in cruise traffic, which only constitutes 5% of its total traffic; it is currently though, a major player in the Mediterranean region. It should be borne in mind that in the second level of the analysis this port was highlighted as a ‘Mature Leader’ in the range, and in third, cruise traffic category was positioned as ‘High Potential’. Venice is also positioned as a ‘Minor Performer’ unit, though important distinctions from Barcelona should be made. This port was also positioned in the same quadrant for the first as well as for the third level of the portfolio analysis and stands as the third major in terms of total passenger movements.
Piraeus cruise traffic has a share in its total traffic which corresponds to any other of the considered ports, but the respective annual growth over the period 2010-2013 is just below the market average. It is worth mentioning, though, that the results of level 2 highlighted cruise as a ‘High Potential’ traffic category, and therefore future evolution in port strategies could adjust Piraeus positioning. Balearic Islands, indeed, are represented as a ‘Mature Leader’ since cruise is of the main operations of the port.
4.6. Conclusions on the four levels of PPA

43
The findings from the port portfolio analysis performed in the sections above, indicate that the port of Piraeus is a ‘Minor Performer’ in relation to cruise traffic as regards the considered range (This is indicated in the third level of PPA). This result comes to no surprise since, as pointed out in the data selection section, the ports that constitute this study’s portfolio happen to be the six major ports in the Mediterranean region and adjoining seas. It is logical therefore, for the port of Piraeus to be registered as a ‘Minor Performer’ unit, since compared to the leading cruise ports in the region is certainly worse performing just from the fact that deals with lower passenger number.
Thus it has clearly experienced significant growth rates within the years of the analysis, a fact that positions it just in this quadrant, and not at the left part of it. It is possible therefore to infer that, as regards cruise activities in the port, a better future position can be anticipated. Yet not only this kind of activities have registered as a significant traffic category within its individual structure (as indicated in the second level of PPA) but also Piraeus has emerged from the first level as ‘High Potential’ for the evolution of total traffic with respect to the range analyzed.
As aforementioned, attributable to cruise’s complex nature of operating, competition among cruise ports becomes a particularly interesting topic. As stressed out in section 4.2 cruise ports need each other to survive as in a ‘mutual benefit’ principle. Consequently, competition exists in the limits of particular geographic regions, mostly shaped in line with the location of the regional homeports. (Bagis & Dooms, 2013) However, this study’s area of interest is not to identify Piraeus competitors for home porting activities, as clearly this study’s aim is to focus on environmental issues of the region.
However for the sake of interest, it is worth to mention that Venice has emerged to be the fierce competitor of Piraeus. Civitavecchia has too, but not so intensely, given the major variances in passenger traffic. Several studies have claimed that, on the East part, few ports are major homeports (Bagis & Dooms, 2013; Lekakou, 2009). Piraeus currently satisfies the home-porting activities of the region but mainly for regional cruise companies (mainly Louis cruises), while for the rest East Med ports are served by the major homeports, which are mainly located in the West part of the region. These are namely, Venice, Genoa, Civitavecchia, and Savona in Italy; and three more in Spain, namely Barcelona, Valencia and Palma Majorca. (Medcruise Statistics, 2014)

44
5 Green Analysis
5.1. Survey
Even though the portfolio analysis conducted provides valuable insights for the position of the port of Piraeus vis-à-vis its rivals, while aiming to this study completion it is crucial to further continue the research. A first understanding on the key determinants that enhance a cruise port’s environmental image has been already gained from the literature review. Though, the sub-question on which are the most important environmental determinants for a cruise port, has yet to be answered. Consequently, it has been necessary to deepen the research digging into the perceptions of the users and main actors in the port of Piraeus.
To identify the important determinants that influence a cruise port’s environmental status and examine the criticality of environmental performance in the positioning of the port of Piraeus in the Mediterranean region, a survey was developed. This survey was partially developed after thoroughly examining publically available materials with content related to the environmental protocols, management and port strategies. In that way, the author was able to gain an insight to the operations behind typical cruise port’s environment-related activities.
In this section, the author makes use of the terms survey and questionnaire ordinary, as stated by De Vaus (2005) (i.e. a list of ordered questions provided in the same way to all respondents). Given the limited availability of time; the survey conducted was Internet based using Qualtrics academic website. After the first contact via e-mail, the on-line link to complete the questionnaire electronically was sent, again via e-mail, to all respondents. Taking into consideration that the responses were gathered mostly from a significant yet local cruise market, that is the Greek one, the idiosyncrasies of this certain market are reflected on the findings of the study, and certain local bias might exist.
5.1.1. The Questions For the aim of this study, the questionnaire was split into three distinctive parts. Firstly the respondents were asked to provide their personal details; then a multiple-choice part is included and finally; in the third part of the survey, there are two open questions.
In Chapter 2, an extensive research conducted in order to identify the key environmental challenges related to the cruise industry, as well as the specific determinants that enhance the green image of a cruise port. As discussed, this paper implies that by strengthening the environmental image of a cruise port; its attractiveness is also enhanced and that, in the long run, might become a supportive competitive factor for the respective port. As mentioned above, this survey contains a multiple-choice section including the abovementioned determinants sent to experts of the Greek cruise sector and intending to access the importance of every determinant using a five-point Likert scale.
In addition, this part was aiming to identify relevant actor’s perceptions of the specific areas that the port of Piraeus lacks on the basis of these eight same

45
determinants. For that reason, respondents where further asked to also provide a ranking on Piraeus environmental performance. The Table 5 just below illustrates the eight main determinants influencing the environmental image of a cruise port which constitute the baseline of the 18-question survey sent to the 70 targeted cruise experts.
Table 5: Determinants chosen for Survey Analysis
Source: own compilation of the author
In the third and last part, a set of comprehensive questions was formulated with the aim of assessing Piraeus attitude towards environmental performance and the role of environmental performance in cruise port attractiveness. The following section presents the way the analysis is conducted, as well as the results of the survey. The survey is presented in Appendix III.
5.1.2. The Respondents
The respondents’ pool was composed of 70 persons mainly from cruise ports or companies (either Greek companies or agents of foreign companies in Greece). As the focus is on cruise ports, the selection had to contain a bigger percentage of these kind of respondents and less from the cruise companies. Though, certainly they could not have been excluding at all. This specific pool of respondents where
•Waste management / Waste reception facilities
Waste
•Environmental management of dredging operations
Land Use & Soils
•Measures to minimize noiseAtmosphere
•Monitoring impactsPort Strategies/ Port
Management
•Measures to minimize air emissionsAtmosphere
•Ballast Water managemenWater
•Energy management/Use of renewable energy sources
Energy
•Proper management of touristic activitiesPort Strategies/ Port
Management

46
selected based on their role in the company or port authority, with people working on Health, Safety, Quality or Environmental departments to be preferable. During the survey process, individual emails were sent as a first approach to each one of the respondents informing them, in addition, that this survey was to be completed in less than 10-15 minutes. The survey was allotted and analyzed between 15 of July and 15 of August.
A two-weeks time limit was given, but because of the time of the year that this thesis was written, the majority of people were out of the office; thus the response rate was not as high as expected. In total, 37 completed questionnaires have been returned constituting a response rate of 54%. Table 3 shows the composition of the responses. The emails were obtained mainly through the MedCruise directory 2013/2014. This is a catalog with cruise port’s and relative actors contact details. In the case of cruise lines or agents, it was possible to find this information online.
Table 3:Composition of the respondents
Sector Number of participants (total: n=37)
Cruise companies 9
Agents 2
Cruise brokers 3
European Community 2
Port Authorities / Port consultants 18
Cruise Consultants 1
Cruise Captains 2
Source: own compilation of the author
5.1.3. Analysis
As soon as the responses were gathered, they were evaluated according to their ranking. The analysis of the data collected determines the criteria on which the cruise sector considers a ‘green’ cruise port and the gravity of each determinant according to their perception. This is achieved already form the first part of survey’s multiple-choice section. For every respondent ranking a determinant with a -2 this was counted as 1 point of significance, when marked with -1 count as 2 point et cetera and in that consisted to the setting of determinants according to their raning.
As regards the part of the survey, which will be useful for further policy recommendations specifically for the port of Piraeus; will be analyzed as follows. Those determinants that received a score of -2 or -1 are considered not to be among the strong points of the port of Piraeus; on the contrary, they signify areas

47
which Piraeus should further asses in terms of management or operations for improving its current position. Those who received a neutral or a positive score, 0; +1 or +2, are the determinants of port competitiveness, and any further improvement could be beneficial for the respective port.
5.2. Green portfolio One of the objectives of this research was to position the port of Piraeus among its main rivals according to their environmental performance. Already in previous sections five ports were selected as Piraeus’ main competitors, in order to be able to conduct the PPA. Namely these are, Barcelona; Civitavecchia; Venice; Balearic Islands and Marseille. Moreover, the nature of competition between cruise ports was explained, so as to frame the results in all four levels of analyses. This section will attempt to provide a green benchmarking analysis for the port of Piraeus against the five other ports already selected in the section 4.1.
In order to examine whether a port has a better or worse environmental performance, a set of things need to be considered. The first to take into consideration is the survey. Its results suggest the importance of each determinant affecting a cruise port’s environmental image and will be further useful for the positioning of the ports in our portfolio. The second thing that this paper considers as crucial; is to what extent the respective ports are environmentally certified by a third-party. Thus, the literature review in this section concentrates on the availability of certifications for Environmental Management Systems (EMS) in the range. These include, the ISO 14000 (International Organization for Standardization) family that address issues related to environmental management systems; and the Port Environmental Review System (PERS), the only port-sector specific environmental management standard provided by ESPO. In case these two are in place, an essential environmental awareness can be inferred and further arguments can be offered from the survey’s results.
In traditional portfolio analysis ports are positioned according to micro-economic elements of their activities, i.e. the average market share and growth rate, as indicators of competitiveness. Haezendonck introduced the environmental aspect of the portfolio analysis (Haezendonck, 2001), based on Ilinitch and Schaltegger (1995). This, by adding a third dimension to the conventional port portfolio analysis, considers the environmental impact caused by port’s activities. It does so through examining the externalities occurred by hinterland transportation in order to conclude what ports are doing regarding environmental performance. While in a conventional port performance analysis, that considers port’s environmental impact, the third dimension represents the environmental effect of port’s activities and operations, in order to examine a cruise port’s environmental performance in terms of facilities; management strategies; and operations, this study was in need of a new approach. For the purpose of this thesis the green portfolio will be adjusted in the fourth level of PPA conducted in section 4.5.
With the aid of the PPA already accomplished, it is possible to evaluate and learn what ports are doing regarding environmental performance, through some calculations while at the same time observing how these ports are performing in economic terms (fourth level of PPA). Furthermore, this way provides the

48
opportunity to observe whether a port, which mostly focuses on cruise traffic, has a ‘greener’ image than others that do not. For all these, the fourth level of analysis was selected, since in this last level the cruise traffic is examined with regard to the average share in port traffic for individual ports. In order to collect the data regarding cruise port’s environmental performance, the survey’s results were taken into account and some desktop research of ports websites was conducted. Diverse matters were to be considered through the desktop research ranging from environmental and sustainability management issues to air quality; energy efficiency; land use; water and natural resources management, waste and recycling management, and other environment-related actions such as proper control of touristic activities.
The following figure (See Figure 16 just below) illustrates green benchmarking of the cruise ports in the considered range. Once more, the x-axis indicates the average share of cruise traffic as a percentage of total port traffic, and the y-axis shows the annual average growth rate of the number of passengers in the range. The respective shares for each port’s cruise sector can be shown in the data labels after the commas for each of the six ports. Again, two bold lines (one vertical and one horizontal) are shaping the matrix described in the section 4.1, allowing four distinctive areas to be observed within the graph surface. The vertical one corresponds the theoretical average market share, while the other expresses the average annual growth rate for the respected ports. The third dimension, which is represented as a circular shape, still indicates the number of passengers; yet now all ports have similar coloring. The green color of the spheres reflects their environmental performance. The lighter the green color, the ‘greener’ this cruise port is in terms of facilities and operations. In case the color is dark green, the respective cruise port can be considered as ‘dirtier’ than those with lighter shade. The terms of the matrix quadrants on the basis of the performance analysis for cruise ports, as suggested in the beginning of this chapter, i.e. ‘Star Performers’, ‘Mature Leaders’, ‘Minor Performers’ and ‘High Potentials’, is also kept in this section.
Figure 16: Green portfolio (adjusted in the fourth level of PPA)

49
Source: own compilation of the author; see also Table 11 in Appendix IV
Civitavecchia and Marseille, the only two ports that have registered greater average growth rates than the other cruise ports in the range, are overall bad in terms of environmental performance. Civitavecchia, positioned as ‘Star Performer’ in terms of the relative significance of cruise traffic both as a percentage of total traffic and vis-à-vis its rivals, seems to be a ‘dark green’ port in terms of its environmental performance. Though after 2013, the Civitavecchia Port Authority plans strong and dynamic expansion with a new container, agricultural, bulk and car terminals and as well as other Italian ports have the notion of ‘greening’ their operations. In this context, port of Civitavecchia recently implemented EMS and signed agreements for the realization of its vision. (ESPO, 2014) As for Marseille, it is the only port classified in this matrix as ‘High Potential’ in economic terms. The French port in recent years experienced major rises in container, dry bulk and cruise passenger volumes; fact that possibly did not let Marseille sufficient period of time to react in those changes. The Port is currently investing and innovating to adjust in this new setting, giving at the same time priority to initiatives that reconcile environmental issues. Concerning the ports of Balearic Islands, although cruise traffic is a sector of major importance for them, certain determinants that constitute destination’s attractiveness are in absence. Indeed they are represented as a ‘Mature Leader’ with the cruise industry being a core operation for the Spanish islands, yet they are depicted as the ‘dirtiest’ ports in this portfolio in terms of environmental performance.
Piraeus cruise traffic has a share in its total traffic equivalent to any other of the considered ports, but its annual growth over the considered period is just below the market average. As regards its environmental performance is worth mentioning that the results highlight Piraeus as third, since this East Med port had initiated environmental strategies before 2010; fact that allow distinguish the results the period of this analysis. Barcelona is a ‘Minor Performer’ in cruise traffic, which only constitutes 5% of its total traffic; it is currently though, the second key player as regards cruise port’s ‘green’ positioning. Sufficient infrastructure and space to accommodate all types of traffic correspond with numerous guidelines and systems in order to enhance this port’s environmental status.
At last, Venice is highlighted as the ‘greener’ cruise port in the range. As discussed earlier in this section, Italian ports have started taking initiatives that reconcile environmental issues, though Venice port’s success does not come from awareness for cruise destination’s attractiveness. It should be borne in mind that in the second and third level of the analysis this port was positioned as a ‘Minor Performer’ unit, thus it can be inferred that all these initiatives and projects regard the city of Venice or a notion of change overall Italy and not specifically focus on the port itself.
To be able to benchmark the environmental performance of the port of Piraeus against its rivals in the range, all the considered ‘green’ determinants had to be quantified in some way. For this reason, some calculations were made based on the collected data summarized in the Table 11 in Appendix 4 at the end of this study:

50
Firstly starting from the most crucial determinant, as suggested from the survey’s results, points were allocated to each determinant, with the most important having the highest number of point i.e. 8 points for Waste Management facilities, 7 points for Energy Management etc. Similarly, 10 points were given to each port certified under the ISO 14001 standard or implemented PERS.
Secondly the results illustrated in the above analysis were obtained with the aid of SUM and AVERAGE functions in an Excel file. The average score for the considered cruise ports in this study’s portfolio was 26.5 points, with 36 being the highest.
If we associate these results to earlier obtained results, (see previous levels of analysis i.e. the first; third and fourth level of PPA), only the port of Barcelona has prospered in facilitating a considerable traffic volume in an environmental friendly manner.
The port of Venice, although depicted as the greener in Figure 16, overall is been recorded as a ‘Minor Performer’ in the range. Some significant traffic volumes have characterized the ports of Balearic Islands, Marseille and Civitavecchia though very poor environmental initiatives have been recorded, with the former of the three being worse positioned. Last but not least, the port of Piraeus is the third ‘greener’ port, yet; as suggested by the survey’s results vital elements are missing (i.e. monitoring impacts)
5.3. Interviews
Complementary to the data collection for the portfolio and ‘green’ portfolio analysis, the interview process with the cruise experts (mainly Greek) supported our aim to gain understanding on environmental issues around a cruise port, as well as on their own perceptions and strategic point of views towards a ‘greener’ development in the future. Interviews also helped in addressing the main restriction of port portfolio analysis, i.e. the narrow sense of the analysis, as a consequence of the fact that manages only past traffic data; while when discussing on environmental performance of a port, future targets and challenges needs to be taken into account.
Measuring the environmental harm of ports in general, is not an easy task. The recognition of activities that are dependent on the port, the degree of this dependency and the times each of these associated effects needs to be multiplied are in need of methodological and capital intensive activities. Direct, indirect and induced impacts are difficult to measure due to the limitations in data collection. Even if the environmental impacts of ports achieved to be measured, there is no unique standard methodology in Europe or even within the Mediterranean region, which would allow equal comparisons to be made.
To a certain extent, ports are being compelled to respond to environmental impacts they generate or caused by shipping activities in general. Given the cumulative character of environmental awareness and the growing number of challenges today, ‘green’ spillover effects in ports would be an ideal solution for this particular matter

51
i.e. the ‘greening’ of supply chains (Every actor in the process is continuously seeking green suppliers, in order for the whole chain to become greener) Due to their spatial expansion and functional ‘regionalization’ (Rodrigue and Notteboom, 2005), ports are more proximate than ever; they share overlapping hinterlands and port related communities, with each of them seeking ways to avoid lagging behind societal pressures. In case a port or a port related community begins addressing environmental issues, this therefore will lead to ever-broader reaction at the port or community located close by.
This notion of change is often a hard pill to swallow. Despite that the results of this world’s harm on the environment can already be seen and in addition, there is a general awareness of what the world can do to prompt reform; few have actually acted on this recognition. As regards ports, it is worth to mention that although all the considered ports report on greening their facilities and operations, monitor impacts and establish appropriate strategies few have actually implemented it. Environmental concerns are mostly perceived as an action that can only stall a port’s operation and development or a goal that its requirements are considered frills that ports couldn’t afford. Several times this study emphasized the urgency of addressing environmental issues in cruise ports particularly. The situation is similar to that regarding ports in general. Although being a ‘green’ port is widely perceived as a good-natured principle and widely reported, the conventional wisdom appears to be that ports and port authorities find little competitive advantage in their environmental performance. (Adams et. al. 2009)
5.4. What the future holds: Recommendations for the port of Piraeus
Building upon the empirical findings, this paper draws up policy recommendations and potential strategies for the port of Piraeus. Chapter three and four of this thesis allow drawing a representative overview of the Mediterranean cruise sector, as well as of this Greek cruise port. Once more, the importance of a destination’s attractiveness, which is surely enhanced through a good environmental performance, should be borne in mind. While significant share of the responsibility to protect the environment lies with the destinations, it is particularly interesting for cruise ports to ensure that destination’s natural heritage is preserved.
The last decade has been an interesting time in the cruise industry since the sector confronted tremendous growth numbers in global level and still continuous to strengthen nowadays. The research findings provide a framework of the key areas that need to be addressed, as well as access to information of existing environmental initiatives in leading cruise ports. In this vein with the aid of the expert interviews conducted, this section will attempt to provide recommendations for the port of Piraeus as regards its cruise sector:
1. The deterministic criteria for choosing a specific port do not include its environmental performance as significant; but this does not mean that this matter should be dealt as ‘strategy of secondary importance’. In addition, there exist empirical findings, as pointed out in literature review, suggesting that a port’s environmental performance really counts. Especially for the port of Piraeus, since for cruise lines the environmental performance of a port is not irrelevant, this issue needs to be at the top of its agenda as a supportive

52
condition for developing its expansion in the Mediterranean cruise market.
2. While EMS is already implemented, much work still needs to be done. EMS offers a structured basis of addressing environmental issues and helps at the same time to minimize potential environmental risks. This approach to proactively manage and enrich a port’s environmental performance should be dealt with more discipline by the respective port. (i.e. regular inspections, respect timeline procedures etc.)
3. As the city of Piraeus city acts as a hub for all cruise passengers’ activities;
partnerships that involve all the key players at destination is important. A first step for instance, could be provided by the port experts and society by ensuring the provision of sufficient public transport infrastructure and where appropriate, facilitating walking to and around the destination.
4. In addition, monitoring the impact of operations related with important issues are, as previously discussed, the initial step towards a better environmental performance. More precise, even though Piraeus reports financial performance indicators, some associated with environmental issues should also be included. These may possibly relate to areas of interest to investors or impacts related to regulatory compliance. Ideally, appropriate indicators should be selected collectively with all related actors in order to enable aggregation of the respective data.
5. At present, a key challenge that is considered from the port of Piraeus falls
into the energy management area. The potential of generating renewable energy on-site is thoroughly examined, and in case it happens will certainly boost Piraeus ‘green’ status. (Choices include the installation of photovoltaic solar panels and wind turbines.)
6. Ensure the development of integrated supply chains for delivering goods to
cruise ships; and the greener these supply chains the more beneficial for the port’s status as a whole. Also, the idea of the provision for short distance sea transport from the cruise terminal should also be considered, either as part of the aforementioned supply chain or as independent port facility.

53
6 Conclusions
Researching a neglected area of research within the scholarly literature (Marti, 2004), the paper assessed the status and trends of the cruise segment in the Mediterranean market in general and the Greek market in particular. Moreover, it provided an empirical analysis, via a questionnaire; interviews and analysis of industry reports, with a focus on the environmental issues related to the industry.
In the first chapter, the structuring of the thesis was presented. More precisely, its main parts are the introduction of the paper, followed by the setting of the research questions and the limitations of the research. This very first section concludes with the designation of the structure of the thesis illustrated in graph format. The second chapter contains the theoretical part of the thesis. Growing environmental concerns pose the biggest challenge for the sector, and varied reasons for a port to invest in improving its environmental performance exist. Yet, despite the need for cruise ports to act pro-actively in today’s environment, the majority of these issues are neglected. To gain a better understanding, in this chapter, six key areas of environmental challenges have been analyzed as essential for any approach towards a ‘greener’ port. Moreover, after emphasized on the urgency of defending the global natural heritage; and the description of the key areas and challenges that need to be addressed; special attention has to be devoted to the Mediterranean and its adjoining seas. In this vein, the third chapter describes the trends formulating the cruise sector globally; in Europe; and more detailed in Mediterranean, followed by a presentation of the characteristics and statistics information of the port of Piraeus.
The fourth chapter, after explaining the nature of competition in cruise ports, thoroughly analyzes the reasoning behind the selection of the specific portfolio for this study. Six ports (Barcelona, Civitavecchia, Venice, Balearic Islands, Piraeus and Marseille) were selected to conduct PPA. This technique will allow the positioning of the ports from a different perspective for each distinctive level. Firstly ports will be categorized according to their total traffic; then depicting their traffic structure; and as for the third and fourth level of PPA, the analysis will emphasize in the cruise traffic category. In these two last levels, selected ports will be positioned in relation to their cruise traffic and by relating cruise traffic with each port’s total traffic.
In keeping with the structure discussed so far, chapter five includes the literature findings and results of the conducted PPA from previous chapters, to conclude by illustrating a green portfolio. This portfolio adjusted in the fourth level of PPA and accompanied by the survey’s results; has allowed identifying the positioning of these ports while taking into account their environmental performances. To be more specific, Piraeus cruise operations have a share in its total traffic which corresponds to any other of the considered ports, but its annual growth over the period 2010-2013 is just below the market average. It is worth mentioning, though, that the results of the second level highlighted cruise as a ‘High Potential’ traffic category, and therefore future evolution in port strategies could adjust this port’s positioning. In this last chapter of this thesis, on the basis on pre-determined criteria, Piraeus is registered as the third greener port in the range; while the leader ‘green’ port was identified to be the port of Venice.

54
The response rate of the survey and the diversity in ports’ total traffics in the portfolio allow drawing a representative overview of the Mediterranean cruise sector. Thus, from the main outputs of the analysis this thesis at the end provides a brief summary of many potential examples of best practice strategies that could be followed by the cruise industry in the port of Piraeus in order to improve its attractiveness. This may involve monitoring the impact of operations related with important issues, restricting visitor numbers for certain excursions, or providing support for local conservation efforts.
As emerging point, it is relevant to mention once more the importance of ports in this discussion. Ports too often perceive that they need the cruise ships more than the cruise lines need them, but in fact there is a mutual need in this relationship. Ports have not yet realized that with the recent expansion of the cruise industry, cruise lines need new or more efficient operating ports as much -if not more- than the ports need them. Therefore, the situation as it is today, and as explained in this paper, has negative consequences on the environment and since the requirements are not going away, nor should they; these negative “green downsides” may stipulate ports to reverse this proactive approach to being viewed as an opportunity to benefit all actors involved.

55
Bibliography
A Blueprint to Safeguard Europe’s Water (COM/2012/0673), European
Commission, 14 November 2012
A Manual for Water and Waste Management: What the Tourism Industry Can
Do to Improve Its Performance, UNEP, 2003
A Manual for Water and Waste Management: What the Tourism Industry Can
Do to Improve Its Performance, UNEP, 2003
Air Pollution and Greenhouse Gas Emissions from Ocean-going Ships, The
International Council on Clean Transportation, 2007: www.theicct.org
Air Pollution and Greenhouse Gas Emissions from Ocean-going Ships: Impacts,
Mitigation Options and Opportunities for Management.
Air quality and Greenhouse Gas Tool Box, International Association of Ports and
Harbors / World Ports Climate Initiative, 2009
Annual report 2013http://www.portdebarcelona.cat/en/web/autoritat-
portuaria/memoria-vigente
Awards for Improving Coastal Environment: The example of the Blue Flag, Blue
Flag / FEE / WTO, 2006
Bagis, O. Dooms, M (2013). Turkey’s potential on becoming a cruise hub for the
East Mediterranean Region: The case of Istanbul. IAME 2013 Conference July
3-5 – Marseille, France Paper ID 226
Battistelli L., Coppola T., Fantauzzi M., Quaranta F., “The Environmental Impact
of Cruise Ships in the Port of Naples: Analysis of the Pollution Level and
Possible Solutions”, Maritime Environment Research II, pp. 945-958
Becker A, Acciaro M, Asariotis R, Carera E, Cretegny L, Crist P, Esteban M,
Mather A, Messner S, Naruse S, Ng AKY, Rahmstorf S, Savonis M, Song D,
Stenek V, Velegrakis AF (2013) A Note on Climate change adaptation for
seaports: A challenge for global ports, a challenge for global society. Climatic
Change. doi:10.1007/s10584-013-0843-z

56
Bunker fuels and the Kyoto Protocol: How ICAO and the IMO failed the climate
change test, European Federation for Transport and Environment, 2009
Bunker fuels and the Kyoto Protocol: How ICAO and the IMO failed the climate
change test, European Federation for Transport and Environment, 2009
C.B. Hunt, E.R. Auster Proactive Environmental Management: Avoiding the
Toxic Trap Sloan Management Review (1990) Winter
Cappato, A. Canevello, S. (2008). Suivi de la strategie Mediterraneenne pour le
développement durable. Etude régionale ‘Plaisance et croisière en
Méditerranée: bilan et perspective. Plan Bleu Centre d’Activités Régionales.
Sophia Antipolis, Juillet 2008.
Civitavecchiaport.org, (2014). Civitavecchia Port. Guide to Civitavecchia Port.
[online] Available at: http://www.civitavecchiaport.org [Accessed 13 Jul. 2014].
Clean Ports USA: Navigating Toward Cleaner Air, United States Environmental
Protection Agency, 2005
Clean Shipping Index: http://www.cleanshippingproject.se
Communication from the Commission. Roadmap for Maritime Spatial Planning:
Achieving Common Principles in the EU, COM/2008/0791, European
Commission 25 November 2008
Comprehensive Manual on Port Reception Facilities, International Maritime
Organization: http://www.imo.org
Comtois, C. and B. Slack (2007). Restructuring the maritime transportation
industry: Global overview of sustainable development practices. Available at:
http://www.mtq.gouv.qc.ca/portal/page/portal/Librairie/Publications/en/mini
stere/etudes/rtq0701.pdf.
Corres, Alkis John. 2012. “The Cruise Industry in Greece: A Survey and
Assessment of the Current Status Quo.” Available at:
http://www.academia.edu/2273782/The_Greek_Cruise_Industry
Council Directive 1999/30/EC of 22 April 1999 relating to limit values for sulphur
dioxide, nitrogen dioxide and oxides of nitrogen, particulate matter and lead in
ambient air, Council of the European Union, 1999

57
Council directive 1999/32/EC of 26 April 1999 relating to a reduction in the
sulphur content of certain liquid fuels and amending Directive 93/12/EEC,
Council of the European Union,1999
Council Directive 92/43/EEC of 21 May 1992 on the conservation of natural
habitats and of wild fauna and flora, Council of the European Communities, 1992
Council Directive of 12 December 1991 on hazardous waste
Council Directive of 2 April 1979 on the conservation of wild birds, Council of the
European Communities, 1979
Council Regulation (EEC) No 259/93 of 1 February 1993 on the supervision and
control of shipments of waste within, into and out of the European Community,
Council of the European Communities, 1993
Cruise calendar, Cruise Norway website, http://www.cruise-norway.no/
Cruise Lines International Association Europe. 2013. “The Cruise Industry.”
Contribution of Cruise Tourism to the Economies of Europe 2013 Edition.”
Retrieved from: http://www.cruise- norway.no/viewfile.aspx?id=3824
Cruise Lines International Association. Cruise Market Profile Study.
www.clia.org, [Accessed 21 Jul. 2014]
De Vaus, D. (2005) Surveys in Social Research. 5th edn. Oxon: Routledge.
Decision Criteria for Cruise Port Selection in the Mediterranean region,
Barcelona port, xxx
Directive 2000/14/EC of the European Parliament and of the Council of 8 May
2000, on the approximation of the laws of the Member States relating to the
noise emission in the environment by equipment for use outdoors, European
Parliament and Council of the European Union, 2000
Directive 2000/14/EC of the European Parliament and of the Council of 8 May
2000, on the approximation of the laws of the Member States relating to the
noise emission in the environment by equipment for use outdoors, European
Parliament and Council of the European Union, 2000

58
Directive 2000/59/EC of the European Parliament and of the Council of 27
November 2000 on port reception facilities for ship-generated waste and cargo
residues, European Parliament and Council of the European Union, 2000
Directive 2000/60/EC of the European Parliament and of the Council of 23
October 2000 establishing a framework for Com- munity action in the field of
water policy, European Parliament and Council of the European Union, 2000
Directive 2000/60/EC of the European Parliament and of the Council
establishing a framework for the Community action in the field of water policy
(Water Framework Directive), European Parliament and Council of the European
Union, 23 October 2000
Directive 2001/81/EC of the European Parliament and of the Council of 23
October 2001 on national emission ceilings for certain atmospheric pollutants,
European Parliament and Council of the European Union, 2001
Directive 2002/49/EC of the European Parliament and of the Council of 25 June
2002 relating to the assessment and management of environmental noise,
European Parliament and Council of the European Union, 2002
Directive 2002/49/EC of the European Parliament and of the Council of 25 June
2002 relating to the assessment and management of environmental noise,
European Parliament and Council of the European Union, 2002
Directive 2005/33/EC of the European Parliament and of the Council of 6 July
2005 amending Directive 1999/32/EC relating to the sulphur content of marine
fuels, European Parliament and Council of the European Union, 2005
Directive 2005/35/EC of the European Parliament and of the Council of 7
September 2005 on ship source pollution and on the introduction of penalties for
infringements, European Parliament and Council of the European Union, 2005
Directive 2008/105/EC of the European Parliament and of the Council of 16
December 2008 on environmental quality standards in the field of water policy,
European Parliament and Council of the European Union, 2008
Directive 2008/105/EC of the European Parliament and of the Council on
environmental quality standards in the field of water policy, European Parliament
and Council of the European Union, 16 December 2008

59
Directive 2008/50/EC of the European Parliament and of the Council of 21 May
2008 on ambient air quality and cleaner air for Europe, European Parliament
and Council of the European Union, 2008
Directive 2008/56/EC of the European Parliament and of the Council of 17 June
2008 establishing a framework for community action in the field of marine
environmental policy (Marine Strategy Framework Directive), European
Parliament and Council of the European Union, 2008
Directive 2008/98/EC of the European Parliament and of the Council of 19
November 2008 on waste and repealing certain Directives, European Parliament
and Council of the European Union, 2006
Ecotourism: Principles, Practices and Policies for Sustainability, UNEP, 2002
Environmental Ship Index, WPCI, http://www.wpci-esi.org/Public/Home
Environmental Ship Index, WPCI, http://www.wpci-esi.org/Public/Home
ESPO Code of Practice on the Birds and Habitats Directives, ESPO, 2007.
Available at: http://www.espo.be
ESPO Environmental Code of Practice, ESPO, 2004. Available at:
http://www.espo.be
ESPO, (2012). ESPO Green Guide: Towards excellence in port environmental
management and sustainability. Available at: http://www.espo.be
European Commission (2003, May 27). Towards a thematic strategy on the
prevention and recycling of waste
European Commission. Discussion paper: a community strategy on air pollution
from seagoing ships. Directorate-General for Environment, Brussels, January
2001.
Evaluation of the Feasibility of Alternative Market-Based Mechanisms To
Promote Low-Emission Shipping In European Union Sea Areas, European
Commission, 2004
Floating Smokestacks - A call for action to clean up marine shipping pollution,
Environmental Defense Fund, 2008

60
Forging Links Between Protected Areas and the Tourism Sector: How tourism
can benefit conservation, UNEP, 2005
G.P. Wild (International) Ltd and Business Research and Economic Advisors
(BREA) (2007). Contribution of cruise tourism to the economies of Europe.
February.
Gertsakis J, Lewis H. Sustainability and the waste management hierarchy.
Available from: hhttp://www.ecorecycle.vic.gov.au/asset/l/ upload/TZW_-
_Sustainability_and_the_Waste_Heirachy_(2003).pdfi [accessed 15 July 2014].
Global Sustainable Tourism Criteria for Hotels and Tour Operators:
http://www.gstcouncil.org/
Globallast.imo.org, (2014). GloBallast Partnerships - Home. [online] Available at:
http://globallast.imo.org [Accessed 21 Aug. 2014].
Good Practice Guide on Port Noise Mapping and Management, NoMEPorts
Project, 2008
Good Practice Guide on Port Noise Mapping and Management, NoMEPorts
Project, 2008
Green Globe Standard Criteria and Indicators: http://greenglobe.com
Greenbunkering.com, (2014). Green Bunkering in the Port of Gothenburg.
Sources of further information - air quality [online] Available at:
http://greenbunkering.com/user/Login.aspx [Accessed 1 Aug. 2014].
Greenhouse Gas Emissions Reduction Potential from International Shipping,
Organization for Economic Co-operation and Development / International
Transport Forum, 2009
Greenhouse Gas Emissions Reduction Potential from International Shipping,
Organization for Economic Co-operation and Development / International
Transport Forum, 2009
Gui, L., & Russo, A. P. (2011). Cruise ports: a strategic nexus between regions
and global lines-evidence from the Mediterranean. Maritime Policy &
Management: The Flagship Journal of International Shipping and Port Research,
38(2), 129e150.
61
Guidelines for ballast water exchange (G6). Resolution MEPC.124 (53), IMO
Marine Environment Protection Committee, 2005: http://www.imo.org/
Guidelines for Community Noise, World Health Organisation, 1999
Guidelines for Community Noise, World Health Organisation, 1999
Haezendonck, E. (2001) Essays on Strategy Analysis for Seaports. Leuven:
Garant Publisher.
Haezendonck, E., (2001), Essays on strategy analysis for seaports, Garant:
Leuven
Haezendonck, E., and Dooms, M. (2004) Environmental Strategy for Ports:
towards a Green Gateway Approach. Proceeding of the International
Association of Maritime Economists 2004 (IAME 2004), Izmir.
Haezendonck, E., and Winkelmans, W. (2002) Strategic Positioning as an
Instrument for Competition Analysis, in Huybrecths, M., Meersman, H., Van de
Voorde, E., Hooydonk, E., Verbeke, A., and Winkelmans, W. (eds) Port
Competitiveness: an Economic and Legal Analysis of the Factors Determining
the Competitiveness of Seaports. Antwerp: De Boeck.
Hall CM, Lew A, editors. Sustainable tourism: a geographical perspective.
London: Prentice-Hall, 1998.
http://www.portdebarcelona.cat/en/home_apb
Ilinitch, A.Y. and Schaltegger, S.C. (1995), Developing a Green Business
Portfolio, Long Range Planning, 28 (2): 29-38.
Indicators of Sustainable Development for Tourism destinations(section 4.18
Cruise Ships and their Destinations), World Tourism Organization (UNWTO),
2004
Information Reporting on Type Approved Ballast Water Management Systems.
Resolution MEPC. 175 (58), IMO Marine Environment Protection Committee,
2008: http://www.imo.org/
Integrated Coastal Zone Management, European Commission website:
http://ec.europa.eu/environment/iczm/home.htm

62
Integrating Sustainability into Business – A Management Guide for Responsible
Tour Operations, UNEP / Tour Operators Initiative, 2005
International Convention for the Control and Management of Ships ́ Ballast
Water and Sediments, International Maritime Organisation, 2004:
http://www.imo.org/
International Convention for the Prevention of Pollution from Ships (MARPOL)
73/78, International Maritime Organization: http://www.imo.org
International Convention for the Prevention of Pollution from Ships (MARPOL)
Annex VI, International Maritime Organization: http://www.imo.org
International Convention for the Prevention of Pollution from Ships (MARPOL)
73/78, International Maritime Organization: http://www.imo.org
International Convention for the Prevention of Pollution from Ships (MARPOL)
73/78, International Maritime Organization: http://www.imo.org
International Convention for the Prevention of Pollution from Ships (MARPOL)
Annex VI, International Maritime Organization: http://www.imo.org [Accessed 10
July 2014]
International Convention on Oil Pollution Preparedness, Response and
Cooperation (OPRC), International Maritime Organisation, 1990,
http://www.imo.org/
International Maritime Organization, Comprehensive Manual on Port Reception
Facilities,: http://www.imo.org
ISO 14064-1:2006 Greenhouse gases, International Standards Organisation,
2006
ISO 14064-1:2006 Greenhouse gases, International Standards Organisation,
2006
ISO 1996-1:2003 Acoustics, description, measurement and assess- ment of
environmental noise, International Standards Organisation, 1996
ISO 1996-1:2003 Acoustics, description, measurement and assessment of
environmental noise, International Standards Organisation, 1996
63
Lam, J.S.L., Notteboom, T., 2014. The greening of ports: a comparison of port
management tools used by leading ports in Asia and Europe. Transport Reviews
32 (2), 169–189.
Landon, F. (2011, October 05). Everyone wants to be green, but who will pay?
Lloyds list.
Lekakou M.B. and Pallis A.A. (2004). Cruising the Mediterranean Sea: Market
Structures and EU Policy Initiatives. Aegean Working Papers, 2(1), 45-61.
Lekakou, M. B., Pallis, A. A., & Vaggelas, G. K. (2009). Which homeport in
Europe: the cruise industry’s selection criteria. TOURISMOS: An International
Multidisciplinary Journal of Tourism, 4(4), 215e240.
Lekakou, M., B., Pallis, A., A., Vaggelas, G., K., (2009). “An analysis of cruise
industry’s selection criteria”. Paper to be presented at the International
Association of maritime Economists Conference, 24-26 June 2009,
Copenhagen, Denmark. Ask if it is published
Lekakou, M., B., Pallis, A., A., Vaggelas, G., K., (2009). “The potential of Piraeus
as a major Mediterranean Cruise Home-port: A selection criteria analysis”.
Proceedings of the 4th International Scientific Conference, 3-5 April 2009,
Rhodes, Greece.
Lekakou, M., Pallis, A.A. and Vaggelas, G.K.. (2009). “Would cruise companies
choose Piraeus as a homeport?” Naftika Chronika magazine, Issue 120, May
2009.
Lekakou, M., Stefanidaki, E., and Vaggelas, G.K., 2011. The economic impact of
cruise to local economies. The case of an island. Presented at: 2011 Athens
tourism
Lloyd’s Register ODS (2010), Noise from ships in ports; Possibilities for noise
reduction, Report for the Environmental Protection Agency of the Danish
Ministry of the Environment, Environmental Project No. 1330, Copenhagen
Managing Cruise Ship Impacts: Guidelines for Current and Potential Destination
Communities, Tourisk Inc., 2006
Marine Shipping Emissions Mitigation, Pew Center on Global Climate Change,
2010

64
Marine Shipping Emissions Mitigation, Pew Center on Global Climate Change,
2010
Maritime Policy and Management, Vol. 27, No. 4, pp. 315-333.
Market-based instruments for NOx abatement in the Baltic Sea, Air Pollution &
Climate Secretariat / European Environmental Bureau / European Federation for
Transport and Environment, 2009
Marti, B., E., (2003). “Trends in world and extended-length cruising (1985-
2002)”. Marine Policy 28, 199-211.
Marti, B.E., (1990). “Geography and the cruise ship port selection process”.
Maritime Policy and Management, 17 (3), 157-164.
MedCruise report, (2014). Cruise activities in Medcruise ports: Statistics 2013.
Association of Mediterranean Cruise Ports
Medcruise Yearbook 2013/2014 (2014), A directory of cruise ports &
professionals in Mediterranean & adjoining seas, Association of Mediterranean
Cruise Ports.
Member States Group on Ports and Maritime Transport - North Sea Group
(1995), Integration of ports and maritime transport in the Transeuropean network
- North Sea region, Planco Consulting / NEA Transport Research: Essen.
Miles A.W. (1986) “Renaissance of the portfolio”, Perspectives, The Boston
Consulting Group, San Francisco, p.3
Murray, Thomas J. & Associates, Inc. 2005. “The Impacts Of The Cruise Ship
Industry On The Quality Of Life In Key West.” City of Key West Naval Properties
Local Redevelopment Authority. October 2005. Retrieved from:
http://responsibletourismkw.com/wp-
content/uploads/2013/06/2005Impact_study.pdf
Namhyun Kim and Bruce E. Wicks, (2010) "Rethinking Tourism Cluster
Development Models for Global Competitiveness" (International CHRIE
Conference-Refereed Track. Paper 28.)
http://scholarworks.umass.edu/refereed/CHRIE_2010/Friday/28, Accessed on
June 14,2014

65
Nijkamp, P. (1999) Roads Toward Environmentally Sustainable Transport, in
Hayashi, Y., Button, K. J., and Nijkamp (eds) The Environment and Transport.
Cheltenham: Edward Elgar, p.18-28.
Notteboom, T. and W. Winkelmans (2001). Structural changes in logistics: how
will port authorities face the challenge? Maritime Policy & Management, 28, 1,
71–89.
Notteboom, T.E. and Rodrigue, J-P. (2005), ‘Port regionalization: towards a new
phase in port development’, Maritime Policy and Management, 32, 3, pp. 297–
313.
OECD (2011), Environmental Impacts of International Shipping; the Role of
Ports; edited by N.A. Braathen, OECD Publishing, Paris
OECD (Organisation for Economic Cooperation and Development) (1988),
Transport and the Environment, OECD: Paris.
Olp.gr, (2014). Piraeus Port Authority. [online] Available at: http://www.olp.gr/el/
[Accessed 6 Jul. 2014].
Our life insurance, our natural capital: an EU biodiversity strategy to 2020,
European Commission, 3 May 2011
Pallis, A.A. (2007), Whither Port Strategy? Theory and Practice in Conflict, in:
idem (Ed.) Maritime Transport: The Greek Paradigm, Research in
Transportation Economics, No 21, Elsevier: London, pp. 345-386.
Pathways to low carbon shipping – Abatement potential towards 2030, Det
Norske Veritas, 2009
Pathways to low carbon shipping – Abatement potential towards 2030, Det
Norske Veritas, 2009
Port of Barcelona: General information for waste disposal:
http://www.portofrotterdam.com/en/Shipping/sea-shipping/Pages/waste-
disposal.aspx [Accessed 3 Jul. 2014].
Port of Dover - Ships’ Waste Management Plan: http://www.dover-
port.co.uk/_assets/client/images/collateral/Ships%20WMP%20ammended.pdf

66
Port of Dover - Ships’ Waste Management Plan: http://www.dover-
port.co.uk/_assets/client/images/collateral/Ships%20WMP%20ammended.pdf
Port of Gothenburg – Liquefied Natural Gas and Biogas:
http://www.portofgothenburg.com/About-the-port/Development-projects/
Liquefied-Natural-Gas-and-biogas/
Port of Marseille. (2014). [online] Available at: http://www.marseille-
port.fr/fr/Accueil/ [Accessed 21 Jul. 2014].
Port of Rotterdam: General information for waste disposal:
http://www.portofrotterdam.com/en/Shipping/sea-shipping/Pages/waste-
disposal.aspx
Port of Venice, (2014). Port of Venice Authority |. [online] Available at:
https://www.port.venice.it/en [Accessed 3 Jul. 2014].
Portdebarcelona.cat, (2014). Port Barcelona - Consultation documents. [online]
Available at: http://www.portdebarcelona.cat/en/web/port-del-ciudada/consulta-
de-documentos [Accessed 15 Jul. 2014].
Ports of Stockholm - Waste instructions for cruise vessels:
http://www.stockholmshamnar.se/en/Services--prices/Waste-instructions-for-
cruise- vessels/
Ports of Stockholm - Waste instructions for cruise vessels:
http://www.stockholmshamnar.se/en/Services--prices/Waste-instructions-for-
cruise- vessels/
Portsdebalears.com, (2014). Ports de Balears: homepage. [Online] Available at:
http://www.portsdebalears.com/index.php3 [Accessed 21 Jul. 2014].
Prevention of Air Pollution from Ships - Second IMO GHG Study, International
Maritime Organization, 2009
Prevention of Air Pollution from Ships - Second IMO GHG Study, International
Maritime Organization, 2009
Prevention of Air Pollution from Ships. [online] MEPC 58/INF.6, IMO Marine
Environment Protection Committee, 2008. Available at: http://www.imo.org/
[Accessed 10 July 2014]

67
Proposal for a Directive of the European Parliament and of the Council
establishing a framework for the protection of soil and amending Directive
2004/35/EC, European Commission, 2004
Psaraftis H.N. and Pallis A.A. (2010). “Concession of the Piraeus container
terminal: Turbulent times and the quest for competitiveness”. Paper presented at
International Association of Maritime Economists Conference, Lisboa, Portugal,
July 2010
Regulation (EC) No 1013/2006 of the European Parliament and of the Council of
14 June 2006 on shipments of waste, European Parliament and Council of the
European Union, 2006
Regulation (EC) No 2099/2002 of the European Parliament and of the Council of
5 November 2002 establishing a Committee on Safe Seas and the Prevention of
Pollution from Ships (COSS) and amending the Regulations on maritime safety
and the prevention of pollution from ships, European Parliament and Council of
the European Union, 2002
Renewable Energy Opportunities in the Tourism Industry, UNEP, 2003
Rodrigue, J-P and Notteboom, T. (2012). “The geography of cruise shipping:
itineraries, capacity deployment and ports of call”. Paper presented at
International Association of Maritime Economists (IAME) Conference, Taipei,
Taiwan, 5-8 September 2012.
Rodrigue, J. P., & Notteboom, T. (2009). The cruise industry. In The geography
of transport systems (Chapter 7), application 4
http://people.hofstra.edu/geotrans/eng/ch7en/appl7 en/ch7a4en.html.
Scaramelli, S. (2010). The Determinants of Port Competitiveness: The case of
Valencia. MSc. Erasmus University.
Shipping Impacts On Climate: A Source With Solutions, Oceana, 2008
Shipping Impacts On Climate: A Source With Solutions, Oceana, 2008
Slack, B. (1985) Containerisation, Inter-Port Competition and Port Selection.
Maritime Policy and Management, 12 (4) 293-303.]
Slack, B. (2010). Battening down the hatches: how should the maritime
industries weather the financial tsunami? In A. K. Y. Ng, & J. J. Liu (Eds.),

68
Research in transportation economics series: Maritime industries in the post-
2008 environment Oxford: Elsevier.
Stefano Soriani, Stefania Bertazzon, Francesco DI Cesare & Gloria Rech (2009)
Cruising in the Mediterranean: structural aspects and evolutionary trends,
Maritime Policy & Management: The flagship journal of international shipping
and port research, 36:3, 235-251, DOI: 10.1080/03088830902861128
Sustainable Cruise Tourism in the North Sea Region, A best practice guide,
Oliver Pierce, 2013
Sustainable Tourism in Protected Areas: Guidelines for Planning and
Management, UNEP / IUCN / WTO, 2002
Sweeting JEN, Wayne SL. A shifting tide. Environmental challenges and cruise
industry responses. Interim Summary Report from the Centre for Environmental
Leadership in Business; 2003.
Sweeting, J.,E.,N., Wayne, S., L., (2003). “A shifting tide. Environmental
challenges and cruise industry responses”. Interim Summary Report,
Washington DC: Centre for Environmental Leadership in Business.
symposium, 2-3 February 2011, Athens, Greece.
The implementation of the Birds and Habitats Directives in estuaries and coastal
zones, with particular reference to port development and dredging, European
Commission, 2011.
The Liner Shipping Industry and Carbon Emissions Policy, World Shipping
council, 2009
The Liner Shipping Industry and Carbon Emissions Policy, World Shipping
Council 2009
The Natural Choice - Environmental innovations for sustainable shipping:
Liquefied Natural Gas provided in the Port of Gothenburg, Port of Gothenburg,
2012
The NoMEPorts (Noise Management in European Ports) project:
http://nomeports.ecoports.com

69
The NoMEPorts (Noise Management in European Ports) project:
http://nomeports.ecoports.com
Tourism and Biodiversity: Mapping Tourism’s Footprint, UNEP, 2003
Tourist facilities in ports: Growth opportunities for the European maritime
economy, European Commission, 2009
Trozzi C. and Vaccaro R. (2000) “Environmental impact of Port Activities”,
Maritime Engineering and Ports II, pp. 151-161
UNEP (2002). Industry as a partner for sustainable development: Tourism. A
report prepared by World Tourism Council, International Hotel and Restaurant
Association, International Federation of Tour Operators and the International
Council of Cruise Lines.
Vaggelas G.K., (2011). “Cruise tourism: Economic benefits, sustainable
development and port-city relations”. Regional Seminar: Tourism and
sustainable development in the Mediterranean. Organized by Plan Bleu. Genoa,
Italy, 12-14 December 2011.
Van De Voorde, E., and Winkelmans, W. (2002) A General Introduction to Port
Competition and Management, in Huybrechts, M., Meersman, H., Van de
Voorde, E., Van Hooydonk, A., Verbeke, A., and Winkelmans, W. (eds) Port
Competitiveness. An Economic and Legal Analysis of the Factors Determining
the Competitiveness of Seaports. Antwerp: De Boeck Ltd.
Verhoeff, J. M. (1981) Seaport Competition: some Fundamental and Political
Aspects. Maritime Policy and Management, 8 (1) 49-60.
Verhoeven, P., 2010. A review of port authority functions: towards a
renaissance? Marit. Policy Manag. 37 (3), 247–270.
Waters, R., 1977. Port economic impact studies: practice and assessment.
Transportation Journal, 17(3), 14-18.
WaterSense landscaping tool http://www.epa.gov/watersense/specs/water-
budget_tool/ws_revwaterbudget_tool.xls
Wiegmans, B.W., Geerlings, H., 2010. Sustainable port innovations: barriers and
enablers for successful implementation. World Rev. Intermodal Transp. Res. 3
(3), 230–250.

70
Wild P. and Dearing, J., (2000). “Development of and prospects for cruising in
Europe”,
World Bank Group, (2014). World Bank Group. [online] Available at:
http://www.worldbank.org [Accessed 17 Jul. 2014].
World Ports Climate Initiative - LNG-Fueled Vessels. Available at:
http://wpci.iaphworldports.org/project-in-progress/lng-fueled-vessels.html
World Ports Climate Initiative http://wpci.iaphworldports.org/
Zondag, B., Bucci, P., Gutzkow, P., and De Jong G. (2010) Port Competition
Modelling Including Maritime, Port and Hinterland Characteristics. Maritime
Policy and Management, 37 (3) 179-194.

71
Appendices
Appendix I
Data analysis: Tables of data Table 4:Cruise Ports per passengers' size. Category A (>130.000 pax), 2013
No. Port Cruise Passengers 2013 1 Balearic islands 1.541.376
2 Barcelona 2.599.232
3 Bari 604.781
4 Cagliari 146.003
5 Cartagena 134.225
6 Civitavecchia 2.538.259
7 Corfu 744.651
8 Cyprus Ports 271.673
9 Dubrovnik/Korcula 1.136.503
10 French Riviera Ports 613.218
11 Genoa 1.050.085
12 Gibraltar 278.139
13 Heraklion 270.020
14 Kotor 317.746
15 Kusadasi/Bodrum/Antalya 780.804
16 La Spezia 213.858
17 Lisbon 558.040
18 Livorno 736.516
19 Madeira Ports 482.112
20 Málaga 397.416
21 Marseille 1.188.031
22 Messina 501.316
23 Monaco 249.806
24 Naples 1.175.018
25 North Sardinian Ports 206.140
26 Palermo 410.999
27 Piraeus 1.302.581
28 Savona 939.038
29 Split 189.107
30 Tenerife Ports 794.151
31 Toulon-Var-Provence 385.971
32 Tunisian Ports 511.065
33 Valencia 473.114
34 Valletta 477.759
35 Venice 1.815.823 Source: adopted by Medcruise Statistics report 2014, own compilation of the author

72
Appendix II
PPA: Tables of data Table 5: Average Growth Rates and Market Shares for the port of Barcelona, years 2010-2013.
Table 6: Average Growth Rates and Market Shares for the port of Civitavecchia, years 2010-2013

73
Table 7: Average Growth Rates and Market Shares for the port of Venice, years 2010-2013.
Table 8: Average Growth Rates and Market Shares for the port of Piraeus, years 2010-2013.
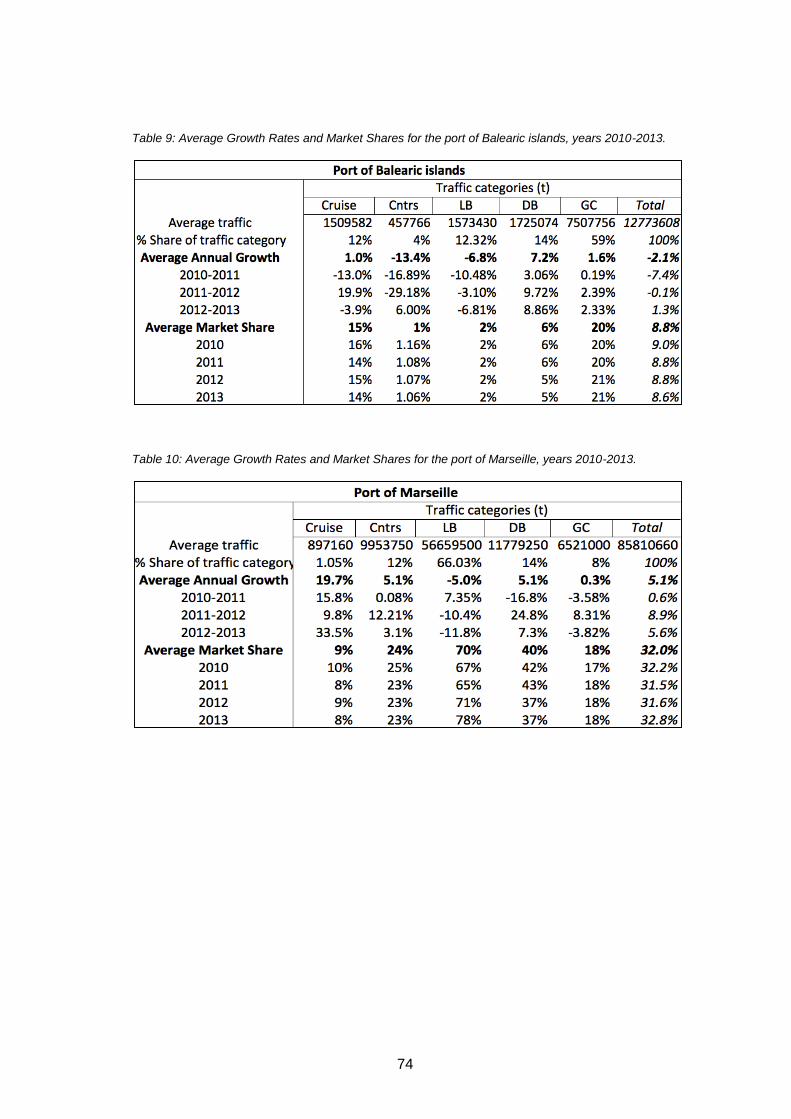
74
Table 9: Average Growth Rates and Market Shares for the port of Balearic islands, years 2010-2013.
Table 10: Average Growth Rates and Market Shares for the port of Marseille, years 2010-2013.

75
Appendix III
Survey sample General Information
Company:
Email:
Company Activity:
Respondent:
Function:
Services:
Website:
Questions
On a scale from -2 to 2, please indicate how the factors-tools listed below enhance
the green image of a cruise port (-2 = strong negative effect; -1= negative effect; 0 =
no opinion; 1 =positive effect; 2 = strong positive effect
-2 -1 0 1 2
1. How important is monitoring impacts (with appropriate use of performance indicators) for a cruise port’s environmental status?
2. How important are measures to minimize noise in a cruise port for its environmental status?
3. How much does the use of renewable energy sources enhance a cruise port’s environmental status?
4. How important is the provision of waste reception facilities for a cruise port’s environmental status?
5. How much does proper management of touristic activities (such as efficient public transport connections and demonstration of suitable capacity plans) positively affect a cruise port’s environmental status?
6. How important is environmental management of dredging operations for a cruise port’s environmental status?
7. How important are measures to minimize air pollution for a cruise port’s environmental status?
8. How important is the establishment of ballast water management for a cruise port’s environmental status?

76
On a scale from -2 to 2, please indicate how the port of Piraeus performs regarding the factors listed below on the right. The boxes on the left specify the area of interest for each determinant. (-2 = strong negative effect; -1= negative effect; 0 = no opinion; 1 =positive effect; 2 = strong positive effect)
Questions
- Do you think Piraeus can achieve a better position due to its environmental performance?
- Based on your perceptions which of the aforementioned determinants is perceived to be the most crucial?
•Waste management / Waste reception facilities
Waste
•Environmental management of dredging operations
Land Use & Soils
•Measures to minimize noiseAtmosphere
•Monitoring impactsPort Strategies/ Port
Management
•Measures to minimize air emissionsAtmosphere
•Ballast Water managementWater
•Energy management/Use of renewable energy sources
Energy
•Proper management of touristic activitiesPort Strategies/ Port
Management

77
Appendix IV
Ta
ble
11
: G
ree
n in
dic
ato
rs o
f a
cru
ise p
ort
's e
nvir
on
me
nta
l pe
rfo
rma
nce
So
urc
e:
ow
n c
om
pila
tio
n o
f th
e a
uth
or
ba
sed
on
po
rt’s
we
bsite
s