Embed Size (px)
Citation preview

Environmental Monitoring Report
This report has been submitted to ADB by the Borrower and is made publicly available in accordance with ADB’s public communications policy (2005). It does not necessarily reflect the views of ADB.
Project Number: LN2612/EI7303 July to Sept 2013
PHI: Visayas Base-load Power Development Project
Prepared by
KEPCO SPC Power Corporation
Cebu City, Philippines

2 x 100 MW CEBU POWER PLANT
2013.10.15
Environmental Monitoring Results (Jul-Sep. 2013)

ii
Table of Contents
Page
I. General Information 1
II. Introduction and Plant Operation Status 1
III. Results of Environmental Monitoring 2
3.1 RA 8749: Air Environment
3.1.1 Ambient Air Quality Monitoring 2
3.1.2 Manual Ambient Air & Noise Monitoring 9
3.1.3 Air Emissions 11
3.2 RA 9275: Water Environment
3.2.1 Ground Water 16
3.2.2 Marine Water 17
3.2.3 Water Effluents 18
3.2.4 Thermal Discharge 19
3.3 RA 6969: Controlled Chemicals & Hazardous Waste
3.3.1 CCO Report 20
3.3.2 Hazardous Waste 20
3.3.3 Naalad Rip-rapping Status 21
3.4 RA 9003: Solid Wastes 22
IV. Conclusion 23
Attachments
Attachment 1 - Monitoring Locations / Sampling Maps
Attachment 2 - Environmental Monitoring Trending Graphs
Attachment 3 - Certificates of Analyses
Attachment 4 - Environmental Monitoring Pictures
Attachment 5 - Newly Acquired Permits

1
I. GENERAL INFORMATION
Name of Plant : CEBU POWER PLANT
Owner : KEPCO SPC POWER CORPORATION
Location : COLON NAGA CITY, CEBU
Project Type : 2x10³MW Coal-fired CFBC
Environmental
Laws Permits (See Attachment 5) Date of Issue Expiry Date
PD 1586 ECC ECC-0511-013-206 05-Dec-05 -
DENR-EMB
RA 9275 DP No. DP-13-E-072230-013
08-May-13
(Att. 5) 08-May-14
DENR-EMB
RA 6969
DENR Registry ID DENR-ID No. 07-22-1139 08-Jun-11 -
CCO Registry CCO-Hg-2011-07-22-001 06-Jan-12 -
DENR-EMB
RA 8749 PO No. POA-13-E-072230-0040
08-May-13
(Att. 5) 08-May-14
PNP
RA 8294
License to Possess
Explosives & Explosive
Ingredients
PGB34-080413-03835 08-Apr-13
(Att. 5) 07-Apr-14
PDEA
RA 9165
License to Handle
Controlled Precursors
and Essential Chemicals
P6-03412001-R017-H
P5-IM-03412001-R011-H
16-Dec-12
(Att. 5) 16-Dec-13
II. INTRODUCTION AND PLANT OPERATION STATUS
This report shall cover the period from July to September 2013 with sampling and testing activities done
within the period. Monitoring stations are those approved in the EIS, by DENR, and in the EMP of the
project. Unit 1 is on shutdown for scheduled maintenance starting September 21 while Unit 2 is on full
load operation within the coverage period. Below is a table showing the summary of plant performance.
Table 1. Cebu Power Plant Performance Status
Month Unit
Total Coal
Consumption
(tons)
Net
Generated
Power
(MWh)
Average Net
Heat Rate
(kCal/kWh)
House
Load Rate
(%)
Net
Efficiency
(%)
Planned
Plant
Outages
(Days)
Forced
Plant
Outages
(Days)
Jul
1 39,378.000 66,820.150 2,555.220 9.200 33.670 0.290 -
2 38,937.000 61,342.670 2,539.030 8.850 33.880 - -
Aug
1 35,538.000 53,185.420 2,674.400 9.600 32.340 3.500 -
2 40,024.000 68,232.380 2,599.220 9.150 33.090 - -
Sep
1 25,102.000 38,574.910 2,631.320 9.060 32.720 10.830 -
2 39,366.000 62,957.690 2,594.460 9.210 33.150 - -

2
III. RESULTS OF ENVIRONMENTAL MONITORING
3.1. RA 8749: AIR ENVIRONMENT
3.1.1. Ambient Air Quality Monitoring System (AAQMS) Results
Ambient air monitoring is important to ensure that the stakeholders are breathing clean air that is
within the set standards. The current period is now in the Operations and Maintenance (O&M) regime
thus monitoring stations covered are those specified in the ECC and in accordance to DENR’s
recommendation. All sampling and analytical procedures conform to those required by the Bureau and
are performed by accredited service provider and laboratory. Table 2 summarizes the monitoring
activities made within the coverage period.
Results of the ambient air parameters monitored at the two (2) continuous stations defined in Table 2
with an averaging time of 24 hours generally concludes that the levels are well within the background
and standard values. On the average, the PM-10, SO2 and NO2 levels at station 1 and station 2 are below
the given standards - no exceedances were observed for all parameters. Tables 3 to 5 shows a summary
of the monthly data in the AAQMS while Figures 1 to 2 is a summary of the meteorological conditions
gathered within the coverage period. Figures 3 to 5 show graphical representations of the data. For the
coverage period, the prevailing wind directions are from the Northwest of station 1 and from Southeast
of station 2 with a maximum speed of 2.5 mps and 8 mps respectively.
Networking and communication to the central station is still currently being resolved but does not
interfere in the monitoring as data can still be manually collected at the two (2) off-site stations.
Table 2. Ambient Air Monitoring Stations and Parameters
Coverage Period Monitoring Stations Parameters Monitored
Jul-Sep 2013
Continuous Ambient Air Monitoring Stations:
STN 1 – North Poblacion Area (Aliganga’s
Residence)
STN 2 – Colon Area Near Barangay Hall (Berdan’s
Open Ground)
Manual Ambient Air Monitoring Points:
STN 3 – Barangay Tangke Basketball Court
STN 4 – Along National Road cor. Aliganga St.
STN 5 – Near the Pier Area at the Plant Site
STN 6 – In front of Mangkikis Chapel, Sitio
Mangkikis
PM-10, SO2, NO2, Noise
PM 10, SO2, NO2, Noise

3
Table 3. AAQMS Results (July 2013)
Monthly Ambient Air Quality Monitoring Report (July'13)
Date
Station 1 Station 2
Averaging
Time
Item
Wind Speed Wind Direction NO2 PM 10 NOISE SO2 Wind Speed Wind Direction NO2 PM 10 NOISE SO2
m/s - ppm mg/m3 dB ppm m/s - ppm mg/m3 dB ppm
DENR STD NA NA 0.080 0.150 75.000D 0.070 NA NA 0.080 0.150 75.000
D 0.070 NA
WORLD BANK STD NA NA 0.0987B 0.150
C 70.000
E 0.0443
A NA NA 0.0987
B 0.150
C 70.000
E 0.0443
A NA
Min 0.900 NA 0.002 0.006 40.366 -0.001 0.500 NA 0.000 0.003 46.300 0.001 24hrs
Max 1.600 NA 0.007 0.038 51.400 0.001 3.900 NA 0.005 0.055 68.798 0.024 24hrs
Average 1.148 NA 0.005 0.018 46.670 0.000 1.513 NA 0.002 0.022 54.145 0.002 month
1 1.000 NNW 0.00592 0.022 48.433 0.00092 1.100 ESE 0.00351 0.007 68.798 0.00118 24hrs
2 1.200 NNW 0.00732 0.018 41.466 0.00104 0.900 ESE 0.00406 0.055 67.618 0.00121 24hrs
3 1.000 WNW 0.00708 0.012 40.776 0.00108 1.400 SE 0.00305 0.028 62.682 0.00124 24hrs
4 1.400 SE 0.00436 0.020 40.867 0.00093 1.300 SE 0.00087 0.018 62.148 0.00122 24hrs
5 1.400 ESE 0.00418 0.033 40.561 0.00089 0.900 ESE 0.00120 0.019 62.135 0.00118 24hrs
6 1.400 SSW 0.00461 0.021 41.513 0.00091 0.800 E 0.00173 0.003 63.232 0.00121 24hrs
7 1.600 SSE 0.00251 0.006 40.366 0.00081 0.600 E 0.00022 0.007 62.504 0.00117 24hrs
8 1.200 W 0.00383 0.023 50.763 0.00089 1.000 E 0.00089 0.007 61.241 0.00123 24hrs
9 1.000 NNE 0.00503 0.018 48.709 0.00035 1.200 ESE 0.00335 0.004 57.435 0.00128 24hrs
10 1.400 E 0.00501 0.017 49.915 -0.00066 1.200 ESE 0.00286 0.009 58.731 0.00125 24hrs
11 1.400 E 0.00411 0.011 43.342 -0.00071 1.700 ESE 0.00228 0.021 58.913 0.00126 24hrs
12 1.100 ENE 0.00442 0.009 46.741 -0.00071 1.600 ESE 0.00356 0.003 58.738 0.00130 24hrs
13 1.000 ENE 0.00483 0.017 44.662 -0.00072 2.600 ESE 0.00129 0.030 59.467 0.00127 24hrs
14 0.900 NW 0.00372 0.018 49.844 -0.00075 2.500 ESE 0.00075 0.028 57.851 0.00123 24hrs
15 1.100 SE 0.00521 0.015 48.600 -0.00068 3.000 ESE 0.00300 0.019 58.901 0.00133 24hrs
16 0.900 W 0.00386 0.016 50.400 -0.00072 2.400 ESE 0.00236 0.018 47.200 0.00134 24hrs
17 1.000 W 0.00290 0.015 49.200 -0.00077 3.300 SSE 0.00266 0.027 46.600 0.00132 24hrs
18 1.200 SE 0.00444 0.012 47.900 -0.00073 3.900 SSE 0.00292 0.023 46.300 0.00135 24hrs
19 1.400 ENE 0.00613 0.011 47.800 -0.00053 1.600 SW 0.00157 0.019 46.400 0.00136 24hrs
20 1.000 SW 0.00579 0.016 47.900 -0.00061 1.700 ESE 0.00210 0.028 46.400 0.00137 24hrs
21 0.900 E 0.00539 0.011 48.300 -0.00029 1.900 W 0.00190 0.039 46.800 0.02354 24hrs
22 0.900 E 0.00364 0.012 50.800 -0.00053 2.100 SW 0.00184 0.033 47.100 0.00801 24hrs
23 1.000 SSE 0.00266 0.013 48.100 -0.00068 1.300 SW 0.00288 0.032 47.400 0.00124 24hrs
24 1.200 W 0.00688 0.011 47.500 -0.00038 0.800 WSW 0.00338 0.040 47.600 0.00126 24hrs
25 1.400 SSE 0.00670 0.011 46.600 -0.00026 1.200 E 0.00324 0.023 47.900 0.00132 24hrs
26 1.200 SE 0.00520 0.014 51.400 -0.00008 0.700 ESE 0.00403 0.027 47.900 0.00128 24hrs
27 1.200 ESE 0.00495 0.038 46.500 0.00055 0.800 SE 0.00218 0.018 47.200 0.00142 24hrs
28 0.900 SE 0.00256 0.018 46.500 0.00140 0.900 E 0.00106 0.019 49.200 0.00133 24hrs
29 0.900 SE 0.00181 0.025 46.600 0.00118 1.300 SE 0.00252 0.038 50.400 0.00135 24hrs
30 1.200 ESE 0.00493 0.030 47.100 -0.00102 0.700 SE 0.00537 0.025 46.600 0.00134 24hrs
31 1.200 SE 0.00208 0.038 47.600 -0.00120 0.500 ESE 0.00283 0.030 47.100 0.00132 24hrs A
Interim Target 1-0.443ppm; Interim Target 2 - 0.0177 ppm; Guideline Value - 0.0071 ppm (Interim Targets are provided in recognition of the need for a staged approach to achieving the recommended guidelines) (Averaging Time: 24 hrs) B
1-hour averaging period os recommended in the WHO Ambient Air Quality Guidelines as well as in the US National Ambient Air Quality Standards (NAAQS) C Interim Target 1-0.1500 ppm; Interim Target 2-0.1000 ppm; Interim Target 3-0.0750 ppm; Guideline Value-0.0500 ppm (Averaging Time 24hrs)
D Daytime Target (9am-6pm) - 75 dB; Morning (5am-9am) and Evening (6pm-10pm) Target - 70dB; Nightime Target (10pm-5am) - 65dB
E Daytime and nighttime standards in industrial and commercial areas
BLDL - Below the Lowest Detectable Level; NR - No reading; NA - Not Applicable

4
Table 4. AAQMS Results (August 2013)
Monthly Ambient Air Quality Monitoring Report (August '13)
Date
Station 1 Station 2
Averaging
Time
Item
Wind Speed Wind Direction NO2 PM 10 NOISE SO2 Wind Speed Wind Direction NO2 PM 10 NOISE SO2
m/s - PPM mg/m3 dB PPM m/s - PPM mg/m3 dB PPM
DENR STD NA NA 0.080 0.150 75.000D 0.070 NA NA 0.080 0.150 75.000
D 0.070 NA
WORLD BANK STD NA NA 0.0987B 0.150
C 70.000
E 0.0443
A NA NA 0.0987
B 0.150
C 70.000
E 0.0443
A NA
Min 0.400 NA 0.002 0.008 46.900 -0.004 0.800 NA 0.001 0.018 47.700 0.001 24hrs
Max 1.500 NA 0.007 0.032 59.400 0.000 3.300 NA 0.007 0.098 66.325 0.002 24hrs
Average 1.016 NA 0.004 0.021 51.145 -0.002 2.045 NA 0.003 0.037 53.805 0.002 month
1 1.200 ESE 0.00313 0.014 56.700 -0.00118 1.700 E 0.00276 0.027 59.877 0.00132 24hrs
2 0.900 SE 0.00650 0.023 59.400 -0.00094 2.300 E 0.00379 0.023 58.953 0.00136 24hrs
3 0.500 NW 0.00428 0.018 59.200 -0.00071 1.600 E 0.00218 0.019 58.619 0.00135 24hrs
4 0.400 SE 0.00265 0.019 59.300 -0.00078 2.500 E 0.00205 0.039 58.754 0.00142 24hrs
5 0.600 W 0.00382 0.020 55.900 -0.00071 1.700 E 0.00226 0.033 60.839 0.00142 24hrs
6 0.900 ESE 0.00439 0.019 48.600 -0.00066 2.100 E 0.00154 0.032 65.667 0.00137 24hrs
7 1.000 NW 0.00515 0.028 49.000 -0.00057 1.600 ESE 0.00248 0.096 64.512 0.00139 24hrs
8 1.200 SW 0.00349 0.032 52.200 -0.00063 1.700 ESE 0.00211 0.098 65.893 0.00146 24hrs
9 1.400 SE 0.00311 0.019 49.800 -0.00056 2.100 SE 0.00175 0.024 66.325 0.00145 24hrs
10 0.900 WNW 0.00316 0.008 48.100 -0.00048 2.300 SE 0.00104 0.063 65.243 0.00143 24hrs
11 0.500 W 0.00211 0.031 46.900 -0.00053 2.100 ESE 0.00128 0.030 62.741 0.00144 24hrs
12 0.600 NW 0.00501 0.010 49.100 -0.00057 3.200 E 0.00733 0.028 63.245 0.00144 24hrs
13 0.800 NNE 0.00315 0.021 51.700 -0.00057 1.800 E 0.00349 0.019 49.200 0.00141 24hrs
14 1.200 N 0.00467 0.026 51.900 -0.00041 2.200 E 0.00364 0.018 48.700 0.00143 24hrs
15 1.000 NE 0.00629 0.019 50.200 -0.00031 2.400 ESE 0.00316 0.027 48.400 0.00143 24hrs
16 1.400 NE 0.00293 0.020 49.900 -0.00123 1.900 ESE 0.00216 0.023 48.000 0.00141 24hrs
17 1.000 N 0.00316 0.022 48.200 -0.00308 1.600 ESE 0.00147 0.019 47.800 0.00197 24hrs
18 0.900 NE 0.00298 0.019 48.900 -0.00310 2.100 ESE 0.00297 0.028 48.000 0.00156 24hrs
19 1.200 NNW 0.00313 0.028 47.800 -0.00322 2.400 ESE 0.00386 0.039 47.800 0.00154 24hrs
20 1.400 WSW 0.00444 0.014 48.500 -0.00351 2.500 ESE 0.00443 0.063 47.900 0.00154 24hrs
21 0.900 NNW 0.00584 0.010 50.600 -0.00336 1.800 ESE 0.00475 0.032 48.000 0.00154 24hrs
22 1.400 NNW 0.00569 0.017 51.000 -0.00328 2.300 E 0.00361 0.021 48.100 0.00156 24hrs
23 1.000 WNW 0.00424 0.030 51.400 -0.00305 2.200 ESE 0.00304 0.025 47.700 0.00162 24hrs
24 1.000 WNW 0.00371 0.031 49.900 -0.00316 3.300 E 0.00313 0.098 47.800 0.00154 24hrs
25 1.000 WSW 0.00200 0.024 50.100 -0.00322 1.400 E 0.00459 0.032 48.200 0.00158 24hrs
26 1.200 SW 0.00260 0.019 50.100 -0.00314 2.600 E 0.00250 0.018 48.100 0.00158 24hrs
27 0.900 SSW 0.00383 0.022 48.600 -0.00292 2.300 E 0.00163 0.019 48.200 0.00173 24hrs
28 1.200 NW 0.00512 0.020 52.400 -0.00257 2.200 ENE 0.00317 0.024 48.000 0.00180 24hrs
29 1.000 SW 0.00481 0.014 48.200 -0.00227 1.200 E 0.00187 0.027 48.200 0.00185 24hrs
30 1.400 SSE 0.00472 0.017 50.200 -0.00233 0.800 ENE 0.00123 0.030 49.500 0.00193 24hrs
31 1.500 WNW 0.00532 0.031 51.700 -0.00212 1.500 E 0.00343 0.085 49.700 0.00194 - A
Interim Target 1-0.443ppm; Interim Target 2 - 0.0177 ppm; Guideline Value - 0.0071 ppm (Interim Targets are provided in recognition of the need for a staged approach to achieving the recommended guidelines) (Averaging Time: 24 hrs) B
1-hour averaging period os recommended in the WHO Ambient Air Quality Guidelines as well as in the US National Ambient Air Quality Standards (NAAQS) C Interim Target 1-0.1500 ppm; Interim Target 2-0.1000 ppm; Interim Target 3-0.0750 ppm; Guideline Value-0.0500 ppm (Averaging Time 24hrs)
D Daytime Target (9am-6pm) - 75 dB; Morning (5am-9am) and Evening (6pm-10pm) Target - 70dB; Nightime Target (10pm-5am) - 65dB
E Daytime and nighttime standards in industrial and commercial areas
BLDL - Below the Lowest Detectable Level; NR - No reading; NA - Not Applicable
5
Table 5. AAQMS Results (September 2013)
Monthly Ambient Air Quality Monitoring Report (September '13)
Date
Station 1 Station 2
Averaging
Time
Item
Wind Speed Wind Direction NO2 PM 10 NOISE SO2 Wind Speed Wind Direction NO2 PM 10 NOISE SO2
m/s - PPM mg/m3 dB PPM m/s - PPM mg/m3 dB PPM
DENR STD NA NA 0.080 0.150 75.000D 0.070 NA NA 0.080 0.150 75.000
D 0.070 NA
WORLD BANK STD NA NA 0.0987B 0.150
C 70.000
E 0.0443
A NA NA 0.0987
B 0.150
C 70.000
E 0.0443
A NA
Min 0.900 NA 0.002 0.006 40.366 -0.002 0.400 NA 0.001 0.007 45.700 0.001 24hrs
Max 1.800 NA 0.008 0.092 52.400 -0.001 2.400 NA 0.005 0.052 48.900 0.025 24hrs
Average 1.103 NA 0.004 0.027 47.068 -0.002 1.410 NA 0.003 0.024 47.595 0.003 month
1 1.000 NW 0.00349 0.018 44.192 -0.00217 0.400 ESE 0.00145 0.026 48.200 0.00194 24hrs
2 1.400 NE 0.00488 0.012 47.219 -0.00199 0.500 ESE 0.00173 0.052 45.900 0.00194 24hrs
3 1.200 NNE 0.00520 0.020 46.582 -0.00208 0.800 ESE 0.00293 0.032 46.500 0.00193 24hrs
4 0.900 W 0.00549 0.033 48.433 -0.00198 0.900 ESE 0.00404 0.026 47.200 0.00141 24hrs
5 1.800 NW 0.00729 0.021 41.466 -0.00211 0.600 ESE 0.00231 0.027 47.300 0.00151 24hrs
6 1.000 NNE 0.00791 0.006 40.776 -0.00196 1.300 E 0.00177 0.036 46.900 0.00147 24hrs
7 1.200 N 0.00581 0.023 40.867 -0.00193 0.500 ESE 0.00112 0.027 46.300 0.00147 24hrs
8 1.400 NE 0.00466 0.018 40.561 -0.00204 0.700 ESE 0.00193 0.037 46.400 0.02514 24hrs
9 0.900 NE 0.00426 0.017 41.513 -0.00170 1.900 SSE 0.00302 0.038 47.900 0.01596 24hrs
10 1.000 N 0.00512 0.011 40.366 -0.00190 1.100 SSE 0.00226 0.041 48.100 0.00137 24hrs
11 1.000 NE 0.00346 0.029 50.763 -0.00205 0.900 SW 0.00261 0.046 48.200 0.00144 24hrs
12 1.000 NNW 0.00625 0.042 48.709 -0.00204 0.800 ESE 0.00229 0.030 48.500 0.00146 24hrs
13 0.900 WSW 0.00465 0.028 49.915 -0.00159 1.000 W 0.00196 0.016 48.700 0.00149 24hrs
14 0.900 NW 0.00315 0.031 43.342 -0.00188 1.600 SW 0.00230 0.018 48.600 0.00146 24hrs
15 0.900 NNW 0.00425 0.071 46.741 -0.00199 1.500 SW 0.00118 0.008 48.700 0.00147 24hrs
16 1.000 NNW 0.00512 0.024 44.662 -0.00215 1.600 WSW 0.00109 0.015 46.500 0.00153 24hrs
17 1.200 WNW 0.00356 0.027 49.844 -0.00212 1.800 E 0.00253 0.016 48.900 0.00158 24hrs
18 1.300 WNW 0.00426 0.013 45.853 -0.00196 2.200 ESE 0.00290 0.014 45.700 0.00164 24hrs
19 1.200 WSW 0.00458 0.020 48.644 -0.00194 1.700 SE 0.00212 0.017 46.800 0.00169 24hrs
20 1.000 SW 0.00399 0.038 47.800 -0.00188 1.900 E 0.00329 0.014 47.100 0.00159 24hrs
21 1.000 SSW 0.00346 0.018 48.500 -0.00201 1.600 SE 0.00506 0.012 47.400 0.00165 24hrs
22 1.000 SW 0.00532 0.025 50.600 -0.00204 1.800 SE 0.00383 0.007 47.600 0.00171 24hrs
23 0.900 SW 0.00299 0.030 51.000 -0.00146 2.100 ESE 0.00428 0.010 47.900 0.00157 24hrs
24 0.900 N 0.00346 0.018 51.400 -0.00124 1.600 E 0.00175 0.012 47.900 0.00156 24hrs
25 1.000 WSW 0.00315 0.025 49.900 -0.00126 1.800 E 0.00403 0.029 48.100 0.00160 24hrs
26 1.400 SW 0.00412 0.027 50.100 -0.00124 1.900 E 0.00524 0.017 48.200 0.00159 24hrs
27 1.400 S 0.00458 0.030 50.100 -0.00162 1.700 E 0.00419 0.026 48.000 0.00160 24hrs
28 1.400 SSE 0.00237 0.017 48.600 -0.00125 2.100 ESE 0.00236 0.032 48.100 0.00167 24hrs
29 1.000 WNW 0.00359 0.025 52.400 -0.00109 2.400 ESE 0.00208 0.030 48.600 0.00165 24hrs
30 0.900 W 0.00379 0.092 51.200 -0.00108 1.600 SE 0.00270 0.015 47.650 0.00171 24hrs A
Interim Target 1-0.443ppm; Interim Target 2 - 0.0177 ppm; Guideline Value - 0.0071 ppm (Interim Targets are provided in recognition of the need for a staged approach to achieving the recommended guidelines) (Averaging Time: 24 hrs) B
1-hour averaging period os recommended in the WHO Ambient Air Quality Guidelines as well as in the US National Ambient Air Quality Standards (NAAQS) C Interim Target 1-0.1500 ppm; Interim Target 2-0.1000 ppm; Interim Target 3-0.0750 ppm; Guideline Value-0.0500 ppm (Averaging Time 24hrs)
D Daytime Target (9am-6pm) - 75 dB; Morning (5am-9am) and Evening (6pm-10pm) Target - 70dB; Nightime Target (10pm-5am) - 65dB
E
Daytime and nighttime standards in industrial and commercial areas
BLDL - Below the Lowest Detectable Level; NR - No reading; NA - Not Applicable

FIGURE 1. AAQMS Station 1 location and Win
6
Station 1
Aliganga’s Residence
(Jul. – Sep. 2013)
SPC POWER PLANT
COMPLEX
KSP
Wind Rose
KSPC CEBU POWER PLANT

FIGURE 2. AAQMS Station 2 location and W
SPC POWER P
COMPLEX
7
d Wind Rose
ER PLANT
PLEX
Station 2
Berdan’s Open Ground
(Jul. - Sep. 2013)
KSPC CEBU POWER PLANT

FIGURE 3.
FIGURE
8
E 3. SO2 and NO2 Values at AAQMS 1&2
URE 4. PM-10 Values at AAQMS 1&2

3.1.2. Manual Ambient Air and N
Ambient air monitoring results at
DENR and World Bank standar
measured for dust content in am
plant are coal dust and ash parti
compared to the standards. Tabl
Sampling location maps are prov
graphs from the construction peri
3.1.3. Air Emissions
As one of its environmental featu
System (CEMS) for each Unit. T
analyzers are functioning well. Pa
Oxide emissions (SOx), Nitrogen O
corrected at 6% O2, indicate that
These favorable results show tha
and 8 summarize the daily results
the trending graphs of the results
no reading for all parameters
maintenance, while Unit 2 CEMS
to gas analyzer IR source malfun
replacement and target date of co
FIG
9
nd Noise Monitoring
ts at the four stations indicated in Table 2 have not exceeded
dards, all parameters are compliant. For this period, t
ambient air is PM-10 since the potential dusts generated
articles. Based on the data, the ambient air quality on dus
Table 6 summarizes the data for the 1-hour sampling in the
provided in Attachment 1 while the manual ambient air q
period up to the present are provided in Attachment 2.
eatures, the power plant has a real-time Continuous Emissio
t. These CEMS Units are subjected for yearly RATA to co
Parameters for testing include the Total Suspended Particl
en Oxide emissions (NOx), and the Carbon Monoxide emissio
hat emission levels are well within the national and World B
that the emissions control of the power plant is highly effi
sults from July to September 2013 of both units while Figure
sults in comparison to the standards. As seen in Table 7, Un
ers from September 21-30, since unit is on shutdown
MS has no reading for SOx, NOx and CO from August 3-Sep
function. Maintenance department have already ordere
of completion of repairs is by first week of October.
FIGURE 5. Noise Values at AAQMS 1&2
eded the reference
d, the parameter
from the power
dust is acceptable
the third quarter.
ir quality trending
issions Monitoring
confirm that the
rticles (TSP), Sulfur
ission (CO). Results,
ld Bank standards.
efficient. Tables 7
gures 6 to 7 shows
7, Unit 1 CEMS has
wn for scheduled
September 30 due
dered spare IR for

10
Table 6. AMBIENT AIR QUALITY (1-Hour Grab-Testing, 2013 September)
Station/Location
PARAMETERS
Observations during sampling PM-10,
µg/Ncm
SO2,
µg/Ncm
NO2,
µg/Ncm
Noise,
dB
CO,
ppm
Station 3 Brgy. Tangke, Basketball
Court
29 <7 2 71 0
� Time: (09/11/13)/ 02:31-03:31PM
� Wind Direction: NE to SW
� Sampler is inside the basketball court approximately 300m from
KSPC; 5 men playing basketball. Raining at time of sampling.
Source of noise on-going water drilling.
Station 4 Along National Road cor.,
Alinganga St., Near Perimeter Fence
of SPC Power Corp.
53 <7 12 68 0
� Time: (09/11/13)/ 01:25-02:25PM
� Wind Direction: NE to SW
� Approximately 150m from KSPC; near National Road (busy
street); The area is partly dusty due to a number of vehicles
passing; 20 motorcycles, 3 tricycles, 13 private vehicles and 14
bicycles with side cars.
Station 5 Near Pier Area inside the
power plant site
36 <7 3 67 0
� Time: (09/11/13)/ 09:30-10:30AM
� Wind Direction: NE to SW
� Sampling location is near the pier area fence; at close proximity
from conveyor and plant boilers. The ambient set-up is in a
grassy area.
Station 6 In front of Mangkikis
Chapel, Sitio Mangkikis
15 <7 38 69 0
� Time: (09/11/13)/ 04:00-05:00PM
� Wind Direction: NE to SW
� Sampling area is near residences; open area; the place/spot has
many trees and plants; few private vehicles pass in the area
Minimum Detection Limit 1 0.01 0.01 --- 0
DENR Standard (DAO 14, 1-hr) 200 340 260 75
(NPCC - D) 30
World Bank Standard (IFC, 1-hr) ---A 212
B 200
C 70 35
B
A Internationally-accepted standards use an averaging time of 24-hours
B US-EPA National Ambient Air Quality Standards (NAAQS)
C WHO Ambient Air Quality Guidelines

11
Table 7. Unit 1 CEMS Results (Jul-Sep 2013)
Quarterly Air Emission Report (Q3, Unit 1) (- indicates unit shutdown)
TSP (DENR-EMB: 150 mg/Nm3, World Bank: 50 mg/Nm
3) NOx (DENR-EMB: 487 ppm, World Bank : 252 ppm) CO (DENR-EMB: 400 mg/Nm3) SO2 (DENR-EMB: 245 ppm, World Bank: 319 ppm)
DATE JULY AUGUST SEPTEMBER JULY AUGUST SEPTEMBER JULY AUGUST SEPTEMBER JULY AUGUST SEPTEMBER
Unit mg/Nm3 ton/day mg/Nm
3 ton/day mg/Nm
3 ton/day ppm ton/day ppm ton/day ppm ton/day ppm ton/day ppm ton/day ppm ton/day ppm ton/day ppm ton/day ppm ton/day
Ave 7.687 0.046 7.479 0.044 11.707 0.072 107.778 107.778 104.639 0.798 106.154 0.860 12.769 0.061 41.030 0.188 76.031 0.379 92.816 1.021 125.177 1.310 160.646 1.812
Max 12.020 0.078 11.340 0.068 15.910 0.103 116.330 116.330 128.410 1.232 121.100 1.176 25.340 0.115 273.050 1.272 347.140 1.779 184.720 2.152 190.510 2.419 222.980 2.428
Min 4.600 0.019 1.330 0.003 7.830 0.044 98.980 98.980 34.000 0.124 73.630 0.511 10.300 0.022 4.020 0.009 10.050 0.049 66.660 0.326 64.130 0.433 105.220 1.018
1 6.750 0.045 6.340 0.038 9.420 0.050 109.050 109.050 109.280 0.877 96.790 0.676 13.740 0.073 11.080 0.054 153.330 0.652 83.950 1.026 86.300 0.964 222.980 2.168
2 8.450 0.051 6.560 0.040 11.750 0.070 108.830 108.830 111.340 0.898 110.760 0.855 13.400 0.065 10.980 0.054 21.550 0.101 81.350 0.908 92.170 1.035 176.330 1.895
3 8.140 0.049 5.880 0.032 10.090 0.059 106.010 106.010 104.410 0.771 117.450 0.906 12.840 0.062 11.230 0.050 10.980 0.052 90.540 1.001 85.360 0.878 146.910 1.579
4 8.260 0.049 4.555 0.018 11.280 0.065 105.700 105.700 69.205 0.392 108.540 0.820 12.550 0.061 7.625 0.026 12.040 0.055 86.920 0.959 85.225 0.672 154.260 1.622
5 7.950 0.048 - - 9.160 0.047 113.250 113.250 - - 73.630 0.511 12.070 0.060 - - 11.990 0.051 75.580 0.854 - - 105.220 1.018
6 8.010 0.049 - - 7.830 0.044 116.330 116.330 - - 97.760 0.764 11.470 0.057 - - 23.840 0.113 74.190 0.841 - - 118.720 1.292
7 7.960 0.048 3.180 0.013 11.060 0.069 116.250 116.250 82.780 0.539 109.450 0.901 11.130 0.054 19.560 0.078 10.050 0.050 80.010 0.887 104.520 0.948 156.740 1.796
8 8.140 0.060 10.070 0.063 11.420 0.069 114.350 114.350 107.580 0.895 109.410 0.870 11.380 0.068 10.690 0.054 10.260 0.050 94.380 1.286 177.040 2.050 155.270 1.719
9 8.190 0.066 9.540 0.059 11.420 0.069 110.820 110.820 103.420 0.847 108.050 0.864 11.270 0.073 12.430 0.062 10.060 0.049 81.350 1.212 154.950 1.766 166.420 1.852
10 8.580 0.063 9.400 0.066 13.390 0.087 111.005 111.005 102.170 0.943 110.930 0.943 11.735 0.070 12.390 0.070 10.720 0.055 103.185 1.405 188.130 2.419 160.060 1.894
11 8.970 0.060 6.850 0.036 15.910 0.103 111.190 111.190 104.030 0.738 111.600 0.938 12.200 0.066 13.350 0.058 10.760 0.055 125.020 1.542 152.750 1.509 144.380 1.689
12 7.070 0.044 8.490 0.049 13.770 0.079 99.370 99.370 108.080 0.828 113.180 0.847 12.520 0.064 12.830 0.060 35.550 0.162 184.720 2.152 174.760 1.863 136.100 1.419
13 6.190 0.038 9.610 0.058 11.610 0.075 99.890 99.890 109.860 0.882 91.090 0.767 18.660 0.093 12.460 0.061 347.140 1.779 157.380 1.798 170.840 1.909 207.190 2.428
14 4.680 0.025 10.180 0.063 12.510 0.080 98.980 98.980 111.150 0.916 100.590 0.845 16.680 0.072 13.090 0.066 229.610 1.174 139.320 1.384 190.510 2.185 163.940 1.917
15 4.600 0.025 9.960 0.062 12.020 0.069 103.150 103.150 110.050 0.903 117.690 0.876 12.620 0.055 13.010 0.065 11.070 0.050 109.450 1.088 176.670 2.019 155.470 1.611
16 5.620 0.031 10.490 0.066 12.890 0.095 101.920 101.920 111.850 0.930 121.100 1.176 25.340 0.115 14.460 0.073 10.680 0.063 121.530 1.265 177.830 2.059 139.950 1.893
17 6.320 0.037 11.340 0.068 12.560 0.091 109.280 109.280 113.300 0.896 111.680 1.058 12.390 0.060 14.800 0.071 76.780 0.443 89.570 0.985 161.630 1.779 174.870 2.306
18 6.840 0.043 6.350 0.033 11.410 0.073 108.510 108.510 109.200 0.752 108.530 0.910 12.030 0.060 12.690 0.053 168.010 0.857 82.810 0.952 131.420 1.261 188.090 2.195
19 7.660 0.048 7.100 0.039 13.200 0.086 108.380 108.380 116.910 0.851 103.450 0.882 11.050 0.056 11.700 0.052 198.190 1.028 80.970 0.943 91.820 0.931 179.380 2.128
20 6.910 0.041 8.160 0.045 11.440 0.067 104.000 104.000 113.700 0.826 101.400 0.786 11.670 0.056 19.320 0.085 158.000 0.745 83.160 0.913 134.790 1.363 - -
21 5.820 0.019 7.620 0.043 - - 99.200 99.200 119.530 0.884 - - 11.930 0.032 12.420 0.056 - - 79.540 0.489 98.900 1.019 - -
22 9.100 0.021 9.180 0.055 - - 106.610 106.610 128.410 1.027 - - 11.770 0.022 10.800 0.053 - - 77.640 0.326 87.680 0.977 - -
23 9.830 0.043 7.480 0.045 - - 108.370 108.370 116.820 0.931 - - 11.650 0.041 29.480 0.143 - - 81.230 0.661 117.480 1.304 - -
24 9.660 0.061 7.730 0.059 - - 110.650 110.650 121.100 1.232 - - 11.060 0.056 10.210 0.063 - - 77.310 0.898 87.960 1.246 - -
25 10.570 0.068 4.050 0.020 - - 112.050 112.050 110.470 0.739 - - 10.760 0.056 11.530 0.047 - - 75.800 0.895 86.990 0.811 - -
26 12.020 0.078 6.180 0.033 - - 112.750 112.750 108.670 0.780 - - 10.570 0.055 212.040 0.927 - - 73.030 0.866 79.110 0.791 - -
27 10.450 0.063 7.150 0.040 - - 109.710 109.710 114.870 0.865 - - 10.300 0.050 185.290 0.849 - - 66.660 0.746 81.410 0.853 - -
28 6.170 0.033 7.510 0.043 - - 104.970 104.970 101.420 0.776 - - 10.470 0.046 273.050 1.272 - - 71.136 0.709 64.130 0.683 - -
29 6.500 0.036 7.610 0.043 - - 106.500 106.500 101.590 0.769 - - 10.400 0.047 257.170 1.185 - - 74.440 0.770 67.930 0.716 - -
30 6.830 0.039 8.460 0.051 - - 107.570 107.570 115.840 0.934 - - 10.410 0.048 10.910 0.054 - - 83.640 0.887 149.830 1.682 - -
31 6.050 0.035 10.250 0.057 - - 106.480 106.480 107.630 0.783 - - 19.780 0.093 14.570 0.065 - - 91.480 0.988 171.540 1.737 - -

12
Table 8. Unit 2 CEMS Results (Jul-Sep 2013)
Quarterly Air Emission Report (Q3, Unit 2) (NR-No reading, Gas analyzer malfunction)
TSP (DENR-EMB: 150 mg/Nm3, World Bank: 50 mg/Nm
3) NOx (DENR-EMB: 487 ppm, World Bank : 252 ppm) CO (DENR-EMB: 400 ppm) SO2 (DENR-EMB: 245 ppm, World Bank: 319 ppm)
DATE JULY AUGUST SEPTEMBER JULY AUGUST SEPTEMBER JULY AUGUST SEPTEMBER JULY AUGUST SEPTEMBER
Unit mg/Nm3 ton/day mg/Nm
3 ton/day mg/Nm
3 ton/day ppm ton/day ppm ton/day ppm ton/day ppm ton/day ppm ton/day ppm ton/day ppm ton/day ppm ton/day ppm ton/day
Ave 0.749 0.006 0.796 0.005 0.769 0.005 92.789 0.981 34.495 0.372 #DIV/0! #DIV/0! 11.669 0.074 2.680 0.018 #DIV/0! #DIV/0! 59.816 0.877 13.605 0.204 #DIV/0! #DIV/0!
Max 0.800 0.007 0.820 0.007 0.820 0.007 138.630 1.495 62.100 0.672 0.000 0.000 33.750 0.211 5.100 0.034 0.000 0.000 143.720 2.188 24.050 0.362 0.000 0.000
Min 0.690 0.005 0.750 0.002 0.000 0.002 0.490 0.005 6.890 0.072 0.000 0.000 6.800 0.041 0.260 0.002 0.000 0.000 9.040 0.137 3.160 0.046 0.000 0.000
1 0.750 0.006 0.760 0.006 0.80 0.006 114.880 1.222 6.890 0.072 NR NR 7.880 0.051 0.260 0.002 NR NR 70.050 1.037 3.160 0.046 NR NR
2 0.740 0.006 0.750 0.006 0.80 0.006 127.110 1.371 62.100 0.672 NR NR 8.440 0.055 5.100 0.034 NR NR 67.960 1.021 24.050 0.362 NR NR
3 0.750 0.006 0.780 0.006 0.80 0.006 120.460 1.278 NR NR NR NR 7.590 0.049 NR NR NR NR 68.610 1.014 NR NR NR NR
4 0.750 0.006 0.775 0.006 0.80 0.007 123.240 1.312 NR NR NR NR 8.190 0.053 NR NR NR NR 73.680 1.092 NR NR NR NR
5 0.740 0.006 0.770 0.007 0.80 0.007 131.280 1.423 NR NR NR NR 7.320 0.048 NR NR NR NR 60.740 0.917 NR NR NR NR
6 0.730 0.006 0.770 0.007 0.81 0.007 133.450 1.447 NR NR NR NR 7.480 0.049 NR NR NR NR 55.040 0.831 NR NR NR NR
7 0.730 0.006 0.770 0.007 0.82 0.007 134.320 1.389 NR NR NR NR 8.360 0.053 NR NR NR NR 63.330 0.912 NR NR NR NR
8 0.730 0.006 0.800 0.006 0.82 0.006 138.630 1.495 NR NR NR NR 8.710 0.057 NR NR NR NR 80.060 1.202 NR NR NR NR
9 0.730 0.006 0.800 0.006 0.81 0.006 130.610 1.346 NR NR NR NR 6.800 0.043 NR NR NR NR 60.580 0.869 NR NR NR NR
10 0.710 0.006 0.800 0.006 0.81 0.006 125.180 1.363 NR NR NR NR 7.365 0.049 NR NR NR NR 83.785 1.270 NR NR NR NR
11 0.690 0.006 0.800 0.006 0.81 0.006 119.750 1.373 NR NR NR NR 7.930 0.055 NR NR NR NR 106.990 1.708 NR NR NR NR
12 0.690 0.006 0.810 0.006 0.82 0.006 112.010 1.225 NR NR NR NR 9.360 0.062 NR NR NR NR 143.720 2.188 NR NR NR NR
13 0.690 0.005 0.810 0.006 0.81 0.006 114.440 1.217 NR NR NR NR 9.970 0.065 NR NR NR NR 132.250 1.958 NR NR NR NR
14 0.700 0.005 0.800 0.006 0.81 0.006 113.170 1.104 NR NR NR NR 10.740 0.064 NR NR NR NR 124.180 1.687 NR NR NR NR
15 0.700 0.005 0.800 0.006 0.81 0.006 94.390 0.920 NR NR NR NR 6.880 0.041 NR NR NR NR 68.220 0.926 NR NR NR NR
16 0.730 0.005 0.800 0.007 0.80 0.007 106.480 1.074 NR NR NR NR 12.770 0.078 NR NR NR NR 84.710 1.189 NR NR NR NR
17 0.770 0.006 0.800 0.006 0.80 0.006 120.800 1.260 NR NR NR NR 8.760 0.056 NR NR NR NR 59.050 0.858 NR NR NR NR
18 0.780 0.006 0.810 0.003 0.81 0.003 117.750 1.274 NR NR NR NR 8.190 0.054 NR NR NR NR 46.380 0.699 NR NR NR NR
19 0.760 0.006 0.810 0.002 0.81 0.002 120.840 1.316 NR NR NR NR 7.860 0.052 NR NR NR NR 45.800 0.695 NR NR NR NR
20 0.750 0.006 0.810 0.003 0.81 0.003 120.160 1.260 NR NR NR NR 8.290 0.053 NR NR NR NR 50.350 0.735 NR NR NR NR
21 0.750 0.005 0.810 0.002 0.82 0.002 116.310 1.119 NR NR NR NR 9.240 0.054 NR NR NR NR 47.240 0.633 NR NR NR NR
22 0.750 0.006 0.810 0.003 0.81 0.003 117.990 1.275 NR NR NR NR 8.980 0.059 NR NR NR NR 24.380 0.367 NR NR NR NR
23 0.770 0.006 0.810 0.004 0.81 0.004 88.150 0.940 NR NR NR NR 6.820 0.044 NR NR NR NR 31.780 0.472 NR NR NR NR
24 0.770 0.006 0.800 0.004 0.60 0.003 82.280 0.869 NR NR NR NR 11.180 0.072 NR NR NR NR 38.890 0.572 NR NR NR NR
25 0.800 0.006 0.800 0.003 0.79 0.003 10.690 0.116 NR NR NR NR 22.540 0.149 NR NR NR NR 9.660 0.146 NR NR NR NR
26 0.800 0.007 0.800 0.002 0.79 0.002 1.150 0.013 NR NR NR NR 20.220 0.134 NR NR NR NR 9.040 0.137 NR NR NR NR
27 0.800 0.006 0.800 0.003 0.77 0.003 0.500 0.005 NR NR NR NR 19.080 0.120 NR NR NR NR 11.340 0.163 NR NR NR NR
28 0.800 0.005 0.820 0.002 0.76 0.002 0.490 0.005 NR NR NR NR 17.970 0.102 NR NR NR NR 16.850 0.219 NR NR NR NR
29 0.800 0.006 0.800 0.002 0.76 0.002 0.490 0.005 NR NR NR NR 17.610 0.101 NR NR NR NR 22.090 0.291 NR NR NR NR
30 0.780 0.006 0.800 0.004 0.76 0.004 11.930 0.120 NR NR NR NR 25.470 0.156 NR NR NR NR 47.030 0.661 NR NR NR NR
31 0.770 0.006 0.800 0.003 - 0.003 27.530 0.282 NR NR NR NR 33.750 0.211 NR NR NR NR 50.500 0.721 NR NR NR NR

13
FIGURE 6.

14
FIGURE 7.

15
3.2. RA 9275: WATER ENVIRONMENT
3.2.1. Groundwater
Although, KSPC does not make use of groundwater for industrial and domestic operation , still
groundwater quality are monitored in compliance with the EIS and to ensure that groundwater being
utilized by the stakeholders are within the standards set according to its use. Table 9 shows the
groundwater monitoring results of the coverage period including that of the previous periods (May 2013
to Sep 2013) while Attachment 2 contains the trending graphs (from the start of monitoring up to the
present period) of the critical parameters with respective DENR standards. Sampling locations are
indicated in Attachment 1. Generally, the monitoring results indicate that groundwater stations tested are
still within acceptable levels but are not recommended for drinking. Though some of the results are not
within the standards, they are all within the background levels and trend of the baseline data from the EIS,
the MMT, and previous monitoring results. It is important to consider however that the power plant does
not withdraw groundwater or discharge effluents to inland surface waters. Thus, any adverse impact to
the community’s groundwater is most likely due to domestic activity and natural earth movement.
The Total Dissolved Solids (TDS) levels are high compared to the standard which could have an effect on
the taste of the ground water but the values are well within the baseline. This is again, as mentioned in
the previous reports, attributable to the natural background of the area. For the chloride levels, all
stations displayed desirable results. As mentioned in the first paragraph, it is highly recommended that
these deep wells be not used for drinking.
3.2.2. Marine Water
It is important to monitor the marine water quality of the nearby sea of the power plant since it is where
the treated water effluent generated from the plant operation are being discharged. Table 10 shows the
marine water monitoring results within the coverage period including that of the previous period (May
2013 to Sep 2013) while Attachment 2 contains the trending graphs of the previous results of critical
parameters with respective DENR standards. Sampling locations are indicated in Attachment 1. Generally,
the monitoring results indicate that there have been no adverse impacts to the receiving marine
environment. Most parameters fall within acceptable standards set by DAO 34 (Water Class SC).
Furthermore, most of the current data falls around the same range to those of the previous period’s
results including that of the MMT Baseline Monitoring Activity.
3.2.3. Water Effluents
Effluents of the power plant are from the sanitary treatment system, which processes all domestic
effluents to acceptable levels before it is discharged to the sea, storm water, and cooling seawater (at a
higher temperature). There are four (4) sanitary treatment systems in the power plant and 2 storm drains
to the sea. Each storm drain discharges effluents from 2 sanitary treatment systems together with the
rain/storm water. On the other hand, cooling water is discharged through the submerged discharge tunnel,
154 m off-shore.
Generally, the effluents of the power plant are within the national and World Bank standards. One
outstanding result would be the high TSS value at the cooling effluent (68 mg/L). The result is more than
the World Bank Standard but lesser than the DENR standard. TSS is quite high since the cooling water used
is seawater. Table 11 summarizes the results of these parameters in comparison to these standards.
3.2.4. Thermal Discharge
According to the standards, the mixing zone border should not experience a temperature increase of more
than 3°C. The baseline temperature shall be that of the ambient seawater while the mixing zone has a
radius of 100 m from the discharge point. The water temperatures were measured in the morning and
afternoon last September 11, 2013 to assess the environmental performance of the power plant. Table 12
presents the results. Figure 8 shows a map of the submerged discharge area and the sampling points.
Results show that the thermal effluents are within the national and World Bank standards.

16
Table 9. Ground Water Monitoring Results
Groundwater Monitoring (3rd Party Conducted by OMLI)
Parameters
Station/LocationA
PNSDWB
DENR
StandardC
STN 1 STN 2 STN 3 STN 4
21-May 27-Jun 11-Sep 21-May 27-Jun 11-Sep 21-May 27-Jun 11-Sep 21-May 27-Jun 11-Sep
pH 7.5 7.2 7.2 7.5 7.0 6.9 7.3 7.0 7.2 7.6 7.3 7.10 6.5-8.5 6.5-8.5
DO, mg/L 6.0 6.0 6.0 7.0 6.0 7.0 5.0 6.0 6.0 2.0 3.0 6.0 N/A 5D
BOD5, mg/L 2.0 <1.0 <1.0 <1.0 5.0 2.0 3.0 <1.0 1.0 1.0 <1 1.0 N/A 1
COD, mg/L 30.0 <9.0 20 10.0 20.0 10.0 10.0 <9 30.0 <9.0 <9.0 10.0 N/A N/A
TSS, mg/L <1.0 <1.0 1 <1.0 <1.0 3.0 <1.0 <1.0 <1.0 <1 4.0 1.0 N/A 25
Oil & Grease,
mg/L <1.0 2.0 <1.0 <1 1.0 <1.0 1.0 1.0 <1.0 1.0 <1.0 <1.0 N/A N/A
TDS, mg/L 712.0 675.0 840.0 704.0 680.0 652.0 948.0 650.0 688.0 908.0 828.0 794.0 500 500E
Total Coliform,
MPN/100mL <1.1 1.10 <1.1 1.10 2.60 <1.1 <1.1 <1.1 <1.1 2.60 1.10 <1.10 <1.1 50
Cr+6
,mg/L 0.003 <0.002 <0.002 0.005 <0.002 <0.002 0.005 <0.002 <0.002 <0.002 0.002 <0.002 0.05 0.05E
CN, mg/L <0.05 <0.05 <0.05 <0.05 <0.05 <0.05 <0.05 <0.05 <0.05 <0.05 <0.05 <0.05 0.07 0.05
Pb, mg/L <0.01 <0.01 <0.01 <0.01 <0.01 <0.01 <0.01 <0.01 <0.01 <0.01 <0.01 <0.01 0.01 0.05E
Hg, mg/L <0.0001 <0.0001 <0.0001 <0.0001 <0.0001 <0.0001 <0.0001 <0.0001 <0.0001 <0.0001 <0.0001 <0.0001 0.001 0.002E
NO3-N, mg/L 3.68 3.10 3.75 3.17 2.43 1.14 3.08 3.07 3.69 <0.01 <0.01 1.14 50 1
Cl, mg/L 117.00 127.10 113.20 84.20 97.60 89.6 266.7 127.1 122.60 154.40 163.40 89.60 250 250
ASTN 1 - Deepwell Brgy. Upper Colon, STN 2 - Deepwell Brgy. Tangke, STN 3 - Deepwell Brgy. Lower Colon, STN 4 - Deepwell Brgy. North Poblacion
BPhilippine National Standards for Drinking Water (2007)
CDAO 90-34 Revised Water Usage and Classification/Water Quality Criteria
DMinimum Standard
EDoes not apply if natural background is higher in concentration

17
Table 10. Marine Water Monitoring Results
Marine Water Monitoring (3rd Party Conducted by OMLI)
Parameters
Station/LocationA
DENR
StandardB
STN 1 STN 2 STN 3 STN 4 STN 5
21-May 27-Jun 11-Sep 21-May 27-Jun 11-Sep 21-May 27-Jun 11-Sep 21-May 27-Jun 11-Sep 21-May 27-Jun 11-Sep
pH 8.4 8.3 8.3 8.5 8.5 8.3 8.5 8.6 8.3 8.5 8.7 8.3 8.5 8.6 8.3 6.0-8.5
DO, mg/L 4.0 8.0 6.0 6.0 8.0 7.0 5.0 8.0 6.0 3.0 7.0 7.0 5.0 8.0 6.0 5C
BOD5, mg/L <1.0 5.0 2.0 4.0 5.0 1.0 3.0 4.0 1.0 1.0 4.0 2.0 2.0 3.0 1.0 7(10)D
TSS, mg/L 52 27 42.0 42 46 54 36 26 47 23 40 29 44 42 40 G
Oil & Grease,
mg/L 1.0 1.0 <1.0 1.0 1.0 <1.0 1.0 1.0 <1.0 <1.0 <1.0 <1.0 <1.0 1.0 <1.1 3
Total Coliform,
MPN/100mL <1.1 2.6 1.1 <1.1 <1.1 <1.1 <1.1 8.0 2.6 <1.1 <1.1 <1.1 <1.1 <1.1 <1.1 5000
Cr+6
,mg/L 0.003 <0.002 <0.002 0.003 <0.002 <0.002 0.003 <0.002 <0.002 <0.002 <0.002 <0.002 <0.002 0.007 <0.002 0.1E
Turbidity, NTU 0.0 3.3 0.0 0.9 0.2 0.0 0.0 0.1 0.20 0.2 0.1 0.0 0.0 0.2 0.0 N/A
CN, mg/L <0.05 <0.05 <0.05 <0.05 <0.05 <0.05 <0.05 <0.05 <0.05 <0.05 <0.05 <0.05 <0.05 <0.05 <0.05 0.05
SO4, mg/L 2568 2424 3077 2477 2507 2331 2563 2519 2999 2531 2535 2865 2580 2474 2832 N/A
Pb, mg/L <0.01 <0.01 <0.01 <0.01 <0.01 <0.01 <0.01 <0.01 <0.01 <0.01 <0.01 <0.01 <0.01 <0.01 <0.01 0.05E
Hg, mg/L <0.0001 <0.0001 <0.0001 <0.0001 <0.0001 <0.0001 <0.0001 <0.0001 <0.0001 <0.0001 <0.0001 <0.0001 <0.0001 <0.0001 <0.0001 0.002E
ASTN 1 - Front of City Hall Plaza, STN 2 - Front of KSPC Site, STN 3 - Front of Barangay North Poblacion, STN 4 - Front of Colon Elementary School (Lower Kayam), STN 5 - Front of Tuyan Elementary School
(Barangay Tuyan) BDAO 90-34 Revised Water Usage and Classification/Water Quality Criteria
GNot more than 30 mg/L increase of the baseline value:
CMinimum Standard STN 1 baseline - 7 mg/L
DValue in parentheses indicates a maximum standard STN 2 baseline - 442 mg/L
EDoes not apply if natural background is higher in concentration STN 3 baseline - 13 mg/L
FStill within the natural background values STN 4 baseline - 22 mg/L
STN 5 baseline - 15 mg/L

18
Table 11. Water Effluents Monitoring Results
Water Effluents Monitoring (3rd Party Conducted by Fast Laboratories Inc.)
Parameters Cooling Water Effluent Stormdrain 1A (near LCF) Stormdrain 2
A (near WTS)
DENR
StandardB
World
Bank
Standards
(IFC) MONTH July August September
3rd
Party July August September
3rd
Party July August September
3rd
Party (Class SD)
pH 7.79 7.60 7.99 7.70 8.38 7.90 7.95 8.20 7.80 7.65 7.76 7.10 5.0 ~ 9.0 5.0 ~ 9.0
Turbidity
(NTU) 0.36 0.53 0.24 0.32 >7500 >7500 4.44 2.00 1.05 1.45 0.25 0.27 - -
Conductivity
(µS) 481.50 49.30 48.91
J 725.20 2.33 1.57
J 666.40 66.05 69.81
J - -
TSS (mg/L) 2.00 2.00 2.00 46.00 12.00 7.00 9.00 2.00 4.00 3.00 13.00 68.00I 150 50
COD (ppm
O₂) 121.30 85.12 72.35 742.00 446.88 353.25 191.52 104.00 85.12 12.77 114.91 922.00 <200 ppm <200 ppm
BOD5 (mg/L) G G G 3.00 G G G 19.00 G G G 2.00 100 N/A
Oil & Grease
(mg/L) H H H <1 H H H 2.00 H H H 17.00 10 10
Free
Chlorine
(ppm Cl₂)
0.0 0.03 0.040 0.025 0.15 0.10 0.035 0.01 0.09 0.07 0.0 0.0 - <0.20 ppm
A where treated effluent from the sanitary treatment system is discharged together with rain water and backwash seawater; samples are collected from a catch basin.
B DAO 90-35 Revised Effluent Regulations of 1990
G No in-house laboratory testing was made due to the unavailability of the instrument to be used for testing.
H No in-house laboratory testing was made since all oily wastewater is treated in the plant's wastewater treatment facility.
I High TSS may be due to accumulated silt in the discharge tunnel. There are no solid additives added to the cooling water.
J No 3rd party analysis done.

19
Table 12. Seawater Temperature Data (September 11, 2013)
Points Time Sampling Location
(Temp. in °C)
Baseline Point
(Temp. in °C)
Temperature
Increase (°C) Residual Chlorine
Plant Load
(% Capacity)
M1 10:37 AM
05:24 PM
30.80
30.30 - - -
Unit 1-100%,
Unit 2-100%
M2 10:38 AM
05:25 PM
30.80
30.30
30.80
30.30
0.0
0.0 0.01
Unit 1-100%,
Unit 2-100%
M3 10:39 AM
05:26 PM
30.80
30.60
30.80
30.30
0.0
0.30 0.01
Unit 1-100%,
Unit 2-100%
M4 10:40 AM
05:27 PM
30.80
30.60
30.80
30.30
0.0
0.30 0.01
Unit 1-100%,
Unit 2-100%
M5 10:41 AM
05:28 PM
30.90
30.50
30.80
30.30
0.10
0.20 0.01
Unit 1-100%,
Unit 2-100%
DENR Standard Temp. Inc. in °C (DAO 90-35) 3.0
World Bank Standard (IFC) Based on the EIA of the project (DENR Standard)
FIGURE 8. High Tide Sea Water Temperature Testing Points
100-m radius
Current direction is SW.
M1 (Ambient Temp.)
M2
M3
M4
M5
Discharge Point

20
3.3. RA 6969: CONTROLLED CHEMICALS & HAZARDOUS WASTE
3.3.1 CCO Report
The plant is using mercury substances in the laboratory for the analysis of water effluents and water to be
used in the boiler. Table 13 shows the summary of chemical purchases within the period from Jul-Sep 13.
Table13: Summary of Chemical Purchases and Usage
No. Chemical
Name Trade Name CAS No.
Balance
from
Previous
Report
Quantity
Purchased Supplier
Quantity
Used
Remaining
Quantity
1 Mercuric
Sulfate
Mercuric
Sulfate 7439-97-6 250 g
No purchased within the
reporting period 100 g 150 g
2 Mercuric (II)
Thiocyanate
Mercuric (II)
Thiocyanate 7439-97-6 - 100 g
Yana
Chemodities 0.30 g 99.70 g
3.3.2 Hazardous Waste
Hazardous waste in the plant site includes waste oils, busted fluorescent lamps, and contaminated
containers. Within the coverage period, no wastes were disposed. These are currently stored in the
designated storage areas in the site. Contaminated containers were also cleaned and re-used as trash cans
and containers of prepared chemicals. As soon as these wastes are ready for disposal to DENR-accredited
treaters, KSPC will accordingly inform DENR-EMB through this report. Generated industrial wastewater is
being treated in the centralized wastewater treatment facility. Water produced are being reused for dust
suppression and firefighting. Mixed chemical wastes with mercury are placed in a tightly closed bottle which
is stored in the laboratory area for future treatment. Table 14 below shows the summary of generated and
stored hazardous wastes within the reporting period.
Table 14: Summary of Hazardous Waste Generated/Treated
HW No. HW Class HW
Nature
HW
Cataloguing
Remaining HW from
Previous Report HW Generated
Quantity Unit Quantity Unit
Waste Water Other Alkali Wastes Liquid C399 --- --- 20,920 m3
Used Oil Waste Oil Liquid I101 11,100 L 1,200 L
Contaminated
Container
Containers previously
containing oil
Solid
(Plastic) J201
20.75 kg --- kg
Containers previously
containing toxic
chemicals
2 drums
(200L) 5
drums
(200L)
24 carboys
(20L) -
carboys
(20L)
51 pcs
(250mL-2L) 10
pcs (250mL-
2L)
Solid
(Glass) 63
pcs
(250mL-2L) 9
pcs (250mL-
2L)
Busted Lamps
Mercury and Mercury
Compounds
Solid
D407
60 kg --- kg
Mixed Chemical
Wastes with
Mercury
Liquid 1000 mL 500 mL

21
3.3.3 Naalad Riprapping Update
Currently, the project status is still in the acquisition of permits and licenses phase, particularly
that from DPWH. The overall project consists of the following activities:
1. Excavation and dredging
2. Rip rapping
3. Opening of new river route
4. Backfilling
Backfilling of excavated earth material shall be the last phase of the project. Ash shall not be used
as backfilling material and shall not be disturbed from its current state right now. Figure 9 below
shows the existing and planned rerouting and riprapping, while Figure 10-11 shows the site
condition and the works started for the rerouting.
Original ash landfill area
New river route
To be backfilled with
earth material
New riprap area
FIGURE 9. Naalad River Rerouting Plan

22
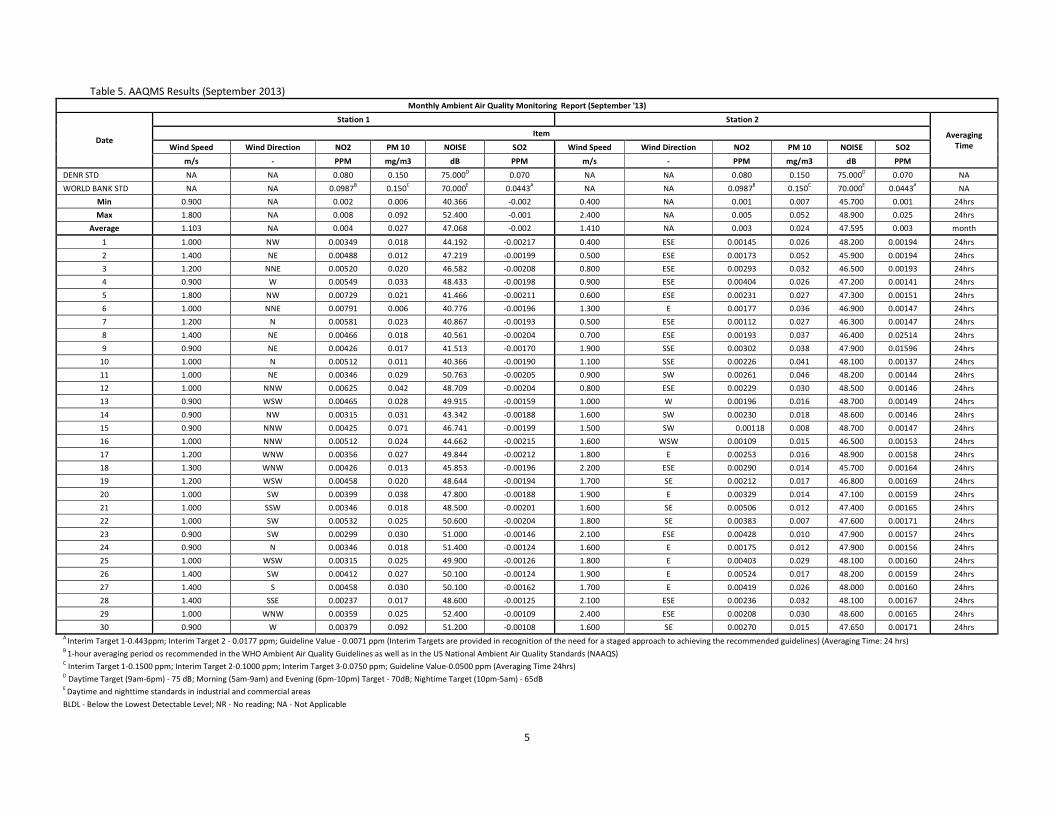
3.4. RA 9003: SOLID WASTE
Solid wastes in the power plant are categorized as domestic/office and industrial. For the coverage period, a
total of 11,735 kg of domestic/office solid wastes were disposed of or collected by the Naga City LGU.
Industrial solid wastes in the power plant are either coal ash or sludge. Sludge from the wastewater
treatment plant was tested using the Toxicity Characteristic Leaching Procedure (TCLP) to determine
whether it is hazardous or not. Previous results indicate that these are within the limits for industrial waste.
Because of its very low generation rate (below 50 MT/year), KSPC will be disposing and mixing its sludge
with the coal at very low percentages depending on the production rate.
The power plant’s coal ash (fly ash; bed ash will be tested in the next quarter) was also tested using TCLP
and results also classified it as solid industrial waste (See Attachment 3). All the coal ash generated was
recycled by CEMEX (APO Cement) in their cement manufacturing business. Ash generation and disposal
activities for this period are more stable due to the very low ash quality of the coal fired compared to the
previous period. Table 15 summarizes the industrial and solid waste quantities generated and the respective
disposal methods.
FIGURE 10. Site Status
FIGURE 11. Site Status
23
Table 15. Summary of Industrial and Solid Waste Generation and Disposal
QUARTERLY SOLID WASTE GENERATION & DISPOSAL (3rd QUARTER 2013)
Coal Ash (Tons) Wastewater Treatment
Sludge (Tons)
Domestic & Office Solid
Waste (kg)
Stored on-site
(Previous) 0.00 0.59 0.00
Generation 9,432.31 1.29 11,735.00
Stored on-site
(Current)A
0.00 1.88 0.00
Disposal 9,432.31 0.00 11,735.00
TCLP Test Result Passed (Industrial Waste-
See Attachment 3) - -
Disposal Method RMC & Cement Recycling No Disposal as of
reporting period
Through local LGU
garbage collection
IV. CONCLUSION
Based on the environmental monitoring results for the period of July to September 2013, the 2x100 MW Cebu
Power Plant Project has not caused any undesirable effect to the nearby surroundings. This is in line with the
company’s goal for sustainable development. The availability of recycling options for the coal ash is a positive
sign that more quantities if not all of the ash can be disposed of through sustainable means. The findings in
this report will be discussed in KSPC’s Multi-Partite Monitoring Team (MMT) and due recommendations will be
made. Certificates of analyses are in Attachment 3 while Attachment 4 contains the rest of the sampling
pictures.