Embed Size (px)
Citation preview

FHWA-NJ-2014-009
Environmental Management System for Transportation Maintenance Operations
FINAL REPORT
5/27/2014
Submitted by
Taha F. Marhaba, Ph.D., P.E. and Lazar N. Spasovic, Ph.D.
Department of Civil and Environmental Engineering
New Jersey Institute of Technology
University Heights, Newark, NJ 07102-1982
Monica Mazurek, Ph.D.
Department of Civil and Environmental Engineering
Center for Advanced Infrastructure and Transportation
Rutgers University
Piscataway, NJ 08854
NJDOT Research Project Manager
Stefanie Potapa
In cooperation with
New Jersey Department of Transportation
Bureau of Research
and
U.S. Department of Transportation
Federal Highway Administration

D I S C L AI M E R S T A T E M E N T
The contents of this report reflect the views of the author(s) who is (are) responsible for
the facts and the accuracy of the data presented herein. The contents do not
necessarily reflect the official views or policies of the New Jersey Department of
Transportation or the Federal Highway Administration. This report does not constitute a
standard, specification, or regulation.

i
TECHNICAL REPORT STANDARD TITLE PAGE
1. Report No.
FHWA-NJ-2014-009
2. Government Accession No. 3. Recipient’s Catalog No.
4. Title and Subtitle
Environmental Management System for Transportation Maintenance Operations
5. Report Date
5/27/2014
6. Performing Organization Code
7. Author(s)
Taha Marhaba, Ph.D., P.E., Branislav Dimitrijevic, Ashish Bargaonkar, Ph.D.,
Lazar N. Spasovic, Ph.D., Monica Mazurek, Ph.D.
8. Performing Organization Report No.
9. Performing Organization Name and Address
New Jersey Institute of Technology
Department of Civil and Environmental Engineering
University Heights
Newark, NJ 07102-1982
10. Work Unit No.
11. Contract or Grant No.
NJDOT 2014 – 009
12. Sponsoring Agency Name and Address
N.J. Department of Transportation
1035 Parkway Avenue
P.O. Box 600
Trenton, NJ 08625-0600
Federal Highway Administration
U.S. Department of Transportation
Washington, D.C.
13. Type of Report and Period Covered
Final Report
Sept. 2009 – Sept. 2012
14. Sponsoring Agency Code
15. Supplementary Notes
16. Abstract
The New Jersey's Global Warming Response Act, enacted in 2007, mandates reductions in greenhouse gas (GHG)
emissions to 1990 levels by 2020, approximately a 20 percent reduction, followed by a further reduction of emissions to
80% below 2006 levels by 2050. The legislation required several State agencies, including the Department of
Transportation (NJDOT) to assess the GHG emissions related to their operations, and develop methods to meet and
exceed the 2020 target reductions. To achieve this goal, NJDOT focused on assessing and monitoring the GHG emissions
of both its Capital Program and Operations. The purpose of this research project is to support this effort by focusing on
effective monitoring of GHG emissions produced by Operations Maintenance activities and identifying solutions for their
reduction. The project evaluates emissions generated by vehicles, equipment, and materials used in maintenance
operations projects by applying the life-cycle analysis approach. The literature review focuses on identifying the sources of
data and methods for evaluating carbon potential of materials mostly used in highway maintenance projects, such as
asphalt, concrete, and steel. The review is further expanded to identify potential methods and strategies that will help
reduce the GHG emissions of highway maintenance projects, focusing primarily on construction processes and aggregate
industry, especially asphalt and bitumen. The emissions generate by vehicles and equipment are also analyzed, along with
the strategies for reducing the related carbon emissions through introduction of more fuel-efficient or hybrid engines and
alternative fuels. Based on the methods developed in this study and the collected data, a decision support software tool is
developed to guide NJDOT in monitoring and assessing alternatives for reduction of GHG emissions related to Operations
Maintenance. Both the analysis framework and the decision support tool will provide means for quantifying the effects of
different strategies for reducing GHG emission, and will ultimately be useful tools in developing Department-wide GHG
emission reduction strategies.
17. Key Words
Greenhouse gas emissions, transportation maintenance
operations
18. Distribution Statement
No Restrictions.
19. Security Classification (of this report)
Unclassified
20. Security Classification (of this page)
Unclassified
21. No of Pages
57
22. Price
Form DOT F 1700.7 (8-69)
ii
A C K N O W L E D G E M E N T S
The research team would like to thank the following individuals for their valuable
contribution towards successful completion of this project.
Andres Roda, CAIT
Manvi Saran, Research Assistant, Department of Civil & Environmental Engineering,
NJIT
The research team would like to extend their gratitude to Richard Shaw, Nancy
Ciaruffoli, Stefanie Potapa, Paul Thomas, and Camille Crichton Sumners of the New
Jersey Department of Transportation, for their continuous support throughout the
project, and their help with identifying and collecting the data relevant for this study.
Their insight, guidance, and commitment to project objectives were invaluable and were
critical to the success of the project.

iii
T A B L E O F C O N T E N T S
BACKGROUND 7
OBJECTIVES 11
RESEARCH APPROACH 12
SUMMARY OF THE LITERATURE REVIEW 14
Estimation of the GHG Emissions of Materials and Industrial Processes 15
Models for Estimation of Transportation-Related Greenhouse Gas Emissions 19
Fuel Catalyst to Reduce GHG Emissions 25
Conclusions of the Literature Survey 25
ASSESSMENT OF OPERATIONS ENVIRONMENTAL MANAGEMENT NEEDS 26
Strategies for Reducing GHG Emissions 29
ENVIRONMENTAL MANAGEMENT SYSTEM MODEL 31
Design Logic 31
Model Methodology 34
PROJECT DELIVERABLES 40
Software for EMS 40
User’s Manual 40
Staff Training Sessions 40
Data Tables 40

iv
CONCLUSIONS AND RECOMMENDATIONS 41
REFERENCES 42
BIBLIOGRAPHY 45
APPENDICES - EXAMPLES OF GHG EMISSIONS CALCULATIONS AND
SUPPORTING MATERIAL 47
A. Sample calculations - Materials 47
B. Sample calculations – Vehicles’ GHG Emissions 48
C. Supporting material for GHG Emissions Calculations 51
Density Estimation - Physics Factbook 51
Measuring a Pavement Job 52
Engineering Unit Conversions 52
D. Sample Input File 54

v
L I S T O F T AB L E S
TABLE 1: An Excerpt from the Inventory of Carbon & Energy (ICE) Database ............. 16
TABLE 2: Strategies to reduce greenhouse gas emissions .......................................... 30
TABLE 3: Concrete Density Table from the Physics Factbook ..................................... 51

vi
L I S T O F F I G U R E S
Figure 1. GHG Emissions by Sector; New Jersey, 2004 Millions of Metric Tons
CO2eq .............................................................................................................. 8
Figure 2. New Jersey Greenhouse Gas Emissions (Estimated 1990, Projected
2020 Business as usual (BAU); 2020 LIMIT, and Proposed Reductions) ........ 9
Figure 3. Research approach ........................................................................................ 12
Figure 4. Contribution of different sectors towards world greenhouse gas
emissions ....................................................................................................... 28
Figure 5. Sources of GHG Emissions in Highway Maintenance Projects ...................... 29
Figure 6. Analysis Approach ......................................................................................... 32
Figure 7. Model input ..................................................................................................... 35
Figure 8. Calculation of GHG emissions for finished materials ..................................... 36
Figure 9. Calculation of GHG emissions for finished materials – choice of
alternatives ..................................................................................................... 38
Figure 10. Calculation of GHG emissions for finished materials – option to
view/change mixing ratio ................................................................................ 39
Figure 11. Total area of a surface to be paved divided into geometric shapes ............. 52

7
BACKGROUND
New Jersey has been at the forefront of the efforts to reverse the climate change and
other negative environmental effects of greenhouse gas (GHG) emissions. New Jersey
has taken a leadership role in the Regional Greenhouse Gas Initiative (RGGI), the first
mandatory market based program to cap the GHG emissions levels at the 2009 rate
through 2014 and then reduce the rate by 10 percent in 2018. In 2007, the New Jersey
legislature went a step further and enacted the Global Warming Response Act (GWRA),
calling for more significant reductions of greenhouse gas (GHG) emissions. The law
requires the state agencies to reduce the GHG emissions to 1990 levels by 2020, and
achieve a further reduction of 80 percent below 2006 levels by 2050. The law mandates
that all State agencies take steps in assessing the baseline emission levels, and to
evaluate and implement the methods for achieving and exceeding the mandated 2020
targets.
Pursuant to the GWRA mandate, the New Jersey Department of Environmental
Protection (NJDEP) published in 2009 a Recommendation Report1 that establishes New
Jersey’s current GHG inventory and outlines strategies and methods for GHG emission
reductions by sector. According to the report, transportation and energy are the largest
contributors to New Jersey GHG emissions. Transportation alone accounts for
approximately 35% of gross emissions in the state. The report identified the New Jersey
Energy Master Plan (EMP), the New Jersey Low Emission Vehicle (LEV) Program, and
the Regional Greenhouse Gas Initiative (RGGI) program as the core measures for
meeting its statewide 2020 GHG limits. Consequently, the recently developed New
Jersey Energy Master Plan (EMP) identifies the need for a 20% reduction of energy by
government facilities through the pursuit of cost-effective alternative fuels and
increasing the supply of reliable alternative energy. Currently, alternative fuels account
for less than one percent of New Jersey’s total energy consumption (Energy Information
Administration, 2009), so there seems to be great potential for reducing carbon
emissions by increasing the share of alternative fuels. Figure 1 shows GHG emissions
by sector for the state of New Jersey.
The 2009 report identifies several strategies for reducing GHG emissions attributed to
transportation, including specific initiatives, such as reducing reliance on cars and
minimizing the increase in the overall vehicle-miles traveled on the state’s roadways,
1 Meeting New Jersey’s 2020 Greenhouse Gas Limit: New Jersey’s Global Warming
Response Act Recommendations Report, New Jersey Department of Environmental
Protection, December 2009. Accessed on 2/11/2012 at
http://www.nj.gov/globalwarming/home/gwra_report.html

8
increasing the use of fuel-efficient vehicles and equipment, promoting the use of
alternative fuels, and developing a regional low carbon fuel standards (LCFS). It also
outlines the planning strategies, including establishment of a carbon footprint standard
for transportation projects, effective implementation of the State Development and
Redevelopment Plan (SDRP), and incorporating growth management and GHG
reduction goals into the regional plans and programs developed by NJDOT, NJDEP,
and all three of New Jersey’s Metropolitan Organizations (MPO).
Figure 1. GHG Emissions by Sector; New Jersey, 2004 Millions of Metric Tons CO2eq2
In order for NJDOT to accomplish the goals set forth by the GWRA, it is critical to
assess and monitor the department’s carbon footprint, and then identify and pursue
effective strategies for reducing the GHG emissions. In 2009 the NJDOT Bureau of
Research held a statewide Sustainable Transportation Forum to highlight the need for a
better understanding of the department’s carbon footprint and initiate a discussion about
the strategies that can help meet the emission reduction goals. Nearly 100
transportation managers attended the forum and discussed the environmental impacts
of transportation, current research on carbon emissions, the importance of land use
2 New Jersey GHG Inventory and Reference Case Projections 1990-2020 November 2008, http://www.nj.gov/globalwarming/home/documents/pdf/njgwra_final_report_dec2009.pdf
49
34
20
29
2
6 4
-7
Transportation (~35% of grossemissions)
Electric Generation (~24% ofgross emissions)
Industrial(~14% of grossemissions)
Residential/Commercial (~20%of gross emissions)
Other(~1% of gross emissions)
Waste Managment(~4% ofgross emissions)
Non-CO2 Highly WarmingGases (~3% of gross emissions)
Terrestrial Carbon Seqestration(Offset ~5% of gross emissions)

9
planning in an effective environmental protection, and received updates on ecological
research and air quality issues that affect transportation. The audience was also
surveyed on future required actions and strategies for minimizing these negative
impacts. The participants identified the following strategies: use smarter design
standards (58%), recycle or reduce energy consumption (28%), and promote
communications/training of state employees (14%) on environmental issues. Also, the
majority identified a need for NJDOT to upgrade roadway materials and maintenance
work to support sustainable transportation. Figure 2 presents the projected GHG
emissions for the state of New Jersey for business as usual (BAU) against the statewide
limit for 2020.
Figure 2. New Jersey Greenhouse Gas Emissions (Estimated 1990, Projected 2020
Business as usual (BAU); 2020 LIMIT, and Proposed Reductions)3
3 (Based on data in “New Jersey Greenhouse Gas Inventory and Reference Case Projections 1990-2020”, November 2008. This document is posted on the State’s Global Warming Web page at http://www.nj.gov/globalwarming/)
110
120
130
140
150
160
1985 1990 1995 2000 2005 2010 2015 2020 2025
Mill
ion
of
Me
tric
To
ns
Year
2020 Statewide Limit
Projected 2020 Business as Usual (BAU)
Proposed Reductions
Estimated 1990

10
Quantifying the GHG emissions on a department-wide level is clearly the first step in
assessing the baseline and then goals for GHG emission reduction. Within NJDOT,
Capital Programs, Operations, and Maintenance are the sectors with major
contributions to GHG emissions. In the past, NJDOT was not actively collecting data to
support quantification of emissions related to any of these three sectors; so the main
difficulty in assessing the GHG emission inventory is lack of readily available relevant
data, as well as procedures for data collection and methods for analyzing the data.
An Environmental Management System (EMS) is the accepted tool used by state DOTs
nationwide to monitor the environmental compliance of their capital improvement,
operations, and maintenance functions. These systems are versatile, since they are
linked to existing data and are frequently built as programs to increase compliance
assurance. Other uses of these systems include prevention of environmental risks and
liability violations, track consent orders, and maintaining special projects. They can be
used to track policy statements, define roles and responsibilities of units, identify
environmental requirements, assess methodologies, prevent and control procedures,
follow competency standards, and document control procedures (Venner, et al., 2007).

11
OBJECTIVES
This research project focuses on GHG emissions produced by the Maintenance
Operations sector of NJDOT. The overall goal of this research is to develop methods
and tools for an effective assessment of carbon emissions produced by NJDOT
Maintenance Operations activities, and evaluation of alternatives for reducing these
emissions. The first step in accomplishing this goal is reviewing the current practices
related to maintenance projects. This includes specifications of utilized materials,
equipment, and vehicles, and identifying their contribution to GHG emissions. Once
these contributions are quantified, it is possible to identify methods and strategies for
reducing GHG emissions. The specific research objectives are the following:
1. Assess the impact of Maintenance Operations activities on climate change:
Review the current Maintenance Operations activities, and develop a
methodology for quantifying related GHG emissions.
2. Identify alternatives for reducing GHG emissions related to Maintenance
Operations: Identify actions and strategies for reducing GHG emissions. The
strategies should focus on implementation of alternative materials and
sustainable construction processes, use of alternative fuels, fuel efficient
vehicles, and equipment.
3. Develop a GHG emission modeling tool: Based on the results of the review of
current practice and alternatives for reducing GHG emissions, develop a
software tool that will assist engineers and planners in quantifying GHG
emissions and guide them in selecting the most effective strategies for reducing
these emissions.

12
RESEARCH APPROACH
To achieve the study’s objectives, a research approach is formulated. The approach consists of six steps, as illustrated in Figure 3. The first two objectives - assessing the impact of maintenance operations activities on climate change, and identifying alternatives for reducing GHG emissions related to them requires an extensive literature survey. A variety of sources including journal papers, research articles, reports, inventories, databases, and web resources are identified and studied for their relevance to providing information about GHG emissions due to transportation maintenance operations. A summary of the literature survey with an overview of the most relevant resources is presented separately in the following section.
Figure 3. Research approach
The literature survey yielded two important sources of information: 1. The transportation maintenance activities that are responsible for GHG emissions, and 2. Carbon emission databases to quantify GHG emissions. The 2007 NJDOT specifications list and bid sheets were principle sources of information in identifying maintenance activities contributing towards GHG emissions. The 2007 NJDOT specifications list served as one of the background data tables for the selection of various processes, materials, and activities for any maintenance project under consideration. Once the activities are identified, the next step is to quantify GHG emissions. Several carbon emission databases were referred to for this purpose. Among the databases that are publically available, databases published by the National Renewable Energy Laboratory (NREL),

13
University of Bath, UK (Inventory of Carbon and Energy Database), and EPA (Emission Factors for Greenhouse Gas Inventories) were found to be most relevant to this research and served as principle sources of information for CO2, N2O, NH4, and CO2
equations’ calculations.
A methodology for the calculation of GHG emissions for each material, process, and
activity was developed using information from references mentioned above. All the
activities listed in the 2007 NJDOT specifications list and bid sheets were grouped
under three main categories: materials, equipment, and vehicles. A separate strategy
was adopted for GHG emissions calculation for each of these categories. This served
as the design logic for the environmental management system model. Details of these
strategies, methodology, and logic are presented in a separate section following the
literature review section.
Finally after the model is developed, a user manual was developed to help understand
the functioning of the model and to aid in its use. In addition to this user manual, NJDOT
staff training sessions are planned to train end users to independently run this model.
Progress of this research was reported in quarterly and supplementary reports
throughout the planning, design, and execution phase.

14
SUMMARY OF THE LITERATURE REVIEW
The primary objective of the literature review is to gather relevant information about the state of practice in quantifying GHG emissions, with a specific focus on transportation and construction sectors. To be able to quantify the GHG emissions generated by transportation maintenance projects, one must have reliable information on carbon content of materials applied in pertinent projects, processes of applying or installing the materials, and emissions generated by the machinery and vehicles used in these processes. Thus, the focus of the literature review is on methods for estimating GHG emissions associated with materials and activities related to the infrastructure maintenance projects, as well as vehicles and equipment used in these projects. The types of materials and equipment used in maintenance projects at NJDOT are described in detail in the NJDOT Standard Specifications for Road and Bridge Construction (2007 Edition)4. This document is used as the main reference for identifying the materials and equipment used in the transportation maintenance projects. Besides the research reports, papers, and articles published in national and international publications, the review included a number of greenhouse gas emission models and calculation tools. These include:
US EPA Diesel Emissions Quantifier;
US DOT Clearinghouse for Environment and Climate Change;
Greenroads 2010 Manual;
NCHRP Greenhouse Gas Calculator for State Departments of Transportation
(GreenDOT) Model;
National Energy Modeling System (NEMS);
Energy MARKAL-MACRO;
MiniCAM;
Greenhouse Gases, Regulated Emissions, and Energy Use in Transportation
(GREET); and
Transitional Alternative Fuels and Vehicles (TAFV).
A detailed review of the resources that were found to be the most useful for this project is provided next.
4 http://www.state.nj.us/transportation/eng/specs/2007/Division.shtml (accessed February 12, 2012)

15
Estimation of the GHG Emissions of Materials and Industrial Processes
Estimation of the GHG emissions for various activities and processes for transportation maintenance operations required gathering a wide array of information from multiple sources. Some of the prominent resources included an inventory of GHG emissions databases, current modeling approaches to convert this raw emissions data into specific values generated during maintenance operations, the standardization of this model so that it can be applied to a group of processes or materials together, and other useful techniques that will help estimate best possible numbers for GHG emissions. This section explains, one by one, important references that formed the core of the emission database and modeling methodology in this research. Inventory of Carbon & Energy (ICE) Version 1.6a5
In this report, the authors developed a database which benchmarked and summarized
the embodied energy and carbon for over 200 building materials. Embodied energy is
the total primary energy consumed during the life time of a product, ideally the
boundaries would be set from the extraction of raw materials (including fuels) to the end
of the products lifetime (including energy from manufacturing, transport, energy to
manufacture capital equipment, heating & lighting of factory, etc.), this boundary
condition is known as Cradle to Grave. It has become common practice to specify the
embodied energy as Cradle to Gate, which includes all energy (in primary form) until the
product leaves the factory gate. The final boundary condition is Cradle to Site, which
includes all energy consumed until the product has reached the point of use (i.e.
building site) (Hammond and Jones, 2008). Selection of ICE database for base GHG
emissions corresponds well with the rest of reviewed literature, which also indicates that
life cycle analysis is an appropriate method for estimating GHG emissions of materials
and activities. An excerpt from the database is presented in Table 1.
5 Authors: Hammond, G.P. and C.I. Jones. Published by the University of Bath, UK, 2008. Available at
www.bath.ac.uk/mech-eng/sert/embodied/

16
TABLE 1: An Excerpt from the Inventory of Carbon & Energy (ICE) Database
Materials Embodied Energy & Carbon Coefficients
Comments
EE - MJ/kg
EC - kgCO2/kg
EC - kgCO2e/kg
EE = Embodied Energy, EC = Embodied Carbon, CO2e = carbon dioxide equivalent
Aggregate
General (Gravel or Crushed Rock)
0.083 0.0048 0.0052 Estimated from measured UK industrial fuel consumption data
Asphalt
4% (bitumen) binder content (by mass)
2.86 0.059 0.066 1.68 MJ/kg Feedstock Energy (Included). Modeled from the bitumen binder content. The fuel consumption of asphalt mixing operations was taken from the Mineral Products Association (MPA). It represents typical UK industrial data. Feedstock energy is from the bitumen content.
5% binder content 3.39 0.064 0.071 2.10 MJ/kg Feedstock Energy (Included). Comments from 4% mix also apply.
6% binder content 3.93 0.068 0.076 2.52 MJ/kg Feedstock Energy (Included). Comments from 4% mix also apply.
7% binder content 4.46 0.072 0.081 2.94 MJ/kg Feedstock Energy (Included). Comments from 4% mix also apply.
8% binder content 5.00 0.076 0.086 3.36 MJ/kg Feedstock Energy (Included). Comments from 4% mix also apply.
Bitumen
General 51 0.38 - 0.43 0.43 - 0.55 42 MJ/kg Feedstock Energy (Included). Feedstock assumed to be typical energy content of Bitumen. Carbon dioxide emissions are particularly difficult to estimate, range given.
Greenhouse Gas Mitigation Measures for Transportation Construction,
Maintenance, and Operations Activities6
The purpose of the study was to provide practical information to help transportation
practitioners better understand available greenhouse gas analysis techniques.
The purpose of this research was threefold:
1. Identify available methods to accurately estimate GHG emissions resulting from
transportation activities, projects, and programs;
2. Evaluate these methods in terms of their strengths and limitations, and
applicability for different types of transportation analysis; and
6 Author: Gallivan, F. (ICF International). Published by the American Association of State Transportation and Highway Officials (AASHTO), 2010. Available at http://onlinepubs.trb.org/onlinepubs/nchrp/docs/NCHRP25-25(58)_FR.pdf
17
3. Identify gaps in existing tools, and develop recommendations for new methods or
improvements to existing methods to fill these gaps.
In NCHRP Project 25-25/Task 58 a spreadsheet-based calculator tool was developed,
the Greenhouse Gas Calculator for State Departments of Transportation (GreenDOT).
This tool allows one to estimate CO2 emissions from construction, maintenance, and
operations activities, including emissions from electricity used in roadways, emissions
from on-road vehicle fleets, emissions from off-road equipment, and emissions related
to embodied carbon in materials used in roadway construction.
In addition, the research confirmed that very few DOTs have estimated the impact of
mitigation strategies on CO2 emissions. While DOTs are increasingly exploring
mitigation strategies, most have not conducted an evaluation of these strategies. Other
interested parties including the U.S. Environmental Protection Agency (EPA), the
Federal Highway Administration (FHWA), and private contractors have also produced
very few quantitative evaluations of CO2 reduction strategies that are relevant to DOTs’
operations, maintenance, and construction activities. The study concluded that
additional research is needed to help DOTs estimate the ability of strategies to reduce
activity levels of on-road vehicles and off-road equipment.
Proceedings of the Asphalt's Carbon Footprint Conference7
The purpose of the conference, which took place in March 2009 in London, was to
monitor greenhouse emissions and move towards greater sustainability. In this seminar,
various ways to calculate carbon footprints were analyzed, particularly for within the
asphalt. This seminar was geared mainly towards engineers and technicians in the
highway and airfield pavement industry who are involved in designing, specifying,
producing and laying asphalt. The purpose of the seminar was to provide them with
information and knowledge that would enable them to minimize the adverse effects of
their industry on the environment.
The references provided in the proceeding’s papers are very useful for calculating GHG
emissions of NJDOT pavement resurfacing projects as they mainly utilize asphalt and
bituminous materials. According to 2007 NJDOT specifications, hot asphalt is used for
base, surface, and intermediate courses. These are also used for micro-surfacing and
pavement courses, and bitumen is used for patch course and surfacing. Asphalt is the
major contributor to carbon emissions, thus it is possible to achieve reductions in GHG
emissions by using several techniques addressing this type of material, such as using
7 Society of Chemical Industry, 2009. Available at: http://www.soci.org/News/construction-asphalt-papers

18
warm mix asphalt instead of hot mix, preventing moisture ingress, and lowering the
mixing and storage temperature of bitumen.
In his conference presentation, Dr. Miles Watkins suggested that recent studies showed
that the aggregate industry recorded around 4.94 kg of CO2 per ton of production in
2007, marking a steady decline over the past several years. This was achieved through
the use of good quality heat and power sources and efficient and economic practices.
Asphalt production is a hot process and consumes a great amount of energy. Various
techniques like reduction of moisture content, use of variable speed drives, and
development of bio-derived fuels have been used to improve the process. The
presentation by Murray Reid pointed out that highways in the UK have been sustainably
maintained by using locally available materials, minimizing and recycling the use of
products, and maximizing the use of cold technologies instead of hot ones. Strategies
like cold recycling of existing pavements, use of incinerator bottom ash for cold recycled
foam bitumen base, and recycling thin surfacing at 25% are implemented for well-
maintained highways. In the analysis of the carbon footprint of bitumen, Ian Lancaster
provided data on the total carbon emissions from cradle to grave along with the
processes to reduce the footprint by prevention of moisture ingress and lower mixing
and storage temperatures. Finally, S. Cook discussed the potential of reducing GHG
emissions of moving vehicles utilizing the following raw materials in tires: exposed
natural rubber, vegetable oils, natural fibers and starch. Fuel economy is the key factor
in the reduction of lifecycle energy consumption. Use of ENR-25 has improved the
micro-dispersion of silica resulting in improved wet grip and rolling resistance in tires,
which reduces the carbon footprint of tires.
Miscellaneous Building Materials (Epoxy Resin – Technical Datasheet)8
This reference consists of the description, features and properties of liquid ER2074 –
epoxy resins. It also includes the mixing properties of resin packs and bulk mixing and
additional information about curing, cleaning, storage, health and safety. Epoxy resins
are created by transforming liquid polyether into infusible solids through a special curing
process. In most cases, resins are the result of a chemical reaction between
epichlorohydrin and bisphenol-A. Overall, the production of epoxy resin is part of the
chemical industry that generates over $15 billion annually. Epoxy resins have many
different uses. For example, epoxy resins have been used successfully in grouts,
mortars, adhesives and coatings. High performance epoxy coatings have been used
worldwide for bridge decks, industrial flooring and other concrete coating applications
and epoxy paints for industrial flooring and a wide variety of other concrete and
8 Author: Electrolube, 2005. Published by Electrolube, a division of H. K. Wentworth. Available online at:
http://images.mercateo.com/pdf/Schuricht/ER2074_DATA_DE.pdf

19
industrial maintenance coating. Industrial tooling applications use epoxy resins to make
laminates, castings, fixtures, and molds. In the electronics industry, epoxy resins can be
used to make insulators, transformers, generators, and switchgear9.
Reclaimed Asphalt Pavement (RAP)10
This reference provides information about the impact of temperature variation of asphalt mix on GHG emissions, primarily focusing on application properties of Reclaimed Asphalt Pavement (RAP). In this document the authors demonstrate the viability of semi-warm and cold temperature asphalt as the alternatives to hot mix asphalt. They show that if warm mix asphalt was used instead of hot mix asphalt, the temperature, as well as energy consumption, would be significantly reduced. This would in turn reduce the carbon footprint of paving/resurfacing projects. Usually, the engineered mixture of aggregate, sand, gravel and asphalt cement (bitumen) is produced at an asphalt plant. The ratio is about 95 percent aggregate to 5 percent asphalt cement. Asphalt cement is the binder - the glue that holds the pavement together. At the plant, the aggregates are heated, driving off moisture. About 500 million tons of asphalt pavement material is produced each year in the U.S. using these methods. The warm mix technologies are compaction aids that improve the workability of the mix. By using warm mix or cold mix
asphalt instead of hot mix, the temperature is reduced to about 215 F (reduction of 50
– 100 F). Since asphalt is the major GHG emissions contributor in the Aggregate sector, emitting 20% of the overall Aggregate-related carbon, cold mix technology makes a significant contribution to sustainable and carbon-efficient roads by minimizing the energy consumption and vapor emissions associated with paving and resurfacing the roads.
Models for Estimation of Transportation-Related Greenhouse Gas Emissions
This summary provides an overview of the characteristics and the relevance to this
study of six frequently used models to calculate emissions related to transportation
infrastructure construction and operations. With some modifications or post-processing,
these models can be used for calculating GHG emissions from transportation projects.
They include:
1. Greenhouse Gas Calculator for State Departments of Transportation
(GreenDOT) Model, developed as part of a NCHRP research project;
9 Source: http://www.intota.com/expertconsultant.asp?bioID=708161&perID=721855
10 Author: Breneman, E. J. Published by EJB Paving & Materials Co., 2010. Available online at: http://www.ejbreneman.com/EJB-Paving-and-Materials/Warm-Mix-Asphalt-And-Rap-Turning-Black-To-Green/

20
2. National Energy Modeling System (NEMS), maintained by the Energy
Information Administration (EIA), U.S. Department of Energy;
3. Energy MARKAL-MACRO, maintained by Brookhaven National Laboratory and
U.S. Department of Energy;
4. MiniCAM, maintained by Pacific Northwest National Laboratory;
5. Greenhouse Gases, Regulated Emissions, and Energy Use in Transportation
(GREET), maintained by Argonne National Laboratory; and
6. Transitional Alternative Fuels and Vehicles (TAFV), maintained by Oak Ridge
National Laboratory (ORNL) and the University of Maine.
The use of these models by the state Departments of Transportation often requires
integration of data from many sources. Many of the data sources used to develop these
models reside at the federal agencies that created and/or currently maintain the models.
NCHRP GreenDOT MODEL
NCHRP GreenDOT model is a spreadsheet-based tool that allows users to calculate
carbon dioxide (CO2) emissions from the operations, construction, and maintenance
activities of state Departments of Transportation. The model was developed by ICF
International as part of the NCHRP Project 25-25/Task 58. The model is designed to
calculate emissions on different levels, ranging from a single project to the entire annual
operations of a department, as well as projects or operations stretching over a period
ranging from one day to several years. The are two frequent uses of the tool:
1. Calculation of annual agency-wide emissions,
2. Calculation of emissions related to a specific project, covering a specific period of
performance.
Using this tool, transportation agencies can take into account their greenhouse gas
emissions as part of their day-to-day activities as well as provide information to the
public and other stakeholders in examining the effects of transportation projects over a
longer term.
The GreenDOT model deals with several aspects of operations of a State DOT,
including: electricity, materials, on-road vehicles, non-road equipment and machinery.
Calculations are facilitated in a series of worksheet modules, with each module
calculating the CO2 emission for different aspects of operations. At the end, all

21
emissions are totaled, providing an overall estimate of CO2 emissions on a
departmental level.
Limitations. Although it is very comprehensive, the GreenDOT model does not accept
input based on the specifications of an individual State DOT. The inputs must be
provided for each material, including its conventional components. For example, for
finished material such as a concrete panel, one must input data for virgin aggregate,
cement, steel, and water. It would be more convenient to be able to select from various
specifications that make up a typical project or a typical project-item (as required by
NJDOT) and calculate the corresponding GHG emissions.
National Energy Modeling System (NEMS MODEL)
The NEMS model is used for the Clean Energy Futures (CEF) study. The primary goals
of the CEF study are toproduce credible estimates of the potential for energy efficiency
and clean energy technologies to address the multiple energy and environmental
challenges of the 21st century, describe technology and policy pathways demonstrating
this potential, compare the results of this analysis with other key studies.
The objective of the NEMS is to project the energy, economic, environmental, and
security impacts that various alternative energy policies and assumptions about energy
markets would have on the United States (USDOE EIA 2003a). The Energy Information
Administration (EIA) developed this model to forecast national and regional energy
supply and demand through 2025. The model allows a wide variety of parameters to be
altered to determine their impact on the overall fuel use. Examples include changes in
equipment efficiencies, costs, fuel supplies and economic growth.
The NEMS estimated energy and carbon savings based on the performance analysis of
heaters and heat pumps. Carbon savings for fuel cells and natural gas heat pumps
were based on detailed energy balance calculations for these technologies. As a result,
the model shows that the use of fuel cells or natural gas heat pumps and natural gas
water heaters, instead of the use of oil/gasoline heat pumps during maintenance
operations, would reduce greenhouse gases.
The transportation demand module (TRAN) of the model projects the fuel consumption
of the transportation sector by mode, including the use of renewable and alternative
fuels, subject to delivered prices of energy and macroeconomic variables, including
disposable personal income, gross domestic product, level of imports and exports,
industrial output, new car and light truck sales, and population.

22
Limitations. The NEMS model is designed for an analysis on a census region and
census division level. Therefore, extrapolation and interpolation are needed to develop
estimates on a state level. Local- or county-level forecasts are not applicable in the
model. In addition, the size of the entire NEMS model is very large and detailed,
requiring over 10 to 15 megabytes (MB) of storage just for the "restart file," which
contains the starting values for the model each year. A "standalone" model run, which
consists of running only one module and keeping the others at reference case levels,
would require 100 MB of storage space. Although NEMS can be installed on an
individual personal computer (PC), the storage requirements are substantial.
MARKAL-MACRO Model
The MARKAL-MACRO Model at DOE is an integration of two models: MARKAL and MACRO. MARKAL is the "bottom-up" technological model of energy and the environment, which includes depletable and renewable natural resources, processing of energy resources, and end-use technologies to meet the projected energy service demands in all sectors. The model forecasts emissions sources and levels for carbon emissions and any user-specified pollutants and wastes. The value of carbon rights (marginal cost of emissions) is one of the important outputs of the model. Outputs are solved in five-year intervals through 2050. As far as modes, the model covers passenger cars, light trucks, heavy trucks, buses, airplanes, shipping, maintenance operations, passenger rail, and freight rail.
Environmental Impact. MARKAL calculates the total emissions of different pollutants
by considering the average emissions coefficients of each technology and total fossil
fuels consumption. It is therefore possible to estimate the environmental impact of each
optimized scenario, and to assess the environmental compatibility of the model choices.
If the analyzed scenarios are not environmentally constrained, it is possible to evaluate
air quality improvement due to a better use of resources.
Limitations. The MARKAL-MACRO model has been very effective in forecasting
carbon emissions, but there are some limitations to the model. While it can provide an
alternative and complimentary approach in longer-term analysis (e.g., projection of
renewable fuel penetration and reduction of CO2 emissions), the model does not cover
as much detail in all sectors as the NEMS model. The MARKAL-MACRO Model uses a
simple approach to forecast energy service demands based on economic indicators
such as housing stocks, commercial floor space, industrial production index, and VMT.
Modeling at the individual equipment level would be difficult and would require off-line
analysis combined with aggregate implementation in MARKAL-MACRO. Individual
sector modeling is relatively aggregate and may also require similar off-line analysis.

23
MiniCAM MODEL
The MiniCAM Model, maintained by the Pacific Northwest National Laboratory (PNNL),
forecasts CO2 and other GHG emissions, and it estimates the impacts on GHG
atmospheric concentrations, climate, and the environment. Although the model is a top-
down agriculture-energy-economy model, it contains bottom-up assumptions about end-
use energy efficiency. MiniCAM Model projections are made through 2100 and in 15-
year increments.
MiniCAM is comprised of three separate models: the Edmonds-Reilly-Barns Model
(ERB), the Agriculture Land Use Model (AGLU), and the Model for the Assessment of
GHG Induced Climate Change (MAGICC). ERB represents the
energy/economy/emissions system, including supply and demand of energy, the energy
balance, GHG emissions, and long-term trends in economic output. The AGLU
simulates global land-use change as it influences the production of composite crops,
animal products, and forest products, and tracks GHG emissions associated with land
use. The transportation system coverage includes automobiles, light trucks, buses, rail,
air, and motorcycles for passenger modes; and trucks, rail, air, ship, pipeline, and
motorcycles for freight modes. Seven major energy sources are modeled: oil, gas, coal,
biomass, resource-constrained renewables, nuclear, and solar. The MiniCAM is a long-
term, partial-equilibrium model of the energy, agriculture, and climate system. The
model can produce an end-to-end analysis of energy supply and demand, emissions of
greenhouse gases and local air pollutants, as well as mitigation costs. It contains an
emissions model that considers energy as well as changes in land use, as well as the
full range of greenhouse gases. The MiniCAM is used for modeling over the long term,
and can model a wide range of technologies, fuels, and energy carriers to supply end-
use energy demands.
Limitations. The main limitation of this model is that the modeling of individual
equipment and technology use and purchasing policies requires off-line analysis, whose
results would then need to be aggregated and “plugged into” the MiniCAM. The model’s
functionality is focused on the national level and does not extend to the regional or state
level. Due to the combination of three models within MiniCAM, the complexity of running
the model may require specialized knowledge of the operations.
GREET MODEL
Sponsored by the U.S. Department of Energy's Office of Energy Efficiency and
Renewable Energy (EERE), Argonne has developed a full life-cycle model called
GREET (Greenhouse gases, Regulated Emissions, and Energy use in Transportation).

24
It allows researchers and analysts to evaluate various vehicle and fuel combinations on
a full fuel-cycle/vehicle-cycle basis. The GREET model is designed to serve as an
analytical tool for use by researchers and practitioners in estimating fuel-cycle energy
use and emissions associated with alternative transportation fuels and advanced
vehicle technologies. This tool provides full fuel-cycle emissions analysis from wells to
wheels, which represents emissions from all phases of production, distribution, and use
of transportation fuels. GREET is an excellent model to determine individual vehicle
emissions and would be valuable in assisting evaluation of new transportation fuels and
advanced vehicle technologies. GREET Model calculates consumption of total energy
(from both non-renewable and renewable sources), fossil fuels (petroleum, natural gas,
and coal together), petroleum, coal and natural gas. EPA has incorporated GREET into
their air MOVES Model.
Limitations. GREET is relevant only to light-duty vehicles; however, this does not
preclude it from being used for other vehicle types in the future. GREET does not
include a vehicle choice model to forecast what people might purchase based on
consumer preferences, but GREET output (total fuel-cycle emissions factors) can be
used with future vehicle technology projections to get a more complete picture of their
environmental impacts.
TAFV MODEL
The Transitional Alternative Fuels and Vehicle (TAFV) Model represents economic
decisions among auto manufacturers, vehicle purchasers, and fuel suppliers, including
distribution to end-users. The model simulates decisions during a transition from current
fuels to alternative fuels and traditional vehicles to advanced technology vehicles.
Limited availability of alternative fuels, including refueling infrastructure, and availability
of alternative fuel vehicle technologies are interdependent. TAFV tracks GHG emissions
from fuel production and vehicles using GREET-based emissions factors. TAFV
contains a model that predicts choice of alternative fuel and alternative vehicle
technologies for light-duty motor vehicles. The nested multinomial logit mathematical
framework is used to estimate vehicle choice among technologies and fuel type
combinations based on consumer preferences and vehicle attributes. Vehicle choice is
dependent on prices, fuel availability, and the diversity of vehicle offerings (all
endogenous) as well as luggage space, refueling time, vehicle performance, and cargo
space (all exogenous parameters). Alternative fuel vehicles have three costs to vehicle
manufacturers: capital costs, variable costs, and costs associated with diverse vehicle
offerings. The model has a limited application in this study as it is focusing on only on
the light-duty vehicles.

25
Fuel Catalyst to Reduce GHG Emissions
Based on a suggestion by NJDOT, the team looked at a fuel catalyst developed by
Quantum Fire, Inc., and some other industries. Fuel catalyst is an additive that when
mixed with fuel in any vehicles, enables complete combustion of the fuel. This improves
the number of miles/gallon the vehicle will produce leading to lesser fuel consumption.
After careful consideration and preliminary investigation, the team decided that real-
time/experimental data would be required to calculate exact savings on GHG emissions
related to the use of fuel catalysts. Several factors are likely to contribute to these
calculations. First, complete combustion will cause more carbon-dioxide generation, so
that needs to be taken into account. It is presumed that this extra carbon-dioxide will be
compensated by the increased miles per gallon and also reduction in some of the other
GHG emissions that would have been produced due to in-complete combustion in the
absence of fuel catalyst. All in all, a conclusion cannot be made without some real data
related to usage of usage of fuel catalyst. Fuel catalyst is only one of several innovative
things that can be incorporated into the model to make it a comprehensive tool to
access all future scenarios to evaluate GHG emission reduction strategies.
Conclusions of the Literature Survey
The review of the state of practice largely confirms that very few DOTs have estimated
the impact of mitigation strategies on CO2 and/or other GHG emissions. While DOTs
are increasingly exploring mitigation strategies, most have not conducted a detailed
evaluation of current GHG emission inventories. Other stakeholders, including the U.S.
Environmental Protection Agency (EPA), the Federal Highway Administration (FHWA),
and private contractors, have also produced very few quantitative evaluations of CO2
reduction strategies that are relevant to DOTs’ operations, maintenance, and
construction activities. It is clear that additional research is needed to help DOTs
estimate the effectiveness of alternative strategies for reducing GHG emissions, such
as the use of alternative materials, processes, vehicles and non-road equipment and
machinery.
Reducing GHG emissions is very important for making any project greener. This can be
achieved by various means: using of new/alternative materials that are more recyclable
or have a smaller lifecycle footprint, establishing in-situ recycling and reuse of materials
and equipment, modifying the composition of different mixes of materials, and changing
minor and major processes. A simple example is to retexture pavement surfaces to
avoid having to replace them, which would reduce the carbon footprint of asphalt
pavements. Especially relevant to this study are methods for quantifying different

26
reduction alternatives and selecting those that are most effective on a department-wide
scale.
Databases used in the study include:
National Renewable Energy Laboratory (NREL) Database: NREL has published a
database for life cycle GHG emissions for several products in the US,
Inventory of Carbon and Energy (ICE) database,
NCHRP Project 25-25(58) – GreenDOT Model,
Processes, Equipment, and Materials: Based on the 2007 NJDOT Specifications and
definitions of the Bid Sheet items.
ASSESSMENT OF OPERATIONS ENVIRONMENTAL MANAGEMENT NEEDS
Prior to designing the model, it was important to access the desired and necessary
outputs of the model. To address this, feedback was obtained from the NJDOT
Maintenance Operations about fundamental requirements for the environmental
management system. The feedback provided valuable information varying from basic
requirements such as the data contained in the existing management systems should
be utilized to the greatest possible extent as an input for the evaluation, to the
consideration of improved vehicle performance (in terms of fuel consumption and
emissions) resulting from the use of fuel additives or engine retrofit, as well as the ability
to evaluate individual projects, maintenance programs, and annual maintenance
operations. All the requirements are met in the developed evaluation model.
Supplementary to the information obtained through the literature survey, the
assessment of needs provided the input and guidelines for the following aspects of the
model:
1. Assess the impacts of the Maintenance Operations activities on Greenhouse Gas
emissions.
2. Identify contributing factors: processes, materials, equipment used by
Maintenance Operations.
3. Quantify GHG emissions using the Life Cycle Assessment (LCA) framework.
4. Identify applicable strategies for reducing the GHG emissions.

27
5. Develop a modeling tool that will assist in informed, sustainable Operations
Maintenance decision making with respect GHG emissions.
One of the important findings of the assessment of the needs is the fact that different
processes and activities need to be handled separately by the model. GHG emissions
due to use of materials are calculated based on life cycle assessment framework.
Several GHG emissions inventory databases identified earlier in this report provide
GHG emission values for various materials used for transportation maintenance
activities. Similarly, vehicles and equipment are to be handled separately as the major
portion of GHG emissions contributed by them is due to burning of fossil fuels.
Figure 4 shows the contribution of various sectors towards global GHG emissions. It
can be clearly observed that transportation is one of the highest impact sectors. Also, a
transportation maintenance project need not necessarily fall under the transportation
sector. It may contribute towards land use change, it will most likely use energy in
electricity, heat, and other forms, it will generate waste, it will contribute to fuel
combustion, and it will also take part in contributing towards other sectors in various
ways. Figure 5 identifies key processes and activities that contribute towards highway
maintenance projects.

28
Figure 4. Contribution of different sectors towards world greenhouse gas emissions11
11 Source: World Resource Institute, Climate Analysis Indicator Tool (CAIT), Navigating the Numbers: Greenhouse Gas Data and International Climate Policy. December 2005. Intergovernmental Panel on Climate Change, 1996.

29
Figure 5. Sources of GHG Emissions in Highway Maintenance Projects
Strategies for Reducing GHG Emissions
In developing strategies for GHG emissions reduction, it is important for DOTs to consider all aspects of transportation projects that are responsible for the production of GHG emissions. Only then would it be possible to identify alternatives and compare their benefits in terms of the relative reduction in GHG emissions. For example, a roadway construction project will produce GHG emissions associated with embodied carbon in the materials used in construction, as well as the equipment used for handling the materials. In addition, extraction, processing, and transportation of the materials will require energy and hence produce CO2 emissions. It is therefore necessary to break down the primary finished materials into their standard ingredients. In the example of a roadway construction project, several finished materials are responsible for CO2 emissions, including:
Concrete Panels – principally composed of cement, aggregate, steel, and water;
Asphalt – principally composed of bitumen and aggregate;
Cement Treated Aggregate – principally composed of cement, aggregate, and water;
Base Aggregate – composed of aggregate only.
• Production of raw materials
• Equipment manufacturing
Raw Materials Used
• On-site electricity usage
• Plant, equipment, site accommodation On-Site Activities
• Extraction and production of products and plants Off-Site Assembly
• Transport of equipment and materials
• Transport of personnel Transport
• Equipment usage
• On-site production (including waste)
On-Site Construction
Refurbished/Demolition

30
There are three ways that DOTs can reduce CO2 emissions from materials used in roadway construction and repair:
1. Reduce the volume of materials used,
2. Use recycled materials that require less energy to produce than virgin materials ,
3. Alternative preparation practices that reduce energy use, such as warm mix
asphalt.
Table 2 below summaries the strategies to reduce GHG emissions that are most
relevant to transportation maintenance projects.
TABLE 2: Strategies to reduce greenhouse gas emissions
Use renewable, energy efficient, and recycled materials
Materials that require less energy and have
smaller lifecycle footprint.
On-situ recycling and reuse of materials and
equipment.
Alternative preparation practices, e.g. Warm-mix
asphalt.
Use alternative fuels Biodiesel, Ethanol, Methanol, CNG.
Use more efficient vehicles and equipment, retro-fit engines
Hybrid, plug-in hybrids, retrofit CNG and biodiesel engines for equipment and heavy machinery.

31
ENVIRONMENTAL MANAGEMENT SYSTEM MODEL
A conceptual model and a prototype of the customized Environmental Management
System was designed and tested by Operations Support supervisors. The following
sections detail the logic that was adopted to build the model.
Design Logic:
The literature review provided many emissions models that use different logic and
methodologies to deliver CO2 emissions emerging from various target activities. Based
on studies of the various models that were found relevant in the literature review, a
unique model is proposed that particularly targets and suits GHG emissions calculations
for transportation maintenance projects.
As mentioned earlier, the important sources of information to be used in the model are
2007 NJDOT specifications list, bid sheets, and GHG emissions inventories. It was also
observed that materials, vehicles, and equipment contribute towards GHG emissions in
different ways. To address this, the model groups similar specifications (items) together
(e.g., all specifications using asphalt will be grouped together) and will calculate the
GHG emissions for total weight (ton) of the grouped items together based on GHG
emission values presented in emission inventory databases. For a finished material
(material that requires mixing of various ingredients or raw materials on site before use)
such as asphalt, GHG emissions calculations are based on default ratios of raw
materials. The user will have the option to change these default mix ratios to suit their
needs. Once the GHG emissions values for any particular project are computed,
theuser is able to construct and compare different alternative scenarios to reduce the
footprint. Presently, the team has worked out details for two main options: 1) change
mixing ratios to reduce footprint, and 2) change raw materials (aggregates are replaced
completely or partially with recycled material) in favor of more environmentally friendly
alternatives. These choices may be expanded to include more alternatives from
information collected during the literature survey and possibly new resources. In
addition, more alternatives such as: hot mix v/s warm mix asphalt, day time v/s night
time laying of materials, etc., are also helpful in reducing GHG emissions associated
with a certain project. Finally, the team adopted various techniques and methods to
make this model as user friendly as possible. The approach was to make the model
progress through different screens. At screen 1 the user will input the information and
relevant project data and at the final screen the output of the normal and
mitigated/alternative scenario will be presented for comparison. Figure 6 shows the flow
diagram of the analysis approach.

32
Figure 6. Analysis Approach
Design Considerations:
Based on NJDOT Specifications and collected data from bid sheets – The project
input depends on the ability to select from one of the specifications or the entry of
new processes or activities. Together, these specifications and new processes will
define each task that the maintenance project will need to execute for completion.
GHG emission calculations and comparisons with scenarios using different emission
reduction strategies – the GHG emission inventory database will provide the
conversion of activity to emissions (E.g., ton of material will produce certain ton of
CO2eq). A separate calculation strategy was used for materials, equipment, and
vehicles.
Built in Reporting Tool – The software is able to generate reports based on project
information and GHG emissions calculations.
Intuitive User Interface – Special effort has been taken on making the software as
user friendly as possible with an intuitive user interface.
Project Bid Sheets / Invoices
Identify Processes, Equipment, and
Materials
Estimate Project GHG Potential
Unit Carbon Emissions: Vehicles, Materials,
Processes
Identify Potential Reductions
Estimate at the time Bids are
submitted
Estimate after the projects are
completed
OR
Estimate before issuing bids
OR

33
The calculations for the items in the 2007 NJDOT specifications list were completed
before building thesoftware model, which will access the specifications list database to
calculate the GHG emissions for different projects. The calculations for GHG emissions
associated with NJDOT 2007 specification items were originally based only on the ICE
database described in the summary of the literature survey. National Renewable Energy
Laboratory (NREL) and EPA also provide similar databases for embodied carbon based
on full product life-cycle assessment. The ICE database was compared with the NREL
database and EPA database for most of the commonly used materials, processes, and
activities at transportation projects including asphalt, bitumen, steel, concrete, etc. Most
numbers were in agreement with each other in both databases. For some materials,
original calculations were updated to include NREL/EPA database numbers, which are
specifically prepared for the US.
After projects are entered into the database, the user is allowed to select projects for further analysis. Project selection is based on one or more selection criteria: project year, project type, DP number, project name or part of the name, location. One or more projects can be selected for further analysis. The further analysis is done for the whole project selection, not by the individual project.
Some important features of the system are presented below:
Emissions Estimation Module: Analytical models were integrated and expanded to
allow users to estimate the carbon footprint of every project or selection of projects.
Project Scoring: This module enables users to score and rank projects based on
environmental criteria including carbon footprint estimations, overall air quality
impacts, environmental preservation, and other information.
Strategy Evaluation: Users are able to evaluate various aspects of quality of life
(stewardship) and economic strategies and their environmental impacts. For
example, users can see the impact of including procedures and materials used in
reducing the carbon footprint.
Post-Implementation Analysis: Users are allowed to enter information about
observed project impacts following implementation. This feature can be expanded
and used to calculate benchmark estimates of various environmental impacts.
Reporting and Data Sharing: This action allows users to quickly generate effective
and informative reports. It also allows the system to share data with other information
management and asset management systems, as well as produce data that can be

34
used as inputs for those systems. This offers an effective integration of environmental
analysis in the overall asset management system at NJDOT.
Model Methodology:
The methodology adopted to calculate GHG emissions has the following steps. Step 1: The first thing to do in the system is to enter a project with all its specification items. This can be done by manually entering item by item (select from drop down menu), or by loading an Excel spreadsheet with a specified formatting. An example of the input format is given in appendix D. The item numbers MUST correspond to the item numbers in the 2007 NJDOT specifications list (stored in the database). Otherwise, for those that are not in the database, the user will have to provide additional details (e.g. description, material class, unit of quantity, CO2 emission per unit, etc.). Step 2: The second step is entering the data. Execution of this step is different for materials and for equipment and vehicles. Data for materials will specify which materials are used and in what quantity. Furthermore, for finished materials, the user has an option to proceed with the default mix ratio or to modify it. Data for equipment and vehicles includes data about the usage of vehicles and equipment in the project. Vehicles are used to transport equipment, materials, and work crews to and from the project site. Equipment is used at the project site to perform certain construction, repair, rehabilitation, and other roadway infrastructure maintenance activities. Step 3: Step 3 deals with the calculation of GHG emissions for the data gathered in steps 1 and 2. Calculations will use reference values from GHG emissions databases to calculate ton of GHG emissions for all the materials, equipment, and vehicles used in the project. Step 4. This step offers the user various alternatives to reduce GHG emissions associated with a single or a selection of projects. Primary alternatives include: use of alternative materials, changing of default mix ratios associated with finished materials, etc. Step 5: This step is all about presentation. The user is able to generate various reports, data summary sheets, graphs, and charts to compare various scenarios, various alternatives, or even to present data associated with a single or a selection of projects. Flow of Model Execution to Calculate GHG Emissions for Materials: The flow of the model execution is illustrated through a series of figures below. Figure 7 explains the process to input project data into the model. The project input form will enable the user to select various materials, processes, and activities, based on the NJDOT specifications list. There is even an option to enter new item with all the relevant information.

35
Figure 7. Model input
Concrete panels, base aggregates, asphalt, and cement treated aggregates are
grouped together as finished materials. These materials are made of conventional
components and need to be mixed and finished on site before they are used. Figure 8
demonstrates the process through which GHG emissions are calculated for the finished
materials. One additional step for these finished materials requires the total weight of a
single type of finished material be broken down into different weights of raw materials
calculated based on default mix ratios or mix ratios edited by the user. Each of the raw
material weight is used to calculate respective GHG emission values based on
reference values. All GHG emissions for each of the raw materials are then added
together to generate total GHG emission values for the selected finished material.

36
Figure 8. Calculation of GHG emissions for finished materials
Flow of Model Execution to calculate GHG emissions for Vehicles and Equipment:
For the calculation of GHG emissions associated with vehicles and equipment, it is
important that the data about the usage of vehicles and equipment in the project has
been entered in accordance with step one as described in the model methodology
section. Vehicles are used to transport equipment, materials, and work crews to and
from the project site. Equipment is used at the project site to perform certain
construction, repair, rehabilitation, and other roadway infrastructure maintenance
activities.
Several examples of calculations of GHG emissions associated with vehicle use are
given in the appendix. Essentially, the CO2 footprint will depend on the type of fuel
used, type of engine, and the usage of vehicles (miles traveled) and equipment (hours
in use). A typical input associated with a vehicle will require the user to specify vehicle
type (light duty truck, van, SUV, heavy duty truck, etc.), engine type (to identify fuel
type, gasoline/diesel/electric), and model year.

37
This is a brief example for a 2009 model light duty truck running on conventional
gasoline fuel. The information inputted by the user will prompt the model to pull up the
following related information from various dictionaries or tables pre-fed to the model:
2009 model small pickup truck gives 18.63 miles/gallon of gasoline which implies that
that truck uses 0.05 gallons of fuel for each mile that it travels. The model also has been
pre-fed the information that 1 gallon of conventional gasoline consumed by a small
pickup truck will produce 8.81 kg CO2.
Using all this data:
kg CO2 equivalent produced per mile run = 8.81*0.05 = 0.47
If a hybrid vehicle was used instead of conventional gasoline vehicle, then the CO2
equivalent will be contributed partly by the burning of fuel and partly due to electricity
produced by the battery used to run the vehicle. Please refer to examples provided in
the appendix of this report for more details on calculations of GHG emissions due to the
use of different types of vehicles. Calculation of GHG emissions due to the use of
various equipment on site is very similar to that of vehicle use.
Alternatives and Analysis:
After projects are entered into the database, user can select one or more projects for
further analysis. This selection of projects can be based on one or more selection
criteria: project year, project type, DP number, project name or part of the name,
location. Users are able to do a variety of analysis and explore many alternatives for the
selection of projects. Users can also add new equipment, new vehicle, new vehicle
type, new material, change mixing ratios for finished materials and replace conventional
materials in a mix by alternative material or recycled material.
Procedure to Add Equipment/Vehicle
Specify the type of vehicle/equipment. Select from the existing types or type a
new one.
Select Engine Type from a drop-down based on Table of Engine Types. Fuel
Type is automatically determined based on selected Engine Type.
Enter total inventory for the new equipment type, as well as CO2 emission rate
per hour of use OR MPG value of vehicle for years (1990-2020). The CO2eq is
then calculated by the model.

38
All finished materials’ calculations have two alternatives: change mixing ratios, and
change ingredients (replace conventional components with renewable or recycled
components). The user may select either or both of the alternatives.
Figure 9. Calculation of GHG emissions for finished materials – choice of alternatives
The GHG emissions calculated using either or both of the alternatives provides
quantitative information about the benefits with use of these pre-defined alternatives.
Figure 9 shows the alternatives available to the user to reduce GHG emissions. Figure
10 explains the process by which the default mixing ratios related to finished materials
(pre-selected based on literature search) may be changed to suit specific requirements.
The choice of one or more alternatives can be made for a single project or for a
selection of several projects. This enables the user to compare various scenarios and
alternatives leading to better decision-making.

39
Figure 10. Calculation of GHG emissions for finished materials – option to view/change
mixing ratio

40
PROJECT DELIVERABLES
1. Software for EMS
EMS software is user friendly with facility to automate calculations for changes in project
parameters. The software system is scheduled to be installed at the three regional
offices and tested for communications compatibility and network efficiency. A tutorial will
be held for regional supervisors to provide input on designing customized workshops for
staff members.
2. User’s Manual
The development of the User’s Manual is underway. Upon completion, the user’s
manual will serve as a reference guide on data requirements, analytical tools used in
the model, project scoring methods, strategy evaluation, and reporting procedures. This
reference will be used during training, along with accompanying Power Point
presentations. The manual will be further revised and refined to reflect the redesigned
software logic and user interface modifications.
3. Staff Training Sessions
Parallel with the development of the graphical user interface and User’s Manual, training
materials are being developed as well. These materials will be used in training sessions
with NJDOT staff and will use examples to illustrate the application of the software.
Operations Support will participate in a tutorial review of the EMS model. Program
activities are expected to include an overview of the system, analytical exercises, and
development of practice reports. After the research team holds the supervisory tutorial,
staff members will participate in a two-hour training session at the Operations Support
location. The regional sessions may be longer, since an additional section will be
presented on data transfer procedures.
4. Data Tables
GHG Emissions calculations done with the EMS software rely on several data tables, including GHG emissions inventory databases, a modified specifications list with detailed GHG emissions calculations for each specification item, vehicles and equipment tables, fuel emission charts, alternative materials, mixing ratios for finished materials, and many other minor tables. All these data tables will be made available to NJDOT for review and future updates (if necessary).

41
CONCLUSIONS AND RECOMMENDATIONS
In conclusion, the Environmental Management System project will enhance the ability of
NJDOT Operations to be an effective steward of the environment. The proposed
monitoring system improves environmental management and departmental
performance. It will also provide NJDOT with the ability to offer relevant, useful, well
formatted, accurate, and timely information and analysis of the environmental impact of
transportation maintenance. Furthermore, NJDOT Operations will be prepared to
effectively monitor GHG emissions activities for compliance in the future.
There are three main outcomes of this project:
1. Enable estimation of the current Operations Maintenance GHG emissions.
2. Implement a decision support tool for analyzing potential strategies for reducing
GHG emissions.
3. Guidelines (operational and policy) for management decisions to reduce GWP:
Modify specs,
Modify equipment/vehicle requirements,
Modify fuel requirements, etc.

42
REFERENCES
AASHTO (2009). Sustainability. Center for Environmental Excellence (4/21/09) http://environment.transportation.org/environmental_issues/sustainability/ AASHTO (2008). Effective Project Management for NEPA. Standing Committee on the Environment, NCHROP Project 25-25, Task27 NCHRP, TRB. AASHTO (2008). Primer on Transportation and Climate Change. Argonne National Laboratory GREET Model. Accessed online (Nov 2010) at: http://www.transportation.anl.gov/pdfs/TA/153.pdf. ASLA (2008). The Sustainable Sites Initiative: Guidelines and Performance Benchmarks, Draft 2008. Breneman, E. J. (2010), Reclaimed Asphalt Pavement (RAP), Published by EJB Paving & Materials Co. Accessed online at: http://www.ejbreneman.com/EJB-Paving-and-Materials/Warm-Mix-Asphalt-And-Rap-Turning-Black-To-Green/ Chien, D. (2005), U.S. Transportation Models Forecasting Greenhouse Gas Emissions: US Department of Transportation-Bureau of transportation statistics, journal of transportation statistics, 8 (2). Accessed online at: http://www.bts.gov/publications/journal_of_transportation_and_statistics/volume_08_number_02/html/paper_04/index.html DOE Energy MARKAL-MACRO Model. Accessed online (Nov 2010) at: http://www.etsap.org. EPA (2005). Emission Facts: Calculating Emissions of Greenhouse Gases – Key Facts and Figures, EPA420-F-05-003, February 2005 Electrolube (2005), Epoxy resin technical datasheet ER2074. Accessed online at: http://images.mercateo.com/pdf/Schuricht/ER2074_DATA_DE.pdf Elert, G. (Editor) (2001), The Physics Factbook - McGraw-Hill Encyclopedia of Science and Technology: Density of Concrete. Accessed online at: http://hypertextbook.com/facts/1999/KatrinaJones.shtml Energy Information Administration (2009), The National Energy Modeling System: An Overview, Report #: DOE/EIA-0581 (2009), U.S. Department of Energy, Release date: October 2009. http://www.eia.doe.gov/oiaf/aeo/overview/pdf/0581(2009).pdf Hammond, G.P. and C.I. Jones (2008), Inventory of Carbon & Energy (ICE) Version 1.6a. University of Bath, UK. Available online at: www.bath.ac.uk/mech-eng/sert/embodied/

43
ICF Consulting (2010), Greenhouse Gas Mitigation Measures for Transportation Construction, Maintenance, and Operations Activities, Final Report, NCHRP Project 25-25, Task 58, National Cooperative Highway Research Program, Transportation Research Board, Published by the American Association of State Transportation and Highway Officials (AASHTO). Accessed online at: http://onlinepubs.trb.org/onlinepubs/nchrp/docs/NCHRP25-25(58)_FR.pdf ICF Consulting (2006), Assessment of Greenhouse Gas Analysis Techniques for Transportation Projects, Final Report, NCHRP Project 25-25, Task 17, National Cooperative Highway Research Program, Transportation Research Board, Published by the American Association of State Transportation and Highway Officials (AASHTO). Available online at: http://onlinepubs.trb.org/onlinepubs/archive/NotesDocs/25-25(17)_FR.pdf Knezek, C. (2009). Sustainable Transportation in a Changing Environment Assessment. Linderburg, M. R. (1999), Engineering Unit Conversions, Fourth Edition, Professional publications Inc. Mazurek, M. (2009). Transportation Systems, Alternative Fuels, and Air Quality. Rutgers Center for Advanced Infrastructure and Transportation. NAPA National asphalt Pavement Association (2010) http://www.hotmix.org/index.php?option=com_content&task=view&id=144&Itemid=227 “New Jersey Greenhouse Gas Inventory and Reference Case Projections 1990-2020”, November 2008. This document is posted on the State’s Global Warming Web page at http://www.nj.gov/globalwarming/ NJDEP (2008). Energy Use and Renewable Energy Sources. Environmental Trends Report, NJDEP, Division of Science, Research and Technology. http://www.state.nj.us/dep/ds/trends2005/. NJDOT (2009). New Jersey Department of Transportation Infrastructure Projects, Quarterly Report. Oak Ridge National Laboratory TAFV Model. Accessed online (Nov 2010) at: http://pzl1.ed.ornl.gov/altfuels.htm Pacific Northwest National Laboratory MiniCAM Model. Accessed online (Nov 2010) at: http://www.pnl.gov/aisu/pubs/chinmod2.pdf (Also see: http://sedac.ciesin.org/mva/minicam/MCHP.html.

44
Potter, E. (2008). MNT-08-02 Survey for the Member Department of Transportation Equipment Managers. Reducing Fuel Consumption and Carbon Footprint in DOT Operations. Time for change http://timeforchange.org/mitigate-global-warming-effects-temperature-simulation Society of Chemical Industry (2009), Proceedings of the Asphalt's Carbon Footprint
Conference, http://www.soci.org/News/construction-asphalt-papers
U.S. Environmental Protection Agency (EPA), Inventory of U.S. Greenhouse Gas Emissions and Sinks: 1990-2008, Table ES-7, 2010. http://www.epa.gov/climatechange/emissions/usinventoryreport.html Venner, M.; DeWit, M.; Gibson, W.; Concienne, R.; Sanghavi, S.; Hunkins, J. (2007). Current Department of Transportation Environmental Management System Development Efforts. Transportation Research Record: Journal of Transportation Research Board, No. 2011. World Resource Institute, Climate Analysis Indicator Tool (CAIT), Navigating the Numbers: Greenhouse Gas Data and International Climate Policy. December 2005. Intergovernmental Panel on Climate Change, 1996. Watkins, M. (2009), Aggregate Industries Society of Chemical Industry: Asphalt's carbon footprint conference papers: The significance of carbon, http://www.soci.org/News/construction-asphalt-papers.aspx

45
BIBLIOGRAPHY
AggRegain CO2 estimator tool (2006), Developed by Center for Sustainability (C4S) at TRL Limited, Taylor Woodrow Technology and Costain Limited-for WRAP. Available online at: www.wrap.org.uk/document.rm?id=2910 American Plastic Lumber Available online at: http://www.americanplasticlumber.com/tech_specs/fiberglass_filament_reinforced_plastic_lumber.htm Asphalt pavement alliance (2011). Available online at: http://asphaltroads.org/images/documents/ghgcarbon_footprint_of_various_pavement_types.pdf Asphalt pavement embodied carbon tool (2010). Available online at: http://www.sustainabilityofhighways.org.uk/ British Cement association (BCA) (2009), Embodied CO2 of UK cement, additions and cementitious material. Available online at: http://www.sustainableconcrete.org.uk/low_carbon_construction/embodied_co2.aspx BCA (2009), Embodied CO2 of factory made cements and combinations. Available online at: http://www.sustainableconcrete.org.uk/low_carbon_construction/embodied_co2.aspx BSi British Standard (2008), Guide to PAS 2050: How to assess the carbon footprint of goods and services. Available online at: http://www.bsigroup.com/upload/Standards%20&%20Publications/Energy/PAS2050-Guide.pdf Clarke, L. et al. (2008), CO2 Emissions Mitigation and Technological Advance: An Updated Analysis of Advanced Technology Scenarios, Final Report, Prepared for the U.S. Department of Energy under Contract DE-AC05-76RL01830, Pacific Northwest National Laboratory. Available online at: http://www.pnl.gov/science/pdf/PNNL18075.pdf DEFRA (2009), Guidelines to DEFRA's Greenhouse Gas Conversion Factors for Company Reporting – Main Report and Annexes. Available online at: http://www.defra.gov/uk/environment/business/reporting/pdf/20090717-guigelines-ghg-conversions-factors.pdf Marks, H. and R. Willis (2010), Measuring a Pavement’s Carbon Footprint, Hot Mix Asphalt Technology, Vol. 15, No.6, November/December 2010, pp. 42-50. Available online at: http://www.nxtbook.com/nxtbooks/naylor/NAPS0610/#/42 Mclnnis, G. (Editor) (2007), EMEP/CORINAIR Emission inventory guidebook, EMEP Task Force on Emission Inventories. European Environmental Agency, Copenhagen,

46
Technical report 16/2007. Available online at: http://www.eea.europa.eu/publications/EMEPCORINAIR5 National Renewable Energy Laboratory: U.S. Life Cycle Inventory Database (2008), version 1.6. Available online at: http://www.nrel.gov/lci/ U.S Department of Energy, Energy efficiency > Transportation Accessed online (Jan 2011) at: http://www.energy.gov/energyefficiency/transportation.htm

47
APPENDICES - EXAMPLES OF GHG EMISSIONS CALCULATIONS AND
SUPPORTING MATERIAL
A. Sample calculations - Materials
The total area of the shape(s) in Figure 11 can be calculated as follows:
Area A is a rectangle 100' × 100' = 10,000 square feet
Area B is a triangle 30' × 100'÷2 = 1,500 square feet
Area C is a rectangle 20' × 120' = 2,400 square feet
Area D is a circle 702 ÷ 4 × 3.14 = (70 × 70) ÷ 4 × 3.14 = 3,846.5 square feet
Planter Area is represented by the two rectangles and two circles with the area of:
45’ x 5’ x 2’ + ((2.5’)2 x π) x 2 = 489.3 square feet Therefore, the total paved area is:
10,000 + 1,500 + 2400 +3846.5 – 489.3 ≈ 17,257 square feet To compute the volume, multiply the 6” (0.5 ft) thickness of the proposed pavement by the area previously computed.
Volume = [Area] × [Thickness]
= (17,257 ft2) × (0.5 ft) = 8,628.5 ft3 ≈ 320 CY To calculate the weight of material needed for the pavement project previously computed, one needs to know the compacted density of the paving material. Density is defined as the weight of material per unit of volume and it can be found listed in resources such as the Physics Factbook for typical concrete mixtures. For example:
Density of the pavement = 145 lb/ft3
Weight = Volume × Density
Weight = 8,628.5 ft3 × 145 pcf = 1,251,132.5 lb
Convert to tons = 1,251,132.5 lb ÷ 2,000 lb/ton ≈ 626 tons

48
B. Sample calculations – Vehicles’ GHG Emissions
Example #1
Vehicle Type Light-Duty Truck (Van, Pickup, SUV)
Engine Type Gasoline Conventional
Model Year 2009
Calculation
Fuel Gasoline
Plug-in Hybrid? No 0%
MPG 18.63 mi/gal
Gasoline Electricity
GGE 1.00 gal/gal 33.53 kWh/gal
CO2e per unit 8.81 kg/gal 0.483 kg/kWh
Units 0.05 gal/mile - kWh/mile
CO2e/mile 0.47 kg CO2e - kg CO2e
Total CO2e 0.47 kg CO2e/mile
Example #2
Vehicle Type Auto
Engine Type Diesel-Electric Hybrid (Plug-in)
Model Year 2010
Calculation
Fuel Diesel
Plug-in Hybrid? Yes 33%
MPG 61.98 mi/gal
Diesel Electricity
GGE 0.88 gal/gal 33.53 kWh/gal
CO2e per unit 10.30 kg/gal 0.483 kg/kWh
Units 0.01 gal/mile 0.18 kWh/mile
CO2e/mile 0.10 kg CO2e 0.09 kg CO2e
Total CO2e 0.18 kg CO2e/mile

49
Example #3
Vehicle Type Auto
Engine Type Gas/Ethanol FFV
Model Year 2010
Calculation
Fuel Ethanol/Gas
Plug-in Hybrid? No 0%
MPG 27.25 mi/gal
Ethanol/Gas Electricity
GGE 1.06 gal/gal 33.53 kWh/gal
CO2e per unit 8.28 kg/gal 0.483 kg/kWh
Units 0.04 gal/mile - kWh/mile
CO2e/mile 0.32 kg CO2e - kg CO2e
Total CO2e 0.32 kg CO2e/mile
Example #4
Vehicle Type Auto
Engine Type CNG Engine
Model Year 2010
Calculation
Fuel CNG
Plug-in Hybrid? No 0%
MPG 27.25 mi/gal
CNG Electricity
GGE 0.12667 1000 cu. Ft./gal 33.53 kWh/gal
CO2e per unit 54.55 kg/1000 cu. Ft. 0.483 kg/kWh
Units 0.0046 1000 cu. Ft./mile - kWh/mile
CO2e/mile 0.25 kg CO2e - kg CO2e
Total CO2e 0.25 kg CO2e/mile
Example #5
Vehicle Type Auto

50
Engine Type Electric
Model Year 2010
Calculation
Fuel Electricity
Plug-in Hybrid? No 0%
MPG 85.00 mi/gal
Electricity Electricity
GGE 33.53 kWh/gal 33.53 kWh/gal
CO2e per unit 0.483 kg/kWh 0.483 kg/kWh
Units 0.39 kWh/mile - kWh/mile
CO2e/mile 0.19 kg CO2e - kg CO2e
Total CO2e 0.19 kg CO2e

51
C. Supporting material for GHG Emissions Calculations
Density Estimation - Physics Factbook
Edited by Glenn Elert Available at: http://hypertextbook.com/facts/index-topics.shtml The Physics Factbook was referred to for guidance in estimating density of various construction materials. For example, concrete is a very important building material, but its density can vary from one application to another. Several different coarse aggregates such as sand and pebbles are mixed with water and cement and then the mix is hydrated to interlock and bind the crystals together and harden the structure. In construction of highways, various types of concrete are used. Reinforced concrete is strengthened by steel. Pre-stressed concrete is made by casting concrete around steel cables stretched by hydraulic jacks. Compressed concrete is the strongest one. It is mainly used for floors and roofs. In order to calculate the GHG emission of concrete, its carbon equivalent needs to be established, which in turn is directly proportional to weight. When the unit measure of the material quantity used in a project is expressed in terms of volume, the density of material has to be known to determine its weight.
TABLE 3: Concrete Density Table from the Physics Factbook
Bibliographic Entry Result (w/surrounding text)
Standardized Result
Dorf, Richard. Engineering Handbook. New York: CRC Press, 1996.
"The density of normal concrete is 2400 kg/m3 and the density of lightweight concrete is 1750 kg/m3
1750–2400 kg/m3
Brooklyn Public Library Files; 1999
"Typical density of concrete (2.3 g/cm3)"
2300 kg/m3
McGraw-Hill Encyclopedia of Science and Technology.
"Volume generally assumed for the density of hardened concrete is 150 lb/ft3 (2400 kg/m3)"
2400 kg/m3
The information provided in the Physics Factbook is found useful in calculating total carbon emission from concrete. Soil aggregate base course, dense graded base course, concrete barrier curb, concrete parapet, deck, panel – these all use concrete as a raw material, but their units of measurement are different (e.g. linear foot, square yard, cubic yard are used interchangeably). In order to measure the emission in CO2 equivalent, unit conversion is required. This is where density of concrete plays the role. The density gives us the total weight of the concrete in tons which is calculated as:
Volume = [weight] x [density]
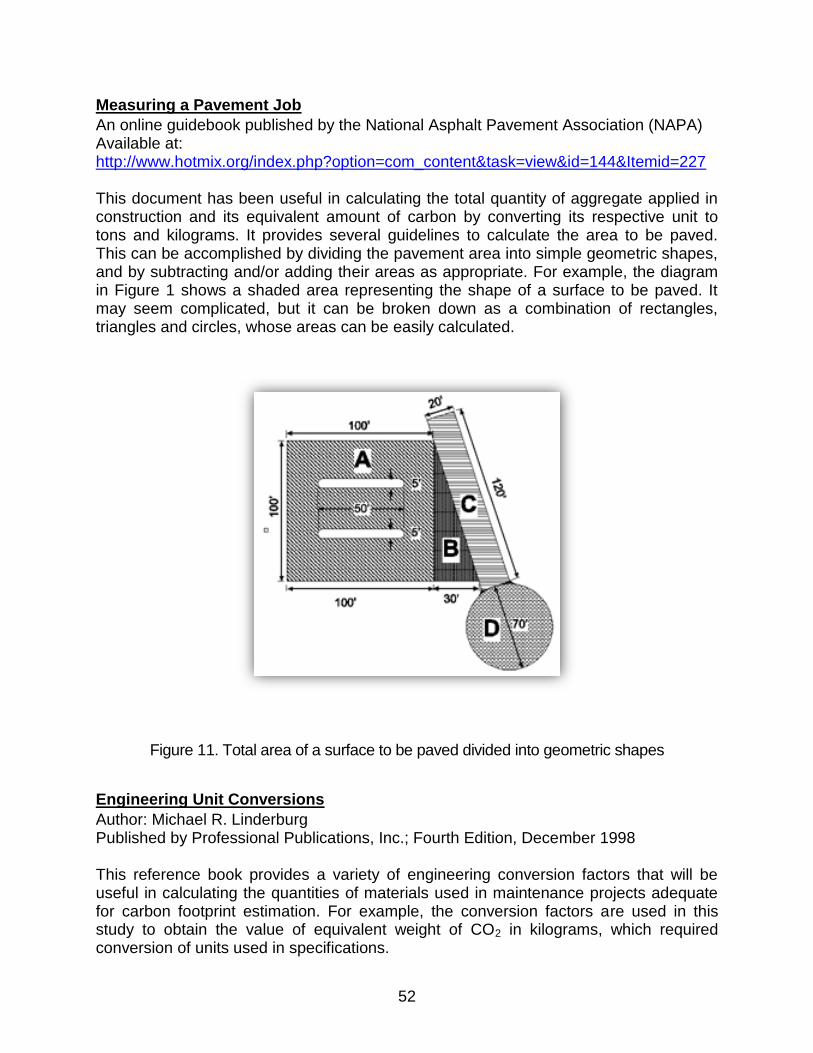
52
Measuring a Pavement Job
An online guidebook published by the National Asphalt Pavement Association (NAPA) Available at: http://www.hotmix.org/index.php?option=com_content&task=view&id=144&Itemid=227 This document has been useful in calculating the total quantity of aggregate applied in construction and its equivalent amount of carbon by converting its respective unit to tons and kilograms. It provides several guidelines to calculate the area to be paved. This can be accomplished by dividing the pavement area into simple geometric shapes, and by subtracting and/or adding their areas as appropriate. For example, the diagram in Figure 1 shows a shaded area representing the shape of a surface to be paved. It may seem complicated, but it can be broken down as a combination of rectangles, triangles and circles, whose areas can be easily calculated.
Figure 11. Total area of a surface to be paved divided into geometric shapes
Engineering Unit Conversions
Author: Michael R. Linderburg Published by Professional Publications, Inc.; Fourth Edition, December 1998 This reference book provides a variety of engineering conversion factors that will be useful in calculating the quantities of materials used in maintenance projects adequate for carbon footprint estimation. For example, the conversion factors are used in this study to obtain the value of equivalent weight of CO2 in kilograms, which required conversion of units used in specifications.

53
Conversion Example1: Dense graded Aggregate Concrete Base Course, 4” thick
Lifecycle CO2 for concrete = 0.023 kg CO2/ kg
Density of concrete = 1,460 kg/m3
Weight = [Density] x [Volume]
Volume = [Paved Area] x [Thickness]
Paved area = 18,000 ft2 = 18,000 ft2 x 0.093 m2/ft2 = 1,674 m2
Thickness = 4” = 4” x (0.0254 m/inch) = 0.1016 m
Volume = 1,674 [m2] x 0.1016 [m] = 170.08 m3
Weight of concrete = 1,460 [kg/m3] x 170 [m3] = 248,314 kg
GHG EMISSIONS = [Weight of concrete] x [CO2 content for concrete]
GHG EMISSIONS = 248,314 [kg] x 0.023 [kg CO2/kg] = 5,711 kg CO2
Conversion Example2: Hot mix asphalt (HMA) pavement repair, 6” thick
Lifecycle CO2 for concrete = 1.48 kg CO2/ton =
= 1.48 [kg CO2/ton] x 0.001 [ton/kg] = 0.00148 kg of CO2/kg
HMA pavement area = 2,500 m2
HMA density = 145 pcf = 2300 kg/m3 (from conversion tables)
HMA thickness = 6” = 6” x (0.0254 m/inch) = 0.1524 m
Volume of HMA = [Area] × [Thickness] = 2,500 m2 x 0.1524 m = 381 m3
Weight of HMA= [Volume] x [Density] = 381 m3 x 2,300 kg/m3 = 876,300 kg
GHG EMISSIONS = [Weight of HMA] x [CO2 content for HMA]
GHG EMISSIONS = 876,300 [kg] x 0.00148 [kg CO2/kg] = 1,297 kg CO2

54
D. Sample Input File
Line No. DP Number Item No. Alternative Description Units Quantity
1 09403 151003M PERFORMANCE BOND AND PAYMENT BOND
LS 1.00
2 09403 152003P OWNER'S AND CONTRACTOR'S PROTECTIVE LIABILITY INSURANCE
LS 1.00
3 09403 154003P MOBILIZATION LS 1.00
4 09403 155006M FIELD OFFICE TYPE B SET UP U 1.00
5 09403 155024M FIELD OFFICE TYPE B MAINTENANCE
MO 6.00
6 09403 155039M TELEPHONE SERVICE LS 1.00
7 09403 157003M CONSTRUCTION LAYOUT LS 1.00
8 09403 158063P CONCRETE WASHOUT SYSTEM
LS 1.00
9 09403 158072M OIL ONLY EMERGENCY SPILL KIT, TYPE 1
U 2.00
10 09403 159003M BREAKAWAY BARRICADE U 500.00
11 09403 159006M DRUM U 100.00
12 09403 159009M TRAFFIC CONE U 750.00
13 09403 159012M CONSTRUCTION SIGNS SF 5,000.00
14 09403 159015M CONSTRUCTION IDENTIFICATION SIGN, 4' X 8'
U 6.00
15 09403 159027M FLASHING ARROW BOARD, 4' X 8'
U 4.00
16 09403 159030M PORTABLE VARIABLE MESSAGE SIGN
U 6.00
17 09403 159108M TRAFFIC CONTROL TRUCK WITH MOUNTED CRASH CUSHION
U 6.00
18 09403 159126M TEMPORARY TRAFFIC STRIPES, 4"
LF 795,564.00
19 09403 159138M HMA PATCH T 100.00
20 09403 159141M TRAFFIC DIRECTOR, FLAGGER HOUR 640.00
21 09403 159144M EMERGENCY TOWING SERVICE
U 1.00
22 09403 160003M FUEL PRICE ADJUSTMENT LS 1.00
23 09403 160006M ASPHALT PRICE ADJUSTMENT LS 1.00
24 09403 201003P CLEARING SITE LS 1.00
25 09403 302051P DENSE-GRADED AGGREGATE BASE COURSE, VARIABLE THICKNESS
CY 100.00
26 09403 401009P HMA MILLING, 3" OR LESS SY 349,444.00
27 09403 401021M HOT MIX ASPHALT SY 1,646.00

55
PAVEMENT REPAIR
28 09403 401027M POLYMERIZED JOINT ADHESIVE
LF 192,884.00
29 09403 401030M TACK COAT GAL 52,417.00
30 09403 401054M HOT MIX ASPHALT 12.5 M 64 SURFACE COURSE
T 17,865.00
31 09403 401057M HOT MIX ASPHALT 12.5 H 64 SURFACE COURSE
T 24,070.00
32 09403 401108M CORE SAMPLES, HOT MIX ASPHALT
U 155.00
33 09403 404006M STONE MATRIX ASPHALT 12.5 MM SURFACE COURSE
T 13.00
34 09403 453006M FULL DEPTH CONCRETE PAVEMENT REPAIR, HMA
SY 1,058.00
35 09403 507020P ASPHALTIC BRIDGE JOINT SYSTEM
LF 152.00
36 09403 602099M RESET EXISTING CASTING U 23.00
37 09403 602105M SET INLET TYPE B, CASTING U 22.00
38 09403 602123M RECONSTRUCTED INLET, TYPE B, USING EXISTING CASTING
U 20.00
39 09403 602153M RECONSTRUCTED INLET, TYPE B, USING NEW CASTING
U 1.00
40 09403 602210M BICYCLE SAFE GRATE U 11.00
41 09403 602213M CURB PIECE U 77.00
42 09403 602216M CLEANING DRAINAGE STRUCTURE
U 12.00
43 09403 606012P CONCRETE SIDEWALK, 4" THICK
SY 10.00
44 09403 606039P HOT MIX ASPHALT DRIVEWAY, 6" THICK
SY 5,364.00
45 09403 606042P HOT MIX ASPHALT DRIVEWAY, VARIABLE THICKNESS
SY 6,977.00
46 09403 606051P CONCRETE DRIVEWAY, 6" THICK
SY 1,565.00
47 09403 606060P CONCRETE DRIVEWAY, REINFORCED, 8" THICK
SY 36.00
48 09403 606084P DETECTABLE WARNING SURFACE
SY 36.00
49 09403 607018P 9" X 16" CONCRETE VERTICAL CURB
LF 4,198.00
50 09403 610003M TRAFFIC STRIPES, LONG LIFE, EPOXY RESIN 4"
LF 265,188.00
51 09403 610009M TRAFFIC MARKINGS, THERMOPLASTIC
SF 370.00
52 09403 MMR081M TRAFFIC MARKINGS, LINES, THERMOPLASTIC
LF 13,411.00

56
53 09403 610012M RPM, MONO-DIRECTIONAL, WHITE LENS
U 595.00
54 09403 610018M RPM, MONO-DIRECTIONAL, AMBER LENS
U 445.00
55 09403 610021M RPM, BI-DIRECTIONAL, AMBER LENS
U 620.00
56 09403 610024M REMOVAL OF RPM U 1,660.00
57 09403 651255M RESET WATER VALVE BOX U 41.00
58 09403 653084M RESET GAS VALVE BOX U 22.00
59 09403 MME078M IMAGING DETECTION SYSTEM, 1 CAMERA
U 1.00
60 09403 MME079M IMAGING DETECTION SYSTEM, 2 CAMERA
U 3.00
61 09403 MME080M IMAGING DETECTION SYSTEM, 3 CAMERA
U 2.00
62 09403 701012P 1 1/2" RIGID METALLIC CONDUIT
LF 40.00
63 09403 702048M LOOP DETECTOR LF 100.00
64 09403 702051P LOOP DETECTOR CABLE LF 100.00
65 09403 804006P TOPSOILING, 4" THICK SY 5,676.00
66 09403 805003M TURF REPAIR STRIP LF 41,631.00
67 09403 806006P FERTILIZING AND SEEDING, TYPE A-3
SY 5,676.00
68 09403 806018P FERTILIZING AND SEEDING, TYPE F
SY 568.00
69 09403 809003M STRAW MULCHING SY 5,676.00