Embed Size (px)
Citation preview

Environmental Life Cycle Criteria for Making Decisions about
Green versus Toxic Propellant Selections
by Christyl C. Johnson
B.S. in Physics, May 1987
M.S. in Electrical Engineering, August 1990
A Dissertation Submitted to the Faculty of
The School of Engineering and Applied Science
of The George Washington University
in partial satisfaction of the requirements
for the degree of Doctor of Philosophy
January 31, 2012
Dissertation directed by
Michael Duffey
Associate Professor of Engineering Management and Systems Engineering

ii
The School of Engineering and Applied Science of The George Washington University
certifies that Christyl Chamblee Johnson has passed the Final Examination for the degree
of Doctor of Science as of December 9, 2011. This is the final and approved form of the
dissertation.
Environmental Life Cycle Criteria for Making Decisions about Green
Versus Toxic Propellant Selections
Christyl C. Johnson
Dissertation Research Committee:
Michael Duffey, Professor of Engineering and Applied Science, Dissertation Director
E. Lyle Murphree, Professor of Engineering Management and Systems Engineering,
Examining Committee Chair
Jonathan Deason, Professor of Engineering and Applied Science, Committee Member
Gregory Shaw, Associate Professor of Engineering Management and Systems
Engineering, Committee Member
Woodrow Whitlow, Associate Administrator, Mission Support Directorate, NASA
Headquarters, Committee Member
Michael Ryschkewitsch, NASA Chief Engineer, NASA Headquarters, Committee
Member

iii
ACKNOWLEDGEMENTS
I would first like to thank Dr. Michael Duffey for his invaluable guidance, direction, and
assistance throughout this process. Dr. Duffey, you are the best advisor that I could have
ever had for this research, and all of your efforts are much appreciated!
Next, I would like to say a heartfelt thanks to Shanessa Jackson for her many invaluable
contributions in many areas along the way. Your countless hours spent and tireless
support has meant the world to me!! Along these same lines, I must thank Dr. Michael
Griffin and Dr. Woodrow Whitlow, who have been supporting me on this research and in
my career for many years now. Thank you again for all that you have done!!
I wish to say a heartfelt thanks to my colleagues at ECAPS (Mathias Persson, Aaron
Dinardi, and Kjell Anflo), who were instrumental in providing important pieces of the
data set used in this research. I also wish to thank my colleagues at FOI in Sweden
(Helena Bergman, Niklas Wingborg, and John de Flon) for our collaborative efforts in
this area over the years. This research would not have been possible without their
contributions.
I would also like to say thank you to my wonderful team at Goddard Space Flight Center
for their support and contributions. Kris Romig, Caitlyn Bacha, Nona Cheeks, Rich
Barney, and Dennis Andruczyk. A special thanks goes to Kris Romig for his
contributions in gathering critical pieces of data for this research. From Goddard’s

iv
Wallops Flight Facility I would like to thank Jay Pittman, Joel Simpson, and Steve
Nelson for their contributions from a range and operations perspective. I would also like
to thank Kimberly Guodace and Richard Keinath for hosting my visit to Kennedy Space
Flight Center, and for providing valuable data used in this research.
I would like to say a special thank you to Jim Farrugia of the Gelman Library at George
Washington University for his enthusiastic and helpful assistance during the literature
search phase of my research. I would also like to thank Michelle Mazzuchi for all of her
help in getting all of the department requirements cleared for this dissertation.
Last, but certainly not least, I would like to thank my family and close friends for all of
their love and support throughout this process. Special thanks go to my husband, Darryl
Johnson; my son, Jerrin Johnson; my father, Sannie Chamblee; my mother, Martha
Chamblee; my brother, Tony Chamblee; my father-in-law, Howard Johnson; my mother-
in-law, Fraitus Johnson; and my close friend, Antoinette Bishop, who never let me slow
down for a minute. Having this support network throughout this journey has been
invaluable to me. Thank you all!! I love you all!!

v
ABSTRACT
Environmental Life Cycle Criteria for Making Decisions about Green versus Toxic
Propellant Selections
Large uncertainties of performance and expense have been an on-going deterrent to
serious consideration of less-toxic green propellants as alternatives to hydrazine for
aerospace propulsion systems. Although candidate propellants may equal or even surpass
the performance of current propellants, with environmental benefits that have been
documented, life cycle trade analyses performed to date have not provided a sufficient
business case for investment in such a significant infrastructural change. These analyses
have been incomplete - typically focused on broad cost, performance, and risk
characteristics, and have not taken into account the comparative costs associated with the
environmental impacts of the alternatives. Environmental life cycle costs must be
included in the analyses in order to understand the true costs incurred.
This research defines a set of environmental components to serve as criteria in life cycle
cost analyses for propellant selection decisions. Based upon information gathered during
visits to facilities responsible for each phase of the propellant life cycle, a detailed
compilation of the environmental life cycle processes and related costs was constructed,
including manufacturing and storage; general safety considerations; site control and
access; air monitoring; personal protective equipment (PPE); decontamination
procedures; transportation by rail, sea, air, and public highway; operations and
maintenance; and end of life disposal.

vi
Lending credence to the significance of the identified costs, a case study approach was
implemented as a way to examine these environmental cost factors using real data. The
case study for this effort was the PRISMA mission, which provided a one-to-one
comparison between the baseline hydrazine to a High Performance Green Propellant
(HPGP) system. This case study revealed a significant reduction in costs (~$500K)
during only one phase of the mission life cycle (a 2/3 reduction from the baseline
hydrazine system).
This analysis resulted in a sample model utilizing the significant cost factors previously
identified that should be included in future total life cycle cost analyses. These cost
categories (broken into operational cost and capital cost) should be identified for both the
baseline option and the alternative option over the expected life of the propellant. The
methodology best suited for incorporation of these identified environmental costs for
decision-making is a customized cost-benefit analysis (CBA). This research has indicated
that the biggest environmental cost drivers over the life cycle of the propellant are facility
operations and maintenance, end of life disposal, and transportation. The costs associated
with health and human safety protection while operating with hazardous materials are
major cost drivers for propellant selection and present significant direct, indirect, and
capital costs over the life of the propellant. These costs are critical, and must be included
in the analyses for informed decision-making.
When environmental costs are included in the analysis, one can potentially bridge the gap
between traditional investment and return on investment models in a timeframe that can
be acceptable to investment decision-makers.

vii
TABLE OF CONTENTS
ACKNOWLEDGEMENTS ............................................................................................... iii
ABSTRACT ........................................................................................................................ v
LIST OF FIGURES ............................................................................................................ x
LIST OF TABLES ............................................................................................................ xii
INTRODUCTION .............................................................................................................. 1
1.1. Background and Statement of the Problem .......................................................... 1
1.2. Objective of the Proposed Research ..................................................................... 4
1.3. Significance of the Proposed Research ................................................................ 4
1.4. Scope and Limitations .......................................................................................... 5
LITERATURE REVIEW ................................................................................................... 6
2.1. Life Cycle Cost Analysis...................................................................................... 6
2.2. Basic Tools Currently in Use ............................................................................... 8
2.2.1 Life Cycle Cost (LCC) Expanded .................................................................9
2.2.2 Cost Benefit Analysis (CBA) Expanded .....................................................12
2.2.3 Life Cycle Assessment (LCA) Expanded ...................................................15
2.3. Current Guidelines, Regulations, and Policies ................................................... 17
2.4. Current Industry Approaches for Incorporating Environmental Costs into Life
Cycle Cost Analysis ........................................................................................... 21
2.4.1 Transportation Industries .............................................................................21
2.4.2 Sustainable Buildings Industry ....................................................................29
2.4.3 Space Industry for Launch Systems ............................................................34
METHODOLOGY ........................................................................................................... 38
3.1. Proposed Methodology for Identifying Environmental Unaccounted for Costs
that Should be Included in Life Cycle Cost Analysis for Propellant Selection
Decisions ............................................................................................................ 38

viii
3.2. Proposed Methodology for Future Life Cycle Cost Analyses ........................... 40
3.3. Research Methodology ....................................................................................... 42
OBSERVATIONS, FINDINGS AND RESULTS ........................................................... 45
4.1. Site Visit Observations ....................................................................................... 45
4.2. Summary of Environmental Unaccounted for Cost Factors Over all Phases of
the Life Cycle of the Propellants Under Consideration ..................................... 48
4.2.1 Manufacturing and Storage .........................................................................56
4.2.1.1 General Safety Considerations ................................................................ 56
4.2.1.2 Site Control and Access .......................................................................... 59
4.2.1.3 Air Monitoring ........................................................................................ 60
4.2.1.4 Personal Protective Equipment (PPE) ..................................................... 62
4.2.1.5 Decontamination Procedures................................................................... 63
4.2.1.6 Storage ..................................................................................................... 64
4.2.2 Transportation .............................................................................................65
4.2.2.1 Land: Rail ................................................................................................ 68
4.2.2.2 Sea ........................................................................................................... 70
4.2.2.3 Air............................................................................................................ 71
4.2.2.4 Land: Public Highways ........................................................................... 72
4.2.3 Operations and Maintenance .......................................................................72
4.2.4 End of Life Disposal ....................................................................................74
4.3. Identification of Significant Cost Drivers .......................................................... 77
4.4. Application of Cost Factors to Life Cycle Analysis Tools ................................ 78
CASE STUDY – PRISMA MISSION .............................................................................. 81
5.1. Test Case Study Comparing Actual Flight of Hydrazine System versus a
―Green‖ Ammonium Dinitramide System ......................................................... 81
5.1.1 Background and Mission Description .........................................................82
5.1.2 Transportation of Propellant ........................................................................84
5.1.3 Handling and Operations During Launch Campaign ..................................85

ix
5.1.4 Assessment of Quantifiable Internal Costs: Comparison of
Hydrazine to HPGP .....................................................................................88
CONCLUSIONS............................................................................................................... 90
6.1. Summary of Findings ......................................................................................... 90
6.2. Recommendations and Future Work .................................................................. 92
Bibliography ..................................................................................................................... 97

x
LIST OF FIGURES
Figure 2.1-1: Life Cycle Analysis Phases: Each phase is evaluated in terms of safety
implications, environmental impacts, and economic development .................................... 7
Figure 2.1-2: Inputs and Outputs to be considered in Life Cycle Cost Analysis
(Environmental Protection Agency (EPA) 2006) ............................................................... 8
Figure 2.4.1-1: Impact Pathway Approach, (European Commission, 2003) ................... 24
Figure 2.4.1-2: Costs of Air Pollution Associated with Urban Passenger Transportation
........................................................................................................................................... 25
Figure 2.4.1-3: Costs of Air Pollution Associated with Rural Passenger Transportation,
(European Commission, 2003) ......................................................................................... 26
Figure 2.4.1-4: Quantifiable Costs Associated with 4 Modes of Transportation in
Germany, (European Commission, 2003) ........................................................................ 26
Figure 2.4.1-5: Life Cycle Stages for Transportation Fuels (Xiaoyu Yan, 2009) ........... 27
Figure 2.4.1-6: Global Greenhouse Gas Emissions in 2004, (International Civil Aviation
Organization, Air Transport Bureau (ATB) 2009) ........................................................... 29
Figure 2.4.2-1: Financial Benefits of Green Buildings, (Kats, et. al., 2003) ................... 31
Figure 2.4.2-2: Relational Costs of Employees to Other Building Costs in California
(Kats, et. al., 2003) ............................................................................................................ 32
Figure 2.4.2-3: Potential Productivity Gains from Enhanced Indoor Environments (Kats,
et. al., 2003) ...................................................................................................................... 34
Figure 4.1-1: Hot-Fire Ground Test Facility Site Visit in Gindsjon, Sweden ................. 47
Figure 4.1-2: Site Visit to Eurenco - Manufacturing Plant for Green Propellants .......... 48
Figure 5.1.1-1: PRISMA Mission Logo and Launch Vehicle (Dinardi, High Performance
Green Propulsion (HPGP) On-Oribit Validation & Ongoing Development 2011) .......... 83
Figure 5.1.1-2: Prisma Main Spacecraft Propulsion System with a Hydrazine Tank ..... 83
Figure 5.1.2-1: PRISMA HPGP Transportation .............................................................. 84

xi
Figure 5.1.3-1: Personal Protection Equipment - HPGP vs Hydrazine (Dinardi, High
Performance Green Propulsion (HPGP) On-Oribit Validation & Ongoing Development
2011) ................................................................................................................................. 86
Figure 5.1.3-2: Launch Campaign Fueling Timeline (ECAPS Corporation 2011) ......... 87
Figure 5.1.3-3 Environmental Wastes from the Launch Campaign (ECAPS Corporation
2011) ................................................................................................................................. 88
Figure 6.2-1: Logic Model Discussion for Selection of Future Propellants .................... 93

xii
LIST OF TABLES
Table 2.4.1-1: Health and Environmental Effects (European Commission, 2003) ......... 23
Table 4.2-1: Summary of Environmental Cost Factors ................................................... 49
Table 4.2-2: Environmental Unaccounted for Life Cycle Cost Element Comparison of
Hydrazine to HPGP........................................................................................................... 53
Table 4.2.2-1: CFR for Transportation of Hazardous Materials (Hydrazine and ADN) . 66
Table 4.4-1: Template for Application of Environmental Cost Factors in Analysis ....... 79
Table 5.1.4-1: Comparison for Prisma HPGP vs Hydrazine (Dinardi and ECAPS
Corporation, Site Visit Interviews and Data Provided by ECAPS Subject Matter Experts
2011) ................................................................................................................................. 89

1
INTRODUCTION
1.1. Background and Statement of the Problem
In an environment where budgets are becoming more and more
constrained, it has become increasingly important for federal agencies to find
efficient ways to reduce the costs associated with every aspect of achieving their
missions. In order for entities (both public and private) within the space
community to deliver technologies required to reach the destinations of the future
(like near-earth asteroids, Mars, and other celestial bodies), our nation must find
creative ways to deliver innovative technologies with a watchful eye on
minimizing costs along the way. Decision-makers must evaluate costs over the
full life cycle of the options under consideration in order to make informed
decisions about whether or not to introduce new technologies, systems, or
approaches.
Over the past 50 years, the U.S. and foreign launch systems in the public
domain have used ammonium perchlorate (AP) and hydrazine as the preferred
propellants for their solid and liquid propulsion systems. These propellants have
been known to provide outstanding performance and reliability. Unfortunately,
this remarkable performance comes with a significant trade-off in risk and
―hidden‖ costs as it relates to hazards to humans and the environment in the
manufacturing, storage, transportation, operations, and disposal of these toxic
materials. Many of these ―hidden‖ costs stem from the strict regulations that
govern safe handling of hazardous and carcinogenic materials. As the space

2
community develops new technologies to meet the needs of the next generation of
launch vehicles and spacecraft, the international community and government
entities are demanding that the environmental impact of industrial processes,
including launch vehicle and spacecraft processes be included in the overall cost
analyses.
Since AP contains chlorine, for example, it produces significant amounts
of hydrochloric acid during the combustion process. This hydrochloric acid,
when released into the atmosphere, has been known to have negative effects on
the environment (U.S. Environmental Protection Agency 2007). In addition, a
hypergolic propellant like hydrazine can present a serious danger to humans in the
event of a catastrophic failure, as witnessed during the Columbia accident in 2003
when the presence of this hazardous material impeded the debris recovery efforts,
and could have caused harm to citizens who may have come into contact with it.
(NASA CAIB 2003). In addition to the hazards associated with these toxic
propellants, their use precludes the kind of extended missions that are anticipated
to be prominent features of the nation’s future space exploration policy. Since
one cannot design a propulsion system large enough to store adequate amounts of
propellant to launch, perform exploration and rendezvous missions, and return
safely to Earth, the propellant of choice must be one that can be replenished while
on the surface of the Moon, Mars, an asteroid, or other destination. It must be
naturally occurring in that habitat, like oxygen or hydrogen.
With these anticipated requirements mandated for future missions,
decision-makers must decide when and how to make a wholesale investment in

3
―green‖ propellant technologies. For the purpose of this research, ―green‖
propellants are defined as those exhibiting the following characteristics: 1) low
toxicity, 2) non-carcinogenic, and 3) environmentally benign. Many candidate
―green‖ propellants have been investigated for potential replacement of the
hazardous propellants. One such propellant that has shown great promise is
ammonium dinitramide, or ADN. Its chemical composition is NH4N(NO2)2,
which has as base elements hydrogen, nitrogen, and oxygen. ADN contains no
chlorine, therefore hydrochloric acid is not produced during combustion, and its
Swedish manufacturers have claimed that ADN production does not require any
toxic materials. Other attractive features include its ability to easily be extracted
into water, which makes it suitable for water washout and easy ingredient
recovery; simple venues for destruction, as it is easily converted to the fertilizer
ammonium nitrate; and very attractive performance and ballistic characteristics
(Thiokol Chemical Corp Brigham City, UT 1998).
As the space industry performs trade studies to evaluate these new green
propellants in comparison to the current toxic ones, and aims to propose these
new technologies for new missions or flights of opportunity, they are required to
provide the costs associated with implementing these technologies over their
entire life. Unfortunately, to date, life cycle cost analyses have omitted the costs
associated with the environmental impacts for both the current propellants and the
proposed green propellants. The omission of these costs discounts significant
costs incurred in all phases of the life cycle, and has made the introduction of new
propellants prohibitive, as the business case has not been closed to transition to

4
the new green propellants. Decision-makers in this area have been put in the
position to make decisions based upon incomplete, and thus inaccurate, data.
1.2. Objective of the Proposed Research
The purpose of this research is to define a set of environmental factors that
could be added to the decision criteria used to perform trade analysis for propellant
selection decisions. Past studies that explored transitioning from toxic propellants
like AP and hydrazine to green propellants typically focused on economic,
performance, and risk characteristics, and did not account for many of the ―hidden‖
costs incurred. Because of this incomplete methodology, the National Aeronautics
and Space Administration (NASA) has previously been unable to close the business
case for committing to large-scale investments in green propellant technologies. It is
the intent of this research to bring many of these ―hidden‖ costs to light, and provide
the space research and development community with decision criteria that will reflect
a more accurate account of the costs that must be considered throughout the life
cycle. When environmental costs are included in the analysis, one can potentially
bridge the gap between traditional investment and return on investment models in a
timeframe that can be acceptable to the investment decision-makers.
1.3. Significance of the Proposed Research
There is significant interest by the United States Department of Defense,
NASA and their industry partners in technologies that open the door for future
capabilities for our nation. The research being proposed here can have a significant
5
impact on the US capability to develop lower cost green launch systems. In order for
the community to take advantage of new technologies and capabilities, it must use a
research methodology that accurately reflects life cycle costs to guide these important
decisions. Without a more comprehensive cost accounting methodology to judge
propellant scenarios, it is difficult to demonstrate the holistic benefit of green
propellants. Since the assessment of the costs associated with a transition to those
new technologies has been a deterrent in past studies, the light shed upon the analysis
from this different vantage point may support and perhaps even spur innovation in
this area. When environmental costs are coupled with the economic and risk costs,
one can more easily identify and address environmental constraints that prohibit
growth and development, and allow for the development of sustainable propulsion
systems for the future.
1.4. Scope and Limitations
The research conducted here focuses strictly on liquid propellants, assuming
the use of Anhydrous Hydrazine monopropellant as a baseline, and provides no
comparison consideration for Monomethyl Hydrazine (MMH) for bipropellant use.
This research was conducted with careful consideration of the fact that
generally in the space community, trade studies must be conducted with limited
resources in a relatively short period of time (on an average completed within 90
days). In order for environmental elements to be included in the studies, there must
be a set of criteria that can be readily documented and quantified. With this in mind,
those environmental cost elements that are difficult to quantify, and require exercises
to value impacts like health risks via surveys, etc. were not considered when

6
establishing the baseline environmental cost factors to be included in future
propellant trade analyses.
Costs associated with the identified environmental cost factors were included
when available, but many of these costs were not identified during this investigation.
These remaining unidentified costs can and should be requested from those
performing future trade studies; the current academic investigation was unable to
provide financial resources for the data to be mined and included in this research.
LITERATURE REVIEW
2.1. Life Cycle Cost Analysis
The term ―life cycle‖ refers to the major activities over the course of the
product’s life-span from its manufacture, including the raw material acquisition, use,
maintenance, and its final disposal. The life cycle analysis performed in this research
provides a means for one to understand the cumulative effect of all of the impacts of
each stage in the material’s life cycle, and includes environmental impacts that are
often not addressed in traditional life cycle estimations (i.e. environmental effects,
―hidden‖ operational costs, and end-of –life disposal), but represent an actual cost that
must be accounted for (Environmental Protection Agency (EPA) 2006). This type of
analysis can provide a more accurate representation of the true human health and
environmental impacts associated with a product, system, or process, and will better
inform the decision-maker of the cost trade-offs in product and process selection.

7
Life cycle analysis is often called a ―cradle-to-grave‖ approach for assessing
any system or its components. Cradle-to-grave begins with the gathering of raw
materials from the earth to create the product and ends at the point when all materials
are completely consumed or returned to the earth (See Figure 2.1-1 below)
(Environmental Protection Agency (EPA) 2006).
Figure 2.2.1-1: Life Cycle Analysis Phases: Each phase is evaluated in terms of safety implications,
environmental impacts, and economic development
It is important to recognize and understand how each choice influences what
happens during these stages so that a decision-maker can balance trade-offs and
positively impact the environment, the economy, and society. Each decision will have
input requirements and associated outputs that must be accounted for in the cost analysis
(See Figure 2.2.1-2 below).
Raw Material Production
Manufacturing Distribution Use/OperationsEnd of Life Recovery
Management
Life Cycle Analysis Phases

8
Figure 2.2.1-2: Inputs and Outputs to be considered in Life Cycle Cost Analysis (Environmental Protection
Agency (EPA) 2006)
2.2. Basic Tools Currently in Use
The public body of literature contains large volumes of information about the
topics of life cycle costing and life cycle analysis. In general, when conducting an
analysis of the cost over the life of a product or system, life cycle costing (LCC), cost
benefit analysis (CBA), and life cycle assessment (LCA) are the tools most
commonly used. LCC models generally have an economic focus, with budget
allocation and business performance as key indicators. A CBA model also has an
economic focus, but it includes the social benefits of the proposed options in
monetary terms, and provides a means to weigh those benefits against the costs. An
LCA model is a methodology used to evaluate the detailed cumulative environmental
performance or effects of a system (Huppes 2004).
LCCs are used broadly across the federal government, and are required for
military and other federal government acquisitions, software development, materials
9
systems, flight systems, energy management systems, and a large array of other
applications. LCCs are also used broadly in public industry during green building
design, automobile and other vehicle production, fuel production, and many other
areas. Although LCCs have been broadly used to understand conventional costs, the
application of environmental components to elements of cost is not advanced enough
for the community to have a commonly accepted methodology for estimating these
values to be included in the models (Steen 2005). This makes extending the LCC
analysis to a CBA more difficult because one must not only determine the
conventional and environmental elements of cost for the model; but also include
social benefits in monetary terms, and then aggregate the costs in a meaningful way.
LCAs can be much more complex than LCCs and CBAs, as they require the
modeler to take inventory of the entire system to quantify as much as is feasible,
including burdens (i.e. individual pollutant emissions), impacts, and their monetized
values; and to use multi-criteria analysis to quantify those impacts that are too
uncertain or do not easily allow quantification by monetization (Rabl 2008).
2.2.1 Life Cycle Cost (LCC) Expanded
Life cycle cost has historically been, and continues to be, the methodology
by which Federal agencies normalize the cost of procurements throughout the
usable life of the product. The intent behind this methodology is to ensure that
operating costs of new acquisitions are clearly identified to assist agencies in
optimizing procurement strategies and choosing the option that provides the
lowest cost of ownership over the life cycle. Typically, an analysis of life cycle
cost accounts for all the costs associated with the acquisition, operation,

10
maintenance and repair, replacement, and retiring/salvage of a particular product,
whether it is a building, machinery, or an operating system such as a hydro-
electric power plant. To conduct a complete life cycle cost analysis requires that
the variables and inputs are normalized to a common point, usually in present
value of money, with out-year cost returned to present value via a predetermined
discount rate. A good LCC model would then demonstrate values in present
value with the capability to demonstrate future value and cost.
As stated in a 2007 update of life cycle cost models and processes for the
State of Washington, as part of the process of making capital investment
decisions, a commonly recognized component is a present value life cycle cost
analysis. For assets like facilities, a ―same-year dollar basis‖ comparison of all
costs related to quantifiable capital and operations as well as an estimation of
those costs over the life of the facility can be addressed in the life cycle cost
analysis. The costs included in the analysis are for planning (the purchase of land,
existing facilities, or leasing agreements), development (construction), operations
(maintenance, equipment and staffing), and management (project management,
staffing). When considering the development of a new facility and/or the adaption
of existing facilities in part or full, accounting for all potential costs and benefits
in the analysis will allow decision-makers to determine the most economical
choice among various possibilities (Joint Legislative Audit and Review
Committee 2007). In order to calculate the total life cycle cost of a project, one
must sum each of the identified costs, and then subtract any elements that would
constitute a positive cash flow such as a salvage or resale value:

11
Life-cycle cost = first cost + maintenance and repair + energy + water
+ replacement - salvage value (Fuller 2005)
In practice, the following formula is frequently used:
LCC = C + Mpw + E pw + R pw - S pw , where the subscript, pw, denotes the present
worth using a preapproved discount rate (Hestermannm n.d.). The discount rate is
sensitive and therefore set prior to calculation to prevent manipulation of the
outcome. Depending on project complexity, additional parameters can be added
to the calculation to increase fidelity.
a. (C) is the capital cost, which would include the initial expenses for the
system design, engineering, equipment, and installation. This cost is
always considered as a single payment occurring in the initial year of the
project, regardless of how the project is financed (Hestermannm n.d.).
b. (M) is the sum of all yearly scheduled operation and maintenance (O&M)
costs. O&M costs include such items as an operator's salary, inspections,
insurance, property tax, and all scheduled maintenance (Hestermannm
n.d.).
c. (E) is the energy cost, which is simply the sum of the annual fuel costs.
Energy cost is calculated separately from operation and maintenance costs,
so that differential fuel inflation rates may be used (Hestermannm n.d.).
d. (R) captures the replacement costs, and is the sum of all anticipated repair
and equipment replacement costs over the life of the system
(Hestermannm n.d.).
e. (S) is the salvage value of the system, which is its value at the end of its
usable life (Hestermannm n.d.).
Future costs must be discounted so that they take into consideration the
time value of money. In many business decisions, a selection is made primarily
12
based upon the procurement costs. When an LCC analysis is conducted, the
decision-maker is provided with the additional benefit of knowing whether or not
the potential operational savings are enough to justify the initial investment costs.
Life cycle cost models are viable tools for accounting for actual or conventional
budgetary and economic costs, but do not function well when additional or non-
traditional activities are being evaluated (H. Paul Barringer 2003).
2.2.2 Cost Benefit Analysis (CBA) Expanded
Cost-benefit analysis (CBA) is a method for quantifying costs and
benefits of a course of action, program, or project, and those of its alternatives, to
provide a procedure for a single scale of comparison for unbiased evaluation.
Though primarily used in financial analysis, CBAs are not limited to monetary
considerations like LCCs. They often include those environmental and social
costs and benefits that can be reasonably quantified. CBAs provide an analytical
way to make decisions about issues that are more difficult to quantify such as
education, health care, transportation, or the environment. The key component
for developing a CBA is quantifying the status quo (current actual cost over the
evaluated time) of a particular action. All other alternatives are then evaluated
against the existing action. After one defines what is considered to be a ―benefit‖
for the analysis, and the relevant time is established, benefits and costs can be
estimated and modeled. For example, in some studies a benefit is defined as
something that promotes or adds to human well-being, whereas a cost is
considered to be something that diminishes it. As described above for life cycle
cost analysis, the present value of both current and future costs and benefits must
13
be considered. One must consider that the money spent today will not have the
same value in the future, as inflation will decrease the value if expressed in future
terms. In order to compensate for these changes in value, one must discount the
future costs and benefits. The determination of the value for the discount rates
and future values used for CBA must be based on a coherent set of circumstances
that are established from the beginning, or the outcome can be significantly
skewed (Environmental Literacy Council 2008).
In many policy considerations, decision-makers may determine that they
will measure as benefits parameters like increased personal income, improved
quality of life, or improvements in the quality of air that we breathe. On the other
hand, costs may be identified as missed opportunities; costs that are easily
identified and explained (internal costs); and external costs that are typically hard
to quantify – i.e. end of life disposal; environmental impact due to wastes,
emissions, and pollutants; or the cost of health problems that result from
hazardous or toxic products. Although these external costs are not typically
included in the prices that are paid for products, the cost is still paid by society in
taxes, compensation dispensed for accidents, payments for insurance and medical
fees, and even through reduced environmental quality for future generations
(Econation 2010). These external costs (and sometimes benefits) are considered
to be externalities, and they are usually imposed upon parties that did not
contribute to the action causing the benefit or cost (Ozkan 2008) (tutor2u n.d.).
In practice, a CBA is performed in stages: 1) definition of the project, 2)
identification of the project impacts, 3) determination of which impacts are

14
economically relevant, 4) quantification of the relevant impacts, 5) monetization
of relevant effects, and 6) determination of discounting for cost and benefit flows
(Hanley and Splash 2003). In any CBA, there must be a common measurement
unit established for costs and benefits. The most convenient unit is money, so
benefits and costs of alternatives must be expressed in terms of equivalent
monetary value and must account for the time value of money (including
inflation) (Watkins n.d.). Once the common measure has been established, one
can compare and evaluate options to find an optimal solution. In economics, the
ideal solution would be what is called a Pareto improvement, in which a change
from the baseline scenario to an alternative scenario would make at least one
improvement to an individual or a system without negatively affecting another
individual or diminishing another part of the system. While the ideal solution is
desirable, it is often impractical or impossible. A more commonly applied
measure of economic efficiency is the Kaldor-Hicks efficiency (Reckon, LLP
2009) Utilizing the Kaldor-Hicks theory, there will be individuals/systems that
are both made better and worse by going from the baseline to an alternate
scenario; however, the ones that are improved would in theory compensate those
that are diminished (Environmental Literacy Council 2008). An example of such
a scenario would be a new air transportation vehicle that permits customers to
travel from Washington, DC to Los Angeles in two hours instead of the typical
five-hour flight. This new capability would provide improvements for both the
provider and the customers, but it would release toxic pollutants into the air.
Under the Kaldor-Hicks theory, the producers and customers would still be

15
willing to proceed with this new capability even if it required compensation to the
victims of that pollution. A Kaldor-Hicks solution only provides a mechanism for
possible compensation, but does not require that the parties carry it out.
Therefore, in contrast to the Pareto improvement, a Kaldor-Hicks improvement
may result in a scenario where not every party is better off – in fact, some parties
could be affected negatively (Stringham 2001)
2.2.3 Life Cycle Assessment (LCA) Expanded
As society becomes increasingly aware and concerned about the
environment and the depletion of natural resources, businesses and industries are
increasingly motivated to assess the effects that their activities are having on the
environment. In many industries, businesses are committing to developing and
using more environmentally friendly products and processes. With the wealth of
current legislation that sets expectations in this area, many businesses seek to
exceed the compliance expectations, and are implementing pollution prevention
strategies and environmental management systems. The life cycle assessment is
one such environmental management system tool (Environmental Protection
Agency (EPA) 2006).
Life cycle assessments first address the capture and collection of the raw
materials required to create a product, and conclude with analysis of the
consumption of the product or its return to the earth. Each stage in the LCA is
dependent upon the others, so the LCA must estimate a cumulative environmental
impact – including those impacts that are generally not included in traditional life

16
cycle cost analyses (i.e. extraction of the raw materials, transportation of the
product materials, and end of life disposal). The LCA technique, which can be
very effective in assessing the environmental effects and potential impacts of a
product, system, process or service, is a systematic process with four components.
The first step is to define the goal and scope of the product, system, process or
service. This step enables the assessor to establish the context for the analysis,
clearly identify which environmental effects are to be reviewed, and establish the
boundaries for the assessment. The second step is to perform an inventory
analysis, which develops a compilation of material and energy inputs and
environmental releases that are relevant to the assessment. This compilation
would include things like solid waste disposal, airborne emissions, waste effluents
that are discharged into water, and other inputs. The third step is to perform an
impact assessment, which would determine the potential ecological and human
effects of the inputs and releases identified in the inventory analysis. The fourth
step is to interpret the results of the inventory and impact assessment to determine
the preferred product, system, process or service, clearly understanding the
assumptions incorporated into the assessments of the previous steps
(Environmental Protection Agency (EPA) 2006).
An LCA provides the decision-maker with the information necessary to
determine which product, system, process or service has the least effect on the
environment. LCAs are instrumental in preventing a decision that shifts
environmental problems from one part of the system to another or from one stage
in the life cycle to another. Since an LCA does not provide a solution regarding

17
the most cost-effective or best-performing product, system, process or service, it
should be combined with cost and performance data to reach a final conclusion.
Although LCAs are effective, they are costly in terms of time and resources. The
data required to perform a comprehensive LCA can be difficult to obtain, as
multiple business practices from diverse industries must be evaluated. The
availability and accuracy of the data can significantly affect the final results.
Because of these constraints and complexities, LCAs are conducted in one of
three levels. A comprehensive LCA is considered to be a Level 1 LCA, in which
the data quality requirements, complexity of system boundaries, and completeness
of the inventory analysis components meet the most stringent requirements of
strict legislation, like the Energy Independence and Security Act of 2007. A level
2 LCA, which is also called a standard LCA, evaluates all of the major component
operations, but with a less comprehensive inventory analysis and lower data
quality requirements. The level 3 LCA, or the screening LCA, has the least
degree of analysis complexity, data quality, and completeness of the inventory
analysis, but it can be very useful for taking a ―quick look‖ or preliminary
assessment of one or more technology alternatives being considered, or to inform
research funding decisions (Allen, et al. 2009).
2.3. Current Guidelines, Regulations, and Policies
There are dozens of guidelines and policies that require federal agencies to
perform life cycle cost analysis in order to make well-informed decisions about the
efficient allocation of resources. Executive Order 13514, Federal Leadership in
Environmental, Energy, and Economic Performance, was created to encourage

18
federal government agencies to lead by example with regards to promoting energy
security, protecting the environment, and protecting the interests of taxpayers. This
Executive Order outlines the United States policy that ―Federal agencies shall
increase energy efficiency; measure, report, and reduce their greenhouse gas
emissions from direct and indirect activities; conserve and protect water resources
through efficiency, reuse, and storm-water management; eliminate waste, recycle,
and prevent pollution; leverage agency acquisitions to foster markets for sustainable
technologies and environmentally preferable materials, products, and services;
design, construct, maintain, and operate high performance sustainable buildings in
sustainable locations; strengthen the vitality and livability of the communities in
which Federal facilities are located; and inform Federal employees about and
involve them in the achievement of these goals.‖ In order to achieve this objective,
agencies are expected to prioritize their decisions and actions based upon a complete
accounting of the economic, social and environmental benefits and costs, resulting
from a life cycle return on investment analysis. This Executive Order only requires
that a life cycle calculation be performed – it does not provide guidance regarding the
mechanism or methodology for the calculations (The President of the United States
2009).
Similarly, the Code of Federal Regulations (CFR), 10 CFR Part 436: ―Federal
Energy Management and Planning Programs‖ establishes rules and standards to
promote a reduction in energy consumption for energy management and planning
programs, and to promote the most cost effective investments in energy and water
systems for buildings and water conservation measures for federal buildings. This

19
document requires agencies to determine the cost-effectiveness of a project over its
life cycle, provides guidance regarding the methodology and procedures for
calculating and comparing the life cycle costs of Federal buildings, presents a
mechanism for determining the cost effectiveness of energy and water conservation
methods, and establishes a method for ranking alternatives for designing new
buildings or retrofitting existing buildings based upon life cycle costs. 10 CFR 436
makes reference to the ―Life Cycle Costing Manual for the Federal Energy
Management Program” (NIST 85-3273), which expands on the life cycle cost criteria
and techniques described in 10 CFR 436. This manual defines how economic
performance can be measured, outlines how assumptions should be handled, and
describes which procedures should be followed in performing life cycle cost
evaluations (GPO Home Page n.d.).
As a companion to 10 CFR 436, and NIST 8-3273, President William Clinton
released ―Executive Order 13123: Greening the Government through Efficient
Energy Management,‖ which required that ―Agencies shall use life-cycle cost analysis
in making decisions about investments in products, services, construction, and other
projects to lower the Federal Government’s costs and to reduce energy and water
consumption…‖ The Office of Energy Efficiency and Renewable Energy in the U.S.
Department of Energy subsequently published guidance documents for federal
agencies to facilitate implementation of this Executive Order. The implementation
guidance provides clarification on how federal agencies should determine life cycle
costs for the investments required by the Executive Order, including guidelines for
comparing different energy and fuel alternatives and assessing the current tools for

20
performing this analysis. Executive Order 13123 also specifically recommends the
use of life cycle cost analysis (LCCA), which evaluates all costs of ownership,
operations, maintenance, and disposal over the life of the product or system (U.S.
Department of Energy; Office of Energy Efficiency and Renewable Energy; Federal
Energy Management Program 2003).
Another piece of important legislation is the ―Energy Independence and Security
Act of 2007”. This act was established with the intent to facilitate the United States’
movement toward greater energy independence and security by encouraging the
production of more clean, renewable fuels, by increasing the efficiency of U.S.
products, buildings, and vehicles, and by promoting more research and development
on greenhouse gas capture and storage technologies. This legislation specifically
calls for life-cycle assessments and life-cycle costing, with some specific guidelines,
to be performed for investment decisions (Congress 2007).
A number of the guidelines require specific agencies to develop a
methodology to determine the life cycle costs and cost benefits. However, when
different agencies perform this analysis using different inputs, parameters, and
assumptions, it is nearly impossible to compare projects or systems among the
agencies. In order to address the need for uniform guidance, the White House Office
of Management and Budget (OMB) released OMB Circular No. A-94, ―Guidelines
and Discount Rates for Benefit-Cost Analysis of Federal Programs.‖ This circular
provides a general roadmap for federal agencies to conduct the cost-benefit and cost-
effectiveness analyses. Although it does specifically exempt decisions concerning
things like water resource projects, the acquisition of commercial services, or energy

21
management programs (guidance for these is provided in the ―Economic and
Environmental Principles and Guidelines for Water and Related Land Resources
Implementation Studies,‖ OMB Circular No. A-76, and the Federal Register of
January 25, 1990 respectively), the circular does provide baseline guidance and can
serve as a checklist for agencies to ensure adequate inclusion of all elements required
for sound cost-benefit analyses (The White House 1992).
Circular A-94 makes a distinction between performing a benefit-cost analysis
and a cost-effectiveness analysis. The benefit-cost analysis is the recommended
technique for formal economic analysis. A cost-effectiveness analysis is permitted
when it has been determined that the benefits of competing options are the same,
when a policy requires that the benefits must be provided, or when it is not necessary
or practical to consider the monetary value of the benefits under consideration. The
circular establishes the net present value as the standard criterion that agencies should
use to determine whether a program can be justified based upon economic principles.
It also provides guidance on outcome measures, elements that should be added into
the benefit-cost analysis, identification and measurement of the benefits and costs to
be considered, treatment of inflation in the analysis, establishment of the discount
rate, and treatment of uncertainties (The White House 1992).
2.4. Current Industry Approaches for Incorporating Environmental Costs into
Life Cycle Cost Analysis
2.4.1 Transportation Industries
The European Commission has sponsored a series of research activities to
evaluate the social-environmental damages resulting from the transport of goods

22
and people. The European Research Network has been working to develop and
adopt a common methodology and conduct case studies to quantify the external
and other unaccounted for costs associated with energy production and
consumption. It was their intent to improve energy and transport policies by
establishing a mechanism to either tax the most damaging fuels and technologies
or incentivize the fuels and technologies with the lowest socio-environmental
cost. This can only be successful once a robust methodology for monetary
quantification of the socio-environmental damages is in place (European
Commission 2003). In Europe, hundreds of technology research projects are
combined with socio-economic research to provide a scientific basis for policy
formulation related to energy and the environment. The European Commission
has sponsored this research in order to determine the consequences of specific
CO2 targets and the cost effectiveness of technologies developed to address
meeting these targets; to address climate change issues by determining the least
expensive option to achieve Kyoto, while identifying the effects of greenhouse
gas emission trading; and to provide a mechanism to measure the socio-
environmental damages resulting from energy production and consumption –
identify which damages should be included in the external cost evaluation, and
what methodology should be used. The Commission’s External Cost report uses
cost benefit analysis as a principal tool to compare the costs required to reduce
environmental burdens. Table 2.4.1-1 below provides an overview of the
categories, burdens, and their associated effects that were included in this

23
analysis. Building material, crops, global warming, and ecosystem effects were
considered in addition to human health effects (European Commission 2003).
Table 2.4.1-1: Health and Environmental Effects (European Commission, 2003)
The Commission studies used an impact pathway approach, which follows a
pathway from its source by evaluating changes in the quality of the air, soil, and water,
and considering physical impacts before translating them to monetary costs and benefits.

24
The following diagram (Figure 2.4.1-1) illustrates the main components of this impact
pathway approach (European Commission 2003).
Figure 2.4.1-1: Impact Pathway Approach, (European Commission, 2003)
Using the impact pathway categories presented in Figure 2.4.1-1, researchers
found that when comparing the costs associated with vehicle use, vehicle production, fuel

25
production, and infrastructure, the most dominant air pollution cost is associated with
vehicle use, which varies by city due to fluctuations in the number of people who can be
affected by airborne pollutants and the climate (See Figure 2.4.1-2 below).
Figure 2.4.1-2: Costs of Air Pollution Associated with Urban Passenger Transportation
In areas that are not considered to be urban (rural areas), fewer people are
impacted by tail pipe emissions, so other processes like vehicle and fuel production and
infrastructure provision become increasingly more significant and important relative to
the costs associated with vehicle use (Figure 2.4.1-3).
The researchers who conducted the European Commission study then estimated
the total quantifiable damage costs that could be attributed to accidents, noise, global
warming, and air pollution. In 1998, the quantifiable total costs were approximately $33

26
billion for the entire transportation sector. As seen in Figure 2.4.1-4 below, the biggest
driver for high external costs for transportation in Germany is road transportation.
Figure 2.4.1-3: Costs of Air Pollution Associated with Rural Passenger Transportation, (European
Commission, 2003)
Figure 2.4.1-4: Quantifiable Costs Associated with 4 Modes of Transportation in Germany, (European
Commission, 2003)

27
Rail, aircraft, and inland waterway modes of transportation have external costs that are
―insignificant‖ relative to the costs associated with road transportation. It is also worth
noting here that for the aircraft mode of transportation, the largest contributor to external
costs is increases in the atmosphere of green-house gases like CO2. For air pollution, the
data presented takes into consideration direct emissions and those from fuel and
electricity production.
Another study conducted by Yan and Crookes presents a ―Life Cycle Analysis of
Energy Use and Greenhouse Gas Emissions for Road Transportation Fuels in China.‖
The life cycle stages that were assessed for transportation fuels in this study included
feedstock recovery and transport, fuel production and transport, and fuel consumption
(See Figure 2.4.1-5 below) (Xiaoyu Yan 2009).
Figure 2.4.1-5: Life Cycle Stages for Transportation Fuels (Xiaoyu Yan, 2009)
The Yan and Crookes report also identifies the road transport sector as the
dominant contributor to the external costs being considered. Road transportation was
named as the dominant oil consumer and the most significant source of greenhouse gas
emission in China, due to the steady increase in use of private vehicles over the past few

28
years. Again, the focus in their life cycle analysis is on CO2 emissions, and promotion of
alternative fuels to reduce the greenhouse gas effects (Xiaoyu Yan 2009).
Another report, published by the Aviation Fuel Life Cycle Assessment Group for
the Air Force, provides insight into how life cycle assessments are performed for their
aviation fuels. The interim report under the Advanced Propulsion Fuels Research and
Development contract provides a framework and specific guidelines for estimating the
greenhouse gas footprints for transportation fuels – aviation fuels in particular. This set
of guidelines instructs the reader in great detail on how to perform the life cycle analysis,
with the focus on reducing fuel consumption and greenhouse gas emissions (Allen, et al.
2009).
The International Civil Aviation Organization’s Air Transportation Bureau (ATB)
is addressing the effects of international aviation greenhouse gas emissions on the global
climate. In order to find effective solutions to protect the environment, they are
encouraging technology improvements, providing operational measurement tools,
pursuing market-based measures, and working toward the movement to sustainable fuels.
Figure 2.4.1-6 below shows that in 2004, transportation modes accounted for only 13% of
the global greenhouse gas emissions. Of that 13%, only 2% was attributed to aviation
CO2 emissions. As reported in the European Commission study, road transportation was
the dominant contributor to greenhouse gas emissions, with aviation contributing only
13% (International Civil Aviation Organization, Air Transport Bureau (ATB) 2009).

29
Figure 2.4.1-6: Global Greenhouse Gas Emissions in 2004, (International Civil Aviation Organization, Air
Transport Bureau (ATB) 2009)
2.4.2 Sustainable Buildings Industry
In the sustainable buildings industry, the prevailing theme throughout the
literature, especially for federal facilities, is to reduce the energy consumption and
costs, to improve the work environment of the facilities, and to minimize the
environmental impact of facility operations. In order for these facilities to be
―sustainable‖, managers and designers must perform their duties with the
following goals in mind: 1) Minimize waste and make the most efficient use of all
resources, including water, energy, land, and materials, 2) protect the natural
environment, from which all other resources are produced, and 3) create a healthy
facility environment for current and future generations (BuildingGreen, Inc.
2001).
As described in section 2.3 above (Current Guidelines, Policies, and
Regulations), 10 CFR 436 includes a requirement for federal managers to make
decisions based upon information resulting from a Life Cycle Cost analysis, so
the majority of published literature regarding sustainable buildings makes

30
mention of or provides data to evaluate the life cycle costs. Those costs include
initial investment costs, planned maintenance costs, repair and replacement costs,
costs for utilities like water and energy, and other costs that would be incurred
over the life of the facility. Additionally, managers and designers of sustainable
buildings are more often taking extra steps to perform environmental life cycle
assessments in order to understand the potential environmental impacts over the
life of the facility or its products (BuildingGreen, Inc. 2001).
A report published by California’s Sustainable Building Task Force, ―The
Cost and Financial Benefits of Green Buildings‖ presents a comprehensive cost
benefit analysis for ―building green‖. In the sustainable building industry,
environmental and human health benefits are commonly acknowledged in their
green building discussions, but this report claims that ―minimal increases in
upfront costs of about 2% to support green design would, on average, result in
life cycle savings of 20% of total construction costs – more than ten times the
initial investment…… an investment of up to $100,000 to incorporate green
building features into a $5 million project would result in a savings of $1 million
in today’s dollars over the life of the building. (Kats, et al. 2003)‖ In addition to
the typical financial benefits examined in building cost benefit analyses, this
report identifies and includes financial benefits from increased productivity and
health for people exposed to the environment of the building. The task force
found an apparent consensus both inside and outside of the sustainable building
community about the environmental and social benefits of building green.
However, there is consistent concern regarding the lack of accurate and

31
comprehensive economic and financial information regarding these benefits; thus,
the task force funded an Economic Analysis Project to develop a more accurate
and comprehensive cost benefit analysis of a sustainable building. The findings
from this report show cost savings in energy, emissions, water, waste, operations
and maintenance, and an enhancement in worker/occupant health and productivity
(Figure 2.4.2-1). The report states that they observed such a large effect on
productivity and health because both direct and indirect costs for employees are
significantly larger than the cost of construction or energy. Therefore, one will
see large financial benefits even from small changes in health and productivity
(Kats, et al. 2003).
Figure 2.4.2-1: Financial Benefits of Green Buildings, (Kats, et. al., 2003)

32
Although health and productivity components are typically addressed
separately, this report combines them as they both attribute directly to worker
well-being and comfort. Worker well-being and comfort are measured by their
impact on productivity. The report acknowledges the very complicated
relationship or correlation between building design/operation and worker comfort
and/or productivity, and utilizes recent meta-studies that have screened and
synthesized the thousands of studies, reports, and articles published on the subject
matter. As shown in Figure 2.4.2-2 below, the cost to the state of California that
is attributed to worker/employee costs is ten times the combined costs attributed
to property costs (Kats, et al. 2003).
Figure 2.4.2-2: Relational Costs of Employees to Other Building Costs in California (Kats, et. al., 2003)

33
It is very difficult to measure the exact cost benefits associated with
healthier, greener buildings, because those costs associated with poor air quality
and poor environmental conditions result in more employees taking days off, and
more employees experiencing allergies, asthma, and other respiratory illnesses.
These effects on the employees are typically hidden in paid sick leave days,
insurance and medical costs, and lower productivity while at work. William Fisk
and his colleagues conducted a comprehensive study that quantified potential
health and productivity benefits from enhanced indoor environments (Figure
2.4.2-3). His study found a potential savings or productivity gain in 2002 dollars
that ranged from $43 billion to $235 billion (Kats, et al. 2003). When these kinds
of elements are introduced into a life cycle analysis, they can help the decision-
maker have a significantly more informed view of the trade space, and can
significantly impact the final decision whether to invest a green building.

34
Figure 2.4.2-3: Potential Productivity Gains from Enhanced Indoor Environments (Kats, et. al., 2003)
2.4.3 Space Industry for Launch Systems
Several trade studies regarding propellant options for future architectures
have been performed across NASA in recent history, including the Explorations
System Architecture Study (ESAS), the Crew Exploration Vehicle (CEV) Smart
Buyer Study, the CEV Green Propellant Study, the Propulsion Architecture
Study, and more.
Analysis conducted by NASA to determine the affordability of exploration
architecture options did not use a budgetary approach as is typically done for
smaller systems or even complex systems when more time is allotted for model
development and analysis. Instead, NASA used a combination of cost-estimation
methods as described in the quote below:

35
“ESAS (Exploration System Architecture Study) operations analysis
of affordability used a combination of cost-estimation methods
including analogy, historical data, subject matter expertise, and
previous studies with contracted engineering firms for construction cost
estimates. The operations affordability analysis relied on cost-
estimating approaches and was not budgetary in nature, as budgetary
approaches generally have extensive processes associated with the
generation of costs, and these budgetary processes cannot easily scale
to either architecture-level study trades in a broad decision-making
space or to trading large quantities of flight and ground systems design
details in a short time frame. The operations cost-estimating methods
used in the ESAS are attempts at fair and consistent comparisons of
levels of effort for varying concepts based on their unique operations
cost drivers.” (NASA 2005)
Most cost estimates were calculated using parametric cost estimating tools,
which utilize historical data to predict the development or production costs of related new
space programs/instruments. The tool most commonly used was the NASA/Air Force
Cost Model (NAFCOM), which has an expansive database of about 122 historical
projects including spacecraft and launch vehicles.
No environmental cost-benefit analysis was included in their life cycle
cost model, although some of the costs associated with using toxic fuel are
included in the operations costs (Prince 2010). The study indicates that switching
to nontoxic, green propellants could ―enable safe/efficient launch operations,
infrastructure reduction, performance improvement, logistics reduction, and
potential commonality between main and auxiliary propellants” (NASA 2005).
In the cost chapter of the published ESAS report, the statement was made that the
estimates developed for the study did not consider ―opportunities for significant
improvements in operations costs‖. Their recommendation to decision-makers is
quoted below:

36
“Hypergols should be eliminated at an architectural level across the
CEV and LV elements. The need is to create highly operable systems that
improve over current systems operations in regard to costs, safety of ground
personnel, and overall responsiveness of the system to flight rate demands. A
generation of systems has evolved that has deferred such an evolution to nontoxic
systems. The elimination of hypergols would begin with newer elements such as
the CEV and the upper stage, and would continue as upgrades to SRB- and
SSME-related systems (power systems). Then, eventual elimination of hydraulic
systems and the implementation of simpler electric actuated systems would
become possible, leading to further operability improvements.” (NASA 2005)
While NASA’s internal trade analysis did not include environmental costs
over the life cycle, an extensive search of the literature was conducted to survey
other efforts to assess environmental impacts over the life cycle. Researchers at
ATK Thiokol Propulsion published research on understanding and mitigating the
environmental effects of rocket exhaust. This work was focused on examining
the terrestrial effects on the local launch site (determining the path and
concentration of chemicals found in the ground cloud that is formed during the
launch) and possible effects that the chlorine in the cloud could have on the
stratospheric ozone. This study resulted in a finding that the toxicity threat from
launch effluents was not likely to evoke range safety cancellation of a scheduled
launch. This study referenced several other independent reviews over the past
decade that investigated the atmospheric impact of rocket motors. Their findings
were similar – the local impacts from the exhaust are minor and manageable, and
the more global impact to the atmosphere is minimal (Bennett 2001).
Fick et. al. have published work on the industrial benefits of using a green
propellant, Hydrazinium Nitroformate (HNF), for satellite propulsion systems.
This work focused on operational and performance aspects – the handling

37
capability resulting from the less-toxic nature of the propellant, and the
envisioned reductions in cost that could result in manufacturing, testing and
operating with this propellant. This article states that considerable cost savings
will be realized due to more relaxed handling constraints than were required with
hydrazine--for example, because of its non-toxic nature, no special garments must
be worn during fueling. As much in many of the published articles, mention is
made of the cost savings in general that should be realized, but they do not
attempt to quantify those costs, and they point out that further work must be done
to understand these issues before these innovations can become a reality. Fick’s
article also identified the fact that parallel processing operations will be able to
continue in the same building where fueling operations are occurring (M. Fick
2001). This is an important point because traditionally all activities are shut down
in the surrounding area until fueling is complete when hazardous fuels like
hydrazine are being loaded.
Bombelli, et. al. have published work on the economic benefits of using
non-toxic fuels in spacecraft applications. This paper states that the European
Space Agency and others have pointed out that the use of green propellants can
provide cost saving opportunities in ground operations and in manufacturing. It
also states that while most publications provide results for a specific propellant
being tested at the thruster or component level, it was focused on quantifying cost
reduction potential resulting from ground operations and simplification of
hardware. It also identified areas ripe for cost reduction with ground support
equipment and Self-Contained Atmospheric Protective Ensemble (SCAPE) suit
38
requirements, but again does not attempt to examine the needs and requirements
over the full life cycle (Vittorio Bombelli 2003).
The community has identified a clear need for an understanding of the
environmental impacts and costs associated with propulsion systems. Only with
this understanding can truly informed decisions be made about significant
technologies of the future that have the potential to revolutionize the spacecraft
and launch industry.
METHODOLOGY
3.1. Proposed Methodology for Identifying Environmental Unaccounted for
Costs that Should be Included in Life Cycle Cost Analysis for Propellant
Selection Decisions
While there is a clear need for increased knowledge of the environmental
impacts and costs associated with propulsion systems, and it is widely understood
that some benefit should be expected from inclusion of this information in the life
cycle analysis, there is currently no guidance on which elements of environmental
cost impacts should be evaluated and included. Where should one begin? Which
elements can be quantified, and are significant enough to influence the outcome
of an analysis? The key theme that pervades all of the life cycle analyses
conducted in the transportation industry is an emphasis on the measurement and
reduction of greenhouse gas emissions, and the reduction of fuel consumption.
Environmentally-conscious life cycle automotive design engineers tend to focus
their research in areas like recyclability, ease of disassembly, and reusability in
39
conjunction with the typical emission reduction concerns (Tmiyama, Umeda and
Wallace June, 1997). Pioneers in the sustainable buildings industry consider
human health and productivity in addition to typical life cycle assessment
elements (initial investment costs, planned maintenance costs, repair and
replacement costs, costs for utilities like water and energy, and other costs that
would be incurred over the life of the facility). When considering which
environmental elements to include in a life cycle analysis for space propulsion
fuels, one would assume that the similarities between aircraft, automobiles, green
buildings, spacecraft, and launch vehicles and operations would allow life cycle
analysts to take advantage of a combination of existing processes. However,
propellant selection for space applications is in a category all by itself, with
unique requirements and operational constraints.
In contrast to the airline and auto industries, the number of shuttle
launches per year is very small – only 5-6 shuttle launches in a calendar year.
When compared to the millions of automobiles driven daily and millions of
airplane flights per year, the amount of greenhouse gas emissions and the total
fuel consumption resulting from all shuttle launches per year is not significant.
However, if one accepts the literature findings that there are significant human
health and productivity cost savings realized by designing and building green
buildings, it follows that trade analyses conducted to make decisions regarding
green fuels versus toxic ones might benefit from considering the human health
and safety aspects of manufacturing, storing, operating, and disposing of those
fuels. The research proposed here is aimed at identifying the potential areas

40
where these human health and safety environmental impact factors have
traditionally been omitted from life cycle cost analyses. When new
programs/projects are proposed in the future, decision-makers can request that
these factors be quantified and included in their total life cycle cost analyses.
3.2. Proposed Methodology for Future Life Cycle Cost Analyses
Once the environmental cost factors have been identified, one would then
have to consider how to incorporate them into the life cycle cost analysis.
Considering the three tools most commonly used as described above in section
2.2 above, the methodology best suited for incorporation of these quantifiable
environmental costs is a customized cost-benefit analysis (CBA).
As described in section 2.2.1, life cycle costing (LCC) generally has an
economic focus, and the application of environmental components to elements of
cost has not advanced enough to allow for a methodology for estimating these
values that is commonly accepted in the community (Steen 2005). As a result,
extending the LCC analysis to a CBA is more difficult because one must not only
determine the conventional and environmental elements of cost for the model; but
also include social benefits in monetary terms, and then aggregate the costs in a
meaningful way. This is difficult to accomplish when examining the costs
associated with employees avoiding the risks associated with working with
hazardous materials, long term effects of spills and exposures in every phase of
the life cycle, costs associated with catastrophic fatal accidents, political or policy
changes, as well as many other ―environmental‖ human factors. LCCs perform
well with actual costs from current systems/processes/policies, but are difficult to

41
conduct when proposing a new system/technology/capability with the current
system as a baseline. With a CBA, one can find the baseline costs, and assign
some sort of value system to identified benefits such as cost reductions or cost
eliminations.
Since a life cycle assessment (LCA) methodology is used to evaluate the
cumulative environmental performance or effects of a system, including those
impacts that are generally not included in traditional life cycle cost analyses (i.e.
extraction of the raw materials, transportation of the product materials, and end of
life disposal), it is geared to provide the best assessment of the environmental
effects and potential impacts of a product, system, process or service. However, it
does not provide a solution regarding the most cost-effective or best-performing
product, system, process or service; therefore LCAs must be combined with cost
and performance data to reach a final conclusion. Additionally, LCAs are
expensive to undertake in terms of time and resources, and the data required to
perform a comprehensive LCA for complex systems for aerospace can be difficult
(nearly impossible) to obtain. If the user community were directed to perform an
LCA before a decision could be made for all proposed new technologies, many
technologies would not be introduced because the process itself is cost-prohibitive
for these types of systems.
A CBA, on the other hand, often includes those environmental and social
costs and benefits that can be reasonably quantified, and provides a means to
weigh those benefits against the costs. CBAs have traditionally been used to
make decisions about complicated issues such as education, health care,
42
transportation, or the environment because the process begins by quantifying the
status quo (current actual cost over the evaluated time) of a particular action, and
then evaluating other alternatives against the existing baseline. After one defines
what is considered to be a ―benefit‖ for the analysis, and the relevant time is
established, benefits and costs can be estimated. Costs may be identified as
missed opportunities; costs that are easily identified and explained (internal
costs); and external costs that are not typically included and can sometimes be
difficult to quantify – i.e. end of life disposal; environmental impact due to
wastes, emissions, and pollutants; or the cost of health problems that result from
hazardous or toxic products. Because the proposed research objectives are well-
aligned with the applications of this tool, the CBA should provide an effective
methodology for discovering a solution set that can eventually improve the
baseline system while reducing overall costs. For the purpose of this research, a
cost is defined as a quantifiable internal cost where costs are incurred, but are not
traditionally included in the life cycle analysis; and a benefit is defined as a cost
avoided or a reduction in cost from the baseline system.
3.3. Research Methodology
In many cases, the most knowledgeable experts that can provide the most
pertinent information tend not to readily reveal information because either it is
proprietary in nature, or they may wish to continue operating with known
materials and known risks, and would be hesitant to support significant changes to
43
their system. Under these conditions, traditional information-gathering
techniques are not effective. If surveys are sent to subject matter experts, only the
questions that are asked will be answered at best. When a researcher is working
to uncover hidden costs, the ―right‖ questions are not typically known up front.
Even in-person interviews will not provide the detailed information that is
required to uncover environmental costs, because subject matter experts can
easily overlook steps in a specific process or miss detailed cost factors when the
experts are removed from their operating environment. Just as with surveys, the
interviewer must be prepared in advance to ask the ―right‖ questions.
In order to effectively uncover these costs, a forensic investigation
methodology (or a process tracing methodology) was implemented. In criminal
cases, the forensic scientist methodically searches for and examines physical
traces or evidence that can be used to establish or exclude association of a suspect
with a crime (Department of Justice 2011). Forensic science is intended to be an
unbiased gathering and analysis of all data available to make a determination of
guilt or innocence. This approach was adapted and applied during site visits to
key facilities involved in every phase of the life cycle of the chosen propellants.
Requirements, constraints, and cost drivers were identified in close coordination
with the facility hosts to inform future cost analyses. Below is the list of research
plan objectives that were followed:
1. Reviewed previous studies on propellant decision-making and environmental
criteria.
2. Investigated processes for material acquisition, handling, and disposal for
toxic and green propellants through phone and in-person interviews with

44
subject matter experts in all phases of the propellant life cycle. This
investigation included all information related to material handling and worker
related requirements for safety (self-breathing suits, special containment
systems, special emission leak sensors, buddy system, special permits, special
insurance, special OSHA requirements, inspection requirements, etc.).
3. Prepared requests for data and specific questions to focus discussions at each
facility targeted for a site visit.
4. Identified key sites to perform physical walk-throughs to understand current
and future operations requirements for each phase of the life cycle. Sites
visited were processing facilities at NASA Kennedy Space Flight Center in
Florida; NASA Wallops Flight Facility on Wallops Island, VA; ECAPS
Corporation’s research, development, and operations facilities in Stockholm,
Sweden; and both the FOI (the Swedish Defense Research Agency) and
Eurenco Corporation (ADN manufacturer) in Sweden.
5. Implemented standard process for site visits, including: a) discussions with
key leadership of the facility for strategic discussions, b) interviews with line
managers and subject matter experts during walk-through of operations, c)
follow-up discussions with subject matter experts, and d) follow-up requests
for documentation when necessary.
6. Conducted additional phone (and in-person) interviews with subject matter
experts at the Indian Head Naval Surface Warfare Center (Energetics
Manufacturing Technology Center) of the Naval Sea Systems Command in
Maryland; NASA Marshall Space Flight Center; NASA Glenn Research
Center; and the NASA Headquarters Office of Strategic Infrastructure,
Environmental Division.
7. Prepared list of quantifiable life cycle cost elements, and acquired cost data
where available.
8. Prepared detailed descriptions of each environmental cost element.
9. Identified hydrazine cost elements to serve as a baseline for comparison with
future alternative propellants, and designed a cost element table for
comparison of baseline versus alternative propellants.

45
10. Prepared template for future life cycle cost analysis projected over the number
of years required by the decision-maker.
11. Determined whether these cost elements represented ―costs‖ or ―benefits‖ for
Cost Benefit Analysis (CBA) purposes, based upon data obtained through
interviews and site visits,
12. Performed analysis of how to incorporate collected data into a CBA, and
made recommendations for a CBA process for future propellant selection
decisions.
In order to lend credence to the significance of the costs associated with
these environmental factors, a case study approach was implemented to apply
these criteria to actual costs for a mission. A mission that has recently been
launched utilizing both a hydrazine propellant and a High Performance Green
Propellant (HPGP) called Ammonium Dinitramide (ADN) was identified as the
test mission. Detailed costs were identified that correspond to a subset of the
environmental factors in order to get a quantitative actual measure of value for
these factors in that scenario.
OBSERVATIONS, FINDINGS AND RESULTS
4.1. Site Visit Observations
The first site visit was conducted at Kennedy Space Center (KSC) in Cape
Canaveral, Florida. During this site visit, meetings were held with key technicians,
engineers, and managers who could characterize their processes for operating with
hydrazine. A walk-through of the laboratories was conducted, and the following
procedural documents were provided:

46
1) Generic propellant system repair – task development/implementation
process overview flowchart
2) Guidelines for propellant system repair
3) Process Hazard Analysis of the Monomethylhydrazine (MMH)
System at the Hypergol Maintenance Facility
4) Process Hazard Analysis of the MMH/N2O4 Transportation Modes at
the Launch Complex 39 and Kennedy Space Center Industrial Areas
These documents served as a source of documented processes where risks
could be identified, identified areas where resources must be applied, and provided a
confirmation of the hazardous operations requirements that must be taken into
consideration. The subject matter experts at KSC identified human exposure and
human risk factors as the most significant environmental cost factor. At this site visit,
information was provided regarding practices for Self-Contained Atmospheric
Protective Ensemble (SCAPE) suits. Workers are required to implement a ―buddy
system‖ in which each person must have a partner in the facility with them at all
times when working with hydrazine. There is also a team of two people waiting
outside the hazard area in the event that one of the initial team members must be
relieved for any reason. At that point, both of the initial team members will exit and
the new team will enter. This means that for all hazardous fueling operations, at least
four people in SCAPE suits are required (Richard Keinath 2010).
The next site visit was conducted at the ECAPS High Performance Green
Propellant (HPGP) hot-fire ground test facility located on-site at FOI in Grindsjon,
Sweden (See Figure 4.1.1 below).

47
Figure 2.4.3-1: Hot-Fire Ground Test Facility Site Visit in Gindsjon, Sweden
ECAPS, part of the Swedish Space Corporation Group, is a company with a focus on
green propulsion-based products for space applications. ECAPS holds a number of
patents worldwide for a family of Ammonium Dinitramide (ADN)-based propellants,
catalysts, thruster designs and manufacturing methods. During this site visit,
operations using proposed ADN-based green propellants were demonstrated, a walk-
through of facilities was conducted, and discussions were held with key subject
matter experts in the facilities. This site visit was instrumental in providing an
understanding of the environmental cost and benefit areas that should be compared to
the current baseline systems in order to do a fair trade analysis study.
The final site visit was to Eurenco located in Karlskoga, Sweden. Eurenco is
a European manufacturer that offers a range of cutting-edge energetic materials for
defense and commercial markets, with five modern production plants in Belgium
(Clermont), Finland (Vihtavuori), France (Sorgues, Bergerac) and Sweden
(Karlskoga) (www.eurenco.com n.d.). At this site visit, the manufacturing process
for the development of green propellants was demonstrated, a walk-through of the
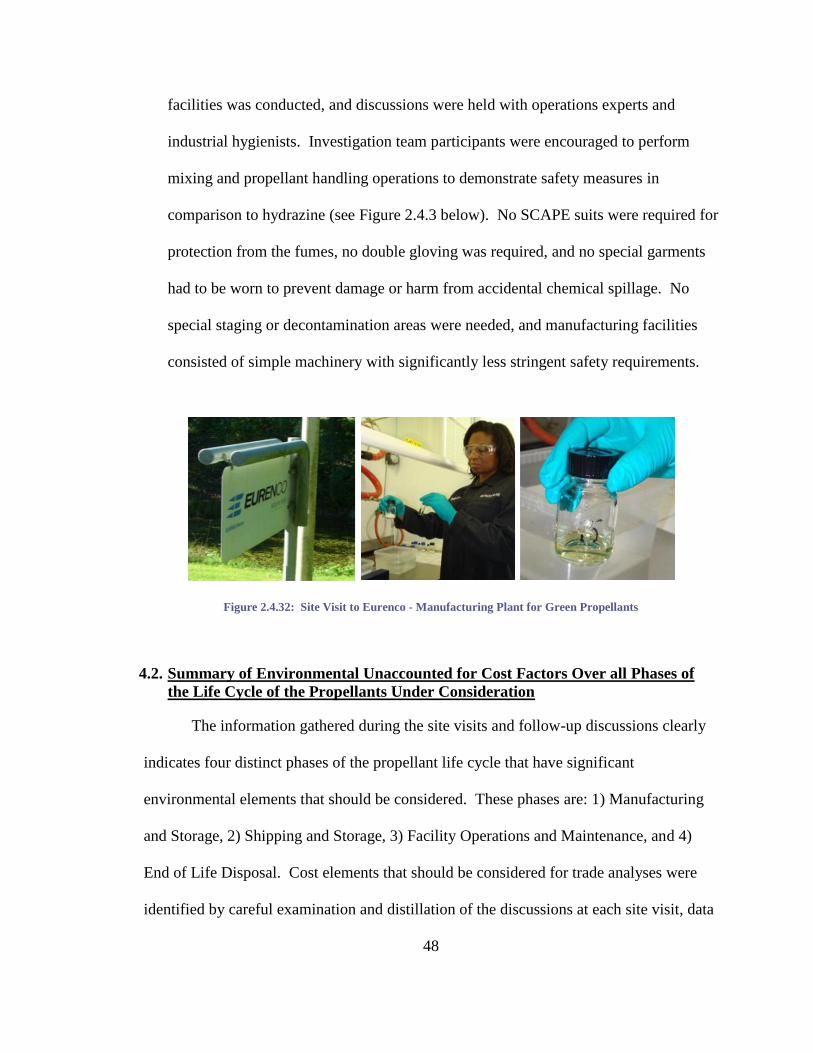
48
facilities was conducted, and discussions were held with operations experts and
industrial hygienists. Investigation team participants were encouraged to perform
mixing and propellant handling operations to demonstrate safety measures in
comparison to hydrazine (see Figure 2.4.3 below). No SCAPE suits were required for
protection from the fumes, no double gloving was required, and no special garments
had to be worn to prevent damage or harm from accidental chemical spillage. No
special staging or decontamination areas were needed, and manufacturing facilities
consisted of simple machinery with significantly less stringent safety requirements.
Figure 2.4.32: Site Visit to Eurenco - Manufacturing Plant for Green Propellants
4.2. Summary of Environmental Unaccounted for Cost Factors Over all Phases of
the Life Cycle of the Propellants Under Consideration
The information gathered during the site visits and follow-up discussions clearly
indicates four distinct phases of the propellant life cycle that have significant
environmental elements that should be considered. These phases are: 1) Manufacturing
and Storage, 2) Shipping and Storage, 3) Facility Operations and Maintenance, and 4)
End of Life Disposal. Cost elements that should be considered for trade analyses were
identified by careful examination and distillation of the discussions at each site visit, data
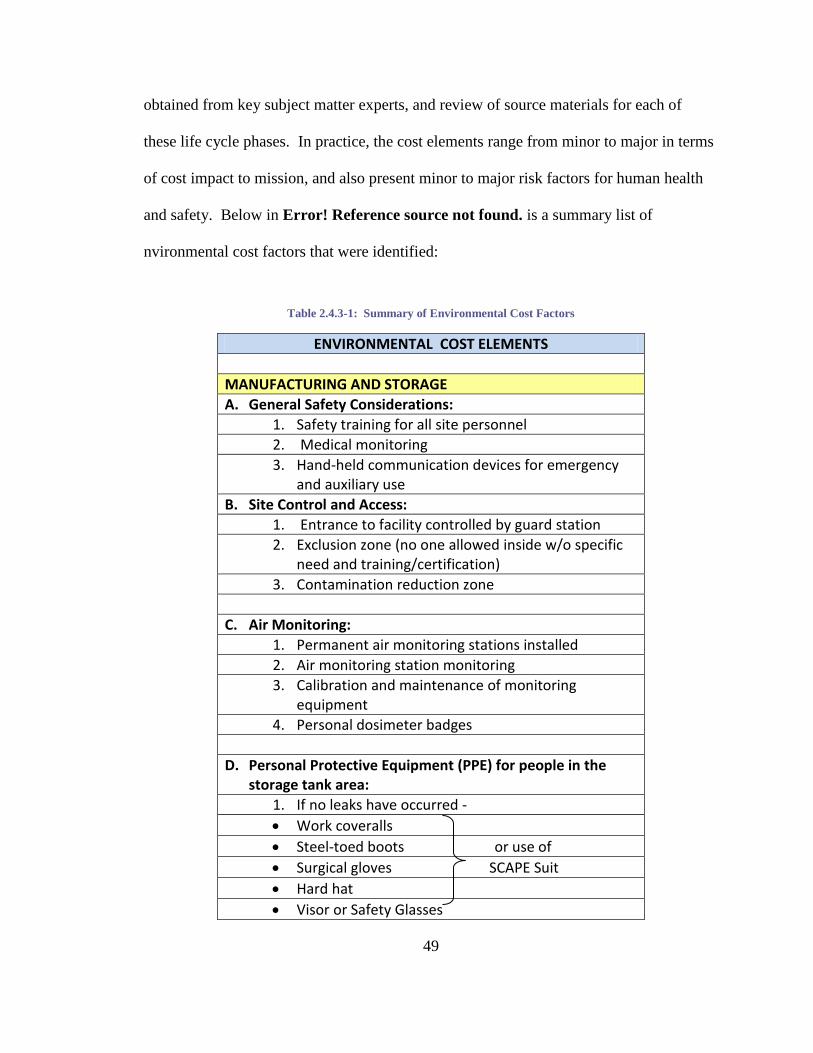
49
obtained from key subject matter experts, and review of source materials for each of
these life cycle phases. In practice, the cost elements range from minor to major in terms
of cost impact to mission, and also present minor to major risk factors for human health
and safety. Below in Error! Reference source not found. is a summary list of
nvironmental cost factors that were identified:
Table 2.4.3-1: Summary of Environmental Cost Factors
ENVIRONMENTAL COST ELEMENTS
MANUFACTURING AND STORAGE
A. General Safety Considerations:
1. Safety training for all site personnel
2. Medical monitoring
3. Hand-held communication devices for emergency and auxiliary use
B. Site Control and Access:
1. Entrance to facility controlled by guard station
2. Exclusion zone (no one allowed inside w/o specific need and training/certification)
3. Contamination reduction zone
C. Air Monitoring:
1. Permanent air monitoring stations installed
2. Air monitoring station monitoring
3. Calibration and maintenance of monitoring equipment
4. Personal dosimeter badges
D. Personal Protective Equipment (PPE) for people in the storage tank area:
1. If no leaks have occurred -
Work coveralls
Steel-toed boots or use of
Surgical gloves SCAPE Suit
Hard hat
Visor or Safety Glasses

50
2. If there is an uncontained exposure to the hazardous material -
Tyvek suits
Steel-toed boots
Overboots or use of
Inner and outer gloves SCAPE Suit
Hard hat
Respiratory protection
E. Decontamination Procedures:
1. Each individual must be decontaminated before leaving the exclusion zone
Wash the outer PPE to remove gross contamination
Removal and disposal of the PPE
Shower prior to entry into any other part of the facility
Washtubs, brushes, water, and citric acid must be available for decontamination
Wash water must be collected and treated before discharge
Used PPE’s must be placed in numbered and labeled barrels to be stored onsite
F. Storage
1. Special storage containers for hazardous materials
2. Special temperature control capability
3. Special pressurized containers?
G. Compliance and Audits
1. Formal audits performed
2. Industrial Hygiene and Safety Staff conduct unannounced health and safety audits for compliance
SHIPPING/TRANSPORTATION
A. Rail:
1. Special transporter training/certification
2. Special storage/shipping drums
B. Sea Vessels (Ship):
1. Special transporter training/certification
2. Special storage/shipping drums
C. Air:
1. Special transporter training/certification
2. Special storage/shipping drums

51
D. Public Highways:
1. Hazmat Cargo tank trailers
2. Special drivers’ certification
3. Transporter liability insurance
4. Special storage/shipping drums for smaller quantities
FACILITY OPERATIONS & MAINTENANCE
1. Construction (to meet safety specifications)
2. Air scrubbers (installation & operation)
3. Spill handling & disposal (catchment tanks)
4. Annual facility certifications & inspections
5. Mandatory safety personnel (fire, medical, etc.)
FUELING OPERATIONS
1. Prepackaged/pre-fueled s/c permissible?
2. Fueling process requirements
SCAPE suit procurement/rental
3. Crew training and certification
4. Safety requirements
Range Safety personnel
Medical personnel
Fire personnel
5. “Down time” of all launch campaign personnel not involved in hazardous fueling operations
6. Ground support equipment refurbishment and preparation
Fueling cart decontamination
Drum decontamination
Replacement of facility spill catchment tanks (if necessary)
END OF LIFE DISPOSAL
A. Propellant End of Use:
1. Remediation for spills
2. Remediation for contaminated objects
3. Disposal of residual propellant
4. Propellant drum return
B. Facility Decommissioning:
1. Hazard Reduction
2. Liquid waste handling and disposal

52
3. Dismantling and demolition
4. Site restoration
- Decontamination and removal of equipment and subsequent revegetation of the grounds after demolition debris and solid wastes are removed
- Postclosure vegetation maintenance
The elements identified in Error! Reference source not found. were used to
erform a comparative analysis between the baseline hydrazine system and a new High
Performance Green Propulsion (HPGP) system. Table 2.4.32-2 below is a summary of
these environmental cost elements applied to a comparison of Hydrazine to an HPGP.
Details of specific areas that have not been included in past life cycle trade studies
(identified in section 2.3.3) are provided in the subsequent sections for each phase of the
life cycle. Some cost data has been included when available, adjusted from different
currencies and time periods to 2011 U.S. dollars. The key for color coding in the table is
as follows:
Red A Cost: A quantifiable internal cost, where costs are
incurred, but are not traditionally included in the life cycle
analysis.
Yellow A Benefit: A reduction in cost from the baseline system.
Green A Benefit: A cost avoidance
Table 2.4.32-2: Environmental Unaccounted for Life Cycle Cost Element Comparison of
Hydrazine to HPGP

53
ENVIRONMENTAL UNACCOUNTED
FOR COST ELEMENTS HYDRAZINE HPGP
MANUFACTURING AND STORAGE A. General Safety Considerations:
1. Safety training for all site
personnel
40 hours minimum
($375/person +
$70/person annually
for mandatory
refresher)
1 hour per
facility/building
2. Medical monitoring Annual
Comprehensive
Medical Exam
N/A
(non-hazardous
operation)
3. Hand-held communication
devices for emergency and
auxiliary use
Walkie Talkies
(~$60/pair) Satellite
Phones (~$1100 ea.)
N/A
(non-hazardous
operation)
B. Site Control and Access:
1. Entrance to facility controlled
by guard station
24 hours/day
($300K/yr or up to
$3M to build new one)
N/A
(non-hazardous
operation)
2. Exclusion zone (no one allowed
inside w/o specific need and
training/certification)
Additional square
footage, access
control, and
decontamination
requirements (not
quantified)
N/A
(non-hazardous
operation)
3. Contamination reduction zone Additional square
footage and
decontamination
requirements (not
quantified)
N/A
(non-hazardous
operation)
C. Air Monitoring:
1. Permanent air monitoring
stations installed
Inside and around
manufacturing
facilities
Not required
2. Station monitoring 24 hours/day Ammonia sensors are
adequate (unmanned)
3. Calibration and maintenance of
monitoring equipment
Calibration performed
at the beginning of
each work day
Regular intervals
4. Personal dosimeter badges Not required
D. Personal Protective Equipment (PPE)
for people in the storage tank area:
1. If no leaks have occurred - SCAPE suit required
Work coveralls Required
Steel-toed boots or use
of
Not required
Surgical glove SCAPE Suit Required
Hard hat Not required
Visor or Safety Glasses Required
2. If there is an uncontained
exposure to the hazardous
material -
SCAPE suit required Gas mask required in
case of major leak
Tyvek suits

54
Steel-toed boots
Overboots or use
Inner and outer gloves of
Hard hat SCAPE
Respiratory protection Suit
E. Decontamination Procedures:
1. Each individual must be
decontaminated before leaving
the exclusion zone
N/A
(non-hazardous
operation)
Wash the outer PPE to remove
gross contamination
SCAPE suit
cleaning or disposal
N/A
(non-hazardous
operation)
Removal and disposal of the PPE Discard gloves only
Shower prior to entry into any
other part of the facility
Not required
Washtubs, brushes, water, and
citric acid must be available for
decontamination
Not required
Wash water must be collected
and treated before discharge
N/A
(non-hazardous
operation)
Used PPE’s must be placed in
numbered and labeled barrels to
be stored onsite (non SCAPE
PPEs)
N/A
(non-hazardous
operation)
F. Storage
1. Special storage containers for
hazardous materials
DOT-4BW Opaque plastic
container acceptable
2. Special temperature control
capability
Store at temps below
51 C (123 F).
Long-term storage:
10-50ºC (50-122ºF)
Short-term storage: -
5-70ºC (41-156ºF)
3. Special pressurized containers Can be packaged only
in Teflon high density
polyethylene or
stainless steel
containing less than
0.5% molybdenum.
Must use nitrogen
blanket.
Plastic container with
latching lid
acceptable (not
compatible with
aluminum tanks)
SHIPPING/TRANSPORTATION
A. Rail:
1. Special transporter
training/certification
FORBIDDEN Yes
2. Special storage/shipping drums N/A UN 1.4S
B. Sea Vessels (Ship):
1. Special transporter
training/certification
Yes Yes
2. Special storage/shipping drums DOT-4BW UN 1.4S
C. Air: Commercial
Passenger
FORBIDDEN
Allowed on
commercial
passenger aircraft

55
1. Special transporter
training/certification
N/A Yes
2. Special storage/shipping drums N/A UN 1.4S
D. Public Highways:
1. Hazmat Cargo tank trailers Yes No
2. Special drivers’ certification Yes Yes
3. Transporter liability insurance Yes Yes
4. Special storage/shipping drums for
smaller quantities
DOT-4BW UN 1.4S
FACILITY OPERATIONS &
MAINTENANCE
1. Construction (to meet safety
specifications)
Required Required
2. Air scrubbers (installation & operation) Required Not required
3. Spill handling & disposal (catchment
tanks)
Required Required
4. Annual facility certifications &
inspections
Required Required
5. Mandatory safety personnel (fire,
medical, etc.)
Required N/A
(non-hazardous
operation)
6. A minimum of 2 people must be present
during all hydrazine facility operations (2
additional people must be in SCAPE suits
on standby during hazardous fueling
operations)
Required Not required
7. Fueling Operations:
a. Safety requirements
Range safety personnel support Required Required
Medical personnel Required N/A
(non-hazardous
operation)
Fire personnel Required N/A
(non-hazardous
operation)
b. ―Down time‖ of all launch campaign
personnel not involved in hazardous
fueling operations
Required N/A
(non-hazardous
operation)
c. Ground support equipment
refurbishment and preparation
Fueling cart decontamination Req’d/Comprehensive Limited
Drum decontamination Req’d/Comprehensive Limited
Replacement of facility spill
catchment tanks (if necessary)
Req’d/Comprehensive Limited
END OF LIFE DISPOSAL
A. Propellant End of Use:
1. Disposal of contaminated objects See pages 71-73 Flush with water
(wastewater treated
as non-toxic waste)
2. Disposal of residual propellant/waste Controlled burn with
absorbent
3. Propellant drum return DOT-4BW Non-hazardous

56
B. Facility Decommissioning:
1. Hazard Reduction
See descriptions on
pages 71-73
Not required
2. Liquid waste handling and disposal Flush with water
(wastewater treated
as non-toxic waste)
3. Dismantling and demolition Flush with water
(wastewater treated
as non-toxic waste)
4. Site restoration Not required
- Decontamination and
removal of equipment and
subsequent revegetation of
the grounds after demolition
debris and solid wastes are
removed
Not required
- Postclosure vegetation
maintenance
Not required
4.2.1 Manufacturing and Storage
4.2.1.1 General Safety Considerations
Human health and safety considerations during the manufacturing and
storage of hydrazine start with general safety considerations that are required
for all hydrazine hazardous operations facilities. The first cost element is the
safety training requirement for all on-site personnel, including engineers,
technicians, contractors/subcontractors, and supervisors. A minimum of 40
hours of safety training that meets Occupational Safety and Health
Administration (OSHA) requirements, along with a minimum of three days of
on-the-job training under the guidance of a trained supervisor are required
(Harding Lawson Associates, O.H. Materials Corporation 1989). In certain
cases, managers are required to take an additional eight hours of training for
the management of hazardous waste operations. In general, training meeting

57
OSHA requirements costs on average $350 per person [OSHA website]. This
cost must be paid for every site employee, so sites with 20-100 employees
would incur costs of approximately $7000 - $35,000 for the initial training.
Each subsequent year leads to an additional cost of ~$70 per person [OSHA
website] for annual refresher training, for another total cost ranging from
$1,400 - $24,500 per year. When considering total cost of training, one must
also consider labor hours (which is time that the employees are being paid, but
are not accomplishing work on-site), and travel expenses if the courses are not
conducted on-site. This safety training requirement factor would is a
quantifiable internal cost, so it is classified as a ―cost‖ for CBA purposes.
When assessing the HPGP in comparison to the baseline hydrazine, this factor
would be considered a benefit in that the cost is significantly reduced by the
significantly less stringent requirement.
The second cost factor is medical monitoring (Harding Lawson
Associates, O.H. Materials Corporation 1989). Before employees can begin
working in a hazardous waste assignment, they must undergo a
comprehensive medical exam to ensure that they are qualified for the
assignment. The physician performing the examination makes a
determination of qualification based upon guidelines provided by OSHA
regulations, the assignment description planned for the employee, anticipated
exposure levels, fitness for wearing personal protective equipment (PPE)
requirements, and any pertinent information from past exams. Additional
exams are conducted as needed depending upon the type of work performed,

58
or when any illnesses, injuries, or exposures are reported. Employees also
receive an exit medical examination when they leave that position (Harding
Lawson Associates, O.H. Materials Corporation 1989). Comprehensive
medical exams including physical, blood work, lung capacity tests, eye exam,
hearing tests, and EKG can range from ~$500 per employee in a federal
government facility to ~$2000 per employee in a private practice facility.
This medical monitoring factor would be considered to be a quantifiable
internal cost for CBA purposes. When assessing the HPGP in comparison to
the baseline hydrazine, this factor would be considered a benefit as it would
be a cost avoided.
The third cost factor is the requirement for hand-held communication
devices to be readily available for emergency and auxiliary use. Should the
telephone lines become inoperable, a mechanism to reach emergency
responders is needed in case of an incident during hazardous operations.
These devices range from ~$60 for a pair of two-way handheld transceivers to
~$1,100 for one satellite phone, and have traditionally been treated omitted
for CBA purposes. These devices are not required for HPGP operations, so
this cost factor would be a benefit, or an avoided cost.
In addition to these general safety considerations, each facility must
adhere to the following actions: 1) obtain and keep up-to-date all required
permits and certifications, 2) undergo routine facility inspections, 3) execute
periodic inspections of protective clothing and equipment, and 4) have all
paperwork ready to submit for audits as required. While these considerations

59
are not as costly as other considerations, they require appropriate levels
staffing, as financial penalties may be assessed if all required elements are not
in compliance.
4.2.1.2 Site Control and Access
When dealing with hazardous materials, controlled access to the area
is required. This is normally accomplished with the use of 24-hour guard
stations positioned at entry points for the site or the building. Access is also
restricted to authorized personnel (including escorted authorized visitors).
Costs associated with having a manned 24-hour guard station can be minor to
significant, ranging from ~$300K per year for a 4-person post in an existing
guard stand to ~$3M to install a new guard station (including infrastructure,
outfitting, information technology requirements, and the guard station
structure itself). For many facilities that operate with hydrazine as a
propellant, this cost is required for reasons other than the fact that hydrazine is
present. Often, these are government facilities that already require controlled
access. Thus, for CBA purposes only a fraction of the cost should be included
in the quantifiable internal cost calculations depending upon the specific
facility that is being assessed. For HPGP facility calculations, again there
may be a requirement for a manned 24-hour guard station because of the
nature of other activities going on at the facility. However, this is not required
for the HPGP operations, and could be a significant benefit for those facilities
that otherwise do not have requirements for these manned 24-hour guard

60
stations. Thus for CBA purposes, operations with HPGP would be considered
to be a benefit – both as a cost reduction and as a cost avoidance depending
upon the specific site/facility being assessed.
The next cost factor is the requirement for an exclusion zone for the
facility. The Rocky Mountain Arsenal defines this as a controlled access area
that safely contains the hazardous waste/operations area (Harding Lawson
Associates, O.H. Materials Corporation 1989). Access to this area is only
granted to those who meet the safety training requirements, and who are
wearing appropriate PPE. Within that exclusion zone is another area called
the contamination reduction zone. This zone is located directly outside of the
exclusion zone, and is used for personnel to either remove or decontaminate
the PPE they were using (Harding Lawson Associates, O.H. Materials
Corporation 1989). The cost of these zones is highly dependent on the facility
being assessed and thus is not quantified here; however, in order to implement
these zones, additional square footage, access control, and decontamination
procedures are required. These are both quantifiable internal costs as it relates
to CBAs. HPGPs do not have this requirement, so when compared to the
baseline this would be considered a benefit – cost avoided.
4.2.1.3 Air Monitoring
Because of the toxic and carcinogenic properties of hydrazine, the
Occupational Safety and Health Administration (OSHA), the National
Institute for Occupational Safety and Health (NIOSH), and the American

61
Conference of Governmental Industrial Hygienists (ACGIH) have provided
standards and guidelines for human exposure limits to hydrazine. In order to
ensure that hydrazine levels are kept at or below these exposure limits, routine
air monitoring is required. Once an individual is able to smell the odor of
hydrazine, the vapor concentration levels are significantly higher than the
allowable exposure limits, so the installation of permanent facility air-
monitoring stations with special sensing detectors is required (Simpson 1986).
These monitoring stations must be in operation 24 hours per day, so that if the
sensors indicate that concentrations exceed a set threshold, the entire zone of
the facility is evacuated until concentrations return to acceptable levels. The
costs associated with these air monitoring stations strictly depend upon the
type of system the facility chooses (there are at least 7 methods for
monitoring, and multiple types and brands of equipment), based upon whether
the use will be for area monitoring, personnel monitoring, or both area and
personnel monitoring (Simpson 1986). The air-monitoring station must be
calibrated at the start of each work day, so calibration equipment must be
purchased, and someone with proper expertise must be employed with the
responsibility to recalibrate the equipment every day. Even with this air
monitoring system in place, personal dosimeters are generally required to help
employees ensure that their personal exposure levels do not exceed allowable
limits (Harding Lawson Associates, O.H. Materials Corporation 1989). The
air monitoring system, 24 hour monitoring requirement, and personal
dosimeters are all quantifiable internal costs that have not been included in life

62
cycle cost analyses, and would be considered a cost for CBA purposes. Since
HPGPs are non-toxic propellants, these measures are not required, and thus
represent benefits (cost avoidances) for CBA purposes.
4.2.1.4 Personal Protective Equipment (PPE)
At the start of the daily operations, if the monitoring stations and
dosimeters indicate normal/acceptable concentration levels, all facility
operations are conducted at the minimum level of personal protection
requirements. This means that all employees on the facility must wear
coveralls, steel-toed boots, surgical gloves, hard hat, safety glasses, and ear
plugs (were noise levels warrant them) (Harding Lawson Associates, O.H.
Materials Corporation 1989).
When a leak or spill has been detected, or when an employee enters
the exclusion zone or must work with an uncontained hazardous material, the
maximum level of personal protection equipment is required. Under these
conditions, an employee must wear Tyvek suits, overboots on top of the steel-
toed boots, both inner and outer gloves, a hard hat, and a respiratory
protection system (Harding Lawson Associates, O.H. Materials Corporation
1989). In almost all current hydrazine operations, these requirements are met
using a Self-Contained Atmospheric Protective Ensemble (SCAPE) suits.
SCAPE suits cost approximately $5,000 per suit and each employee working
in or around hazardous exposure areas must wear one of these suits. These
PPE requirements pose a significant cost impact for manufacturing operations,
and as they have not been included in life cycle cost analyses, they would be

63
quantifiable internal costs, and thus costs for CBA purposes. For HPGPs
there is also a requirement for employees to wear coveralls or laboratory
jackets, surgical gloves, and eye goggles. Additionally, when there is a
significant spill, face masks are required due to the strong ammonia fumes.
These PPE requirements also pose a hidden cost, but they represent a
reduction in the costs required for baseline hydrazine facilities, so they would
be considered benefits for CBA purposes.
4.2.1.5 Decontamination Procedures
Upon exiting the exclusion zone, all personnel must go through the
decontamination process. This process completed by personnel includes
removing gross contamination by washing the outer PPE surfaces, removing
or disposing of the PPE, and showering before entering any of the non-
hazardous zones. In order to execute these decontamination procedures, all
facilities/exclusion zones must have washtubs/showers, brushes, water and
citric acid readily available. All contaminated wash water must be collected
and treated meeting hazardous waste requirements before it can be discharged.
The used PPE must also be collected and placed in labeled and numbered
barrels for on-site storage (Harding Lawson Associates, O.H. Materials
Corporation 1989). When SCAPE suits are used in the exclusion zone, they
must also be cleaned prior to exiting the zone.
These decontamination requirements also represent hidden internal
costs that have not been included in life cycle cost analyses. Washtub and
showering capability, treatment of liquid hazardous waste capability, and the
64
requirement to appropriately dispose of contaminated PPE all pose moderate
to significant cost impacts to a system. These factors would be considered
costs in a CBA analysis, and should be factored in these types of analyses.
Due to its classification, this HPGP requires no decontamination procedures–
personnel would only be required to dispose of the gloves (in a standard trash
receptacle) used during operations. Therefore, these factors would be
considered benefits (cost avoidance) for CBA purposes.
4.2.1.6 Storage
Because hydrazine is extremely reactive with many other materials,
special storage precautions must be taken in order to prevent an explosion or
fire. Hydrazine may only be stored in Department of Transportation approved
containers with the design designation of DOT-4BW, which means it can be
packaged only in Teflon high density polyethylene or stainless steel
containing less than 0.5% molybdenum. Contact with metal oxides like
copper, lead, iron and molybdenum must be avoided because it may lead to
flaming decomposition (Arch Chemicals 2011).
Hydrazine must be stored in well ventilated areas, and the container
opening must be tightly secured. Hydrazine can be explosive or flammable in
the presence of heat, flames, sparks, and even air. In fact, any contact with
oxidizers like hydrogen peroxide, fluorine, nitrogen tetroxide, etc. will result
in immediate ignition or explosion. Therefore, the storage container must be
purged with a Nitrogen blanket, which serves to significantly reduce the
explosion limit when oxidizers are introduced. To prevent explosions due to

65
heat, hydrazine must be stored in a facility where the temperature is not
permitted to exceed 51º C (123º F) (Arch Chemicals 2011).
These stringent, critical storage requirements for hydrazine pose
significant cost impacts over the life of the propellant. As a matter of fact, the
hazardous risk implications might suggest that not only is this factor a cost for
CBA purposes, but perhaps a second cost should be added because of the
additional risk factor for employees.
HPGPs can be stored in simple opaque plastic containers, and a
latching lid is acceptable for long term storage. Temperature requirements for
long term storage are 10-50ºC (50-122ºF), and for short term storage (41-
156ºF), so again thermally controlled storage facilities are required. Although
there are costs associated with purchasing the storage containers and
maintaining thermal control for the facilities, these costs would be benefits for
CBA purposes, as they would represent a cost reduction from the baseline
hydrazine system.
4.2.2 Transportation
The high rate of U.S. transport of hazardous materials by sea, land, and air
each year require significant effort and oversight by Federal government and
industry entities that produce, deliver, and utilize these materials. The Department
of Transportation has oversight responsibility for the transport of all hazardous
materials utilized in space applications such as HPGP/ADN and Hydrazine.
Although the selected chemicals serve the exact same purpose as propellants,
there are significant differences in both processes and requirements for their

66
storage, delivery, and handling during transportation activities. It should be noted
that there are significant transportation constraints and additional resource
requirements when transporting hydrazine versus the transportation of comparable
amounts of the HPGP. These constraints can end up requiring additional mission
time for shipping propellants to a launch site, or can limit when, how, and where a
mission is developed. Table 4.2.2-1 below contains requirements for Hydrazine
and HPGP in the Code of Federal Regulations 49, Parts 100 to 185, revised as of
October 1, 2007. These requirements for the transportation of both materials in
the United States are outlined in the following sub-sections under the categories
of land (rail and highway), sea, and air.
Table 4.2.2-1: CFR for Transportation of Hazardous Materials (Hydrazine and ADN)
§ 172.101 HAZARDOUS MATERIALS TABLE – 49 CFR Parts 100 to 185 – Volume 2 Hazardous materials descriptions and proper shipping names
Hazard class or Division
Identification Numbers
PG Label Codes
Special provisions (§ 172.102)
(8) (9) (10)
Packaging (§ 173.***)
Quantity limitations (see §§ 173.27 & 175.75)
Vessel Stowage
Excep-tions
Non- Bulk
Bulk Passenger aircraft/rail
Cargo aircraft only
Location Other
Hydrazine, anhydrous (High Explosives)
8 UN2029 I 8,
3,6.1
A3, A6, A7, A10, B7, B16, B53
None 201 243 Forbidden
2.5 L D 40, 52, 125
Substances, Explosive, n.o.s. (Ammonium dinitramide (ADN-solution LPM-103S)
1.4S UN0481 II 1.4S ………………..
None 62 None 25 kg 75 kg 05
This table outlines the listed items as hazardous materials in regards to
their transportation, and designates their proper shipping name (column 1), hazard
class (column 2), identification numbers (column 3), packing group (column 4),

67
label codes (column 5), special provisions (column 6), and guidelines for
packaging and transportation via sand, lea, and air.
The hazard class for Hydrazine is listed as Class 8, which per the CFR
denotes ―corrosive material‖ that destroys the full thickness of human skin within
a certain time period, or corrodes steel or aluminum based on specified criteria.
The hazard class for HPGP/ADN or ―Substances, Explosive, n.o.s.‖ is Class 1,
which the CFR denotes as an ―explosive‖ substance or device that causes or leads
to the rapid expulsion of gas and heat via a chemical reaction. Class 1 explosives
are further divided into six additional categories, of which 1.4 is a minor risk of
explosion, generally not wholly or quickly consumed by an external fire, with
effects primarily being contained within its package with negligible ejection of
solid material. Explosives are further defined by compatibility groups, denoted by
a letter of the alphabet. Compatibility group S substances do not significantly
impact emergency response such as fire fighting in the event of accidental release.
Column 4 of the table designates the packing group, with Hydrazine
falling within Packing Group I meaning ―High Danger‖ with related requirements
and ADN falling within Packing Group II meaning ―Medium danger‖ with related
requirements.
Column 6 contains special provisions, which are specific instructions and
guidelines related to the transport of the hazardous materials. ADN does not have
special provisions listed; however Anhydrous Hydrazine has several related to
packaging materials and processes. For example, the provision A10 states that

68
―When aluminum or aluminum alloy construction materials are used, they must
be resistant to corrosion.‖
In general ADN has fewer restrictions than Hydrazine in terms of being
transported with or in the vicinity of other hazardous materials. For the purposes
of the next subsections we assume adherence to all overarching requirements such
as those relating to shipping paperwork, placards, safety, delivery speed, work
spaces, supervisors, etc.
4.2.2.1 Land: Rail
The U.S. Department of Transportation sets forth in 49 CFR Part
174 guidelines for carriage of hazardous materials in or on rail cars. This
includes general requirements for the transport, safety, security, delivery,
and acceptance of hazardous materials within various jurisdictions
(federal, state, local, or Indian tribe), in adherence with the Federal
Railroad Safety Act administered by the Federal Railroad Administration,
as well as specific details for different types of hazardous materials. As a
class 8 corrosive liquid, transport of Anhydrous Hydrazine in or on a
passenger rail car is forbidden. It can, however, be transported on a
freight rail car. Below is an outline of the specific requirements for
transportation of Anhydrous Hydrazine in or on a freight car and HPGP
ADN in or on a freight or passenger rail car.

69
General loading and unloading requirements must be followed,
including hazardous materials packing instructions and ensuring that
hazardous materials are appropriately secured.
Inspection and placarding requirements must also be followed for rail
cars containing hazardous materials.
Rail transportation processes for all hazardous materials are required to
follow guidance listed in the Segregation Table above for storage and
loading.
Class 1 (explosive materials) must be delivered at an agency station,
unless a cosignee can receive the shipment or a secure facility is
available at that point for storage. Otherwise, the shipment must be
forwarded to the next available agency station.
Cosignee must remove shipments within 48 hours, after being notified
of the delivery. Otherwise, the carrier can dispose of carload and less-
than-carload shipments by storage on its property, storage on other
property, or by sale after 15 days. The carrier can also dispose of less-
than-carload shipments by return to shipper.
Train crews must document and continually update the position within
the train of rail cars containing hazardous material. The crew must also
maintain information on each hazardous material including emergency
response information.
Packages must conform to requirements, be fully sealed and non-
leaking, and should be loaded in such a way that protects structural

70
integrity and prevents collisions with other freight during transport.
Class 1.4 explosives (HPGP) may be loaded into closed or container
cars that are in reasonably good condition. Certificates are not a
requirement, and the packages should be blocked and braced.
When transporting Class 1.4 explosives (HPGP) on a truck body,
trailer, or flatcar container, these containers must be closed and tight,
with all heating and cooling equipment disabled; and the packages
should be locked and braced to prevent shifting.
4.2.2.2 Sea
The U.S. Department of Transportation sets forth in 49 CFR Part
176 guidelines for transportation of hazardous materials by vessel. This
includes activities under the jurisdiction of the Department of Defense,
United States Coast Guard. HPGP/ADN, as a Class 1.4 explosive, has few
requirements for stowage above and beyond the standard supervisor and
safety requirements. HPGP/ADN can also be stowed on a ship among
other Class 1 materials per the Hazard Materials Segregation Table.
Class 8 (corrosive) materials like Hydrazine must be stowed away from all
sources of heat, living quarters and edible items; they cannot be stored
underneath any combustible items nor above cotton-containing non-steel
compartments, and glass containers with corrosive material are not
allowed aboard any vessel more than two tiers high without protective
packaging.

71
4.2.2.3 Air
The U.S. Department of Transportation sets forth in 49 CFR Part
175 guidelines for transportation of hazardous materials in commerce
aboard (including attached to or suspended from) aircraft. This includes
general requirements regarding delivery and acceptance of hazardous
materials to, from, and within the U.S. and addresses carriers, personnel,
and air passengers.
As a Class 8 corrosive liquid, transport of Hydrazine via passenger
aircraft is forbidden. HPGP/ADN, classified as 1.4 and Compatibility
Group S, is the only explosive class that can be transported via passenger
aircraft. In this case, the package cannot contain more than 25 kg (55
pounds) of hazardous material. It mustl be loaded in a manner that is
inaccessible, that is, where authorized personnel cannot handle or separate
the material from other cargo.
Per CFR 49 guidelines, both ADN and Hydrazine may be
transported via cargo aircraft, with the following requirements:
Notices must be provided regarding the transport of
hazardous materials via aircraft.
All packaging, loading, and segregation requirements
apply.
Those hazardous materials that are not permitted aboard
passenger aircraft must be marked with a ―CARGO
AIRCRAFT ONLY‖ label.

72
Quantity and loading requirements for all three aircraft
transportation scenarios must be adhered to.
4.2.2.4 Land: Public Highways
The U.S. Department of Transportation sets forth in 49 CFR Part
177 guidelines for transportation of hazardous materials on U.S. highways
aboard various motor vehicles. Above and beyond standard operating
procedures for loading, transporting, and unloading hazardous materials,
as well as the segregation table for hazardous materials and the
compatibility table for explosive materials, for comparative purposes there
were no notable additional restrictions and requirements in the CFR
relevant to the transportation of ADN or Hydrazine.
4.2.3 Operations and Maintenance
Any organization that wishes to perform operations using hydrazine as a
propellant must first ensure that the environmental considerations that were
identified in the manufacturing and storage section above are in place. That
includes general safety considerations, site control and access, air monitoring,
personal protective equipment (PPE), decontamination procedures, and storage
requirements. In addition to those considerations, there is a mandatory
requirement for on-site safety personnel for both fire and medical emergencies.
During all hydrazine facility operations, a minimum of two people must always
be present, and during hazardous fueling operations there must be two additional
personnel standing by in SCAPE suits ready to relieve the two people performing
the operations in the event that one of them must take a break for any reason.

73
During hydrazine fueling operations, in addition to the fire and medical safety
personnel, a pre-defined level of range safety staff support is also required.
During these same operations using an HPGP, no fire and medical safety
personnel are required to be present, a buddy system is not required, and
significantly fewer range support personnel are required. These would be
represented as avoided cost benefits in a cost benefit analysis for HPGPs, but
would be represented as costs for hydrazine.
During launch campaigns with hydrazine, one potentially costly
consideration is the fact that all launch campaign personnel not involved in the
hazardous fueling operations must shut down their operations during the fueling
activities which can typically be up to one week. This is also the case for other
activities not related to a specific launch campaign, including when another
spacecraft is being prepared for launch activities at the same site as the one being
fueled with hydrazine. The additional costs associated with having a significant
workforce on-site that is not being utilized to perform their tasks is not typically
considered in cost trade analyses, but they represent costs that someone will have
to pay. Because the current designation for the HPGP permits a ―non-hazardous
operations‖ status, parallel processing is permitted and all other operations can
continue even in close proximity to the fueling facility – representing an avoided
cost benefit for cost benefit analyses.
Finally, one must take into consideration the costs associated with
refurbishing and preparing the ground support equipment used during the fueling
operations. Both the fueling cart and the propellant drums must be

74
decontaminated, and the spill catchment tanks must regularly be replaced for
hydrazine fueling operations. Because of the non-toxic classification of HPGP, a
much more limited process is required for the decontamination of the fueling cart,
propellant drum, and catchment tank replacement. These factors would represent
reduced cost benefits in a cost benefit analysis.
4.2.4 End of Life Disposal
Decommissioning is the process to make a hazardous materials facility
inoperative, decontaminate the facility and its waste, and dismantle equipment
and buildings. Facilities that manufacture, handle, and dispose of hazardous
materials require an extensive process, and these decommissioning efforts and
planning must also address any onsite spills or surveys conducted by oversight
organizations.
The decommissioning process both remediates and results in solid waste
(debris from demolition of facilities, and contaminated soil) and liquid waste
(production wastewaters, decommissioning wastewaters from decontamination of
equipment and vehicles, and other production and facility liquids including
fluids and flammable liquids). Separate handling and disposal plans are required
for solid and liquid waste; in addition, all waste determined to be hazardous must
be handled accordingly. Based on the decommissioning report of the Army/Air
Force Hydrazine Blending and Storage Facility, it can be expected that a large
percentage of decommissioning wastewater results from decontamination rinsing
of vehicles used to haul the solid waste.
75
Personnel, equipment, and facilities must be identified to conduct and
support the decommissioning process. Additionally, plans must be developed and
implemented to minimize exposure of workers to hazardous materials and
byproducts, and ensure safety in handling of hazardous materials and equipment.
These hazards can include those specific to building materials such as asbestos in
insulation, and those specific to hazardous chemicals such as carcinogenic
contaminants. Hydrazine in particular can pose a carcinogenic risk.
Prior to disposal, most liquid wastes are treated with technologies that
remove or significantly reduce various elements of contamination. These
treatments can be biological, chemical, physical, or thermal and should not create
additional hazardous materials. Final disposal of liquids can include evaporation,
disposal to a drainage ditch, or disposal via a hazard waste incinerator for those
liquids unsuitable for release. Solid wastes are disposed of at hazardous or secure
waste sites and standard landfills when appropriate. Transportation of liquid and
solid waste for final disposal by rail or highway must conform to Department of
Transportation guidelines, including those related to the transportation of
hazardous materials as discussed above. In order to calibrate the significant costs
associated with these kinds of efforts, senior leaders of NASA Headquarters were
interviewed in order to assess actual NASA costs. For the cleanup of Santa
Susana Field Laboratory, NASA is estimating that it will have to spend $300M
per year for soil removal (~$400M per year if all dirt is removed) and $150-
$200M for ground water cleanup over the next 70-90 years (~$1-$3M per year).
NASA is also estimating that it will take ~$500M to clean up the White Sands

76
Test Facility. In addition to the financial liabilities associated with end of life
disposal/cleanup, there are also cost factors that are not easily quantifiable like the
costs associated with the vast number of legal battles and the loss of good will in
the local communities. When organizations are faced with these kinds of steep
liabilities, they often find that it is better to keep them in operation than to close
them because of the cleanup liabilities and other legal ramifications.
In the case of the HPGP/ADN, disposal of residual propellant is treated as
a non-toxic material, so a controlled burn using an absorbent to hold the
propellant is permissible. The exhaust components released into the atmosphere
as a result of the controlled burn are only N2, H2, CO, and CO2. Liquid waste
handling and disposal, as well as facility dismantling and demolition only require
that the propellant exposure areas be flushed with water, and that the resulting
waste water be treated as non-toxic waste. These processes present a significant
reduction in cost over the baseline hydrazine requirements (Dinardi and ECAPS
Corporation, Site Visit Interviews and Data Provided by ECAPS Subject Matter
Experts 2011).
After completion of these disposal activities, the site/facility must then be
restored as the final part of the decommissioning process. Final closing of
facilities includes decontaminating and removing all remaining equipment and
restoring natural landscaping which must then be maintained (Harding Lawson
Associates, O.H. Materials Corporation 1989).

77
4.3. Identification of Significant Cost Drivers
When determining the most significant cost drivers, one must first identify the
vantage point from which the decision must be made. If an entity wants to make a
decision about whether to become the first supplier of a new propellant that will
replace the baseline propellant, their view is significantly different from the one in
which an entity needs to make a decision about whether to continue operating with
the baseline propellant versus transitioning to operations with a new green propellant.
For the purposes of this research, the significant cost driver is derived based upon an
intended decision to continue operating with a baseline propellant versus transitioning
to an alternative propellant.
Although the cost factors identified in this research are by no means
comprehensive (additional costs will be identified with more time and resources spent
during the development of proposed alternatives), the cost factors that were identified
provide a realistic starting point for identifying cost drivers and true costs incurred
over the life of the propellant options. After examination of the costs factors over the
life of the propellant as described in section 4.1 above, it is clear that one of the most
significant impact areas is in the manufacturing phase of the life cycle. However,
since this analysis is being performed from the baseline versus alternative vantage
point, the direct and indirect costs associated with manufacturing the baseline and
alternative fuels would not need to be identified and highlighted because propellant
manufacturer includes these factors in the price of the propellant. End users simply
procure the propellant and are unaware of the contributing costs in the purchase price.
It is certainly worth mentioning here that if a new propellant is introduced into the
78
market, the purchase price would need to include all of the start-up direct and indirect
costs that the manufacturers would incur; as a result, the initial price may be
significantly more than the price for the baseline propellant until the market for the
new propellant increases enough to bring the price down.
Clearly the largest environmental cost drivers over the life cycle of the
propellant are the facility operations and maintenance, the end of life disposal, and
the transportation. The costs associated with health and human safety protection
while operating with hazardous materials are major cost drivers for propellant
selection. Specific construction requirements; certification, training, and inspection
requirements; hazard detection/spill prevention/mitigation measures; storage and
transportation options/requirements; SCAPE suit requirements; medical, fire, and
range safety personnel requirements; and decontamination and other end of life
requirements present significant direct, indirect, and capital costs over the life of the
propellant, and must be quantified and included in all future decision trade analyses.
4.4. Application of Cost Factors to Life Cycle Analysis Tools
Table 4.4-1 below is a sample template utilizing the significant cost factors
identified above that should be included in future total life cycle cost analyses. Each
cost category has been broken into operational cost and capital cost elements for more
clear visibility into expected costs. These cost categories should be identified for
both the baseline option and the alternative option over the expected life of the
propellant.

79
Table 4.2.4-1: Template for Application of Environmental Cost Factors in Analysis
ENVIRONMENTAL COST FACTORS
FOR LIFE CYCLE ANALYSIS 2011 2012 2013 2014 2015
FACILITY OPERATIONS &
MAINTENANCE A. GENERAL SAFETY
CONSIDERATIONS: Operational Costs:
1. Safety training, certifications, and
annual renewal of certifications 2. Medical monitoring
Capital Costs: 3. Hand-held communication devices for
emergency and auxiliary use B. SITE CONSTRUCTION,
CONTROL, AND ACCESS: Operational Costs:
1. Security Services 2. Mandatory safety personnel (fire,
medical, range safety) 3. Additional manpower requirements
for SCAPE operations 4. Restricted Access/Down Time during
hazardous propellant loading operations Capital Costs:
1. Entrance to facility controlled by
guard station 2. Restricted Access to Hazardous
Operations Zone 3. Contamination reduction zone 4. Spill handling & disposal (catchment
tanks) C. AIR MONITORING: Operational Costs:
1. Station monitoring 2. Calibration and maintenance of
monitoring equipment Capital Costs:
1. Purchase of air scrubbers 2. Purchase and installation of permanent
air monitoring stations 3. Personal dosimeter badges

80
D. PERSONAL PROTECTIVE
EQUIPMENT (PPE) Operational Costs:
1. Cleaning and Maintenance of SCAPE
Suits 2. Disposal of PPE's as Required
Capital Costs: 1. Purchase of SCAPE Suits 2. Purchase of non-SCAPE Suit PPE's
E. DECONTAMINATION
PROCEDURES: Operational Costs:
1. Individual decontamination before
leaving the hazardous operations zone 2. Collection and Treatment of
Contaminated Washwater 3. Fuel cart decontamination 4. Drum decontamination
Capital Costs: 1. Purchase of washtubs, brushes,
citric acid and Decontamination Requirements
2. Replacement of spill catchment
tanks (when necessary)
F. STORAGE Operational Costs:
1. Temperature control Capital Costs:
1. Special storage containers for
hazardous materials 2. Special materials for hazmat
operations (nitrogen blanket/purging, etc.) SHIPPING/TRANSPORTATION
Operational Costs: 1. Special transporter
training/certification 2. Transporter liability insurance
Capital Costs: 1. Special storage/shipping drums END OF LIFE DISPOSAL
A. Propellant End of Use: Operational Costs:
1. Disposal of contaminated objects

81
2. Disposal of residual propellant/waste 3. Propellant drum return
B. Facility Decommissioning: Operational Costs:
1. Hazard Reduction 2. Liquid waste handling and disposal 3. Dismantling and demolition
Capital Costs: 1. Site restoration costs
CASE STUDY – PRISMA MISSION
5.1. Test Case Study Comparing Actual Flight of Hydrazine System versus a
“Green” Ammonium Dinitramide System
It is clear in much of the literature that the dominant expectation when one
compares life cycle operations including environmental effects of a high
performance green propellant to that of a toxic one like hydrazine, is that one will
see some magnitude of cost reductions. As presented above, there are many paid
quantifiable internal costs that are currently not accounted for when life cycle
analyses are performed. In order to understand the magnitude of cost impact
associated with the most significant cost driver areas based upon data collected in
this research (identified above), an actual flight mission (the Prisma mission) was
used as a case study to examine these cost factors using real data. This mission

82
presents an opportunity to compare a subset of environmental impact costs for a
baseline hydrazine system to a new HPGP system using actual mission costs. The
detailed description of the mission objectives, performance, and results is
presented in the SSC/ECAPS Flight Report for the Basic Mission and Test Plan
for Extended Mission (ECAPS Corporation 2011). The information described
below was developed from a combination of the flight report document, the site
visit discussions in Sweden, and follow-up data provided by the ECAPS mission
team members.
5.1.1 Background and Mission Description
PRISMA is a demonstration mission focused on testing formation flying
and rendezvous technology in an actual space environment. The mission was
formulated by the Swedish Space Corporation, and was funded by the Swedish
National Space Board with a prime contract to OHB Sweden, and support from
the German Aerospace Center (DLR), the French National Space Center (CNES),
and the Technical University of Denmark (DTU). The mission concept consists
of two spacecraft – Mango and Tango (see Figure 5.1.1-1 below).

83
Figure 5.1.1-1: PRISMA Mission Logo and Launch Vehicle (Dinardi, High Performance Green Propulsion
(HPGP) On-Oribit Validation & Ongoing Development 2011)
The larger spacecraft, Mango, has two monopropellant systems onboard –
a hydrazine system, which serves as the baseline, and an HPGP ADN system to
demonstrate new technologies (see Figure 5.1.1-2 below). This is the first time
that a hydrazine system is being flown on the same spacecraft as an HPGP ADN
system, and the mission provides a ground-breaking, premier one-to-one
comparison capability for assessing operational environmental impacts.
Figure 5.1.1-2: Prisma Main Spacecraft Propulsion System with a Hydrazine Tank
and an HPGP ADN tank (Dinardi, High Performance Green Propulsion
(HPGP) On-Oribit Validation & Ongoing Development 2011)

84
5.1.2 Transportation of Propellant
During the launch campaign, the ground support equipment, the
Prisma spacecraft, and the HPGP propellant were all flown by aircraft
from Sweden to the launch facility in Russia (see Figure 5.1.2-1 below).
In Europe, the HPGP (LMP-103S, which is an ADN blend) has been
classified as UN Class 1.4S. That means that it is safe for air
transportation, including passenger aircraft.
Figure 5.1.2-1: PRISMA HPGP Transportation
Due to the hazardous nature of hydrazine, it could not be shipped
via aircraft in Europe, so it was transported from Germany on a ship to St.
Petersburg and then transported by truck to the Russian launch facility
months in advance of the launch campaign (ECAPS Corporation 2011).

85
5.1.3 Handling and Operations During Launch Campaign
The sequence for the propellant loading operation consisted of the loading
of the micropropulsion cold gas system, the loading of the HPGP system, and
then the loading of the hydrazine system. This loading process required five days
in the fueling hall. The operations team made specific mention of the fact that
there was a clear ―benefit‖ observed while performing operations with the HPGP
compared to the hydrazine propellant. Because the HPGP was classified as a non-
hazardous propellant, all operations associated with the HPGP system were
declared as non-hazardous operation. That meant that the employees were not
required to wear SCAPE suits during handling and fueling operations, and parallel
operations at the launch range did not have to be shut down during propellant
loading operations. Operations with hydrazine required all regulated hazardous
operations standards including use of SCAPE suits, larger manpower
requirements, and a required presence of emergency medical and fire personnel
during operations (see Figure 5.1.3-1 below) (ECAPS Corporation 2011).

86
Figure 5.1.3-1: Personal Protection Equipment - HPGP vs Hydrazine (Dinardi, High Performance Green
Propulsion (HPGP) On-Oribit Validation & Ongoing Development 2011)
For HPGP, the propulsion system loading process included unpacking all
shipped components, preparation of the ground station equipment for pre-loading
checkouts, a functional test of the spacecraft, on-range safety meetings, loading of
the fuel, pressurizing the tanks, and decontamination of the fueling cart. This
comprehensive process was accomplished by a team consisting of two specialists
and one part-time technician, over a period of seven days. Two days were
required for propellant handling, fueling and decontamination. In contrast, the
hydrazine loading activities required five mission fueling specialists and more
than twenty specialists from the launch base hydrazine fueling support team.
These specialists were required for fourteen days in comparison to the seven day

87
operations with HPGP (see Figure 5.1.3-2 below). Although both processes
require the same procedures for checking out the system before the fuel is loaded
and for actually loading the fuel, the process for hydrazine required more than
three times the amount of manpower than that for HPGP (ECAPS Corporation
2011).
Figure 5.1.3-2: Launch Campaign Fueling Timeline (ECAPS Corporation 2011)
Fueling cart decontamination for the hydrazine operations required
three people for three days, as compared with the HPGP operations where
one person completed the operation in one hour. When comparing and
contrasting the toxic waste produced during operations, the team noted
also that there was a significant difference between the two. From the
hydrazine operations, the waste consisted of 29 liters (~8 gallons) of
hydrazine (excess), 400 liters (~105 gallons) of contaminated de-ionized
water, and 70 liters (~18 gallons) of isopropyl alcohol. Since the
destruction of hydrazine was determined to be a ―significant operation‖ by

88
the Russian launch range, special measures had to be adhered to. HPGP
operations, the waste consisted of 1 liter (~1/4 gallon) of propellant and 3
liters (~ ¾ gallon) of isopropyl alcohol/de-ionized water that was
considered to be non-toxic (see Figure 5.1.3-3 below). The launch base
provided disposal of these wastes at no charge (ECAPS Corporation
2011).
Figure 5.1.3-3 Environmental Wastes from the Launch Campaign (ECAPS
Corporation 2011)
5.1.4 Assessment of Quantifiable Internal Costs: Comparison of Hydrazine
to HPGP
While the costs provided by ECAPS do not represent a one-to-one
comparison of the internal cost elements identified in the table above, the Prisma
mission table below does specifically call out some of those elements, while
incorporating a few of the other elements into combined general headings (see
Table 5.1.4-1 below). Because of the proprietary nature of the detailed cost data,
the costs could not be broken down further for publication, and the hydrazine
individual line item costs could not be provided (only the subtotaled cost for the

89
same items listed for HPGP). A review of the table below shows that the costs
that were specifically provided represent a marked difference depending upon
whether operations were with hydrazine or with HPGP. Because of the hazardous
operation requirements as described in earlier sections, the Prisma team spent
€100,000 more during launch site operations, and ~ €120,000 more for propellant
and propellant shipping costs for the hydrazine loading activities (ECAPS
Corporation 2011).
Table 5.1.4-1: Comparison for Prisma HPGP vs Hydrazine (Dinardi and ECAPS Corporation, Site Visit
Interviews and Data Provided by ECAPS Subject Matter Experts 2011)
The total spent during Phase E (spacecraft propellant loading) operations
was ~ €80,000 more for hydrazine than for the HPGP system. Although specific
line item values were not provided for hydrazine, discussions with the team

90
revealed that the bulk of the difference in cost resulted from the fueling procedure
and the range safety measure requirements for hydrazine. Considering only the
Phase E costs identified in the Prisma table, the overall cost difference when
operating with HPGP versus the industry standard baseline hydrazine was
~$440,000. This represents an over 2/3 reduction in cost from the baseline, and
does not include the costs associated with ―down time‖ or loss in production
during mandatory shut down of parallel operations during hydrazine fueling. This
case study also revealed that the sum of quantifiable internal cost elements like
ground station equipment refurbishment requirements for hazardous materials,
propellant shipping costs, propellant disposal and drum return, range safety
requirements, special training and certification requirements for hazardous
materials, etc. pose a significant cost impact over the life of the propellants that
are used by the space community. The few items identified during the Prisma
launch campaign represent an overall cost for the baseline system of ~ $650,000
for one launch campaign. These costs are significant, and scale up with expected
proportional increases for larger more complex missions. For those entities where
multiple launches occur, many of these are recurring costs and must be included
in future life cycle cost analyses (ECAPS Corporation 2011).
CONCLUSIONS
6.1. Summary of Findings

91
Large uncertainties of performance and expense have been an on-going
deterrent to serious consideration of less-toxic green propellants as alternatives to
hydrazine for aerospace propulsion systems. Although candidate propellants may
equal or even surpass the performance of current propellants, with environmental
benefits that have been documented, life cycle trade analyses performed to date have
not provided a sufficient business case for investment in such a significant
infrastructural change. One of the reasons that the business case has not closed in the
past is that the analyses have been incomplete - typically focused on broad cost,
performance, and risk characteristics, and have not taken into account the
comparative costs associated with the environmental impacts of the alternatives.
Environmental costs incurred over the life cycle can be significant, and failure to
consider these costs can result in missed opportunities for new technology infusion.
The research presented here provides the space community with a much
needed and desired baseline set of environmental decision criteria to be used to
perform comparative life cycle trade analyses for future propellant selection
decisions. The analysis performed as a part of this research effort resulted in a
sample model utilizing the significant cost factors identified via research, site visits,
interviews, and case studies of actual missions that should be included in future total
life cycle cost analyses. These cost factors (broken into operational cost and capital
cost) should be identified for both the baseline option and the alternative option over
the expected life of the propellant, and then used in a customized cost benefit analysis
to determine feasibility of adoption. Over the course of the investigation for this
research, it became quite evident that the biggest environmental cost drivers over the

92
life cycle of the propellant are facility operations and maintenance, end of life
disposal, and transportation (at least from the end user’s perspective/vantage point).
That finding became clearer with every site visit and every discussion held with the
subject matter experts that work in this field day in and day out. The costs associated
with health and human safety protection while operating with hazardous materials are
major cost drivers for propellant selection and present significant direct, indirect, and
capital costs over the life of the propellant. These costs can be significant, and must
be included in the analyses for informed decision-making. When environmental costs
are included in the analysis, one can potentially bridge the gap between traditional
investment and return on investment models in a timeframe that can be acceptable to
investment decision-makers.
6.2. Recommendations and Future Work
In order to provide a realistic view of how the research conducted can be used
and expanded in the propellant decision-making process, a logic model was
developed to illustrate a sample program’s goals, activities in support of pursuing
those goals, and the resulting outcomes. This kind of model can aide a decision-
maker to clearly understand and visually represent the intended relationship between
a program’s investments and results (McLaughlin and Jordan 1999).
Figure 6.2-1 below is a graphical representation of a logic model that could be
used to develop the business case for selecting and implementing ―green‖ propellants
for the future. Using this logic model approach, one can more easily see the
requirements and areas in need of further development.

93
Figure 6.2-1: Logic Model Discussion for Selection of Future Propellants
First, one must understand the SITUATION that brings about the need for the
proposed program activities. In order to address the entire business case for green

94
propellants, one must understand what the overall capacity requirements will be, so that
the amount of propellant to be manufactured can be assessed. This would require a study
of the predicted amount of missions that could utilize this capability, based upon current
estimates of budget profiles. This could be a comprehensive study, which should include
not just science mission applications, but technology demonstration mission applications
as well. The SITUATION is also where competition sensitivities are brought to the table.
Currently, the international community has made significant strides towards prioritizing
investments in ―green‖ technologies. The European Union has conducted a major reform
of European Union chemical policies that would affect the whole supply chain for users
and producers of chemicals. The REACH (Registration, Evaluation, Authorization and
Restrictions of chemicals) regulation places substances of very high concern (SVHC) on
a banned substances list, and companies cannot use them unless they receive
authorization to use them on the European Market. Hydrazine has recently been added as
a candidate for that list (European Union 2011). That has been an impetus for European
entities to find creative alternatives to hydrazine for all applications. Future work in this
area must first assess whether or not this same approach is planned for adoption in the
U.S. If so, it would be a major driver for finding ―green‖ alternatives.
Once all assumptions and inputs are considered, the INNOVATION is presented
and assessed. This point is the nexus of the innovative technologies with any innovations
in the processes used to assess those innovative technologies. The environmental cost
factors identified in this research were restricted to those that could be documented and
quantified in a short enough time-frame to be used in relatively short trade study
analyses. Use of these cost factors by any decision-maker should require that these

95
factors be quantified as much as possible up front as a part of their proposal development
budget. Because the proposed HPGP/ADN propellant has never been developed or flown
in the U.S., the environmental cost criteria are limited to information that was shared
from the Swedish subject matter experts. Therefore, there will undoubtedly be additional
cost factors that were not uncovered in this research that could pose a significant impact.
Activities surrounding bringing this propellant into the U.S. for testing and certification
would flesh out some of these cost factors, and provide more confidence in the costs
associated with the cost factors that were identified during this research effort.
Additional future research in this area might focus on identifying external costs that are
difficult to quantify, and include those factors like valuing human lives, etc.
Using the outputs of the cost benefit analysis, an analyst could assess the
transition costs associated with using the alternative propellant in the U.S., including
infrastructure changes; propellant access, cost, and demand; and propellant certification
and testing costs. These would be critical pieces of information to inform the decision.
Once the decision-maker has all of the information need to make a decision, and the
choice is made to proceed to implementation, additional work must be completed to plan
for the successful evaluation and ADOPTION of the implementation plan. Further
iterations of the environmental cost factors and other trade study parameters would then
need to be combined to assess feasibility, and to develop implementation plans for each
phase of the life cycle. This is where more clarity would be provided for time/labor
requirements, detailed facility transition costs, and expected capacity requirements.
The results that emerge from the adoption activities will show short-term, mid-
term, and long-term benefits to the sponsoring entity. The future work activities
96
described here, can contribute significantly to enabling impactful infusion of new
technologies and capabilities. A success program of this nature could position the U.S. to
have more capable, affordable, and safe aerospace missions; improve our stewardship of
the environment; reduce the amount of hazardous material use in the U.S.; and spur
innovation and technology development in the U.S.

97
Bibliography
(NEPIS). "Environmental Protection Agency - National Service Center for
Environmental Publications (NSCEP)." Incorporating Environmental Costs and
Considerations in to Decision-Making: Review of Available Tools and Software.
1995. http://nepis.epa.gov/Exe/ZyPURL.cgi?Dockey=20000ZEU.txt (accessed
August 2010).
"3rd International Conference on Green Propellants for Space Propulsion." University of
Poitier sponsored website. July 2006. http://sfa.univ-
poitiers.fr/green_propellants/invitation/index.html (accessed February 1, 2008).
Allen, David T., Charles Allport, Kristopher Atkins, and et.al. PROPULSION AND
POWER RAPID RESPONSE RESEARCH AND DEVELOPMENT (R&D)
SUPPORT Delivery Order 0011: Advanced Propulsion Fuels Research and
Development‒Subtask: Framework and Guidance for Estimating Greenhouse Gas
Footprints of Aviation Fuels. Interim Report, WRIGHT-PATTERSON AIR
FORCE BASE: AIR FORCE RESEARCH LABORATORY, PROPULSION
DIRECTORATE, 2009.
Arch Chemicals. Responsible Care for Anydrous Hydrazine. 2011.
http://www.archchemicals.com/Fed/HDR/Products/Propellants/responsiblecare.ht
m#Anhydrous_Hydrazine__AH_ (accessed June 2011).
Bennett, Dr. Robert. "Alternate Propellant Research and Studies for Improved
Performance and Cost Reduction." International Conference on Green Propellant
for Space Propulsion. Noordwijk, The Netherlands: European Space Agency -
European Space Research and Technology Center, 2001.
BuildingGreen, Inc. An Energy, Environmental, and Economic Resource Guide for
Federal Facility Managers and Designers. DOE Prime Contract No. DE-AC36-
99GO10337, NREL Subcontract No. AAR-0-29469-01, Brattleboro: U.S.
Department of Energy, Office of Energy Efficiency and Renewable Energy,
Federal Energy Management Program, 2001.
Congress, United States. Energy Independence and Security Act of 2007. 2007.
http://frwebgate.access.gpo.gov/cgi-
bin/getdoc.cgi?dbname=110_cong_bills&docid=f:h6enr.txt.pdf (accessed October
2010).

98
Davenas, A. "Development of Modern Solid Propellants." AIAA Journal of Propulsion
and Power 19, no. 6 (December 2003).
David T. Allen, et.al. Framework and Guidance for Estimating Greenhouse Gas
Footprints of Aviation Fuels. Interim Report for Delivery Order 0011; Contract
Number FA8650-08-D-2806-001, Air Force Research Laboratory, 2009.
Department of Defense. "Life Cycle Costing Guide for Acquistions." January 1973.
http://www.dtic.mil/cgi-
bin/GetTRDoc?AD=ADA328744&Location=U2&doc=GetTRDoc.pdf (accessed
2010).
Department of Justice. Bureau of Justice Statistics - Forensic Investigation. November
23, 2011. http://bjs.ojp.usdoj.gov/index.cfm?ty=tp&tid=78 (accessed November
23, 2011).
Dinardi, Aaron. High Performance Green Propulsion (HPGP) On-Oribit Validation &
Ongoing Development. Powerpoint Presentation, ECAPS Corportation, 2011.
Dinardi, Aaron, and et. al. ECAPS Corporation, interview by Christyl Johnson. Site Visit
Interviews and Data Provided by ECAPS Subject Matter Experts (September
2011).
ECAPS Corporation. PRISMA HPGP Propulsion System In-Flight Demonstration.
Stockholm, July 19, 2011.
Econation. "External Costs vs Internal Costs." Econation: Making Sense of
Sustainability. 2010. http://www.econation.co.nz/external-costs.html (accessed
October 2010).
Energy Technology Support Unit, Harwell and Metroeconomica. EXTERNALITIES OF
ENERGY, "EXTERNE" PROJECT, Method for Estimation of Physical Impacts
and Monetary Valuation for Priority Impact Pathways, Vol 2. Study Report,
Oxfordshire, UK: European Commission, n.d.
Environmental Literacy Council. "Cost Benefit Analysis." Environmental Literacy
Council Website. March 2008.
http://www.enviroliteracy.org/article.php/1322.html (accessed February 2010).
Environmental Protection Agency (EPA). "LIFE CYCLE ASSESSMENT 101:
PRINCIPLES AND PRACTICE." Life Cycle Assessment Research - LCA 101.
May 2006.
99
http://www.epa.gov/nrmrl/lcaccess/pdfs/chapter1_frontmatter_lca101.pdf
(accessed March 2010).
European Commission. External Costs: Research results on socio-environmental
damages due to electricity and transport. Research Results Report, Luxembourg:
Office for Official Publications of the European Communities, 2003.
—. "External Costs: Research Results on Socio-Environmental Damages Due to
Electricity and Transport." ExternE - Externalities of Energy. A Research Project
of the European Commission. 2003. http://www.externe.info/externpr.pdf
(accessed 2010).
European Union. REACH (Registration, Evaluation, Authorization and Restrictions of
chemicals). November 22, 2011.
http://export.gov/europeanunion/reachclp/index.asp (accessed November 26,
2011).
Fuller, Sieglinde K. "Guidance on Life-Cycle Cost Analysis Required by Executive
Order 13123." U.S. Department of Energy, Energy Efficiency & Renewable
Energy. April 2005. http://www1.eere.energy.gov/femp/pdfs/lcc_guide_05.pdf
(accessed July 2010).
"GPO Home Page." Electronic Code of Federal Regulations. n.d.
http://ecfr.gpoaccess.gov/cgi/t/text/text-
idx?c=ecfr&tpl=/ecfrbrowse/Title10/10cfr436_main_02.tpl (accessed October
2010).
Gupta, Dr. Mohan. Addressing Environmental Constraints to Allow Sustainable Green
Aviation. April 26, 2009. http://event.arc.nasa.gov/Green-
Aviation/home/pdf/FAA_green_aviation.pdf (accessed March 13, 2010).
H. Paul Barringer, P.E. "A Life Cycle Cost Summary." Barringer & Associates, Inc. May
2003. http://www.barringer1.com/pdf/LifeCycleCostSummary.pdf (accessed July
20, 2010).
Hanley, Nick, and Clive L. Splash. Cost Benefit Analysis and the Environment.
Massachusetts: Edward Elgar Publishing, 2003.
Harding Lawson Associates, O.H. Materials Corporation. Hydrazine Blending and
Storage Facility Interim Response Action Implementation Final Safety Plan.
Safety Plan, Commerce City, CO: Rocky Mountain Arsenal, 1989.

100
Hestermannm, Lyle V. "Personal Property Life Cycle Costs, A Standard." National
Property Management Association: Leaders in Asset Managment. n.d.
http://www.npma.org/Archives/Hestermann.pdf (accessed August 2010).
Huppes, Gjalt, et. al. Life Cycle Costing and the Environment. Project Report
Commissioned by the Dutch Government, Dutch Ministry of VROM-DGM,
2004.
International Civil Aviation Organization, Air Transport Bureau (ATB) . ICAO: Uniting
Aviation on Climate Change. 2009. http://www.icao.int/Act_Global/ (accessed
November 2010).
Joint Legislative Audit and Review Committee. "State of Washington Joint Legislative
Audit and Review Committee (JLARC) Life Cycle Cost Model Update."
Washington State Legislature. February 21, 2007.
http://www.leg.wa.gov/JLARC/Documents/awards/07-5.pdf (accessed 2011).
Kats, Greg, Leon Alevantis, Berman Adam, and et.al. The Costs and Financial Benefits
of Green Buildings. Task Force Report, California's Sustainable Building Task
Force, 2003.
M. Fick, et. al. "Industrial Benefits of Applying HNF in Monopropellant Satellite
Propulsion." First International Conference on Green Propellants for Space
Propulsion. Noordwijk, The Netherlands: European Space Agency - European
Space Research and Technology Center, 2001. 138.
Mabie, Kevin, et.al. Green Propellant Evaluation Tool. Contract Task Report, Herndon:
Valador Inc., 2010.
McLaughlin, John A., and Gretchen B. Jordan. "Logic models: a Tool for Telling Your
Program's Performance Story." Evaluation and Program Planning volume 22,
1999: 65-72.
NASA. "NASA - Exploration." NASA's Exploration Systems Architecture Study -- Final
Report. November 2005. http://www.nasa.gov/pdf/140631main_ESAS_01.pdf
(accessed November 2009).
Ozkan, Deniz. "Benefit Cost Analysis." Course Handout Notes: EMSE 261 - Economic
Analysis in Engineering Planning. Washington, DC, Fall 2008.
Prince, Andy, interview by Christyl Johnson. Study Team Cost Lead (March 1, 2010).

101
Rabl, Ari and Holland, Mike. "Environmental Assessment Framework for Policy
Applications: Life Cycle Assessment, External Costs and Multi-Criteria
Analysis." Journal of Environmental Planning and Management, 2008: 81-105.
Reckon, LLP. Pareto Improvements and Kaldor-Hicks Efficiency Criterion. February
2009.
https://shadow.unitedhosting.co.uk/reckon.co.uk/online/open.cgi?Pareto_improve
ments_and_Kaldor-Hicks_efficiency_criterion (accessed September 2010).
Richard Keinath, et. al., interview by Christyl Johnson. Hypergolic Systems Manager
(November 2010).
Senthil Kumaran D, S K Ong, Reginald B H Tan, and A Y C Nee. "Environmental Life
Cycle Cost Analysis of Products." April 27, 2000.
http://www.lcacenter.org/InLCA/pdf/4cKumaran.pdf (accessed August 2010).
Simpson, D.K. "Safety and Handling of Hydrazine." 22nd Department of Defense
Explosives Safety Seminar. Anaheim: Department of Defense, 1986. 947-968.
Steen, Bengt. "Environmental Costs and benefits in life cycle costing." Mangement of
Environmental Quality, 2005: 107-118.
Stringham, Edward. "KALDOR-HICKS EFFICIENCY AND THE PROBLEM OF
CENTRAL PLANNING." THE QUARTERLY JOURNAL OF AUSTRIAN
ECONOMICS VOL. 4, NO. 2, 2001: 41–50.
The President of the United States. "Executive Order 13514 - Federal Leadership in
Environmental, Energy, and Economic Performance." U.S. Department of
Energy: Energy Efficiency and Renewable Energy. October 8, 2009.
http://www1.eere.energy.gov/femp/pdfs/eo13514.pdf (accessed 2010).
The White House. "The Office of Managment and Budget." Circular No. A-94 Revised.
October 29, 1992. http://www.whitehouse.gov/omb/circulars_a094/ (accessed
October 2010).
Thiokol Chemical Corp Brigham City, UT. "Utilization of Ammonium Dinitramide
(ADN) in Propellant Formulations." Technical Report #A660504; Contract
#N00014-95-C-0215, N00174-95-C-, 1998.
Tmiyama, T., Y. Umeda, and D. Wallace. "A Holistic Approach to Life Cycle Design."
Life Cycle Networks Proceedings of the 4th International Seminar on Life Cycle
Engineering, CIRP. Berlin, June, 1997. 92-103.
102
tutor2u. What are Externalities? n.d.
http://tutor2u.net/economics/content/topics/externalities/what_are_externalities.ht
m (accessed September 2010).
U.S. Department of Energy; Office of Energy Efficiency and Renewable Energy; Federal
Energy Management Program. Federal Energy Management Program. January 8,
2003. http://www1.eere.energy.gov/femp/pdfs/eoguidancedoc.pdf (accessed
2010).
U.S. Environmental Protection Agency. Technology Transfer Network - Air Toxics Web
Site. November 06, 2007. http://www.epa.gov/ttn/atw/hlthef/hydrochl.html
(accessed 11 2009).
Vittorio Bombelli, Dieter Simon, and Ton maree, Jean-Luc Moerel. "Economic Benefits
of the Use of Non-Toxic Mono-Propellants for Spacecraft Applications." 39th
AIAA/ASME/SAE/ASEE Joint Propulsion Conference and Exhibit. Huntsville,
AL: American Institute of Aeronautics and Astronautics, 2003.
Watkins, Thayer. An Introduction to Cost Benefit Analysis, San Jose State University
Department of Economics. San Jose, n.d.
Wikipedia, The Free Encyclopedia. "Kaldor–Hicks Efficiency." Wikipedia. August 2010.
(accessed September 2010).
Wingborg, Niklas. "ADN-Based Liquid Monopropellants: Propellant Selection and Initial
Thruster Development." 3rd International Conference on Green Propellants for
Space Propulsion. Poitiers, France: FOI, Swedish Defense Research Agency,
2006.
Wingborg, Niklas. Development of Propulsion System for Solid ADN-Based Propellants.
Research Proposal, FOI, Swedish Defense Research Agency, 2007.
www.eurenco.com. Eurenco, Groupe SNPE. n.d.
http://www.eurenco.com/en/about/index.html (accessed 2011).
Xiaoyu Yan, Roy J. Crookes. "Life Cycle Analysis of Energy Use and Greenhouse Gas
Emissions for Road Transportation Fuels in China." Renewable & Sustainable
Energy Reviews, June 2009: 2505-2513.