Embed Size (px)
Citation preview

Environmental Justice and Public Beach AccessJinwon Kim*University of Florida
Seong Ok LyuKorea University
HakJun SongPai Chai University
Beaches are an important recreational setting due to their provision of ideal openspaces for diverse water- and land-based recreation opportunities. Despite the im-portance of assessing the environmental justice of public beach access, few em-pirical studies have been conducted in community recreation. Using an environ-mental justice framework, this study examined whether inequities exist for certainracial/ethnic and socioeconomic groups with respect to the distribution of publicbeach access in the Detroit Metropolitan Area. Results indicated that inequitablepublic beach access is associated with population density, median housing value, el-derly population, and nonvehicle ownership. Such findings can help public leisureagencies to assess environmental justice, a first step in developing more effectivecommunity recreation planning and management policies. Study implications, lim-itations, and recommendations for further research are also discussed.
INTRODUCTION
A variety of recreation settings such as parks, playgrounds, trails, golf courses, and otherpublic and blue spaces are public open spaces (POSs) that provide local residents withopen space opportunities for recreational purposes (Kim and Nicholls 2016a). Access toPOSs has been recognized as an important indicator demonstrating how urban systemsare successfully operated and an essential catalyst facilitating residents’ perceptions ofwell-being (Nicholls 2001). Chiesura (2004: 129) noted that “ . . . urban parks and opengreen spaces are of strategic importance for the quality of life of our increasingly urban-ized society.”
However, not all people have adequate access to POSs. There has been a growing so-cial and political concern regarding economically disadvantaged communities as wellas racial and ethnic minorities who are disproportionately excluded from the environ-mental benefits from access to POSs (Deng, Walker, and Strager 2008). If there are anydisparities in levels of access to POSs with regard to age, race, ethnicity, income, or otherdemographic/socioeconomic characteristics, it is an environmental injustice (Deng,
∗Correspondence should be addressed to: Jinwon Kim, Department of Tourism, Recreation and Sport Manage-ment, University of Florida, Gainesville, FL 32611, USA; [email protected].
City & Community 18:1 March 2019doi: 10.1111/cico.12372C© 2019 American Sociological Association, 1430 K Street NW, Washington, DC 20005
49

CITY & COMMUNITY
Walker, and Strager 2008; Porter and Tarrant 2001; Tarrant and Cordell 1999; Tayloret al. 2007). Environmental justice refers to the fair treatment of all people regardless oftheir racial/ethnic or socioeconomic factors with respect to environmental benefits andcosts (Floyd and Johnson 2002). Byrne et al. (2009) defined environmental justice as “atheoretical frame and a civil-right based social movement that seeks to understand howenvironmental benefits and harms are ethno-racially and socioeconomically differenti-ated among urban populations” (p. 365). The importance of equitable access to POSshas been discussed in the context of environmental justice since the early 1980s. In par-ticular, following President Clinton’s Executive Order 12898 in 1994, all public leisureservice agencies have been mandated to assess environmental justice in racial/ethnic orsocioeconomic minorities with regard to access to environmental benefits and costs.
To assess environmental justice in community recreation, previous studies have mea-sured the degree of equity associated with the distribution of access to POSs. A fundamen-tal question related to the equity of POSs is whether the distribution of access to them isindeed equitable among different demographic and socioeconomic groups. Numerousstudies have attempted to determine whether inequitable access to POSs exist for certainsocioeconomic and racial groups with regard to the distribution of urban parks (Byrne,Wolch, and Zhang 2009; Maroko et al. 2009; Moore et al. 2008; Nicholls 2001; Omer2006; Talen 1998), urban trails (Estabrooks, Lee, and Gyurcsik 2003; Lindsey, Maray, andKuan 2001), playgrounds (Smoyer-Tomic, Hewko, and Hogson 2004; Talen and Anselin,1998), golf courses (Deng, Walker, and Strager 2008), recreational forests (Tarrant andCordell 1999), and campsites (Porter and Tarrant 2001).
Although there have been numerous studies measuring the equity of POSs in com-munity recreation, researchers have overlooked one important type of POSs—beaches.Beaches are an essential type of recreational setting that enables a variety of water- andland-based activities (Orams 1999). They can also offer visual interests, open spaces forcommunity interaction, and economic benefits associated with the income generatedthrough tourism (Dixon, Oh, and Draper 2012). Public beach access is everyone’s rightfor a better quality of life (Negris 1986). Racial/ethnic, social, and economic disparitiesin levels of residents’ access to beaches represent an environmental injustice. Despitethe urgent need to assess the environmental justice of public beach access, past studieshave typically focused on legal issues in the context of public trust doctrine, and few em-pirical studies have assessed whether the distribution of public beach access is indeedequitable with regard to different racial, ethnic, or socioeconomic groups. The purposeof this study was therefore to assess the environmental justice of public beach access inthe Detroit Metropolitan Area (DMA). Specifically, the level of access to and the degreeof equity inherent in the distribution of public beaches in the DMA were measured usingGeographic Information System (GIS)-based spatial analytical techniques.
LITERATURE REVIEW
ENVIRONMENTAL JUSTICE AND EQUITY IN COMMUNITY RECREATION
Environmental justice is a broad conceptual framework concerned with the inextricablelink between social, political, economic, and environmental issues (Albrecht 1995). It wasoriginally based on the US Civil Rights Act of 1964, enacted to prohibit discrimination
50

ENVIRONMENTAL JUSTICE AND PUBLIC BEACH ACCESS
against racial, ethnic, national, and religious minorities and women, and referred to theequal enforcement of rules, regulations, decisions, and frameworks in the distributionof locally unwanted land uses (LULUs), such as incinerators, waste facilities, and toxicrelease inventories (Porter 2001).
Following President Clinton’s 1994 Executive Order 12898, titled “Federal Actions toAddress Environmental Justice in Minority Populations and Low-Income Populations”,the framework of environmental justice was expanded to encompass a more comprehen-sive definition that includes disparities not only in exposure to environmental costs fromLULUs but also in access to environmental benefits from locally desirable land uses (LD-LUs) such as POSs. As Taylor et al. (2007) explained, access to POSs such as urban parksprovides numerous environmental benefits, with psychological (e.g., stress reduction),social (e.g., open spaces for community interaction), and health (e.g., benefits of ex-ercise) dimensions. Many scholars have indicated that environmental injustice can alsooccur when certain groups or individuals receive an unfair amount of access to POSs(Boone et al. 2009; Tarrant and Cordell 1999; Taylor et al. 2007). Accordingly, this morecomprehensive framework of environmental justice has been used to explore disparitiesin levels of access to POSs, including urban parks, urban trails, playgrounds, golf courses,national forests, and campsites in the community recreation literature (Kim and Nicholls2016b).
Equity is an important concept within the framework of environmental justice (DiChiro 1998). It is generally referred to as the fairness of a situation or distribution(Nicholls 2001). As noted by Wicks and Crompton (1986: 342), equity is “the perceivedfairness of resource allocation patterns.” Since inequities in the distribution of accessto POSs have been recognized as an environmental injustice (Byrne, Wolch, and Zhang2009; Sister, Wolch, and Wilson 2010), the concept of equity has been commonly used forassessing whether environmental (in)justice has occurred in previous community recre-ation literature (Porter and Tarrant 2001; Sister, Wolch, and Wilson 2010; Tarrant andCordell 1999). Several authors such as Lucy (1981) and Wicks and Crompton (1986) il-lustrated the four equity models such as equality, need (or compensatory), demand (orpreferences), and market (or willingness to pay) that have commonly been employed inthe community recreation literature.
Among these four equity models, compensatory or need-based model of equity hastypically been employed to measure the equity of POSs. Compensatory or need-basedequity is based on the assumption that extra services should be allocated to the mostneedy groups or areas (Deng, Walker, and Strager 2008). Though there has been somedebate to define the most needy groups or areas, they have typically been identified ac-cording to race/ethnicity and income characteristic under the assumption of the “un-derclass hypothesis,” that “systematic and deliberate discrimination exists against cer-tain socio-economically disadvantaged groups and areas in the distribution of goods andservices, resulting in their receiving fewer and/or poorer quality resources relative tomore advantaged citizens” (Nicholls 2001: 207). However, it seems that several empiri-cal equity studies of POSs also have utilized other variables such as age (Nicholls 2001;Talen 1997; Talen and Anselin 1998), educational attainment (Deng, Walker, and Strager2008; Lindsey, Maray, and Kuan 2001; Porter and Tarrant 2001; Tarrant and Cordell1999), economic status (Estabrooks, Lee, and Gyurcsik 2003), housing occupancy/value(Nicholls and Shafer 2001), language (Maroko et al. 2009), and population density(Lindsey, Maray, and Kuan 2001; Maroko et al. 2009; Nicholls 2001) as proxies for or
51

CITY & COMMUNITY
in addition to race/ethnicity and income. In community recreation, adopting a com-pensatory or need-based equity model is justified because ‘social equity’ assuming that“universal access to public parks and recreation is a right, not just a privilege” is oneof the National Recreation and Park Association’s (NRPA) three core pillars, includingconservation, health/wellness, and social equity (NRPA 2014).
MEASURING THE EQUITY AND ACCESSIBILITY OF POSs
To measure the degree of equity inherent in the distribution of access to POSs, sev-eral methods such as linear correlation (Gilliland et al. 2006; Omer 2006; Sister, Wolch,and Wilson 2010; Smoyer-Tomic et al. 2004), equity mapping (Talen 1997, 1998; Talenand Anselin 1998), and multiple regression (Deng, Walker, and Strager 2008; Porterand Tarrant 2001; Tarrant and Cordell 1999) have been utilized. Among these meth-ods, multiple regression has been recognized as the most powerful methodological ap-proach because linear correlation is limited to analyzing the relationships between sev-eral variables simultaneously. Equity mapping is a useful visualization tool, but it can-not establish the sociopolitical processes that determine who benefits from and whythey pay for public resources (Talen 1998). Multiple regression, however, overcomessome of the limitations of linear correlation and equity mapping. Deng et al. (2008)used logistic multiple regression analysis to measure the equity of public and privategolf courses relative to Chinese residents in Calgary, Canada. Porter and Tarrant (2001)employed logistic multiple regression analysis to determine whether inequities exist forcertain racial or socioeconomic groups with respect to the distribution of access to fed-eral tourism sites and campsites in Southern Appalachia. Tarrant and Cordell (1999)also used logistic multiple regression analysis to determine the spatial relationships be-tween outdoor recreation sites and census block (CB) group (CBG) variables in northernGeorgia.
Access measurements is a prerequisite for equity measurement (Smoyer-Tomic et al.2004). As noted by Talen and Anselin (1998), “accessibility is a tool used to discoverwhether or not equity has been achieved” (p. 596). Kim and Nicholls (2016a) identifiedfive different approaches to measuring POS access: (1) container approach, which de-fines accessibility based on the presence of POSs (e.g., the number or total area of POSs)within a specific geographic unit, such as a census tract (CT) or CBG; (2) minimumdistance approach, which defines accessibility as the minimum distance local residentsshould travel to reach the nearest POS; (3) travel cost approach, which defines accessi-bility based on the average or total distance between each residential neighborhood andall POSs; (4) spatial interaction model approach based on a gravity model, assuming thatPOSs are weighted by their attractiveness and the friction of distance; and (5) coveringapproach, which defines accessibility within a specific service radius measured not fromresidential neighborhoods to POSs. As noted by Kim and Nicholls (2016a), it assumesthat “residents are said to have access to a POS if they are located within its service areas,but they are deemed to have no access if they are not” (p. 122).
52

ENVIRONMENTAL JUSTICE AND PUBLIC BEACH ACCESS
BEACH, PUBLIC BEACH ACCESS, AND ENVIRONMENTAL JUSTICE
Beaches are an important type of POS that provides ideal open spaces for diverse water-and land-based recreational opportunities (Kim and Nicholls 2018; Lee, Penningon-Gray,and Kim 2019). For example, a variety of water- and land-based recreational activitiessuch as sailing, canoeing, jet skiing, snorkeling, surfing, trail biking, swimming, kayak-ing, and fishing can take place at water bodies such as beaches (Prideaux and Cooper2009). Furthermore, beaches can offer significant environmental, social, psychological,and economic benefits for local communities (Kim and Nicholls 2016a). Specifically,beaches provide wildlife habitat as well as attractive landscapes that differ from terres-trial environments (Jennings 2007); they can also offer educational opportunities forlocal citizens. Beaches may be used as places for residents to interact (Edgerton 1979);they enable a variety of water- and land-based activities and offer natural settings to relaxand reduce stress levels (Beatley, Brower, and Schwab 2002; Jennings 2007; Orams 1999).Visitors to beaches may be attracted by the promise of emotional well-being and physi-cal fitness, which can contribute to reduced health care costs and lower levels of crime(Godbey 1993; Meyer and Brightbill 1964). Well-designed and well-managed beaches canbring economic benefits to local communities. The income generated through tourism,such as the payment of user fees and spending at concessions, can contribute to regionaleconomic activity (Dixon, Oh, and Draper 2012; Oh et al. 2008; Yang et al. 2012). Theimportance of public beach access has, therefore, received much attention in various dis-ciplines including coastal management (Blizzard and Mangun 2008; Fischer 1988; Klineand Swallow 1998; Oh et al. 2008; Oh, Draper, and Dixon 2009; Lee 1999), law (Davi-son 2006; Dyer 1972; Elliott 1976; Kehoe 1994; Negris 1986; Poirier 1995; Summerlin1995), tourism (Dixon, Oh, and Draper 2012; Yang et al. 2012), environmental planning(Oehme 1987), and resource economics (Whitehead et al. 2008).
The issue of public beach access lends itself to examination within the framework ofenvironmental justice for two reasons. First, public beach access is a civil right in the con-text of public trust doctrine. The source of the doctrine is an ancient principle of Romanlaw holding that “by the law of nature, the air, running water, the sea, and consequentlythe shores of the sea were common to mankind” (Negris 1986: 438). Thus, a number ofbeach access movements have campaigned to protect the public’s right to access beachesbased on this doctrine (Kim 2015). Second, providing and improving public beach ac-cess for recreational purposes has been recognized as an essential responsibility of publicleisure agencies in their response to the Coastal Zone Management Act of 1972 (Lee1999). Though several discussions among scholars of law have addressed the importanceof equitable public beach access in the context of public trust doctrine (Davison 2006;Negris 1986; Oehme 1987; Poirier 1995; Summerlin 1995), no empirical studies havemeasured the equity of public beach access. The analyses presented here are thereforesomewhat novel in their emphasis on empirical measurements of accessibility and equityof public beach access.
53

CITY & COMMUNITY
METHOD
STUDY AREA: DMA, MICHIGAN
The DMA is referred to as Metro Detroit, which is located in Southeast Michigan cen-tered on the City of Detroit. According to the U.S. Census Bureau (2010), the DMAwas the 12th largest metropolitan area including three counties (Oakland, Wayne,and Macomb) with a population of 3,863,924 and an area of 1,958.96 square miles(3,463.2 km2). The DMA was selected as the study area for two reasons. First, the ma-jority of public beaches in Michigan are geographically concentrated in the DMA. As ofthe 2013 report of the Michigan Department of Environmental Quality (2013), 178 (14.5percent) out of 1,124 public beaches in Michigan were located in the DMA. Second, theDMA is the most densely populated and demographically diverse area in Michigan. TheU.S. Census Bureau (2010) indicated that the population density of the DMA (2,792.5inhabitants per square mile) was greater than the population density of Michigan (174.8inhabitants per square mile). The racial and ethnic makeup was 70.1 percent White, 22.8percent African American, 6.2 percent Hispanic, 3.3 percent Asian, 0.3 percent NativeAmerican, and 0.02 percent Pacific Islander in 2010.
Unit of Analysis
When analyzing spatial data, it is essential to define the unit of analysis because the resultsof spatial data analysis are influenced by the size and nature of the areal unit employed(Kim, Jang, Kang, and Kim 2019; Kim, Thapa, Jang, and Yang 2018; Xu, Pennington-Gray, and Kim 2019). Previous studies have assessed the environmental justice of POSs atthe CB (Lotfi and Koohsari 2009), CBG (Abercrombie et al. 2008; Maroko et al. 2009;Nicholls 2001; Nicholls and Shafer 2001; Tarrant and Cordell 1999), and CT (Deng,Walker, and Strager 2008; Estabrooks, Lee, and Gyurcsik 2003; Lindsey, Maray, and Kuan2001; Talen and Anselin 1998) levels. Small amount of aggregation can be reduced byminimally aggregating areal unit (Smoyer-Tomic et al. 2004). Although both CB andCBG are the lowest level of areal unit, only a limited amount of socioeconomic informa-tion is provided (Nicholls and Shafer 2001). As noted by Moore et al. (2008, p. 17), a CTis a subdivision of a county with “a mean population of approximately 4,000 people thatare relatively homogeneous in socioeconomic characteristics.” A CT is regarded as anappropriate unit of analysis with reliable social and economic data that can be obtainedfrom the U.S. Census Bureau. Thus, this study employed the CT as its unit of analysis.The DMA includes 1,164 CTs. Figure 1 illustrates the distribution of public beaches (n =178) and the CT boundaries within the study area.
VARIABLE DEFINITION AND DATA ACQUISITION
The dependent variable selected in this study was the level of access to public beaches.The level of access to public beaches was operationally defined as the shortest road net-work distance from the CT centroid to the nearest public beach for each CT. It is basedon the minimum distance approach as explained by Talen and Anselin (1998). Use of theminimum distance is justified because many POSs such as urban parks, playgrounds, andtrails are typically accessed by nearby residents. Moreover, several previous equity studies
54

ENVIRONMENTAL JUSTICE AND PUBLIC BEACH ACCESS
FIG. 1. Study Area [Color figure can be viewed at wileyonlinelibrary.com]
associated with the distribution of POSs have employed the minimum distance approach(Byrne, Wolch, and Zhang 2009; Lotfi and Koohsari 2009; Smoyer-Tomic et al. 2004;Talen 1998; Talen and Anselin 1998). To represent the actual landscape, only road-basednetwork distance was utilized in current study.
55

CITY & COMMUNITY
To measure the equity of public beach access, among multiple conceptualizations ofequity (e.g., equality, need [or compensatory], demand [or preference], market [willing-ness to pay]) identified by Wicks and Crompton (1986), a need (compensatory)-basedequity model was adopted for two reasons. First, redistributing public resources in a com-pensatory manner is one of the essential roles of the public sectors (Nicholls 2001). Sec-ond, a compensatory- or need-based equity model is in accordance with the premise ofsocial equity that is one of the National Recreation and Park Association’s (NRPA) threecore pillars (e.g., conservation, health and wellness, and social equity; Kim and Nicholls2016b). As the leading nonprofit organization dedicated to the advancement of publicparks, recreation, and conservation in the United States, NRPA provides services to com-munities by the construction of parks and recreational facilities around the United States(NRPA 2014).
A variety of demographic and socioeconomic variables were selected as potential in-dependent variables to represent residents’ need with regard to public beach access. Se-lection of independent variables was based on a review of variables considered relevantin previous equity studies of POSs and limited to those available for CT. These inde-pendent variables include: (1) population density (Maroko et al. 2009); (2) age (juvenile[e.g., population under age 18] and elderly [population over age 64]; Nicholls 2001); (3)race/ethnicity (African American, Asian, and Hispanic groups; Kim and Nicholls 2016b;Nicholls 2001); (4) income (Estabrooks, Lee, and Gyurcsik 2003; Smoyer-Tomic et al.2004); (5) housing value (Lindsey, Maray, and Kuan 2001; Talen 1997, 1998); (6) educa-tional attainment (Deng, Walker, and Strager 2008); (7) language (Maroko et al. 2009);and (8) vehicle ownership (Lindsey, Maray, and Kuan 2001). In this study, disadvantagedor needy groups were defined as those residing in more densely populated areas, the ju-venile and elderly, non-Whites (e.g., Asians and African American) and Hispanics, thoseearning lower income, those living in lower value housing, those having lower educa-tional attainment, those with non-English spoken at home, and those without a vehicle.According to the need (or compensatory)-based equity adopted, an equitable distribu-tion of public beach access would occur when the needy groups received better access tobeaches (i.e., a lower travel distance), whereas inequitable distribution of public beachaccess would occur when the needy groups received lower levels of public beach access(i.e., higher travel distance). The dependent variables, independent variables, and theiroperational definitions are shown in Table 1.
A variety of data sources, summarized in Table 2, were utilized. Boundaries for the CTsand street networks were acquired from the Michigan GIS Data Library (2015). Locationdata such as the latitude and longitude for the public beaches were collected from theFlorida Department of Environmental Quality. The census data utilized in the analysis ofequity were obtained from the 2010 Census summary file 1 (SF1) and file 3 (SF3) of theU.S. Bureau of the Census at the CT level.
DATA ANALYSIS
Data analysis consisted of four steps and was conducted using ArcGIS (version 10.4.1),the ArcGIS Network Analyst extension, and SPSS (version 20.0). First, census data wereintegrated with the corresponding CT polygons. Second, descriptive statistical analysis ofall independent variables was carried out to check for missing or erroneously entered
56
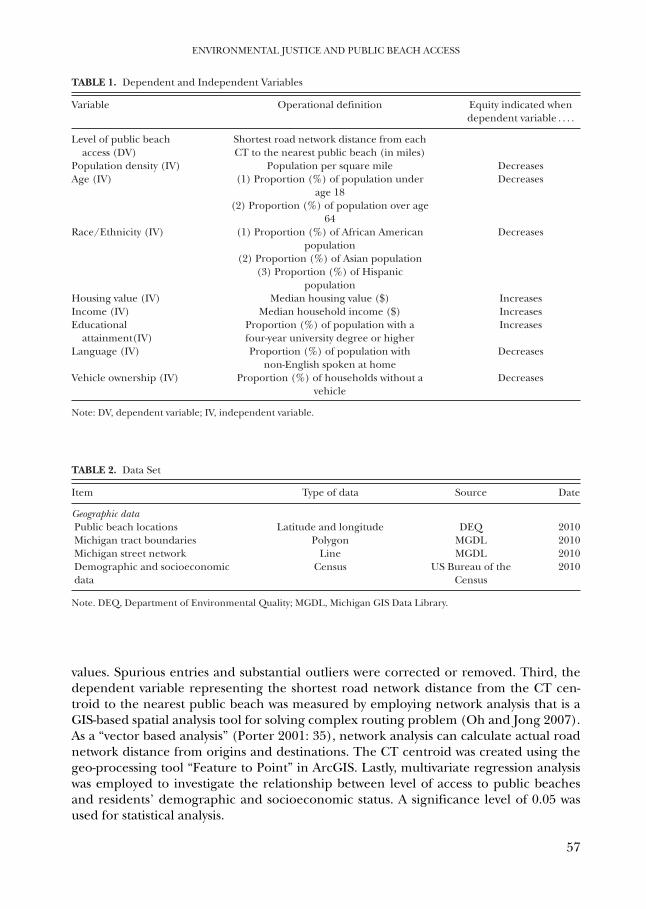
ENVIRONMENTAL JUSTICE AND PUBLIC BEACH ACCESS
TABLE 1. Dependent and Independent Variables
Variable Operational definition Equity indicated whendependent variable . . . .
Level of public beachaccess (DV)
Shortest road network distance from eachCT to the nearest public beach (in miles)
Population density (IV) Population per square mile DecreasesAge (IV) (1) Proportion (%) of population under
age 18Decreases
(2) Proportion (%) of population over age64
Race/Ethnicity (IV) (1) Proportion (%) of African Americanpopulation
Decreases
(2) Proportion (%) of Asian population(3) Proportion (%) of Hispanic
populationHousing value (IV) Median housing value ($) IncreasesIncome (IV) Median household income ($) IncreasesEducational
attainment(IV)Proportion (%) of population with afour-year university degree or higher
Increases
Language (IV) Proportion (%) of population withnon-English spoken at home
Decreases
Vehicle ownership (IV) Proportion (%) of households without avehicle
Decreases
Note: DV, dependent variable; IV, independent variable.
TABLE 2. Data Set
Item Type of data Source Date
Geographic dataPublic beach locations Latitude and longitude DEQ 2010Michigan tract boundaries Polygon MGDL 2010Michigan street network Line MGDL 2010Demographic and socioeconomic Census US Bureau of the 2010data Census
Note. DEQ, Department of Environmental Quality; MGDL, Michigan GIS Data Library.
values. Spurious entries and substantial outliers were corrected or removed. Third, thedependent variable representing the shortest road network distance from the CT cen-troid to the nearest public beach was measured by employing network analysis that is aGIS-based spatial analysis tool for solving complex routing problem (Oh and Jong 2007).As a “vector based analysis” (Porter 2001: 35), network analysis can calculate actual roadnetwork distance from origins and destinations. The CT centroid was created using thegeo-processing tool “Feature to Point” in ArcGIS. Lastly, multivariate regression analysiswas employed to investigate the relationship between level of access to public beachesand residents’ demographic and socioeconomic status. A significance level of 0.05 wasused for statistical analysis.
57

CITY & COMMUNITY
TABLE 3. Descriptive Statistics for Independent Variables (n = 1,164)
Variable (unit) Mean SD Min. Max.
African American population (%) 31.7 37.4 0.0 98.1Asian population (%) 2.8 4.7 0.0 53.3Hispanic population (%) 4.0 8.8 0.1 76.8Population density (square mile) 4,200.9 2,521.8 90.8 18,404.5Median household income ($) 52,832 27,317 9,923 160,431Median housing value ($) 128,322 83,358 13,400 674,900Population under age 18 (%) 26.7 5.5 5.8 48.5Population over age 64 (%) 13.4 5.1 1.0 42.7Population with a university degree or higher (%) 25.4 18.6 0.0 80.9Proportion of population with non-English spoken at home (%) 12.9 12.0 0.0 86.5Proportion of household without a vehicle (%) 11.0 11.4 0.0 66.6
Note. SD, standard deviation; Min., minimum; Max., maximum.
RESULTS
DESCRIPTIVE STATISTICS
Descriptive statistics for the independent variables are presented in Table 3.In terms of race/ethnicity, the proportion of the African American population ranged
from 0.0 to 98.1 percent (mean: 31.7 percent), while the proportion of Asian populationranged from 0.0 to 53.3 percent (mean: 2.8 percent). The proportion of Hispanic pop-ulation (mean: 4.0 percent) ranged from 0.1 to 76.8 percent. Population density rangedfrom 90/square mile to 18,404/square mile, with a mean of 4,200/square mile. Medianhousehold income ranged from $9,923 to $160,431 (mean: $52,832), while average me-dian housing value was $128,332 (range from $13,400 to $674,900). The proportion ofpopulation under age 18 varied from 5.8 to 48.5 percent (mean: 26.7 percent), while pro-portion of population over age 64 ranged from 1.0 to 42.7 percent (mean: 13.4 percent).An average of about one quarter of residents (25.4 percent) held a university degree orhigher, with a range from 0.0 to 80.9 percent. The proportion of population with non-English spoken at home ranged from 0.0 to 86.5 percent (mean: 12.9 percent), whileproportion of households without a vehicle ranged from 0.0 to 66.6 percent (mean: 11.0percent). These wide ranges in demographic and socioeconomic status between CTs in-dicate potentially diverse levels of need for access to public beaches in the DMA.
LEVEL OF ACCESS TO PUBLIC BEACHES
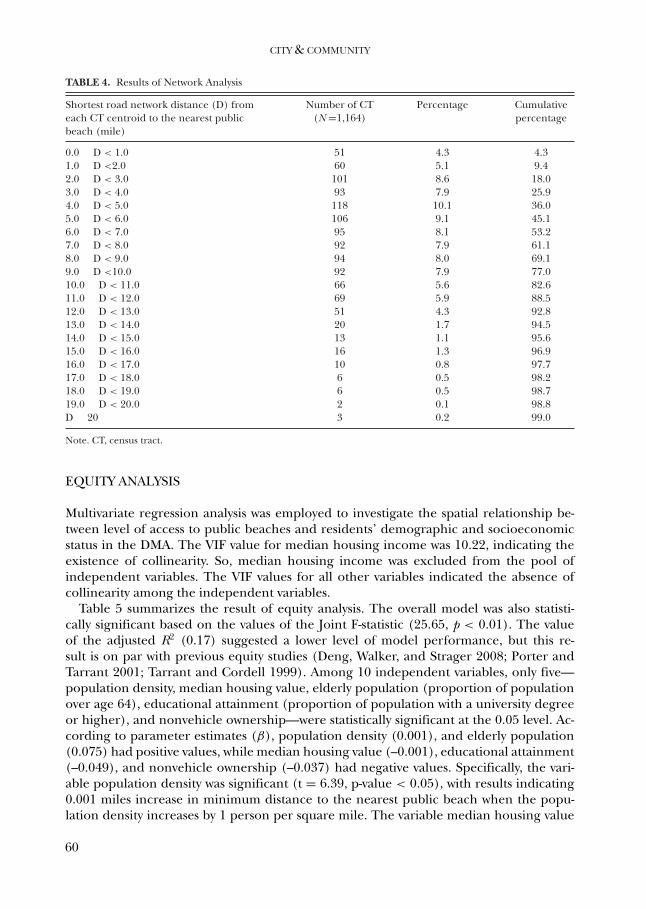
Level of public beach access in the DMA is displayed and summarized in Figure 2 andTable 4.
Distance to the nearest public beach is illustrated in increments of 1 mile. The min-imum distance to the nearest public beach from CT centroids varied from 0.009 miles(Waterford township, Oakland county) to 21.2 miles (Grosse Ile township, Wayne county)with a mean of 6.9 miles; 4.3 percent of the population within all CTs of the DMA residewithin 1 mile of a public beach, 36.0 percent within 5 miles, 77 percent within 10 miles,and 99.8 percent within 20 miles. As shown in Figure 2, access to public beaches is less
58

ENVIRONMENTAL JUSTICE AND PUBLIC BEACH ACCESS
FIG. 2. Level of Public Beach Access [Color figure can be viewed at wileyonlinelibrary.com]
prevalent in both Macomb and Wayne counties. In contrast, residents of Oakland countyappear to have extremely good access to public beaches. These findings indicate thatserious regional disparities in levels of access to public beaches occurred in the DMA.
59
CITY & COMMUNITY
TABLE 4. Results of Network Analysis
Shortest road network distance (D) fromeach CT centroid to the nearest publicbeach (mile)
Number of CT(N =1,164)
Percentage Cumulativepercentage
0.0 � D < 1.0 51 4.3 4.31.0 � D <2.0 60 5.1 9.42.0 � D < 3.0 101 8.6 18.03.0 � D < 4.0 93 7.9 25.94.0 � D < 5.0 118 10.1 36.05.0 � D < 6.0 106 9.1 45.16.0 � D < 7.0 95 8.1 53.27.0 � D < 8.0 92 7.9 61.18.0 � D < 9.0 94 8.0 69.19.0 � D <10.0 92 7.9 77.010.0 � D < 11.0 66 5.6 82.611.0 � D < 12.0 69 5.9 88.512.0 � D < 13.0 51 4.3 92.813.0 � D < 14.0 20 1.7 94.514.0 � D < 15.0 13 1.1 95.615.0 � D < 16.0 16 1.3 96.916.0 � D < 17.0 10 0.8 97.717.0 � D < 18.0 6 0.5 98.218.0 � D < 19.0 6 0.5 98.719.0 � D < 20.0 2 0.1 98.8D � 20 3 0.2 99.0
Note. CT, census tract.
EQUITY ANALYSIS
Multivariate regression analysis was employed to investigate the spatial relationship be-tween level of access to public beaches and residents’ demographic and socioeconomicstatus in the DMA. The VIF value for median housing income was 10.22, indicating theexistence of collinearity. So, median housing income was excluded from the pool ofindependent variables. The VIF values for all other variables indicated the absence ofcollinearity among the independent variables.
Table 5 summarizes the result of equity analysis. The overall model was also statisti-cally significant based on the values of the Joint F-statistic (25.65, p < 0.01). The valueof the adjusted R2 (0.17) suggested a lower level of model performance, but this re-sult is on par with previous equity studies (Deng, Walker, and Strager 2008; Porter andTarrant 2001; Tarrant and Cordell 1999). Among 10 independent variables, only five—population density, median housing value, elderly population (proportion of populationover age 64), educational attainment (proportion of population with a university degreeor higher), and nonvehicle ownership—were statistically significant at the 0.05 level. Ac-cording to parameter estimates (β), population density (0.001), and elderly population(0.075) had positive values, while median housing value (–0.001), educational attainment(–0.049), and nonvehicle ownership (–0.037) had negative values. Specifically, the vari-able population density was significant (t = 6.39, p-value < 0.05), with results indicating0.001 miles increase in minimum distance to the nearest public beach when the popu-lation density increases by 1 person per square mile. The variable median housing value
60

ENVIRONMENTAL JUSTICE AND PUBLIC BEACH ACCESS
TA
BL
E5.
Res
ults
ofR
egre
ssio
nA
nal
ysis
Vari
able
Un
stan
dard
ized
Coe
ffic
ien
tSt
anda
rdiz
edC
oeff
icie
nt
t-val
uep-
valu
eV
IFE
quit
yor
Ineq
uity
?
βSE
Bet
a
Inte
rcep
t6.
650
1.03
66.
42<
0.05
Afr
ican
Am
eric
anpo
pula
tion
(%)
0.00
50.
005
0.04
30.
920.
353.
07A
sian
popu
lati
on(%
)0.
040
0.04
00.
048
1.01
0.31
3.16
His
pan
icpo
pula
tion
(%)
-0.0
020.
020
-0.0
05-0
.12
0.90
2.65
Popu
lati
onde
nsi
ty(s
quar
em
ile)
0.00
10.
001
0.20
56.
39<
0.05
1.44
Ineq
uity
Med
ian
hou
sin
gva
lue
($)
-0.0
010.
001
–0.1
20–2
.20
<0.
054.
20In
equi
tyPo
pula
tion
unde
rag
e18
(%)
0.00
50.
029
0.00
70.
160.
872.
26Po
pula
tion
over
age
64(%
)0.
075
0.02
80.
097
2.70
<0.
051.
82In
equi
tyPo
pula
tion
wit
ha
univ
ersi
tyde
gree
orh
igh
er(%
)-0
.049
0.01
1-0
.227
-4.3
3<
0.05
3.86
Ineq
uity
Popu
lati
onw
ith
non
-spo
ken
En
glis
hat
hom
e(%
)–0
.004
0.01
2–0
.011
–0.2
90.
761.
93
Hou
seh
old
wit
hou
tave
hic
le(%
)–0
.037
0.01
4–0
.105
–2.6
06<
0.05
2.26
Ineq
uity
N=
387
R2
=0.
18,A
djus
ted
R2
=0.
17Jo
intF
-sta
tist
ic=
25.6
5(p
-val
ue:<
0.01
)
Not
e.SE
,sta
nda
rder
ror;
VIF
,var
ian
cein
flat
ion
fact
or.
61

CITY & COMMUNITY
was significant (t = –2.20, p-value < 0.05), with results indicating 0.001 miles decreasein minimum distance to the nearest public beach when the median housing value in-creases by one US dollar. The variable elderly population was significant (t = 2.70, p-value< 0.05), with results indicating 0.075 miles increase in minimum distance to the nearestpublic beach when the proportion of elderly population increases by one percent. Thevariable educational attainment was significant (t = –4.33, p-value < 0.05), with resultsindicating 0.049 miles decrease in minimum distance to the nearest public beach whenthe proportion of population with a university degree or higher increases by 1 percent.The variable vehicle ownership was significant (t = –2.60, p-value < 0.05), with resultsindicating a 0.037 decrease in minimum distance to the nearest public beach when theproportion of household without a vehicle increases by 1 percent. These results indicatethat level of access to public beaches is inequitably distributed with respect to populationdensity, proportion of elderly population, median housing value, educational attainment,and nonvehicle ownership.
DISCUSSION AND IMPLICATIONS
Using the framework of environmental justice, this study measured the degree of equityinherent in the distribution of access to public beaches in the DMA. To achieve the pur-pose, GIS-based spatial analytical techniques such as network analysis and spatial regres-sion analysis were employed using CT level data. As shown in Table 5, public beaches areinequitably accessible to CTs with lower median housing value, lower levels of educationalattainment, and higher levels of nonvehicle ownership. Generally, there is a correlationbetween education level and economic status. In this study, the educational attainmentvariable (proportion of population with a university degree or higher) showed high levelsof correlation with median household income (0.831, <0.05) and median housing value(0.833, <0.05). These variables are often highly collinear. Previous POS equity studieshave also regarded groups with lower median housing value, lower levels of educationalattainment, and higher levels of nonvehicle ownership as needy or minority groups (Kimand Nicholls 2016b). These findings are consistent with previous studies indicating thatinequitable access to POSs is associated with residents’ median household value (Lind-sey, Maray, and Kuan 2001), educational attainment (Estabrooks, Lee, and Gyurcsik 2003;Porter and Tarrant 2001), and nonvehicle ownership (Smoyer-Tomic et al. 2004). Thesefindings may be explained in the context of several relevant theories such as depriva-tion amplification, market-based equity, and marginality. First, the concept of depriva-tion amplification is referred to as “a pattern of diminished opportunities related to thefeatures of the local environment” (Kim and Nicholls 2016b). As explained by Tayloret al. (2007), “deprivation amplification indicates that in places where people have lim-ited resources (e.g., money, private transportation), there are fewer safe, open spaceswhere people can walk, jog, or take their children to play” (p. 55). The finding of thisstudy can provide strong empirical evidence that inequitable access to water-based POScan be associated with population density as a case study of public beaches in the DMA.Second, the market-based equity assumes that “an inequity in goods and services distri-bution occurs if minority groups cannot afford the necessary market price” (Kim andNicholls 2016b: 130). Nicholls and Crompton (2007) have also demonstrated the impactof proximity to golf course on residential property values in College Station, Texas. Lastly,
62

ENVIRONMENTAL JUSTICE AND PUBLIC BEACH ACCESS
“marginality” is a theory that attempts to explain disparities and inconsistencies in gain-ing to access resources by reference to their social class or ethnicity, race or culture (Park1928). As explained by West (1989), “because of lower incomes, minorities are seen ashaving constraints on their ability to afford the cost of participation, or of transportationto recreation sites” (p. 11).
Another finding of this study is that public beaches are inequitably accessible to CTswith higher levels of elderly population (population over age 64). This finding, however,is unexpected and is inconsistent with those of previous studies (Nicholls 2001; Nichollsand Shafer 2001). This finding may be explained by regional disparities in the propor-tion of elderly population in the DMA. According to the U.S. Census Bureau (2010), thetotal number of elderly population (population over age 64) is 510,007. The majorityof elderly population in the DMA is located in Wayne county; 45.2 percent (230,703)of the elderly population reside in Wayne county, 31.2 percent (159.124) in Oaklandcounty, 23.6 percent (120,180) in Macomb county. As shown in Figure 2, residents in bothWayne and Macomb counties have relatively poorer access to public beaches than thosein Oakland county. According to the U.S. Census Bureau (2010), the median householdincome of Oakland county ($65,636) is greater than those of Wayne ($41,504) and Ma-comb ($53,628), assuming that the majority of the lower income retired population mayhave difficulties in access to public beaches in the DMA. According to Porter (2001), theretired population might relocate close to POSs because of their potential health issues.Thus, additional variables such as average retirement income should be employed whenmeasuring the equity of POSs in future studies.
As shown in Table 5, the value of adjusted R2 (0.17) indicated a lower level of modelperformance. Although the R2 value is generally consistent with those of previous POSequity studies (Deng, Walker, and Strager 2008 [R2: 0.28]; Maroko et al. 2009 [R2: 0.23];Porter and Tarrant 2001 [R2: 0.18]; Tarrant and Cordell 1999 [R2: 0.27]), such a low levelof explanatory power suggests that the regression model may not be properly specified.This may be explained by two considerations. First, there might be several missing de-terminants of level of public beach access that could improve model performance. Suchmodel misspecification cannot directly account for the phenomenon with regard to pub-lic beach access in the DMA. Second, there might be local variations in the relationshipsbetween level of public beach access and residents’ demographic and socioeconomic sta-tus that could reduce the model performance. As noted by Kim and Nicholls (2016b:106), “spatial data such as the geographic locations of POSs, measures of access to POSs(e.g., distance or travel time between origin and destination), and spatially referencedcensus data may exhibit spatial effects such as spatial dependence and spatial heterogene-ity that can lead to biased estimation results using traditional multivariate techniques.” Itis therefore recommended in future studies to deal with these spatial effects by employingspecialized research methods that differ from those used to analyze nonspatial data.
Traditionally, race/ethnicity and income have been recognized as the dominant vari-ables accounting for inequitable access to POSs (Deng, Walker, and Strager 2008; Mooreet al. 2008; Talen 1997). In this study, however, the most dominant variable related toinequitable access to public beaches was age (especially over age 64) and educationalattainment. The three racial and ethnic variables were not significantly related to thelevel of access to public beaches. This finding partially supports Bass’s (1998) definitionof environmental justice, “the fair treatment and meaningful involvement of all peopleregardless of race, color, sex, national origin, or income with respect to the development,
63

CITY & COMMUNITY
implementation, and enforcement of environmental laws, regulations, and policies” (p.84). This study suggests that the impacts of age and educational attainment as well asother socioeconomic variables also should be considered when defining the frameworkof environmental justice in community recreation. Several authors such as Gilliland et al.(2006), Maroko et al. (2009), and Smoyer-Tomic et al. (2004) excluded the effects ofracial/ethnic variables but suggested the importance of other socioeconomic variables(e.g., educational attainment, age, nonvehicle ownership, population density, language,dwelling structure, family composition, and occupation) in accounting for inequitableaccess to POSs. The findings of this study not only support Maroko et al. (2009) andSmoyer-Tomic et al.’s (2004) studies, but also provide strong empirical evidence that re-gional disparities in level of access to POSs can be more influenced by residents’ socioe-conomic status than their race/ethnicity and income.
The findings highlighted in this study can suggest several implications to successfulcommunity recreation planning and management. First, public leisure agencies and man-agers should attempt to ensure equitable allocation of public resources that does notunfairly benefit specific groups over other groups. When measuring the equity of pub-lic resources, identifying who is receiving the benefits (costs) of public resources is veryimportant. As noted by Tarrant and Cordell (1999), “when inequities do arise, either thecost of resource utilization should be borne proportionately by all those who benefit orindividuals who bear the costs should be fairly compensated” (p. 32). For this reason, pub-lic leisure agencies need to identify optimal locations for alternative recreational facilitiessuch as spray parks and public swimming pools close to neighborhoods with higher popu-lation densities, lower median housing value, lower levels of educational attainment, andhigher level of non-vehicle ownership. Figure 3 shows the spatial distributions of pop-ulation density, median housing value, elderly population, educational attainment, andnon-vehicle ownership in the DMA. Previous studies stated that GIS maps can be used asuseful tools for decreasing the perceptual gaps between stakeholders by increasing inter-action and understanding between them (Jang and Kim 2018; Jang, Kim, and Zedtwitz2017; Kang, Lee, Kim, and Park 2018; Kim, Thapa, and Kim 2018). So, these maps inFigure 3 can contribute to identifying the optimal locations of alternative POSs in theDMA.
Identifying the optimal locations of alternative POSs is justified because it can not onlyprovide recreation opportunities for minority groups but also, ultimately, can ensure thesustainability of local communities. According to Yaffee (1994), the allocation of multiple-use resources including recreation facilities could be critical for ensuring the sustainabil-ity of local communities. As noted by Tarrant and Cordell (1999), “sustainability is con-cerned with the optimal allocation and use of natural resources to meet the long-termneeds of an increasingly diverse public” (p. 31). However, identifying the optimal loca-tions for recreational facilities is a complex spatial multi-criteria decision problem thatshould take into consideration not only the geographical features of resource attributesbut also other criteria as identified diverse stakeholders. It also becomes a controversiallocal issue, which can have major impacts on the natural environment, land use and ac-tivity patterns, and economy of the host community. Thus, it is recommended in futurestudies to utilize location-allocation model in combination with spatial multi-criteria deci-sion analysis for allocating alternative POSs more efficiently and equitably by minimizingconflicts between stakeholders in community recreation planning and management.
64

ENVIRONMENTAL JUSTICE AND PUBLIC BEACH ACCESS
FIG
.3.
Spat
ialD
istr
ibut
ion
ofPo
pula
tion
Den
sity
,Med
ian
Hou
sin
gVa
lue,
Eld
erly
Popu
lati
on,E
duca
tion
alA
ttai
nm
ent,
and
Non
veh
icle
Ow
ner
ship
inth
eD
MA
[Col
orfi
gure
can
bevi
ewed
atw
ileyo
nlin
elib
rary
.com
]
65

CITY & COMMUNITY
Lastly, creating alternative POSs is not feasible because of limited budgets and spaces,public leisure agencies and managers should develop partnerships with private compa-nies to locate alternative water-based recreational facilities such as swimming pools orwater parks in neighborhoods with poor accessibility to public beaches in the DMA. More-over, additional partnerships with public transportation services should be built to pro-vide free or reduced-cost access to public beaches for underserved groups.
LIMITATIONS AND RECOMMENDATIONS FOR FUTURE STUDIES
Despite several practical implications of this study, several limitations should be acknowl-edged. First, the findings of this study are limited by the inability to predict demand forpublic beach access. Although regional demographic and socioeconomic data could rep-resent residents’ needs or demands with regard to public beach access, these proxies donot reflect residents’ desire to access public beaches in the DMA. So, future studies shouldemploy additional data collection at the individual level, e.g., via quantitative (e.g., a res-ident survey) or qualitative (e.g., focus group interview) methods to reflect residents’ de-mands with regard to public beach access in the DMA. Second, while measuring the levelof access to public beaches based on residents’ distance of travel, this study does not con-sider other objective and subjective factors, such as transportation availability, awarenessof the location, perceived or actual levels of safety and crowding, environmental qual-ity, discrimination, and others when residents are placed in proximity to public beaches.Future studies will incorporate these factors into their analyses to provide more compre-hensive measurements of overall accessibility. Third, this study defined the accessibilityof public beach access as a relatively simple road network distance, assuming that localresidents choose to visit their nearest beach. However, residents always do not visit thenearest beach. They might visit a more amenable beach at a farther distance to increasetheir variety of recreational experiences. As described in the literature review, there aredifferent approaches to measuring POS access. Level of access to public beach access canbe better measured as a different outcome such as the number of public beaches withina certain distance from a neighborhood centroid. So, future studies will employ differentmethods of measuring public beach access. Fourth, this study excluded White populationbecause this tends to be the most privileged racial group in previous environmental jus-tice research. However, there are some White poverty groups in the DMA. According tothe U.S. Bureau of the Census (2010), the total number of White population below thepoverty line is 299,450. The majority of the White poverty group in the DMA is locatedin Wayne county; 25.3 percent (148,700) of the White poverty group reside in Waynecounty, 10.1 percent (79,064) in Oakland county, and 11.2 percent (71,686) in Macombcounty. So, future studies will integrate both White population and White poverty groupto provide more comprehensive equity measurement of public beach access. Fifth, thisstudy did not deal with spatial effects such as spatial dependence and spatial heterogene-ity while measuring the degree of equity inherent in the distribution of access to publicbeaches. As noted by Longley et al. (2005: 5), “Spatial is special.” The use of spatial data inlinear regression models can lead to the potential for biased estimation results caused byspatial dependence and spatial heterogeneity, thereby making it difficult to interpret theresults (Fotheringham, Brunsdon, and Charlton 2003). So, future studies should employadvanced spatial econometric models such as spatial error model, spatial lag model, or
66

ENVIRONMENTAL JUSTICE AND PUBLIC BEACH ACCESS
geographically weighted regression to deal with these spatial effects when measuring theequity of public beach access. Lastly, the findings of this study are limited to a single POStype (public beaches) and geographic location (DMA). Because it is a case study of theDMA, the findings may not be generalizable outside of the DMA. So, future studies willfocus on other geographic regions and POaS types to provide valuable access and equityevidence to the POS providers in those communities.
CONCLUSIONS
The purpose of this study is to apply an environmental justice framework to measure in-equities associated with public beach access in the DMA. Results of this study suggestedinequities with regard to population density, median housing value, elderly population(proportion of population over age 64), educational attainment (proportion of popula-tion with a university degree or higher), and nonvehicle ownership, but not necessarilyrace/ethnicity (proportions of African American, Asian, and Hispanic populations) andlanguage (proportion of population with non-English spoken at home) for public beachaccess. In particular, age (especially over age 64) and educational attainment were themost significant variable accounting for inequitable access to public beach access in theDMA. This finding indicates that level of access to public beaches in the DMA is more in-fluenced by residents’ socioeconomic status than traditional racial and ethnic variables,considering the impacts of socioeconomic variables when defining the framework of en-vironmental justice in outdoor recreation.
Despite the importance of assessing the environmental justice of recreation opportu-nity, consideration of environmental justice issues remains relatively scarce in the com-munity recreation literature. It is one of relatively few efforts to respond to Floyd andJohnson’s (2002) call for increased attention to environmental justice in the communityrecreation realm. It is hoped that this study will stimulate community recreation scholarsinto paying more attention to environmental justice, thereby extending the scope of thecommunity recreation literature.
REFERENCES
Abercrombie, Lauren C., James F. Sallis, Terry L. Conway, Lawrence D. Frank, Brian E. Saelens, and James E.Chapman. 2008. “Income and Racial Disparities in Access to Public Parks and Private Recreation Facilities.”American Journal of Preventive Medicine 34(1):9–15.
Albrecht, Stan L. 1995. “Equity and Justice in Environmental Decision Making: A Proposed Research Agenda.”Society & Natural Resources 8(1):67–72.
Bass, Ronald. 1998. “Evaluating Environmental Justice under the National Environmental Policy Act.” Environ-mental Impact Assessment Review 18(1):83–92.
Beatley, Timothy, David Brower, and Anna K. Schwab. 2002. An Introduction to Coastal Zone Management, 2nd Ed.Washington, DC: Island Press.
Blizzard, Amy F., and William R. Mangun. 2008. “Intergovernmental Influences on the Implementation ofCoastal Zone Management in the United States: Public Shoreline Access in the Southeast.” Ocean & CoastalManagement 51(6):443–9.
Boone, Christopher G., Geoffrey L. Buckley, J. Morgan Grove, and Chona Sister. 2009. “Parks and People:An Environmental Justice Inquiry in Baltimore, Maryland.” Annals of the Association of American Geographers99(4):767–87.
Byrne, Jason, Jennifer Wolch, and Jin Zhang. 2009. “Planning for Environmental Justice in an Urban NationalPark.” Journal of Environmental Planning and Management 52(3):365–92.
67

CITY & COMMUNITY
Chiesura, Anna. 2004. “The Role of Urban Parks for the Sustainable City.” Landscape and Urban Planning68(1):129–38.
Davison, Ewa M. 2006. “Enjoys Long Walks on the Beach: Washington’s Public Trust Doctrine and the Right ofPedestrian Passage Over Private Tidelands.” Washington Law Review 81(4):813–44.
Deng, Jinyang, Gordon Walker, and Michael Strager. 2008. “Assessment of Territorial Justice using GeographicInformation Systems: A Case Study of Distributional Equity of Golf Courses in Calgary, Canada.” Leisure/Loisir32(1):203–30.
Di Chiro, G. 1998. “Environmental Justice from the Grassroots.” In Daniel Faber (ed.), The Struggle for EcologicalDemocracy, pp. 104–36. New York, NY: The Guilford Press.
Dixon, Anthony W., Chi-Ok Oh, and Jason Draper. 2012. “Access to the Beach: Comparing the Economic Valuesof Coastal Residents and Tourists.” Journal of Travel Research 51(6):742–53.
Dyer, Dion G. 1972. “California Beach Access: The Mexican Law and the Public Trust.” Ecology LQ 2: 571.Edgerton, Robert B. 1979. Alone Together: Social Order on an Urban Beach. Berkeley, CA: University of California
Press.Elliott, Richard J. 1976. “Texas Open Beaches Act: Public Rights to Beach Access.” Baylor Law Review 28: 383–94.Estabrooks, Paul A., Rebecca E. Lee, and Nancy C. Gyurcsik. 2003. “Resources for Physical Activity Participa-
tion: Does Availability and Accessibility Differ by Neighborhood Socioeconomic Status?” Annals of BehavioralMedicine 25(2):100–4.
Fischer, David W. 1988. “An Evaluation of Sandy Beach Access Policy in an Urbanizing State: Florida’s Save OurCoast Program.” Ocean and Shoreline Management 11(2):101–12.
Floyd, Myron F., and Cassandra Y. Johnson. 2002. “Coming to Terms with Environmental Justice in OutdoorRecreation: A Conceptual Discussion with Research Implications.” Leisure Sciences 24(1):59–77.
Fotheringham, A. Stewart, Chris Brunsdon, and Martin Charlton. 2003. Geographically Weighted Regression: TheAnalysis of Spatially Varying Relationships. New York, NY: John Wiley & Sons.
Gilliland, Jason, Martin Holmes, Jennifer D. Irwin, and Patricia Tucker. 2006. “Environmental Equity is Child’sPlay: Mapping Public Provision of Recreation Opportunities in Urban Neighborhoods.” Vulnerable Childrenand Youth Studies 1(3):256–68.
Godbey, Geoffrey. 1993. “The Contribution of Recreation and Parks to Reducing Health Care Costs: FromTheory to Practice.” Trends 30(4):37–41.
Jang, Seongsoo, and Jinwon Kim. 2018. “Remedying Food Policy Invisibility with Spatial Intersectionality: ACase Study in the Detroit Metropolitan Area.” Journal of Public Policy & Marketing 37(1):167–87.
———, and Max Zedtwitz. 2017. “The Importance of Spatial Agglomeration in Product Innovation: A Micro-geography Perspective.” Journal of Business Research 78: 143–54.
Jennings, Gayle. 2007. Water-based Tourism, Sport, Leisure, and Recreation Experiences. Burlington, MA: Routledge.Kang, Sanghoon, Gyehee Lee, Jinwon Kim, and Deukhee Park. 2018. “Identifying the Spatial Structure of
Tourism Attraction System in South Korea using GIS and Network Analysis: An Application of Anchor-PointTheory.” Journal of Destination Marketing & Management, 9: 358–70.
Kehoe, James M. 1994. “Next Wave in Public Beach Access: Removal of States as Trustees of Public Trust Prop-erties.” Fordham Law Review 63(5):1913–51.
Kim, Jinwon. 2015. Measuring the Equity of Recreation Opportunity: A Spatial Statistical Approach. Unpublished Doc-toral Dissertation. Michigan State University, East Lansing, MI.
———, and Sarah Nicholls. 2016a. “Influence of the Measurement of Distance on Assessment of RecreationAccess.” Leisure Sciences 38(2):118–39.
———, and ———. 2016b. “Using Geographically Weighted Regression to Explore the Equity of Public OpenSpace Distributions.” Journal of Leisure Research 48(2):105–33.
———, and ———. 2018. “Access for All? Beach Access and Equity in the Detroit Metropolitan Area.” Journal ofEnvironmental Planning and Management 61(7):1137–61.
———, Seongsoo Jang, Sanghoon Kang, and Seunghyun Kim. 2019. “Why are Hotel Room Prices Different?Exploring Spatially Varying Relationships between Room Price and Hotel Attributes.” Journal of BusinessResearch. https://doi.org/10.1016/j.jbusres.2018.09.006
———, Brijesh Thapa, Seongsoo Jang, and Eunjung Yang. 2018. “Seasonal Spatial Activity Patterns of Visitorswith a Mobile Exercise Application at Seoraksan National Park, South Korea.” Sustainability 10(7):1–21.
Kim, Minseong, Brijesh Thapa, and Jinwon Kim. 2018. “Community Reactions to Tourism Development: HowDoes Governmental Fairness Work?” Journal of Environmental Planning and Management 61(9):1511–34.
Kline, Jeffrey D., and Stephen K. Swallow. 1998. “The Demand for Local Access to Coastal Recreation in South-ern New England.” Coastal Management 26(3):177–90.
68

ENVIRONMENTAL JUSTICE AND PUBLIC BEACH ACCESS
Lee, Yongjin, Lori Pennington-Gray, and Jinwon Kim. 2019. “Does Location Matters? Exploring the SpatialPatterns of Food Safety in a Tourism Destination.” Tourism Management 71: 18–33.
Lindsey, Greg, Maltie Maraj, and SonCheong Kuan. 2001. “Access, Equity, and Urban Greenways: An Ex-ploratory Investigation.” The Professional Geographer 53(3):332–46.
Longley, Paul A., Michael F. Goodchild, David J. Maguire, and David W. Rhind. 2005. Geographic InformationSystems and Science. New York, NY: John Wiley & Sons.
Lotfi, Sedigheh, and Mohammad Javad Koohsari. 2009. “Measuring Objective Accessibility to NeighborhoodFacilities in the City (A Case Study: Zone 6 in Tehran, Iran).” Cities 26(3):133–40.
Lucy, William. 1981. “Equity and Planning for Local Services.” Journal of the American Planning Association47(4):447–57.
Maroko, Andrew R., Juliana A. Maantay, Nancy L. Sohler, Kristen L. Grady, and Peter S. Arno. 2009. “TheComplexities of Measuring Access to Parks and Physical Activity Sites in New York City: A Quantitative andQualitative Approach.” International Journal of Health Geographics 8(1):1–23.
Meyer, Harold Diedrich, and Charles Kestner Brightbill. 1964. Community Recreation: A Guide to Its Organization.Englewood Cliffs, NJ: Prentice-Hall.
Michigan Department of Environmental Quality. 2013. “Michigan Beaches.” Retrieved December 28, 2014,from http://www.deq.state.mi.us/beach/.
Michigan GIS Data Library. 2015. “Geographic Data Library.” Retrieved December 2, 2015, fromhttps://www.mcgi.state.mi.us/mgdl/.
Moore, Latetia V., Ana V. Diez Roux, Kelly R. Evenson, Aileen P. McGinn, and Shannon J. Brines. 2008. “Avail-ability of Recreational Resources in Minority and Low Socioeconomic Status Areas.” American Journal of Pre-ventive Medicine 34(1):16–22.
National Recreation Park Association. 2014. “NRPA Three Pillars.” Retrieved December 2, 2014, fromhttp://http://www.stpeteparksrec.org/nrpa-three-pillars.html.
Negris, Karen A. 1986. “Access to New Jersey Beaches: The Public Trust Doctrine.” Columbia Journal of Law andSocial Problems 20: 437–60.
Nicholls, Sarah. 2001. “Measuring the Accessibility and Equity of Public Parks: A Case Study using GIS.” Manag-ing Leisure 6(4):201–19.
———, and John L. Crompton. 2007. “The Impact of a Golf Course on Residential Property Values.” Journal ofSport Management 21(4):555–70.
———, and Scott Shafer. 2001. “Measuring Accessibility and Equity in a Local Park System: The Utility ofGeospatial Technologies to Park and Recreation Professionals.” Journal of Park and Recreation Administration19(4):102–24.
Oehme, Karen. 1987. “Judicial Expansion of the Public Trust Doctrine: Creating a Right of Public Access toFlorida’s Beaches.” Journal of Land Use & Environmental Law 3(1):75–94.
Oh, Chi-Ok, Anthony W. Dixon, James W. Mjelde, and Jason Draper. 2008. “Valuing Visitors’ Economic Benefitsof Public Beach Access Points.” Ocean & Coastal Management 51(12):847–53.
———, Jason Draper, and Anthony W Dixon. 2009. “Assessing Tourists’ Multi-Attribute Preferences for PublicBeach Access.” Coastal Management 37(2):119–35.
Oh, Kyushik, and Seunghyun Jeong. 2007. “Assessing the Spatial Distribution of Urban Parks using GIS.” Land-scape and Urban Planning 82(1):25–32.
Omer, Itzak. 2006. “Evaluating Accessibility using House-Level Data: A Spatial Equity Perspective.” Computers,Environment and Urban Systems 30(3):254–74.
Orams, Mark. 1999. Marine Tourism: Development, Impacts and Management. London, UK: Routledge.Park, Robert E. 1928. “Human Migration and the Marginal Man.” American Journal of Sociology 33: 881–93.Pogue, Pamela, and Virginia Lee. 1999. “Providing Public Access to the Shore: The Role of Coastal Zone Man-
agement Programs.” Coastal Management 27(2–3):219–37.Poirier, Marc R. 1995. “Environmental Justice and the Beach Access Movements of the 1970s in Connecticut
and New Jersey: Stories of Property and Civil Rights.” Connecticut Law Review 28: 719–812.Porter, Robert. 2001. Environmental Justice and North Georgia Wilderness Areas: A GIS Based Analysis. Unpublished
Doctoral Dissertation. University of Georgia, Athens, GA.———, and Michael A. Tarrant. 2001. “A Case Study of Environmental Justice and Federal Tourism Sites in
Southern Appalachia: A GIS Application.” Journal of Travel Research 40(1):27–40.Prideaux, Bruce, and Malcolm Cooper. 2009. River Tourism. Oxfordshire, UK: Cabi.Sister, Chona, Jennifer Wolch, and John Wilson. 2010. “Got Green? Addressing Environmental Justice in Park
Provision.” GeoJournal 75(3):229–48.
69

CITY & COMMUNITY
Smoyer-Tomic, Karen E., Jared N. Hewko, and M. John Hodgson. 2004. “Spatial Accessibility and Equity ofPlaygrounds in Edmonton, Canada.” The Canadian Geographer/Le Geographe Canadien 48(3):287–302.
Summerlin, Daniel. 1995. “Improving Public Access to Coastal Beaches: The Effect of Statutory Managementand the Public Trust Doctrine.” William & Mary Environmental Law and Policy Review 20(3):425–44.
Talen, Emily. 1997. “The Social Equity of Urban Service Distribution: An Exploration of Park Access in Pueblo,Colorado, and Macon, Georgia.” Urban Geography 18(6):521–41.
———. 1998. “Visualizing Fairness: Equity Maps for Planners.” Journal of the American Planning Association64(1):22–38.
———, and Luc Anselin. 1998. “Assessing Spatial Equity: An Evaluation of Measures of Accessibility to PublicPlaygrounds.” Environment and Planning A 30(4):595–613.
Tarrant, Michael A., and H. Ken Cordell. 1999. “Environmental Justice and the Spatial Distribution of OutdoorRecreation Sites: An Application of Geographic Information Systems.” Journal of Leisure Research 31(1):18–34.
Taylor, Wendell C., Myron F. Floyd, Melicia C. Whitt-Glover, and Jordan Brooks. 2007. “Environmental Justice: AFramework for Collaboration between the Public Health and Parks and Recreation Fields to Study Disparitiesin Physical Activity.” Journal of Physical Activity & Health 4(1):50–63.
United States Bureau of the Census. 2010. American FactFinder. Retrieved December 28, 2014, fromhttp://factfinder2.census.gov/faces/nav/jsf/pages/index.xhtml.
West, Patrick C. 1989. “Urban Region Parks and Black Minorities: Subculture, Marginality, and Interracial Re-lations in Park Use in the Detroit Metropolitan Area.” Leisure Sciences 11(1):11–28.
Whitehead, John C., Christopher F. Dumas, Jim Herstine, Jeffery Hill, and Bob Buerger. 2008. “Valuing BeachAccess and Width with Revealed and Stated Preference Data.” Marine Resource Economics 23(2):119–35.
Wicks, Bruce E., and John L. Crompton. 1986. “Citizen and Administrator Perspectives of Equity in the Deliveryof Park Services.” Leisure Sciences 8(4):341–65.
Xu, Yu-Hua, Lori Pennington-Gray, and Jinwon Kim. 2019. “The Sharing Economy: A Geographically WeightedRegression Approach to Examine Crime and the Shared Lodging Sector.” Journal of Travel Research.https://doi.org/10.1177/0047287518797197
Yaffee, Steven Lewis. 1994. The Wisdom of the Spotted Owl: Policy Lessons for a New Century. Washington, DC: IslandPress.
Yang, Byungyun, Marguerite Madden, Jinwon Kim, and Thomas R. Jordan. 2012. “Geospatial Analysis of BarrierIsland Beach Availability to Tourists.” Tourism Management 33(4):840–54.
70