Embed Size (px)
Citation preview

1
NATIONAL ENVIRONMENTAL HEALTH ACTION PLAN MALAYSIA
29 APRIL 2013 PICC, PUTRAJAYA
Environmental Issues And Challenges –
Malaysian Scenario
By Dato’ Dr. Ahmad Kamarulnajuib Che Ibrahim
Deputy Director General (Planning) Department of Environment Malaysia
aki@ doe.gov.my H/P 019-5593344

Environmental issues becoming more complex & challenging due to:
• Emerging of new types of products
• Changes in manufacturing processes
• Emerging new technologies for products
• Level of housekeeping
• Degree of cleaner technology use
• Competency in handling environmental issues
• Old environmental issues still not propely address
• Regulations are not update
INTRODUCTION

Air pollution – outdoor and indoor Sewerage DID
Solid waste management
Food safety
Occupational health and safety
Soil contamination
Urban sanitation
Hazardous waste management
Rural water supply and sanitation Recreational water
Safe drinking water
(Extract: National Environmental Health Action Plan (2010), Ministry of
Health)
ENVIRONMENTAL HEALTH AREAS
OF CONCERN

NATIONAL POLICY ON THE ENVIRONMENT
POLICY STATEMENT
For continuos economic, social and cultural
progress and enhancement of the
quality of life of Malaysians, through
environmentally sound
and sustainable development
( 21 October 2002)
Clean, Safe ,
HEALTHY & Sustainable Lifestyles

Pollution Control and Prevention
Environmental Ethics,
Competency, Self-Regulatory
Integration Environmental Dimensions in Development
Planning
Awareness Raising & Education
Public Participation
Inter-Agency & Federal-
State Cooperation
Bilateral, Regional and International Cooperation
Sustainable Development via
Resource Conservation
Monitoring
ENVIRONMENTAL MANAGEMENT STRATEGIES
5

38 Regulations &
Orders
Prevention, abatement, control of pollution and
enhancement of the environment in Malaysia
ENVIRONMENTAL QUALITY ACT, 1974
(ACT 127)
6
EQA 1974 & Amendment
2012 (enforced 1 January 2013) &
Section 4 EEZ Act 1984

7
Environmental
Issues
&
Challenges
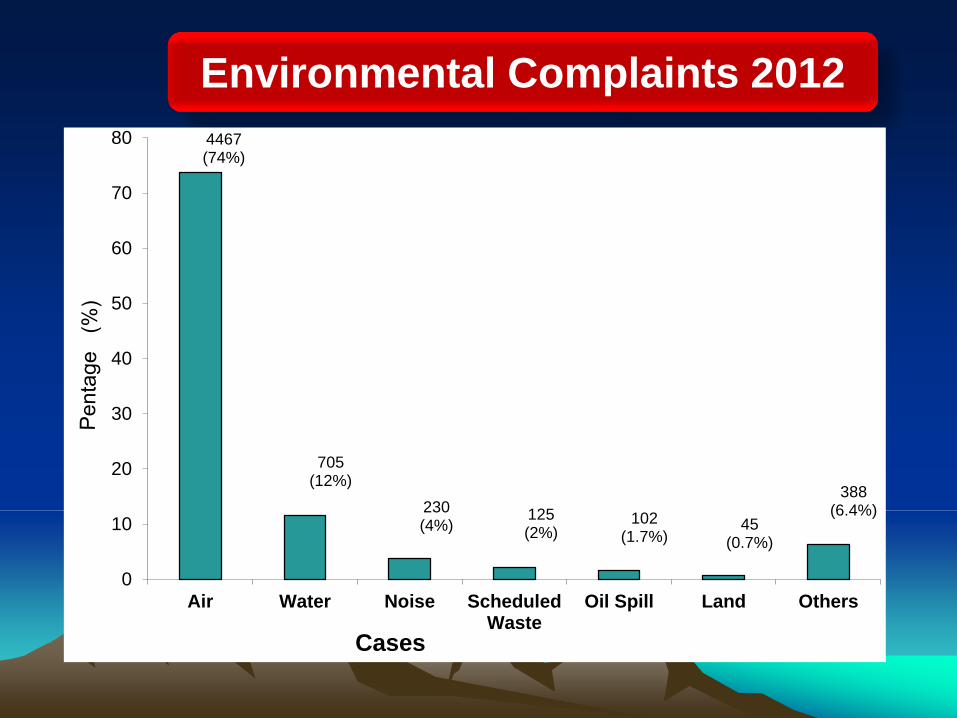
Environmental Complaints 2012
4467 (74%)
705 (12%)
230 (4%)
125 (2%)
102 (1.7%)
45 (0.7%)
388 (6.4%)
0
10
20
30
40
50
60
70
80
Air Water Noise ScheduledWaste
Oil Spill Land Others
Cases

9
QUARRY
RESIDENTIALS
INCOMPATIBLE DEVELOPMENT

10
MASSIVE LAND DISTURBANCE
Land clearance without
proper erosion control

11
AIR
POLLUTION

12
Air Pollution Sources
Open burning & Haze (Trans-boundary Pollution)
Industries (Point Sources)
Black smoke from vehicle

0
2,000,000
4,000,000
6,000,000
8,000,000
10,000,000
12,000,000
Motorcycle PassengerCars
GoodVehicles
Taxi Bus
No
. of
Ve
hic
les
Vehicle Type
Number of Motor Vehicles by Type, 2012 (Source : Road Transport Department, 2012)
2011
2012

Air Pollutant Emission Load
4,437 13,743
216,428
392,301
1,670,996
4,585 14,391
226,209
426,430
1,779,409
0
200,000
400,000
600,000
800,000
1,000,000
1,200,000
1,400,000
1,600,000
1,800,000
2,000,000
PM SO2 NO2 HC CO
Em
iss
ion
Lo
ad
(Me
tric
To
nn
es
)
Parameter
2011 2012

15
HAZE EPISODES IN MALAYSIA
1997
1998
2005
2006
2010
2011

AIR QUALITY MANAGEMENT INITIATIVES
Air Quality Monitoring Network (52 Continuous
Monitoring Stations)
Legislation and Enforcement
National Haze Committee & Action Plan
Standard Operating Procedure in Fire Fighting
Malaysian Air Quality Guidelines & Air Pollutant Index
Fire Prevention & Peatland Management Programme to control peatland fire prone areas (Check Dams, Tube Wells & Watch Tower)

CHALLENGES IN AIR QUALITY MANAGEMENT
17
Clean Air Action Plan (CAAP)
New Clean Air Regulations 2013 (List of about
500 Hazardous Substances-Dioxins & Furans, Volatile Organic Substances, Gaseous Inorganic Substances, Particulate Organic Substances & Carcinogenic Substances) & Isokinetic Measurements
Propose New Standard for Malaysia Ambient Air Quality
(Particulate Matter –PM2.5 and PM10 micron, O3, CO, SO2,NO2) and emerging HCN standard?
New Odour Regulations (to be finalized by AG)?
Continuous Emission Monitoring System (CEMS) & Performance Emission Monitoring System (PEMS)

International Agreement Designed to protect the
ozone layer Phasing out production of ozone depleting
substances (ODS) and HCFC
MONTREAL PROTOCOL

Water
Pollution
19

RIVER MONITORING (Major Pollutants & Sources)
• Biological Oxygen Demand (BOD)
– Sources : Sewage, Agro based, Manufacturing Industry
• Ammoniacal Nitrogen (AN)
– Sources : Sewage & Animal Farming
• Suspended Solids (SS)
– Sources : Earthwork and Land Clearing
WATER SUPPLY
DISRUPTION SOIL EROSION –
HIGH SS

Water Pollution Sources of 4
Sectors

River Water Quality Trend based on BOD sub-index
302
349
376
320
187
104
44 36
134
102 117
156
238 255
266 270
158
122
87 103
152
211
154 167
0
50
100
150
200
250
300
350
400
2005 2006 2007 2008 2009 2010 2011 2012
Nu
mb
er
of
rive
rs
Year
Clean
Slightly Polluted
Polluted
Source of Pollution (Activity) : Sewage, Agro based and
Manufacturing Industries

River Water Quality Trend based on AN sub-index
208 204 213
282
227
147
174
147
179 180
203
137
167
205
167
183
207 189
164 160
183
218
123
143
0
50
100
150
200
250
300
2005 2006 2007 2008 2009 2010 2011 2012
Nu
mb
er
of
rive
rs
Year
Clean
Slightly Polluted
Polluted
Source of Pollution (Activity) : Sewage & Animal Farming
Pollution Indicator : Ammoniacal Nitrogen (NH3-N)

River Water Quality Trend based on SS sub-index
416
354
296
269
291
334
293
338
70 83
125
106 100
80 71 64
108
136
159
204 186
156
100
71
0
50
100
150
200
250
300
350
400
450
2005 2006 2007 2008 2009 2010 2011 2012
Nu
mb
er
of
rive
rs
Year
Clean
Slightly Polluted
Polluted
Source of Pollution (Activity) : Earthworks & Land clearings
Pollution Indicator (Parameter) : Suspended solids

1. New Regulations for Animal Farming Activities
Soon (Issues to be resolved)
2. New Regulations for Public Wet Market
Discharges
3. Hypermarket (Private Wet Market) subject to Sewage
Regulations 2009
DOE NEW INITIATIVES
26
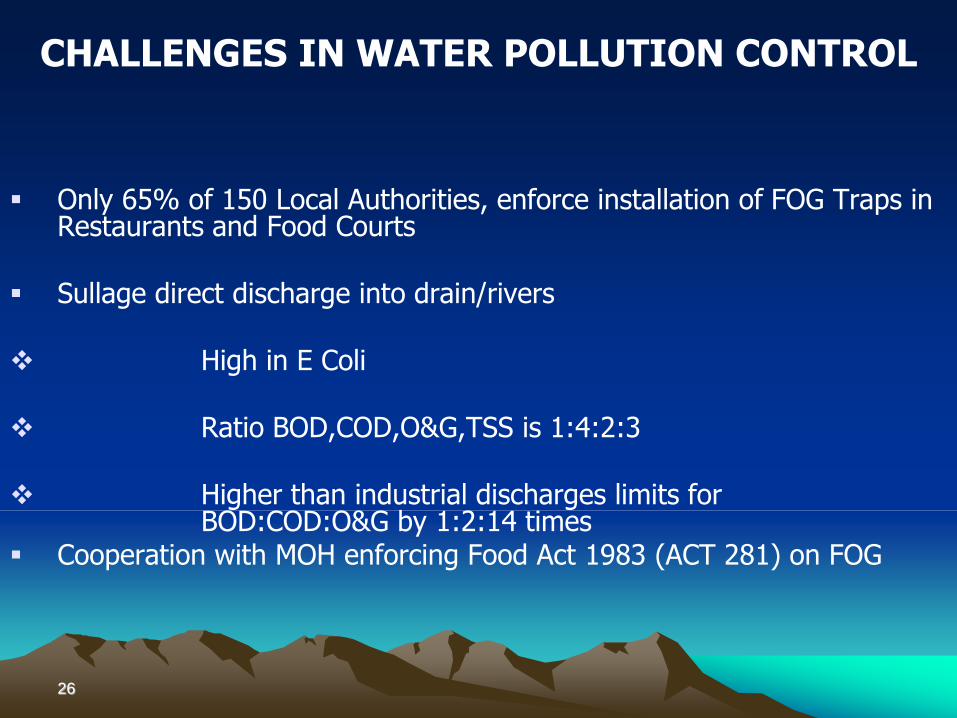
CHALLENGES IN WATER POLLUTION CONTROL
Only 65% of 150 Local Authorities, enforce installation of FOG Traps in Restaurants and Food Courts
Sullage direct discharge into drain/rivers
High in E Coli
Ratio BOD,COD,O&G,TSS is 1:4:2:3 Higher than industrial discharges limits for
BOD:COD:O&G by 1:2:14 times Cooperation with MOH enforcing Food Act 1983 (ACT 281) on FOG

No Type of sources No. of sources
1 Manufacturing Industries 4,595
2 Agro-based industries 512
3 Pig farms^ equavalent to 1,792,666 lifestock population
754
4 Sewage treatment plant@
- Public sewage 5,800
- Private sewage 4,004
- Septic tank 1,449,383
- CST 3,631
5 Restaurant/ food stalls/ caterers* 192,710
6 Hotels+ 1,333
7 Schools# 10,083
8 Universities (public & private) 70
9 Education Institutes# 1,072
10 Wet markets" 865
11 Hospitals 386
Sources of information 2012:-
The number of of restaurants/ food stalls/ caterers was registered in Food Safety Information System for Malaysia - Domestic (FoSIM) under Ministry of Health Malaysia and Local Government Department
Ministry of Education Malaysia
Ministry of Tourism Malaysia,
Indah Water Konsortium
Local Government Department
Department of Veterinary Services
Number of Water Pollution Sources Increasing

River Water Quality Monitoring
Started by DOE since 1978 and contract out to Alam Sekitar Malaysia Sdn. Bhd. (ASMA) from 1995 to 2015
Monitoring by:
Manual and Automatic Continuous Stations
Objective- Establishing Baselines, Water Quality Index and Pollution Sources
28

GROUNDWATER MONITORING
Started in 1997 for Peninsular Malaysia & extended to Sabah dan Sarawak
in 2002
Analyze for VOCs, Heavy Metals, Pesticides, Phenolic Compounds,
Coliform, TDS, pH, Conductivity & DO
Normally, high in As, Fe, Mn, Coliform & Phenolics comparing with
National Raw Drinking Water Quality (MOH, 2000)

Cover 107 Groundwater Stations in 12 Land Use Areas
T Land Use Area Numbers of Stations
1) Agricultural Areas 12
2) Urban & Suburban Areas 11
3) Industrial Sites 18
4) Landfills 24
5) Golf Courses 7
6) Rural Areas 3
7) Ex - Mining 3
8) Municipal Water Supply 7
9) Animal Burial 14
10) Aquaculture Farms 6
11) Radioactive Landfill 1
12) Resorts 1
Total:- 107
Marine Water Quality Monitoring Programmes
314 Monitoring Stations and started in 1978 Peninsular and 1985 in Sabah and Sarawak
Cover Estuary, Coastal and 74 Islands
(Islands include Development On Islands,
Resort , Marine Park and Protected Islands)

32
HAZARDOUS WASTE MANAGEMENT

SCHEDULED WASTES
• Scheduled Wastes generated
(in 2011) = 3.3 Million mTon
(an increased of 6.3%
compared to 2010)
Manage Via Scheduled Wastes
Regulations 2005 & Basel
Convention
• Main categories generated:
Dross/slag/clinker/ash,
gypsum, mineral sludge,
heavy metal sludge and e-
waste

FACILITIES HANDLING SCHEDULED WASTES

CLINICAL WASTES
25% Health-Care Waste Generated is Hazardous & Health Risks
Clinical Wastes Subject to Environmental Quality (Schedule Waste) Regulations, 2005 and international requirements Basel Convention:
SW 403 - Discarded drugs containing psychotropic substances or
containing substances that are toxic, harmful, carcinogenic, mutagenic or teratogenic;
SW 404 - Pathogenic and clinical waste and quarantined
materials
SW 421 - A mixture of schedule waste
SW 422 - A mixture of schedule and non schedule waste
Sharps, Drugs, Tissues, Bloods, etc

0
2000
4000
6000
8000
10000
12000
14000
16000
18000
20000
2007 2008 2009 2010 2011
Qu
an
tity
of
Clin
ica
l W
as
te (
MT
)
Year
80,000 mTon Clinical Wastes Generated from 2007 -2011

CHALENGES In MANAGING
CONTAMINATED LAND
Standards & Protocol yet to be Developed Under Section 24 EQA
Sources Increasing Industrial Sites, Motor Workshops, Petrol Stations,
Fuel Depots, Railway Yards, Landfills & Ex-Mining Land

POPS emerging environmental issue
POPs subject to The Stockholm Convention
Treaty
POPs are toxic and accumulate in fatty tissue of living organisms, humans and wildlife
POPs-remain intact in the environment for long periods and widely distributed geographically
Managing them very challenging
ENVIRONMENTAL ISSUE: Persistent Organic Pollutants (POPs)

39
HEALTH IMPACT
ASSESSMENT (HIA)

• HIA has been integrated in EIA
• HIA for projects that may affect the environment
and human health
• Examples: Incineration Plant, Landfills, Chemical
Plants, Coal Fired Power Plant
INTEGRATION OF HIA IN EIA

Guidance Documents on HIA in operation since 2012
Include Scoping of HIA FOR EIA STUDIES & PROCEDURE
DOE NEW INITIATIVES ON
HEALTH IMPACT ASSESSMENT

CHALLENGES IN PROMOTING GREEN ACTIVITIES
Promoting Green Industries (Cleaner Production/Sustainable
Consumption Principles) on SME Industries
Promotion of Green Technology (Green Economy)
Friend of Environment (RAS) Outreach Programme on 222
Parliamentary Constituencies
Awareness Raising on Sustainable Cities Program &
Sustainable Schools Program

Promoting “Competent Person” on DOE Staffs, Industries, Consultants & Service Providers via Certification Programmes in Executing Specialize Environmental Management Issues
Promoting Accumulation of CPD Hours
Timely, for Promoting Transformation of Command & Control of Enforcement Approach into Guided Self Regulation
CHALLENGES ON ENVIRONMENTAL TRAINING

• Call for Action
Due to complexity of Environmental
Issues & Challenges in Managing
them, collaboration along with
Agencies and Ministries should be
strengthened especially in Air &
Water Pollution Control and
Hazardous Waste Management &
Disposal
CONCLUSION

45
Thank You