Embed Size (px)
Citation preview

Environmental Insights From High-Resolution (SIMS) Sulfur Isotope Analyses of Sulfides in Proterozoic Microbialites With Diverse Mat Textures
CitationGomes ML, DA Fike, KD Bergmann, C Jones, and AH Knoll. 2018. Environmental Insights From High-Resolution (SIMS) Sulfur Isotope Analyses of Sulfides in Proterozoic Microbialites With Diverse Mat Textures. Geobiology 16, no. 1 (January): 17-34.
Permanent linkhttp://nrs.harvard.edu/urn-3:HUL.InstRepos:41292726
Terms of UseThis article was downloaded from Harvard University’s DASH repository, WARNING: This file should NOT have been available for downloading from Harvard University’s DASH repository.
Share Your StoryThe Harvard community has made this article openly available.Please share how this access benefits you. Submit a story .
Accessibility

Geobiology. 2017;1–18. wileyonlinelibrary.com/journal/gbi | 1© 2017 John Wiley & Sons Ltd
Received:16September2016 | Accepted:01September2017DOI: 10.1111/gbi.12265
O R I G I N A L A R T I C L E
Environmental insights from high- resolution (SIMS) sulfur isotope analyses of sulfides in Proterozoic microbialites with diverse mat textures
M. L. Gomes1,2 | D. A. Fike1 | K. D. Bergmann3 | C. Jones1 | A. H. Knoll2
1WashingtonUniversity,SaintLouis,MO,USA2HarvardUniversity,Cambridge,MA,USA3Massachusettes Institute of Technology, Cambridge,MA,USA
CorrespondenceM. L. Gomes, Johns Hopkins University, Baltimore,MD,USA.Email: [email protected]
AbstractIn modern microbial mats, hydrogen sulfide shows pronounced sulfur isotope (δ34S) variability over small spatial scales (~50‰ over <4 mm), providing information about microbial sulfur cycling within different ecological niches in the mat. In the geological record, the location of pyrite formation, overprinting from mat accretion, and post- depositional alteration also affect both fine- scale δ34S patterns and bulk δ34Spyrite val-ues. We report μm- scale δ34S patterns in Proterozoic samples with well- preserved microbial mat textures. We show a well- defined relationship between δ34S values and sulfide mineral grain size and type. Small pyrite grains (<25 μm) span a large range, tending toward high δ34Svalues (−54.5‰to11.7‰,mean:−14.4‰).Largerpyritegrains (>25 μm) have low but equally variable δ34Svalues(−61.0‰to−10.5‰,mean:−44.4‰).Inonesample,largersphaleritegrains(>35μm) have intermediate and es-sentially invariant δ34Svalues(−22.6‰to−15.6‰,mean:−19.4‰).Wesuggestthatdifferent sulfide mineral populations reflect separate stages of formation. In the first stage, small pyrite grains form near the mat surface along a redox boundary where high rates of sulfate reduction, partial closed- system sulfate consumption in microen-vironments, and/or sulfide oxidation lead to high δ34S values. In another stage, large sphalerite grains with low δ34S values grow along the edges of pore spaces formed from desiccation of the mat. Large pyrite grains form deeper in the mat at slower sul-fate reduction rates, leading to low δ34Ssulfide values. We do not see evidence for sig-nificant 34S- enrichment in bulk pore water sulfide at depth in the mat due to closed- system Rayleigh fractionation effects. On a local scale, Rayleigh fractionation influences the range of δ34S values measured for individual pyrite grains. Fine- scale analyses of δ34Spyrite patterns can thus be used to extract environmental information from ancient microbial mats and aid in the interpretation of bulk δ34Spyrite records.
1 | INTRODUCTION
Microbial mats are multi- layered aggregations of phylogenetically and metabolically diverse microorganisms. Microbial mats can be preserved in the geological record as microbialites, which are ubiquitous through geologicaltime(Grotzinger&Knoll,1999)andthushavethepotentialto provide a rich suite of information about the evolution of microbial
metabolisms and ancient environmental conditions. Precambrian mi-crobialites have received special attention because they provide in-sight intoourunderstandingofearly lifeonEarth.Additionally, it islikely that metabolic activity of microbial mat communities played a dominant role in biogeochemical cycling on the early Earth and thus influenced both nutrient and oxygen availability (Hoehler, Bebout, & DesMarais,2001;Anbar&Knoll,2002;Hayes&Waldbauer,2006).

2 | GOMES Et al.
Methodological and technological advances in geochemical imaging and fine- scale analyses have made it possible to evaluate geochemical heterogeneity in both modern microbial mats and microbialites over small spatial scales (i.e., μm- scale). By coupling these analyses with petrological information about mat textures, it is possible to evaluate potential signatures of biological process at play at the time of forma-tion, ancient environmental conditions, evidence for post- depositional alteration, and the influence of fine- scale heterogeneity on traditional bulk- scale (i.e., >1 cm3) geochemistry. Here, we use this approach to evaluate sulfur isotope heterogeneity in sulfide minerals within mi-crobialites from two time intervals in the Proterozoic Eon in order to explore patterns of sulfur cycling during this critical interval of Earth history.
Biogeochemical sulfur transformations are an important com-ponent of elemental cycling in microbial mats (Canfield & Des Marais, 1993; Habicht & Canfield, 1996; Fike, Gammon, Ziebis,&Orphan, 2008; Fike etal., 2009).Manymodernmicrobial matscontain an upper pigmented layer with oxygenic phototrophs (e.g., Cyanobacteria) overlying and admixed with anoxygenic phototrophs (e.g., certain taxa of the Chloroflexi and Proteobacteria such as the Chloroflexales and Chromatiales, respectively). These phototrophic communities fix carbon to produce energy and biomass, fueling mat growth and thereby providing a substrate for heterotrophic commu-nities. Sulfide is generated in the mats via microbial sulfate reduc-tion (MSR), a process by which microorganisms (e.g., certain orders of the Proteobacteria such as the Desulfobacterales) use sulfate to respire organic carbon (CH2O) or hydrogen (H2, not shown in the reaction below), generating hydrogen sulfide (H2S) and bicarbonate (HCO3
−):
The depth in the mat at which sulfide accumulates is called the sulfide chemocline. Diurnal cycles stimulate vertical migration of the sulfide chemocline (Canfield&DesMarais,1993;Fikeetal., 2009).During the day, photosynthetic oxygen production and sulfide oxida-tiondrivethesulfidechemoclinetodeeperwithinthemat.Atnight,the chemocline moves upwards as the result of continued sulfide ox-idation in the absence of photosynthetic oxygen production (Canfield &DesMarais,1993).
Sulfur isotopes provide a powerful tool for exploring patterns of sulfur cycling in microbial mats and other Earth surface environments. They are often quantified as the relative concentration of the two most abundant stable isotopes of sulfur, 32S(95.02%)and34S(4.22%),in delta notation (δ34S) as a permil (‰) deviation from the sulfur iso-tope composition of the Vienna Canyon Diablo Troilite (V- CDT) refer-ence standard.
The primary process that fractionates sulfur isotopes in Earth sur-face environments is MSR. During MSR, microorganisms preferentially utilize 32S, and therefore, the product, sulfide, can be depleted in 34S byupto~70‰relativetosulfate(Canfield,Farquhar,&Zerkle,2010;Sim, Bosak, & Ono, 2011; Wing & Halevy, 2014). The magnitude of δ34S fractionation during MSR (εSR) depends on cell- specific sulfate
reduction rates (csSRR;Habicht&Canfield,1996;Sim,Bosaketal.,2011; Sim, Ono, Donovan, Templer, & Bosak, 2011; Leavitt, Halevy, Bradley, & Johnston, 2013) and ambient sulfate concentrations (Habicht, Gade, Thamdrup, Berg, & Canfield, 2002; Wing & Halevy, 2014; Bradley et al., 2015). First, there is a negative correlation be-tween net sulfate reduction rate and εSR values that has been well documented inmicrobial cultures (Harrison&Thode, 1958; Kaplan&Rittenberg,1964;Chambers,Trudinger,Smith,&Burns,1975)andmarine sediments (Goldhaber & Kaplan, 1975). Low csSRR, whichcontribute to a low net sulfate reduction rates in a system, can result from limitation by organic carbon availability, nutrient availability, low sulfate levels, high sulfide concentrations, or a combination of these factors (Wing & Halevy, 2014; Bradley et al., 2015). Second, εSR values tend to scale with ambient sulfate concentrations, which can reflect strain- specific relationships between sulfate concentration and frac-tionation (Habicht et al., 2002; Wing & Halevy, 2014; Bradley et al., 2015) or Rayleigh isotope fractionation as the sulfate reservoir is more readily depleted when sulfate levels are low (Gomes & Hurtgen, 2013). However, the relationship between sulfate concentration, csSRR, and εSR values differs among microbial species (Bradley et al., 2015) and may have varied over Earth history in association with secular changes in ocean chemistry and/or biological evolution.
Sulfide oxidation is also a globally significant process (Jorgensen, 1982; Canfield, 1991). However, the magnitude of δ34S fraction-ations reported for various sulfide oxidation pathways is small (<10‰; Kaplan&Rafter,1958;Kaplan&Rittenberg,1964;Ivanov,Gogotova,Matrosov,&Zyakun,1977;Fry,Gest,&Hayes,1988;Zerkle,Farquhar,Johnston,Cox,&Canfield,2009;Poseretal.,2014)relativetoεSR val-ues.Although sulfide oxidation canbe important for driving overallδ34Spatterns,particularlyinshallowmarinesediments(Aller,Madrid,Chistoserdov,Aller,&Heilbrun,2010;Fike,Bradley,&Rose,2015),theconsensus is that environmental controls on MSR play the dominant role in determining the evolution of δ34Ssulfide values with depth in a sedimentary environment.
In the case of cyanobacterial mats from Guerrero Negro, Baja California Sur, Mexico, δ34Ssulfide patterns with depth in the mat are in-terpreted in terms of changes in average csSRR because sulfide abun-danceswere<1%of ambient sulfate concentrations, and therefore,neither sulfate limitation nor Rayleigh isotope effects influence δ34Ssulfide trends(Fikeetal.,2009).Inthetop1–4mmofthemat,δ34Ssulfide values are ~15‰–40‰ higher than δ34Ssulfide values deeper in the mat (Fike etal.,2008,2009).Additionalδ34Ssulfide oscillations (~20‰) occur well below the chemocline (~1.5 cm), and these are interpreted to reflect variable εSR at depth due to differential microbial metabolic activity that arises from different microbial populations, variations in avail-ability of carbon substrates or other metabolites, or additional sulfur species (e.g., polysulfides) at depth. However, the consistent trend that emerges is that δ34Ssulfide values are high near the surface redox bound-ary and decrease with distance from the redox boundary (Figure 1). Similarly, microbial consortia in marsh environments show a trend of high δ34Ssulfide values near the redox boundary due to differential mi-crobial metabolic activity rather than closed- system Rayleigh isotope effects (Wilbanks et al., 2014). Experimental evidence indicates that
SO2−
4+2CH2O→H2S+2HCO3−

| 3GOMES Et al.
sulfate concentration also influences δ34Ssulfide patterns; mat incuba-tions at low sulfate concentration (<1 mm) show smaller (~5‰) 34S- enrichments in sulfide toward the top of the mat and δ34Ssulfide values tend to be closer to δ34Ssulfatevalues (Fikeetal.,2009).Sulfideyieldswere low in these incubations, so it is unlikely that the δ34Ssulfide trends are due to closed- system Rayleigh isotope effects. Rather, the δ34Ssulfide patterns can be attributed to low εSR values associated with MSR at low sulfate concentrations, particularly when carried out by organisms that are otherwise adapted to higher sulfate concentrations (Bradley et al., 2015). Given how these trends vary with differential metabolic activ-ity associated with microbial communities present at different depths in the mat and ambient sulfate concentration, δ34Ssulfide patterns pre-served in ancient mats can provide additional paleoenvironmental con-text to complement bulk δ34Spyrite records.
Pyrite (FeS2) is an important geological archive of δ34Ssulfide trends in sedimentary systems where it is a ubiquitous component of marine sediments. However, there is still uncertainty about pathways of pyrite formation in sedimentary environments (see Rickard, 2012 for a re-view).Althoughstudiesofmodernsystemshaveshownthatδ34Spyrite values can be offset from pore water δ34Ssulfide values by up to 40‰, the working hypothesis is that δ34Spyrite values reflect δ34Ssulfide values atthelocationofpyriteformation(Lyons,1997)andtheoffsetisdueto transport of pyrite grains, unsteady diagenetic regimes, or pyrite formation in microenvironments (Bruchert & Pratt, 1996; Canfield,Raiswell, & Bottrell, 1992; Chanton, Martens, & Goldhaber, 1987;Raven, Sessions, Fischer,&Adkins, 2016). Petrographic informationcan be used to assess these effects.
It should be noted that above δ34Ssulfide trends with depth in mi-crobial mats differ from pore water δ34Ssulfide trends in some mod-ernmarine sediments (e.g., Hartmann&Nielsen, 1968; Figure1).Specifically, in some organic- rich modern marine sediments, pore water δ34Ssulfide values are low near the top of the zone of sulfide accumulation and increase with depth. This pattern is a result of closed- system Rayleigh isotope fractionation effects where δ34Ssulfide values evolve toward δ34S values of the overlying sulfate reservoir as the sulfate reservoir is progressively consumed. Such isotopic profiles are common in systems with high organic carbon availabil-ity, low rates of diffusion, and/or low sulfate concentrations (Gomes & Hurtgen, 2015). It is possible that the trend of 34S- enrichment due to high rates of sulfate reduction near the top of the zone of sulfate reduction could be superimposed upon the closed- system trend (e.g., Raven et al., 2016; Figure 1). The closed- system trend has not been documented in modern microbial mats because the fraction of sulfate consumed in the studied systems is too low (on the order of 1%) to producemeasurableRayleigh isotope fractionation effects(Fike etal., 2009). However, taking a holistic view that considersboth modern microbial mat and marine environments, high δ34Spyrite values could reflect the capture of the S- isotope signature of sul-fide near the top of the zone of sulfate reduction (associated with high csSRR, low εSRvalues,andoxidativesulfurcycling;Lyons,1997;Habicht&Canfield,2001;Dale,Bruchert,Alperin,&Regnier,2009)or at greater depths where a large portion of the sulfate reservoir hasbeenconsumed.Anotherpotentialmechanismtogeneratehighδ34Ssulfide values, which could be captured in pyrite, is via Rayleigh isotope fractionation associated with MSR in microniches that are not well connected with the surrounding pore water. Intragrain δ34S variability could add insight into the influence of this process on δ34Spyrite values. Petrography is a key tool that can be used to as-sess the environmental context of pyrite formation and to distin-guish between these possibilities. Thus, by coupling petrographic observations with fine- scale geochemical analyses, it is possible to make inferences about the location of pyrite formation and extract additional paleoenvironmental information from fine- scale δ34Spyrite patterns.
To evaluate how fine- scale δ34Ssulfide patterns in modern mi-crobial mats are preserved in sulfides in microbialites, we present fine- scale δ34S values of sulfide minerals from two microbialites from the Sukhaya Tunguska Formation, Siberia (Mesoproterozoic–Neoproterozoic transition; Sergeev, Knoll, & Petrov, 1997) and onemicrobialite from the Draken Formation, Spitsbergen (Neoproterozoic; Knoll,Swett,&Mark,1991).Weevaluatefine-scaleδ34Spyrite patterns in the context of petrographic information and elemental mapping and compare the results to δ34Spyrite patterns from modern microbial mats(Fikeetal.,2008,2009)andmicrobialconsortia(Wilbanksetal.,2014). This approach enables us to propose a framework for under-standing the pyrite formation dynamics that influence bulk δ34Spyrite values in microbialites, an approach that can be extended to other types of sedimentary materials in order to gain additional insights into the spectrum of biogeochemical sulfur cycling associated with major Earth- life transitions in the past.
F IGURE 1 Schematic diagram depicting pore water δ34Ssulfide patterns with depth in microbial mats or marine sediments. Left profile shows δ34Ssulfide patterns driven by differential (diff.) metabolic activity in microbial mats (orange) and Rayleigh isotope fractionation trends in modern marine sediments (purple). The right profile shows a pore water δ34Ssulfide profile (blue) where the differential metabolic trend is superimposed upon the Rayleigh isotope fractionation trend (i.e., the overlapping trend). *The overlapping trend is an idealized profile and, therefore, it should be noted that the depth and isotopic range varies greatly in natural systems because of differences in sedimentation rate, organic carbon and oxidant availability, and transport processes. See the Section 4 for explanations of points 1, 2, and 3

4 | GOMES Et al.
2 | MATERIALS AND METHODS
2.1 | Geological setting
Our samples come from silicified microbialites preserved in two Proterozoic carbonate platforms. The Sukhaya Tunguska Formation is exposed in the Turukhansk Uplift, along the northwestern margin of the Siberian Platform. This 530- to 670- m- thick succession records a shallowing- upward sequence from subtidal, basinal limestones to pe-ritidaldolomites(Petrov,1993;Petrov,Semikhatov,&Sergeev,1995).SamplesK95-101andK95-103comefromatidalflat/lagoonalunitmidway through the formation (Petrov etal., 1995),which consistsof intercalated dolarenite with low angle cross- stratification, dolomic-rite, intraclastic conglomerate, and microbial laminite. Early diagenetic chert is common, particularly in the microbial mats, with excellent preservation of microfossils (Mendelson & Schopf, 1982; Sergeevetal., 1997).Direct age constraints are limited, but on the basis ofmicrofossils and stromatolites, Russian stratigraphers have generally recognized the boundary between the Sukhaya Tunguska and over-lying Derevnya formations as the Middle- Upper Riphean boundary, implyinganageslightly>1,000Ma (Petrovetal.,1995;Semikhatovet al., 2000). Carbonate carbon isotope stratigraphy is consistent with this estimate (Bartley et al., 2001), as is a Pb–Pb carbonate date of 1,035±65Ma(Ovchinnikovaetal.,1995).
The Draken Formation is exposed in the glaciated highlands of Spitsbergen. Part of the nearly two thousand meter thick carbon-ateAkademikerbreensuccession(Knoll&Swett,1990),the150-to250- m- thick Draken Formation consists of tidal flat and lagoonal do-lomites, including microbial laminites and low domal stromatolites, oolites, oncolites, and intraformational conglomerates, along with areniticandmicriticbeds(Knolletal.,1991;Fairchild,Knoll,&Swett,1991).AlthoughDraken carbonates are almost entirely dolomitic,fabric retention is excellent, suggesting penecontemporaneous do-lomitization(Fairchildetal.,1991).Desiccationcracksoccursporad-ically throughout the succession, and both tepees and fenestrae are common, underscoring the peritidal setting of most Draken carbon-ates. Early diagenetic silicification is also common, with excellent preservation of microfossils (Knoll etal., 1991). Sample P4705-Acomes from the uppermost part of the formation, directly beneath the lowermost oolitic beds of the Backlundtoppen Formation; it consists of interlaminated grainstones and intraclasts of microbial laminite, with fabric specific silicification of the mat fragments. The age of the sample is constrained by the ca. 800 Ma Bitter Springs carbon isotope anomaly in the underlying Svanbergfjellet Formation (Halverson, Hoffman, Schrag, Maloof, & Rice, 2005) and by the overlying 717–660 Ma Sturtian tillites (Rooney, Strauss, Brandon, & Macdonald, 2015). Consistent with this age, Draken samples con-tain vase- shaped protistan microfossils comparable to those in suc-cessions from the Grand Canyon (Porter, Meisterfeld, & Knoll, 2003) and northwestern Canada (Strauss, Rooney, Macdonald, Brandon, & Knoll, 2014). The assemblage within the Draken is likely correlative with the older vase- shaped microfossils from both localities. If cor-rect, the Draken Formation is older than 740 Ma and well below the
IslayAnomaly,whichispreservedintheoverlyingRussøyaMemberin Svalbard (Karlstrom et al., 2000; Hoffman et al., 2012; Strauss et al., 2014).
One reason for selecting samples from these two formations is that both sites have avoided significant post- depositional alteration. While both formations have been buried, involved in collisional tec-tonic events, and exhumed, the maximal temperatures experienced were similar, with no evidence for significant metasomatic fluid flow events. The Sukhaya Tunguska Formation of the Turukhansk Uplift experienced a collisional event following Mesoproterozoic deposition but prior to the Ediacaran (Nikishina, Sobornov, Prokopiev, & Frolov, 2010). This faulting and uplift resulted in at least 3–4 km of erosion and maximum burial temperatures of 150–200°C (Frolov et al., 2015). The source rocks that have been studied from the Mesoproterozoic succession are post- mature but TOC- rich (Frolov et al., 2015). This is in contrast to the overlying Ediacaran stratigraphy whose source rocks are immature to early mature indicating the early burial and uplift of the Sukhaya Tunguska Formation was the only significant deforma-tional event in its history (Frolov et al., 2015). The geochemical charac-ter of Sukhaya Tunguska carbonates (both dolomites and limestones) has low Mn/Sr and Fe/Sr ratios and display 87Sr/86Sr ratios, δ13C val-ues, and δ18O values similar to other rocks of their age (Gorokhov etal.,1995;Pope,Bartley,Knoll,&Petrov,2003),whichisconsistentwith minimal post- depositional alteration of the carbonates.
The Draken Formation is overlain by a significant overburden of Neoproterozoic to Ordovician rocks (~3km; Knoll etal., 1991;Fairchild etal., 1991; Halverson, 2011). Additionally, deformationfrom the Caledonian Orogeny resulted in shortening and shear zones across Svalbard. However, this and more recent tectonic events ap-pear to have had minimal thermal overprinting effects on the northern Ny Friesland succession (Fairchild et al., 2016). Thermal estimates of the Ordovician- aged strata indicate immature to early mature organic materialfromconodontswithCAI1(Lehnert,Stouge,&Brandl,2013).Fine- scale observations suggest early alteration of the samples during shallow burial (Knoll etal., 1991; Knoll, Fairchild, & Swett, 1993;Fairchildetal.,1991).Geochemicalanalysesofcarbonates fromtheAkademikerbreenGrouparealsosimilartoothercarbonatesoftheirage (Halverson, Wade, Hurtgen, & Barovich, 2010; Fairchild et al., 2016).Asbothsiteshaveavoidedsignificantburialandtectonicover-printing, they allow us to explore trends in sulfur isotopes preservation from samples of different ages with minimal bias imposed by differ-ences in the metamorphic and metasomatic history.
An additional motivation for selecting samples from these twosites is their similar peritidal depositional setting and early diagenetic history including fabric- retentive dolomitization and selective early silicification in both cases. The mat fabrics from each unit are almost always preferentially silicified, and both sites contain exceptional mi-crofossil preservation of both filamentous forms and other types of matdwellers(Mendelson&Schopf,1982;Sergeevetal.,1997;Knolletal.,1991,1993;Fairchildetal.,1991).Silicificationprecededsub-stantial decay of mat building and dwelling microorganisms. Insofar as pyrite formation preceded silica emplacement, this sharply constrains the timing of pyrite deposition.

| 5GOMES Et al.
2.2 | Bulk geochemical analyses
Pyrite was extracted from homogenized samples using the chromium reduction technique (Canfield, Raiswell, Westrich, Reaves, & Berner, 1986) in the IsotopeGeobiology Laboratory atHarvardUniversity.Briefly, powdered samples (~1 g) were loaded into vessels that were subsequently purged of O2 by N2 gas. Pyrite- S was extracted as H2S by reaction with in boiling 1 m chromium chloride and 6N hydrochloric acid for 2 hr and driven by an N2 carrier gas to a trap vessel containing 0.3 mzincacetateand0.6%aceticacidandconvertedtozincsulfide.Analiquotof thetrapvesselwasremovedforconcentrationdeter-mination by the Cline method using a Thermo Scientific GENESYS 10SUV/VisSpectrophotometer(Cline,1969).TheremainingZnSwasconverted toAg2S and purified by rinsing with 1M ammonium hy-droxide,whichremovesallsilversaltsbesidesAg2S(Firsching,1961),and deionized water. For δ34Smeasurements,0.35–0.45mgofAg2S was weighed in tin boats along with 2–4 mg of vanadium pentoxide. Measurements of δ34S values were made on a Thermo Scientific Delta V Plus continuous- flow isotope ratio mass spectrometer at Harvard Universityby combustionofAg2S to SO2. S- isotope measurements were reproducible within 0.2‰ based on repeat analysis of interna-tionalstandards(IAEAS-1,IAEAS-2,andIAEAS-3).
Organic carbon concentration determinations were made on ho-mogenized and acidified samples. To remove inorganic carbon, ~1 g of powdered samples was treated with 3N hydrochloric acid and al-lowed to react for 24 hr. The hydrochloric acid was removed by re-peated rinses with deionized water. Calcium carbonate concentrations were determined gravimetrically based on loss during acidification. Organic carbon concentrations were determined on a Costech ECS 401ElementalAnalyzercoupledtoaDeltaVPlusmassspectrometerin the Stable Isotope Biogeochemistry Lab at Washington University. Analyticaluncertaintyis±0.1‰basedonreplicateanalysesoflabo-ratory standards.
2.3 | Petrography
Petrographic observations were made using a petrographic micro-scope. Images were taken using Leica EC4 Microscope camera. Scanning electron microscope images were also used for petrography (see Section 2.5).
2.4 | Grain size determinations
Grain diameters of sulfide minerals in thin sections were quantified from petrographic microscope images. These grain diameter values should be considered “apparent” grain size diameters because they were determined from the grain cross sections observed in thin sec-tion. If the thin section cut through the center of a spherical grain, then the measured diameter would represent the maximum diameter of the grain. In reality, the thin section exposes grain cross sections at random distances from the center of the grain. Therefore, the grain sizes reported here, and from similar studies of thin sections, are lower than the maximum diameter of the grain (assuming perfectly spherical
grains). It is not standard procedure in many petrographic studies to perform a correction to account for this effect. However, we note that this effect should be considered when combining petrological obser-vations with fine- scale geochemical analyses, particularly when trying to model environmental parameters giving rise to observed geochemi-cal trends.
2.5 | Elemental analysis
Elemental mapping data and scanning electron microscope images were acquired using the JEOL-JXA-8200 Superprobe at the MITElectron Microprobe Facility. Quantitative elemental spot analyses were carried out with an accelerating voltage of 15 kV, a beam cur-rentof10nA,andabeamsizeof1μm. Standards used for quanti-tative elemental analyses were chalcopyrite (S and Fe), hematite (O), and sphalerite (Zn).Detection limitswereas follows:60ppm forS,130ppmforFe,200ppmforO,and500ppmforZn.Errorestimatesbased on measurements of the standards (expressed as standard de-viationvalues)wereasfollows:0.23wt%forS,0.31wt%forFe,0.47wt%forO,and0.70wt%forZn.
2.6 | Secondary ion mass spectrometry
Secondary ion mass spectrometry (SIMS) measurements were made on the CAMECA IMS 7f-GEO at the Department of Earthand Planetary Sciences at Washington University on one- inch di-ameter round thin sections. Prior to mounting, a small (~2 mm) hole was made with a diamond dental drill in each sample and a piece of the Washington University in- house pyrite standard (δ34S=0.13±0.30‰;Meyer, Zerkle, & Fike, 2017) was insertedwith epoxy. This internal standard allowed us to correct for isotopic variability between sample holders and between different analyti-cal sessions. Thin sections were mounted and prepared with double polishing by High- Mesa Petrographics. Samples were gold coated (~35 nm) prior to analysis, in order to provide surface conductiv-ity sufficient to sustain the stable secondary ion extraction field requisite for precise isotope ratio analysis. To further aid precision Cameca“Z-1”sampleholderswereused,thesearespecificallyengi-neered to enhance the sample area available for precise isotope ratio analysis.Analysesweremade in “spotmode.”This term indicatesdata were acquired via bombardment with a Cs+ ion beam rastered over a few micrometers, but without any specific x, y registration of data origin other than the central coordinates of the beam in rela-tion to the sample. (In contrast, scanning ion image mode would re-quire a larger raster and data collection would be co- registered with the temporal beam coordinates.) There were 3- week- long sessions (May 2015, November 2015, and March 2016). The primary beam was set to a current of ~1nA and a diameter of ~2μm and was further rastered in a 2 × 2 μm grid to produce a δ34S measurement for a 4 × 4 μm area. Note that an unrastered larger spot could have been employed, however, the smaller spot plus raster mode was chosen as it allowed more flexibility to engage in close- proximity transect and/or micro- grain analyses. Experiments comparing small

6 | GOMES Et al.
spot plus raster mode with larger spot mode showed no difference in analytical precision.
Faraday cups were used to register relative ion currents for 32S (FC1; >108 c/s for 10 cycles) and 34S (FC2; >4 × 10⁶ c/s for 10 cycles) ions. Background levels on Faraday cups were calibrated at the begin-ning of each session and were <2 × 10⁴ c/s for 32S and <4 × 10³ c/s for 34S.Automaticpeakcentering,masscalibration,andpre-sputtering(10 s over a 4 μm × 4 μm area) were performed prior to each measure-ment. The small beam size (~2 μm) allowed for δ34S measurements on small sulfide grains (i.e., ~6 μm), with an average internal relative stan-dard deviation (RSD) of ~2.7‰ (calculated for n = 10 cycles for each sulfide analysis).
We performed a correction on sample and standard data to ac-count for differences in the depth of 32S and 34S measurements. On the 7f/geo 32S and 34S, data are acquired sequentially, repeated over a number of cycles. Counts of 32S and 34Sareacquiredfor0.96sand4s,respectively, with a 1.2- s wait time between analyses. This means that the time of acquisition for the 32S and 34S ions is slightly offset. This will not have an impact on measured δ34S values if samples (and result-ing ion counts) are homogenous; in our analyses, 32S and 34S counts eachvaryby<10%overthecourseof10cyclesinhomogeneousstan-dards. However, 32S and 34S counts in heterogeneous pyrite grains can varybyupto45%overthecourseof10cyclesofdatacollection.Inthese cases, the timing of collection for 32S versus 34S can bias δ34S results. To correct for this bias, we perform a linear interpolation on 32S count data to calculate a 32S count value that corresponds to the same time as the 34S measurement. This correction was performed on both standard and sample data.
The embedded standard was typically measured 2–4 times be-tweenevery9and15samplemeasurements.Weusedthebracket-ing standard data to correct our sample data to minimize the effect of instrumental bias imposed by drift over the course of the analyt-ical session (Valley&Kita, 2009). Replicate analyses of the embed-ded Washington University in- house standard (δ34S = 0.13 ± 0.30‰; Meyer et al., 2017) and a separately mounted Balmat standard (δ34S = 15.1‰) indicated that the average standard deviation (SD) of δ34S values measured on isotopically homogenous samples is 0.3‰. However, due to the greater isotopic heterogeneity in our samples compared to the standards, we report δ34S uncertainty for the un-knowns as the SD of individual sulfide grain data (n = 10 cycles). This SD value is used to express the spread in the data over 10 cycles, but does not necessarily imply that the data were normally distributed be-cause over 10 cycles the data were either randomly distributed around the mean or trended in a negative or positive direction. Data are pro-vided in order of analysis in Table S1.
Sphalerite(ZnS)grainswerealsoanalyzedbySIMS.Isotoperatiosfor sphalerite grains were calculated using a correction factor that was determined from the analysis of a Washington University in- house sphalerite standard with a known δ34S value (δ34S = 3.5 ± 0.3‰ [2SD]; determined by gas- source isotope ratio mass spectrometry). The count rate for sphalerite grains was on average 1.5× the count rate of py-rite grains. Differences in the crystal orientation of sphalerite grains with respect to the incident primary Cs+ beam have been shown to
introduce an instrumental bias that can result in an inaccuracy of up to 3‰ if the standard grain has a different orientation from the sam-ple (Kozdon et al., 2010); in contrast, pyrites have a maximum known orientation effect of 0.2‰ (Kozdon et al., 2010). We did not deter-mine the extent of inaccuracy imposed by the crystal orientation ef-fect in our analyses and therefore use the maximum value reported by Kozdon et al. (2010) as our uncertainty in Table S2.
To account for potential spatial δ34S variability in larger pyrite grains (i.e., >14 μm), we performed δ34S measurements in grain tran-sects along the central vertical and horizontal plane, as positioned in the SIMS and pictured in petrographic images. To evaluate biases im-posed by closely spaced (~5 μm) measurements, we used the same method to measure vertical and horizontal transects on the Balmat standard. The close spacing (i.e., 5 μm) of measurements along the hor-izontal plane resulted in δ34S variability of up to 5.4‰ on standards. This increased isotopic variability is attributed to differential ionization effects introduced by interactions between the incident primary Cs+ beam and adjacent pits made by previous measurements; this effect occurs because the incident primary Cs+ beam approaches the surface ofthesampleatanglealongthehorizontalplane.Additionalexperi-ments determined that, for these analytical parameters, data were no longer compromised when a horizontal spacing >8 μm was used. This effect could also be avoided using diagonal steps for closely spaced measurements in orthogonal transects. The maximum δ34S variability was much lower (i.e., 1.7‰) on transects along the vertical plane (i.e., orthogonal to the angled direction of incident Cs+ beam), where the impact of adjacent spots was minimal. Thus, here we only report δ34S data for transects along the vertical plane. The δ34S measurements from each grain transect were averaged to calculate δ34S values for each pyrite grain, and we compare these values directly to the single δ34S measurements made on individual grains.
3 | RESULTS
The studied thin sections include centimeter- scale microbial mats, mat clasts, and clastic layers, which contain smaller mat fragments (Figure 2). Petrographic observations using both transmitted and re-flected light, supplemented with elemental analysis data, indicate that portions of the samples that appear dark in Figure 2 contain finely disseminated, small (<25 μm) pyrite grains. The small pyrite grains rep-resent~1%–2%ofthesedarkmattextures.Themattexturesappearto be dark in both cross- polarized and plane- polarized light and are interpreted to be organic- rich (Figures 2, 4, and 5). In the lighter por-tion of the samples (Figure 2), localized populations of larger (>25 μm) sulfide grains were found on the edges of silicified void spaces. Thus, the general pattern is that small pyrite grains (<25 μm diameter) tend to occur in dark, organic- rich portions of the samples, while larger sulfide grains are found in organic- poor, silicified regions that appear transparent in plane- polarized light (Figures 2, 4, and 5). In what fol-lows, we will describe each sample individually.
Petrography, elemental maps, and elemental analysis data from Sukhaya Tunguska Formation sample K95-101 indicate that the

| 7GOMES Et al.
sulfide grains in this sample are pyrite (Figures 3, 4a–c and 5a,b; Table S2). Most pyrite grains in this sample are small (<25 μm; only one of the 18 samples analyzed by SIMS was >25 μm), spherical, range from subeuhedraltoeuhedralgraintextures,andcover<1%oftheareaoforganic- rich mat textures (Figures 4a–c and 5a,b). Both the light and dark portions of the sample are silicified, with dolomite grains (<50 μm) coveringatmost~10%oftheorganic-richarea(Figure4c).
Sulfide grains in K95-103, also from the Sukhaya TunguskaFormation, are predominantly pyrite (Figures 3, 4d–f and 5c,d,g; Table S2), but also include some large (>35 μm diameter) sphalerite (ZnS)grains (Figure5e–h;TableS2).Both thedark,organic-richandlighter potions of the samples are silicified. Dolomite grains (<50 μm)
comprise ~2% of the area in organic-richmat textures of K95-103(Figure 4f). Small pyrite (<25 μm)comprise~1%oftheareaoforganic-rich mat textures and have subeuhedral to euhedral spherical shapes (Figures4d–f and 5c,d,g). Large sulfide grains in K95-103 occur onthe edges of silicified fenestrae and are predominantly sphalerite (Figure 5e–h; Table S2). The shapes of the sphalerite grains are highly irregular and may result from the aggregation of smaller particles (Figures 5e–h).
IntheDrakenFormationsampleP4705-A,theconcentrationsofS and Fe in sulfide grains range from the weight percent predicted from the stoichiometry of pyrite (FeS2:S≈53.5wt%,Fe≈46.5wt%)tomoreoxidizedformsresemblingironoxideswithFe≈60wt%andO≈30–35wt%(Figures3and5;TableS2).Onlypyriteswithlowoxy-gensignal(generally<1wt%O)wereanalyzedforδ34S data. Similar to the Sukhaya Tunguska Formation samples, small pyrite grains (<25 μm) tend to occur in organic- rich mat textures (Figures 4g–i and 5m,n). Small (<25 μm) pyrite grains are subhedral to anhedral and comprise 3%–10%oftheareaoforganic-richmattextures,withhigherpercent-ages found in darker portions of the sample (Figures 4g–i and 5m,n). In contrast to the Sukhaya Tunguska Formation samples, these organic- rich sections areheavilydolomitized in sampleP4705-A,with silicaonlyrepresenting~5%ofthearea(Figures4iand5o,p).Largepyritegrains (>25 μm) occur along the boundary of silicified vugs or chan-nels (Figure 5m–p). These grains can be euhedral and primarily py-rite (e.g., Figure 5o) or framboidal grains that show evidence for both overgrowths and differential oxidation of both framboid boundaries and interiors (e.g., Figure 5p). Large pyrite grains were also found in a silica- rich portion of a mat fragment (Figure 5i,j). These grains have morphologies consistent with formation by aggregation of smaller par-ticles and have either anhedral (e.g., Figure 5l) or overgrown, subhedral framboidal shapes (e.g., Figure 5k).
In all three samples, mean δ34S values of individual sulfide grains range around the sample bulk δ34S values (Figure 6), which were de-termined from sulfide extracted via the chromium reduction method (Canfieldetal.,1986).Whilegenerallyassumedtoreflectpyrite,thechromium reduction method recovers sulfide that is operationally de-fined as the chromium reducible sulfide (CRS) pool because it recovers sulfide from both pyrite and sphalerite (as well as other metal sulfide
F IGURE 2 Microbialitethinsections:(a)K95-101and(b)K95-103,bothfromtheca.1,000MaSukhayaTunguskaFormation,Siberia,and(c)P4705-A,fromtheca.750MaDrakenFormation,Spitsbergen.LocationswheresulfidemineralswereanalyzedbySIMSareindicatedwithpurple filled circles (see Table S1 for x and y coordinates). The list below each thin section image indicates the sulfide grain # that correspond to those listed in Tables S1 and S2 and figures with high- resolution images of the sulfide grains that correspond to each location. The location of the Washington University in- house standard is circled in red. Each thin section is 2.54 cm in diameter
F IGURE 3 TernarydiagramofFe,S,andOconcentrations(wt%)inP4705-A(reddiamonds),K95-101(greensquares),K95-103(purple circles), pyrite (black square), and hematite (black diamond). The gray dotted line indicates the mixing line between pure pyrite andpurehematite.P4705-Ashowsevidenceofdiageneticpyriteoxidation. Only pyrites with low oxygen concentrations (generally <1wt%O)wereanalyzedforδ34S values

8 | GOMES Et al.
minerals) if no acid pre- treatment step is included. Individual pyrite grain δ34S values in Sukhaya Tunguska Formation sample K95-101range from −11.6±3.1‰ to 11.7±3.2‰,with a mean SIMS δ34S valuewithinthesampleof−4.5‰(σ = 5.7‰, n = 18). The bulk δ34SCRS valueforK95-101is0.6±0.2‰.TheothersamplefromtheSukhayaTunguskaFormation,K95-103,hasaslightlylowerbulkδ34SCRS value of−5.1±0.2‰.Correspondingly,themeanindividualgrainδ34S value forallsulfidegrainsinK95-103isslightlylowerat−8.6‰(σ = 6.7‰, n = 24), with a range of δ34S values between −22.6±1.5‰ and7.6±2.1‰.TheDrakenformationsample,P4705-A,hasabulkδ34SCRS valueof−28.0±0.2‰,abimodaldistributionofindividualgrainδ34S values, a mean SIMS δ34Svalueof−34.6‰(σ=15.9‰,n = 46), and
an individual grain δ34Srangeof−61.0±4.4‰to−6.4±1.9‰.TheconcentrationsofCRSare230±20ppmSinK95-101,301±20ppmSinK95-103,and516±20ppmSinP4705-A.Totalorganiccarbonconcentrationsare0.6±0.1wt%inK95-101,0.4±0.1wt%inK95-103,and0.2±0.1wt%inP4705-A.
4 | DISCUSSION
4.1 | Fine- scale δ34S trends
These two sample suites were selected for their similar diagenetic histories of early dolomitization, silicification, and exceptional mat
F IGURE 4 Images of organic- rich matrix with small pyrite grains (<25 μm):(a–c)K95-101(d–f)K95-103,and(g–i)P4705-A.Imagesinthe left- most column (a, d, g) are in plane- polarized light. Images in the center column (b, e, h) are in reflected light. Images in the rightmost column (c, f, i) are SEM images overlain by elemental maps, which show distributions of silica (Si, green), pyrite (indicated by Fe, orange), and dolomite (indicated by Mg, purple). The location of (c), (f), and (i) is indicated by white boxes in (a and b), (d and e), and (g and h), respectively. The blue box in (d) and (e) indicates the location of the image in Figure 5k. Pyrites appear in bright gold color in the reflected light images (b, e, h). White arrows (a–f) indicate pyrite grains that have been analyzed by SIMS. Pyrite grains in images (g), (h), and (i) were not analyzed by SIMS, butareshownheretoprovideanexampleofthemicrotexturesassociatedwithsmallpyritegrainsinP4705-A
200 µm 200 µm 200 µm
200 µm 200 µm 200 µm
200 µm 200 µm 50 µm
(a) (b) (c)
(d) (e) (f)
(g) (h) (i)

| 9GOMES Et al.
fabric preservation, as well as their moderate temperature history and lack of evidence for metasomatic alteration. Although sepa-rated in age, they sample comparable environments that underwent similar early diagenetic silicification and preservation of early pyrite. Fine- scale δ34S analyses and petrographic observations of sulfide minerals reveal a well- defined relationship between populations of small versus large sulfide grains and δ34S values (Figure 7). Smaller pyrite grains (<25 μm), which are more common in organic- rich portions of mat fragments (Figures 4 and 5a–d,m,n), tend to have higher δ34S values. Larger pyrite and sphalerite grains (>25 μm),
found along the boundaries of silicified pore spaces (Figure 5e,f,m,n) and in mat fragments that have been almost completely replaced by silica (Figure 5i,j), tend to have lower δ34S values. These two groups of pyrite grains are reflected in the bimodal distribution of δ34Svalues inthehistogramofP4705-A (Figure6c).Thedistribu-tion of δ34S values in the Sukhaya Tunguska Formation samples (Figure 6a,b) does not show a bimodal pattern because the number of large sulfide grains in the sample is small (i.e., one >25 μm pyrite grainwasanalyzedinK95-101andthree>25μm sphalerite grains wereanalyzedinK95-103).Weinterprettherelationshipbetween
F IGURE 5 Imagesofcross-cuttingrelationships:(a,b)organic-richmattexturesinK95-101,(c,d)organic-richmattexturesinK95-103,(e–h)sphaleritegrainsinK95-103,(i–l)pyritegrainsinalaminatedsilicifiedmatfragmentinP4705,and(m–p)pyritegrainsattheboundarybetweensilicified void spaces and organic- rich mat textures in P4705. Images (a), (c), (e), (i), and (m) are taken in plane- polarized light. Images (b), (d), (f), (j), and (n) are taken in reflected light. Images in (g), (h), (k), (l), (o), and (m) are SEM images overlain by elemental maps, which show distributions of Si (green, indicating silicified material), Fe (orange, indicating pyrite in (g), (h), (k), (l), and (o) and iron oxides in (m), Mg (purple, indicating dolomite), Zn(pink,indicatingsphaleritein(g,h)),andS(yellow,indicatingpyritein(m)).SulfidegrainsthathavebeenanalyzedbySIMSareindicatedbywhite arrows in plane- polarized and reflected light images. The location of image G is indicated by the blue box in Figure 4d,e. The white box in (e) and (f) indicates the location of image (h). Images (k) and (l) show pyrite grains within the same silica- rich mat fragment shown in images (i) and (j) and is located ~2 mm to the left of (i) and (j). The leftmost white box in (m) and (n) indicates the location of image (p). The rightmost white box in (m) and (n) indicates the location of image (o). Pits made by SIMS measurements are shown in (g), (h), (k), (l) and (o). Sample names for grainsinSEMimagesareasfollows:(g)K95-103-PYR14;(H)K95-103-PYR12;(k)P4705-A-PYR49(top)andP4705-A-PYR50(bottom);(l)lefttoright:P4705-A-PYR43,P4705-A-PYR44,P4705-A-PYR46,P4705-A-PYR45,P4705-A-PYR47,P4705-A-PYR48,P4705-A-PYR51,P4705-A-PYR50,andP4705-A-PYR49;(o)P4705-A-PYR40;(m)lefttoright;P4705-A-PYR81andP4705-A-PYR80
500 µm 500 µm 200 µm 200 µm
100 µm
100 µm
200 µm 200 µm
100 µm
100 µm
20 µm
20 µm
20 µm 20 µm
50 µm
100 µm
(a) (b) (c) (d)
(e)
(i)
(m)
(j) (k) (l)
(n) (o) (p)
(f) (g) (h)

10 | GOMES Et al.
δ34S values in small versus large sulfide grains to reflect different generations of sulfide formation.
The small pyrite grains (<25 μm) with relatively high δ34S val-ues represent one generation of sulfide formation. If we consider δ34Ssulfide trends from modern microbial mats and consortia, where δ34Ssulfide values tend to be higher near redox boundaries due to high average csSRR and low εSR values (i.e., the differential metabolic ac-tivitytrendinFigure1;Fikeetal.,2008,2009;Wilbanksetal.,2014),we could infer that these small pyrite grains represent a first genera-tion of pyrite formation near the surface of the mat (i.e., location #1 in Figure 1). However, high δ34Ssulfide values also occur deeper within the sediments of many modern marine sedimentary environments (i.e., location #2 in Figure 1) as a result of closed- system Rayleigh isotope effects during early diagenesis. Closed- system Rayleigh isotope fractionation trends have not been documented in modern marine microbial mats because sulfate concentrations are high (i.e., >28 mm) and only a small portion of the sulfate reservoir is consumed (<1%;Fikeetal.,2009).Similarly, incubationswith lowsulfatecon-centrations (0.2–1 mm) using mat samples from modern marine en-vironments did not show Rayleigh isotope fractionation trends. The lack of closed- system isotope effects was attributed to low rates of sulfide production (Fike etal., 2009), likely because the microbialcommunities in the mats were not adapted to low sulfate concentra-tions (Bradley et al., 2015). However, it is possible that the microbial mat communities associated with mat fragments in the studied sam-ples were adapted to low sulfate conditions that were common in Proterozoic oceans (Canfield, 2004; Kah, Lyons, & Frank, 2004) and therefore could consume a sufficiently large portion of the sulfate reservoir to generate a Rayleigh fractionation δ34Ssulfide trend; such apatternhasbeendocumented in lateArcheansediments (Fischeret al., 2014). Thus, high δ34Ssulfide values in the small pyrite grains could either capture the signature of sulfide near the redox boundary at the surface of the mat or at greater depths where a large fraction of the sulfate reservoir was consumed. It is also possible that high δ34S values in the small pyrite grains reflect local microniches with variable but localized influences of Rayleigh isotope fractionation on δ34Ssulfide values, which could occur at any depth in the mat.
Using petrographic context and knowledge of pyrite formation mechanisms, we can attempt to differentiate between these two potential locations of small (<25 μm) pyrite formation. First, the small pyrites are evenly disseminated in organic- rich groundmass with microtextures such as wavy crinkled laminae (Figures 4d,e, and 5a–d) sponge pore fabrics (Figure 4a,b,g,h) and adjacent shrinkage cracks (Figure 5a–f) that are characteristic of microbially induced sedimentary structures (Noffke, 2009). Thus, although samplesK95-101 and K95-103 come from a different formation thanP4705-A, allof the studied samples showapetrographic associa-tion between small pyrite grains and organic- rich fragments with mat textures. Similar types of small pyrite grains in kerogen- rich ma-trixmaterialinArcheanmicrobialcarbonateswereinterpretedtobeearly diagenetic pyrites (Kamber & Whitehouse, 2007). The early diagenetic origin of the small pyrite grains in our samples is further
F IGURE 6 Frequency distribution of pyrite (FeS2;graybars)andzincsulfide(ZnS;hatchedgraybars)δ34Svaluesfor(a)K95-101,(b)K95-
103,and(c)P4705-A.Bulkδ34S values of chromium reducible sulfide (CRS) are indicated by the black bar. Probability density functions are shownforalldatainK95-101(a;solidline),<25μm FeS2inK95-103(b;dottedline),ZnSinK95-103(b;dashedline),<25μm FeS2inP4705-A(c; dotted line), and >25 μm FeS2inP4705-A(c;dashedline)
F IGURE 7 Grain size versus δ34SvaluesforP4705-Apyrite(FeS2; reddiamonds),K95-101pyrite(FeS2;greensquares),K95-103pyrite(FeS2;purplecircles),andK95-103sphalerite(ZnS;purpletriangles).Solid lines indicate the linear regression line, and shaded regions representthe±95%confidenceinterval

| 11GOMES Et al.
supported by the excellent fabric retention and preservation of mi-crofossils in both the Sukhaya Tunguska and Draken microbial mats, which suggests early diagenetic silicification and/or dolomitization (Mendelson&Schopf,1982;Fairchildetal.,1991;Knolletal.,1991;Sergeevetal.,1997).
Second, empirical and theoretical studies of pyrite formation suggest thatpyrite is formednear redoxboundaries (Rickard,1975;Wilkin,Barnes,&Brantley,1996;Wilkin,Arthur,&Dean,1997)andthat small pyrite grains, in particular, are formed in locations with rapid redox oscillation (Wilkin etal., 1996).Therefore, it is likely that theearly diagenetic, small pyrite grains were formed near the surface of the mat where diurnal cycles promote redox oscillation via vertical migration of the chemocline and the presence of intermediate sulfur species promotes pyrite formation. Biotic or abiotic (i.e., by reaction with H2S) reduction in iron oxides would also promote pyrite forma-tion near the redox interface. It is possible that pyrite growth con-tinued during burial upon the grains nucleated near the mat surface, and this may account for some of the inter- and intragrain range in the SIMS δ34S values of the <25 μm pyrite grains. The intragrain δ34S range could also reflect Rayleigh isotope effects occurring in microen-vironments. We cannot completely rule out pyrite formation in deeper portions of the mat where δ34Ssulfide values were high due to significant consumption of the sulfate reservoir. However, finely disseminated pyrite textures are believed to be the result of nucleation bursts and subsequent decreases in pyrite saturation (Rickard, 2012), which likely occurs in locations with frequent redox oscillations. Thus, based on these insights about how pyrite formation process impact pyrite tex-tures and the association with organic- rich mat fragments (Figures 4 and 5a–d,m,n), we posit that the small pyrite grains (<25 μm) with high δ34Spyrite values were formed near a redox boundary (i.e., location #1 in Figure 1). In this location, low apparent S- isotope fractionations be-tween sulfate and sulfide are a result of either high average csSRR associated with the respiration of photosynthetically produced labile organic matter and low sulfide concentrations due to active sulfide oxidation or Rayleigh isotope fractionation in microniches.
Large pyrite grains (>25 μm) represent a different generation of sulfideformation inP4705-A,with lowerδ34S values than the small pyrites. The δ34S value of the single >25 μmpyritegraininK95-101isalsoslightlylower(−10.5±2.0‰)thanthemeanδ34S value of the <25 μmpyritegrains(−4.2‰,σ = 5.7‰, n = 17). Only a single >25 μm pyrite grain was observed, and therefore, we will focus this discus-siononP4705-A,whichhasamorerobustdataset;however,wenotethat grain size and δ34StrendsinK95-101areconsistentwiththoseobservedinP4705-A.Theselarge(>25μm)grainsinP4705-Aarelo-cated along the boundaries of silicified vugs or channels (Figure 5m–p) as well as channelized portions of silicified mat fragments (Figure 5i–l). The pore spaces are thought to form either as a result of primary po-rosity in the microbial mats or from the dissolution of precursor mate-rials under the influence of meteoric or deep- burial fluids (Choquette &Pray,1970).Whilewecannotcompletelyruleoutthepossibilitythatthese grains formed during deep burial from hydrothermal (or other) fluids, their location along the edges of silicified void spaces and mat fragments implies their formation predates silicification.
It is also unlikely that these grains formed from hydrothermal fluids because the δ34S values of the large (>25 μm) pyrite grains are lower thanhydrothermallyderivedsulfide(i.e.,1‰to3‰;Arthur,2000)aswell as the small pyrite grains, which could have served as a source of sulfide from dissolution in hydrothermal fluids. It is also possible that dissolution of pyrite in adjacent sediments could be a source of sul-fide. However, fractures cross- cut the large pyrite grains (Figure 5i,j) and silicified pore spaces (Figure 5m,n) and therefore postdate the formation of the large pyrite grains and silicified pore spaces. This im-plies that, if sulfide from adjacent sediments was transported through these fractures, it did not contribute to the formation of the large py-rite grains. Instead, it is likely that the large pyrite grains formed from early diagenetic pore fluids flowing though the vugs or channels at depth within the mat (i.e., location #3 in Figure 1) or, in the case of reworked mat fragments, after the mats had been ripped up by storms andredepositedinmoreoffshoresettings.Additionalsupportforadi-agenetic rather than hydrothermal sulfide source is the excellent fabric retention and preservation of microfossils associated with these sam-ples that indicates early dolomitization and silicification (Knoll et al., 1991;Fairchildetal.,1991).Therefractorynatureoforganiccarbondeep within the mat and/or entrained and redeposited mat fragments could lead to low average csSRR, resulting in high εSR values and low δ34S values. Nutrient limitation or co- limitation may also play a role in suppressing average csSRR (Bradley et al., 2015), but is not necessarily required to explain the fine- scale δ34S patterns. In sum, the large pyrite grains tend to have lower δ34S values because they record δ34S values of sulfide produced at low average csSRR deep within sediments in locations exposed to fluids promoting pyrite formation.
The large (>35 μm)sphaleritegrainsinK95-103representyetan-other stage of sulfide mineral formation. It is important to note that sphalerite grains were only detected in one sample, and therefore, we have only observed evidence for this stage of sulfide mineral growth in sampleK95-103.InK95-103,thesphaleritegrainsarelocatedalongthe edges of pore spaces (Figure 5e–h) and have low δ34S values, while the smaller pyrite grains are evenly distributed in organic- rich mat fragments (Figures 4d,e and 5c,d) and have higher δ34S values. Pyrite and sphalerite have different thermodynamic relationships, reaction kinetics, and redox reaction pathways that influence how we inter-pret the δ34S values of the sphalerite grains. In particular, sphalerite is thought to form prior to pyrite due to faster water exchange re-actionkineticsassociatedwithZn(Morse&Luther,1999).Thus,wemight expect that the sphalerite grains formed before both the small and the large pyrite grains. In fact, precipitation of sphalerite has been documented in modern biofilms (Labrenz et al., 2000) and these sphalerite grains share some characteristics with the sphalerite grains inK95-103.Sphaleritegrainsinthemodernbiofilmshavemicrotex-tures formed by aggregation of smaller particles, are a few tens of mi-crometers in size, have spatially heterogeneous distribution patterns, and are found in organic- rich microenvironments (Druschel, Labrenz, Thomsen- Ebert, Fowle, & Banfield, 2002). Yet, sphalerite grains are notfoundwithintheorganic-richmatfragmentsinK95-103.Instead,the sphalerite grains are primarily found along the boundary between organic- rich mat fragments and laminoid fenestrae (Figure 5e–h).

12 | GOMES Et al.
Laminoid fenestrae are commonly formed in intertidal to supratidal settings from wetting and drying of microbial mats and/or carbonate mud that leads to separation of the mat surface from the adjacent sed-iment(Shinn,1968;Davies,1970;Logan,Hoffman,&Gebelein,1974;Hardie&Ginsburg,1977).Thus,thesphaleritegrainslikelyformedasa result of diagenesis that occurred after the wet- dry cycles that led to the development of the laminoid fenestrae.
Shale and iron formation records suggest that Proterozoic marine zinc concentrations were similar to modern marine levels (Scott et al., 2013; Robbins et al., 2013), and so seawater zinc would be available for sphalerite formation. We do not find sphalerite grains finely dis-persed in the organic- rich matrix materials, which necessarily formed prior to the development of laminoid fenestrae during desiccation. It is possible that organic complexation or microbial uptake of zinc in the mats depleted the porewaters of available zinc and inhibited the formation of zinc sulfides within the organic- rich matrix. Then, during the time periods between the re- wetting of the desiccated mat and the establishment of a new phototrophic microbial mat community, diminished zinc uptake by microorganisms allowed for higher concen-trations of zinc. This laid the foundation for sphalerite formation along the boundary between fenestrae and organic- rich mat fragments that served as an organic carbon substrate for MSR. This would require a large quantity of zinc and therefore repeated wet- dry cycles or intro-duction of new zinc by flushing with seawater under continued wet conditions over a long time period before the re- establishment of pho-totrophic microbial mat communities. The formation during repeated wet and dry cycles is consistent with the large range of δ34S values measured in sphalerite grain transects (i.e., up to 117.4‰; Table S1) because differential rates of MSR, diffusion and advection, evapora-tion and wetting (which would concentrate or dilute sulfate, sulfide, and zinc), and Rayleigh isotope fractionation in microenvironments would result in heterogeneous δ34Ssulfide values over the course of min-eral growth. Despite the large range of δ34S values in sphalerite grain transects, mean δ34S values of sphalerite grains are similar (Figure 6b). Thus, mean δ34S values of sphalerite grains capture an integrated sig-nal of this stage of sulfide growth in this sample. The heterogonous intragrain δ34S values imply that microbial sulfate reducers were able to utilize organic carbon in the mat or entrained in fluids in previously desiccated mats to reduce sulfate to sulfide in an unsteady diagenetic regime.
Based on the hypothesized formation mechanisms for the dif-ferent generations of sulfide minerals, we can draw some inferences about the environmental history of the microbialite samples and the δ34Ssulfide signatures of each stage of sulfide formation. In this discus-sion, it is important to note that the lagoonal depositional setting of the microbial mats (i.e., prior to entrainment and redeposition) could have had varying degrees of connectivity with the ocean and/or rates of evaporation during the lifetime of the mat. Evaporation of water does not directly affect the isotopic composition of sulfate, but it does alter the size of the local sulfate reservoir. Enhanced evaporation of seawater would lead to higher sulfate concentrations and a decreased potential of Rayleigh isotope fractionation during MSR to drive sul-fate to high δ34S values. In contrast, the input of freshwater from
land or precipitation would lead to lower sulfate concentrations and a greater potential for sulfate to become 34S- enriched due to MSR. Or, put another way, δ34Ssulfate values can vary to a greater extent when sulfate levels are low due to the dilution of seawater by freshwater or precipitation. In what follows, we take S- isotopic analyses of late Mesoproterozoic and early to mid- Neoproterozoic gypsum and an-hydrite δ34S values of ca. 20 ± 5‰ to approximate the isotopic com-position of seawater sulfate (Kah, Lyons, & Chesley, 2001; Canfield, 2004), but note that the sulfate concentration and potential for 34S- enrichment in sulfate may vary as a function of lagoon hydrology, and this also has potential to affect δ34Spyrite values.
InK95-101, pyrite grains are predominantly small (<25μm) and have high δ34Svalues(−11.6±3.1‰to11.7±3.2‰).Wesuggestthatthese grains capture the signature of sulfide near the redox boundary based on their even distribution in organic- rich mat fragments, excel-lent fabric retention, and preservation of microfossils in these samples thatindicatesearlylithification(Mendelson&Schopf,1982;Fairchildetal.,1991;Knolletal.,1991;Sergeevetal.,1997),and theoreticalmodels of how environmental conditions influence pyrite morphology (Rickard,2012).Althoughthissamplecouldhavegonethroughwet-dry cycles and have been impacted by fluid flow during deep burial, we do not see petrographic evidence for sulfide formation during these stages. Thus, the bulk δ34SCRSvalueofK95-101recordstheδ
34S sig-nature of pyrites formed adjacent to the redox boundary in the upper portions of the mat during early diagenesis. The δ34S values of the majority of the individual pyrite grains are lower bulk δ34SCRS value, which may indicate that the pyrite grains that were too small to be measured by our SIMS method (i.e., <5 μm) have higher δ34S values. The δ34S range in individual pyrite grains of 23.3‰ could reflect local-ized Rayleigh isotope fractionation due to significant sulfate consump-tion during early diagenesis or heterogeneity of εSR values in early diagenetic microniches in the upper portions of the mat environment. Considering the average of the small pyrite δ34S values, the S- isotope difference between this small pyrite population and estimated coeval seawater sulfate is 24.5‰, which is similar to the S- isotope difference between the bulk δ34SCRS value and inferred coeval seawater sulfate (19.4‰).Thisimpliesthat,inabsenceofsignificantRayleighisotopefractionation of the overlying sulfate reservoir, the average S- isotope fractionation between sulfate and sulfide (Δ34S) near the upper redox boundary was ~20‰ in this 1,000 Ma microbial mat, which should be considered a minimum value because Rayleigh isotope fractionation in microenvironments would decrease the apparent δ34S offset.
K95-103 contains both small (<25μm) pyrite grains and large (>35 μm)sphaleritegrains.Applyingthecriteriagivenintheprevi-ousparagraphfor theformationofsmallpyritegrains inK95-101to this sample, we similarly suggest that the small pyrite grains formed first near the redox boundary close to the mat surface. Subsequent wet- dry cycles lead to the establishment of laminoid fenestrae (Figure 5e–h) and subsequent formation of large sphaler-ite grains. The bulk δ34SCRS value represents a mixed signal of two sulfide populations formed during different stages of diagenesis and is offset from the coeval seawater sulfate δ34S value by 25.1‰. On its own, this bulk value may not be that meaningful because it does

| 13GOMES Et al.
not represent a single stage of sulfide mineral formation. However, the fine- scale analyses allow us to demonstrate that the mean small pyrite δ34S value is 27.1‰ lower than the estimated δ34S value of coeval seawater sulfate. This value, which approximates the Δ34S value near the upper redox boundary, is similar to the Δ34S value of 24.5‰determinedfortheother1,000Masample(K95-101).Themean sphalerite δ34Svalueis39.4‰lowerthantheestimatedδ34S value of coeval seawater sulfate. It is possible that the bulk δ34S sig-nature of these two sulfide populations could be determined from sequential extraction of sphalerite by acid extraction and pyrite bychromiumreduction(seeMorse&Luther,1999fordiscussion).Unfortunately, there is no corresponding way to chemically separate different generations of pyrite grains. Nonetheless, sequential sep-aration of these operationally defined sulfide pools could aid in dis-tinguishing populations of sulfide minerals with distinct δ34S values. Supplementing the sequential extraction with fine- scale analyses has the added benefit of connecting the different generations of sul-fide mineral formations to the environmental history of the sample.
Lastly, P4705-A contains two generations of pyrite formationrepresented by small (<25 μm) and large (>25 μm) pyrite populations. Similar to the Sukhaya Tunguska samples, even distribution in mat fragments, retention of mat textures, and excellent microfossil preser-vation(Knolletal.,1991)alongwithpyriteformationtheory(Rickard,2012) imply that small pyrite δ34S values capture the δ34S signature of sulfide adjacent to the redox boundary at the surface of the mat. In contrast, the observation that large pyrite grains occur along the edges of silicified void spaces implies that large pyrite δ34S values re-flect the δ34S value of sulfide in pore fluids during later stages of burial or after entrainment of mat fragments and redeposition. These two populations are easily distinguished in the frequency distribution plot of SIMS δ34S values (Figure 6c), and the bulk δ34SCRS value represents an average of these two populations. While the bulk δ34SCRS value is 48.0‰ lower than the estimated δ34S value of coeval seawater sulfate, this S- isotope difference is 46.4‰ and 66.2‰ for the small and large pyrite populations, respectively. The difference in apparent S- isotope fractionation between the small and the large pyrite grains could indi-cate two different paleoenvironmental trends: (i) If small pyrite grains were precipitated in the upper portions of the mat and large pyrite grains in deeper portions, then that would imply the δ34Ssulfide gradi-ent was similar to what is observed in modern microbial mats (Fike etal.,2008,2009); (ii) if smallpyritegrainswereprecipitated in theupper portions of the mat and large pyrite grains were precipitated after entrainment and redeposition, then the difference in apparent S- isotope fractionation could be due to different average csSRR, dif-ferent amounts of localized system openness, or differences in δ34S values of the sulfate reservoir in lagoonal versus deeper water depo-sitionalsettings.Atthistime,weareunabletodifferentiatebetweenthese options. This 750 Ma sample has a higher Δ34S value near the upper redox boundary than the 1000 Ma samples, inferred from the mean δ34S value of the small (<25 μm) pyrite grains and assuming minimal influence of Rayleigh isotope fractionation on the overlying sulfate reservoir. This could be due to higher ambient sulfate concen-trations, increasing εMSR and/or depressing closed- system behavior
during MSR, enhanced oxidative S cycling, or differences in organic carbon and nutrient availability.
The inferred environmental histories of sulfide formation in these microbialite samples represent our best attempt to synthesize the in-formation provided by petrography, elemental mapping, and fine- scale δ34S analyses. We cannot completely rule out other processes. For example, closed- system Rayleigh isotope effects are likely influencing δ34S values on a local scale, which can explain some of the δ34S vari-ability within both individual crystals and the small and large pyrite pools. However, we do not see evidence for significant pyrite forma-tion in where δ34Ssulfide values are very high due to consumption of the sulfate reservoir in a closed system (i.e., location #2 in Figure 1) because petrographic evidence (Figure 4, 5a–d,m,n) suggests that small pyrite grains are formed near the surface (i.e., location #1 in Figure 1) and large pyrite grains (Figure 5i–p) are formed deeper in the mat where average csSRR are low (i.e., location # 3 in Figure 1). Given that fluid inclusion data indicate marine sulfate levels, which were 50%–90% lower in the Proterozoic thanmodern sulfate con-centrations (Lowenstein, Hardie, Timofeeff, & Demicco, 2003; Spear et al., 2014), and organic carbon availability was high in these mats, we would expect near- complete consumption of the sulfate reservoir deep in the mat. If near- complete consumption of the sulfate reservoir did lead to high δ34Ssulfide values at depth, this signature was not cap-tured in the pyrite grains, perhaps because iron limitation inhibited sig-nificant pyrite formation in this location. Late- stage alteration also has the potential to affect δ34S values. However, three observations imply that the effects of late-stage (i.e., catagenetic) alteration are minimal in our samples: (1) the lack of pyrite in veins or other alteration textures, (2) petrographic evidence that veins cross-cut sulfide grains and mat fragments (Figure 5), and (3) the excellent fabric retention and preser-vation of microfossils indicating early lithification. In sum, the textural and geochemical information provided by these techniques gives us confidence in our reconstructions of the evolution of sulfur cycling in these ancient microbial environments.
4.2 | Implications for the sedimentary sulfide sulfur isotope record
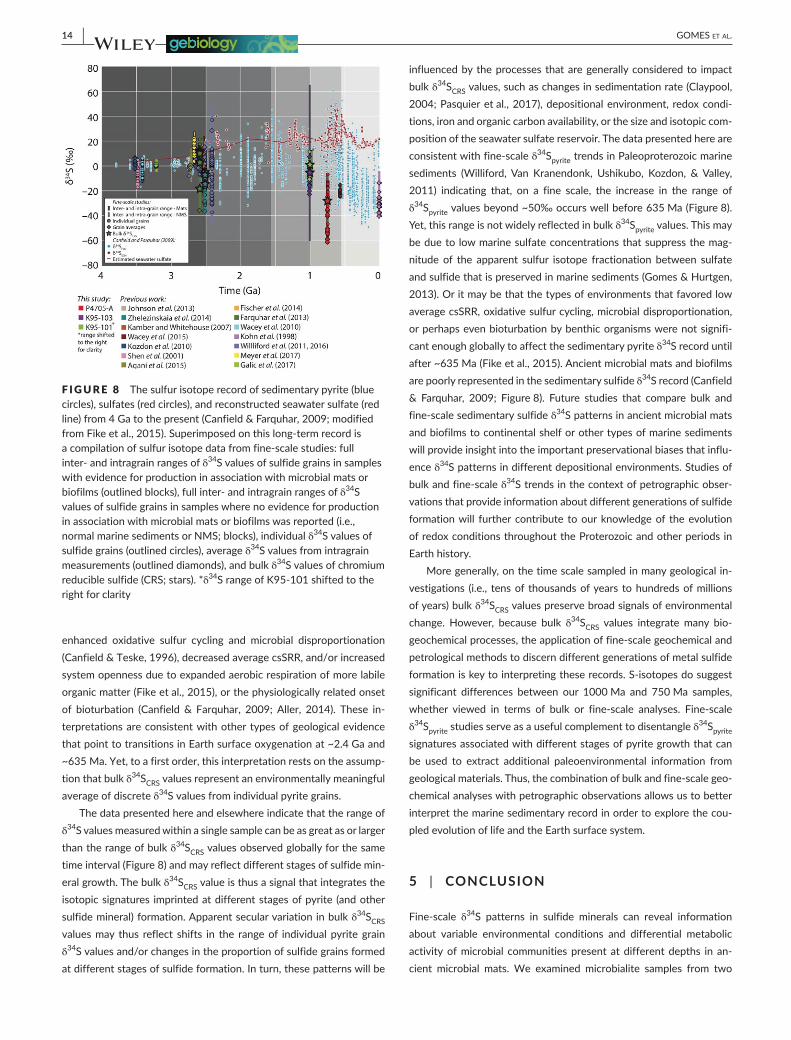
The δ34S record of sedimentary sulfides provides important informa-tion about the oxygenation of the ocean and atmosphere through Earthhistory (e.g.,Canfield&Farquhar,2009;Figure8). Inparticu-lar, the increase in the range of δ34Spyrite values toward the present has been linked to oxygenation of Earth surface environments. There are two intriguing transitions: (i) at ~2.4 Ga the range of δ34S values of sedimentary pyrites increases from <~20‰ to ~50‰ and (ii) at roughly 635 Ma there is another increase in the δ34Spyrite range. The first transition has been linked to the Great Oxidation Event and an associated increase in sulfate concentrations due to oxidative weath-ering of pyrite on land and/or a decrease in the efficiency of the pyrite burial sink due to diminished iron availability of the ocean. The second transition has been linked to the expansion of well- oxygenated envi-ronments through the oceans and associated biogeochemical changes that would increase the range of preserved δ34S values, including
14 | GOMES Et al.
enhanced oxidative sulfur cycling and microbial disproportionation (Canfield&Teske,1996),decreasedaveragecsSRR,and/orincreasedsystem openness due to expanded aerobic respiration of more labile organic matter (Fike et al., 2015), or the physiologically related onset of bioturbation (Canfield & Farquhar, 2009; Aller, 2014). These in-terpretations are consistent with other types of geological evidence that point to transitions in Earth surface oxygenation at ~2.4 Ga and ~635 Ma. Yet, to a first order, this interpretation rests on the assump-tion that bulk δ34SCRS values represent an environmentally meaningful average of discrete δ34S values from individual pyrite grains.
The data presented here and elsewhere indicate that the range of δ34S values measured within a single sample can be as great as or larger than the range of bulk δ34SCRS values observed globally for the same time interval (Figure 8) and may reflect different stages of sulfide min-eral growth. The bulk δ34SCRS value is thus a signal that integrates the isotopic signatures imprinted at different stages of pyrite (and other sulfidemineral)formation.Apparentsecularvariationinbulkδ34SCRS values may thus reflect shifts in the range of individual pyrite grain δ34S values and/or changes in the proportion of sulfide grains formed at different stages of sulfide formation. In turn, these patterns will be
influenced by the processes that are generally considered to impact bulk δ34SCRS values, such as changes in sedimentation rate (Claypool, 2004; Pasquier et al., 2017), depositional environment, redox condi-tions, iron and organic carbon availability, or the size and isotopic com-position of the seawater sulfate reservoir. The data presented here are consistent with fine- scale δ34Spyrite trends in Paleoproterozoic marine sediments (Williford, Van Kranendonk, Ushikubo, Kozdon, & Valley, 2011) indicating that, on a fine scale, the increase in the range of δ34Spyrite values beyond ~50‰ occurs well before 635 Ma (Figure 8). Yet, this range is not widely reflected in bulk δ34Spyrite values. This may be due to low marine sulfate concentrations that suppress the mag-nitude of the apparent sulfur isotope fractionation between sulfate and sulfide that is preserved in marine sediments (Gomes & Hurtgen, 2013). Or it may be that the types of environments that favored low average csSRR, oxidative sulfur cycling, microbial disproportionation, or perhaps even bioturbation by benthic organisms were not signifi-cant enough globally to affect the sedimentary pyrite δ34S record until after~635Ma(Fikeetal.,2015).Ancientmicrobialmatsandbiofilmsare poorly represented in the sedimentary sulfide δ34S record (Canfield & Farquhar, 2009; Figure8). Future studies that compare bulk andfine- scale sedimentary sulfide δ34S patterns in ancient microbial mats and biofilms to continental shelf or other types of marine sediments will provide insight into the important preservational biases that influ-ence δ34S patterns in different depositional environments. Studies of bulk and fine- scale δ34S trends in the context of petrographic obser-vations that provide information about different generations of sulfide formation will further contribute to our knowledge of the evolution of redox conditions throughout the Proterozoic and other periods in Earth history.
More generally, on the time scale sampled in many geological in-vestigations (i.e., tens of thousands of years to hundreds of millions of years) bulk δ34SCRS values preserve broad signals of environmental change. However, because bulk δ34SCRS values integrate many bio-geochemical processes, the application of fine- scale geochemical and petrological methods to discern different generations of metal sulfide formation is key to interpreting these records. S- isotopes do suggest significant differences between our 1000 Ma and 750 Ma samples, whether viewed in terms of bulk or fine- scale analyses. Fine- scale δ34Spyrite studies serve as a useful complement to disentangle δ34Spyrite signatures associated with different stages of pyrite growth that can be used to extract additional paleoenvironmental information from geological materials. Thus, the combination of bulk and fine- scale geo-chemical analyses with petrographic observations allows us to better interpret the marine sedimentary record in order to explore the cou-pled evolution of life and the Earth surface system.
5 | CONCLUSION
Fine- scale δ34S patterns in sulfide minerals can reveal information about variable environmental conditions and differential metabolic activity of microbial communities present at different depths in an-cient microbial mats. We examined microbialite samples from two
F IGURE 8 The sulfur isotope record of sedimentary pyrite (blue circles), sulfates (red circles), and reconstructed seawater sulfate (red line)from4Gatothepresent(Canfield&Farquhar,2009;modifiedfrom Fike et al., 2015). Superimposed on this long- term record is a compilation of sulfur isotope data from fine- scale studies: full inter- and intragrain ranges of δ34S values of sulfide grains in samples with evidence for production in association with microbial mats or biofilms (outlined blocks), full inter- and intragrain ranges of δ34S values of sulfide grains in samples where no evidence for production in association with microbial mats or biofilms was reported (i.e., normal marine sediments or NMS; blocks), individual δ34S values of sulfide grains (outlined circles), average δ34S values from intragrain measurements (outlined diamonds), and bulk δ34S values of chromium reducible sulfide (CRS; stars). *δ34SrangeofK95-101shiftedtotheright for clarity

| 15GOMES Et al.
Proterozoic formations to evaluate whether fine- scale δ34Ssulfide pat-terns in modern microbial mats and consortia are preserved in the geological record. We also explored how closed- system Rayleigh isotope fractionation or post- depositional alteration influence fine- scale δ34Spyrite patterns. We find that small (<25 μm) pyrite grains tend to have higher δ34S values than large (>25 μm) pyrite and (>35 μm) sphalerite grains. Based on these patterns, elemental mapping, pet-rographic information, and comparison with modern microbial mats, we suggest that there are three generations of sulfide formation in the studied samples: (i) small (<25 μm) pyrite grains that formed near the redox interface with high δ34S values due to high average csSRR, (ii) large (>35 μm) sphalerite grains with low δ34S values formed dur-ing repeated wet- dry cycles from sulfide produced by MSR under an unsteady diagenetic regime (i.e., variable rates of csSRR, diffusion, and advection), and (iii) large (>25 μm) pyrite grains formed during later stages of burial with low δ34S values due to formation from a pool of sulfide produced by slower average csSRR. Each sample contains grains from one or two of these stages of sulfide growth. Bulk δ34Spyrite values reflect a weighted average of the different sulfide groups. Fine- scale isotopic studies coupled with elemental mapping and pet-rographic observations can thus reveal important information about microbially mediated reactions occurring at different stages of burial. The extension of this approach to other time periods and sedimentary materials will enhance our ability to extract paleoenvironmental infor-mation from the geological record.
CONFLICT OF INTEREST
The authors declare no conflict of interest.
ACKNOWLEDGMENTS
The authors thank the NASA Astrobiology Institute, WashingtonUniversity, and Massachusetts Institute of Technology (MIT) as well as the NSF Major Research Instrumentation (EAR #1229370) andDOE/BERBioimagingTechnology (DE-SC0014613) awards toDAFfor supporting this work. We are also grateful for the technical sup-port of Nilanjan Chatterjee (MIT) for electron microprobe analyses, Erin Beirne (Harvard University) for isotope ratio mass spectroscopy measurement, Stephanie Moore (Washington University) for carbon concentration analyses, Michael Krawczynski (Washington University) for access to petrographic microscopes, and Harry- Luke McClelland (Washington University) for help constructing figures. We thank David Johnston, Andrew Masterson (Harvard), Jennifer Houghton,and Jocelyn Richardson (Washington University) for comments that improved the manuscript.
REFERENCES
Aller,R.C.(2014).Sedimentarydiagenesis,depositionalenvironments,andbenthic fluxes. In H. D. Holland, & K. K. Turekian (Eds.), Treatise on geo-chemistry, Vol. 8(pp.293–334).Oxford:Elsevier.
Aller,R.C.,Madrid,V.,Chistoserdov,A.,Aller,J.Y.,&Heilbrun,C.(2010).Unsteady diagenetic processes and sulfur biogeochemistry in tropical
deltaic muds: Implications for oceanic isotope cycles and the sedimen-tary record. Geochimica et Cosmochimica Acta, 74,4671–4692.
Anbar,A.D.,&Knoll,A.H.(2002).Proterozoicoceanchemistryandevolu-tion:Abioinorganicbridge?Science, 297, 1137–1142.
Arthur,M.A.(2000).Volcanic contributions to the carbon and sulfur geochem-ical cycles and global change. Encyclopedia of Volcanoes (pp. 1045–1056). Cambridge,MA:Academic.
Bartley,J.K.,Semikhatov,M.A.,Kaufman,A.J.,Knoll,A.H.,Pope,M.C.,& Jacobsen, S. B. (2001). Global events across the Mesoproterozoic–Neoproterozoic boundary: C and Sr isotopic evidence from Siberia. Precambrian Research, 111, 165–202.
Bradley,A. S., Leavitt,W.D., Schmidt,M., Knoll,A.H., Girguis, P. R., &Johnston, D. T. (2015). Patterns of sulfur isotope fractionation during microbial sulfate reduction. Geobiology, 14(1),91–101.
Bruchert,V.,&Pratt,L.M.(1996).Contemporaneousearlydiageneticfor-mation of organic and inorganic sulfur in estuarine sediments from St.Andrew Bay, Florida, USA.Geochimica et Cosmochimica Acta, 60, 2325–2332.
Canfield,D.E. (1991).Sulfate reduction indeep-sea sediment.American Journal of Science, 291, 177–188.
Canfield, D. E. (2004). The evolution of the Earth surface sulfur reservoir. American Journal of Science, 304,839–861.
Canfield,D.E.,&DesMarais,D.J.(1993).Biogeochemicalcyclesofcarbon,sulfur, and free oxygen in a microbial mat. Geochimica et Cosmochimica Acta, 57,3971–3984.
Canfield,D.E.,&Farquhar,J. (2009).Animalevolution,bioturbation,andthe sulfate concentration of the oceans. Proceedings of the National Academy of Science, 106, 8123–8127.
Canfield,D.E.,Farquhar,J.,&Zerkle,A.L. (2010).Highisotopefraction-ations during sulfate reduction in a low- sulfate euxinic ocean analog. Geology, 38(5), 415–418.
Canfield,D. E., Raiswell, R. R.,&Bottrell, S.H. (1992).The reactivity ofsedimentary iron minerals towards sulfide. American Journal of Science, 292,659–683.
Canfield,D.E.,Raiswell,R.R.,Westrich,J.T.,Reaves,C.M.,&Berner,R.A.(1986).Theuseofchromiumreductionintheanalysisofreducedinor-ganic sulfur in sediments and shales. Chemical Geology, 54,149–155.
Canfield, D. E., &Teske,A. (1996). Late Proterozoic rise in atmosphericoxygen concentration inferred from phylogenetic and sulphur- isotope studies. Nature, 382, 127–132.
Chambers, L. A., Trudinger, P. A., Smith, J. W., & Burns, M. S. (1975).Fractionation of sulfur isotopes by continuous cultures of Desulfovibrio desulfuricans. Canadian Journal of Microbiology, 10, 1602–1607.
Chanton,J.P.,Martens,C.S.,&Goldhaber,M.B.(1987).Biogeochemicalcyclinginanorganic-richcoastalmarinebasin.8.Asulfurisotopicbud-get balanced by differential diffusion across the sediment- water inter-face. Geochimica et Cosmochimica Acta, 51, 1201–1208.
Choquette,P.W.,&Pray,L.C.(1970).Geologicnomenclatureandclassifica-tion of porosity in sedimentary carbonates. AAPG Bulletin, 54, 207–250.
Claypool, G. E. (2004). Ventilation of marine sediments indicated by depth profilesofporewater sulfateandb’34S. InR.J.Hill,J. Leventhal,Z.Aizenshtat,M.J.Baedecker,G.Claypool,R.Eganhouse,M.B.Goldhaber,& K. Peters (Eds.), Geochemical investigations in Earth and Space science: A tribute to Isaac R. Kaplan, Vol. 9(pp.59–65).Amsterdam:Elsevier.
Cline,J.D.(1969).Spectrophotometricdeterminationofhydrogensulfidein natural waters. Limnology and Oceanography, 14, 454–458.
Dale,A.W.,Bruchert,V.,Alperin,M.,&Regnier,P. (2009).An integratedsulfur isotope model for Namibian shelf sediments. Geochimica et Cosmochimica Acta, 73,1924–1944.
Davies,G. R. (1970).Carbonate bank sedimentation, eastern SharkBay,WesternAustralia.American Association of Petroleum Geologists Memoir, 75, 85–168.
Druschel,G.K.,Labrenz,M.,Thomsen-Ebert,T.,Fowle,D.A.,&Banfield,J.F.(2002).GeochemicalmodelingofZnSinBiofilms:Anexampleoforedepositional processes. Economic Geology, 97,1319–1329.

16 | GOMES Et al.
Fairchild, I. J., Bonnand, P., Davies, T., Fleming, E. J., Grassineau, N., Halverson, G. P., … Stevenson, C. T. E. (2016). The late Cryogenian warm interval, NE Svalbard: Chemostratigraphy and genesis. Precambrian Research, 281, 128–154.
Fairchild,I.J.,Knoll,A.H.,&Swett,K.(1991).Coastallithofaciesandbio-facies associated with syndepositional dolomitization and silicification (Draken Formation, Upper Riphean, Svalbard). Precambrian Research, 53,165–197.
Farquhar, J., Cliff, J., Zerkle, A. L., Kamyshny, A., Poulton, S.W., Claire,M., … Harms, B. (2013). Pathways for Neoarchean pyrite formation constrained by mass- independent sulfur isotopes. Proceedings of the National Academy of Science, 110, 17638–17643.
Fike,D.A.,Bradley,A.S.,&Rose,C.V.(2015).Rethinkingtheancientsulfurcycle. Annual Review of Earth and Planetary Sciences, 43(1),593–622.
Fike, D.A., Finke, N., Zha, J., Blake, G., Hoehler, T.M., &Orphan,V. J.(2009). The effect of sulfate concentration on (sub)millimeter-scalesulfide δ34S in hypersaline cyanobacterial mats over the diurnal cycle. Geochimica et Cosmochimica Acta, 73, 6187–6204.
Fike,D.A.,Gammon,C.L.,Ziebis,W.,&Orphan,V.J.(2008).Micron-scalemappingofsulfurcyclingacrosstheoxyclineofacyanobacterialmat:ApairednanoSIMSandCARD-FISHapproach.ISME Journal, 2(7),749–759.
Firsching, F. H. (1961). Precipitation of silver phosphate from homoge-neous solution. Analytical Chemistry, 33, 873–874.
Fischer,W.W.,Fike,D.A.,Johnson,J.E.,Raub,T.D.,Guan,Y.,&Kirschvink,J. L. (2014). SQUID–SIMS is a useful approach to uncover primary sig-nalsintheArcheansulfurcycle.Proceedings of the National Academy of Science, 111, 5468–5473.
Frolov,S.V.,Akhmanov,G.G.,Bakay,E.A.,Lubnina,N.V.,Korobova,N.I.,Karnyushina, E. E., & Kozlova, E. V. (2015). Meso- Neoproterozoic petro-leum systems of the Eastern Siberian sedimentary basins. Precambrian Research, 259,95–113.
Fry, B., Gest,H., &Hayes, J.M. (1988). 34S/32S fractionation in sulfurcycles catalyzed by anaerobic bacteria. Applied and Environmental Microbiology, 54(1), 250–256.
Goldhaber,M.B.,&Kaplan,I.R.(1975).Controlsandconsequencesofsulfatereduction rates in recent marine sediments. Soil Science, 119(1), 42–55.
Gomes, M. L., & Hurtgen, M. T. (2013). Sulfur isotope systematics of a eux-inic, low- sulfate lake: Evaluating the importance of the reservoir effect in modern and ancient oceans. Geology, 41(6), 663–666.
Gomes, M. L., & Hurtgen, M. T. (2015). Sulfur isotope fractionation in modern euxinic systems: Implications for paleoenvironmental recon-structions of paired sulfate–sulfide isotope records. Geochimica et Cosmochimica Acta, 157,39–55.
Gorokhov, I. M., Semikhatov, M. A., Baskakov, A. V., Kutyavin, E. P.,Mel’nikov,N.N., Sochava,A.V.,&Turchenko,T. L. (1995). Sr isoto-pic composition in Riphean, Vendian, and Lower Cambrian Carbonates from Siberia. Stratigraphy and Geological Correlation, 3, 1–28.
Grotzinger,J.P.,&Knoll,A.H. (1999).Stromatolites inPrecambriancar-bonates: Evolutionarymileposts or environmental dipsticks?.Annual Review of Earth and Planetary Sciences, 27, 313–358.
Habicht, K. S.,&Canfield,D. E. (1996). Sulphur isotope fractionation inmodern microbial mats and the evolution of the sulphur cycle. Nature, 382, 342–343.
Habicht, K. S., & Canfield, D. E. (2001). Isotope fractionation by sulfate- reducing natural populations and the isotopic composition of sulfide in marine sediments. Geology, 29, 555–558.
Habicht, K. S., Gade, M., Thamdrup, B., Berg, P., & Canfield, D. E. (2002). CalibrationofsulfatelevelsintheArcheanocean.Science, 298(5602), 2372–2374.
Halverson, G. P. (2011). Glacial sediments and associated strata of the Polarisbreen Group, northeastern Svalbard. Memoirs of the Geological Society of London, 36,571–579.
Halverson,G.P.,Hoffman,P.F.,Schrag,D.P.,Maloof,A.C.,&Rice,A.H.N. (2005). Toward a Neoproterozoic composite carbon- isotope record: GSA.Bulletin, 117, 1181–1207.
Halverson, G. P., Wade, B. P., Hurtgen, M. T., & Barovich, K. M. (2010). Neoproterozoic chemostratigraphy. Precambrian Research, 182, 337–350.
Hardie,L.A.,&Ginsburg,R.N. (1977).Layering:Theoriginandenviron-mentalsignificanceoflaminationandthinbedding.InL.A.Hardie(Ed.),Sedimentation on the modem Carbonate Tidal Flats of Northwest Andros Island, Bahamas (pp. 50–123). Baltimore: The Johns Hopkins University Press.
Harrison,A.G.,&Thode,H.G.(1958).Mechanismofthebacterialreduc-tion of sulphate from isotope fractionation studies. Transactions of the Faraday Society, 54(1),84–92.
Hartmann, M., & Nielsen, H. (1968). δ34S- Werte in rezenten Meeressedimenten und ihre Deutung am Beispiel einiger Sedimentprofile aus der westlichen Ostsee. Geologische Rundschau, 58(2), 621–655. (Translated in Environmental and Health Studies, 648, 627–632).
Hayes, J. M., & Waldbauer, J. R. (2006). The carbon cycle and associated redox processes through time. Philosophical Transactions of the Royal Society B, 631,931–950.
Hoehler, T. M., Bebout, B. M., & Des Marais, D. J. (2001). The role of micro-bial mats in the production of reduced gases on the early Earth. Nature, 412, 324–327.
Hoffman,P.F.,Halverson,G.P.,Domack,E.W.,Maloof,A.C.,Swanson-Hysell, N. L., & Cox, G. M. (2012). Cryogenian glaciations on the south-ern tropical paleomargin of Laurentia (NE Svalbard and East Greenland), andaprimaryoriginfortheupperRussøya(Islay)carbonisotopeexcur-sion. Precambrian Research, 206–207, 137–158.
Ivanov,M.V.,Gogotova,G. I.,Matrosov,A.G.,&Zyakun,A.M. (1977).Fractionation of sulfur isotopes by phototrophic sulfur bacteria Ectothiorhodospira shaposhnikovii. Microbiology (English Translation Mikrobiologiya), 45,655–659.
Johnson, J. E., Webb, S. M., Thomas, K., Ono, S., Kirschvink, J. L., & Fischer, W. W. (2013). Manganese- oxidizing photosynthesis before the rise of cyanobacteria. Proceedings of the National Academy of Science, 110, 11238–11243.
Jorgensen,B.B. (1982).Mineralizationoforganicmatter intheseabed—the role of sulphate reduction. Nature, 296, 643–645.
Kah, L. C., Lyons, T. W., & Chesley, J. T. (2001). Geochemistry of a 1.2 Ga carbonate- evaporite succession, northern Baffin and Bylot Islands: Implications for Mesoproterozoic marine evolution. Precambrian Research, 111, 203–234.
Kah, L. C., Lyons, T. W., & Frank, T. D. (2004). Low marine sulphate and protracted oxygenation of the Proterozoic biosphere. Nature, 431, 834–838.
Kamber, B. S., & Whitehouse, M. J. (2007). Micro- scale sulphur isotope evi-denceforsulphurcyclinginthelateArcheanshallowocean.Geobiology, 5, 5–17.
Kaplan,I.R.,&Rafter,T.A.(1958).Fractionationofstableisotopesofsulfurby Thiobacilli. Science, 127, 517–518.
Kaplan, I. R.,&Rittenberg, S. C. (1964).Microbiological fractionation ofsulphur isotopes. Journal of General Microbiology, 34,195–212.
Karlstrom,K.E.,Bowring,S.A.,Dehler,C.M.,Knoll,A.H.,Porter,S.M.,Marais, D. J. D., … Davidek, K. L. (2000). Chuar Group of the Grand Canyon: Record of breakup of Rodinia, associated change in the global carbon cycle, and ecosystem expansion by 740 Ma. Geology, 28, 619–622.
Knoll, A. H., Fairchild, I. J., & Swett, K. (1993). Calcified microbes inNeoproterozoic carbonates: Implications for our understanding of the Proterozoic/Cambrian transition. Palaios, 8, 512–525.
Knoll, A. H., & Swett, K. (1990). Carbonate deposition during the lateProterozoic era: An example from Spitsbergen. American Journal of Science, 290-A, 104–132.
Knoll,A.H.,Swett,K.,&Mark,J.(1991).PaleobiologyofaNeoproterozoictidal flat/Lagoonal complex: The Draken Conglomerate Formation, Spitsbergen. Journal of Paleontology, 65, 531–570.

| 17GOMES Et al.
Kohn,M.J.,Riciputi,L.R.,Stakes,D.,&Orange,D.L.(1998).Sulfurisotopevariability in biogenic pyrite: Reflections of heterogeneous bacterial colonization?American Mineralogist, 83, 1454–1468.
Kozdon,R.,Kita,N.T.,Huberty,J.M.,Fournelle,J.H.,Johnson,C.A.,&Valley, J. W. (2010). In situ sulfur isotope analysis of sulfide minerals by SIMS: Precision and accuracy, with application to thermometry of ∼3.5 Ga Pilbara cherts. Chemical Geology, 275, 243–253.
Labrenz,M.,Druschel,G.K.,Thomsen-Ebert,T.,Gilbert,B.,Welch,S.A.,Kemner,K.M.,…Banfield,J.F. (2000).Formationofsphalerite (ZnS)deposits in natural biofilms of sulfate- reducing bacteria. Science, 290, 1744–1747.
Leavitt,W.D.,Halevy,I.,Bradley,A.S.,&Johnston,D.T.(2013).Influenceof sulfate reduction rates on the Phanerozoic sulfur isotope record. Proc Natl Acad Sci U S A, 110(28),11244–11249.
Lehnert,O., Stouge,S.,&Brandl,P.A. (2013).Conodontbiostratigraphyin the Early to Middle Ordovician strata of the Oslobreen Group in Ny Friesland, Svalbard: German. Journal of Geosciences, 164,149–172.
Logan,B.W.,Hoffman,P.,&Gebelein,C.D. (1974).Algalmats, cryptal-galfabrics,andstructures,HamelinPool,WesternAustralia.American Association of Petroleum Geologists Memoir, 22,140–191.
Lowenstein,T.K.,Hardie,L.A.,Timofeeff,M.N.,&Demicco,R.V.(2003).Secular variation in seawater chemistry and the origin of calcium chlo-ride basinal brines. Geology, 31(10), 857–860.
Lyons,T.W. (1997). Sulfur isotopic trends and pathways of iron sulfideformation in upper Holocene sediments of the anoxic Black Sea. Geochimica et Cosmochimica Acta, 61, 3367–3382.
Mendelson,C.V.,&Schopf,J.W.(1982).ProterozoicmicrofossilsfromtheSukhaya Tunguska, Shorikha, and Yudoma Formations of the Siberian Platform, U.S.S.R. Journal of Paleontology, 56, 42–83.
Meyer, N. R., Zerkle, A. L., & Fike, D. A. (2017). Sulphur cycling in aNeoarchaean microbial mat. Geobiology, 15(3), 353–365.
Morse,J.W.,&Luther,G.W.(1999).Chemicalinfluencesontracemetal-sulfide interactions in anoxic sediments. Geochimica et Cosmochimica Acta, 63, 3373–3378.
Nikishina,A.M.,Sobornov,K.O.,Prokopiev,A.V.,&Frolov,S.V. (2010).Tectonic evolution of the Siberian platform during the Vendian and Phanerozoic. Moscow University Geology Bulletin, 65, 1–16.
Noffke,N.(2009).Thecriteriaforthebiogeneicityofmicrobiallyinducedsedimentarystructures(MISS)inArcheanandyounger,sandydeposits.Earth-Science Reviews, 96, 173–180.
Ovchinnikova, G. V., Semikhatov, M. A., Gorokhov, I. M., Belyatskii, B.V.,Vasilieva, I.M.,& Levskii, L. K. (1995).U–Pb systematics of Pre-Cambrian carbonates: The Riphean Sukhaya Tunguska formation in the Turukhansk Uplift, Siberia. Lithology and Mineral Resources, 30, 525–536.
Pasquier, V., Sansjofre, P., Rabineau, M., Révillon, S., Houghton, J., & Fike, D. (2017). Pyrite sulphur isotopes reveal glacial- interglacial environ-mental changes. Proceedings of the National Academy of Science., 114, 5941–5945.
Petrov,P.Y.(1993).Depositionalenvironmentsofthelowerformationsofthe Riphean Sequence, northern part of the Turukhansk Uplift, Siberia. Stratigraphy and Geological Correlation, 1,181–191.
Petrov,P.Y.,Semikhatov,M.A.,&Sergeev,V.N.(1995).Developmentofthe Riphean carbonate platform and distribution of silicified micro-fossils: The Sukhaya Tunguska Formation, Turukhansk Uplift, Siberia. Stratigraphy and Geological Correlation, 3,79–99.
Pope,M.C.,Bartley,J.K.,Knoll,A.H.,&Petrov,P.Y.(2003).Molartoothstructures in calcareous nodules, early Neoproterozoic Burovaya Formation, Turukhansk region, Siberia. Sedimentary Geology, 158, 235–248.
Porter,S.M.,Meisterfeld,R.,&Knoll,A.H.(2003).Vase-shapedmicrofossilsfromtheNeoproterozoicChuarGroup,GrandCanyon:Aclassificationguided by modern testate amoebae. Journal of Paleontology, 77,409–429.
Poser,A.,Vogt,C.,Knoller,K.,Ahlheim,J.,Weiss,H.,Kleinsteuber, S.,&Richnow, H. H. (2014). Stable sulfur and oxygen isotope fractionation
of anoxic sulfide oxidation by two different enzymatic pathways. Environmental Science and Technology, 48(16),9094–9102.
Raven, M. R., Sessions, A. L., Fischer, W. W., & Adkins, J. F. (2016).Sedimentary pyrite d34S differs from porewater sulfide in Santa Barbara Basin: Proposed role of organic sulfur. Geochimica et Cosmochimica Acta, 186, 120–134.
Rickard,D.T. (1975).Kineticsandmechanismofpyriteformationat lowtemperatures. American Journal of Science, 275, 636–652.
Rickard, D. T. (2012). Sulfidic sediments and sedimentary rocks. Oxford: Elsevier.
Robbins,L.J.,Lalonde,S.V.,Saito,M.A.,Planavsky,N.J.,Mloszewska,A.M.,Pecoits,E.,…Konhauser,K.O.(2013).Authigenicironoxideprox-ies for marine zinc over geological time and implications for eukaryotic metallome evolution. Geobiology, 11,295–306.
Rooney,A.D.,Strauss,J.V.,Brandon,A.D.,&Macdonald,F.A.(2015).ACryogenian chronology: Two long- lasting synchronous Neoproterozoic glaciations. Geology, 43,459–462.
Scott, C., Planavsky, N. J., Dupont, C. L., Kendall, B., Gill, B., Robbins, L. J., … Lyons, T. W. (2013). Bioavailability of zinc in marine systems through time. Nature Geoscience, 6, 125–128.
Semikhatov,M.A.,Ovchinnikova,G.V.,Gorokhov,I.M.,Kuznetsov,A.B.,Vasil’eva, I. M., Gorokhovskii, B. M., & Podkovyrov, V. N. (2000). Isotope Age of theMiddle-Upper Riphean Boundary: Pb-Pb Geochronologyof the Lakhanda Group Carbonates, Eastern Siberia. Doklady Earth Sciences, 372,625–629.
Sergeev, V. N., Knoll, A. H., & Petrov, P. Y. (1997). Paleobiology of theMesoproterozoic–Neoproterozoic transition: The Sukhaya Tunguska Formation, Turukhansk Uplift, Siberia. Precambrian Research, 85, 201–239.
Shen, Y., Buick, R., & Canfield, D. E. (2001). Isotopic evidence for microbial sulphatereductionintheearlyArchaeanera.Nature, 410, 77–81.
Shinn,E.A.(1968).Practicalsignificanceofbirdseyestructuresincarbon-ate rocks. Journal of Sedimentary Petrology, 38, 215–223.
Sim, M. S., Bosak, T., & Ono, S. (2011). Large sulfur isotope fractionation does not require disproportionation. Science, 333, 74–77.
Sim, M. S., Ono, S., Donovan, K., Templer, S. P., & Bosak, T. (2011). Effect of electron donors on the fractionation of sulfur isotopes by a marine Desulfovibrio sp. Geochimica et Cosmochimica Acta, 75,4244–4259.
Spear, N., Holland, H. D., Garcia-Veígas, J., Lowenstein, T. K., Giegengack, R.,&Peters,H.(2014).AnalysesoffluidinclusionsinNeoproterozoicmarine halite provide oldest measurement of seawater chemistry. Geology, 42(2), 103–106.
Strauss, J.V., Rooney,A. D.,Macdonald, F.A., Brandon,A. D., & Knoll,A.H. (2014).740Mavase-shapedmicrofossils fromYukon,Canada:Implications for Neoproterozoic chronology and biostratigraphy. Geology, 42,659–662.
Valley,J.W.,&Kita,N.T.(2009).InsituoxygenisotopegeochemistrybyIon Microprobe. Mineralogical Association of Canada Short Course, 41, 19–63.
Wacey,D.,Kilburn,M.R.,Saunders,M.,Cliff,J.B.,Kong,C.,Liu,A.G.,…Brasier, M. D. (2015). Uncovering framboidal pyrite biogenicity using nano- scale CNorg mapping. Geology, 43(1), 27–30.
Wacey, D., McLoughlin, N., Whitehouse, M. J., & Kilburn, M. R. (2010). Two coexisting sulfur metabolisms in a ca. 3,400 Ma sandstone. Geology, 38, 1115–1118.
Wilbanks,E.G.,Jaekel,U.,Salman,V.,Humphrey,P.T.,Eisen,J.A.,Facciotti,M. T., … Orphan, V. J. (2014). Microscale sulfur cycling in the phototro-phic pink berry consortia of the Sippewissett Salt Marsh. Environmental Microbiology, 16,3398–3415.
Wilkin,R.T.,Arthur,M.A.,&Dean,W.E.(1997).Historyofwater-columnanoxia in the Black Sea indicated pyrite framboid size distributions. Earth and Planetary Science Letters, 148, 517–525.
Wilkin,R.T.,Barnes,H.L.,&Brantley,S.L.(1996).Thesizedistributionofframboidalpyrite inmodernsediments:An indicatorof redoxcondi-tions. Geochimica et Cosmochimica Acta, 60,3897–3912.

18 | GOMES Et al.
Williford, K. H., Ushikubo, T., Lepot, K., Kitajima, K., Hallmann, C., Spicuzza, M. J., … Valley, J. W. (2016). Carbon and sulfur isotopic signatures of ancient life and environment at the microbial scale: Neoarchean shales and carbonates. Geobiology, 14(2), 105–128.
Williford, K. H., Van Kranendonk, M. J., Ushikubo, T., Kozdon, R., & Valley, J. W. (2011). Constraining atmospheric oxygen and seawater sulfate concentrations during Paleoproterozoic glaciation: In situ sulfur three- isotope microanalysis of pyrite from the Turee Creek Group, Western Australia.Geochimica et Cosmochimica Acta, 75(19),5686–5705.
Wing,B.A.,&Halevy,I.(2014).Intracellularmetabolitelevelsshapesulfurisotope fractionation during microbial sulfate respiration. Proceedings of the National Academy of Science U S A, 111, 18116–18125.
Zerkle,A.L.,Farquhar,J.,Johnston,D.T.,Cox,R.P.,&Canfield,D.E.(2009).Fractionation of multiple sulfur isotopes during phototrophic oxidation of sulfide and elemental sulfur by a green sulfur bacterium. Geochimica et Cosmochimica Acta, 73(2),291–306.
Zhelezinskaia,I.,Kaufman,A.J.,Farquhar,J.,&Cliff,J.(2014).Largesulfurisotope fractionations associated with Neoarchean microbial sulfate reduction. Science, 346(6210), 742–744.
SUPPORTING INFORMATION
Additional Supporting Informationmay be found online in the sup-porting information tab for this article.
How to cite this article:GomesML,FikeDA,BergmannKD,JonesC,KnollAH.Environmentalinsightsfromhigh-resolution (SIMS) sulfur isotope analyses of sulfides in Proterozoic microbialites with diverse mat textures. Geobiology. 2017;00:1–18. https://doi.org/10.1111/gbi.12265