Embed Size (px)
Citation preview

1
Environmental incomes and rural livelihoods: a global-comparative assessment
By Arild Angelsen12, Sven Wunder1, Ronnie Babigumira1, Brian Belcher3, Jan Börner1, Carsten Smith-Hall4
Paper presented at the 4th Wye Global Conference, Rio de Janeiro, 9.-11. November 2011
Disclaimer: This paper presents preliminary results from the PEN project, which are not yet published in peer reviewed journals. Data cleaning and analyses are still ongoing.
ABSTRACT Various case studies have suggested that environmental incomes from forests and other vegetation types are important for rural households in developing countries. However, in most large-scale household surveys these income sources are either underreported or ignored, hence there has been a lack of evidence to support the wider applicability of that claim. This paper reports data from the Poverty Environment Network (PEN), which has gathered comparable income data from about 8,000 households in 360 villages and 58 sites, spread over 24 developing countries. The data collection involved a careful, quarterly recording of all forest and environmental uses, as well as other major income sources over one full year.
We find that forest income on average constitutes about one fifth of total household income, while adding other environmental income brings the share to more than one fourth – about the same as incomes from growing crops. Environmental resources and agricultural crops are the two main sources of livelihoods in the survey sites. As expected, forest reliance (share of
1 Center for International Forestry Research (CIFOR), [email protected], [email protected],
[email protected] 2 Norwegian University of Life Sciences (UMB), Norway, [email protected]
3 Royal Roads University, Canada, [email protected]
4 University of Copenhagen, Faculty of Life Sciences, Denmark, [email protected]

2
forest income in total household income) is higher for the poorer income quintiles, but the differences are less pronounced than what was found in most previous studies. We also find that safety net and seasonal gap-filling functions may be less important that often assumed.
Ignoring environmental incomes in income surveys and in rural development planning would in quantitative terms amount to ignoring that farmers grow crops. Agricultural area expansion into forests and other vegetation types may well come to increase household incomes, but corresponding income losses from losing forest cover and forest degradation could be larger than previously assumed. Depriving poor people of access to forest product extraction, for instance through highly exclusionary conservation policies, could jeopardize the livelihoods of people depending on these resources.
Keywords: forests, environmental income, poverty, livelihoods, household surveys
1 Introduction Various case studies have found that environmental – including forest – incomes are critically important to poor, rural households in developing countries. Most large-scale household surveys done by governmental and international agencies underreport or ignore these income sources. Such resources, harvested in non-cultivated habitats ranging from natural forests to rangelands and rivers, often come from many different products extracted in irregular frequencies, yet they can contribute significantly to households’ current consumption and provide safety nets or pathways out of poverty. However, inconsistent and flawed research methods can easily lead to either under- or over-estimations (Angelsen and Wunder, 2003). The general shortage of a representative sample of detailed quantitative studies, coupled with the diversity in the quality and methods used in the few existing ones, leave key unanswered questions: how important are environmental resources for livelihoods in quantitative terms? When they are important, is it because they can help lift people out of poverty, or are they mainly useful as gap-fillers and safety nets preventing extreme hardship? How do different resource management regimes and policies affect the benefits accruing to the poor? What types of interventions and policies have been effective to enhance the contribution of forests in poverty alleviation? Answers to such questions are essential to design effective policies and projects to alleviate rural poverty. Yet, there is surprisingly little systematic knowledge to answer them adequately. This paper reports preliminary results from the Poverty Environment Network (PEN), which has gathered comparable income data from about 8,000 households in 360 villages and 58 sites, spread over 24 developing countries across three continents. The data collection involved a careful, quarterly recording of all environmental (including forests) uses, as well as other major income sources (agriculture, livestock, wages, etc.), over one year. By answering these questions, PEN can provide well-researched advice for enhancing the way natural resource and poverty-related policies and projects are designed and implemented.

3
This paper is divided into two main parts. Section 2 presents the methodological details about the PEN project, including key lessons drawn for how to best uncover the hidden harvest from environmental resources. Section 3 presents some of the main results regarding the size and sectoral composition of household incomes, with focus on the overall picture of the role of forests in rural livelihoods. The final section summarizes the main conclusions and policy implications.
2 Background to the PEN project
2.1 Studies on poverty and the environment The body of literature quantifying environmental resources in rural livelihoods is slowly increasing (e.g. Cavendish, 2000; Fisher, 2004; Mamo et al., 2007; Vedeld et al., 2007; Narain et al., 2008; Babulo et al., 2009; Kamanga et al., 2009), but has yet to be widely acknowledged in rural development circles – as becomes evident from recent reviews of rural income and livelihood studies that exclude environmental income (e.g. Ellis and Freeman, 2005). Published and unpublished quantitative environmental income studies are hard to compare, due to methodological differences. In a summary of 54 studies on household environmental income, Vedeld et al. (2004: xiv) noted that “[t]he studies reviewed displayed a high degree of theoretical and methodological pluralism, and the substantial variability in reporting of specific variables and results is partly explained through such pluralism. This variability must, however, also be attributed to methodological pitfalls and weaknesses observed in many studies.” Methodological challenges include: (i) data generated using long (e.g. one-year) recall periods which is likely to seriously underestimate environmental incomes derived from a myriad of sources (Lund et al., 2008); (ii) inconsistent basic definitions, e.g. what is considered a forest may differ across studies, making findings incomparable; (iii) a host of survey implementation problems, e.g. failure to adequately train enumerators or check data while in the field, resulting in questionable data quality; and (iv) a widespread perception that it is too difficult and costly to obtain high quality environmental income data. The geographical coverage of available detailed case studies is also limited, with most coming from the drylands of southern and eastern Africa. Thus, while our knowledge on environmental income and rural livelihoods is incrementally improving, more in-depth studies across a range of sites and geographical regions are required, preferably using best-practice and unified methodologies that enable comparison and synthesis. Designing and implementing household and village surveys for quantitative assessment of rural livelihoods in developing countries is thus methodologically challenging, with accurate quantification of income from biologically diverse ecosystems such as forests, bushlands, grasslands and rivers, being particularly hard to achieve. However, as the above published studies indicate, this “hidden harvest” (Campbell and Luckert, 2002) is too important to ignore. Fieldwork using state-of-the-art methods, and in particular well-designed household questionnaires, thus becomes an imperative to adequately capture environmental income

4
dimensions of rural welfare. In fact, current poverty alleviation strategies in most developing countries draw to a significant extent on results from household surveys; environmental income estimates are, however, not included in the standardised living standards measurement surveys (Oksanen and Mersmann, 2003). Studies based on such data are thus inaccurate for understanding the holistic character of rural income generation in developing countries.
2.2 The PEN project The Poverty Environment Network (PEN) was set up to both develop and test state-of-the-art methods for data collection and to fill the gap in knowledge, identified above, through the systematic collection of socio-economic data in a variety of tropical ecosystems, using similar data definitions and methodologies (http://www.cifor.org/pen). This is intended to make PEN the world's first global comparative and quantitative review of the role of tropical forests in poverty alleviation. PEN was established in 2004 as a project of the Center for International Forestry Research (CIFOR). The first phase of PEN (2004-05) focused on identifying and designing the research approach and the data collection instruments and guidelines, and building up network of collaborating researchers, the “PEN partners”. Fieldwork and data collection by PEN partners started in 2005. Data collection was completed in 2008, followed by a third phase of data cleaning, establishing the global data set, data analysis and reporting. The project will be completed in 2012, and the PEN dataset will be made publicly available on the CIFOR website. The core of PEN is the tropics-wide collection of uniform socio-economic and environmental data at the household and village levels, undertaken by 33 PEN partners and supported by some 20 PEN resource persons (CIFOR researchers and external university partners acting as supervisors with active field presence). PEN in many ways represents a new and collaborative way of doing research. The individual field studies were in most cases done by PhD students, with the majority coming from the country of fieldwork. We have long observed that the best field studies are often done as part of a PhD thesis. At the same time the value-added of the individual studies can be substantially enhanced by using standardized definitions and methods, which permit comparative analysis.
2.3 The PEN research approach During early discussions and workshops, a consensus quickly emerged that, to generate high quality estimates of environmental resource uses, a detailed recording (income accounting) method was needed, using relatively short recall periods - one year being too long for the desired accuracy. This was particularly inspired by work done in Zimbabwe by Cavendish (2000) and Campbell et al. (2002). It was also decided that PEN data collection should consist of three types of quantitative surveys (in addition to an attrition and temporary absence survey) covering a full year:
Two village surveys (V1, V2)
Two annual household surveys (A1, A2)
Four quarterly household surveys (Q1, Q2, Q3, Q4)

5
The timing of the surveys is shown in Figure 1. Data collection requires a fieldwork period of no less than 10 months. The village surveys (V1-V2) collect data that are common to all, or show little variation among, households; V1 is done at the beginning of the fieldwork to get background information on the villages, while V2 is done at the end of the fieldwork period to get information for the 12 months of accumulated recall period covered by the surveys. The household surveys were grouped into two categories: (i) annual household surveys, with A1 at the beginning of field work providing household information serving as a baseline (demographics, assets, forest-related information), while A2 at the end collected information for the 12 month period covered by the surveys (e.g., on risk); (ii) the four quarterly household surveys that focused on collecting detailed income information. All research tools (the prototype questionnaires and the associated technical guidelines; the template for data entry; the code book; and the data cleaning procedures) can be downloaded from the PEN web site (http://www.cifor.cgiar.org/pen/). Prototype questionnaires are available in English, French, Spanish, Portuguese, Chinese, Nepalese and Khmer. All prototype questionnaires should be pre-tested and adapted to local conditions at each research site. Each PEN partner submits their final data set, along with a narrative adhering to a standard template and providing detailed contextual site information, to the global database. t-3 t-1 t t+3 t+6 t+9
Preparatory A1, V1 A2, V2
work Q1 Q2 Q3 Q4
Minimum fieldwork period
12 month survey period (accumulated recall)
Figure 1: The timing of village and households surveys in a PEN study.
A key feature of the PEN research project is the collection of high quality data through the quarterly household surveys. These included detailed data collection on all types of income, not just environmental sources. In addition to the higher accuracy and reliability of quarterly income surveys, various income-generating activities often have considerable seasonal variations, and documenting these can help us understanding fluctuations and seasonal gap fillers. The recall period in the quarterly income surveys was generally one month, which would then be extrapolated to the three-month period. The exception was agricultural income and “other income” (remittances, pension, etc.) where we used three months recall, as these are major income sources (easier to remember) that come in bigger irregularly distributed portions (thus the full 12 month period needs to be covered). The PEN technical guidelines also emphasise that all major products with irregular harvesting, e.g. short-lived mushrooms harvested for sale on a large scale, or the occasional sale of a timber tree from private land, should be identified early on, e.g. during preparatory fieldwork and pre-testing of questionnaires. The differential choice
6
of recall periods across sectoral income sources in the PEN survey thus reflected the necessary trade-off between maximum time coverage and adequate recall periods within finite survey budgets.
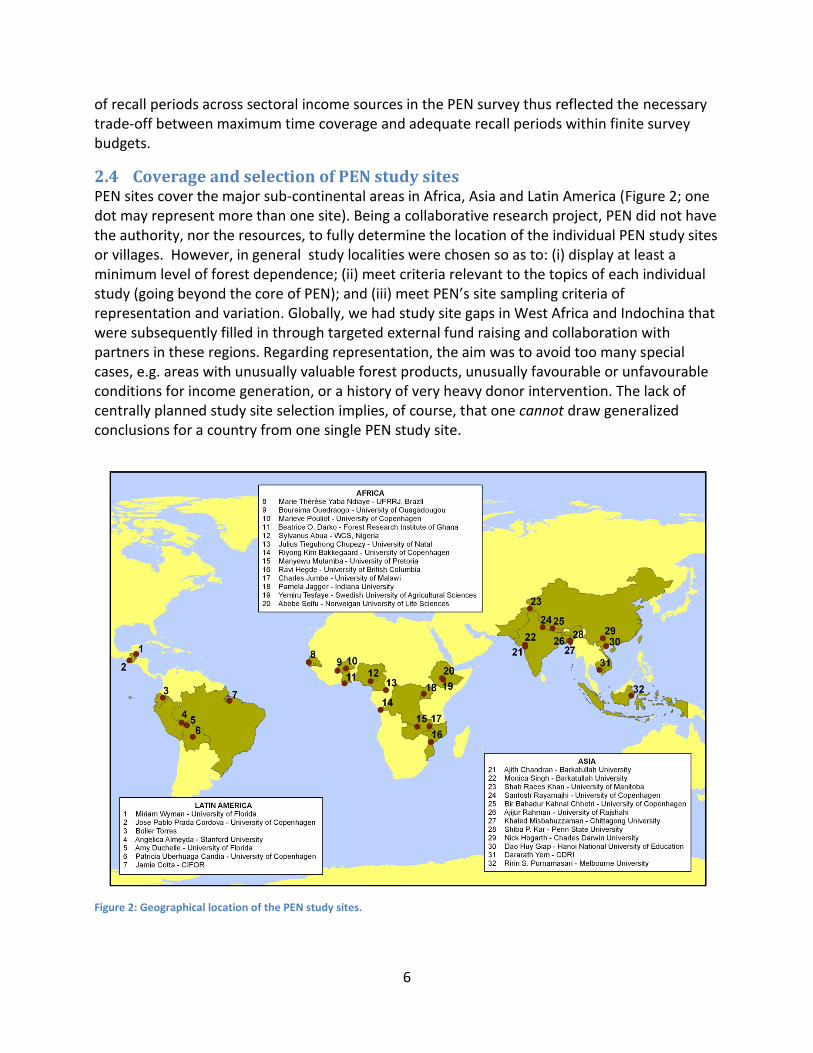
2.4 Coverage and selection of PEN study sites PEN sites cover the major sub-continental areas in Africa, Asia and Latin America (Figure 2; one dot may represent more than one site). Being a collaborative research project, PEN did not have the authority, nor the resources, to fully determine the location of the individual PEN study sites or villages. However, in general study localities were chosen so as to: (i) display at least a minimum level of forest dependence; (ii) meet criteria relevant to the topics of each individual study (going beyond the core of PEN); and (iii) meet PEN’s site sampling criteria of representation and variation. Globally, we had study site gaps in West Africa and Indochina that were subsequently filled in through targeted external fund raising and collaboration with partners in these regions. Regarding representation, the aim was to avoid too many special cases, e.g. areas with unusually valuable forest products, unusually favourable or unfavourable conditions for income generation, or a history of very heavy donor intervention. The lack of centrally planned study site selection implies, of course, that one cannot draw generalized conclusions for a country from one single PEN study site.
Figure 2: Geographical location of the PEN study sites.

7
To achieve a highly representative sample, the internal sampling procedure within study areas can be just as important as the choice of which countries to be present in. We deliberately recruited partners with an aim to get a range of case studies (sites) along key gradients, such as market distance, vegetation types, land tenure and institutions, population density and growth, predominance of ethnic groups and commercial stakeholders, sources of risk, and levels of poverty to make site results representative of a larger universe – e.g. a district or province of the country being studied (Cavendish, 2003). Not all these gradient variations are found within any single study area, and often gradients correlate, making choices easier: market-remote areas tend to be poorer yet richer in natural vegetation, less densely populated yet with a higher share of indigenous people. PEN partners were advised by their PEN supervisors during start-up workshops on how to choose study areas, and surveyed villages within those areas. Most PEN partners were supported in their methodological choices by on-site visits from their PEN supervisors. To be included in the global PEN data set, a minimum sample of 100 households was required. Most studies had higher samples, with an average of about 240-250 households. While PEN sites and villages were thus selected according to explicit stratification criteria, the within-village selection of households followed random sampling, using household lists and pre-existing censuses as a base.
2.5 The global data set For each survey module, we developed a Microsoft Access database for data entry. The database was complimented with a user guide for first time or novice users. Using a common database for data entry allowed us to capture data in a centralized and standardized way, e.g. variable names and types would be the same across all sites. The user interface was very similar to the questionnaire, which eased data entry and reduced the risk of data entry errors. In addition, we took advantage of MS Access data quality controls (e.g. validation rules to restrict entries in a given field to a range or type –text vs. numeric) to further limit data entry problems. PEN partners submitted their individual data set to CIFOR, where the data underwent a centralized process of data cleaning and quality control. This process aimed to identify missing data, inconsistencies, and also flagged outliers in a Stata command specifically developed for the project (‘obsofint’ – short for ‘observations of interest’). This process is further described in Babigumira (2011). The result of the process is a “bug report”, which is returned to the partner for checking and corrections in the data set. Through an interactive process between CIFOR and the partner, the dataset is eventually approved and included in the global data set. The individual data sets needed a set of further modifications to be included in the global analysis. One particular problem was households that were missing from some of the quarterly income surveys. In the end, it was decided not to include households that missed two or more or those surveys. For households participating in three out of the four quarterly surveys, a formula was used to estimate sectoral income in that quarter, based on the households’ income in the other quarters and the seasonal variation found among other households in that

8
particular site. In other cases prices were missing for individual households and products, and average village prices (or site prices, in case of few observations) were used. Following a long discussion within the PEN team, it was decided to use a simple system (frequently used by the World Bank) to calculate adult equivalents (AE): each household member below the age of 15 and above the age of 65 is given the weight of 0.5 while other household members get the weight of one. Hence all household incomes are reported as income per AE. Finally, in order to compare incomes across countries we followed commonly used international practice of using Purchasing Power Parity (PPP) exchange rates rather than the nominal exchange rate at the time of the survey.
2.6 Methodological lessons The basic PEN idea, to develop a common set of methods, and implement a collaborative network of primarily PhD students to generate a critical pool of data, has scope for being replicated in relation to other research topics. Some lessons learned from PEN may therefore have wider interest for those who want to do global-comparative research on rural livelihoods. It is critical to allow for sufficient time to jointly develop common prototype instruments and technical guidelines; developing and agreeing on these among many partners may take a year or more. This key initial activity should be well advanced before recruitment of partners, who otherwise may drop out because their time schedule does not allow them to wait for the research instruments to be developed. The guidelines and training workshops emphasised the importance of data quality and the proposed approaches to facilitate the generation of high quality data, including: thorough enumerator training and daily data quality control in the field; allowing ample time for data checking, cleaning, and harmonization of comparative standards, and using standardised central data quality control procedures. Designing the principal research instrument – the prototype questionnaires – involved a number of trade-offs (Angelsen and Lund, 2011). Collecting income data through four quarterly surveys is a major strength of PEN, with shorter recall periods and opportunity to study seasonality, but is costly. Using different recalls for different sectors can potentially yield biases in the results, but we have not been able to test for this in PEN. Some parts of the questionnaire, in particular the livestock section, were hard to implement, and should have been simplified. PEN deliberately chose to not collect labour and consumption data, which are both time consuming and may involve high degrees of uncertainty if not sufficient time and resources are set aside for the task. The emphasis in PEN was on collecting reliable and comprehensive income data (subsistence and cash), decomposed in ways that were easily grasped by the respondents. PEN also followed up with a questionnaire-based survey among PEN partners to evaluate the prototype questionnaires and lessons learned from the field. Four areas stand out in the responses: (i) Sustained field presence is essential to build trust, collect contextual information, and supervise the data collection. (ii) Well-trained and motivated enumerators and other field assistants are critical for successful fieldwork. (iii) Questionnaires verified and entered early

9
after the interviews, though time-consuming, tend to be of superior quality. (iv) Flexibility, patience, and determination are needed to successfully meet the logistical challenges.
3 Preliminary findings
3.1 Representativeness of data The PEN study sites were not systematically selected to give a representative sample for developing countries, thus a legitimate question is the representativeness of the 58 sites. We present two secondary data sets which can shed light on this question. Figure 3 place the PEN sites along two dimensions: the forest cover (share of land are under forest cover) and the population density at the sub-national administrative unit (province, region, etc. – depending on country) where the site is located. As expected, we observe a negative correlation between forest cover and population density. The PEN sites are located along the full range of forest cover, although there is a bias – also not unexpected – towards the high forest cover areas.
Figure 3: PEN sites located by forest cover and population density. Source: Dewi and Belcher, unpublished
Secondly, we looked at the poverty profile of the sites. As noted earlier, most poverty surveys only partially capture the environmental income of rural households. One implication is that rural income, and poverty rates using absolute poverty lines, are underestimated. If the PEN sample is representative of rural areas in developing countries, we would therefore expect that: (i) the poverty rates estimated in PEN are lower than those estimated by official poverty

10
statistics, and (ii) the poverty rates in PEN when environmental income is excluded, are higher than the official ones. This is the story emerging from Figure 4. The official World Bank (WB) derived rates for extreme poverty (< US$ 1.25 per day) are found to be between the PEN rates with and without environmental income. For moderate poverty the rates are higher in the WB estimates, which might be explained by PEN being able to better capture subsistence income in agriculture and other sectors. While these aggregate figures suggest that some key characteristics of the PEN sites are fairly representative of rural areas in developing countries, a better interpretation of representativeness is that PEN sites do present a picture of forest reliance among developing country smallholders and communities in rural areas adjacent to natural forests. As seen below, forest income varies greatly across the sites, and for Latin America there appears to be an over-representation of sites with high forest reliance.
Figure 4: Poverty rates (%) in PEN with and without environmental income, and rural poverty rates across the three developing continents. (NEI = No Environmental Income). Source: PEN and IFAD (2010), based on World Bank (WB) poverty estimates.
3.2 Overall role of forest and environmental income On average, forest income constitutes about one fifth of total household income, while environmental income (forest and non-forest) makes up more than one fourth. These results are displayed in Figure 5. This means that, in areas where communities have access to some forest resources (completely deforested areas were not included in our sample), resources extracted from the wild contributed about the same amount of income as agricultural crops. Thus, environmental income plays a significant role in rural livelihoods, too important to be ignored if we want to understand rural livelihoods and poverty.
5 9 16 21 31 36
55 62 66
7 11
14 23
30 22
16
25 13
88 80
70 56
39 42 29
13 21
0
10
20
30
40
50
60
70
80
90
100
Non-poor(>$2)
Poor ($1.25-2)
Extremelypoor (<$1.25)

11
Figure 5: Cash and subsistence income in the PEN sites.
The high share of subsistence income is also noteworthy. More than 60% of the forest and other environmental income is consumed directly (subsistence use), with fuelwood being the single most important forest product. Overall, more than 40% of the household income is food and other household necessities that are produced or collected for immediate use within the family, without being traded in any market.
Figure 6: Sectoral income shares in the PEN sites.

12
While average figures are useful, there is large variation in income composition across the PEN sites, as shown in Figure 6. Most notably, forest reliance – defined as the share of household income that come from forests – varies from well below 10 to more than 60 %, the latter being a Brazilian site dominated by collection of Brazil nuts.
3.3 Poverty and forest reliance Most previous studies on the forest-poverty link have found a strong negative correlation between forest reliance and household income (e.g. Vedeld et al., 2004). Hence the poorest would appear to be much more dependent than the non-poor in relative terms, while in absolute term the better-off households tend to use the forest more. A surprising finding in the PEN data is that this relationship is found to be less pronounced. Forest income is not just for the poorest, but important for everyone at our study sites, which were dominated by peasants and smallholders with differing degree of assets and wealth. Figures 7 and 8 demonstrate that forest income share (forest reliance) varies little across the income quintiles. There is a tendency of poor households relying more on forests, but this is less pronounced than earlier studies have suggested.
Figure 7: Cash and subsistence forest income across income quintiles.
13
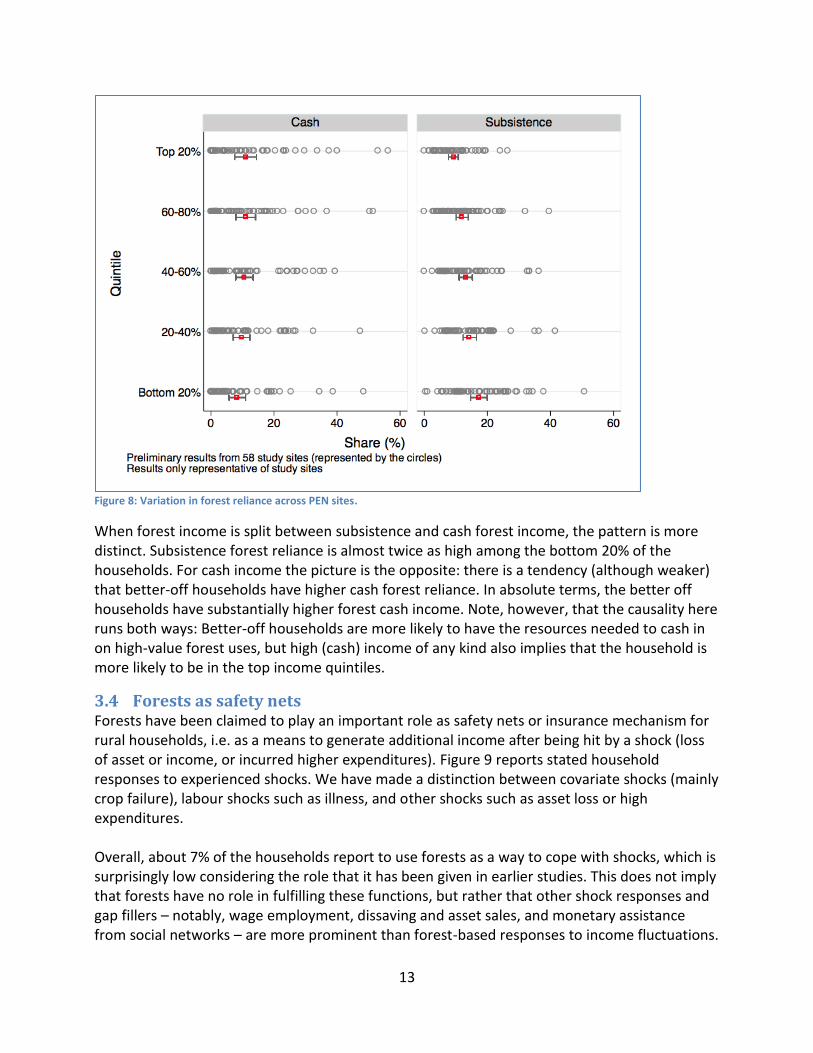
Figure 8: Variation in forest reliance across PEN sites.
When forest income is split between subsistence and cash forest income, the pattern is more distinct. Subsistence forest reliance is almost twice as high among the bottom 20% of the households. For cash income the picture is the opposite: there is a tendency (although weaker) that better-off households have higher cash forest reliance. In absolute terms, the better off households have substantially higher forest cash income. Note, however, that the causality here runs both ways: Better-off households are more likely to have the resources needed to cash in on high-value forest uses, but high (cash) income of any kind also implies that the household is more likely to be in the top income quintiles.
3.4 Forests as safety nets Forests have been claimed to play an important role as safety nets or insurance mechanism for rural households, i.e. as a means to generate additional income after being hit by a shock (loss of asset or income, or incurred higher expenditures). Figure 9 reports stated household responses to experienced shocks. We have made a distinction between covariate shocks (mainly crop failure), labour shocks such as illness, and other shocks such as asset loss or high expenditures. Overall, about 7% of the households report to use forests as a way to cope with shocks, which is surprisingly low considering the role that it has been given in earlier studies. This does not imply that forests have no role in fulfilling these functions, but rather that other shock responses and gap fillers – notably, wage employment, dissaving and asset sales, and monetary assistance from social networks – are more prominent than forest-based responses to income fluctuations.

14
Households actually going to the forest for coping tend to be younger, male-headed, lower-educated, poorer (income, assets), live closer to forests and have higher forest income.
Figure 9: Responses to shocks experienced by the household.
3.5 Gender differences The current literature on gender differences in forest use commonly assume that: (i) forest products are more important to women than to men, and (ii) women are relatively more involved in subsistence uses while men focus on cash-earning forest activities. Our data on labour inputs into forest income generation shows that all members of a household – men, women, and children – participate in the collection and processing of forest products. And, contrary to what has been claimed, men bring as much or more forest products to the households as women. We find a gender differentiation between involvement in subsistence and cash activities, and between unprocessed and processed forest products, as displayed in Figure 10. Women are more involved in unprocessed and subsistence activities, but the pattern for cash vs. subsistence uses is not as pronounced as one might have expected.

15
Figure 10: Gender differentiated involvement in forest activities.
4 Conclusions While most of the analyses of the global data set remain to be consolidated, some preliminary conclusions are: First, forests play a vital role in rural livelihoods, with about one fifth of the household income in our sample coming from this source. Failing to account for this contribution gives a misleading picture of rural livelihoods, and an inadequate basis for policy design. For rural areas with similar characteristics as those included in the PEN survey, ignoring environmental incomes in income surveys and in rural development planning would in quantitative terms amount to ignoring that farmers grow crops. Second, forest income is important for every income group in the communities, not just the poorest. Subsistence reliance is relatively higher for the poor. This finding challenges popular “Garden of Eden” perceptions, i.e. that there are low-hanging, valuable fruits in the forests that the poor can pick, or that households can easily draw upon in periods of crisis. To the poor there are no easy incomes – if there were, they might not have been poor in the first place. Third, the data have displayed a large variety of situations. Preliminary analysis – awaiting further in-depth investigations – suggests a major distinction between poverty-driven forest reliance (lack of assets and opportunities) and opportunity-driven forest reliance, where valuable cash products and market access drive high forest reliance, and those that benefit are the relatively better-off households among smallholders and communities. Fourth, the results can have important implications for policy priorities and design. Agricultural area expansion into forests and other vegetation types may well come to increase household incomes, but corresponding income losses from losing forest cover could be larger than

16
previously assumed. Depriving poor people of access to forest extraction, for instance through highly exclusionary conservation policies, could jeopardize the livelihoods of people depending on these resources. Environmental incomes may also have a larger than previously expected potential in household adaptation to climate change and its detrimental impacts on rural livelihoods.
References Angelsen, A. and Wunder, S. 2003. Exploring the forest-poverty link: key concepts, issues and
research implications. CIFOR Occasional Paper no. 40. Angelsen, A. and J.F, Lund. 2011. Designing the household questionnaire. In: A. Angelsen, H.O.
Larsen, J.F. Lund, C. Smith-Hall, and S. Wunder, (Eds.) 2011. Measuring Livelihoods and Environmental Dependence: Methods for Research and Fieldwork. London: Earthscan.
Babigumira, R. 2011. Data entry and quality checking. In: A. Angelsen, H.O. Larsen, J. F. Lund, C. Smith-Hall, and S. Wunder, eds. 2011. Measuring Livelihoods and Environmental Dependence: Methods for Research and Fieldwork. London: Earthscan.
Babulo, B., Muys, B., Nega, F., Tollens, E., Nyssen, J., Deckers, J. and Mathijs, E. 2009. The economic contribution of forest resource use to rural livelihoods in Tigray, Northern Ethiopia. Forest Policy and Economics 11, 109–117.
Cavendish, W. 2000. Empirical Regularities in the Poverty-Environment Relationship of Rural Households: Evidence from Zimbabwe. World Development 28 (11):1979-2000.
Cavendish, W. 2003. How Do Forests Support, Insure And Improve The Livelihoods Of The Rural Poor? A Research Note. Unpublished paper, CIFOR. Available at the PEN Web-page.
Campbell, B.M., S. Jeffrey, W. Kozanayi, M. Luckert, M. Mutamba, and C. Zindi. 2002. Household Livelihoods in Semi-Arid Regions: Options and Constraints. Bogor, Indonesia: Center for International Forestry Research (CIFOR).
Campbell, B.M. and M.K. Luckert (Eds.) 2002. Uncovering the hidden harvest. Valuation methods for woodland and forest resources, People and Plants. London: Earthscan.
Ellis, F. and Freeman, H.A. 2005. Comparative evidence from four African countries. In: Ellis, F. and Freeman, H.A. (Eds.) Rural livelihoods and poverty reduction policies. Routledge, London, 31-47.
Fisher, M. 2004. Household welfare and forest dependence in Southern Malawi. Environment and Development Economics 9, 135–154.
IFAD. 2010. Rural poverty report 2011. Rome, Italy: International Fund for Agricultural Development (IFAD).
Kamanga, P., Vedeld, P. and Sjaastad, E. 2009. Forest incomes and rural livelihoods in Chiradzulu District, Malawi. Ecological Economics 68, 613-624.
Lund, J.F., Larsen, H.O., Chhetri, B.B.K., Rayamajhi, S., Nielsen, Ø.J., Olsen, C.S., Uberhuaga, P., Puri, L. and Prado, J.P.P. 2008. When theory meets reality – how to do forest income surveys in practice. Forest & Landscape Working Paper No. 29-2008, Centre for Forest, Landscape and Planning, University of Copenhagen, Copenhagen.
Mamo, G., Sjaastad, E. and Vedeld, P. 2007. Economic dependence on forest resources: a case from Dendi District, Ethiopia. Forest Policy and Economics 9, 916–927.

17
Narain, U., Gupta, S. and Veld, K. van’t 2008. Poverty and resource dependence in rural India. Ecological Economics 66, 161-176.
Oksanen, T. and Mersmann, C. 2003. Forests in poverty reduction strategies – an assessment of PRSP processes in sub-Saharan Africa. In: Oksanen, T., Pajari, B. and Tuomasjukka, T. (Eds.) Forests in poverty reduction strategies: capturing the potential, EFI Proceedings No. 47, 121-155.
Vedeld, P., Angelsen, A., Bojö, J., Sjaastad, E. and Berg, G.K. 2007. Forest environmental incomes and the rural poor. Forest Policy and Economics 9, 869-879.
Vedeld, P., Angelsen, A., Sjaastad, E. and Berg, G.K. 2004. Counting on the environment: forest income and the rural poor. Environmental Economics Series 98. Washington D.C.: The World Bank.