Embed Size (px)
Citation preview
November 2010
Environmental Facts
Facts and Figures to Inspire Action toward Zero Waste

1
En
vir
on
me
nta
l F
acts
| 1
/1
/2
01
0
Environmental Facts
Facts and Figures to Inspire Action toward Zero Waste
CATEGORIES
Consumption Wasting Recycling Saves
Landfills & Incinerators Toxins General Environment
Climate Change Colorado
CONSUMPTION
In the past 50 years, humans have consumed more resources than in all previous history. U.S. EPA,
2009. Sustainable Materials Management: The Road Ahead.
U.S. consumption grew sixfold between 1960 and 2008 but the U.S. population only grew by a
factor of 2.2. This means consumption alone nearly tripled between 1960 and 2008. Worldwatch
Institute, 2010. State of the World 2010.
With only 5.1% of the world’s population, North America consumes just over 24% of global
energy. United Nations Environment Programme, 2007. Global Environment Outlook 4: Summary for Decision Makers.
The way we produce, consume and dispose of our products and our food accounts for 42% of
U.S. greenhouse gas emissions. U.S. EPA, 2009. Opportunities to Reduce Greenhouse Gas Emissions through Materials and
Land Management Practices.
Total material consumption in the U.S. grew 57% from 1975 to 2000, more than twice the
rate of population growth. World Resources Institute, 2005. Material Flows in the United States: A Physical Accounting of the
2
En
vir
on
me
nta
l F
acts
| 1
/1
/2
01
0
U.S. Industrial Economy.
Four primary materials industries—paper, metals, plastics, and glass—consume 30.2% of the
energy used for all U.S. manufacturing. U.S. DOE Energy Information Administration, 2002. Manufacturing Energy
Consumption Survey.
The use of single-use plastic packaging, which is largely not recyclable, has grown from
120,000 tons in 1960 to 12.7 million tons in 2006. U.S. EPA, 2006. 2006 MSW Characterization Data Tables.
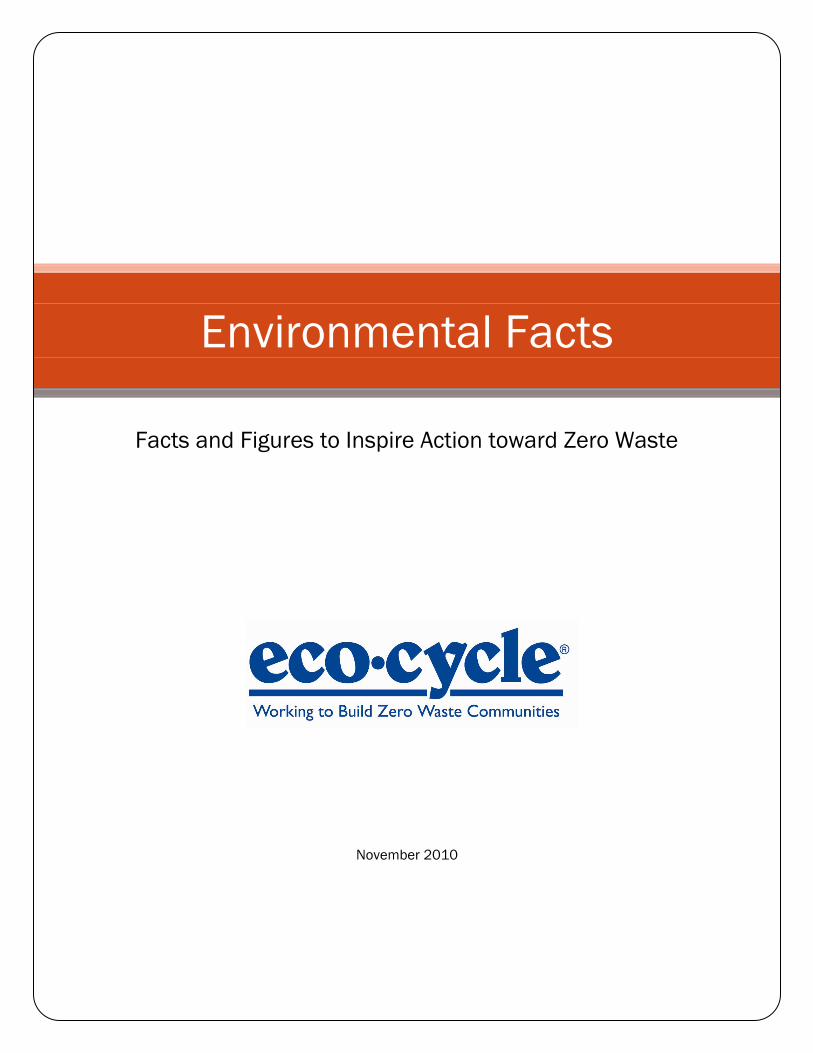
Twelve to 24 trees must be cut
down to make 1 ton of paper.
Conservatree, 2008.
Materials consumption in the United
States is on average more than 50%
higher than consumption in the
European Union. World Resources Institute,
2005. Material Flows in the United States: A
Physical Accounting of the U.S. Industrial Economy.
Industrial countries—home to less than 20% of global population—cut 74% of the wood used
for industrial purposes (lumber, paper, etc.). The United States is the largest consumer.
Worldwatch Institute, 2006. Vital Signs 2006-2007.
Americans used 44% of the motor gasoline burned up worldwide in 2002. Worldwatch Institute, 2006.
Vital Signs 2006-2007.
In 2005, total ad spending worldwide reached $88 per person. But in the United States it was
more than 10 times this figure at $933 per person. Worldwatch Institute, 2006. Vital Signs 2006-2007.

3
En
vir
on
me
nta
l F
acts
| 1
/1
/2
01
0
Between 1950 and 2005, worldwide metals production grew sixfold, oil consumption
eightfold, and natural gas consumption 14-fold. In total, 60 billion tons of resources are now
extracted annually—about 50% more than just 30 years ago. Today the average European uses
43 kilograms of resources daily, and the average American uses 88 kilograms. Worldwatch Institute,
2010. State of the World 2010.
In 2008 alone, people around the
world purchased 68 million vehicles,
85 million refrigerators, 297 million
computers, and 1.2 billion cell phones.
Worldwatch Institute, 2010. State of the World 2010.
Annual U.S. per capita consumption of
metals (837 pounds per person) is
nearly double the worldwide average and 9 times greater than that of China. Worldwatch Institute,
2009. World Metal Production Surges.
Every year in the U.S. nearly 200 billion beverage containers are sold, two-thirds of which are
landfilled, incinerated or littered. As You Sow and Container Recycling Institute, 2006. U.S. Beverage Container Recycling
Scorecard and Report.
American consumers purchase over 500 million beverage bottles and cans, on average, every
day. In the 30 years from 1973 to 2003, beverage container sales increased more than fivefold.
Waste and Opportunity: As You Sow and Container Recycling Institute, 2006. U.S. Beverage Container Recycling Scorecard and Report.
Americans purchased 215 billion beverage cans and bottles in 2005, about 724 per person.
Container Recycling Institute, 2007. Water, Water Everywhere: The growth of non-carbonated beverage containers in the United States.
Americans consumed 27.9 billion plastic water bottles (1 liter or less) in 2005. Container Recycling
Institute, 2007. Water, Water Everywhere: The growth of non-carbonated beverage containers in the United States.
4
En
vir
on
me
nta
l F
acts
| 1
/1
/2
01
0
The U.S. population has the largest ―ecological footprint‖ in the world, with a greater impact
on many of the planet’s resources and ecosystems than any other nation on Earth. Center for
Environment and Population, 2006. U.S. National Report on Population and the Environment.
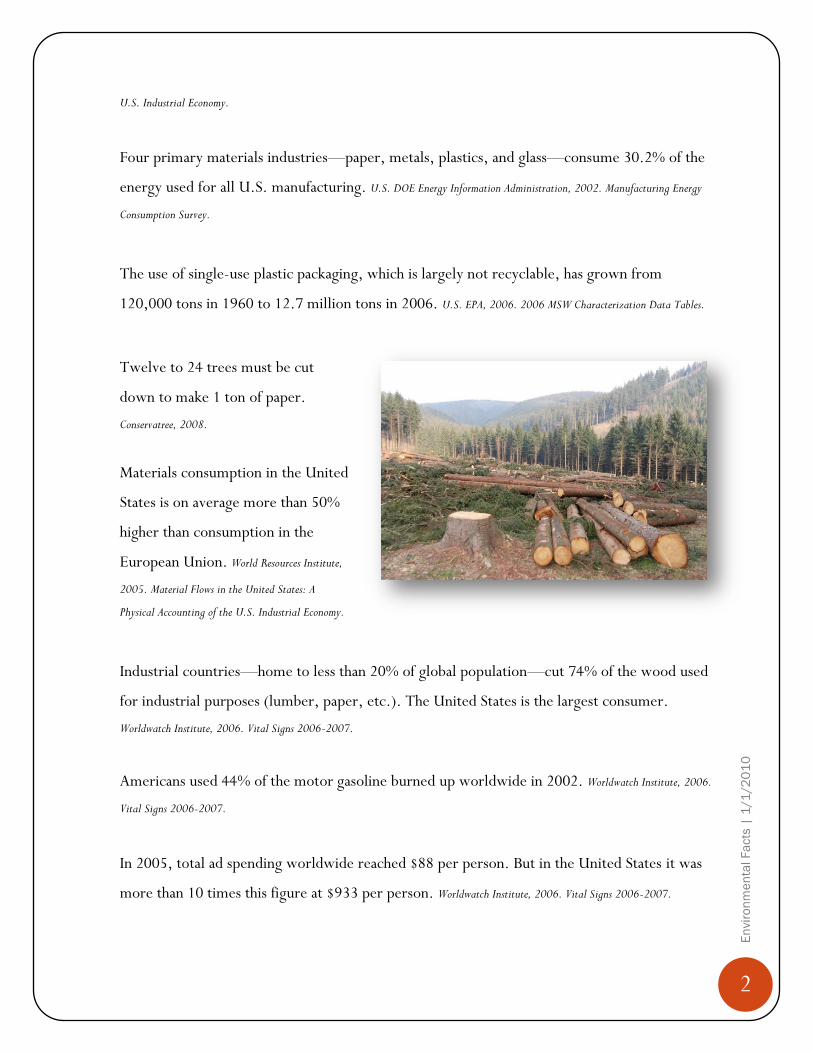
Each American effectively occupies about 20% more developed land (for housing, schools,
shopping, roads, and other uses) than he/she did 20 years ago. Center for Environment and Population, 2006.
U.S. National Report on Population and the Environment.
In 1900, 41% of the materials used in the U.S.
were renewable (e.g., agricultural, fishery, and
forestry products); by 1995, only 6% of materials
consumed were renewable. The majority of
materials now consumed in the U.S. are
nonrenewable, including metals, minerals, and
fossil-fuel derived products. U.S. EPA, 2009. Sustainable
Materials Management: The Road Ahead.
Our reliance on minerals as fundamental
ingredients in the manufactured products used in
the U.S.—including cell phones, flat-screen
monitors, paint, and toothpaste—requires the
extraction of more than 25,000 pounds of new
nonfuel minerals per capita each year. U.S. EPA, 2009. Sustainable Materials Management: The Road Ahead.
Since the late 1980s, our human footprint has exceeded the Earth’s biocapacity. In 2005, global
biocapacity was measured as 2.1 hectares per capita, while the average demand or footprint per
person was 2.7 hectares. This ecological ―overshoot‖ means that it now takes about one year
and three months for the Earth to regenerate what we use in a single year. World Wildlife Fund, 2008.
Living Planet Report.
5
En
vir
on
me
nta
l F
acts
| 1
/1
/2
01
0
The ecological footprint of a U.S. resident is estimated at 9.4 hectares, more than four times
the global biocapacity per capita. This large ecological footprint is primarily associated with
energy production, which in turn is tied to greenhouse gas emissions. World Wildlife Fund, 2008. Living
Planet Report.
Between 1970 and 1995, the U.S. represented about one-third of the world’s total material
consumption. With less than 5% of the world’s population, the U.S. consumes 33% of paper,
25% of oil, 15% of coal, 17% of aluminum, and 15% of copper. U.S. EPA, 2009. Sustainable Materials
Management: The Road Ahead.
Industrialized countries, with 20% of the world’s population, consume 87% of the world’s
printing and writing paper. Environmental Paper Network, 2007. Understanding Recycled Fiber.
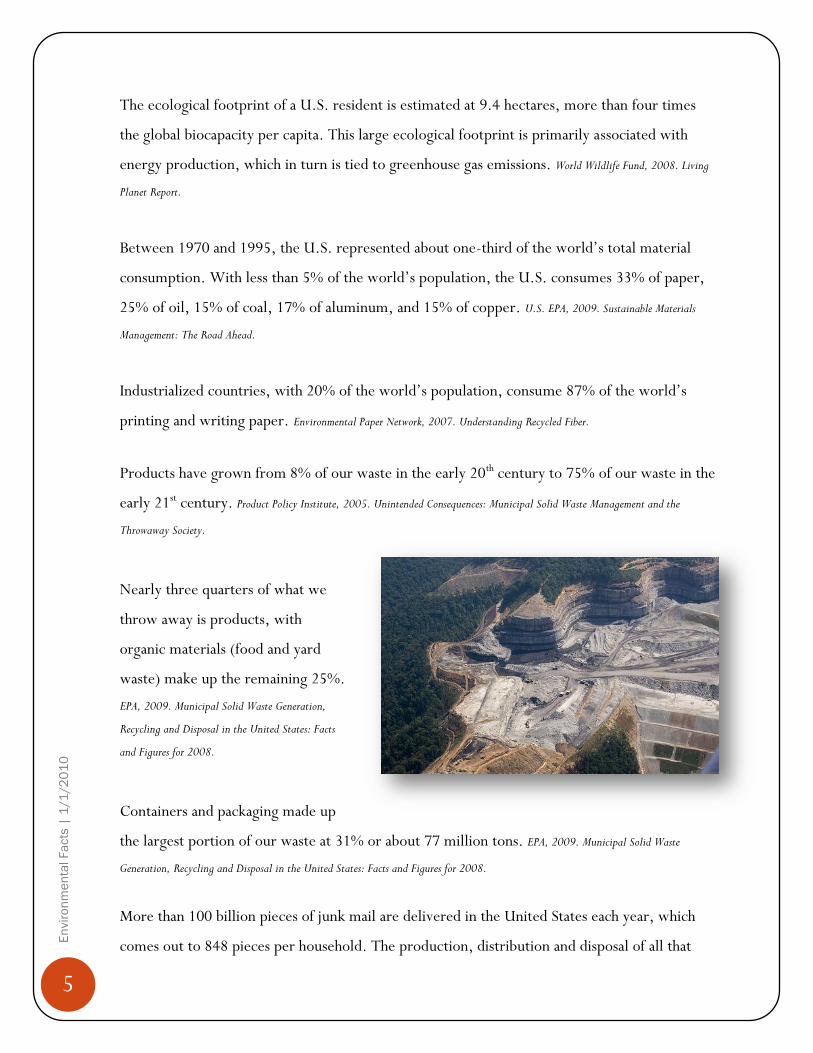
Products have grown from 8% of our waste in the early 20th century to 75% of our waste in the
early 21st century. Product Policy Institute, 2005. Unintended Consequences: Municipal Solid Waste Management and the
Throwaway Society.
Nearly three quarters of what we
throw away is products, with
organic materials (food and yard
waste) make up the remaining 25%.
EPA, 2009. Municipal Solid Waste Generation,
Recycling and Disposal in the United States: Facts
and Figures for 2008.
Containers and packaging made up
the largest portion of our waste at 31% or about 77 million tons. EPA, 2009. Municipal Solid Waste
Generation, Recycling and Disposal in the United States: Facts and Figures for 2008.
More than 100 billion pieces of junk mail are delivered in the United States each year, which
comes out to 848 pieces per household. The production, distribution and disposal of all that
6
En
vir
on
me
nta
l F
acts
| 1
/1
/2
01
0
junk mail creates over 51 million metric tons of greenhouses gases annually, the equivalent
emissions of more than 9.3 million cars. ForestEthics, 2008. Climate Change Enclosed: Junk Mail’s Impact on Global
Warming.
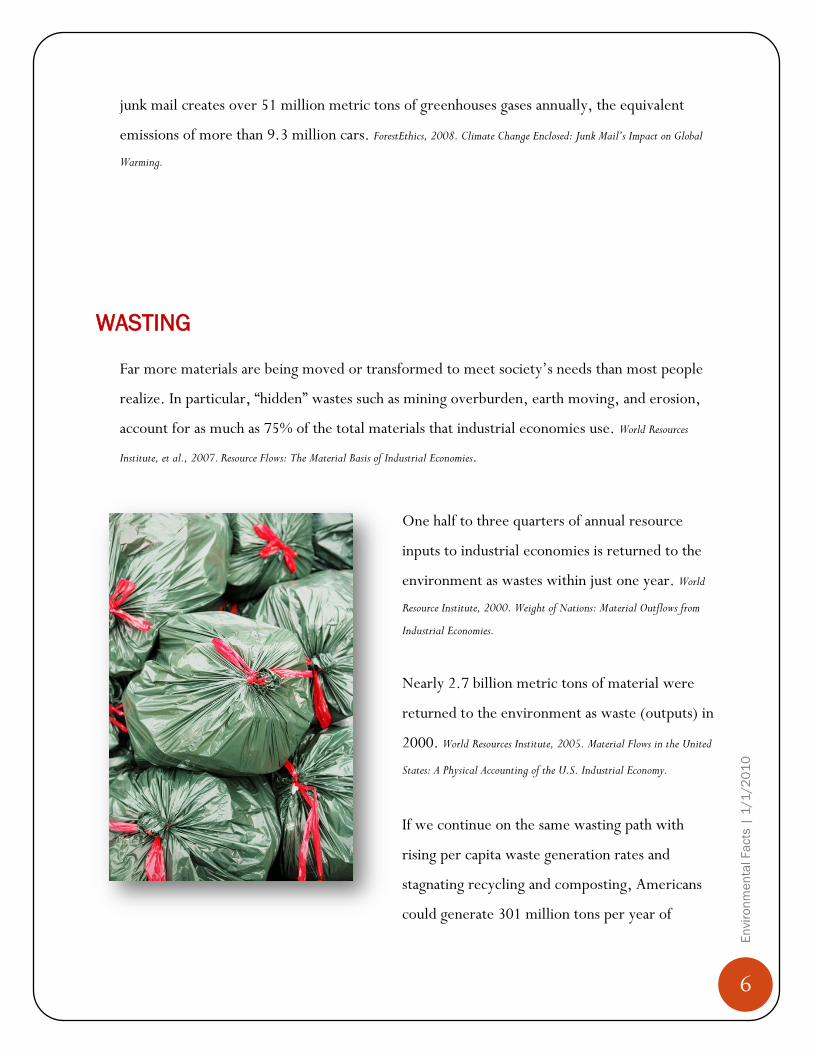
WASTING
Far more materials are being moved or transformed to meet society’s needs than most people
realize. In particular, ―hidden‖ wastes such as mining overburden, earth moving, and erosion,
account for as much as 75% of the total materials that industrial economies use. World Resources
Institute, et al., 2007. Resource Flows: The Material Basis of Industrial Economies.
One half to three quarters of annual resource
inputs to industrial economies is returned to the
environment as wastes within just one year. World
Resource Institute, 2000. Weight of Nations: Material Outflows from
Industrial Economies.
Nearly 2.7 billion metric tons of material were
returned to the environment as waste (outputs) in
2000. World Resources Institute, 2005. Material Flows in the United
States: A Physical Accounting of the U.S. Industrial Economy.
If we continue on the same wasting path with
rising per capita waste generation rates and
stagnating recycling and composting, Americans
could generate 301 million tons per year of

7
En
vir
on
me
nta
l F
acts
| 1
/1
/2
01
0
municipal solid waste by 2030, a 20% increase from 2006. B. Platt et al., 2008. Stop Trashing the Climate.
The U.S. buried or burned more than 166 million tons of resources—paper, plastic, metals,
glass and organic materials—in landfills and incinerators in 2008. We recycled and composted
only one-third of our discards. U.S. EPA, 2009. Municipal Solid Waste Generation, Recycling, and Disposal in the United
States, Detailed Tables and Figures for 2008.
For every ton of discarded
products and materials destroyed
by incinerators and landfills, about
71 tons of manufacturing, mining,
oil and gas exploration,
agricultural, coal combustion, and
other discards are produced. B. Platt
et al., 2000. Wasting and Recycling in the U.S.
U.S. per capita food waste has
progressively increased by 50% since 1974, reaching more than 1400 calories per person per
day. Hall, K., et al., 2009. The Progressive Increase of Food Waste in America and Its Environmental Impact.
Losses and food waste in the United States could be as high as 40-50%. Up to one quarter of all
fresh fruits and vegetables in the U.S. is lost between the field and the table. United Nations
Environment Programme, 2009. The environmental food crisis: Environments role in averting future food crises.
In 2005, the production of 10 key metals commodities resulted in more than 3 billion tons of
waste materials, more than four times the weight of the metals extracted. Worldwatch Institute, 2009.
World Metal Production Surges.
The aluminum industry is among the most energy intensive in the world, accounting for 3% of
global electricity use. Producing aluminum from recycled sources uses only 5-10% of the

8
En
vir
on
me
nta
l F
acts
| 1
/1
/2
01
0
energy needed to make virgin aluminum, and avoids toxic mining wastes associated with mining
bauxite ore. Worldwatch Institute, 2009. World Metal Production Surges.
In 2003, only about 44% of aluminum beverage cans in the United States were recycled. If we
had recycled this metal instead of landfilling it, we could have saved 36.7 billion kilowatt-hours
of electricity, enough to power 3.5 million U.S. households for a whole year. Worldwatch Institute,
2006. Vital Signs 2006-2007.
An estimated 144 billion beverage containers were landfilled, incinerated or littered in the
United States in 2005, approximately two out of every three containers sold. This amounts to
54 billion aluminum cans, 52 billion plastic bottles and jugs, 30 billion glass bottles, and about
10 billion pouches, cartons, and drink boxes.
Container Recycling Institute, 2007. Water, Water Everywhere: The
growth of non-carbonated beverage containers in the United States.
Approximately 18 million barrels of crude oil
equivalent were consumed in 2005 to replace the
2 million tons of PET bottles that were wasted
instead of recycled. Container Recycling Institute, 2007.
Water, Water Everywhere: The growth of non-carbonated beverage
containers in the United States.
Some 53 million tons of electronic waste was
generated worldwide in 2009. Only about 13%
of it was recycled. ABI Research Firm, 2010. As cited in New
York Times, A Program to Certify Electronic Waste Recycling Rivals
an Industry-U.S. Plan.
More than 97%, or 31 million tons, of U.S. food scraps was buried or burned in landfills and
incinerators in 2008. U.S. EPA, 2009. Municipal Solid Waste Generation, Recycling, and Disposal in the United States,
Detailed Tables and Figures for 2008.
9
En
vir
on
me
nta
l F
acts
| 1
/1
/2
01
0
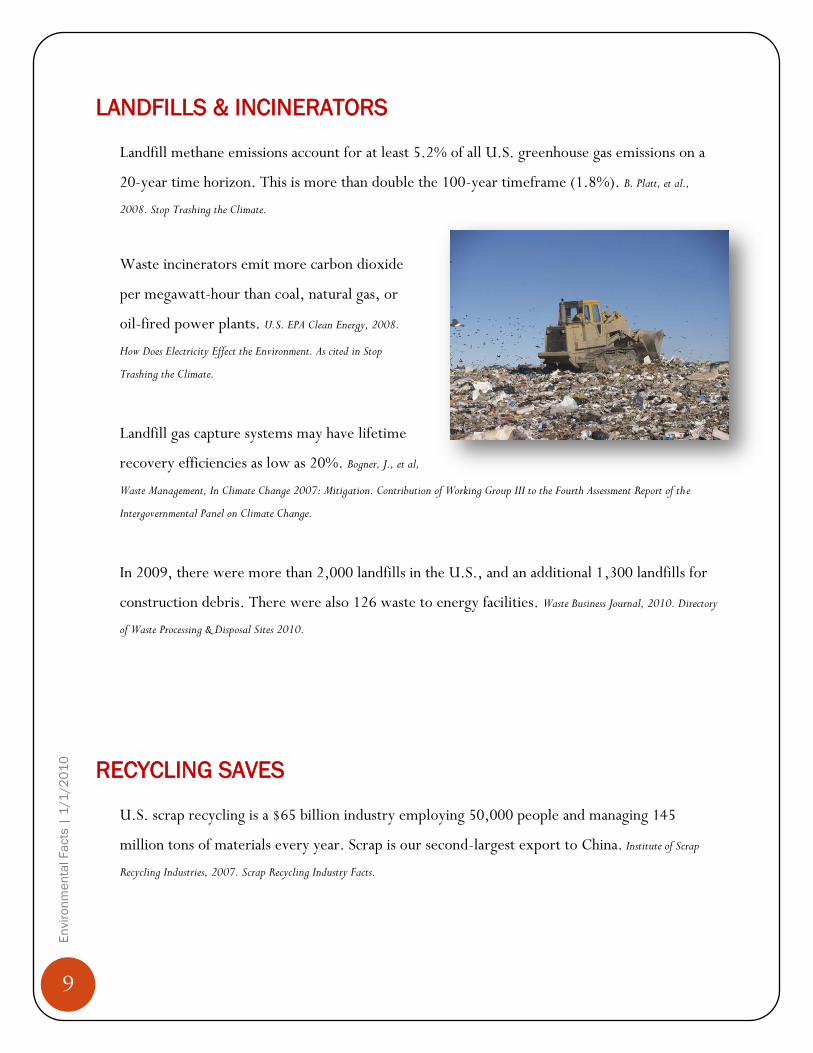
LANDFILLS & INCINERATORS
Landfill methane emissions account for at least 5.2% of all U.S. greenhouse gas emissions on a
20-year time horizon. This is more than double the 100-year timeframe (1.8%). B. Platt, et al.,
2008. Stop Trashing the Climate.
Waste incinerators emit more carbon dioxide
per megawatt-hour than coal, natural gas, or
oil-fired power plants. U.S. EPA Clean Energy, 2008.
How Does Electricity Effect the Environment. As cited in Stop
Trashing the Climate.
Landfill gas capture systems may have lifetime
recovery efficiencies as low as 20%. Bogner, J., et al,
Waste Management, In Climate Change 2007: Mitigation. Contribution of Working Group III to the Fourth Assessment Report of the
Intergovernmental Panel on Climate Change.
In 2009, there were more than 2,000 landfills in the U.S., and an additional 1,300 landfills for
construction debris. There were also 126 waste to energy facilities. Waste Business Journal, 2010. Directory
of Waste Processing & Disposal Sites 2010.
RECYCLING SAVES
U.S. scrap recycling is a $65 billion industry employing 50,000 people and managing 145
million tons of materials every year. Scrap is our second-largest export to China. Institute of Scrap
Recycling Industries, 2007. Scrap Recycling Industry Facts.
10
En
vir
on
me
nta
l F
acts
| 1
/1
/2
01
0
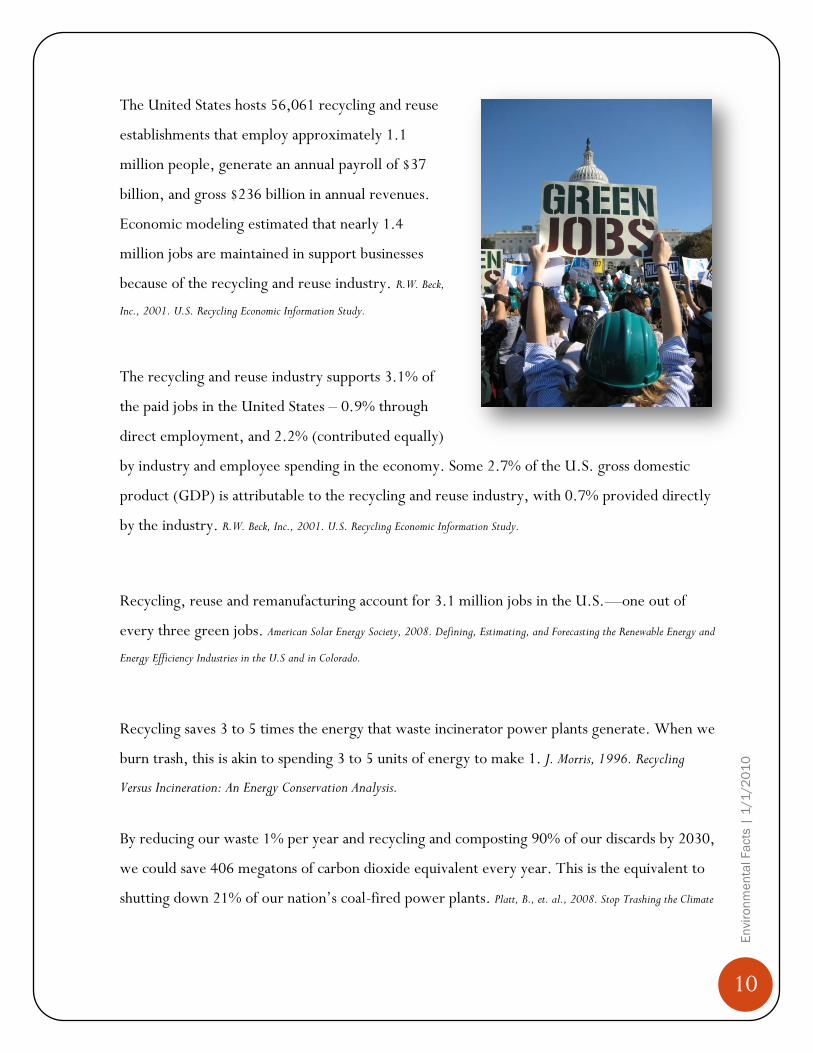
The United States hosts 56,061 recycling and reuse
establishments that employ approximately 1.1
million people, generate an annual payroll of $37
billion, and gross $236 billion in annual revenues.
Economic modeling estimated that nearly 1.4
million jobs are maintained in support businesses
because of the recycling and reuse industry. R.W. Beck,
Inc., 2001. U.S. Recycling Economic Information Study.
The recycling and reuse industry supports 3.1% of
the paid jobs in the United States – 0.9% through
direct employment, and 2.2% (contributed equally)
by industry and employee spending in the economy. Some 2.7% of the U.S. gross domestic
product (GDP) is attributable to the recycling and reuse industry, with 0.7% provided directly
by the industry. R.W. Beck, Inc., 2001. U.S. Recycling Economic Information Study.
Recycling, reuse and remanufacturing account for 3.1 million jobs in the U.S.—one out of
every three green jobs. American Solar Energy Society, 2008. Defining, Estimating, and Forecasting the Renewable Energy and
Energy Efficiency Industries in the U.S and in Colorado.
Recycling saves 3 to 5 times the energy that waste incinerator power plants generate. When we
burn trash, this is akin to spending 3 to 5 units of energy to make 1. J. Morris, 1996. Recycling
Versus Incineration: An Energy Conservation Analysis.
By reducing our waste 1% per year and recycling and composting 90% of our discards by 2030,
we could save 406 megatons of carbon dioxide equivalent every year. This is the equivalent to
shutting down 21% of our nation’s coal-fired power plants. Platt, B., et. al., 2008. Stop Trashing the Climate
11
En
vir
on
me
nta
l F
acts
| 1
/1
/2
01
0
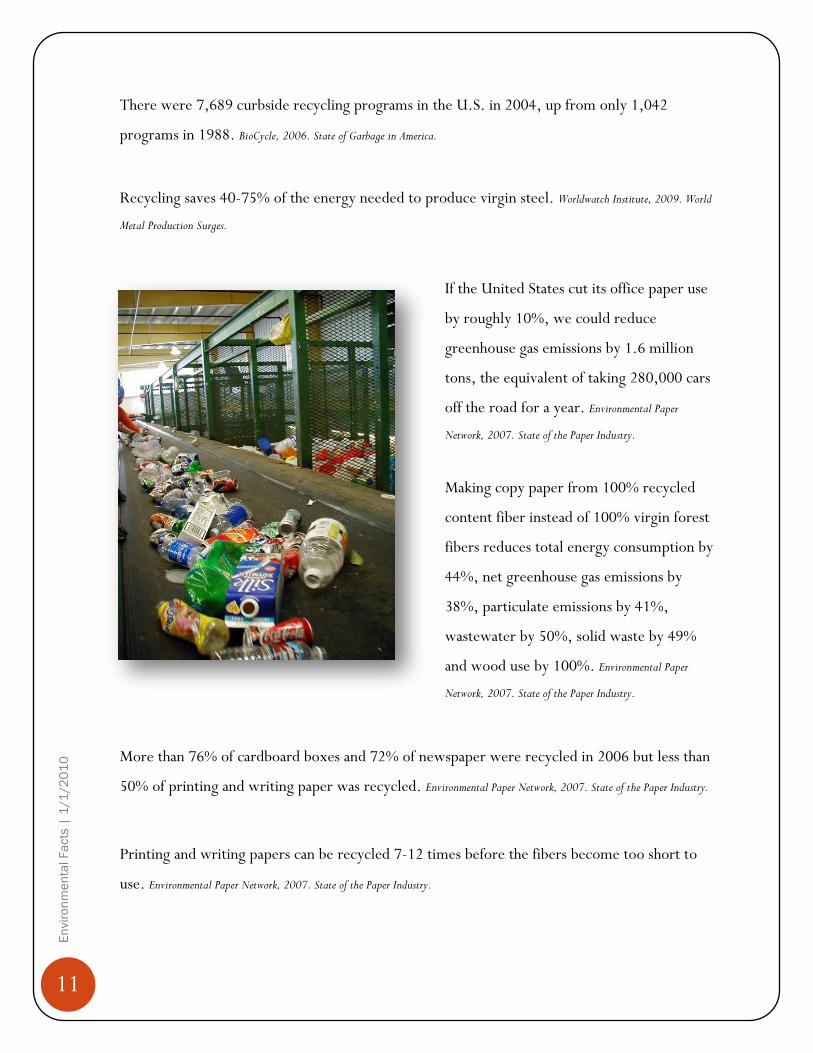
There were 7,689 curbside recycling programs in the U.S. in 2004, up from only 1,042
programs in 1988. BioCycle, 2006. State of Garbage in America.
Recycling saves 40-75% of the energy needed to produce virgin steel. Worldwatch Institute, 2009. World
Metal Production Surges.
If the United States cut its office paper use
by roughly 10%, we could reduce
greenhouse gas emissions by 1.6 million
tons, the equivalent of taking 280,000 cars
off the road for a year. Environmental Paper
Network, 2007. State of the Paper Industry.
Making copy paper from 100% recycled
content fiber instead of 100% virgin forest
fibers reduces total energy consumption by
44%, net greenhouse gas emissions by
38%, particulate emissions by 41%,
wastewater by 50%, solid waste by 49%
and wood use by 100%. Environmental Paper
Network, 2007. State of the Paper Industry.
More than 76% of cardboard boxes and 72% of newspaper were recycled in 2006 but less than
50% of printing and writing paper was recycled. Environmental Paper Network, 2007. State of the Paper Industry.
Printing and writing papers can be recycled 7-12 times before the fibers become too short to
use. Environmental Paper Network, 2007. State of the Paper Industry.
12
En
vir
on
me
nta
l F
acts
| 1
/1
/2
01
0
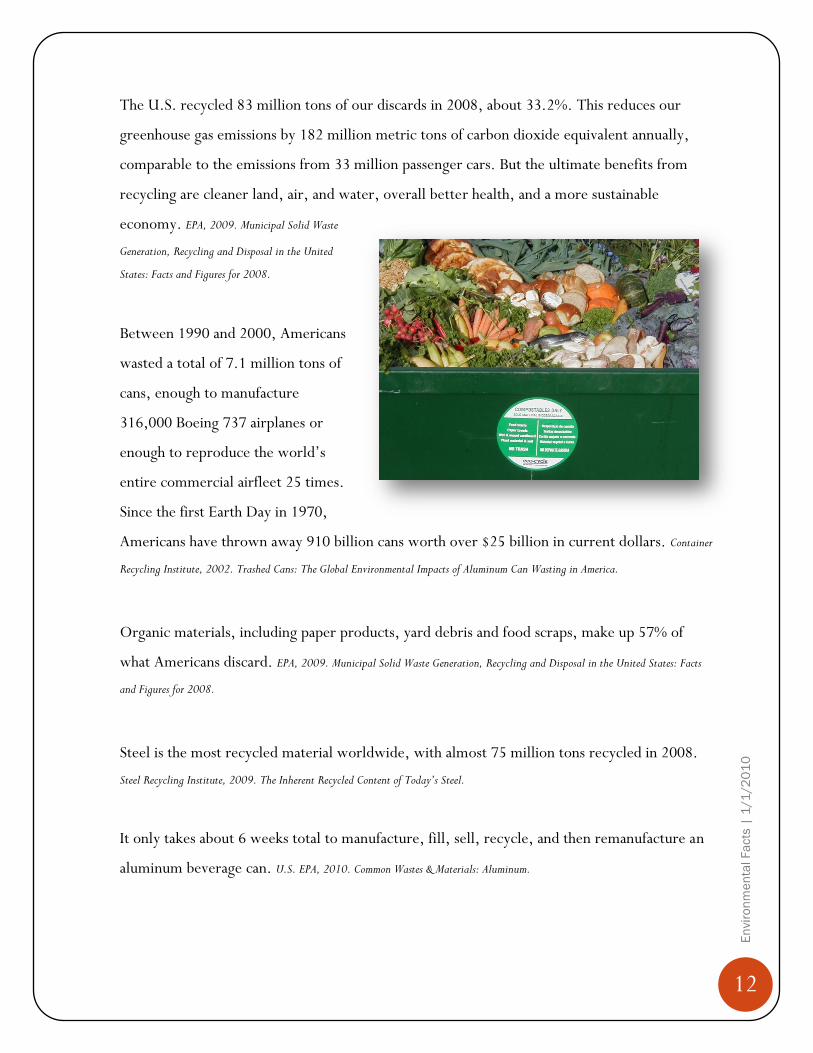
The U.S. recycled 83 million tons of our discards in 2008, about 33.2%. This reduces our
greenhouse gas emissions by 182 million metric tons of carbon dioxide equivalent annually,
comparable to the emissions from 33 million passenger cars. But the ultimate benefits from
recycling are cleaner land, air, and water, overall better health, and a more sustainable
economy. EPA, 2009. Municipal Solid Waste
Generation, Recycling and Disposal in the United
States: Facts and Figures for 2008.
Between 1990 and 2000, Americans
wasted a total of 7.1 million tons of
cans, enough to manufacture
316,000 Boeing 737 airplanes or
enough to reproduce the world’s
entire commercial airfleet 25 times.
Since the first Earth Day in 1970,
Americans have thrown away 910 billion cans worth over $25 billion in current dollars. Container
Recycling Institute, 2002. Trashed Cans: The Global Environmental Impacts of Aluminum Can Wasting in America.
Organic materials, including paper products, yard debris and food scraps, make up 57% of
what Americans discard. EPA, 2009. Municipal Solid Waste Generation, Recycling and Disposal in the United States: Facts
and Figures for 2008.
Steel is the most recycled material worldwide, with almost 75 million tons recycled in 2008.
Steel Recycling Institute, 2009. The Inherent Recycled Content of Today’s Steel.
It only takes about 6 weeks total to manufacture, fill, sell, recycle, and then remanufacture an
aluminum beverage can. U.S. EPA, 2010. Common Wastes & Materials: Aluminum.
13
En
vir
on
me
nta
l F
acts
| 1
/1
/2
01
0
Recycling one ton of paper can save enough energy to power the average American home for
six months, save 7000 gallons of water, save 3.3 cubic yards of landfill space, and save one
metric ton of greenhouse gases (MTCE). U.S. EPA, 2010. Common Wastes & Materials: Benefits of Paper Recycling.
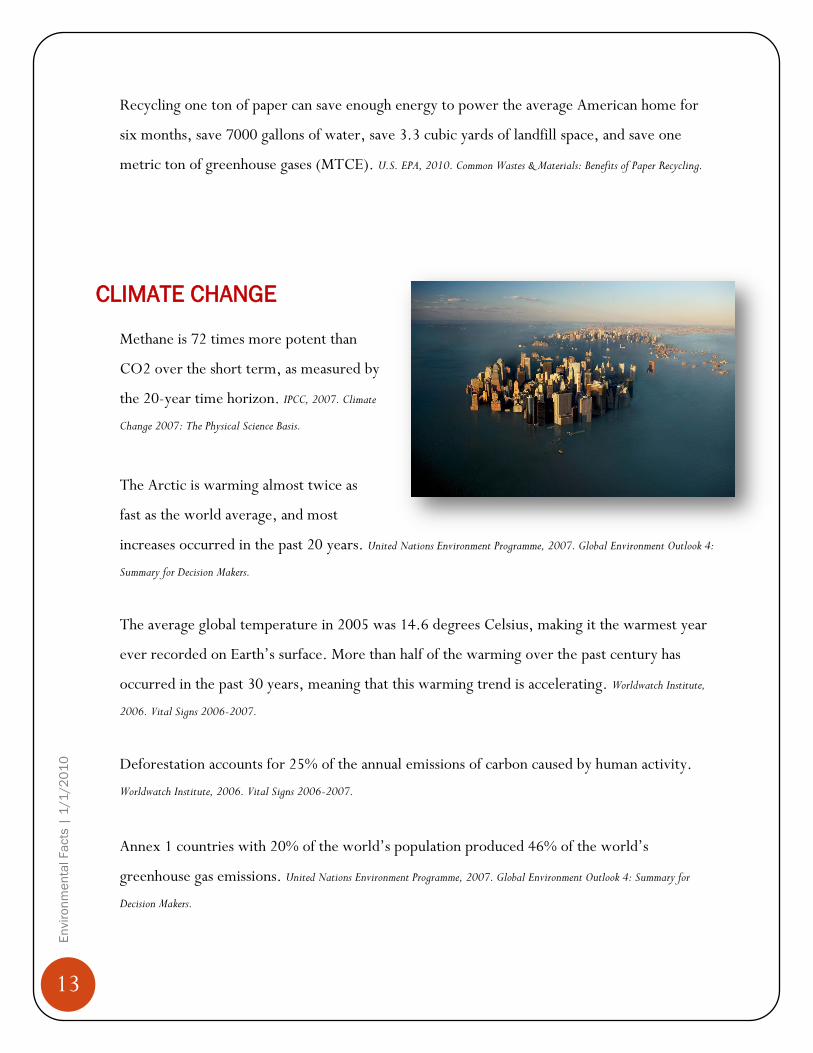
CLIMATE CHANGE
Methane is 72 times more potent than
CO2 over the short term, as measured by
the 20-year time horizon. IPCC, 2007. Climate
Change 2007: The Physical Science Basis.
The Arctic is warming almost twice as
fast as the world average, and most
increases occurred in the past 20 years. United Nations Environment Programme, 2007. Global Environment Outlook 4:
Summary for Decision Makers.
The average global temperature in 2005 was 14.6 degrees Celsius, making it the warmest year
ever recorded on Earth’s surface. More than half of the warming over the past century has
occurred in the past 30 years, meaning that this warming trend is accelerating. Worldwatch Institute,
2006. Vital Signs 2006-2007.
Deforestation accounts for 25% of the annual emissions of carbon caused by human activity.
Worldwatch Institute, 2006. Vital Signs 2006-2007.
Annex 1 countries with 20% of the world’s population produced 46% of the world’s
greenhouse gas emissions. United Nations Environment Programme, 2007. Global Environment Outlook 4: Summary for
Decision Makers.
14
En
vir
on
me
nta
l F
acts
| 1
/1
/2
01
0
The Intergovernmental Panel on Climate Change (IPCC) projects an increase in the global
temperature of 1.8–4°C by the end of this century. This will lead to potentially massive
consequences, especially for the most vulnerable, poor and disadvantaged people who
contribute to climate change to a lesser extent. Even if atmospheric concentrations of
greenhouse gases were to be stabilized today, land and ocean temperatures would increase for
decades and sea levels would rise for centuries. United Nations Environment Programme, 2007. Global Environment
Outlook 4: Summary for Decision Makers.
While the consumption of fossil fuels has taken the brunt of the blame for anthropogenic
greenhouse gas emissions, land-use changes have been responsible for about one-third of the
increase in atmospheric carbon dioxide over the last 150 years, mainly through the loss of soil
organic carbon. United Nations Environment Programme, 2007. Global Environmental Outlook 4.
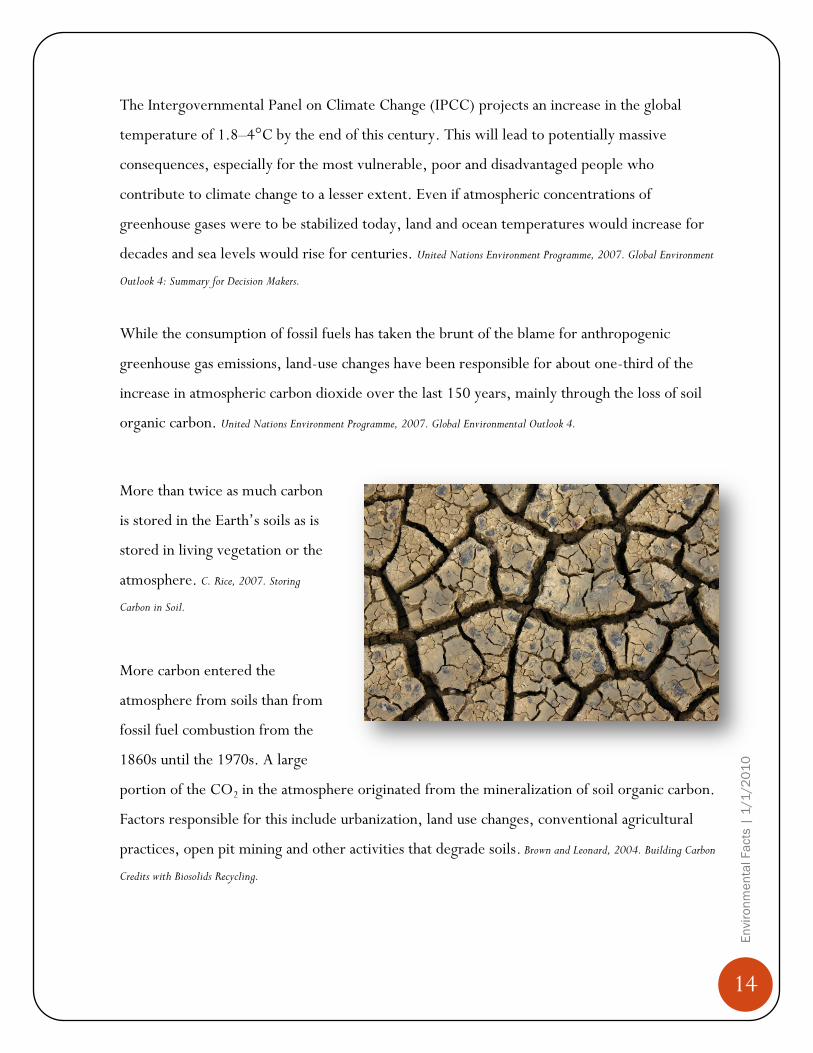
More than twice as much carbon
is stored in the Earth’s soils as is
stored in living vegetation or the
atmosphere. C. Rice, 2007. Storing
Carbon in Soil.
More carbon entered the
atmosphere from soils than from
fossil fuel combustion from the
1860s until the 1970s. A large
portion of the CO2 in the atmosphere originated from the mineralization of soil organic carbon.
Factors responsible for this include urbanization, land use changes, conventional agricultural
practices, open pit mining and other activities that degrade soils. Brown and Leonard, 2004. Building Carbon
Credits with Biosolids Recycling.
15
En
vir
on
me
nta
l F
acts
| 1
/1
/2
01
0
Warming of the climate system is unequivocal, as
is now evident from observations of increases in
global average air and ocean temperatures,
widespread melting of snow and ice, and rising
global average sea level. IPCC, 2007. Climate Change 2007:
Synthesis Report.
Eleven of the last twelve years (1995–2006) rank
among the 12 warmest years in the instrumental
record of global surface temperature (since 1850).
IPCC, 2007. Climate Change 2007: Synthesis Report.
Average Northern Hemisphere temperatures
during the second half of the 20th century were
very likely higher than during any other 50-year period in the last 500 years and likely the
highest in at least the past 1300 years. IPCC, 2007. Climate Change 2007: Synthesis Report.
Global greenhouse gas emissions due to human activities have grew 70% between 1970 and
2004. IPCC, 2007. Climate Change 2007: Synthesis Report.
The atmospheric concentrations of CO2 and CH4 in 2005 exceed by far the natural range over
the last 650,000 years. Global increases in CO2 concentrations are due primarily to fossil fuel
use, with land-use change providing another significant but smaller contribution. IPCC, 2007.
Climate Change 2007: Synthesis Report.
Most of the observed increase in global average temperatures since the mid-20th century is very
likely due to the observed increase in anthropogenic GHG concentrations. IPCC, 2007. Climate Change
2007: Synthesis Report.
16
En
vir
on
me
nta
l F
acts
| 1
/1
/2
01
0
GENERAL ENVIRONMENT
Up to half of amphibian species could be wiped out in coming years through habitat loss and
climate change—the biggest mass extinction since dinosaurs disappeared. World Association of Zoos and
Aquariums, 2007.
Human activities caused $6.6 trillion in environmental costs in 2008, equivalent to 11% of
global GDP. The top 3,000 public companies cause over $2.15 trillion, or one-third, of global
environmental costs. United Nations Envioronmental Programme Finance Initiative. 2010. Universal Ownership: Why
environmental externalities matter to institutional investors.
Biodiversity declined 40% between
1970 and 2000. Worldwatch Institute,
2006. Vital Signs 2006-2007.
Over about 20 years, most
agricultural soils will have lost
about 50% of their organic carbon
because of the reliance of industrial
agriculture on inorganic fertilizers,
rather than organic composts and
manures, as a source of crop
nutrients, and the extensive use of
tillage. European Commission, 2001. Waste Management Options and Climate Change.
17
En
vir
on
me
nta
l F
acts
| 1
/1
/2
01
0
Nearly one-third of the world’s cropland (1.5 billion hectares) has been abandoned because of
soil erosion and degradation over the past 40 years. Global Education Project, 2010. Food and Soil.
It takes approximately 500 years to replace 25 millimeters (1 inch) of topsoil lost to erosion.
The minimal soil depth for agricultural production is 150 millimeters. From this perspective,
productive fertile soil is a nonrenewable, endangered ecosystem. Global Education Project, 2010. Food and
Soil.
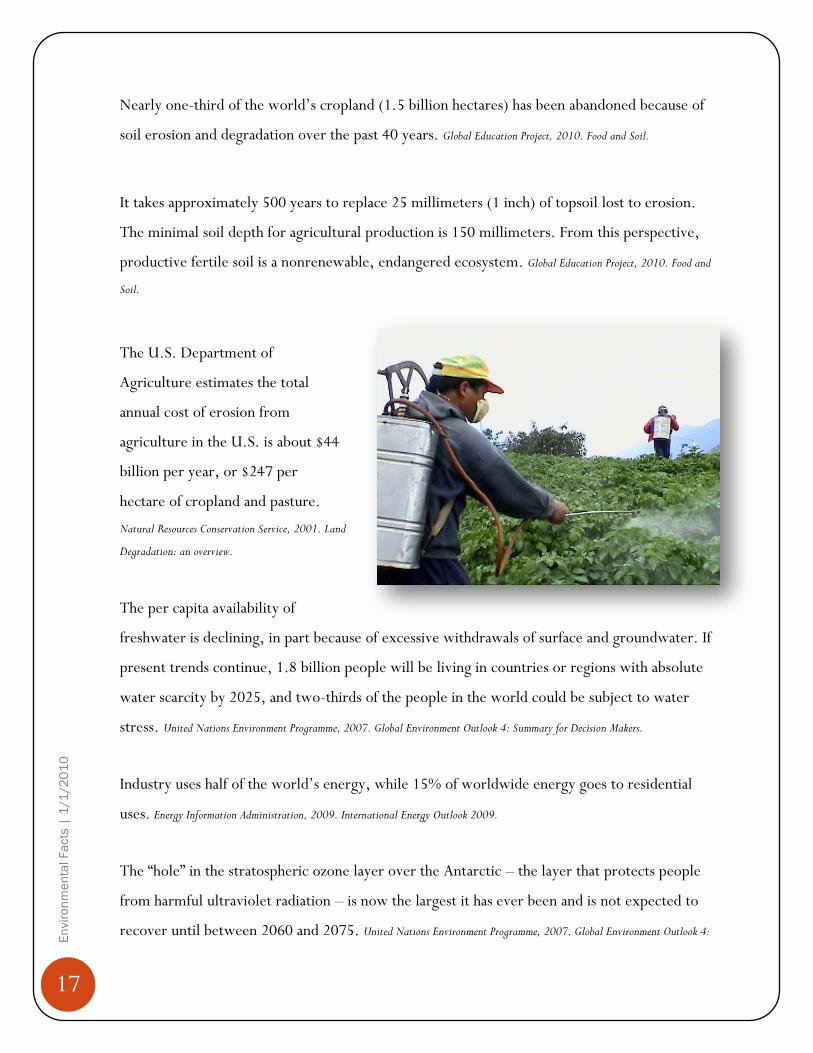
The U.S. Department of
Agriculture estimates the total
annual cost of erosion from
agriculture in the U.S. is about $44
billion per year, or $247 per
hectare of cropland and pasture.
Natural Resources Conservation Service, 2001. Land
Degradation: an overview.
The per capita availability of freshwater is
The per capita availability of
freshwater is declining, in part because of excessive withdrawals of surface and groundwater. If
present trends continue, 1.8 billion people will be living in countries or regions with absolute
water scarcity by 2025, and two-thirds of the people in the world could be subject to water
stress. United Nations Environment Programme, 2007. Global Environment Outlook 4: Summary for Decision Makers.
Industry uses half of the world’s energy, while 15% of worldwide energy goes to residential
uses. Energy Information Administration, 2009. International Energy Outlook 2009.
The ―hole‖ in the stratospheric ozone layer over the Antarctic – the layer that protects people
from harmful ultraviolet radiation – is now the largest it has ever been and is not expected to
recover until between 2060 and 2075. United Nations Environment Programme, 2007. Global Environment Outlook 4:

18
En
vir
on
me
nta
l F
acts
| 1
/1
/2
01
0
Summary for Decision Makers.
Agriculture accounts for more than 70% percent of global water use. United Nations Environment
Programme, 2007. Global Environment Outlook 4: Summary for Decision Makers.
If the world economy used energy
today in the same way it did in 1970,
it would require the energy equivalent
of 11 additional Saudi Arabias—more
than all the oil produced in the world.
Thus ―saved energy‖ is arguably the
world’s leading energy source.
Worldwatch Institute, 2006. Vital Signs 2006-2007.
Nearly 80% of the world’s energy comes from oil, coal, or gas. Worldwatch Institute, 2006. Vital Signs
2006-2007
80% of the plastic debris in our oceans comes from land-based sources, particularly trash and
plastic litter in urban runoff. California Ocean Protection Council, 2008. An Implementation Strategy for the California
Ocean Protection Council Resolution to Reduce and Prevent Ocean Litter.
Plastic debris in an area north of Hawaii known as the Northwest Pacific Gyre has increased 5-
fold in the last 10 years. The general composition of ocean litter is 60-80% plastics, although it
has reached 90-95% in some areas. California Ocean Protection Council, 2008. An Implementation Strategy for the
California Ocean Protection Council Resolution to Reduce and Prevent Ocean Litter.
About 40% of the nation’s rivers, 46% of lakes, and 50% of the estuaries are too polluted for
fishing and swimming. American Rivers. 2004. America’s Most Endangered Rivers of 2004: Ten Rivers Reaching the Crossroads
19
En
vir
on
me
nta
l F
acts
| 1
/1
/2
01
0
in the Next 12 Months.
Mercury concentrations in game fish exceed EPA’s recommended levels at 49% of lakes and
reservoirs nationwide, and polychlorinated biphenyls (PCBs) in game fish at levels of potential
concern at 17% of lakes and reservoirs. U.S. EPA, 2009. National Lake Fish Tissue Study.
The rate of deforestation in the tropics is approximately one acre per second. U.S. EPA, 2009.
Sustainable Materials Management: The Road Ahead.
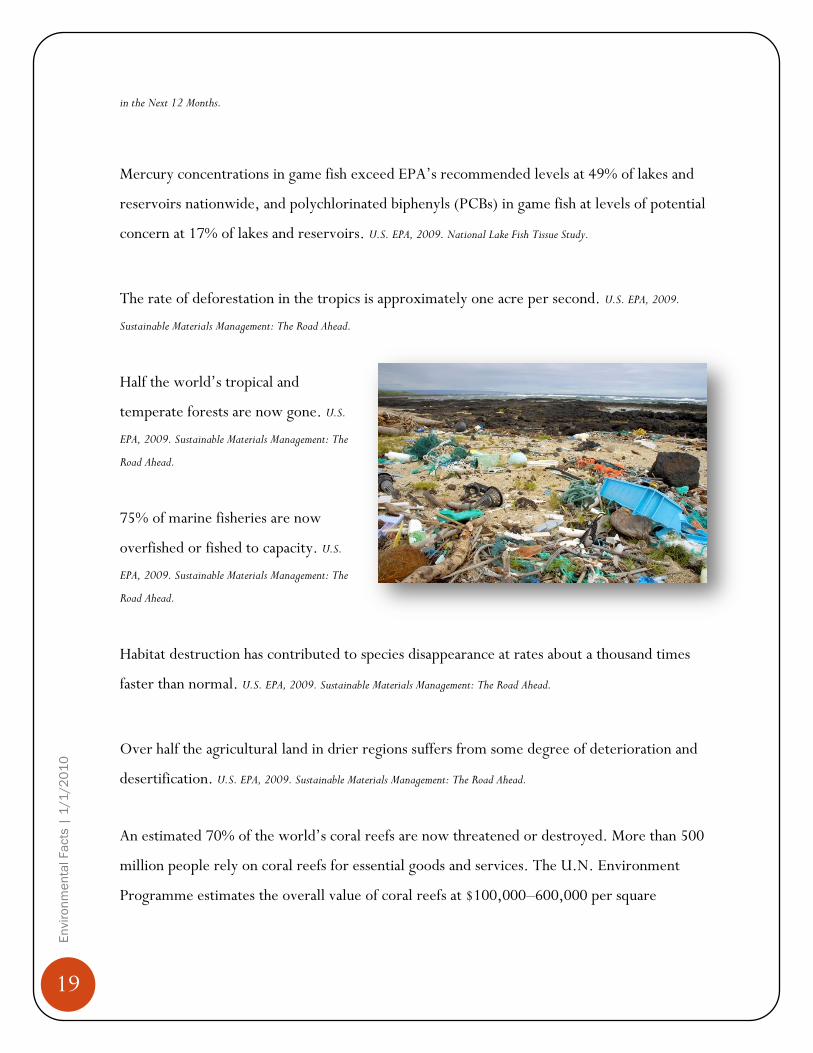
Half the world’s tropical and
temperate forests are now gone. U.S.
EPA, 2009. Sustainable Materials Management: The
Road Ahead.
75% of marine fisheries are now
overfished or fished to capacity. U.S.
EPA, 2009. Sustainable Materials Management: The
Road Ahead.
Habitat destruction has contributed to species disappearance at rates about a thousand times
faster than normal. U.S. EPA, 2009. Sustainable Materials Management: The Road Ahead.
Over half the agricultural land in drier regions suffers from some degree of deterioration and
desertification. U.S. EPA, 2009. Sustainable Materials Management: The Road Ahead.
An estimated 70% of the world’s coral reefs are now threatened or destroyed. More than 500
million people rely on coral reefs for essential goods and services. The U.N. Environment
Programme estimates the overall value of coral reefs at $100,000–600,000 per square
20
En
vir
on
me
nta
l F
acts
| 1
/1
/2
01
0
kilometer a year. Worldwatch Institute, 2006. Vital Signs 2006-2007.
Nearly one-quarter (22%) of mammal species are globally threatened or extinct. International Union
for Conservation of Nature, 2008. State of the World’s Species.
Households that use natural lawn care practices produce nearly $75 in annual ongoing public
health, ecological, water conservation and hazardous waste management benefits – from
reduced use of synthetic fertilizers and pesticides, switching from gas to electricity for lawn
mowing, reduced irrigation, and lower hazardous waste management costs. Morris and Bagby, 2007.
Measuring Environmental Value for Natural Lawn and Garden Care.
Collectively U.S. organizations waste
$2.8 billion every year powering unused
PCs. In 2009, these unused PCs emitted
approximately 20 million tons of carbon
dioxide equivalent—equal to the annual
emissions of 4 million cars. 1E and the Alliance
to Save Energy, 2009. PC Energy Report 2009.
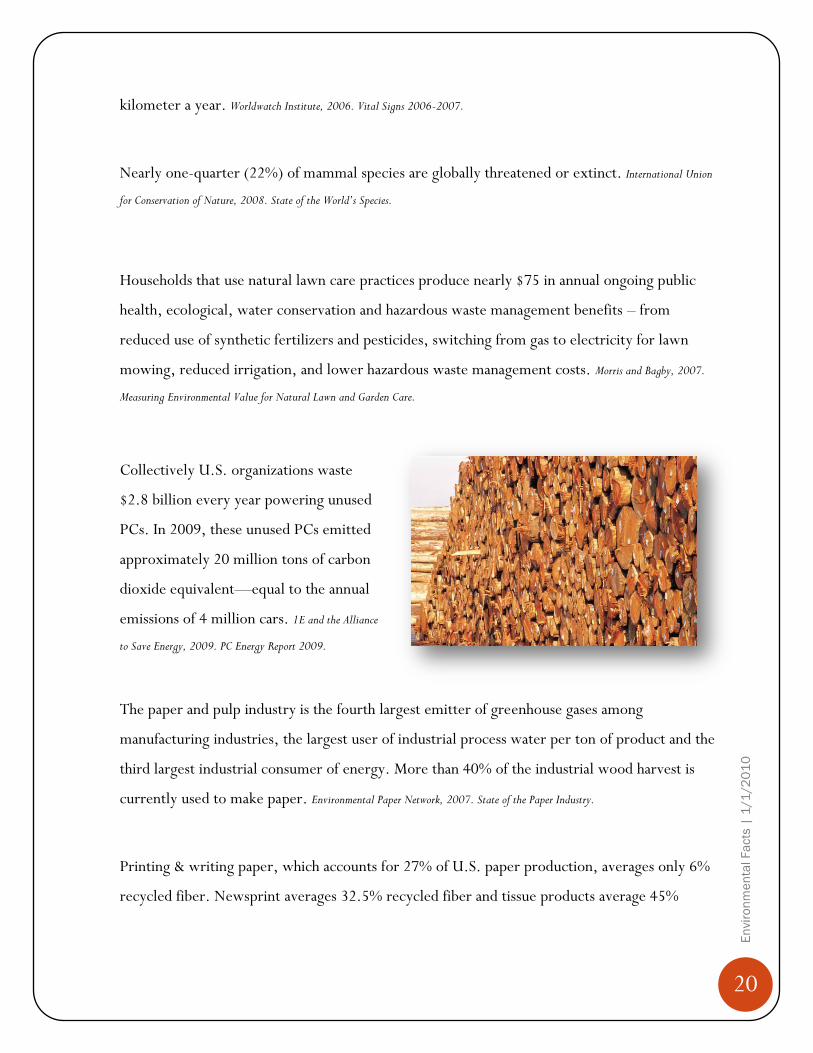
The paper and pulp industry is the fourth largest emitter of greenhouse gases among
manufacturing industries, the largest user of industrial process water per ton of product and the
third largest industrial consumer of energy. More than 40% of the industrial wood harvest is
currently used to make paper. Environmental Paper Network, 2007. State of the Paper Industry.
Printing & writing paper, which accounts for 27% of U.S. paper production, averages only 6%
recycled fiber. Newsprint averages 32.5% recycled fiber and tissue products average 45%
21
En
vir
on
me
nta
l F
acts
| 1
/1
/2
01
0
recycled fibers. Environmental Paper Network, 2007. State of the Paper Industry.
Roughly half the world’s forests have been burned or cleared and converted to non-forest uses.
Human activity has degraded almost 80% of what remains of the planet’s once vast forests.
Environmental Paper Network, 2007. State of the Paper Industry.
Livestock in the U.S. are responsible for 55% of erosion and sediment, 37% of pesticide use,
50% of antibiotic use and one-third of nitrogen and phosphorus loadings in our waterways. Food
and Agriculture Organization of the United Nations, 2006. Livestock’s Long Shadow: Environmental issues and options.
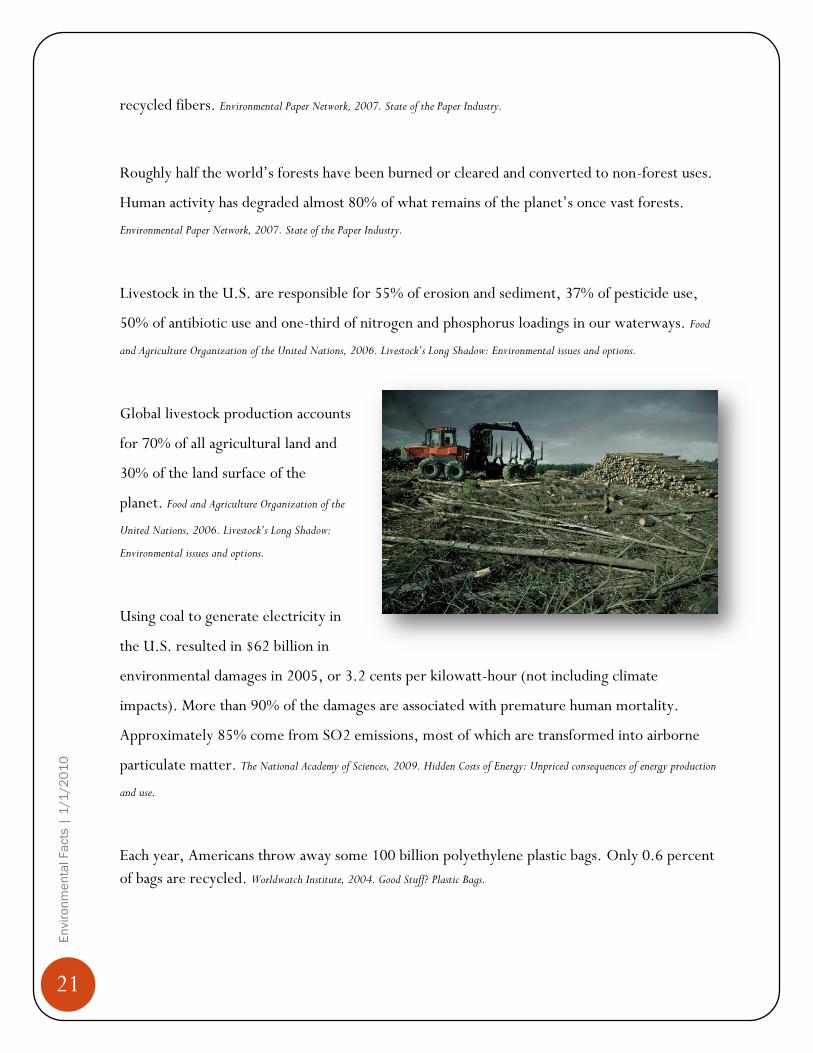
Global livestock production accounts
for 70% of all agricultural land and
30% of the land surface of the
planet. Food and Agriculture Organization of the
United Nations, 2006. Livestock’s Long Shadow:
Environmental issues and options.
Using coal to generate electricity in
the U.S. resulted in $62 billion in
environmental damages in 2005, or 3.2 cents per kilowatt-hour (not including climate
impacts). More than 90% of the damages are associated with premature human mortality.
Approximately 85% come from SO2 emissions, most of which are transformed into airborne
particulate matter. The National Academy of Sciences, 2009. Hidden Costs of Energy: Unpriced consequences of energy production
and use.
Each year, Americans throw away some 100 billion polyethylene plastic bags. Only 0.6 percent
of bags are recycled. Worldwatch Institute, 2004. Good Stuff? Plastic Bags.

22
En
vir
on
me
nta
l F
acts
| 1
/1
/2
01
0
TOXINS
Only a few hundred of the more than 80,000 chemicals in use in the United States have been
tested for safety. President’s Cancer Panel, National Cancer Institute, 2010. Reducing Environmental Cancer Risk: What We Can
Do Now.
The most environmentally harmful outputs to our environment—synthetic and persistent
organic chemicals, radioactive compounds, and heavy metals—increased 24% between 1975
and 2000. World Resources Institute, 2005. Material Flows in the United States: A Physical Accounting of the U.S. Industrial
Economy.
Fertilizer consumption has increased exponentially since the 1950s, so much so that 50% of all
commercial fertilizer ever produced has been applied since 1984. World Resources Institute, 1998. Nutrient
Overload: Unbalancing the Global Nitrogen Cycle.
One half of every metric ton of fertilizer applied
to fields never even makes it into plant tissue, but
instead ends up evaporating or being washed into
local waterways. World Resources Institute, 1998. Nutrient
Overload: Unbalancing the Global Nitrogen Cycle.
In 2008, the American Association of Poison
Control Centers reported that more than half of
the 2 million poisoning incidents each year
involve children younger than six years old.
Leading causes of poisoning include cosmetics
such as perfume and nail polish, deodorant and
soap, household cleaning products and
medications. US EPA, 2010. Prevent Poisonings in Your Home.
23
En
vir
on
me
nta
l F
acts
| 1
/1
/2
01
0
Our world is increasingly burdened by the long-term risks associated with toxic chemicals. By a
very conservative estimate, global production of hazardous waste has reached 300–500 million
tons per year. Worldwatch Institute, 2004. State of the World 2003.
Less than 2% of chemicals on the market have actually been tested for carcinogenicity
(tendency to cause cancer). President’s Cancer Panel, National Cancer Institute, 2010. Reducing Environmental Cancer Risk:
What We Can Do Now.
Pesticides (insecticides, herbicides, and fungicides) approved for use by the U.S. Environmental
Protection Agency (EPA) contain nearly 900 active ingredients, many of which are toxic. Many
of the solvents, fillers, and other chemicals listed as inert ingredients on pesticide labels also are
toxic, but are not required to be tested for their potential to cause chronic diseases such as
cancer. President’s Cancer Panel, National Cancer Institute, 2010. Reducing Environmental Cancer Risk: What We Can Do Now.
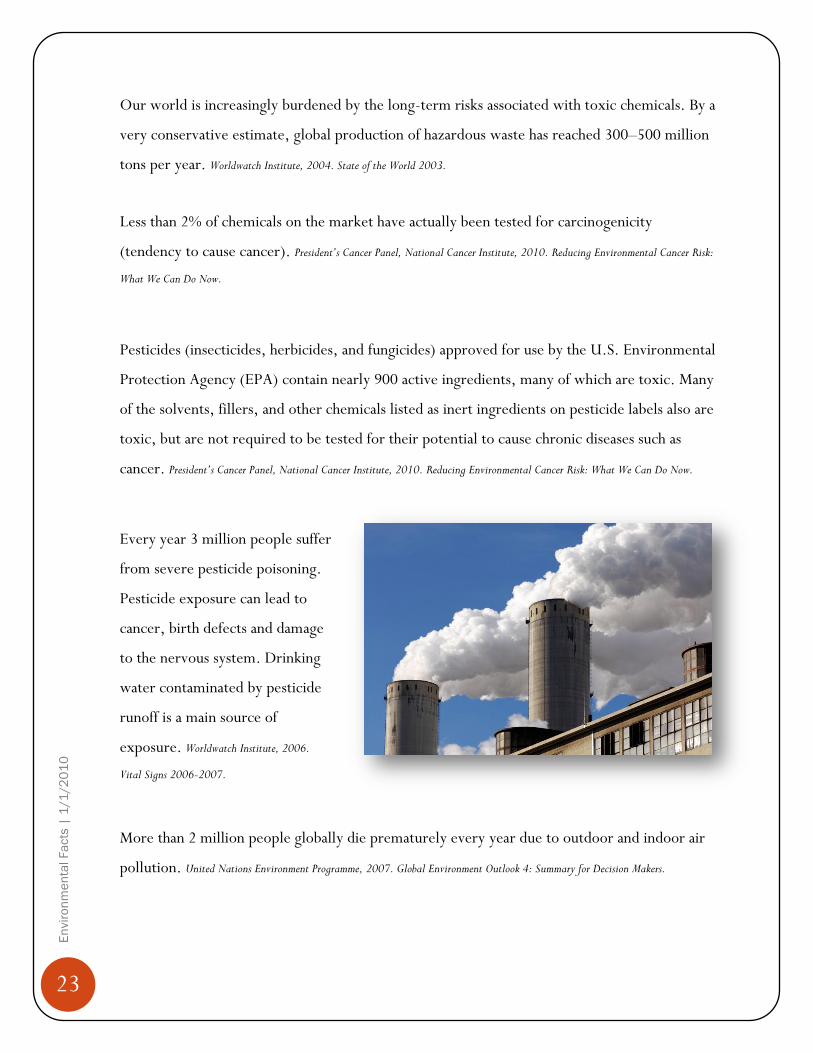
Every year 3 million people suffer
from severe pesticide poisoning.
Pesticide exposure can lead to
cancer, birth defects and damage
to the nervous system. Drinking
water contaminated by pesticide
runoff is a main source of
exposure. Worldwatch Institute, 2006.
Vital Signs 2006-2007.
More than 2 million people globally die prematurely every year due to outdoor and indoor air
pollution. United Nations Environment Programme, 2007. Global Environment Outlook 4: Summary for Decision Makers.

24
En
vir
on
me
nta
l F
acts
| 1
/1
/2
01
0
Less than 20% of all chemicals in cosmetics have been assessed for safety by the industry’s safety
panel. Story of Stuff, 2010. Story of Cosmetics.
Since 1938, the FDA has banned just 8 out of over 12,000 ingredients used in cosmetics.
Companies are not required to even list all of the
ingredients on the label. Story of Stuff, 2010. Story of Cosmetics.
Glass containers are endlessly recyclable, made from
all-natural ingredients (sand, soda ash, limestone, and
recycled glass), and is the only packaging material
accepted by the U.S. FDA as ―GRAS‖ or ―generally
recognized as safe‖ for food and beverage contact.
Glass is nonporous and impermeable, so there are no
interactions between the glass packaging and the
contained products that could affect the flavor of foods
and beverages. Glass Packaging Institute, 2010. Cradle to Cradle Life
Cycle Assessment of North American Container Glass.
COLORADO
Colorado had 112 recycling facilities, 56 landfills and 22 composting facilities in 2008. Colorado
Department of Public Health and Environment, 2010. Recycling Data Collection and Reporting.
Coloradoans recycled 19.6% of our discards in 2008. Excluding scrap metal recycling, our
recycling rate drops to 9.3%. We sent 6.8 million tons to landfills for disposal. We generated
an average of 8.5 pounds of discarded materials per person per day, far above the national
average. Colorado Department of Public Health and Environment, 2010. Annual Municipal Solid Waste Recycling and Diversion
25
En
vir
on
me
nta
l F
acts
| 1
/1
/2
01
0
Totals.
By recycling and composting nearly 4 million tons of materials in 2008, Colorado saved the
energy equivalent of 288 million gallons of gasoline. These diversion efforts also saved 3.8
million metric tons of CO2e, the equivalent of taking more than 695,000 cars off the road for a
year. Colorado Department of Public Health and Environment, 2010. 2009 Annual Report to the Colorado General Assembly on the
Status of the Solid Waste and Material Management Program in Colorado.
Eco-Facts are compiled by Eco-Cycle staff for general use. Eco-Cycle grants permission to reproduce some or all of these
facts, provided our name and website (www.ecocycle.org) accompanies all reproductions.