Embed Size (px)
Citation preview

Environmental Toxicology and Chemistry, Vol. 29, No. , pp. 1893–1906, 2010# 2010 SETAC
Printed in the USADOI: 10.1002/etc.243
ENVIRONMENTAL FACTORS AFFECTING THE LEVELS OF LEGACY PESTICIDES IN
THE AIRSHED OF DELAWARE AND CHESAPEAKE BAYS, USAANUBHA GOEL,y LAURA L. MCCONNELL,*z ALBA TORRENTS,y ZHIHUA KUANG,§ CATHLEEN J. HAPEMAN,zDONALD W. MERITT,k STEPHANIE T. ALEXANDER,k JOSEPH R. SCUDLARK,# and ROBERT SCARBOROUGHyy
yCivil and Environmental Engineering, University of Maryland, College Park, Maryland 20742, USA
zU.S. Department of Agriculture, Agricultural Research Service, 10300 Baltimore Avenue, BARC-West, Beltsville, Maryland 20705
§Greenman-Pedersen, Annapolis Junction, Maryland 20701, USA
kUniversity of Maryland Center for Environmental Science, Horn Point Laboratory, Cambridge, Maryland 21613, USA
#University of Delaware, School of Marine Science and Policy, Lewes, Delaware 19958, USA
yyDelaware National Estuarine Research Reserve, St. Jones Reserve, Dover, Delaware 19901, USA
(Submitted 30 September 2009; Returned for Revision 23 December 2009; Accepted 16 March 2010)
All* To
(laura.mPub
(wileyo
Abstract—Organochlorine insecticides and their degradation products contribute to toxicity in Chesapeake Bay, USA, sediments andaffect the reproductive health of avian species in the region; however, little is known of atmospheric sources or temporal trends inconcentrations of these chemicals. Weekly air (n¼ 265) and daily rain samples (n¼ 494) were collected over 2000 to 2003 from threelocations in the Delmarva Peninsula, USA. Pesticides were consistently present in the gas phase with infrequent detection in the particlephase. Hexachlorocyclohexanes (HCHs) and cis- and trans-chlordane were detected most frequently (95–100%), and cis- and trans-nonachlor, oxychlordane, heptachlor, heptachlor epoxide, dieldrin, and 1-chloro-4-[2,2-dichloro-1-(4-chlorophenyl)ethenyl]benzene(4,40-DDE) were also detected frequently. The highest mean air concentrations were for dieldrin (60–84 pg/m3), g-HCH (37–83 pg/m3),and 4,40-DDE (16–80 pg/m3). Multiple regression analyses of air concentrations with temperature and wind conditions using modifiedClausius-Clapeyron equations explained only 30 to 60% of the variability in concentration for most chemicals. Comparison of the airconcentrations and enthalpy of air–surface exchange values at the three sites indicate sources of chlordanes and a-HCH sources areprimarily from long-range transport. However, examination of chlordane isomer ratios indicates some local and regional contributions,and g-HCH, 4,40-DDE, dieldrin, heptachlor, heptachlor epoxide, and oxychlordane also have local or regional sources, possibly fromcontaminated soils. Median rain sample volumes of 1 to 3 L led to infrequent detections in rain; however, average measuredconcentrations were 2 to 10 times higher than in the Great Lakes. Dissipation half-lives in air were well below 10 years for all chemicalsand below published values for the Great Lakes except dieldrin, which did not decline during the sample period. Environ. Toxicol.Chem. 2010;29:1893–1906. # 2010 SETAC
Keywords—Chesapeake Bay Organochlorine insecticides Atmosphere Long-range transport Delaware Bay
INTRODUCTION
The Chesapeake Bay, located in the Mid-Atlantic region, isthe largest estuary in the United States, supporting an abundantand diverse wildlife population. The increasing population inthe Baltimore–Washington corridor exerts significant pressureon the health of this complex ecosystem. Sediments, nutrients,and other toxic chemicals enter the Chesapeake Bay via theatmosphere and the 150 major rivers and streams that feed theestuary, and studies have demonstrated that industrial andagricultural pollutants are entering the Chesapeake Bay throughboth riverine [1–3], and atmospheric sources [4–9].
Exposure to toxic chemicals alters both functional andstructural aspects of the estuarine microbial food web, whichcould have serious implications for the higher trophic levels. Inan agreement between the states within the Chesapeake Baywatershed, a commitment was made to achieve a ChesapeakeBay free of toxics from all controllable sources to levels that resultin no toxic or bioaccumlative impact on living resources (http://www.chesapeakebay.net/content/publications/cbp_12081.pdf). A
Supplemental Data may be found in the online version of this articlewhom correspondence may be [email protected]).
lished online 14 May 2010 in Wiley Online Librarynlinelibrary.com).
1893
recent report by Hartwell and Hameedi [10] (http://ccma.nos.noaa.gov/publications/NCCOSTM47.pdf), describes the level ofcontamination in sediments within the main stem of the Ches-apeake Bay and some major tributaries. These data were exam-ined along with measured toxicity, sediment characterization,benthic community analysis, and other key parameters suchas dissolved oxygen. Their report indicates that concentrationsof metals and organic pollutants such as polychlorinated bip-henyls (PCBs), polyaromatic hydrocarbons (PAHs), and thepesticides, 1-chloro-4-[2,2,2-trichloro-1-(4-chlorophenyl) eth-yl]benzene (4,40-DDT) and chlordane, were positively corre-lated with toxicity response. Researchers working in the nearbyDelaware River and Delaware Bay found that concentrations ofthe organic contaminants 4,40-DDE, heptachlor epoxide, chlor-danes, and total PCBs) were predictive of hatching success forosprey (Pandion halieatus) [11]. The recent Presidential Exec-utive Order 13508 also requires that federal agencies makerecommendations to expand environmental research, monitor-ing, and observation to strengthen scientific support for deci-sion making on Chesapeake Bay restoration issues (http://www.whitehouse.gov/the_press_office/Executive-Order-Chesapeake-Bay-Protection-and-Restoration).
Previous studies on atmospheric concentrations and depo-sition of organic pollutants to the Chesapeake Bay region haveprimarily focused on PCBs, PAHs [7–9,12,13], and currently

1894 Environ. Toxicol. Chem. 29, 2010 A. Goel et al.
used agricultural pesticides [4,14,15]. No long-term datasets oforganochlorine insecticides and their degradation products inair and precipitation are available for the Chesapeake Bay areaand Delmarva Peninsula. The closest available measurementsof the legacy pesticides were carried out from six sites as part ofthe New Jersey Atmospheric Deposition Network project dur-ing 2000 and 2001 [16] and by Offenberg et al. [17] from threesites in the same network from 1997 to 1999.
The chlorinated insecticides were extensively used from the1940s until as late as the mid-1980s, and nearly all have beenbanned in the United States due to their tendency for persis-tence, toxicity, and bioaccumulation in sensitive ecosystems[18]. The objectives of the present study were to determine thelevels of banned organochlorine insecticides and selecteddegradation products in the atmosphere near the Chesapeakeand Delaware Bays, and to compare these observations withmeasurements from Central America, the southern United
Fig. 1. Map of Chesapeake and Delaware Bays on the Atlantic Coast of the U.S. and t
States (U.S.), and the Great Lakes region. Air and precipitationsamples were collected over four years (2000–2003) at threelocations in the upper Delmarva Peninsula. The data wereassessed for spatial and temporal trends, and were analyzedto evaluate the processes that influence the levels of the organo-chlorine pesticides in the region. The Clausius-Clapeyron equa-tion was used to examine the relationship of temperature andmeteorological parameters (wind speed and direction) on gasphase concentrations and to discern the contribution of long-range transport versus possible local sources. In addition, theatmospheric half-lives of these chemicals were estimated.
MATERIALS AND METHODS
Weekly air samples were collected at three sites on the upperDelmarva Peninsula (Fig. 1) from April 2000 to September2003 except during the winter months. The first site (HP) was
he surrounding area indicating major cities and sample collection sites. Colors

Legacy pesticides in the air of Delaware and Chesapeake Bays Environ. Toxicol. Chem. 29, 2010 1895
located at University of Maryland Center for EnvironmentalStudies, Horn Point Laboratory near the Choptank River inCambridge, Maryland, USA (38.6011, �76.1297; population10,911 in 2000) (http://www.census.gov/). In April 2001, asecond site (LD) at University of Delaware (Lewes, DE, USA)(38.7739, �75.1389; (population 2,932) was added. The thirdsite (DV) at the Delaware National Estuarine Research Reserve,St. Jones Component (Dover, DE, USA) (39.1581, �75.5239;population 32,135) was added in April 2002. Land use on theDelmarva Peninsula is mostly rural and agricultural with thenearest major urban and/or industrial centers being Washington,DC, Baltimore, Maryland, Philadelphia, Pennsylvania, andWilmington, Delaware. Total air samples collected at HP,LD, and DV were 123, 95, and 47, respectively. Rainfallsamplers were also deployed at each site and precipitationwas collected on a daily basis; 245, 178, and 71 samples werecollected at HP, LD, DV, respectively.
Meteorological data were collected near each site from thefollowing sources. Meteorological towers were colocated atHP and DV. The meteorological center at University of Del-aware at Georgetown, located 15 km southwest from Lewes,was used for LD. For the three sites, temperature, wind direc-tion, and wind speed were averaged over each 24-h samplingperiod. Average wind direction was determined using vectoraveraging.
Sample collection procedures
Air samples (integrated over 24 h, 10 a.m. to 10 a.m. the nextday) were collected simultaneously from all three sites) using ahigh-volume sampler (Model GPNY 1123, Grasby GeneralMetal Works). The sampling assembly consisted of a filter(for particles) and a sorbent for the gaseous fraction. Air waspulled at a flow rate ranging from 0.29 to 0.64 m3/min througha 20.3� 25.4-cm rectangular glass fiber filter (Gelman A/E)followed by two 7.6� 7.6 cm cylindrical polyurethane foam(PUF) plugs held within a glass sleeve. Concentration valueswere calculated from the sum of the analyte on both PUF plugs.
The effectiveness of the PUFs in collecting the air sampleswas evaluated by examining the back PUF:front PUF (BP:FP)ratio. The BP:FP ratio was <0.1 for most compounds. However,a- and g-HCH, and heptachlor exhibited a BP:FP ratio of >0.20in 59, 32, and 27% of samples, respectively. The greatest ratiovalues were observed during June, July, and August whentemperature conditions were highest and the effective vaporpressure values are increased. The BP:FP ratio of of a-HCH,g-HCH, and heptachlor exceeded 0.50 in 33, 8, and 10% ofsamples, indicating some loss during sample collection. Con-centration values were not adjusted for breakthrough; therefore,concentration values presented for these three compounds arelower than actual values.
The PUF plugs were precleaned using tap water, distilledwater, followed by Soxhlet extraction with acetone for 12 h andthen with ethyl acetate for another 12 h. The PUF plugs weredried within a vacuum desiccator and kept sealed in individual,precleaned glass jars with Teflon1-lined lids. The glass jars andlids were cleaned using tap water, distilled water, and acetone;the jars were baked for 4 h at 4008C. Filters were wrappedindividually in aluminum foil pocket and baked 4008C asdescribed by McConnell et al. [19]. Sample PUFs and filterswere returned to their individual containers after collection andwere kept frozen at �208C until processing.
Precipitation was collected on an event basis using a wet-only, commercially available MIC-B (Meteorological Instru-ment Center) sampler equipped with a 0.2 m2 stainless steel
funnel. Each event was any rain that fell during a 24-h periodfrom 10 AM to 10 AM (�1 h) the following day. Rainwater waspumped through an in-line 45-mm glass fiber filter and thenextracted using a solid-phase extraction (SPE) cartridge con-taining 200 mg of a hyper crosslined styrene–divinylbenzenecopolymer (Isolute1 ENVþ , Biotage AB). A flow rate ofapproximately 20 to 50 ml/min was used to achieve extractionefficiencies of greater than 80% for most compounds (Z. Kuang.2001. Master’s thesis. University of Maryland College Park).After an event, the SPE cartridge was stored at 48C and the filterwas wrapped in aluminum foil and stored at �208C. Rainsamples were shipped weekly on ice packs in small Styrofoamcoolers via overnight mail to the laboratory for processing andanalysis. Field blanks for both air and precipitation samplers atthe three sites were collected monthly.
Sample processing
The PUF plugs and glass fiber filters were fortified withdiazinon-d10 and extracted separately in batches of 15 to 20via Soxhlet extraction with ethyl acetate or dichloromethane,respectively, for 12 h. Extracts were reduced to 5 to 10 ml invacuo, and reduced to 1.0 ml using a gentle stream of high purity(99.9%) nitrogen gas. A laboratory blank and a spike samplewere processed with each batch of samples to observe anymatrix interference or contamination and to determine extrac-tion efficiency, respectively. Air filters were not analyzed forsamples collected in 2000. For rain samples, SPE cartridgeswere dried upon receipt using clean nitrogen gas. Absorbedanalytes were eluted from the cartridge with 6 ml dichloro-methane followed by 9 ml 3:1 acetone:acetonitrile solventmixture. The resulting extract was concentrated to a volumeof about 1.0 ml under a gentle stream of high purity (99.9%)nitrogen gas. A second aliquot of 2 ml acetonitrile was addedand the solution was blown down to 1.0 ml. The rain filters from2000 did not contain appreciable amount of analytes (Z. Kuang.2001. Master’s thesis) and were not analyzed for subsequentyears.
Analytical method
All samples and controls were analyzed for 15 legacypesticides or degradation products (Table 1) except in 2000when aldrin, heptachlor, heptachlor epoxide, oxychlordane, and4,40-DDD (1-chloro-4-[2,2-dichloro-1-(4-chlorophenyl)ethyl]-benzene) were not part of the analyte suite. Details of theanalytical methods for samples collected in 2000 can be foundelsewhere and are similar to below [15]. Extracts for samples in2001 to 2003 were analyzed using either a Hewlett-Packard5890 gas chromatograph coupled to a Hewlett-Packard 5989Amass spectrometer (GC-MS) or an Agilent Technologies 6890Ngas chromatograph coupled to an Agilent 5973 mass spectrom-eter. Both were operated in selected-ion monitoring mode usingelectron capture negative ion mass spectrometry. The chroma-tographic conditions were as follows: column, J&W DB-17MS(Agilent Technologies), 30 m, 0.25-mm inner diameter (i.d.),0.25-mm thickness; flow rate through the column, 1.4 ml/min;temperature program, 1308C, raised at 68C/min to 2058C for4.5 min and then at 68C/min to 3008C for 5.5 min; interface,3008C; quadrupole, 1508C; source, 2008C; injector, 2908C. Theionization gas was ultrahigh purity methane supplied at 60 kPa.Eighty nanograms of 2,20,3,4,40,5,6,60-octachlorobiphenyl wereadded to all extracts just before analysis and used as an internalstandard.
The method detection limits (MDLs) for analytes in rain-water were determined by spiking 5 to 50 ng of each compound

Table 1. Target analytes with Chemical Abstracts Service (CAS) registry numbers, method detection limits, and average percent spike recovery values forsample matrices and selected physical– chemical properties
Common name CAS No.
Method detection limitaAverage percentspike recovery
Molecularmass Solubilityb
Vaporpressureb HLCb
logKOW
bGas
phaseParticlephase
Dissolvedrain
Gasphase
Particlephase
Dissolvedrain
(pg/m3) (pg/m3) (ng/L)Avg.
percent recovery (SD) (g/mol) (mol/m3) (Pa)(Pa m3/
mol)
Aldrin 309-00-2 1.2 2.4 0.33 90 (20) 90 (20) 40 (6) 364.9 0.0027 0.064 23 6.24cis-chlordane 5103-71-9 1.8 1.2 0.76 86 (17) 100 (20) 62 (4) 409.8 0.0013 0.0073 5.7 6.20trans-chlordane 5103-74-2 1.9 1.0 (1.3) c 0.64 82 (19) 100 (20) 55 (4) 409.8 0.0015 0.010 6.8 6.27p,p0-DDDd 72-54-8 24 9.6 2.8 84 (19) 110 (30) 62 (3) 321 0.0023 0.0012 0.50 6.33p,p0-DDEe 72-55-9 5.9 3.0 1.5 86 (19) 101 (18) 45 (4) 319 0.00079 0.0034 4.2 6.93p,p0-DDTf 50-29-3 98 7.4 0.40 90 (60) 140 (60) 79 (12) 354.5 0.00042 0.00048 1.1 6.39Dieldrin 60-57-1 1.4 1.2 0.24 120 (40) 90 (20) 70 (3) 380.9 0.013 0.014 1.1 5.48Heptachlorg 76-44-8 0.8 1.1 0.80 90 (20) 100 (30) 63 (2) 373.4 0.0035 0.13 38 5.94Heptachlor
epoxideg1024-57-3 1.5 1.2 0.80 90 (20) 100 (30) 75 (2) 389.2 0.013 0.022 1.7 5.42
a-HCHh 319-84-6 2.5 0.9 0.80 81 (18) 90 (30) 85 (7) 290.85 0.333 0.245 0.735 3.94g-HCHi 58-89-9 0.9 0.9 1.0 (5.6c) 75 (17) 90 (30) 85 (8) 290.85 0.247 0.0757 0.306 3.83cis-nonachlor 5103-73-1 1.0 1.0 0.61 80 (16) 100 (20) 63 (7) 444.22trans-nonachlor 5103-74-2 1.1 1.2 0.65 84 (19) 110 (20) 57 95) 444.22 0.00378j 7.10j
Mirexg 2385-85-5 1.5 1.1 0.20 77 (18) 100 (20) 30 (3) 545.59Oxychlordane 027304-13-8 1.8 1.0 0.85 84 (13) 100 (20) 58 (4) 423.76 0.0102j 4.95j
a Method detection limits provided assume an air volume of 720 m3 and a rain sample volume of 2 L.b Values are designated as final adjusted values from Shen and Wania [21] or Ziao et al. [22].c Values in parantheses are higher method detection limits used for Horn Point, unless otherwise noted.d 1-Chloro-4-[2,2-dichloro-1-(4-chlorophenyl)ethyl]benzene.e 1-Chloro-4-[2,2-dichloro-1-(4-chlorophenyl)ethenyl]benzene.f 1-Chloro-4-[2,2,2-trichloro-1-(4-chlorophenyl)ethyl]benzene.g Method detection limit in rain was estimated from instrumental detection limits.h (1a,2a,3b,4a,5b,6b)-1,2,3,4,5,6-hexachlorocyclohexane.i (1a,2a,3b,4a,5a,6b)-1,2,3,4,5,6-hexachlorocyclohexane, also known as lindane.j Estimated values from Paasivirta et al. [23].
1896 Environ. Toxicol. Chem. 29, 2010 A. Goel et al.
(the equivalent to the lowest point of the calibration curve) into4-L distilled water, which was poured into the funnel of thesampler, was extracted through the filter-SPE cartridge assem-bly, and was processed in the same manner as the samples. Forthe gaseous and particle-phase air samples, the MDLs weredetermined by spiking 5 to 50 ng of each compound onto pre-cleaned PUFs or filters (8 replicates) and extracting and proc-essing them in the same manner as samples. Standard deviationsof measured replicate concentrations from these low-level spikeexperiments were used to calculate the MDL for each com-pound according to the U.S. Environmental Protection Agencystandard methods ([20]; http://www.epa.gov/osw/hazard/testmethods/sw846/index.htm). The pesticides were, in general,not detected in the field blanks. In a few cases when the levelswere above the MDL, the MDL was modified accordingly.Method detection limits each chemical for air and rain sampleextracts along with relevant physical chemical properties areprovided in Table 1 [21–23].
Laboratory spike recoveries averaged greater than or equalto 75% for PUFs, greater than or equal to 90% for filters andgreater than 60% for precipitation cartridges except for aldrin,4,40-DDE, trans-nonachlor, and mirex, which had recoveryvalues of less than 60% (Table 1). Samples were not correctedfor spike recoveries. Extraction surrogate recoveries averaged76% for all PUF samples and averaged 104% for filter samples.
Statistical analysis
Multiple regression analyses were performed to determineheats of phase transition and half-life values using the generallinear model procedure in SAS (SAS Institute). Box-plot
analysis to assess temporal and spatial variability in analyteconcentrations and one-way analysis of variance using aKruskal-Wallis test were conducted using GraphPad Prism1
(GraphPad Software).
RESULTS AND DISCUSSION
Legacy pesticides
The legacy pesticides included in the present study fall intoseveral groups (Table 1). The first are related to chlordane, aproduct that was used initially on agricultural crops and lawnpests and then later restricted to use in the foundation ofbuildings for termite control and finally banned in 1988(http://www.epa.gov/oppsrrd1/Rainbow/98rainbo.pdf). Tech-nical chlordane is a mixture of approximately 120 compounds[24]. The primary chlordane-related compounds are cis- andtrans-chlordane and cis- and trans-nonachlor. Heptachlor isalso a major component of technical chlordane, but it was alsoused independently as an agricultural insecticide and wasbanned in 1988. Technical heptachlor contains approximately72% heptachlor, 20 to 22% trans-chlordane, and 4 to 8%trans-nonachlor ([25]; http://www.who.int/ipcs/publications/cicad/cicad70.pdf). Heptachlor epoxide and oxychlordane arepersistent degradation products of heptachlor and chlordane,respectively.
The second group of legacy pesticides examined is theinsecticide HCH. Technical HCH is a mixture of isomers madeup of 55 to 80% a-HCH, 8 to 15% b-HCH, 2 to 16% g-HCH,and lesser contributions from the d- and e-HCH isomers[26]; this product was banned in the U.S. in the late 1970s
Legacy pesticides in the air of Delaware and Chesapeake Bays Environ. Toxicol. Chem. 29, 2010 1897
(http://www.epa.gov/glindicators/air/airb.html). The g-HCHisomer, also known as lindane, was still in limited use inthe U.S. and Canada as a seed treatment for canola and otherminor uses at the time of the present study, but it too was bannedin Canada in 2004 [27] and in the U.S. in 2006 (http://www.epa.gov/fedrgstr/EPA-PEST/2006/December/Day-13/p21101.htm). The third group is the Diels-Alder products ofcyclopentadiene and norbornadiene, aldrin, and dieldrin. Aldrinwas used from 1950 to 1969 on many agricultural crops untiluses were restricted to seed treatments in 1969. Dieldrin, also anoxidative degradation product of aldrin, was used during thesame time period on cotton, corn, and citrus. Both products werelimited to subterranean termite uses and other minor uses in1974 before the registration of both were cancelled in 1986(http://www.epa.gov/oppsrrd1/Rainbow/98rainbo.pdf).
The DDT-related compounds are the fourth group, consist-ing of the insecticide 4,40-DDT and its degradation products4,40-DDD and 4,40-DDE [28]. Originally used in the 1940s forcontrol of mosquito-borne malaria and other vector-borne dis-eases, 4,40-DDT was widely produced for agricultural andcommercial applications (http://www.epa.gov/history/topics/ddt/02.htm). Total usage in the U.S. is estimated at over600 kt. This product was cancelled in the U.S. for most usesin 1972. Finally, mirex, which was used both as an insecticide tocontrol fire ants and as an industrial fire retardant, was banned inthe U.S. in 1977.
Aldrin, dieldrin, chlordane, 4,40-DDT, 4,40-DDD, 4,40-DDE,and mirex have all been identified by the U.S. EnvironmentalProtection Agency as persistent, bioaccumulative, and toxicchemicals, and have been banned or severely limited in mostcountries (http://www.epa.gov/oppt/pbt/pubs/cheminfo.htm);however, continuing usage of DDT, chlordane, aldrin, anddieldrin has been reported in Mexico as recently as the late1990s and early 2000s [29]. Because these compounds arepersistent, residues remain in soils, surface waters, biota, andair. Furthermore, the atmosphere serves as a conduit, allowingmovement and equilibration between environmental compart-ments. Heavy agricultural usage of some of these pesticides hasleft behind a reservoir of these materials in some U.S. soils.When the soils are tilled or when temperatures increase, the rateof pesticide volatilization can increase, which allows greateramounts of the chemicals to be transported. In the atmosphere,they partition with atmospheric aerosols or particles. Theseparticles slowly settle from the atmosphere depositing residuesonto terrestrial surfaces and into water bodies via dry deposi-tion. The gas and particle-phase pesticides can also be scav-enged from the air during rain events; however, this processmay not be as important compared to other compounds becausemost legacy pesticides have low water solubilities (Table 1).Potential sources of the legacy pesticides to the Chesapeake andDelaware Bays and Delmarva Peninsula include a global back-ground signal, transport from historically contaminated areas inthe U.S., regional transport from surrounding urban areas, andlocal sources of contaminated agricultural and residential soils.
Legacy pesticides in air and precipitation
Three environmental compartments were investigated forlegacy pesticide concentrations in this work: gas and particle-phase air and dissolved phase rain. Overall, target analytes weredetected much more frequently in the gas phase compartmentthan in the particle or dissolved precipitation compartments(Table 2). This result is expected in view of the physicalproperties of the pesticides, the environmental conditions atthe sites, and the methods utilized to collect the samples
(Table 1). The volume of the air samples collected was highat around 700 m3, adequate for the detection of many persistentorganic pollutants, but particle concentrations in these ruralareas were likely low [30]; therefore, surface area for partition-ing onto particles was limited. At least one target analyte wasdetected in the gas phase of every sample with an average of 10compounds per sample at HP, 13 compounds at LD, and 11compounds at DV.
Particle phase concentrations
Results of particle-phase air samples indicate that, especiallyin LD and DV, legacy pesticides reside almost completely in thegas phase (Table 2). Out of 95 filter samples collected at LD,only dieldrin was detected in one sample at levels above thelimit of quantitation. At DV, only g-HCH was detected in twosamples at levels above the limit of quantitation. More legacypesticides were detected in the particle phase at HP and thedetections were more frequent. The compounds cis- and trans-chlordane were detected most often at 32 and 37%, respectively(Table 2) and were almost always detected together as would beexpected from a technical chlordane source. However, the othermajor chlordane components (e.g., nonachlor and heptachlor)were rarely detected. Mirex was the third most frequentlydetected compound in the particle phase at HP (25%); however,mirex was only detected once in the gas phase at this site.Although cis- and trans-chlordane and mirex were detectedmuch more frequently than the other legacy pesticides, theirconcentration levels averaged about 10% of that in the gasphase. The highest concentrations found in the particle phasewere for g-HCH, with a maximum concentration of 20 pg/m3,but it was detected infrequently (7%) and was nearly an ordermagnitude less than the maximum observed in the gas phase.
The patterns of detection in air particle samples may providesome indication of the nature of particles present in the atmos-phere at these three sites. The atmosphere at LD and DV islikely more strongly influenced by marine air from the AtlanticOcean than at HP given their relative distances from the ocean(Fig. 1). In addition, the nature of particles at these sites is likelylower in organic carbon content than at HP. Dachs et al. [31]found that gas and particle-phase PAHs were readily trans-ported with soot particles from Baltimore and deposited to theupper Chesapeake Bay, and that variability in concentrationswas related to wind speed and direction. An examination ofmonthly wind direction frequency data at HP indicated that thissite occasionally receives winds from the northwest direction(Baltimore–Washington metropolitan area) during the summer(5–10% of the time, data not shown) and more frequently duringthe fall and winter. The DV site also receives winds from thenorthwest in the winter from areas north of Baltimore, whenconcentrations are low; however, DV primarily receives windsfrom the southeast and southwest during the summer where noup-wind urban areas exist.
Gas phase concentrations
Patterns in gas phase concentrations at all three locationsindicated that cis- and trans-chlordane and both HCH isomersare present continuously (95–100% detection) in the region atlow levels averaging 20 to 50 pg/m3. Trans-nonachlor was alsocontinuously detected at LD and DV (96% at both locations), butwas only detected in 61% of samples at HP. Concentrations ofcis-nonachlor were up to an order of magnitude less than theconcentration of the trans-nonachlor and were less frequentlydetected, ranging from 24% at HP to 88% at LD. Heptachlor anddieldrin were detected fairly frequently at all three locations,

Table 2. Summary of measured gas- and particle-phase air concentrations (pg/m3) and rain concentrations (ng/L)a
Horn Point (HP) Lewes (LD) Dover (DV)
AVE GM MED MIN MAX%
Det AVE GM MED MIN MAX%
Det AVE GM MED MIN MAX %Det
Gas phase (pg/m3) (n¼ 123) (n¼ 95) (n¼ 47)Aldrin 4.3 4.3 3.9 2.5 6.1 2 0 0cis-Chlordane 22 19 18 3.5 71 95 27 21 20 3.2 127 96 25 20 18 3.8 120 96trans-Chlordane 24 20 20 4.0 97 93 31 24 22 1.6 155 99 25 23 19 3.2 90 984,40-DDDb 37 33 35 25 54 2 0 04,40-DDEc 16 12 14 7.0 52 29 27 19 20 4.5 109 83 80 74 56 7.9 230 894,40-DDTd 0 0 0Dieldrin 84 61 56 2.1 394 74 60 33 32 1.6 314 98 64 54 41 4.2 263 81a-HCHe 31 22 25 4.6 142 99 23 19 19 2.0 61 100 24 23 22 5.5 53 100g-HCHf 37 27 28 4.0 150 97 52 28 28 2.2 382 100 83 54 49 1.2 343 81Heptachlor 25 15 16 4.0 568 72 23 20 19 3.2 64 95 19 17 14 3.3 92 72Heptachlor epoxide 7.7 5.6 5.8 1.7 31 47 5.6 4.6 4.9 1.4 14 60 11 8.7 8.8 1.7 28 57Mirex 10 10 10 10 10 1 13 4.1 6.5 1.3 54 14 8.1 6.9 6.7 2.8 16 9cis-Nonachlor 2.0 1.9 1.9 0.9 3.1 24 2.8 2.3 2.3 0.80 10 88 2.4 2.1 2.1 1.0 6.9 49trans-Nonachlor 4.8 4.1 4.2 1.5 13 62 21 17 15 1.9 103 96 18 15 13 1.5 76 96Oxychlordane 18 15 15 2.5 50 93 4.8 3.9 4.1 1.3 14 86 7.0 6.9 5.8 1.6 20 57Particle phase
(pg/m3)(n¼ 91)g (n¼ 95) (n¼ 47)
Aldrin 0 0 0cis-Chlordane 2.3 2.2 2.2 0.7 4 32 0 0trans-Chlordane 2.2 2.2 2.2 1.4 4 37 0 04,40-DDD 0 0 04,40-DDE 0 0 04,40-DDT 0 0 0Dieldrin 0 1.6 1.6 1 0a-HCH 1.2 1.2 1 0 0g-HCH 7.0 4.7 4.7 1.3 20 7 0 17.1 13.9 17.1 7.1 27 2Heptachlor 0 0 0Heptachlor epoxide 4.8 4.8 1 0 0Mirex 2.2 2.2 2.2 1.9 3.7 29 0 0cis-Nonachlor 4.0 4.0 1 0 0trans-Nonachlor 2.2 1.7 2.4 0.5 4 3 0 0Oxychlordane 0 0 0Dissolved rain
(ng/L)(n¼ 245) (n¼ 178) (n¼ 71)
Aldrin 0 2.7 2.7 1 0cis-Chlordane 1.4 1.1 1.3 0.4 3 2 0.9 0.8 0.6 0.4 2 3 1.5 1.2 1.0 0.5 6 23trans-Chlordane 1.6 1.6 1.6 1.5 1.7 1 3.3 3.3 1 1.6 1.3 1.3 0.5 5.8 354,40-DDD 0 0 04,40-DDE 19 12 12 2.8 90 10 33 22 26 6.2 66 2 12 7.6 7.4 2.3 63 354,40-DDT 14 14 0.4 0 0Dieldrin 1.4 1.0 1.3 0.1 3 4 1.2 0.9 1.0 0.2 3 5 2.0 1.5 1.5 0.5 10 49a-HCH 0.8 0.6 0.5 0.3 2 3 2.9 1.1 1.1 0.2 11 3 1.3 0.9 0.9 0.3 3.3 18g-HCH 2.9 2.0 1.8 0 22 20 35 35 1 5.0 2.7 2.7 0.5 35 61Heptachlor 19 18 22 10 25 1.2 33 18 40 1.3 49 2 0Heptachlor epoxide 56 56 0.4 18 18 1 0Mirex 0 30 17 30 3.0 57 2 0cis-Nonachlor 0 0 0.9 0.9 0.9 0.7 1.1 3trans-Nonachlor 0 0 1.3 1.2 1.0 0.6 2.2 10Oxychlordane 2.3 2.3 0.4 0 1.7 1.5 1.7 0.9 2.5 3
a AVE¼ average; GM¼ geometric mean; MED¼median; MIN¼minimum; MAX¼maximum; % Det¼ percent detection.b 1-Chloro-4-[2,2-dichloro-1-(4-chlorophenyl)ethyl]benzene.c 1-Chloro-4-[2,2-dichloro-1-(4-chlorophenyl)ethenyl]benzene.d 1-Chloro-4-[2,2,2-trichloro-1-(4-chlorophenyl)ethyl]benzene.e (1a,2a,3b,4a,5b,6b)-1,2,3,4,5,6-hexachlorocyclohexane.f (1a,2a,3b,4a,5a,6b)-1,2,3,4,5,6-hexachlorocyclohexane, also known as lindane.g Filter samples from the year 2000 at Horn Point were not analyzed.
1898 Environ. Toxicol. Chem. 29, 2010 A. Goel et al.
ranging from 72 to 95% for heptachlor and 74 to 98% fordieldrin, with the highest number of detections observed atLD for both compounds. Heptachlor concentrations weresimilar to the chlordane components, averaging from 19 pg/m3 at DV to 25 pg/m3 at HP, whereas dieldrin concentrationswere nearly twice as high, averaging from 60 pg/m3at LD to84 pg/m3at HP.
The degradation products, heptachlor epoxide and oxychlor-dane, were observed somewhat less frequently than their parent
compounds, heptachlor, and cis- and trans-chlordane, and atlower average concentrations of less than 11 pg/m3 and 18 pg/m3, respectively. The parent compound 4,40-DDT was notdetected above the limit of quantitation in any of the 265 airsamples collected, and its degradation product 4,40-DDD wasdetected in only two samples from HP. However, 4,40-DDE, amore stable degradation product, was detected frequently atboth LD (83%) and DV (89%), but much less frequently at HP(29%) and at average concentrations ranging from 16 pg/m3 at

Legacy pesticides in the air of Delaware and Chesapeake Bays Environ. Toxicol. Chem. 29, 2010 1899
HP to 80 pg/m3 at DV. Mirex was detected infrequently at allthree sites at average concentration ranging from 8.1 to 13 pg/m3, and aldrin was detected in only two samples from HP with amaximum concentration of 6.1 pg/m3.
Concentrations in precipitation
Observed dissolved pesticide concentrations in rain samplesreflect the low aqueous solubility of the legacy pesticidesincluded in the present study (Table 1). In 67% of all rainsamples, concentrations of legacy pesticides were below theirlimits of quantitation. At the HP site, only one compound wasdetected in 32% of rain samples, at the LD site only 14%, but atthe DV site, 82% of samples contained at least one compound.In addition, the three sites exhibited a slightly different profilewith respect to the compounds most frequently detected. At HP,g-HCH was detected most frequently at 20% followed by 4,40-DDE at 10%, but the average g-HCH concentrations wereconsiderably lower (2.9 ng/L) than 4,40-DDE concentrations(19 ng/L). Furthermore, the compound with the highest max-imum concentration at HP was 4,40-DDE (90 ng/L). All theremaining compounds were detected in less than 5% of samples(Table 2). The solubility of g-HCH is 7.3 g/m3, the highest ofany of the pesticides included in the present study; therefore,more frequent detection of this chemical in rain is reasonable.
At the LD site, all compounds were detected in less than 5%of samples and the most frequently detected compound wasdieldrin. In contrast to HP, g-HCH was only detected in onesample at the LD site and 4,40-DDE was detected in only threesamples. At the DV site, overall average concentrations werehigher than at either the HP or LD sites, and the frequency ofdetections was much larger. Like HP, g-HCH was detected mostfrequently (61% of samples); a-HCH was detected in 18% ofsamples; dieldrin in 49% of samples; and 4,40-DDE and trans-chlordane in 35% of samples. This is somewhat unexpected asthe solubility of 4,40-DDE and trans-chlordane are an order ofmagnitude lower than the solubility of g-HCH. Cis-chlordaneand trans-nonachlor were also found in 23 and 10% of samples,respectively. For samples with concentrations above the detec-tion limits, concentrations of a- and g-HCH and 4,40-DDE atDV were 2 to more than 10 times greater than average con-centrations detected at the Integrated Atmospheric DepositionNetwork (IADN) in the Great Lakes [32].
Such drastic differences in the number of compoundsdetected between sites, especially for nearby sites LD andDV, was an unanticipated result. Rain sample volumes col-lected in the present study were minimal for the purpose oflegacy pesticide concentration measurements. For example, inthe present study, samples were collected over 24 h, whereas theIADN precipitation collection protocol uses the same type ofcollector as the present study but uses a 28-d composite rainsample [32]. The median rain sample volumes were signifi-cantly different (p< 0.05); the median volume at the DV site(2.3 L) was 43% greater than the HP site (1.3 L) and 61% greaterthan the LD site (0.9 L). A regression analysis of sample volumecollected per rainfall amount indicated that no efficiency differ-ences existed between the three samplers (r2 � 0.99); the slopesfor all three sites were virtually identical. Thus, the differencesin the frequency of compound detection between the DV andLD sites is likely due to somewhat higher rainfall rates andtherefore larger sample volumes at the DV site, leading topesticide mass collection above the limit of quantitation in moresamples. In the present study, a more in-depth analysis of gasphase air concentrations, where the dataset is more robust, ismore likely to be useful for site comparisons and for evaluation
of long-range versus local sources of legacy pesticides. Theremaining discussion is limited to gas-phase air concentrationresults for the most frequently detected pollutants.
Spatial analysis of air concentrations
Local source strength of legacy pesticides is dependent uponthe rate and duration of use, but these data for Maryland andDelaware are not available. The Delmarva Peninsula has a lowpopulation density, and historically land use has been primarilyagriculture. Therefore, it is reasonable to expect that legacypesticides were used in response to potential or actual pestpressures in the production of grain, vegetable, and fruit crops.Local source strength is also a function of soil half life. Soils onthe Delmarva are generally sandy and lower in organic carbonthan in other agricultural regions of the U.S., such as theMidwest; thus, release of these hydrophobic chemicals isexpected to be greater as soils are disturbed.
Although no official definition of local, regional and long-range sources exists, the United Nations defines long-rangetransport of air pollutants as the ‘‘atmospheric transport ofair pollutants within a moving air mass for a distance ofgreater than 100 kilometers’’ ([33]; http://unstats.un.org/unsd/environmentgl/). Therefore, for the purposes of this dis-cussion, local sources are defined as between 0 and 10 km,regional sources are between 10 and 100 km, and long-rangesources are >100 km. For all three sites, the 10 km local sourcearea is limited to the Delmarva Peninsula or nearby surfacewaters. The HP site would include the city of Cambridge,Maryland, the LD site would include the city of Lewes,Delaware, and the DV site would include the city of Dover,Delaware, and the Dover Air Force Base, all relatively smallcites as described above. Potential regional sources of <100 kmwould include Washington, DC, and Baltimore, Maryland, forthe HP site, Baltimore and the Wilmington, Delaware, andPhiladelphia, Pennsylvania areas would be included for the DVsite, but only Wilmington would be included for LD.
Statistical analysis of all gas-phase air concentration obser-vations at the three sites indicates that some compounds havelong-range or regional sources, whereas others may have somecontributions from local sources (Fig. 2). No significant differ-ences were observed between sites for cis-chlordane, trans-chlordane, trans-nonachlor, or a-HCH, indicating long-range ordistant regional sources provided significant contributions to thesignals observed at each site and that no strong local sourcesexisted. However, a comparison of the ratio of trans-chlorda-ne:cis-chlordane (TC/CC) found that the median values of 1.06,1.20, and 1.12 were significantly different from each other (p�0.01) for HP, LD, and DV, respectively (Fig. 2). The medianTC/CC values observed at our sites are similar to annualaverages seen at urban centers in the Great Lakes, where ratiosof 1.22 and 1.13 were found at Toronto, Canada, and Chicago,Illinois, USA, during the same time period as the present study[34]. Results suggest that nearby urban centers like Baltimore,Washington, Wilmington, and Philadelphia are probablyregional sources of chlordanes to our sites.
The ratio of TC/CC in technical chlordane is 1.16, but thepredicted ratio in air reflecting component vapor pressures is1.63 to 1.85 at 20 or 258C, respectively [17,35]. An examinationof temporal trends in TC/CC ratio values (Fig. 3) reveals that,with the exception of one sample from HP, all ratios were wellbelow that predicted from technical chlordane. This is to beexpected, because global background chlordane profiles havebecome more depleted in TC since these products were banned[36]. The LD site did not go below a value of 1.0 in any sample,
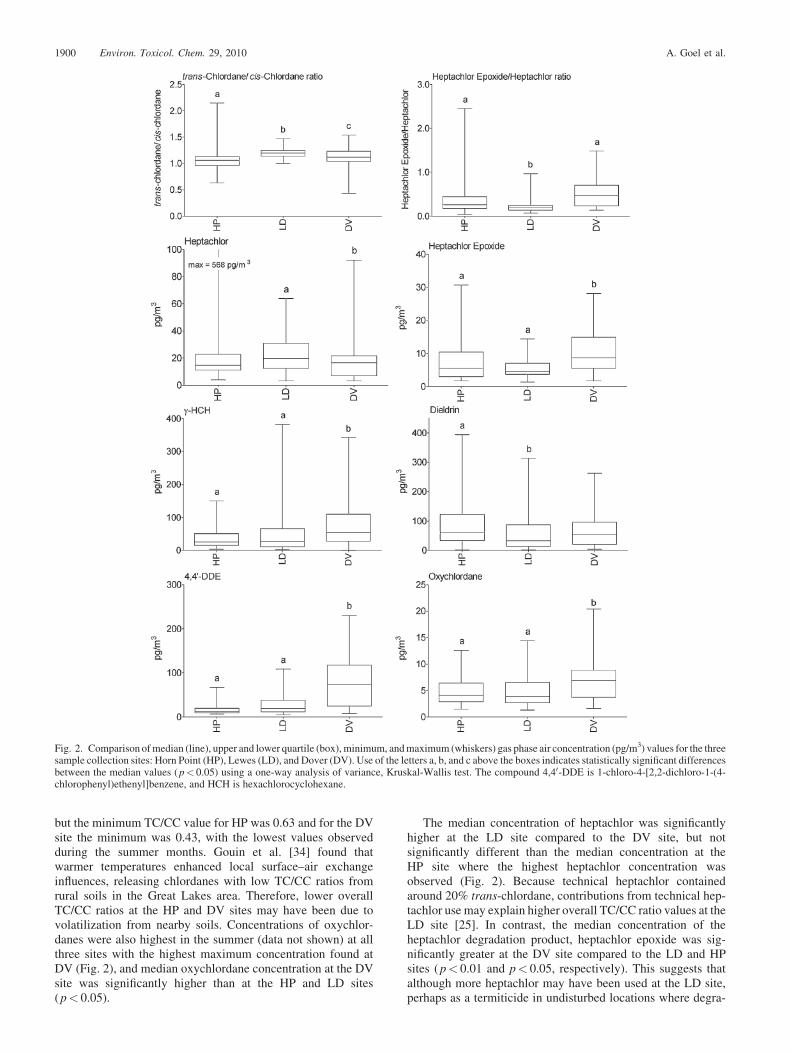
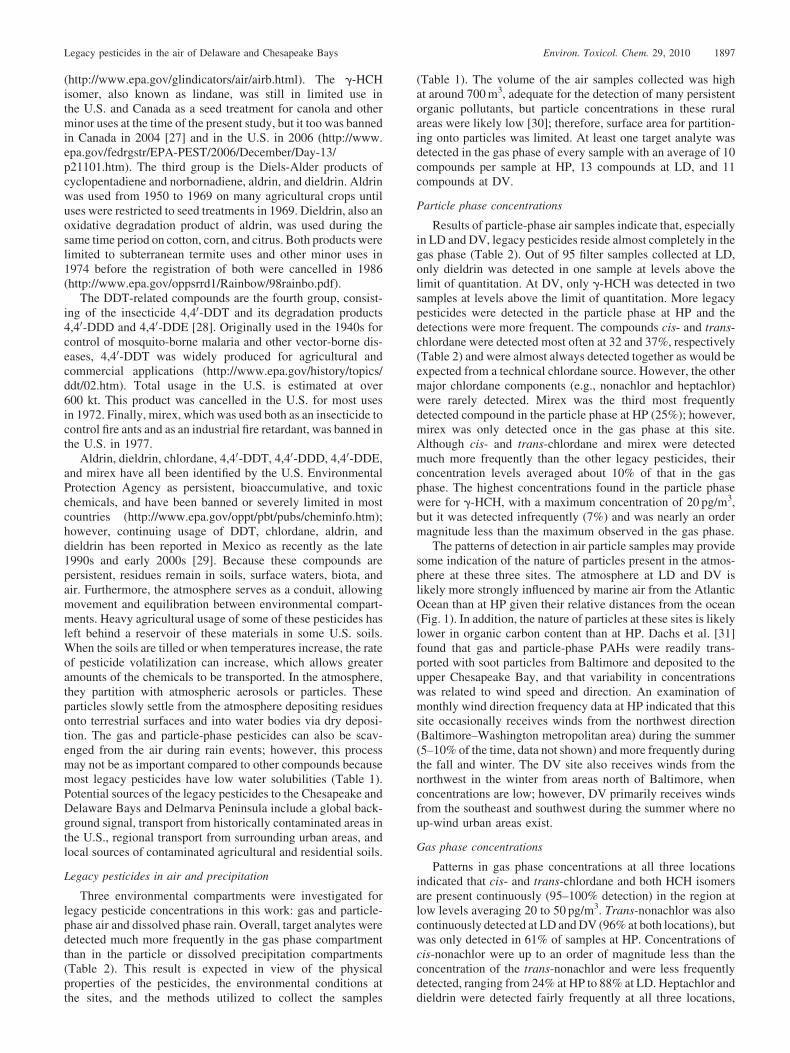
Fig. 2. Comparison of median (line), upper and lower quartile (box), minimum, and maximum (whiskers) gas phase air concentration (pg/m3) values for the threesample collection sites: Horn Point (HP), Lewes (LD), and Dover (DV). Use of the letters a, b, and c above the boxes indicates statistically significant differencesbetween the median values (p< 0.05) using a one-way analysis of variance, Kruskal-Wallis test. The compound 4,40-DDE is 1-chloro-4-[2,2-dichloro-1-(4-chlorophenyl)ethenyl]benzene, and HCH is hexachlorocyclohexane.
1900 Environ. Toxicol. Chem. 29, 2010 A. Goel et al.
but the minimum TC/CC value for HP was 0.63 and for the DVsite the minimum was 0.43, with the lowest values observedduring the summer months. Gouin et al. [34] found thatwarmer temperatures enhanced local surface–air exchangeinfluences, releasing chlordanes with low TC/CC ratios fromrural soils in the Great Lakes area. Therefore, lower overallTC/CC ratios at the HP and DV sites may have been due tovolatilization from nearby soils. Concentrations of oxychlor-danes were also highest in the summer (data not shown) at allthree sites with the highest maximum concentration found atDV (Fig. 2), and median oxychlordane concentration at the DVsite was significantly higher than at the HP and LD sites(p< 0.05).
The median concentration of heptachlor was significantlyhigher at the LD site compared to the DV site, but notsignificantly different than the median concentration at theHP site where the highest heptachlor concentration wasobserved (Fig. 2). Because technical heptachlor containedaround 20% trans-chlordane, contributions from technical hep-tachlor use may explain higher overall TC/CC ratio values at theLD site [25]. In contrast, the median concentration of theheptachlor degradation product, heptachlor epoxide was sig-nificantly greater at the DV site compared to the LD and HPsites (p< 0.01 and p< 0.05, respectively). This suggests thatalthough more heptachlor may have been used at the LD site,perhaps as a termiticide in undisturbed locations where degra-

Fig. 3. Comparison of trans-chlordane:cis-chlordane ratio values in the gasphase for the sample collection sites: Horn Point (HP), Lewes (LD), andDover (DV).
Legacy pesticides in the air of Delaware and Chesapeake Bays Environ. Toxicol. Chem. 29, 2010 1901
dation would be limited, heptachlor may have been applied asan insecticide to soils in the DV area where it more readilyunderwent microbial degradation to heptachlor epoxide. Acomparsion of heptachlor epoxide:heptachlor ratios at the threesites reveals that the median values at both the HP and DV siteswere significantly higher than at the LD site (p< 0.01 andp< 0.001, respectively).
The median concentrations of g-HCH and 4,40-DDE werealso significantly higher at the DV site than at the other two sites(p< 0.01 and p< 0.001, respectively). From a spatial perspec-tive, the Dover region appears to have stronger local sources ofmany of the legacy pesticides when compared to the other twosites. However, it is unclear if this is due to greater local sourcesor from more distant regional sources such as Wilmington orPhiladelphia. One notable exception, was dieldrin, where themedian concentration was significantly higher at the HP site(p< 0.01) compared to the LD site but not significantly differ-ent than the DV site, indicating the presence of local sources atthe HP site. Dieldrin is both the degradation product of aldrinand was used directly on agricultural crops. Although informa-tion on specific use rates or overall usage is unavailable, theentire Delmarva Peninsula is a historically agricultural regiondating back to the colonial period. Therefore, it is not surprisingto discover that these legacy pesticides were used on soils nearour sites.
Relating air concentration to temperature
A visual analysis of temporal trends in air concentrations atthe three sites during the sample collection period indicated thatair concentrations in the region do increase with average dailytemperature (Supplemental Data, Fig. S1), as has been observedin numerous other studies. However, it is not possible toquantify the effect of local temperature changes on air concen-tration without a more detailed analysis. A common approach toevaluate the temperature
lnP ¼ �DHvap
R
1
T
� �þ C (1)
dependence of atmospheric concentrations of organic com-pounds is to utilize the Clausius-Clapeyron equation (Eqn. 1),which describes the relationship between compound partialpressures, temperature, and the enthalpy of vaporization
[16,17,37–39]. If the atmospheric background concentrationis low, and contamination in the local area is high, then the slopeof ln P versus 1/T will reflect the thermodynamics of air–surfacepartitioning [40], where P is the vapor pressure of the compound(Pa), T is the temperature (K), the slope is equal to � DHvap/R orthe enthalpy of vaporization (kJ/mol) divided by the universalgas constant, and C is the intercept. When applied to ambient airconcentration measurements, DHvap is the enthalpy of phasechange between air and the sorbed state, DHAS. A shallowslope or a weak dependence on temperature indicates theinfluence of distant sources; whereas, a steep slope indicatesthat air concentrations are controlled by emissions from localsources [40].
The Clausius-Clapeyron equation can be modified (Eqn. 2)and used to perform a regression analysis of ln P versus 1/T,where T is the average ambient temperature and t is the samplecollection time (in Julian days relative to January 1, 2000). Thecoefficient a1 (� DHvap/R) was used to determine the enthalpyof phase change, DHAS (kJ/mol). The coefficient a2, (d�1)describes the rate of change of the partial pressures, that is,the observed concentrations, and is used to calculate dissipationhalf-life (t1/2¼ ln2/a2). For a compound whose concentration(i.e., partial pressure) is increasing with time, a2 will be positive,and negative for a compound whose concentration is decreas-ing. Because the legacy pesticides are no longer in use inthe U.S., the levels are expected to be on the decline and a2
is expected to be negative. However, g-HCH was still registeredfor limited uses in the U.S. and Canada during the samplingperiod of the present study; therefore, the rate of observeddecline may be slower than some other pesticides.
lnP ¼ a0 þ a1
1
T
� �þ a2t (2)
The modified Clausius-Clapeyron equation (Eqn. 2) wasmoderately effective at describing the changes in the partialpressure of the legacy pesticides, indicating that temperature isan important factor governing air concentrations in this region(Supplemental Data, Table S1) [41,42]. At the HP site, theregression results for all compounds were highly significant(p< 0.0001) except for 4,40-DDE (p¼ 0.01). At the LD site, allcompounds were highly significant except for heptachlor epox-ide (p¼ 0.01), and at the DV site, all compounds were highlysignificant (p� 0.0006) except for oxychlordane (p¼ 0.04) andg-HCH, heptachlor, and cis-nonachlor, which were not signifi-cant. Although the regression results were significant for almostall chemicals, the coefficients of determination (r2) values weregenerally less than 0.60 when using Equation 2. At HP, all r2
values were less than or equal to 0.57 except for cis-nonachlorwhere r2 was 0.70. At LD, all r2 values were less than or equal to0.51, and at the DV site, all r2 values were less than or equal to0.61. These results indicate that temperature does influence theobserved concentrations, but that it can only explain some of thevariability in observed concentrations for most of the legacycompounds at the three sites.
Inclusion of wind speed and direction
Using multiple linear regression analysis to evaluate theinfluence of parameters other than temperature on atmosphericlevels of contaminants has been found to improve predictionsfor PCBs in Great Lakes [43] and organochlorines in Turkey[44]. The potential influence of local sources on levels of legacypesticides was investigated by including wind speed, WS (m/s)and wind direction, WD (degrees) in the Clausius-Clapeyron

1902 Environ. Toxicol. Chem. 29, 2010 A. Goel et al.
equation (Eqn. 3).
lnP ¼ a0 þ a1
1
T
� �þ a2t þ b1 cosWDð Þ þ b2 sinWDð Þ
þ b3 LnWSð Þ (3)
Using the cosine and sine function of WD enables a clearerdetermination of the effect of wind direction, and the location ofthe sources can be identified with greater precision. If b3 ispositive and the values of the coefficients are significant(p< 0.05), then wind erosion from local sources (fields andfallow lands) is important, resulting in increased air concen-trations with elevated wind speed. Inclusion of the wind speedand wind direction parameters in Equation 3 improved the r2
values only slightly (5–9%) for most chemicals at the threelocations. At the HP location, only 4,40-DDE r2 values werenoticeably improved (18%). Overall, cis-nonachlor also had thelargest r2 value of any chemical in the present study (0.81) forEquation 3. At the LD site, the r2 value for heptachlor epoxidewas improved by 18%. At the DV site, using Equation 3improved the r2 value (26%) for oxychlordane only. The 24-h length of the air samples collected in the present study likely
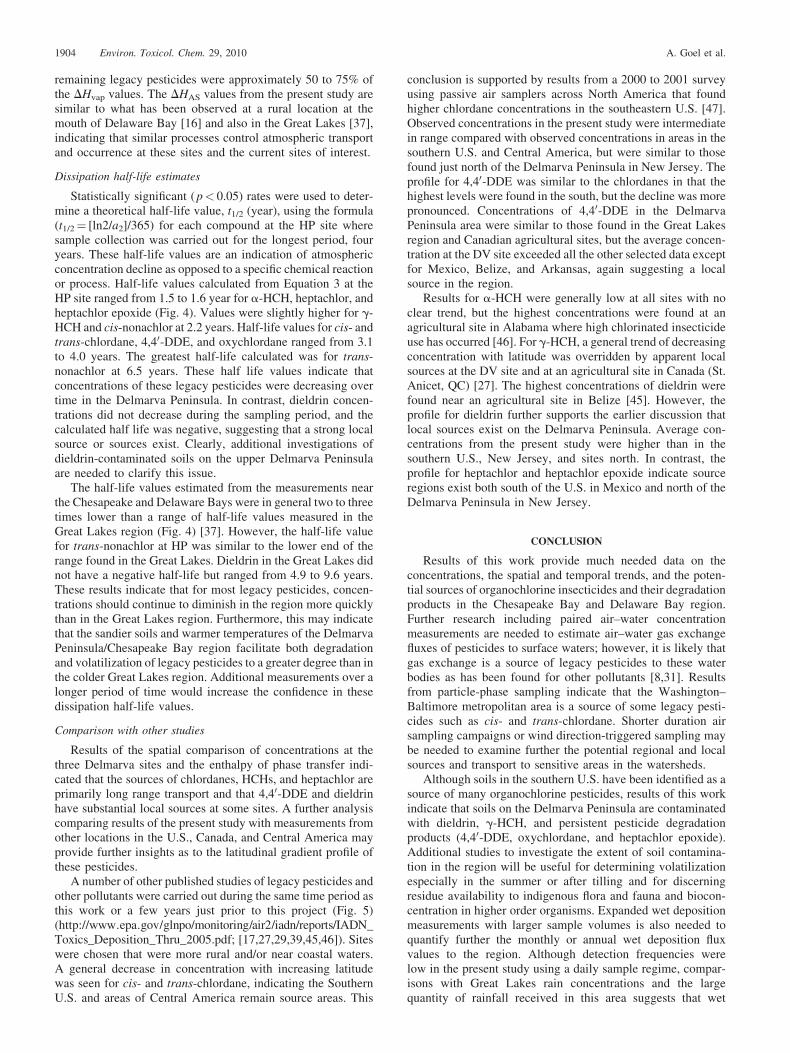
Fig. 4. Comparison of published enthalpy of vaporization (DHvap kJ/mol) [15,45,46Point (HP), Lewes (LD), and Dover (DV). Also presented are calculated half-life (t1/2
observed at seven Great Lakes sites [32]. The compound 4,40-DDE is 1hexachlorocyclohexane.
reduces the usefulness of wind-related data as wind conditionscan vary widely throughout the day at all three sites. Additionalstudies with shorter sample collection periods or wind-direc-tion-triggered sampling would likely be necessary to discernmore detailed information concerning local and regional sour-ces.
Long-range transport versus local sources
An examination of the enthalpy of phase change (DHAS)values calculated from the two modified Clausius-Clapeyronequations in comparison with DHvap further supports the con-clusion that most of the legacy pesticides observed in air inDelmarva region originate from long-range transport sources(Fig. 4). As described by Wania et al. [40], the low values ofDHAS compared with DHvap for most of the compounds rep-resent a shallow slope condition or distant sources. At the HPsite, a-HCH has a slightly negative DHAS value using Equation2 and only 1.4 kJ/mol using Equation 3, indicating that levels ofthis compound are governed by background air concentrationswith no significant local or regional sources. Although theDHAS
values of a-HCH at the LD and DV sites are positive, they arethe lowest values for all the analytes where regression analysis
] with enthalpy of phase change (DHAS, kJ/mol) for three sampling sites: Horn, year) values for Horn Point compared with range of published half-life values-chloro-4-[2,2-dichloro-1-(4-chlorophenyl)ethenyl]benzene, and HCH is

Legacy pesticides in the air of Delaware and Chesapeake Bays Environ. Toxicol. Chem. 29, 2010 1903
results were significant. However, results for a-HCH may havebeen influenced by sampling losses under high temperatureconditions, thereby lowering the slope values for this chemical.Other pesticides with low DHAS values are heptachlor at boththe HP and LD sites and 4,40-DDE at the HP site.
The DHAS for dieldrin, especially at the HP and LD sites, issimilar to the published DHvap, indicating that volatilization
Fig. 5. Comparison of average gas-phase air concentrations from the present work (Hduring the same time period or few years just prior the present study. Data from TapacMuscle Shoals, Alabama [46] are from a variety of sources. Data from Cape May, NSandy Hook, New Jersey, are from Gioia et al. [16], except values for trans- and cirepresent the geometric mean of gas plus particle phase concentrations. Data fromIntegrated Atmospheric Deposition Network (http://www.epa.gov/glnpo/moremaining Canadian sites and Egbert, Ontario (Canada) are from Yao et al. [27]. N
from local sources is a likely contributor to the observed airconcentrations and that dieldrin was used in the region in thepast. At the DV site, the DHAS for 4,40-DDE is also close to theDHvap, which strongly suggests that a local source is a majorcontributor to the observed concentrations. This local sourcemay be contaminated soils where presumably DDT was used formosquito control in the region. The DHAS values for the
orn Point, Lewes, Dover) with others collected in North and Central Americahula, Chiapas (Mexico) [29], Belmopan, Belize [45], Rohwer, Arkansas [39],ew Jersey (listed as Delaware Bay in the source), Pinelands, New Jersey, ands-chlordane for Sandy Hook, New Jersey, are from Offenberg et al. [17] and
Point Petre, Ontario (Canada), and Eagle Harbor, Michigan, are from thenitoring/air2/iadn/reports/IADN_Toxics_Deposition_Thru_2005.pdf). The
A¼ not available, and ND¼ not detected.
1904 Environ. Toxicol. Chem. 29, 2010 A. Goel et al.
remaining legacy pesticides were approximately 50 to 75% ofthe DHvap values. The DHAS values from the present study aresimilar to what has been observed at a rural location at themouth of Delaware Bay [16] and also in the Great Lakes [37],indicating that similar processes control atmospheric transportand occurrence at these sites and the current sites of interest.
Dissipation half-life estimates
Statistically significant (p< 0.05) rates were used to deter-mine a theoretical half-life value, t1/2 (year), using the formula(t1/2¼ [ln2/a2]/365) for each compound at the HP site wheresample collection was carried out for the longest period, fouryears. These half-life values are an indication of atmosphericconcentration decline as opposed to a specific chemical reactionor process. Half-life values calculated from Equation 3 at theHP site ranged from 1.5 to 1.6 year for a-HCH, heptachlor, andheptachlor epoxide (Fig. 4). Values were slightly higher for g-HCH and cis-nonachlor at 2.2 years. Half-life values for cis- andtrans-chlordane, 4,40-DDE, and oxychlordane ranged from 3.1to 4.0 years. The greatest half-life calculated was for trans-nonachlor at 6.5 years. These half life values indicate thatconcentrations of these legacy pesticides were decreasing overtime in the Delmarva Peninsula. In contrast, dieldrin concen-trations did not decrease during the sampling period, and thecalculated half life was negative, suggesting that a strong localsource or sources exist. Clearly, additional investigations ofdieldrin-contaminated soils on the upper Delmarva Peninsulaare needed to clarify this issue.
The half-life values estimated from the measurements nearthe Chesapeake and Delaware Bays were in general two to threetimes lower than a range of half-life values measured in theGreat Lakes region (Fig. 4) [37]. However, the half-life valuefor trans-nonachlor at HP was similar to the lower end of therange found in the Great Lakes. Dieldrin in the Great Lakes didnot have a negative half-life but ranged from 4.9 to 9.6 years.These results indicate that for most legacy pesticides, concen-trations should continue to diminish in the region more quicklythan in the Great Lakes region. Furthermore, this may indicatethat the sandier soils and warmer temperatures of the DelmarvaPeninsula/Chesapeake Bay region facilitate both degradationand volatilization of legacy pesticides to a greater degree than inthe colder Great Lakes region. Additional measurements over alonger period of time would increase the confidence in thesedissipation half-life values.
Comparison with other studies
Results of the spatial comparison of concentrations at thethree Delmarva sites and the enthalpy of phase transfer indi-cated that the sources of chlordanes, HCHs, and heptachlor areprimarily long range transport and that 4,40-DDE and dieldrinhave substantial local sources at some sites. A further analysiscomparing results of the present study with measurements fromother locations in the U.S., Canada, and Central America mayprovide further insights as to the latitudinal gradient profile ofthese pesticides.
A number of other published studies of legacy pesticides andother pollutants were carried out during the same time period asthis work or a few years just prior to this project (Fig. 5)(http://www.epa.gov/glnpo/monitoring/air2/iadn/reports/IADN_Toxics_Deposition_Thru_2005.pdf; [17,27,29,39,45,46]). Siteswere chosen that were more rural and/or near coastal waters.A general decrease in concentration with increasing latitudewas seen for cis- and trans-chlordane, indicating the SouthernU.S. and areas of Central America remain source areas. This
conclusion is supported by results from a 2000 to 2001 surveyusing passive air samplers across North America that foundhigher chlordane concentrations in the southeastern U.S. [47].Observed concentrations in the present study were intermediatein range compared with observed concentrations in areas in thesouthern U.S. and Central America, but were similar to thosefound just north of the Delmarva Peninsula in New Jersey. Theprofile for 4,40-DDE was similar to the chlordanes in that thehighest levels were found in the south, but the decline was morepronounced. Concentrations of 4,40-DDE in the DelmarvaPeninsula area were similar to those found in the Great Lakesregion and Canadian agricultural sites, but the average concen-tration at the DV site exceeded all the other selected data exceptfor Mexico, Belize, and Arkansas, again suggesting a localsource in the region.
Results for a-HCH were generally low at all sites with noclear trend, but the highest concentrations were found at anagricultural site in Alabama where high chlorinated insecticideuse has occurred [46]. For g-HCH, a general trend of decreasingconcentration with latitude was overridden by apparent localsources at the DV site and at an agricultural site in Canada (St.Anicet, QC) [27]. The highest concentrations of dieldrin werefound near an agricultural site in Belize [45]. However, theprofile for dieldrin further supports the earlier discussion thatlocal sources exist on the Delmarva Peninsula. Average con-centrations from the present study were higher than in thesouthern U.S., New Jersey, and sites north. In contrast, theprofile for heptachlor and heptachlor epoxide indicate sourceregions exist both south of the U.S. in Mexico and north of theDelmarva Peninsula in New Jersey.
CONCLUSION
Results of this work provide much needed data on theconcentrations, the spatial and temporal trends, and the poten-tial sources of organochlorine insecticides and their degradationproducts in the Chesapeake Bay and Delaware Bay region.Further research including paired air–water concentrationmeasurements are needed to estimate air–water gas exchangefluxes of pesticides to surface waters; however, it is likely thatgas exchange is a source of legacy pesticides to these waterbodies as has been found for other pollutants [8,31]. Resultsfrom particle-phase sampling indicate that the Washington–Baltimore metropolitan area is a source of some legacy pesti-cides such as cis- and trans-chlordane. Shorter duration airsampling campaigns or wind direction-triggered sampling maybe needed to examine further the potential regional and localsources and transport to sensitive areas in the watersheds.
Although soils in the southern U.S. have been identified as asource of many organochlorine pesticides, results of this workindicate that soils on the Delmarva Peninsula are contaminatedwith dieldrin, g-HCH, and persistent pesticide degradationproducts (4,40-DDE, oxychlordane, and heptachlor epoxide).Additional studies to investigate the extent of soil contamina-tion in the region will be useful for determining volatilizationespecially in the summer or after tilling and for discerningresidue availability to indigenous flora and fauna and biocon-centration in higher order organisms. Expanded wet depositionmeasurements with larger sample volumes is also needed toquantify further the monthly or annual wet deposition fluxvalues to the region. Although detection frequencies werelow in the present study using a daily sample regime, compar-isons with Great Lakes rain concentrations and the largequantity of rainfall received in this area suggests that wet

Legacy pesticides in the air of Delaware and Chesapeake Bays Environ. Toxicol. Chem. 29, 2010 1905
deposition could also be an important source of legacy pesti-cides to the larger watershed. Dissipation half-life values basedon temporal trends in gas phase concentrations at Horn Point areencouraging as most are less than 10 years except for dieldrin,which did not decline during the collection period. If globalusage of these compounds continues to decline as expected,then concentrations of most legacy pesticides are likely todecrease to below 10% of today’s values over the next 30 to40 years.
SUPPLEMENTAL DATA
Table S1. Enthalpy of phase change (DHAS, kJ/mol)� stan-standard deviation and half-life (t1/2, year) standard deviationcalculated from two modified Clausius-Clapyeron equationscompared with literature values of enthalpies of vaporizationand octanol–air partitioning and with DHAS values from CapeMay, NJ, and the Great Lakes.
Figure S1. Air temperature (8C) and air concentrations (pg/m3) of g-hexachlorocyclohexane (g-HCH), dieldrin, 4,40-DDE(1-chloro-4-[2,2-dichloro-1-(4-chlorophenyl)ethenyl]benzene),and trans-chlordane measured during the study period for allthree sites. Dieldrin was not measured in 2000 and 4,40-DDEwas only detected once in 2000 at Horn Point (HP). Samplecollections began in Lewes (LD) in 2001 and at Dover (DV) in2002. (409.7 KB PDF).
Acknowledgement—Partial funding for this project was provided by grantsfrom the Maryland Water Resources Research Center, the CooperativeInstitute for Coastal and Estuarine Environmental Technology, and USDA–ARS intramural research. Logistical support for sampling and ancillary dataat Lewes, DE was provided by the NOAA Air Resources Laboratory, underthe auspices of the National Atmospheric Deposition Program–AtmosphericIntegrated Research Monitoring Network (NADP-AIRMoN). A portion ofthe 2000 population density data used in Figure 1 was obtained from theCenter for International Earth Science Information Network at ColumbiaUniversity (http://sedac.ciesin.columbia.edu/usgrid/). Kusuma Prabhakaraassisted with Figure 1, and Carrie Green is acknowledged for her assistancewith SAS analyses. Mention of specific products or supplies is foridentification and does not imply endorsement by U.S. Department ofAgriculture to the exclusion of other suitable products or suppliers.
REFERENCES
1. Foster GD, Lippa KA, Miller CV. 2000. Seasonal concentrations oforganic contaminants at the fall line of the Susquehanna River basin andestimated fluxes to northern Chesapeake Bay, USA. Environ ToxicolChem 19:992–1001.
2. Liu B, McConnell LL, Torrents A. 2002. Herbicide and insecticideloadings from the Susquehanna River to the Northern Chesapeake Bay.J Agric Food Chem 50:4385–4392.
3. Ko FC, Baker JE. 2004. Seasonal and annual loads of hydrophobicorganic contaminants from the Susquehanna River basin to theChesapeake Bay. Mar Pollut Bull 48:840–851.
4. Goel A, McConnell LL, Torrents A. 2005. Wet deposition of current usepesticides at a rural location on the Delmarva Peninsula: Impact of rain-fall patterns and agricultural activity. J Agric Food Chem 53:7915–7924.
5. Goel A, McConnell LL, Torrents A, Scudlark J, Simonich S. 2006. Sprayirrigation of treated municipal wastewater as a potential source ofatmospheric PBDEs. Environ Sci Technol 40:2142–2148.
6. Goel A. 2007. Contaminants in the atmosphere of the DelmarvaPeninsula: Impact of local activities and atmospheric transport. PhDthesis. University of Maryland, College Park, Maryland, USA.
7. Leister DL, Baker JE. 1994. Atmospheric deposition of organiccontaminants to the Chesapeake Bay. Atmos Environ 28:1499–1520.
8. Offenberg JH, Baker JE. 1999. Influence of Baltimore’s urbanatmosphere on organic contaminants over the northern ChesapeakeBay. J Air Waste Manag Assoc 49:959–965.
9. Offenberg JH, Baker JE. 2002. Precipitation scavenging of polychlori-nated biphenyls and polycyclic aromatic hydrocarbons along an urban toover-water transect. Environ Sci Technol 36:3763–3771.
10. Hartwell SI, Hameedi J. 2007. Magnitude and extent of contaminatedsediment and toxicity in Chesapeake Bay. NOS NCCOS 47.NOAA Technical Memorandum. U.S. Department of Commerce,Washington, DC.
11. Toschik PC, Rattner BA, McGowan PC, Christman MC, Carter DB,Hale RC, Matson CW, Ottinger MA. 2005. Effects of contaminantexposure on reproductive success of ospreys (Pandion haliaetus)nesting in Delaware River and Bay, USA. Environ Toxicol Chem24:617–628.
12. Bamford HA, Ko FC, Baker JE. 2002. Seasonal and annual air–waterexchange of polychlorinated biphenyls across Baltimore Harbor and thenorthern Chesapeake Bay. Environ Sci Technol 36:4245–4252.
13. Arzayus KM, Dickhut RM, Canuel EA. 2001. Fate of atmosphericallydeposited polycyclic aromatic hydrocarbons (PAHs) in ChesapeakeBay. Environ Sci Technol 35:2178–2183.
14. Harman-Fetcho JA, McConnell LL, Rice CP, Baker JE. 2000. Wetdeposition and air–water gas exchange of currently used pesticides to asubestuary of the Chesapeake Bay. Environ Sci Technol 34:1462–1468.
15. Kuang Z, McConnell LL, Torrents A, Meritt DM, Tobash S. 2003.Atmospheric deposition of pesticides to an agricultural watershed of theChesapeake Bay. J Environ Qual 32:1611–1622.
16. Gioia R, Offenberg JH, Gigliotti CL, Totten LA, Du S, Eisenreich SJ.2005. Atmospheric concentrations and deposition of organochlorinepesticides in the U.S. Mid-Atlantic region. Atmos Environ 39:2309–2322.
17. Offenberg JHNelson ED, Gigliotti CL, Eisenreich SJ, 2004. Chlordanesin the mid-Atlantic atmosphere: New Jersey 1997–1999. Environ SciTechnol 38:3488–3497.
18. Jones KC, de Voogt P. 1999. Persistent organic pollutants (POPs): stateof the science. Environ Pollut 100:209–211.
19. McConnell LL, Nelson E, Rice CP, Baker JE, Johnson WE, Harman JA,Bialek K. 1997. Chlorpyrifos in the air and surface water of ChesapeakeBay: predictions of atmospheric deposition fluxes. Environ ToxicolChem 31:1390–1398.
20. Environmental Protection Agency US. 2004. Test Methods forEvaluating Solid Waste, Physical/Chemical Methods 3rd ed. SW-864.Office of Solid Waste and Emergency Response, Washington, DC.
21. Shen L, Wania F. 2005. Compilation, evaluation, and selection ofphysical–chemical property data for organochlorine pesticides. J ChemEng Data 50:742–768.
22. Xiao H, Li N, Wania F. 2004. Compilation, evaluation and selection ofphysical–chemical property data for a-, b-, and g-hexachlorocyclohex-ane. J Chem Eng Data 49:173–185.
23. Paasivirta J, Sinkkonen S, Mikkelson P, Rantio T, Wania F. 1999.Estimation of vapor pressures, solubilities and Henry’s law constants ofselected persistent organic pollutants as functions of temperature.Chemosphere 39:811–832.
24. Dearth MA, Hites RA. 1991. Complete analysis of technical chlordaneusing negative ionization mass spectrometry. Environ Sci Technol25:245–254.
25. World Health Organization. 2006. Concise International ChemicalAssessment Document 70, Heptachlor. Geneva Switzerland.
26. Metcalf RL. 1955. Organic Insecticides, Their Chemistry and Mode ofAction. Interscience, New York, NY, USA.
27. Yao Y, Tuduri L, Harner T, Blanchard P, Waite D, Poissant L, Murphy C,Belzer W, Aulagnier F, Li Y-F, Sverko E. 2006. Spatial and temporaldistribution of pesticide air concentrations in Canadian agriculturalregions. Atmos Environ 40:4339–4351.
28. Spencer WF, Cliath MM. 1972. Volatility of DDT and relatedcompounds. J Agric Food Chem 20:645–649.
29. Alegria HA, Bidleman TF, Salvador-Figueroa M. 2006. Organochlorinepesticides in the ambient air of Chiapas, Mexico. Environ Pollut140:483–491.
30. Wolff GT, Kelly NA, Ferman MA, Ruthkosky MS, Stroup DP, KorsogPE. 1986. Measurements of sulfur oxides, nitrogen oxides, haze and fineparticulates at a rural site on the Atlantic coast. JAirPollutControlAssoc36:585–591.
31. Dachs J, Glenn TR, Gigliotti CL, Brunciak P, Totten LA, Nelson ED,Franz TP, Eisenreich SJ. 2002. Processes driving the short-termvariability of polycyclic aromatic hydrocarbons in the Baltimore andnorthern Chesapeake Bay atmosphere, USA. Atmos Environ 36:2281–2295.
32. Sun P, Backus S, Blanchard P, Hites RA. 2006. Temporal and spatialtrends of organochlorine pesticides in Great Lakes precipitation.EnvironSci Technol 40:2135–2141.
33. United Nations. 1996. Glossary of environmental statistics. STESA/STAT/SER.F/67. New York, NY, USA.

1906 Environ. Toxicol. Chem. 29, 2010 A. Goel et al.
34. Gouin T, Jantunen L, Harner T, Blanchard P, Bidleman TF. 2007.Spatial and temporal trends of chiral organochlorine signatures inGreat Lakes air using passive air samplers. Environ Sci Technol41:3877–3883.
35. Bidleman TF, Alegria H, Ngabe B, Green C. 1998. Trends of chlordaneand toxaphene in ambient air of Columbia, South Carolina. AtmosEnviron 32:1849–1856.
36. Bidleman TF, Jantunen LM, Helm P, Brorstrom-Lunden E, Juntto S.2002. Chlordane enantiomers and temporal trends of chlordane isomersin Arctic air. Environ Sci Technol 36:539–544.
37. Sun P, Blanchard P, Brice K, Hites RA. 2006. Atmospheric organo-chlorine pesticide concentrations near the Great Lakes: Temporal andspatial trends. Environ Sci Technol 40:6587–6593.
38. Hung H, Halsall CJ, Blanchard P, Li HH, Fellin P, Stern G, Rosenberg B.2002. Temporal trends of organochlorine pesticides in the Canadianarctic atmosphere. Environ Sci Technol 36:862–868.
39. Hoh E, Hites RA. 2004. Sources of toxaphene and other organochlorinepesticides in North America as determined by air measurements andpotential source contribution function analyses. Environ Sci Technol38:4187–4194.
40. Wania F, Haugen JE, Lei YD, Mackay D. 1998. Temperaturedependence of atmospheric concentrations of semivolatile organiccompounds. Environ Sci Technol 32:1013–1021.
41. Hinckley DA, Bidleman TF, Foreman WT, Tuschall JR. 1990.Determination of vapor pressures for nonpolar and semipolar organiccompounds from gas chromatographic retention data. J Chem Eng Data35:232–237.
42. Shoeib M, Harner T. 2002. Using measured octanol-air partitioncoefficients to explain environmental partitioning of organochlorinepesticides. Environ Toxicol Chem 21:984–999.
43. Hillery BR, Basu I, Sweet CW, Hites RA. 1997. Temporal and spatialtrends in a long-term study of gas-phase PCB concentrations near theGreat Lakes. Environ Sci Technol 31:1811–1816.
44. Sofuoglu A, Cetin E, Bozacioglu SS, Sener GD, Odabasi M. 2004. Short-term variation in ambient concentrations and gas/particle partitioning oforganochlorine pesticides in Izmir, Turkey. Atmos Environ 38:4483–4493.
45. Alegria HA, Bidleman TF, Shaw TJ. 2000. Organochlorine pesticides inambient air of Belize, Central America. Environ Sci Technol 34:1953–1958.
46. Jantunen LMM, Bidleman TF, Harner T, Parkhurst WJ. 2000.Toxaphene, chlordane, and other organochlorine pesticides in Alabamaair. Environ Sci Technol 34:5097–5105.
47. Shen L, Wania F, Lei YD, Teixeira C, Muir DCG, Bidleman TF. 2005.Atmospheric distribution and long-range transport behavior of organo-chlorine pesticides in North America. Environ Sci Technol 39:409–420.