Embed Size (px)
Citation preview

For feedback and suggestions
Corporate Communications Group
E-mail: [email protected]
Environmental Data Book
Year Ended March 31, 2019

- 1 -
Position of the Environmental Data Book
The Environmental Data Book provides information and data on the Santen Group’s environmental efforts. Related
information is also available on our Annual Report and website.
(Reporting coverage)
Japan: all facilities including sales offices
Other countries: Principal production facilities, Tampere Plant (Finland) and Suzhou Plant (China)
(Reporting period)
Japan: April 1, 2018 – March 31, 2019
other countries: January 1, 2018 – December 31, 2018
Certain information is updated after the above period
With regard to the major indicators, figures for previous fiscal years are also given.
(Important change in organization during the reporting period)
Transfer of functions of Osaka Plant to other plants completed and Osaka Plant was closed by March, 2015.
(Guidelines referenced)
This data book has been prepared with reference to the Environmental Reporting Guidelines (2018 edition, Ministry of the
Environment Japan), GHG Intensity calculation database (ver.2.6, Ministry of the Environment Japan), Environmental Accounting
Guideline (2005 edition, the Ministry of the Environment Japan), and GRI Standards
(Notational system of numerical results)
Total and tallies of shares may not always match, due to the effect of rounding and so on.
(Currency exchange rate - U.S. dollar amounts)
In this data book, U.S.dollar amounts have been translated from yen, solely for the convenience of the reader, at the rate of ¥110.99
to U.S.$1.00, the exchange rate prevailing on March 29, 2019. (This date was selected because March 30 and 31, 2019 was a non-
business day for financial institutions.).
(Date of issue)
June, 2019

- 2 -
Contents
1.Environmental management ・・・・・・・・・・・・・・・・・・・・・・・・・・・・・・・・・・・・・・・・・・・・・・・・・・ P3
FY2020 targets/ performances in FY2018
ISO14001certification
Environmental management audit
Environmental risk assessment
Environment-related accidents and complaints
Overview of environmental impact (FY2018)
2.Measures against Climate Change ・・・・・・・・・・・・・・・・・・・・・・・・・・・・・・・・・・・・・・・・・・・・・ P5
Greenhouse gas (CO2) emissions trend by scope
Greenhouse gas (CO2) emissions trend by operational site
Energy usage trend
Renewable energy trend
3.Reducing our Environmental Impact ・・・・・・・・・・・・・・・・・・・・・・・・・・・・・・・・・・・・・・・・・・・ P7
Waste reduction and recycling trend
Air pollutants emissions trend
Water pollutants emissions trend
PRTR substances handled (in Japan)
PCB storage
Water usage trend
Prevention of environmental pollution
4.Biodiversity ・・・・・・・・・・・・・・・・・・・・・・・・・・・・・・・・・・・・・・・・・・・・・・・・・・・・・・・・・・・・・・・ P10
Forest conservation activities
Local environmental clean-up activities
【Reference】 ・・・・・・・・・・・・・・・・・・・・・・・・・・・・・・・・・・・・・・・・・・・・・・・・・・・・・・・・・・・・・・・・・ P11
Environmental accounting (in Japan)

- 3 -
1.Environmental management
■FY2020 targets/ performances in FY2018
【Santen Group】
FY2020 targets Performance in FY2018
Measures against Climate
Change CO2 emissions Lower than 34,357t-CO2 34,160t-CO2
Reducing our
Environmental Impact
Final waste disposal
rate Lower than 2.1% 8.0%
Input water
resources Less than
2.4thousand m3/billion yen 2.39 thousand m3/billion yen
【In Japan】
FY2020 targets Performance in FY2018
Measures against Climate
Change CO2 emissions Lower than 24,756t-CO2 24,804t-CO2
Reducing our
Environmental Impact
Final waste disposal
rate Lower than 0.01% 5.76%
■ISO14001certification
Organization scope of activity acquisition date
As integrated organization
Shiga Product Supply Center
Noto Plant
Claire Co., Ltd
Production of pharmaceuticals
Cleaning of antidust and sterilized
clothing
December 2014 ※
Suzhou Plant (China) Production of pharmaceuticals February 2019
※ Shiga Plant was registered in 1999, Noto Plant was in 2003, and were migrated to integrated organization certification in 2014
■Environmental management audit
Our ISO 14001-certified plants are constantly subject to regular assessment by an ISO 14001 certification assessment
body. We also make an internal audit of our plants that have not yet obtained ISO 14001 certification by following the
ISO 14001 standard.
■Environmental risk assessment
Santen conducts environment-related risk assessment and confirm that there is no significant risk, for our major
production and research facilities, with utilizing WWF-DEG Water Risk Filter, and so on.
■Environment-related accidents and complaints
There was no accident that causes environmental pollution, i.e. soil contamination, and no infraction of laws or regulations
related environmental issues, at our business sites.
- 4 -
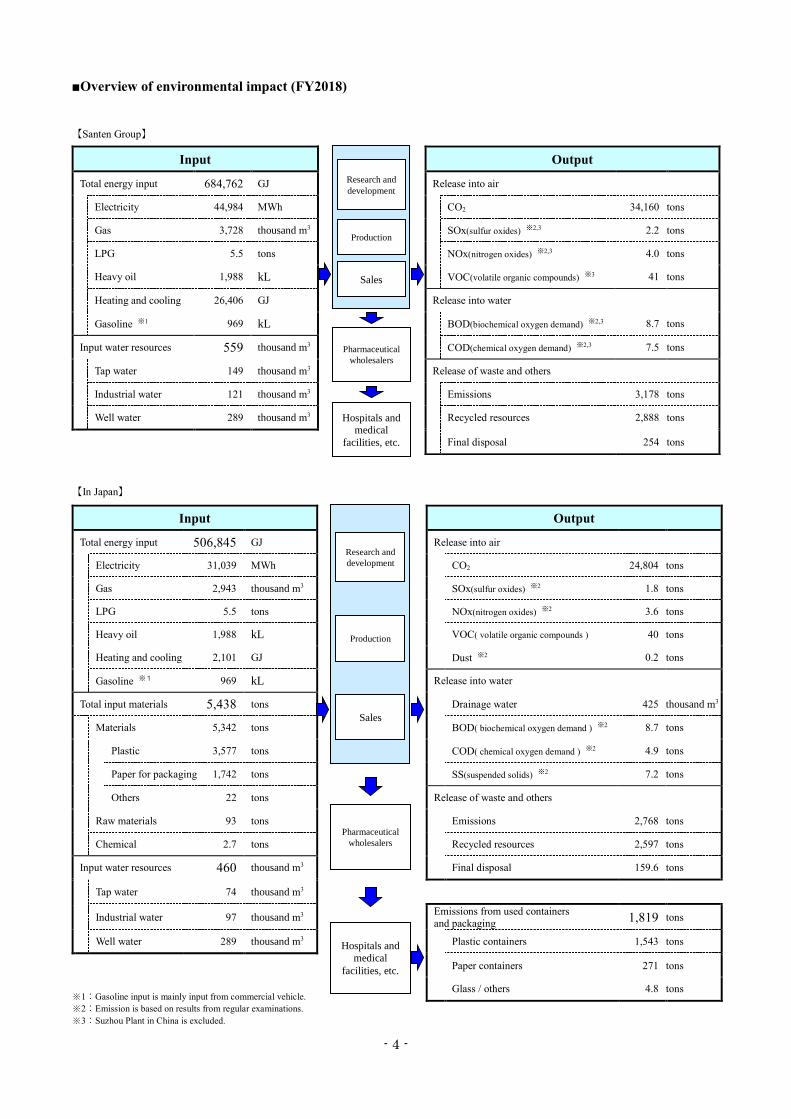
■Overview of environmental impact (FY2018)
【Santen Group】
【In Japan】
Input
Output
Total energy input 684,762 GJ Release into air
Electricity 44,984 MWh CO2 34,160 tons
Gas 3,728 thousand m3 SOx(sulfur oxides) ※2,3 2.2 tons
LPG 5.5 tons NOx(nitrogen oxides) ※2,3 4.0 tons
Heavy oil 1,988 kL VOC(volatile organic compounds) ※3 41 tons
Heating and cooling 26,406 GJ Release into water
Gasoline ※1 969 kL BOD(biochemical oxygen demand) ※2,3 8.7 tons
Input water resources 559 thousand m3 COD(chemical oxygen demand) ※2,3 7.5 tons
Tap water 149 thousand m3 Release of waste and others
Industrial water 121 thousand m3 Emissions 3,178 tons
Well water 289 thousand m3 Recycled resources 2,888 tons
Final disposal 254 tons
Input
Output
Total energy input 506,845 GJ Release into air
Electricity 31,039 MWh CO2 24,804 tons
Gas 2,943 thousand m3 SOx(sulfur oxides) ※2 1.8 tons
LPG 5.5 tons NOx(nitrogen oxides) ※2 3.6 tons
Heavy oil 1,988 kL VOC( volatile organic compounds ) 40 tons
Heating and cooling 2,101 GJ Dust ※2 0.2 tons
Gasoline ※1 969 kL Release into water
Total input materials 5,438 tons Drainage water 425 thousand m3
Materials 5,342 tons BOD( biochemical oxygen demand ) ※2 8.7 tons
Plastic 3,577 tons COD( chemical oxygen demand ) ※2 4.9 tons
Paper for packaging 1,742 tons SS(suspended solids) ※2 7.2 tons
Others 22 tons Release of waste and others
Raw materials 93 tons Emissions 2,768 tons
Chemical 2.7 tons Recycled resources 2,597 tons
Input water resources 460 thousand m3 Final disposal 159.6 tons
Tap water 74 thousand m3
Industrial water 97 thousand m3 Emissions from used containers and packaging
1,819 tons
Well water 289 thousand m3 Plastic containers 1,543 tons
Paper containers 271 tons
Glass / others 4.8 tons
Pharmaceutical
wholesalers
Hospitals and medical
facilities, etc.
Research and
development
Production
Sales
Pharmaceutical
wholesalers
Hospitals and
medical
facilities, etc.
Research and
development
Production
Sales
※1:Gasoline input is mainly input from commercial vehicle.
※2:Emission is based on results from regular examinations.
※3:Suzhou Plant in China is excluded.

- 5 -
2.Measures against Climate Change
■Greenhouse gas (CO2) emissions trend by scope
【Scope 1 and 2】 (unit:t-CO2)
Year ended March 31 % Change
2019/2018 2018 2019
Santen Group 16,811 17,018 1.2
Scope 1 In Japan 14,464 14,390 -0.5
Outside Japan 2,347 2,628 12.0
Santen Group 16,560 17,142 3.5
Scope 2 In Japan 10,403 10,414 0.1
Outside Japan 6,157 6,728 9.3
【Scope 3 (In Japan) 】 (unit:t- CO2)
Category Year ended March 31 % Change
2019/2018 Calculation methodology
2018 2019
1:Purchased goods and services 137,102 142,215 3.7
Estimated figures based on multiplying the weight of raw materials, ingredients, or
purchase amount of stock goods by the
emission factors of the calculation database.
2:Capital goods 19,058 25,270 32.6
Estimated figures based on multiplying the amount of money for acquisition of the
fixed assets by the emission factors of the
calculation database.
3:Fuel and energy related activities
not included in Scope1 and Scope2 1,098 1,099 0.1
Estimated figures based on multiplying the
usage of electricity by the emission factors of the calculation database.
4:Transportation and distribution
(Upstream) 708 630 -11.0
Estimated figures based on the
transportation distance between the plants/logistics centers and the destinations
(pharmaceutical wholesalers, etc.) with
using the fuel consumption method or the ton method.
5:Waste generated in operation 410 440 7.3 Estimated figures based on multiplying the
weight of each waste discharged by the
emission factors of the calculation database.
6:Business travel 2,894 2,763 -4.5
Estimated figures based on multiplying the
travel expenses of each transportation type
and accommodation expenses by the
emission factors of the calculation database.
7:Employee commuting 1,444 1,633 13.1
Estimated figures based on multiplying the
commutation expenses of public
transportation systems and the amount of gasoline used of the commuter cars by the
calculation database.
12:End-of-life treatment of sold products 225 223 -0.9
Estimated figures based on multiplying the weight of each material for the sold
products and packaging by the emission
factors of the calculation database.
Total 162,939 174,273 7.0
CO2 emissions per unit of revenue [t-CO2/billion yen]
948 989 4.3
● Calculate CO2 emissions reference with “GHG Intensity calculation database” (ver.2.6, Ministry of the Environment Japan)
● Category 8,10,11,13-15 are not indicated, because of our business characteristics. Category 9 is not calculated and indicated, at present.

- 6 -
■Greenhouse gas (CO2) emissions trend by operational site
【Santen Group】 (unit:t-CO2)
Year ended March 31 % Change 2015 2016 2017 2018 2019 2019/2018
Greenhous gas (CO2) emissions 34,650 31,840 33,108 33,371 34,160 2.4
CO2 emissions per unit of revenue [t-CO2/billion yen] 214 163 166 148 146 -1.6
[t-CO2/million $] 23.8 18.1 18.5 16.5 16.2
● U.S.dollar amounts have been translated from yen, solely for the convenience of the reader, at the rate of ¥110.99 to U.S.$1.00, the exchange rate prevailing on March 29,
2019. (This date was selected because March 30 and 31, 2019 was a non-business day for financial institutions.)
【In Japan】 (unit:t-CO2)
Operational site Year ended March 31 % Change
2015 2016 2017 2018 2019 2019/2018
Osaka Office(and Osaka Plant) 4,345 336 246 244 208 -14.6
Noto Plant 9,761 10,097 10,817 10,985 11,072 0.8
Shiga Product Supply Center 5,431 6,544 6,543 6,802 6,860 0.8
Nara Research and Development Center 4,331 4,034 4,223 4,151 4,112 -0.9
Branch and Sales offices and others 3,369 2,740 2,716 2,685 2,552 -5.0
Total 27,237 23,751 24,545 24,867 24,804 -0.3
● For the CO2 conversion factor for electric power, the emission factor of the Federation of Pharmaceutical Manufacturers’ Associations of Japan is used.
CO2 emissions per unit of revenue [t-CO2/billion yen] 197 152 156 145 141 -2.7
【Outside Japan】 (unit:t-CO2)
Operational site Year ended March 31 % Change
2015 2016 2017 2018 2019 2019/2018
Tampere Plant (Finland) 2,120 2,015 1,831 1,674 1,609 -3.8
Suzhou Plant (China) 5,293 6,074 6,732 6,830 7,747 13.4
Total 7,413 8,089 8,563 8,504 9,356 10.0
● For the CO2 conversion factor for electric power, the emission factor of the International Energy Agency (IEA) is used.
■Energy usage trend
【Santen Group】 (unit:GJ)
Year ended March 31 % Change
2015 2016 2017 2018 2019 2019/2018
Energy usage 731,381 617,922 648,643 656,715 684,762 4.3
Energy usage per unit of revenue [GJ/billion yen] 4,519 3,164 3,258 2,919 2,926 0.2
[GJ/million $] 502 351 362 324 325
● U.S.dollar amounts have been translated from yen, solely for the convenience of the reader, at the rate of ¥110.99 to U.S.$1.00, the exchange rate prevailing on March 29,
2019. (This date was selected because March 30 and 31, 2019 was a non-business day for financial institutions.)
【In Japan】 (unit:GJ)
Operational site Year ended March 31 % Change
2015 2016 2017 2018 2019 2019/2018
Osaka Office(and Osaka Plant) 100,595 9,625 7,173 7,122 6,085 -14.6
Noto Plant 212,605 219,213 236,784 238,837 241,750 1.2
Shiga Product Supply Center 129,066 153,088 152,713 158,305 159,485 0.7
Nara Research and Development Center 101,513 93,807 98,259 96,359 95,572 -0.8
Branch and Sales offices and others 55,237 8,001 8,880 8,522 3,954 -53.6
Total 599,016 483,733 503,808 509,145 506,845 -0.5
Energy usage per unit of revenue [GJ/billion yen] 4,327 3,099 3,210 2,962 2,876 -2.9
【Outside Japan】 (unit:GJ)
Operational site Year ended March 31 % Change
2015 2016 2017 2018 2019 2019/2018
Tampere Plant (Finland) 54,805 51,413 48,791 50,314 66,284 31.7
Suzhou Plant (China) 77,560 83,871 96,044 97,256 111,632 14.8
Total 132,365 135,284 144,835 147,570 177,917 20.6
■Renewable energy trend
(unit:MWh)
type Year ended March 31 % Change
2015 2016 2017 2018 2019 2019/2018
Solar energy generation ※1 13 13 13 13 11 -16.5
Purchased renewable energy ※2 633 602 554 554 581 4.8
Total 646 615 567 567 592 4.3
※1:Generated by solar energy equipment installed in Nara Research and Development Center. Not included in energy consumption.
※2:Purchased and consumed in Tampere Plant. Not subtracted from the amount of energy consumption.

- 7 -
3.Reducing our Environmental Impact
■Waste reduction and recycling trend
【Santen Group】 (unit:tons)
Year ended March 31 % Change
2015 2016 2017 2018 2019 2019/2018
Total
Emissions 3,219 3,274 2,702 2,910 3,178 9.2
Recycled
resources 2,338 2,501 2,630 2,814 2,888 2.6
Final disposal 46 40 37 62 254 308.9
Final disposal ratio
1.4% 1.2% 1.4% 2.1% 8.0% 5.9ppt
Final disposal per unit of revenue [t/billion yen] Final disposal
0.28 0.20 0.19 0.28 1.08 293.0
[t/million $] 0.03 0.02 0.02 0.03 0.12
● U.S.dollar amounts have been translated from yen, solely for the convenience of the reader, at the rate of ¥110.99 to U.S.$1.00, the exchange rate prevailing on March 29,
2019. (This date was selected because March 30 and 31, 2019 was a non-business day for financial institutions.)
【In Japan】 (unit:tons)
Operational site Year ended March 31 % Change
2015 2016 2017 2018 2019 2019/2018
Osaka Office(and Osaka Plant)※
Emissions 331 136 109 83 231 177.7
Recycled
resources 321 132 105 78 62 -20.2
Final disposal 2.0 0.2 0.2 0.2 159.4 78,005.5
Noto Plant
Emissions 1,532 1,580 1,715 1,686 1,793 6.4
Recycled
resources 1,532 1,580 1,715 1,686 1,793 6.4
Final disposal 0.1 0.0 0.0 0.1 0.1 -14.3
Shiga Product Supply Center
Emissions 146 405 524 711 671 -5.7
Recycled resources
146 405 524 711 671 -5.7
Final disposal 0.0 0.0 0.0 0.0 0.0 0.0
Nara Research and Development Center
Emissions 111 103 49 53 73 38.6
Recycled
resources 71 97 47 51 72 40.0
Final disposal 8.7 0.2 0.1 0.1 0.1 -3.6
Total
Emissions 2,121 2,224 2,398 2,533 2,768 9.3
Recycled
resources 2,071 2,213 2,391 2,526 2,597 2.8
Final disposal 10.7 0.4 0.3 0.4 159.6 43,440.5
Final disposal
ratio 0.51% 0.02% 0.01% 0.01% 5.76% 5.75ppt
Final disposal per unit of revenue [t/billion yen] Final disposal 0.1 0.0 0.0 0.0 0.9 42,369.0
※ Regarding the final disposal of year ended March 31 2019 at Osaka Office(and Osaka Plant), the emissions was temporarily increased due to disposal of residual
equipment, etc. associated by selling of the former head office and the Osaka Plant.
【Outside Japan】 (unit:tons)
Operational site Year ended March 31 % Change
2015 2016 2017 2018 2019 2019/2018
Tampere Plant (Finland)
Emissions 1,055 992 266 260 262 0.8
Recycled resources
252 263 234 231 237 2.4
Final disposal 7.6 6.5 4.0 1.7 0.0 -100.0
Suzhou Plant (China)※
Emissions 43 58 38 117 148 26.8
Recycled
resources 15 25 5 57 54 -5.1
Final disposal 28 33 33 60 94 57.2 ※ Regarding the emissions at Suzhou Plant in China from the year ended March 31 2018, the scope has expanded by reviewing the definition of the emissions.

- 8 -
■Air pollutants emissions trend
【Santen Group】 (unit:tons)
Substance Year ended March 31 % Change
2015 2016 2017 2018 2019 2019/2018
SOx(sulfur oxides) ※1,2 8.0 10.1 8.3 6.1 2.2 -63.9
NOx(nitrogen oxides) ※1,2 10.8 7.9 7.5 8.3 4.0 -52.0
VOC(volatile organic compounds) ※2 65 65 36 36 41 14.5
【In Japan】 (unit:tons)
Substance Year ended March 31 % Change
2015 2016 2017 2018 2019 2019/2018
SOx(sulfur oxides) ※1 2.2 4.5 2.7 2.4 1.8 -23.7
NOx(nitrogen oxides) ※1 8.3 5.5 5.1 5.9 3.6 -40.0 VOC(volatile organic compounds) 31 27 34 35 40 15.7
Dust 1.2 0.6 0.4 0.4 0.2 -42.2
【Outside Japan】 (unit:tons)
Substance Year ended March 31 % Change
2015 2016 2017 2018 2019 2019/2018
SOx(sulfur oxides) ※1,2 5.8 5.6 5.6 3.7 0.4 -90.0 NOx(nitrogen oxides) ※1,2 2.5 2.4 2.4 2.4 0.4 -81.7
VOC(volatile organic compounds) ※2 33.8 38.3 1.2 1.4 1.2 -14.3
※1:Emission is estimated based on results from regular examinations.
※2:Suzhou Plant in China is excluded.
■Water pollutants emissions trend 【Santen Group】 (unit:tons)
Substance Year ended March 31 % Change
2015 2016 2017 2018 2019 2019/2018
BOD(biochemical oxygen demand) ※1,2 9.0 7.4 4.5 4.5 8.7 94.9 COD(chemical oxygen demand) ※1,2 13.3 11.1 5.4 4.8 7.5 56.8
【In Japan】 (unit:tons)
Substance Year ended March 31 % Change
2015 2016 2017 2018 2019 2019/2018
BOD(biochemical oxygen demand) ※1 2.8 2.1 2.9 3.0 8.7 188.9 COD(chemical oxygen demand) ※1 2.0 1.9 2.5 2.6 4.9 91.1
SS(suspended solids) ※1 3.5 4.7 6.5 8.9 7.2 -18.9
【Outside Japan】 (unit:tons)
Substance Year ended March 31 % Change
2015 2016 2017 2018 2019 2019/2018
BOD(biochemical oxygen demand) ※1,2 6.2 5.3 1.6 1.5 0.0 -100.0 COD(chemical oxygen demand) ※1,2 11.3 9.2 2.9 2.2 2.6 16.7
※1:Emission is estimated based on results from regular examinations.
※2:Suzhou Plant in China is excluded.
■PRTR substances handled (in Japan)
【In Japan】 (unit:tons)
Substance Year ended March 31 % Change
2015 2016 2017 2018 2019 2019/2018 Acetonitrile 1.4 1.8 1.8 1.8 1.9 7.1
Boron and its compounds 0.6 0.7 0.9 1.0 0.6 -35.6
Xylene 0.2 0.2 0.1 0.6 0.1 -91.2
Others 0.2 0.2 0.1 0.2 0.8 250.0
Total※ 2.4 2.8 2.9 3.5 3.3 -5.9
※ The data included chemical materials used more than 1 kg in a year.
The number of substances over 1kg used per year 19 18 14 30 34 13.3
■PCB storage
We have no PCB-containing equipment in our business sites at June 2019. In March 2017, we completed, through a
nationally designated service provider, appropriately disposing of the three PCB-containing fluorescent light ballasts that
had been stored at our former Osaka Plant, and making them harmless.

- 9 -
■Water usage trend
【Santen Group】 (unit:thousand m3)
Year ended March 31 % Change
2015 2016 2017 2018 2019 2019/2018
Water usage Total 516 519 552 545 559 2.6
Water usage per unit of revenue [thousand m3/billion yen] 3.19 2.66 2.77 2.42 2.39 -1.4
[thousand m3/million $] 0.35 0.29 0.31 0.27 0.26 ● U.S.dollar amounts have been translated from yen, solely for the convenience of the reader, at the rate of ¥110.99 to U.S.$1.00, the exchange rate prevailing on March 29,
2019. (This date was selected because March 30 and 31, 2019 was a non-business day for financial institutions.)
【In Japan】 (unit:thousand m3)
Operational site Year ended March 31 % Change
2015 2016 2017 2018 2019 2019/2018
Osaka Office(and Osaka Plant) Usage 59.6 5.2 4.3 4.2 3.9 -7.0
Discharge 59.5 5.1 4.3 4.2 3.9 -6.9
Noto Plant Usage 247 271 301 300 294 -2.1
Discharge 225 215 261 291 286 -1.8
Shiga Product Supply Center Usage 71 94 110 115 107 -6.9
Discharge 52 69 91 91 93 2.6
Nara Research and Development Center Usage 41 41 44 46 55 18.0
Discharge 41 41 44 35 43 20.7
Total Usage 419 411 460 466 460 -1.3
Discharge 377 330 401 421 425 1.0
Water usage per unit of revenue
[thousand m3/billion yen]
Usage 3.0 2.6 2.9 2.7 2.6 -3.7
Discharge 2.7 2.1 2.6 2.4 2.4 -1.5
【Outside Japan】 (unit:thousand m3)
Year ended March 31 % Change
2015 2016 2017 2018 2019 2019/2018
Tampere Plant (Finland) Usage 53 51 39 39 41 4.4
Suzhou Plant (China) Usage 44 57 53 40 58 45.9
■Prevention of environmental pollution
To conserve the living environments of the areas where our plants are located, we have conducted regular environmental
monitoring, and have successfully ensured that all plants stay far below the regulation values based on laws, ordinances,
treaties, etc.
🔴 Measurements and results of analysis of environmental data (FY2018)
Noto Plant Shiga Product Supply Center
Nara Research and Development Center
Criteria Results Criteria Results Criteria Results
Air pollution
Soot and dust [g/Nm3] 0.3 0.01 0.2 < 0.005 0.1 0.0009
NOx [ppm] 150 28 180 36 150 43
SOx [Nm3/h] 0.98 0.02 - - - -
Water
contamination
pH 5.8~8.6 7.3~7.8 5.0~9.0 7.1~8.2 5.0~9.0 6.7~7.7
BOD [mg/L] 80 77 600 92 1,500 35
COD [mg/L] 80 44 600 27 - -
SS [mg/L] 120 31 600 38 1,500 72
Noise
Morning [dB] 60 50 50 48 60 46
Noon [dB] 65 51 55 45 65 44
Evening [dB] 60 49 50 48 60 41
Night [dB] 50 49 45 46※ 50 40
Vibration
levels
Noon [dB] 65 45 70 34 65 31
Night [dB] 60 44 65 < 25 60 < 25
● Criteria values are specified according to the agreements with municipalities where the workplaces are located.
※ Regarding the noise of night at Shiga Product Supply Center, the noise data caused only by the site could not be obtained, because the measured data was affected
by the noise of insects and the sound around the site.

- 10 -
4.Biodiversity
■Forest conservation activities
Because appropriate forest conservation contributes to not only facilitating the absorption of CO2 but also maintaining
the rich natural environment and headwater conservation capacity, leading to the protection of biodiversity, Santen Group
engages in forest conservation activities.
・Activities of Noto Plant
Noto Plant supports the Environmental Education Project to conserve nature at Mt. Hodatsu, organized by the board of
education of Hodatsushimizu Town, the local government of the area where it is located. Santen employees participate in
the project as helpers by leading local students in mountain climbing and cleaning.
・Activities of Shiga Product Supply Center
Santen calls for employees' participation in events held by a Shiga Prefecture-based NPO to offer practical training on the
management and use of satoyama forests and other matters.
■Local environmental clean-up activities
To contribute to the cleaning up and beautification of local environments, Santen's offices, laboratories and plants,
including the Noto Plant, the Shiga Product Supply Center and the Shimoshinjo Office, conduct clean-up activities in
collaboration with local governments and regional organizations. In FY2018, a total of 393employees participated in
these activities.

- 11 -
【Reference】Environmental accounting(in Japan)
Scope: The cost and effect of Environmental preservation of Santen Pharmaceutical Co., Ltd.
Period covered: April 1st, 2018 to March 31st 2019
Reference: Environmental Accounting Guideline (2005 edition, the Ministry of the Environment Japan)
【Environmental conservation costs】 (unit:million yen)
category Year ended March 31, 2018 Year ended March 31, 2019
Investments Expenses Investments Expenses
Business area costs 1.0 256.8 23.3 223.4
Pollution prevention 0.0 65.3 0.0 57.7
Global environmental conservation 1.0 135.2 23.2 108.1
Resource circulation 0.0 56.3 0.1 57.6
Upstream/downstream costs — 10.3 0.1 12.9
Administration costs — 77.8 — 67.1
R&D costs — — — —
Social activity costs — 0.6 — 0.6
Environmental damage costs — 0.0 — —
Total 1.0 345.6 23.3 304.0
Only the cases that can be determined as related to the purpose of environmental conservation are included in the calculation.
The cost includes the depreciation amount and was accounted for the same way as the accounting.
Current investment includes both the investment amount and expense.
Total number was only a rough estimation because the totals were rounded off.
The employment cost of the environmental management department and operation and maintenance of the environmental management system was accounted for as
administration costs.
“-” means no cost or no activities.
【Economic effects of environmental conservation measures】 (unit:million yen)
category Year ended March 31, 2018 Year ended March 31, 2019
Profits from sales of waste etc 72.0 80.3
Cost reductions 16.1 13.1
Only economic effects that can be determined with a high degree of certainty are included in the calculation.

- 12 -
【Environmental conservation effect】
category unit Year ended March 31
Environment
al burden
reduction
% Change
2018 2019 2019/2018
Energy Total energy usage GJ 509,145 506,845 -2,300 -0.5
Electricity kWh 31,008 31,039 31 0.1
Gas thousand m3 2,933 2,943 10 0.3
LPG tons 5.4 5.5 0.0 0.9
Heavy Oil kL 1,998 1,988 -10 -0.5
Gasoline kL 999 969 -30 -3.0
Water resources Total water usage thousand m3 466 460 -6 -1.3
Tap water thousand m3 74 74 0 0.4
Industrial water thousand m3 97 97 -0 -0.4
Well water thousand m3 295 289 -6 -2.0
Materials Raw and other materials tons 5,466 5,435 -31 -0.6
Global warming CO2 tons 24,867 24,804 -64 -0.3
Atmospheric pollutants SOx (sulfur oxides) tons 2.4 1.8 -0.6 -23.7
NOx (nitrogen oxides) tons 5.9 3.6 -2.4 -40.0
VOC (volatile organic compounds) tons 35 40 5 15.7
Dust tons 0.4 0.2 -0.2 -42.2
Water pollutants Discharged water thousand m3 421 425 4 1.0
BOD(biochemical oxygen demand) tons 3.0 8.7 5.7 188.9
COD(chemical oxygen demand) tons 2.6 4.9 2.3 91.1
SS(suspended solids) tons 8.9 7.2 -1.7 -18.9
Waste materials Emissions tons 2,533 2,768 235 9.3
Recycled resources tons 2,526 2,597 72 2.8
Final disposal tons 0.4 159.6 159.2 43,440.5