Embed Size (px)
Citation preview

ENVIRONMENTAL CHAMBER STUDYOF MAXIMUM INCREMENTAL REACTIVITIES
OF VOLATILE ORGANIC COMPOUNDS
by
William P. L. Carter1, John A. Pierce2,Dongmin Luo, and Irina L. Malkina
May 3, 1995
Atmospheric Environmentin press
Statewide Air Pollution Research Center, andCollege of Engineering Center for Environmental Research and Technology
University of CaliforniaRiverside, CA 92521
1 Author to whom correspondence should be addressed
2 Present Address: Department of Environmental Health, School of Public HealthLoma Linda University, Loma Linda, CA 92350

ABSTRACT
The effects of 26 individual volatile organic compounds (VOCs) on ozone formation, NO
oxidation, and OH radical levels were measured by adding them to reactive organic gas (ROG) - NOx -
air environmental chamber irradiations representing a simplified model photochemical smog system.
These experiments had relatively low ROG/NOx ratios to represent conditions where ozone formation is
most sensitive to VOC additions. The compounds studied included representative alkanes, alkenes,
aromatic hydrocarbons, aldehydes, alcohols, and CO. The addition of formaldehyde, methylbenzenes,
alkenes and methanol all caused increased integrated OH radical concentrations, and caused the most NO
oxidation and ozone formation per molecule reacted. The C6+ n-alkanes had the most inhibiting effects
on OH radicals, and caused reduced NO oxidation and ozone formation in these experiments. The other
compounds had smaller negative effects on OH radicals, but moderate positive effects on ozone formed
and NO oxidized. The implications of these results in terms of the atmospheric reaction mechanisms of
these compounds are discussed.
INTRODUCTION
The formation of ground-level ozone is caused by the gas-phase interactions of emitted volatile
organic compounds (VOCs) and oxides of nitrogen (NOx) in the presence of sunlight (NRC, 1991).
Individual VOC compounds can differ significantly in their effects on ozone, due not only to differences
in their atmospheric reaction rates, but also due to differences in the way in which their reactions affect
ozone (Carter and Atkinson, 1987; Carter 1994; Bauman and Seinfeld, 1994a,b). There are a number of
ways to quantify a VOC’s effect on ozone (e.g., Bauman and Seinfeld, 1994a,b), but probably the most
direct quantitative measure for practical air quality impact assessments is its "incremental reactivity"
(Carter and Atkinson, 1987; 1989a; Chang and Rudy, 1990; Russell, 1990; Carter, 1991, 1994). This is
defined as the amount of additional ozone formation resulting from the addition of a small amount of the
compound to the system in which ozone is formed, divided by the amount of compound added. This
depends not only on the VOC and its atmospheric reactions, but also on the conditions of the system
where the VOC is reacting. For example, incremental reactivities of VOCs under high NOx conditions
can differ from those under conditions where NOx is limited, not only in terms of absolute magnitude but
also (in many cases) in a relative sense (e.g., Carter, 1991, 1994). Model calculations indicate that
incremental reactivities measured in environmental chamber experiments can be somewhat different than
those in the atmosphere, due to differences in dilution, static conditions, and the "surrogate" mixture of
compounds used in the experiment to represent the other VOCs in the atmosphere (Carter and Atkinson,
1989; Carter et al., 1994). Nevertheless, results of incremental reactivities measured in suitably designed
chamber experiments should be influenced by the same chemical mechanistic factors which affect
incremental reactivities in the atmosphere, and thus can provide insights into these factors. Experimentally
measured incremental reactivities also provide the most direct available means to evaluate the ability of
the chemical models used in models to predict incremental reactivities in the atmosphere.
2

This paper describes the results of a series of experiments to measure incremental reactivities of
a series of representative VOCs under relatively high NOx or "maximum reactivity" conditions.
Incremental reactivities under high NOx conditions are referred to as maximum reactivities because VOCs
have their highest magnitudes of incremental reactivities (most ozone formed per VOC emitted) under such
conditions (Carter and Atkinson, 1989; Carter, 1991, 1994). Although it is clearly of interest to measure
reactivities under a variety of conditions, we chose to focus initially on maximum reactivity conditions
because those are the conditions where O3 is most sensitive to VOCs, and because the California Air
Resources Board used a maximum incremental reactivity (MIR) scale when implementing reactivity-based
standards for motor vehicle emissions (CARB 1990, 1991).
METHODS
Experimental Approach
The reactivities of the representative VOCs were measured by carrying out a series of repeated
6-hour irradiations of a standard mixture representing photochemical smog precursors in an indoor
environmental chamber, alternating with irradiations of the same mixture with varying amounts of the test
VOC added. The chamber employed consists of a ~3000-liter flexible FEP Teflon reaction bag held in
a framework surrounded by blacklights which were used as the light source. Dry purified air for the
experiments was provided by an in-house air purification system. The chamber was flushed with purified
air overnight, and then the reactants were injected, mixed, and monitored. The chamber contents were
then irradiated for six hours. Ozone and NOx were monitored continuously by commercial continuous
analyzers, and the temperature was monitored by a thermocouple probe inside the chamber. The O3, NOx,
and temperature data were recorded on the data acquisition computer every 15 minutes. Organic reactants
were monitored approximately hourly by gas chromatography. After the run the reaction bag chamber
was deflated and flushed with pure air to remove the contents and prepare for the next run. The
experimental approach and analysis methods are described in detail elsewhere (Carter et al. 1993).
The temperature in the chamber when the lights were on ranged from 298 to 304 K. The light
intensity was measured by conducting periodic NO2 actinometry experiments using a modified version of
the quartz tube method of Zafonte et al. (1977). The NO2 photolysis rate ranged from ~0.4 min-1 initially
to ~0.32-0.33 min-1 at the end of the study. The spectral distribution of the blacklight light source was
measured using a LiCor LI-1800 spectral radiometer. Characterization and control runs were also carried
out as described elsewhere (Carter et al., 1993).
The experiments with the representative photochemical smog precursors but without the added test
VOC are referred to as the "base case" experiments. The photochemical smog precursors utilized in the
base case experiments consisted of ~3.5 or ~4.5 ppmC of a "mini-surrogate" reactive organic gas (ROG)
mixture containing 35% (as carbon) ethene, 50% n-hexane, and 15% m-xylene, along with ~0.5 ppm of
3

oxides of nitrogen (NOx) in air. This was designed to represent "maximum reactivity" conditions, i.e.,
relatively low ROG/NOx ratios where VOCs have the greatest effects on ozone formation (Carter, 1991,
1994). The 3-component mini-surrogate was designed to be an experimentally simple representative of
the reactive organic compounds emitted into the atmosphere. Although this mini-surrogate is a significant
oversimplification of the complex mixture of ROGs present in the atmosphere (see, for example, Jeffries
et al. 1989), model calculations show that use of this simpler mixture provides a more sensitive measure
of reactivities than use of more complex mixtures. The mini-surrogate is also referred to as the "base
ROG mixture" (following the terminology used previously [Carter, 1994]), since it is the ROG mixture
used in the base case experiments.
The experiments where a test VOC was added to the reactants in the base case experiments are
referred to as the "test" experiments. The amount of VOCs added in these experiments varied depending
on the observed reactivity of the VOC. Generally the amount added was determined so that it caused at
least a 30%, but less than a factor of 2, change in the sum of amount of NO consumed plus the amount
of ozone formed in six hours. If the effect of adding the VOC in the first experiment was not in this
range, the amount added was adjusted. Usually at least two or three added VOC experiments were
conducted for each of the VOCs studied.
Two changes were made in the experimental procedures or conditions during the course of this
study, yielding three different sets of base case and test runs. In the Set 1experiments, 3.5 ppm of the
mini-surrogate was employed, and the NOx was injected using glass syringes. In the Set 2experiments
the NOx was injected using a vacuum rack preparation to reduce possible formation of nitrous acid
(HONO). In the set 3experiments the amount of mini-surrogate was increased to ~4.5 ppm to increase
the ozone yields to levels comparable to Set 1. The reasons for these changes and their effects on the
experiments are discussed in the Results section.
Data Analysis Methods
The quantity of interest from a practical perspective is the VOC’sincremental reactivity, which
is defined as the effect of the VOC on some measure of air quality (e.g., ozone), divided by the amount
of VOC added. However, from a mechanistic analysis perspective it is more useful to at the components
of incremental reactivity. As discussed previously (Carter and Atkinson, 1989a, Carter, 1991, 1994),
incremental reactivity can be thought of as being a product of two more fundamental factors: (1) the
kinetic reactivity, which is defined as the fraction of the emitted VOC which undergoes chemical reaction
in the pollution scenario or experiment being considered; and (2) themechanistic reactivity, which is the
amount of ozone formed relative to the amount of VOC which has undergone reaction. The utility of this
concept is that this provides a means to factor out (at least to a first approximation) the effect of a VOC’s
reaction rate from all the other mechanistic aspects which affect reactivity. Since the only aspect of the
VOC’s mechanism which affects kinetic reactivities are the VOC’s rate constants, which generally are
known, the ability of a mechanism to predict kinetic reactivities are not considered to be particularly
4

uncertain. On the other hand, the mechanistic reactivities are sensitive to all the other aspects of the
VOC’s mechanism, many (or all) of which are uncertain. Thus, the mechanistic reactivities are the
quantities which are the most difficult to predicta-priori. For this reason, in the rest of this paper we will
focus primarily on determinations of various measures of mechanistic reactivities.
The results of the experiments were analyzed to yield three measures of VOC reactivity. The first
was the effect of the added VOC on the amount of NO reacted plus the amount of ozone formed at hourly
intervals in the experiment. This is abbreviated as d(O3-NO) in the subsequent discussion. As discussed
elsewhere (e.g., Johnson, 1983; Carter and Atkinson, 1987; Carter and Lurmann, 1990, 1991) this gives
a direct measure of the amount of conversion of NO to NO2 by peroxy radicals formed in the
photooxidation reactions, which is the process that is directly responsible for ozone formation in the
atmosphere. (Johnson calls it "smog produces" or "SP".) The incremental reactivity of the test VOC
relative to d(O3-NO) at time t, designated IR[d(O3-NO)]tvoc, is given by
test based(O -NO) - d(O -NO)voc 3 t 3 tIR[d(O -NO)] = (I)3 t [VOC] 0
where d(O3-NO)ttest is the d(O3-NO) measured at time t from the experiment where the test VOC was
added, d(O3-NO)tbaseis the corresponding value from the "base case" experiments where the test VOC was
not present, and [VOC]0 is the amount of test VOC added. In an analogous manner, the mechanistic
reactivities, designated MR[d(O3-NO)]tvoc, is given by
test based(O -NO) - d(O -NO)voc 3 t 3 tMR[d(O -NO)] = (II)3 t (VOC Reacted) t
where (VOC reacted)i is the amount of the test VOC which has undergone reaction up to time=t. (In the
subsequent discussion, we will give the derivations only for types of mechanistic reactivities, though the
derivations for incremental reactivities are analogous.) These quantities were calculated for each hour of
the 6-hour experiments.
The second measure of reactivity obtained in this study is the effect of the VOC on integrated
hydroxyl (OH) radical concentrations in the experiment, abbreviated "IntOH" in the subsequent discussion.
The effect of a VOC on radicals is an important factor affecting reactivity because radical levels affect
how rapidly all VOCs present, including the base ROG components, react to form ozone. If a compound
is present in the experiment which reacts primarily with OH radicals, then the IntOH at time t can be
estimated from
[tracer] 0ln - Dtt [tracer]⌠ tIntOH = [OH] d τ = , (III)t ⌡ τ0 tracerkOH
5
where [tracer]0 and [tracer]t are the initial and time=t concentrations of the tracer compound, kOHtracer its
OH rate constant, and D is the dilution rate in the experiments. The latter was found to be 0.5±0.25 %/hr,
which is small but non-negligible (Carter et al., 1993). The concentration of tracer at each hourly interval
was determined by fitting the experimental ln[tracer] data to linear or quadratic curves when plotted
against time or d(O3-NO)t, as discussed elsewhere (Carter et al., 1993).
For most experiments m-xylene was used as the OH tracer, since as a mini-surrogate component
it was present in all experiments, its OH rate constant is known (the value used was 2.36x10⁻¹¹ cm3 molec-1
s-1 [Atkinson, 1989]), and it reacts relatively rapidly. For some later experiments, particularly those with
p-xylene, which we could not monitor simultaneously with m-xylene, trace amounts (~2 ppb) of 2-
chloromethyl-3-chloropropene, monitored at low levels by GC/ECD, was used as the OH radical tracer.
The OH radical rate constant used for it was 3.16x10⁻¹¹ cm3 molec-1 s-1 , which was measured in this work
using the relative rate method (Atkinson, 1989) and m-xylene as the reference compound (Carter et al.,
1993). This rate constant is in good agreement with the results of Tuazon et al (1988). Although this
compound also reacts with ozone, its measured rate constant (Tuazon et al, 1984) is sufficiently low that
ozone reaction is calculated to be negligible under the conditions of these experiments.
The effect of the VOC on IntOH was measured by its incremental or mechanistic reactivities
relative to IntOH, or IR[IntOH]tvoc and MR[IntOH]t
voc. These are defined in a way exactly analogous to
the reactivities relative to d(O3-NO), e.g.:
test baseIntOH - IntOHvoc t tMR[IntOH] = (IV)t (VOC reacted) t
The effects of the test VOC on d(O3-NO) and IntOH can also be used to obtain estimates of the
direct and indirect components of reactivity. All peroxy radicals which oxidize NO and cause ozone
formation in a ROG-NOx-air photooxidation system can be traced back to an initially present or emitted
VOC (Jeffries and Crouse, 1991). Therefore, in an experiment where a test VOC is added to a base ROG
mixture, the amount of ozone formed and NO oxidized, d(O3-NO)test, is the sum of ozone formed and NO
oxidized due to radicals formed from the reactions of the test VOC or its products, d(O3-NO)tveosct, plus the
ozone formed and NO oxidized from radicals formed from reactions of the components of the base ROG
mixture and their products, d(O3-NO)tbeasste ROG. Plugging this into Equation (II) yields
test test based(O -NO) d(O -NO) - d(O -NO)3 VOC 3 base ROG 3MR[d(O -NO)] = +3 (VOC rct’d) (VOC reacted)t t(V)
direct indirect= MR + MR
where the fist term is the "direct reactivity" and the second is the "indirect reactivity".
6

Neither d(O3-NO)tveosct nor d(O3-NO)t
beasste ROG are directly measured, but the latter can be estimated if
two approximations are made. These are: (1) the amount of base ROG and base ROG products reacting
in an experiment (whether base or test) is proportional to IntOH; and (2) the ratio of d(O3-NO)tbeasste ROG to
amount of base ROG and base ROG products reacting is unaffected by the addition of the test VOC.
From these it follows that
test based(O -NO) d(O -NO)3 base ROG ~ 3= , (VI)test baseIntOH IntOH
and thusbased(O -NO)test test 3d(O -NO) - IntOHdirect ~ 3 baseMR = IntOH (VII)
(VOC reacted) t
andbased(O -NO)indirect ~ 3MR = MR[IntOH] . (VIII)baseIntOH
Note that these approximations predict that the "indirect" mechanistic reactivity is the same as the
mechanistic reactivity with respect to IntOH, except that the d(O3-NO)base/IntOHbaseratio is used to derive
the effect on d(O3-NO) from the effect on IntOH.
The first approximation upon which the above equations is based is only strictly true for VOCs
which react relatively slowly and only with OH radicals, but is probably good to within the precision of
experimental incremental reactivity data. The second approximation can be applied only if NOx is in
excess and the major fate of peroxy radicals formed from reactions of VOCs is reaction with NO. This
is the case for most of the experiments discussed here. Under those conditions the number of peroxy
radicals, and thus NO conversions, resulting from the reactions of a given VOC molecule are expected
to be unaffected by the presence of other VOCs, since current mechanisms predict that cross reactions of
radicals from different VOCs are of negligible importance if sufficient NOx is present (Atkinson, 1990;
Stockwell et al., 1990; Carter, 1990). However, this neglects the fact that the distribution of ROG
components which react will change with the extent of reaction, which would be affected by the presence
of the VOCs with large effects on radical levels.
Thus, the use of Equations (VII) and (VIII) to estimate direct and indirect reactivities is only
applicable in experiments when NOx is always in excess, and they become increasingly approximate as
the IntOH levels in the test experiments deviate from those in the base case runs. Nevertheless, they
provide indications of the direct and indirect components of reactivity which are useful for elucidating how
7

different types of VOCs affect ozone formation, and for evaluating whether chemical mechanisms are
accounting for these factors correctly.
The quantities d(O3-NO)test, IntOHtest, and [VOC]0 are obtained from the results of each of the
individual test experiments. However, because of run-to-run variability in temperature, light intensity, and
initial reactant concentrations, the quantities d(O3-NO)base, IntOHbase, and [d(O3-NO)base/IntOHbase] are not
measured in a single experiment. Instead, these are estimates, using the results of many base case runs,
of what the result of a base case experiment would be if it were carried out under the conditions of the
added test VOC experiment. These are obtained by linear multiple regression analyses on the results of
the base case experiments as a function of the variable run conditions which were found to be significant
(Carter et al., 1993). The [d(O3-NO)base/IntOHbase] ratio was derived from separate regressions for
d(O3-NO)baseand IntOHbasebecause the ratio was found to be much less dependent on run conditions than
d(O3-NO) or IntOH. Separate estimates are made for the three sets of base case experiments.
Determination of mechanistic reactivities requires determining amounts of test compound reacted
at the various times in the experiments. These were determined either by direct measurement, after
correction for dilution using
t⌠(VOC reacted) = [VOC] - [VOC] - D [VOC] dt, (IX)t 0 t ⌡0
or, if the VOC reacted only with OH radicals, by calculation from the measured IntOH and the kOHvoc,
the VOC’s OH radical rate constant using
voc vockOH IntOH - kOH IntOH - Dt~ t t(VOC reacted) = [VOC] 1 - et 0 vockOH IntOH + Dt (X)t
The concentration of VOC at each hourly interval was determined in the same manner as used for the
tracer data when computing IntOH (Carter et al., 1993). The approach which gave the least uncertainty
in estimated (VOC reacted)t was used. A 20% uncertainty in kOHvoc was used in determining which
approach gave the least uncertainty, but was not used in computing the reported uncertainty in the amounts
reacted and the mechanistic reactivities. The tabulations of the results indicate which approach was used.
RESULTS
Results of Base Case Experiments
Concentration-time plots for a representative base case experiment from each of the three run sets
are shown on Figure 1. Results of model calculations, discussed elsewhere (Carter, 1995), are also shown.
A typical Set 1 base case run in this set produced 0.22 ppm O3 in six hours. Note that ozone formation
8

Figure 1. Concentration - time plots of selected species in representative base case runs. Resultsof model simulations, which are discussed in the companion paper (Carter, 1995), are alsoshown.
9

is just starting to occur when the run is terminated after 6 hours of irradiation, so the final ozone yield
is highly sensitive to the ozone formation rate. This is an appropriate type of experiment to assess
maximum reactivities of VOCs, since maximum reactivities are determined primarily by effect of the
VOCs on ozone formation rates (Carter, 1994). A total of 15 base case experiments were conducted in
Set 1, interdispersed with runs with added ethane, n-butane, propene or toluene.
The Set 1 experiments were characterized by relatively high initial NO oxidation rates compared
to the subsequent sets. Model simulations of characterization runs (Carter et al., 1993) could fit the data
only if it is assumed that non-negligible amounts of nitrous acid are present initially in these experiments.
This is undesirable because initial HONO is a source of uncontrolled variability which cannot be measured
directly, and which must be treated as an adjustable parameter when modeling the runs. HONO could be
introduced either as a contaminant in the NO tank or by heterogeneous hydrolysis of the NO2 being
prepared for injection. To reduce these possibilities, for subsequent sets a modified NOx injection
procedure was employed where molecular sieves were used to remove HONO from the NO and to remove
H2O from the diluent gases. A vacuum rack was employed to store NO after purification and to prepare
NO and NO2 for injection.
The Set 2 runs had the same initial reactant concentrations as Set 1, but changing the NOx
injection procedure significantly changed the results, as shown in Figure 1. Set 2 base case runs had
slower initial rates of NO oxidation, and as a result ozone formation only just began before the runs
ended. Model simulations of Set 2 runs and tracer-NOx-air control experiments (Carter et al., 1982)
suggest that HONO is no longer initially present. Although only very low amounts of O3 are formed in
the Set 2 base case runs, these experiment still provide useful information concerning ozone reactivities
of VOCs because the chemical processes which cause NO to be consumed when it is in excess are the
same as those which cause ozone formation once the NO has reacted. A total of 27 base case runs were
conducted in Set 2, interdispersed with runs with the test VOCs studied in Set 1, and several others.
For Set 3 the initial concentration of the mini-surrogate components was increased from ~3.5 to
~4.5 ppm to increase the amount of ozone formed in the base case experiment. This experiment still
represented maximum reactivity conditions because O3 was still increasing at the end of the run, indicating
that the final O3 yield is still determined by the rate of its formation. The final ozone formed in the
experiment depended on the average temperature in the run (see below), but was typically ~0.30 ppm.
Results of a typical Set 3 base case run are shown on Figure 1. Set 3 includes the majority of the
experiments discussed here, including 92 base case runs, interdispersed with runs with all the test VOCs
reported here except for propene and ethanol.
A large number of repeated base case experiments were carried out for each set so a good baseline
for determining the effects of adding the test VOCs could be established. The reproducibility of these
experiments are shown on Figure 2, which show plots, against experiment number, of the observed 2-,
4-, and 6-hour d(O3-NO)baseIntOHbaseand of the 6-hour d(O3-NO)base/IntOHbasedata. There is significant
10

Figure 2. Plots of the d(O3-NO), IntOH and d(O3-NO)/IntOH results for selected run times againstrun number for the base case experiments. Solid lines show the values estimated usingthe regression fits, and dotted lines show the (oneσ) uncertainty ranges of the estimates.(The dip in d(O3-NO) and IntOH observed around runs 300-325 are attributed to lowerthan usual temperatures in the laboratory — see text.)
11

variability in the d(O3-NO) and IntOH, with the data for the Set 1 and (to a lesser extent) Set 2 runs
tended to decrease with time, and the results of the Set 3 runs had large variability around the time of runs
300-320. On the other hand, the d(O3-NO)/IntOH ratios were almost constant, changing only when the
initial mini-surrogate was changed for Set 3.
Most of this variability in the base case results can be attributed to known variabilities in run
conditions. The results of the periodic NO2 actinometry experiments indicated that the light intensity
decreased by ~17% during Set 1 and by ~7% during Set 2, presumably due to the ageing of the
blacklights. This can explain the tendency of the d(O3-NO)baseand IntOHbaseto decrease with run number
for these sets. The temperature in the experiments was controlled primarily by the building air
conditioner, and occasional problems resulted in average temperatures as high as 305°K or as low as
297°K in a few experiments. These deviations in temperature explain the large deviations in the results
of the runs around 300-320. The initial reactant concentrations had a 5-10% variability, which can also
account for some of the variability in the results.
A linear multiple regression analysis was conducted to provide a means to correct for these
variations when determining the effects of the added VOCs. The temperature, light intensity (as
determined by fits of the results of the separate NO2 actinometry experiments to run number) and
measured initial reactant concentrations were used as the prediction parameters, though most of the
variability could be explained by the variation in temperature and light intensity alone. The solid lines
on Figure 2 show the predictions of these regressions, and the dotted lines show the (oneσ) uncertainties
of the estimates for each run. It can be seen that the regression explained most of the observed variabili-
ties in the d(O3-NO)baseand IntOHbaseresults. The results of these regressions were then used to predict
base case values corresponding to the temperatures, light intensities, and initial reactant concentrations of
each of the added test VOC runs.
The uncertainty levels of these regressions estimates are important because they provide an
estimate of the run-to-run variability in our experiments, which ultimately limits the precision of the
reactivity measurements. For example, the uncertainties of the estimates of the 6-hour d(O3-NO)base for
the Set 3 runs were typically 6%, and typically the addition of a test VOC causes a 40% increase in
d(O3-NO). If the d(O3-NO)test is assumed to have the same uncertainty due to run-to-run variability as
d(O3-NO)base, then this yields a 21% estimated uncertainty in the change in d(O3-NO) caused by adding
the VOC. This is larger than the uncertainty in the amount of test VOC added and is usually larger than
the uncertainty in the amount reacted. Thus this is the major factor affecting the stated uncertainties of
most of the incremental and mechanistic reactivity measurements.
12

Reactivity Results
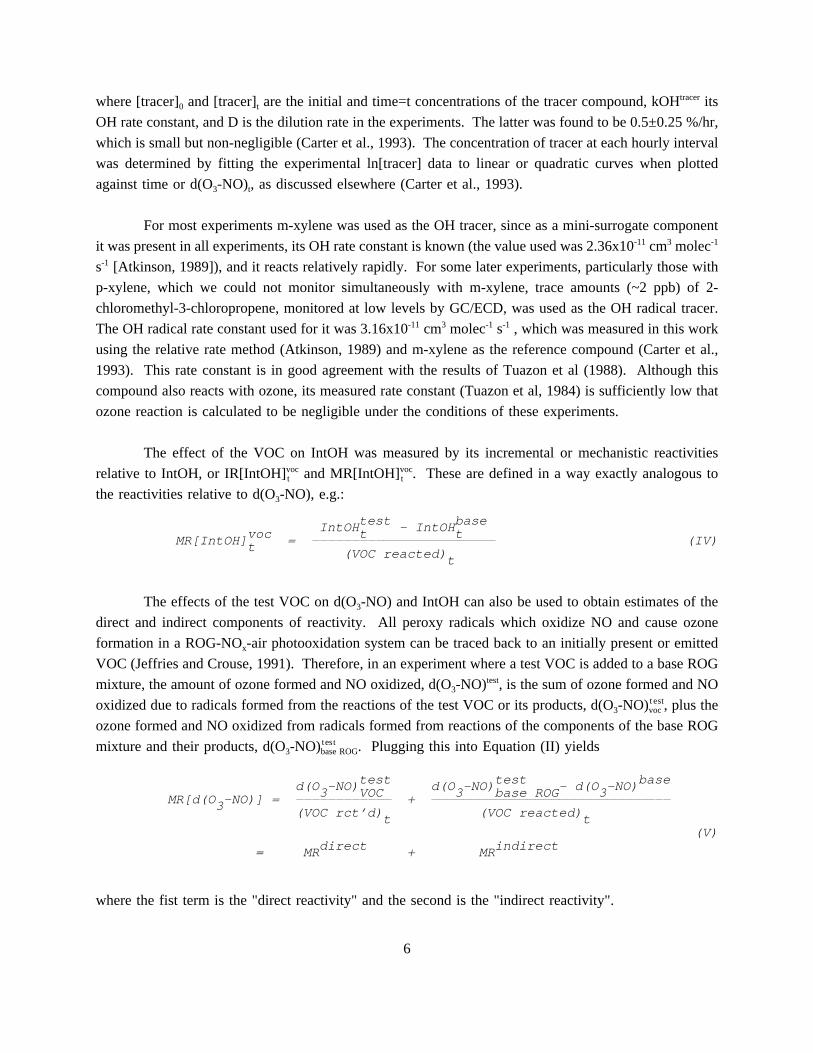
A summary of the major results of each reactivity experiment is given in Table 1. This includes
the run set and run number, the amount of test VOC added and reacted, the 6-hour d(O3-NO) incremental
and mechanistic reactivities, and the direct and indirect mechanistic reactivities. Footnotes indicate
whether the amounts reacted were determined by direct measurement or derived from the measured
IntOH’s and the VOC’s OH rate constant. The uncertainties in the amounts added and reacted refer to
measurement precision (not accuracy) and, when applicable, uncertainties in measured IntOH due to
variabilities in the m-xylene or radical tracer data. The uncertainties in the reactivities reflect these
uncertainties in amounts added or reacted, run-to-run variability (discussed above), and, for direct and
indirect reactivities, uncertainties in IntOH determinations. These can be thought of as reflecting oneσconfidence levels. More detailed tabulations of the results of these experiments are given elsewhere
(Carter et al., 1993). Direct mechanistic reactivities are not shown for those VOCs for which the
derivation is not considered to be meaningful (discussed below). Plots of selected reactivity results as a
function of reaction time for selected experiments or VOCs are shown in the companion paper, which
discusses model simulations of these data (Carter, 1995).
The amounts of test VOC reacted could not be determined in the formaldehyde experiments. The
IntOH method (Equation X) is inappropriate because formaldehyde is significantly by photolysis, and the
direct method could not be used because formaldehyde is a product from the mini-surrogate components
(especially ethylene). However, to allow for comparisons with mechanistic reactivities for other VOCs,
Table 1 gives estimates of their mechanistic reactivities derived from the experimental incremental
reactivities and estimates of amounts reacted derived from computer model calculations (Carter, 1995).
The model calculation affects only the comparison of the magnitudes of the mechanistic reactivities with
those for the other VOCs, and not the results in terms of the relative importance of the direct vsindirect
reactivity components. The model calculation for the amount of formaldehyde reacted is unlikely to be
significantly in error because most of the added formaldehyde is calculated to react. (The stated
uncertainty levels for formaldehyde Table 1 do not take modeling uncertainty into account.)
At least two, and usually more, reactivity determinations were carried out for each VOC, though
not all experiments provided useful data. This is because some experiments had insufficient test VOC
added for its effect to be significantly above run-to-run variability. Because of this, data from only one
useful experiment each are available for n-hexane and ethylbenzene.
The results of most of the experiments were reasonably consistent with each other given the
experimental uncertainties and variabilities, with the exception of one CO run and several ethane, n-butane
and propene runs. In the case of CO, the CO was not purified in the first run (number 414) carried out
for that compound, and a theoretically unreasonable (see below) direct mechanistic reactivity, due to an
anomalously high IntOH, was observed. The CO was purified for subsequent runs, which gave more
theoretically reasonable results. Three of the nine ethane runs gave higher reactivities than the other runs,
13

Table 1. Summary of Reactivity Results for the Test VOC Experiments.
ReactivitySet Run Added Reacted Incremental Mechanistic (mol O 3-NO/mol reacted)
(ppm) (ppm) (meth) (mol O 3-NO/[a] mol added) Total Indirect [b] Direct [c]
Carbon Monoxide4 418 102. 0.731 ( 4%) I 0.0048 (10%) 0.7 + 0.1 -0.3 + 0.3 0.9 + 0.34 416 147. 0.879 ( 5%) I 0.0034 (11%) 0.6 + 0.1 -0.3 + 0.3 0.8 + 0.3
Wt. Avgs = 0.6 + 0.1 -0.3 + 0.2 0.9 + 0.2
Ethane1 68 9.99 0.092 ( 4%) I [e]1 62 17.6 0.153 ( 4%) I 0.0142 (23%) 1.6 + 0.4 -0.5 + 0.4 2.1 + 0.41 79 17.9 0.140 ( 5%) I 0.0075 (43%) 1.0 + 0.4 -0.5 + 0.5 1.5 + 0.41 73 18.1 0.129 ( 5%) I 0.0053 (60%) 0.7 + 0.4 -1.0 + 0.5 1.7 + 0.41 88 24.3 0.189 ( 5%) I 0.0123 (20%) 1.6 + 0.3 -0.3 + 0.4 1.9 + 0.32 92 17.5 0.114 ( 5%) I 0.0067 (18%) 1.0 + 0.2 -0.3 + 0.3 1.3 + 0.22 99 17.6 0.107 ( 6%) I 0.0069 (17%) 1.1 + 0.2 -0.5 + 0.3 1.6 + 0.33 332 [d] 20.0 0.191 ( 4%) I 0.0129 (22%) 1.4 + 0.3 -0.4 + 0.5 1.8 + 0.53 333 [d] 21.1 0.247 ( 3%) I 0.0217 (12%) 1.9 + 0.2 0.5 + 0.4 1.4 + 0.43 235 43.4 0.324 ( 5%) I 0.0057 (23%) 0.8 + 0.2 -0.5 + 0.3 1.2 + 0.2
Wt. Avgs = 1.0 + 0.3 -0.5 + 0.2 1.5 + 0.3
Propane3 226 11.28 0.250 ( 6%) I [e]3 305 20.3 0.473 ( 6%) I 0.0154 (18%) 0.7 + 0.1 -0.5 + 0.2 1.2 + 0.23 230 28.0 0.526 ( 8%) I 0.0171 (12%) 0.9 + 0.1 -0.6 + 0.2 1.5 + 0.2
Wt. Avgs = 0.8 + 0.2 -0.6 + 0.1 1.3 + 0.2
n-Butane1 59 1.82 0.127 ( 5%) I 0.0654 (49%) 0.9 + 0.5 -1.0 + 0.8 1.8 + 0.71 51 2.35 0.164 ( 5%) I 0.0625 (43%) 0.9 + 0.4 -1.2 + 0.5 2.2 + 0.51 53 [d] 5.22 0.385 ( 4%) I 0.0395 (30%) 0.5 + 0.2 -0.4 + 0.2 0.9 + 0.21 82 6.75 0.276 ( 7%) I 0.0282 (31%) 0.7 + 0.2 -1.0 + 0.3 1.7 + 0.21 86 6.98 0.280 ( 8%) I 0.0333 (25%) 0.8 + 0.2 -1.0 + 0.3 1.8 + 0.22 135 6.03 0.215 ( 9%) I 0.0217 (16%) 0.6 + 0.1 -0.8 + 0.1 1.4 + 0.22 97 6.17 0.214 ( 9%) I 0.0281 (12%) 0.8 + 0.1 -1.0 + 0.2 1.7 + 0.22 94 7.11 0.272 ( 8%) I 0.0189 (19%) 0.5 + 0.1 -0.7 + 0.1 1.1 + 0.13 224 10.00 0.358 ( 9%) I 0.0212 (27%) 0.6 + 0.2 -1.1 + 0.3 1.7 + 0.2
Wt. Avgs = 0.6 + 0.1 -0.9 + 0.2 1.5 + 0.3
Isobutane3 228 2.69 0.135 ( 6%) I [e]3 303 6.65 0.306 ( 6%) I 0.0322 (27%) 0.7 + 0.2 -0.9 + 0.3 1.6 + 0.23 241 10.32 0.457 ( 6%) I 0.0488 (11%) 1.1 + 0.1 -0.6 + 0.2 1.7 + 0.23 232 20.8 0.545 (11%) I 0.0327 ( 9%) 1.3 + 0.2 -0.7 + 0.2 2.0 + 0.2
Wt. Avgs = 1.1 + 0.2 -0.7 + 0.2 1.7 + 0.2
n-Hexane3 201 1.44 0.049 (25%) I -0.0831 (47%) -2.5 + 1.3 -11.1 + 3.3 8.6 + 2.43 209 1.61 0.101 (13%) I -0.105 (33%) -1.7 + 0.6 -3.8 + 1.0 2.2 + 0.7
Wt. Avgs = -1.8 + 0.6 -4.5 + 2.3 2.7 + 1.8
Isooctane3 291 10.07 0.402 (11%) I 0.0147 (40%) 0.4 + 0.2 -1.5 + 0.3 2.0 + 0.33 293 10.73 0.430 (11%) I 0.0136 (41%) 0.3 + 0.1 -1.4 + 0.3 1.8 + 0.2
Wt. Avgs = 0.4 + 0.1 -1.4 + 0.2 1.8 + 0.2
n-Octane3 239 1.57 0.083 (19%) I -0.234 (16%) -4.4 + 1.1 -6.8 + 1.8 2.4 + 0.93 237 1.68 0.120 (14%) I -0.222 (15%) -3.1 + 0.6 -4.6 + 1.0 1.4 + 0.5
Wt. Avgs = -3.4 + 0.8 -5.1 + 1.3 1.7 + 0.6
Ethene3 203 0.176 0.077 (26%) D 1.09 (31%) 2.5 + 1.0 2.3 + 1.33 199 0.354 0.173 (14%) D 1.31 (14%) 2.7 + 0.5 1.7 + 0.6 1.0 + 0.6
Wt. Avgs = 2.6 + 0.4 1.8 + 0.6 1.0 + 0.6
Propene1 65 0.087 0.074 ( 2%) D 1.75 (37%) 2.1 + 0.8 1.2 + 1.0 1.0 + 0.91 72 0.124 0.098 ( 3%) D 0.750 (61%) 1.0 + 0.6 0.8 + 0.7 0.1 + 0.62 110 0.083 0.058 ( 3%) D 2.39 (11%) 3.4 + 0.4 0.6 + 0.5 3.0 + 0.52 106 0.089 0.066 ( 3%) D 2.37 (10%) 3.2 + 0.3 1.5 + 0.4 1.7 + 0.42 108 0.091 0.064 ( 3%) D 1.79 (13%) 2.6 + 0.3 1.4 + 0.4 1.4 + 0.42 118 0.168 0.128 ( 3%) D 1.48 (10%) 1.9 + 0.2 0.8 + 0.2 1.0 + 0.2
Wt. Avgs = 2.4 + 0.7 1.0 + 0.3 1.3 + 0.8
14
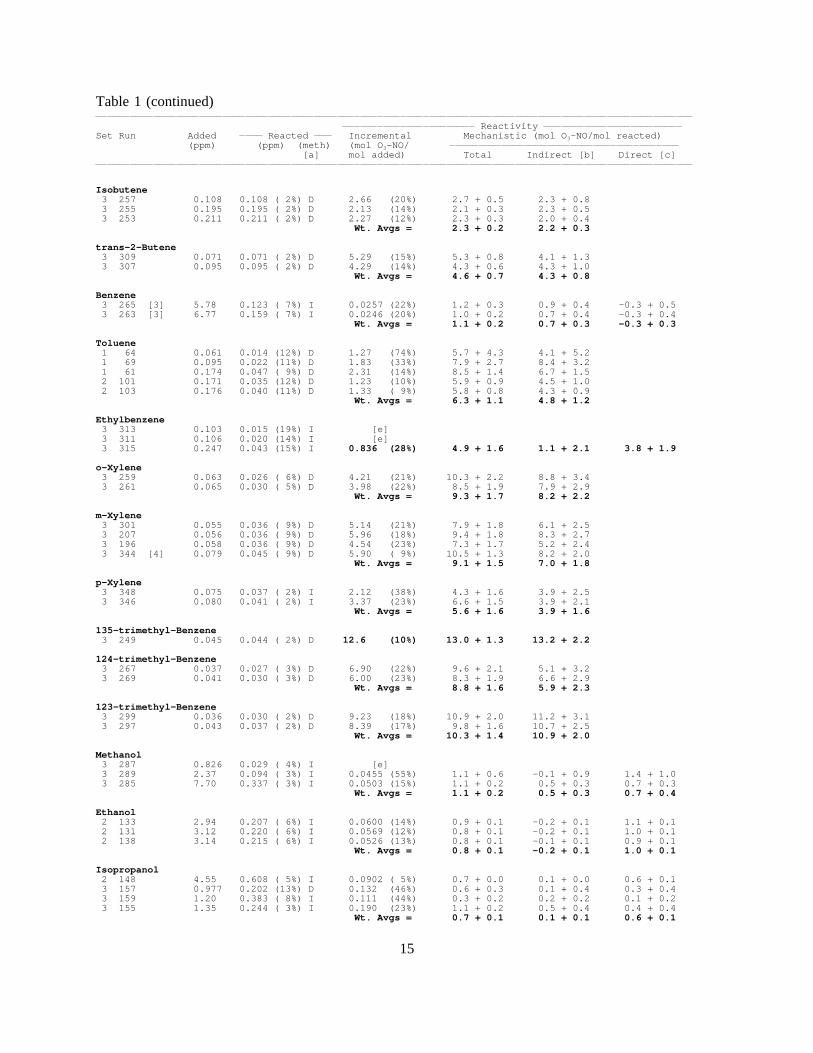
Table 1 (continued)
ReactivitySet Run Added Reacted Incremental Mechanistic (mol O 3-NO/mol reacted)
(ppm) (ppm) (meth) (mol O 3-NO/[a] mol added) Total Indirect [b] Direct [c]
Isobutene3 257 0.108 0.108 ( 2%) D 2.66 (20%) 2.7 + 0.5 2.3 + 0.83 255 0.195 0.195 ( 2%) D 2.13 (14%) 2.1 + 0.3 2.3 + 0.53 253 0.211 0.211 ( 2%) D 2.27 (12%) 2.3 + 0.3 2.0 + 0.4
Wt. Avgs = 2.3 + 0.2 2.2 + 0.3
trans-2-Butene3 309 0.071 0.071 ( 2%) D 5.29 (15%) 5.3 + 0.8 4.1 + 1.33 307 0.095 0.095 ( 2%) D 4.29 (14%) 4.3 + 0.6 4.3 + 1.0
Wt. Avgs = 4.6 + 0.7 4.3 + 0.8
Benzene3 265 [3] 5.78 0.123 ( 7%) I 0.0257 (22%) 1.2 + 0.3 0.9 + 0.4 -0.3 + 0.53 263 [3] 6.77 0.159 ( 7%) I 0.0246 (20%) 1.0 + 0.2 0.7 + 0.4 -0.3 + 0.4
Wt. Avgs = 1.1 + 0.2 0.7 + 0.3 -0.3 + 0.3
Toluene1 64 0.061 0.014 (12%) D 1.27 (74%) 5.7 + 4.3 4.1 + 5.21 69 0.095 0.022 (11%) D 1.83 (33%) 7.9 + 2.7 8.4 + 3.21 61 0.174 0.047 ( 9%) D 2.31 (14%) 8.5 + 1.4 6.7 + 1.52 101 0.171 0.035 (12%) D 1.23 (10%) 5.9 + 0.9 4.5 + 1.02 103 0.176 0.040 (11%) D 1.33 ( 9%) 5.8 + 0.8 4.3 + 0.9
Wt. Avgs = 6.3 + 1.1 4.8 + 1.2
Ethylbenzene3 313 0.103 0.015 (19%) I [e]3 311 0.106 0.020 (14%) I [e]3 315 0.247 0.043 (15%) I 0.836 (28%) 4.9 + 1.6 1.1 + 2.1 3.8 + 1.9
o-Xylene3 259 0.063 0.026 ( 6%) D 4.21 (21%) 10.3 + 2.2 8.8 + 3.43 261 0.065 0.030 ( 5%) D 3.98 (22%) 8.5 + 1.9 7.9 + 2.9
Wt. Avgs = 9.3 + 1.7 8.2 + 2.2
m-Xylene3 301 0.055 0.036 ( 9%) D 5.14 (21%) 7.9 + 1.8 6.1 + 2.53 207 0.056 0.036 ( 9%) D 5.96 (18%) 9.4 + 1.8 8.3 + 2.73 196 0.058 0.036 ( 9%) D 4.54 (23%) 7.3 + 1.7 5.2 + 2.43 344 [4] 0.079 0.045 ( 9%) D 5.90 ( 9%) 10.5 + 1.3 8.2 + 2.0
Wt. Avgs = 9.1 + 1.5 7.0 + 1.8
p-Xylene3 348 0.075 0.037 ( 2%) I 2.12 (38%) 4.3 + 1.6 3.9 + 2.53 346 0.080 0.041 ( 2%) I 3.37 (23%) 6.6 + 1.5 3.9 + 2.1
Wt. Avgs = 5.6 + 1.6 3.9 + 1.6
135-trimethyl-Benzene3 249 0.045 0.044 ( 2%) D 12.6 (10%) 13.0 + 1.3 13.2 + 2.2
124-trimethyl-Benzene3 267 0.037 0.027 ( 3%) D 6.90 (22%) 9.6 + 2.1 5.1 + 3.23 269 0.041 0.030 ( 3%) D 6.00 (23%) 8.3 + 1.9 6.6 + 2.9
Wt. Avgs = 8.8 + 1.6 5.9 + 2.3
123-trimethyl-Benzene3 299 0.036 0.030 ( 2%) D 9.23 (18%) 10.9 + 2.0 11.2 + 3.13 297 0.043 0.037 ( 2%) D 8.39 (17%) 9.8 + 1.6 10.7 + 2.5
Wt. Avgs = 10.3 + 1.4 10.9 + 2.0
Methanol3 287 0.826 0.029 ( 4%) I [e]3 289 2.37 0.094 ( 3%) I 0.0455 (55%) 1.1 + 0.6 -0.1 + 0.9 1.4 + 1.03 285 7.70 0.337 ( 3%) I 0.0503 (15%) 1.1 + 0.2 0.5 + 0.3 0.7 + 0.3
Wt. Avgs = 1.1 + 0.2 0.5 + 0.3 0.7 + 0.4
Ethanol2 133 2.94 0.207 ( 6%) I 0.0600 (14%) 0.9 + 0.1 -0.2 + 0.1 1.1 + 0.12 131 3.12 0.220 ( 6%) I 0.0569 (12%) 0.8 + 0.1 -0.2 + 0.1 1.0 + 0.12 138 3.14 0.215 ( 6%) I 0.0526 (13%) 0.8 + 0.1 -0.1 + 0.1 0.9 + 0.1
Wt. Avgs = 0.8 + 0.1 -0.2 + 0.1 1.0 + 0.1
Isopropanol2 148 4.55 0.608 ( 5%) I 0.0902 ( 5%) 0.7 + 0.0 0.1 + 0.0 0.6 + 0.13 157 0.977 0.202 (13%) D 0.132 (46%) 0.6 + 0.3 0.1 + 0.4 0.3 + 0.43 159 1.20 0.383 ( 8%) I 0.111 (44%) 0.3 + 0.2 0.2 + 0.2 0.1 + 0.23 155 1.35 0.244 ( 3%) I 0.190 (23%) 1.1 + 0.2 0.5 + 0.4 0.4 + 0.4
Wt. Avgs = 0.7 + 0.1 0.1 + 0.1 0.6 + 0.1
15

Table 1 (continued)
ReactivitySet Run Added Reacted Incremental Mechanistic (mol O 3-NO/mol reacted)
(ppm) (ppm) (meth) (mol O 3-NO/[a] mol added) Total Indirect [b] Direct [c]
Dimethyl Ether3 295 2.11 0.205 ( 4%) I 0.0964 (29%) 1.0 + 0.3 -0.4 + 0.4 1.5 + 0.43 283 2.12 0.214 ( 4%) I 0.141 (19%) 1.4 + 0.3 -0.4 + 0.4 1.9 + 0.43 281 3.41 0.352 ( 4%) I 0.107 (16%) 1.0 + 0.2 -0.1 + 0.2 1.2 + 0.23 279 4.05 0.439 ( 4%) I 0.118 (12%) 1.1 + 0.1 0.0 + 0.2 1.1 + 0.2
Wt. Avgs = 1.1 + 0.1 -0.1 + 0.2 1.3 + 0.3
Formaldehyde3 352 0.100 (0.079 [f]) 2.61 (22%) 3.3 + 0.7 4.1 + 1.23 357 0.257 (0.210 [f]) 1.47 (15%) 1.8 + 0.3 2.7 + 0.5
Wt. Avgs = 2.0 + 0.6 2.9 + 0.7
Acetaldehyde3 335 0.645 0.260 ( 6%) D 0.264 (33%) 0.7 + 0.2 -0.8 + 0.4 1.5 + 0.33 338 1.21 0.433 ( 7%) D 0.145 (32%) 0.4 + 0.1 -0.9 + 0.2 1.3 + 0.2
Wt. Avgs = 0.5 + 0.2 -0.9 + 0.2 1.4 + 0.2
[a] Method used to derive amount reacted: D = direct method (Equation IX); I = IntOH Method (Equation X).[b] Estimated using Equation (VIII).[c] Estimated using Equation (VII).[d] Data from this run appear to be anomalous and were not used for computing average reactivities. See text.[e] Uncertainty is greater than magnitude of reactivity.[f] The amounts of formaldehyde reacted could not be determined. The amounts reacted used to derive the
mechanistic reactivities were estimated using model calculations of fractions reacted. The modelcalculations used the updated mechanism as discussed by Carter et al. (1995). Uncertainty estimatesin mechanistic reactivities do not include uncertainty in amounts reacted.
with run 333 being clearly anomalous. This is attributed to contamination by some reactive impurity in
the ethane sample — relatively large amounts of ethane (over 20 ppm in the case of the most anomalous
run) are needed to yield a useful reactivity measurement. One n-butane run had an anomalously high
IntOH reactivity, and another had an anomalously high direct reactivity compared to the other seven runs
carried out with this compound. In the case of propene, two of the Set 2 runs had 6-hour d(O3-NO)
reactivities which were about twice as high as two Set 1 runs or the Set 2 run with the most precise
reactivity measurement. The ethane and CO runs with probable contaminants (332, 333 and 412) and the
most anomalous n-butane run (53) were not used in computing the average reactivities for the purpose of
evaluating model predictions, but the data from the other runs mentioned above were not rejected.
The experiments with added benzene were somewhat unique in that these were the only runs
where a "true" ozone maximum was observed. This can be seen on Figure 3, which compares the
concentration-time plots for d(O3-NO) in a representative benzene run with comparable data for several
other VOCs. This is predicted by the model calculations (Carter, 1995). These results indicate that O3
is NOx-limited in these experiments, since the decline in the ozone concentration can be attributed to the
NOx being consumed, ending ozone formation, since NOx is required for ozone to form. (The uncorrected
NO2 data do not give a good indication of NOx consumption, since the instrument also responds to organic
nitrates and HNO3 [Winer et al., 1974]. The calculated NO2 does not include this interference.) This
means that the assumptions underlying the derivations of the direct and indirect reactivities are not valid
throughout these runs, though they are valid in the 3-4 hours in the run before the NOx is consumed. For
16

Figure 3. Concentration-time plots for d(O3-NO) in representative reactivity experiments for benzeneand selected other VOCs where comparable initial NO oxidation rates were observed.
better comparability with the data shown for the other VOCs, which are all for conditions where NOx is
still remaining, the data shown on Table 1 for benzene are for t=3 hours, rather than t=6. Benzene is the
only VOC for which NOx-limited ozone formation was apparently observed; for all other added VOC runs
the production of ozone was still occurring at a significant rate at the end of the runs.
Table 1 also shows the weighed averages of the mechanistic reactivities for the various
compounds. Data for experiments which are considered to be anomalous, as indicated in the discussion
above and the footnotes to the table, are not included in the averages.
17

DISCUSSION
The results of these experiments are consistent with previous experimental (Carter and Atkinson,
1987) and computer modeling (e.g., Dodge, 1984; Carter and Atkinson, 1989a; Chang and Rudy, 1990;
Carter, 1991) studies in showing that different VOCs have significantly different effects on ozone
formation, even after differences in reaction rates are taken into account (Carter and Atkinson, 1989a;
Carter, 1991). The measure which has the most direct relationship to the effect of a VOC’s reactions on
ozone formation is its mechanistic reactivity with respect to d(O3-NO). This quantity, expressed as moles
O3 formed + NO oxidized per mole VOC reacted, ranges from highs of approximately 10-15 for the
trialkylbenzenes to lows of -5 for n-octane. On a per-carbon basis, the compound with the highest
measured d(O3-NO) mechanistic reactivity is formaldehyde (with an average of ~2 moles O3-NO formed
per mole C reacted), followed by methanol (1.4), the alkylbenzenes (but not benzene) (0.7-1.5), the
alkenes (0.6-1.3), and ethane (~0.6). These are the compounds which cause the most ozone formation
once they react. Propane, n-butane, isobutane, isooctane, benzene, acetaldehyde, and the C3+ alcohols
and ethers also promote ozone formation, but with much less efficiency, with the efficiency being lowest
for isooctane and benzene. The C6+ n-alkanes inhibit NO oxidation and ozone formation in our
experiments.
The processes by which VOCs promote or inhibit ozone formation involve the interaction of a
number of factors. VOCs promote ozone formation by reacting to form peroxy radicals which react to
oxidize NO and shift the NO, NO2, ozone photostationary state towards higher ozone levels. The
maximum amount of ozone formation which can be directly caused by a VOC’s reactions is the amount
of NO it oxidizes when it reacts. However, VOCs also affect ozone formation indirectly, by affecting how
much ozone is formed from the reactions of all other VOCs. If the reactions of a VOC enhance or inhibit
overall radical levels, it would affect how rapidly all VOCs present react and form ozone. This is
important for determining maximum reactivities of VOCs, since these reflect primarily how VOCs affect
ozone formation rates (Carter, 1991). The presence of NOx is required for ozone formation to occur, and
if the reactions of a VOC enhance the rate of NOx removal, it will reduce the maximum ozone formation
potential from reactions of all VOCs. This affects reactivities only when ozone is NOx limited, which is
not the case for the experiments discussed here, except for those with benzene.
The measurements of direct mechanistic reactivities provide an indication of the amount of ozone
formation directly caused by the reaction of the VOCs, independent (to a first approximation) of how the
VOC’s reactions affect the reactions of other VOCs. Unfortunately, experimental uncertainties tend to
dominate the derivation of this quantity for compounds with large positive IntOH reactivities, and the
direct reactivities derived for the alkylbenzenes and most of the alkenes have such high uncertainties that
they are probably not meaningful. The assumption that the VOC is not affecting ratios of amounts of
ozone directly formed to amounts of ROG reacted for the base ROG components may break down when
the test VOC has a large effect on the radicals in the system, because the test VOC would also have a
large effect on the extent of reaction of the base ROG components. For that reason, direct mechanistic
18

reactivities for VOCs with indirect (i.e., radical) reactivities greater than ~2 are not shown on Table 1.
As discussed above, the assumptions involved in the derivation of direct reactivities are not valid for the
final periods of the added benzene runs, where ozone is apparently NOx limited. However, information
could be obtained concerning the direct reactivity of benzene from the data from the early periods of the
runs.
Useful information concerning direct reactivities were obtained for the alkanes, alcohols, and
ethers. In most cases the results were consistent with our understanding of the atmospheric reactions of
these VOCs. For example, the major processes consuming both ethane and ethanol involve formation of
acetaldehyde, but two NO to NO2 conversions are involved in the ethane mechanism, while only one is
involved for ethanol (excluding the estimated 10% reaction at the methyl group):
O NO O NO2 2OH + C H C H OO C H O HO OH2 6 2 5 2 5 2-H O NO CH CHO NO2 2 3 2
O NO2OH + C H OH CHCHOH HO OH2 5 3 2-H O CH CHO NO2 3 2
Thus, the expected direct mechanistic reactivities are 2 for ethane and 1 ethanol. These are consistent with
the observed values of 1.7 ± 0.3 and 1.0 ± 0.1, respectively. The other alcohols are expected to have
similar mechanisms as ethanol, and indeed they also have relatively low direct mechansitic reactivities
compared to the alkanes. CO is also expected to have a direct mechanistic reactivity of ~1, and this is
indeed what is observed (except for the experiment where the CO was not purified). The MRdirect values
for the alkanes are in the 1.5 - 2.5 range, tending to increase with the size of the molecule. The higher
alkanes have the highest direct mechanistic reactivities of all the VOCs studied. This is expected because
higher alkanes have an increased tendency to have alkoxy radical decompositions and isomerization which
cause multi-step mechanisms involving additional NO oxidations.
Note that the direct reactivity by itself gives a poor prediction of a VOC’s effect on ozone. For
example, despite having the highest direct mechanistic reactivities, the higher alkanes form little ozone
or are ozone inhibitors in these experiments. The effect of the VOCs on radical levels, which are directly
measured by the IntOH reactivities (which are used to derive the indirect reactivities), appears to be a
more important factor. This is shown on Table 1, where it can be seen that for many VOCs the indirect
reactivities are higher in magnitude than the direct reactivities. Without exception, the VOCs which are
the highest in indirect (i.e., IntOH) reactivities also have the highest in d(O3-NO) reactivities, and those
with the most negative IntOH reactivities are also the strongest ozone inhibitors. Thus the major factor
accounting for extremes in reactivity is not the amount of ozone the VOC forms directly, but the extent
to which it affects how much ozone is formed from other VOCs.
19

Approximately half the compounds studied tended to enhance radical levels under the conditions
of these experiments, with the rest tending to inhibit radicals to various degrees. All the VOCs which
enhanced radicals had high mechanistic reactivities towards forming ozone. These included formaldehyde,
methanol, the alkenes and the alkylbenzenes. The enhancement caused by formaldehyde is attributed to
its direct photolysis to form radicals, while in the case of methanol and the aromatics the enhancement
is attributed to the formation of radical initiating products. In the case of methanol the radical initiating
product is formaldehyde, while in the case of the aromatics the known radical initiating products are
α-dicarbonyls such as methyl glyoxal. Aromatics also apparently form other photoreactive products which
have not been identified as such, since only models which assume this (or which use unrealistically high
α-dicarbonyl yields) can account for the high reactivities of aromatics. In the case of the alkenes, radical
formation can come directly from the reaction of the alkene with ozone, or indirectly from the formation
of photoreactive products such as formaldehyde.
Most other VOCs tend to suppress radical levels. In the case of alkanes this is attributed to
removal of peroxy radicals by reactions with NO to form alkyl nitrates, while in the case of acetaldehyde
and ethanol (which forms acetaldehyde), this is attributed to the removal of acetyl peroxy radicals by
reaction with NO2 to form PAN. In the case of isobutane, removal of alkoxy radicals by reaction with
NO2 to form a nitrate also appears to be significant under the conditions of these experiments (Carter et
al., 1993), though this is expected to be less important in the atmosphere because the NO2 levels are
generally lower. However, the inhibition by the peroxy + NO reactions in the other alkane systems or the
PAN formation from acetaldehyde are expected to be of comparable importance in the atmosphere as they
are in these experiments, since the relative importance of these reactions are not dependent on total NO2
levels (though it does depend on the NO2/NO ratio).
It is interesting to note that CO also has a slight tendency to suppress radicals, despite the fact that
no radical terminations are involved in its photooxidation. Its only reaction is to convert OH to HO2, and
it forms no reactive products. Thus, simply converting NO to NO2 (as results when HO2 reacts with NO
to regenerate OH) must cause at least some suppression of integrated OH radical levels in these
experiments. This is probably due to the enhanced reactions of OH with NO2 resulting from the more
rapid increase of NO2 caused by this conversion. Since essentially all VOCs have some reactions which
convert NO to NO2, they would all inherently have this slight tendency to reduce radicals, even if they
or their products did not have direct radical termination reactions.
Most of the compounds which suppress radical levels still have positive d(O3-NO) reactivities, i.e.,
still cause enhanced ozone formation under the conditions of our experiments. In these cases the
additional ozone formation caused by the VOC’s direct reactions is sufficient to counter their effects on
reducing ozone formation from other VOCs (see Table 1, above). In the case of acetaldehyde, direct
radical formation from its photolysis would also counter inhibition due to PAN formation, which becomes
increasingly important with reaction time since PAN formation becomes more favorable as NO is
converted to NO2. This is consistent with the fact that the IntOH mechanistic reactivity of acetaldehyde
20

decreases with reaction time [see Figure 6 in the companion paper (Carter, 1995)]. In general, as one
would expect, the efficiency in ozone formation (i.e., the d(O3-NO) mechanistic reactivities) decrease as
the tendency to suppress radicals increased, and when the suppression becomes sufficiently large, it
overwhelms the positive effect on ozone formation of the VOC’s direct reactions, making the compound
a net ozone inhibitor. This is the case for the C6+ n-alkanes under the conditions of our experiments.
Thus for VOCs which are radical inhibitors, there is a balance between opposing effects of the
VOC causing additional ozone formation from its direct reactions, and its causing lower radicals and thus
less ozone formation from other VOCs. Which effect is more important can vary depending on
conditions. Model simulations suggest that this balance is somewhat different under atmospheric
conditions than in these experiments, since n-hexane and n-octane, which are correctly predicted by the
model to have negative reactivities in these experiments, are predicted by the same model to have positive
(though small) maximum incremental reactivities in the atmosphere (Carter, 1991, 1994). Apparently
effects on radicals are somewhat less important in affecting ozone reactivities in the atmosphere, or in the
presence of the more complex atmospheric mixtures, than in these experiments. However, the small
magnitudes of the atmospheric reactivities of these radical inhibiting VOCs indicate that the radical
inhibition is still significantly suppressing their reactivities in the atmosphere.
CONCLUSIONS
We believe that this study has provided data which will be useful for reducing the chemical
mechanistic uncertainties in maximum incremental reactivity scales for ozone formation in the atmosphere.
Data were obtained which can test model predictions of maximum reactivities of a variety of different
VOCs, including representative alkanes, alkenes, aromatic hydrocarbons, alcohols, and ethers. Other types
of compounds were also studied (Carter et al., 1993), which will be discussed in subsequent papers. A
number of these compounds have never been studied previously in environmental chamber experiments
suitable for model evaluation, except perhaps as parts of complex mixtures of many other VOCs, or in
experiments whose results are dominated by poorly characterized chamber effects. This study has
provided the most useful presently available data concerning ozone reactivities of alkanes, because results
of experiments where alkanes are irradiated in the absence of other VOCs are so dominated by chamber
effects that they are essentially useless for mechanism testing (Carter and Lurmann, 1991). It has also
provided a needed addition to the existing data set for the other VOCs, most of which have not been
previously studied in this way.
It is important, however, to recognize that reactivities measured in these experiments should not
be extrapolated to the atmosphere without taking into account the differences in conditions between these
experiments and the atmosphere. These differences include spectral characteristics of the light sources,
higher absolute pollutant concentrations, the lack of dilution and continuous emissions, the lack of
background or entrained pollutants, and the highly simplified base ROG surrogate in the experiments. The
21

extrapolation to atmospheric conditions can be carried out by using these data to evaluate the chemical
mechanisms used in the airshed models to calculate atmospheric reactivity, or by using models to derive
relationships which can be used to estimate atmospheric reactivities from those measured in the chamber.
The ultimate practical benefit of these data will come when the mechanisms used to calculate VOC
reactivities in the atmosphere are updated to take these results into account. An initial evaluation of
chemical mechanisms using the data from this work, and additional data needs required for mechanism
evaluation, is discussed in the companion paper (Carter, 1995).
ACKNOWLEDGEMENTS
The authors acknowledge Dr. Roger Atkinson of SAPRC for many helpful discussions, and for
assistance in carrying out these experiments and administering the above-referenced contracts and Mr.
William D. Long for providing valuable assistance in carrying out most of the experiments. We also
acknowledge Ms. Patricia McElroy, who conducted a major portion of the experimental work in the initial
experiments. Ms. Sara Aschmann and Dr. Ernesto Tuazon also provided occasional valuable assistance
in carrying out these experiments, and Ms. Minn Poe provided assistance with computer programming in
the data collection and analysis. Ms. Kathalena M. Smihula and Mr. Armando D. Avallone of the UCR
College of Engineering, Center for Environmental Research and Technology (CE-CERT) assisted in
carrying out the later experiments in this study. We thank Dr. Joseph Norbeck, director of CE-CERT, for
supporting Ms. Smihula and Mr. Avallone during this period.
This work was funded by a number of agencies. The initial experiments were funded by the
United States Environmental Protection Agency through Cooperative Agreement No. CR-814396-010-0.
Most of the experiments were funded jointly by the Coordinating Research Council (CRC) as project No.
ME-9, and by the California Air Resources Board through Contract No. A032-0692. Additional support
for this project was provided by the California South Coast Air Quality Management District through
Technical Services Agreement Carter-88 and through Contract No. C91323. Funding through the CRC
contract was supplemented by contributions from the National Aerosol Association to study propane,
isobutane, and dimethyl ether.
REFERENCES
Atkinson, R. (1989): "Kinetics and Mechanisms of the Gas-Phase Reactions of the Hydroxyl Radical withOrganic Compounds," J. Phys. Chem. Ref. Data, Monograph no. 1.
Atkinson, R. (1990): "Gas-Phase Tropospheric Chemistry of Organic Compounds: A Review," Atmos.Environ., 24A, 1-24.
22

Bowman, F. M. and J. H. Seinfeld (1994a): "Ozone Productivity of Atmospheric Organics," J. Geophys.Res. ??, 5309.
Bowman, F. M. and J. H. Seinfeld (1994b): "Fundamental Basis of Incremental Reactivities of Organicsin Ozone Formation in VOC/NOx Mixtures," J. Geophys Res., in press.
CARB (1990): "Low-Emission Vehicles/Clean Fuels -- Technical Support Document," Mobile SourceDivision, Research Division, Stationary Source Division, and Technical Support Division,California Air Resources Board, Sacramento, CA.
CARB (1991): "Proposed Reactivity Adjustment Factors for Transitional Low-Emissions Vehicles:Technical Support Document," California Air Resources Board, Sacramento, CA., September 27.
Carter, W. P. L. (1990): "A Detailed Mechanism for the Gas-Phase Atmospheric Reactions of OrganicCompounds," Atm. Environ., 24A, 481-518.
Carter, W. P. L. (1991): "Development of Ozone Reactivity Scales for Volatile Organic Compounds",EPA-600/3-91/050, August.
Carter, W. P. L. (1994): "Development of Ozone Reactivity Scales for Volatile Organic Compounds,"J. Air & Waste Manage. Assoc. 44, 881-899.
Carter, W. P. L. (1995): "Computer Modeling of Environmental Chamber Studies of MaximumIncremental Reactivities of Volatile Organic Compounds," Submitted to Atmos. Environ.
Carter, W. P. L. and R. Atkinson (1987): "An Experimental Study of Incremental HydrocarbonReactivity," Environ. Sci. Technol., 21, 670-679
Carter, W. P. L. and R. Atkinson (1989a): "A Computer Modeling Study of Incremental HydrocarbonReactivity", Environ. Sci. and Technol., 23, 864-880.
Carter, W. P. L., R. Atkinson, A. M. Winer, and J. N. Pitts, Jr. (1982): "Experimental Investigation ofChamber-Dependent Radical Sources," Int. J. Chem. Kinet., 14, 1071.
Carter, W. P. L., and F. W. Lurmann (1990): "Evaluation of the RADM Gas-Phase Chemical Mechanism,"Final Report, EPA-600/3-90-001.
Carter, W. P. L. and F. W. Lurmann (1991): "Evaluation of a Detailed Gas-Phase Atmospheric ReactionMechanism using Environmental Chamber Data," Atmos. Environ., 25A, 2771-2806.
Carter, W. P. L., J. A. Pierce, I. L. Malkina, D. Luo, and W. D. Long (1993): "Environmental ChamberStudies of Maximum Incremental Reactivities of Volatile Organic Compounds," Report onCoordinating Research Council Project ME-9 and California Air Resources Board Contract No.A032-0692, April 1.
23

Carter, W. P. L., D. Luo, I. L. Malkina, and J. A. Pierce (1994): "Environmental Chamber Studies ofAtmospheric Reactivities of Volatile Organic Compounds. Effects of Varying ROG Surrogate andNOx," Draft final report to Coordinating Research Council, Inc., Project ME-9, California AirResources Board, Contract A032-0692, and South Coast Air Quality Management District,Contract C91323. September 10.
Chang, T. Y. and S. J. Rudy (1990): "Ozone-Forming Potential of Organic Emissions from Alternative--Fueled Vehicles," Atmos. Environ., 24A, 2421-2430.
Dodge, M. C. (1984): "Combined Effects of Organic Reactivity and NMHC/NOx Ratio on PhotochemicalOxidant Formation -- A Modeling Study," Atmos. Environ., 18, 1657-1665.
Jeffries, H. E. and R. Crouse (1991): "Scientific and Technical Issues Related to the Application ofIncremental Reactivity. Part II: Explaining Mechanism Differences," Report prepared for WesternStates Petroleum Association, Glendale, CA, October.
Jeffries H. E., K. G. Sexton, J. R. Arnold, and T. L. Kale (1989): "Validation Testing of New Mechanismswith Outdoor Chamber Data. Volume 2: Analysis of VOC Data for the CB4 and CALPhotochemical Mechanisms," Final Report, EPA-600/3-89-010b.
Johnson, G. M. (1983): "Factors Affecting Oxidant Formation in Sydney Air," in "The Urban Atmosphere-- Sydney, a Case Study." Eds. J. N. Carras and G. M. Johnson (CSIRO, Melbourne), pp. 393-408.
NRC (1991): "Rethinking the Ozone Problem in Urban and Regional Air Pollution", National ResearchCouncil Committee on Troposoheric Ozone Formation and Measurement, National AcademyPress, Washington, DC.
Russell, A. G. (1990): "Air Quality Modeling of Alternative Fuel Use in Los Angeles, CA: Sensitivityof Pollutant Formation to Individual Pollutant Compounds," the AWMA 83rd Annual Meeting,June 24-29.
Stockwell, W. R., P. Middleton, J. S. Chang, and X. Tang (1990): "The Second Generation RegionalAcid Deposition Model Chemical Mechanism for Regional Air Quality Modeling," J. Geophys.Res., 95, 16343- 16376.
Tuazon, E. C., R. Atkinson, S. M. Aschmann, M. A. Goodman and A. M. Winer (1988): "AtmosphericReactions of Chloroethenes with the OH Radical," Int J. Chem. Kinet., 20, 241-265.
Tuazon, E. C., R. Atkinson, A. M. Winer and J. N. Pitts, Jr. (1984): "A Study of the AtmosphericReactions of 1,3-Dichloroopropene and Other Selected Organochlorine Compounds," Arch.Environ. Contam. Toxicol., 13, 691-700.
Winer, A. M., J. W. Peters, J. P. Smith, and J. N. Pitts, Jr. (1984): "Response of CommercialChemiluminescent NO-NO2 Analyzers to Other Nitrogen-Containing Compounds," Environ. Sci.Technol., 8, 1118-1121.
Zafonte, L., P. L. Rieger, and J. R. Holmes (1977): "Nitrogen Dioxide Photolysis in the Los AngelesAtmosphere," Environ. Sci. Technol., 11, 483-487.
24