Embed Size (px)
Citation preview
Environmental assessment for
selected sanitation systems in India,
Indonesia, Malaysia and Nepal
July 2009
Anna Norström Frida Pettersson Erik Kärrman
CIT
Urb
an W
ater
Man
agem
ent
AB
Photo: Markus Starkl
Environmental assessment for sanitation systems
July 2009
2
CONTENT
Compilation of data and prerequisites ............................................................... 3
Results of environmental assessment ................................................................ 8
INDIA ............................................................................................................... 8
INDONESIA .................................................................................................... 11
MALAYSIA ..................................................................................................... 14
NEPAL ........................................................................................................... 17
Energy calculations .......................................................................................... 20
Pour Flush Toilet with septic tank .................................................................. 21
Option with a biogas digester ....................................................................... 21
Ecological Sanitation Option ......................................................................... 23
Community Imhoff Tank ................................................................................ 24
Aerated treatment plant ............................................................................... 25
REFERENCES ..................................................................................................... 26

Environmental assessment for sanitation systems
July 2009
3
Compilation of data and prerequisites
The environmental assessment was made using information of removal capacities and energy use
from data of evaluated technologies (first priority), literature data (second priority) and estimates
(third priority). Removal capacities for different technologies are often presented as a range,
however, to be able to perform a comparative analysis, assumptions have been made and removal
rates have been defined. A classification system has been formulated including removal rates for
nitrogen (N), phosphorus (P), organic matter (BOD) as well as cadmium (Cd) in sewage products for
use in agriculture (Table 1). The scale consisted of four classes; “low”, “moderate”, “high” and “very
high”. The classes low and moderate level were defined with the perspective that low level matches
poor technologies and acceptable technologies in this part of the world matches moderate level.
High level corresponds to what is acceptable for municipal wastewater management in a European
perspective, while very high quality corresponds to what is acceptable where the highest standards
are applied, for instance the requirements of large scale wastewater treatment plants in sensitive
coastal areas in Sweden.
Table 1. Classification key
Low removal Moderate removal High removal Very high removal
Nitrogen < 25 % 25-49 % 50-74 % ≥ 75 %
Phosphorus < 30 % 30-69 % 70-89 % ≥ 90 %
BOD < 50 % 50-79 % 80-89 % ≥ 90 %
Low quality Moderate quality High quality Very high quality
Cd (mg/kg DM) > 40 20-40 3-19 ≤ 2
The defined removal rates for selected technologies treating i) black water, ii) grey water and iii)
combined wastewater are presented in Table 2-4 respectively. However, it is important to note that
the stated removal rates are relating to emissions to the water recipient which significantly impact
on the removal rates of dry systems (i.e. systems including the urine diverting toilet) and biogas
digesters where most of the substances are trapped and removed with the solid fraction. It should
also be noted that, as mentioned above, the classification for cadmium in Table 1 is related to the
quality of sewage products, i.e. these levels are not used to classify the removal of cadmium by the
sanitation systems regarding discharge to the water recipient. For most technologies, removal rates
were taken from literature except for a few cases where data from analysis performed in Malaysia
could be used.

Environmental assessment for sanitation systems
July 2009
4
Table 2. Removal rates for selected technologies for black water treatment
Septic tank Upgraded
septic tank
Biogas
digester5,6
Two-pit
latrine8
Urine
diverting
toilet9
Soil
absorption
field
Removal of
nitrogen 10%
1 10%
1 0% 50% 100%
Low Low Low High Very high
Removal of
phosphorus 5%
1 62%
4 0% 80% 100% 35%
Low Moderate Low High Very high Moderate
Removal of BOD 62%2 77%
4 50%
7 80% 100% 35%
Moderate Moderate Low High Very high Moderate
Removal of
cadmium 25%
3 88%
4 0% 80% 100%
1 Swedish EPA (1985);
2 Kamil (2007);
3 Wittgren et al. (2003);
4 Local information from Malaysia concerning the
performance of Individual Septic Tanks (IST); 5
Biogas digester is also used for treating combined wastewater; 6
Assumption that 50% of N, 80% of P, 80% BOD and 80% Cd is retained in the solid phase and will not reach the
water recipient; 7 Alvarez et al (2008);
8 The stated removal rates are representing the fraction of the
substances that are retained in solids, same fractions are used as for biogas digester; 9 No substances are
contaminating the receiving water body in a dry system, hence, the removal rate is considered to be very high.
Table 3. Removal rates for selected technologies for grey water treatment
Constructed
Wetland1
Stabilisation
ponds
Storm
water filter Screen chamber
6
Subsurface sand
filter7
Removal of nitrogen 50%
60%2 0% 50%
High High Low High
Removal of
phosphorus 80% 40%
2 0% 50%
High Moderate Low Moderate
Removal of BOD 80% 70%3 70%
5 0% 90%
High High High Low Very high
Removal of cadmium
74% 50%4 0% 49%
1 Cui et al. (2003);
2 Mbwele (2006);
3 Picot et al. (2005);
4 Kaplan et al. (1986);
5 According to Malaysian local
partners; 6
Only screen solids according to Malaysia feasibility report; 7
Palm et al. (2002), Nilsson et al. (1998); 8 Wittgren et al. (2003).
Environmental assessment for sanitation systems
July 2009
5
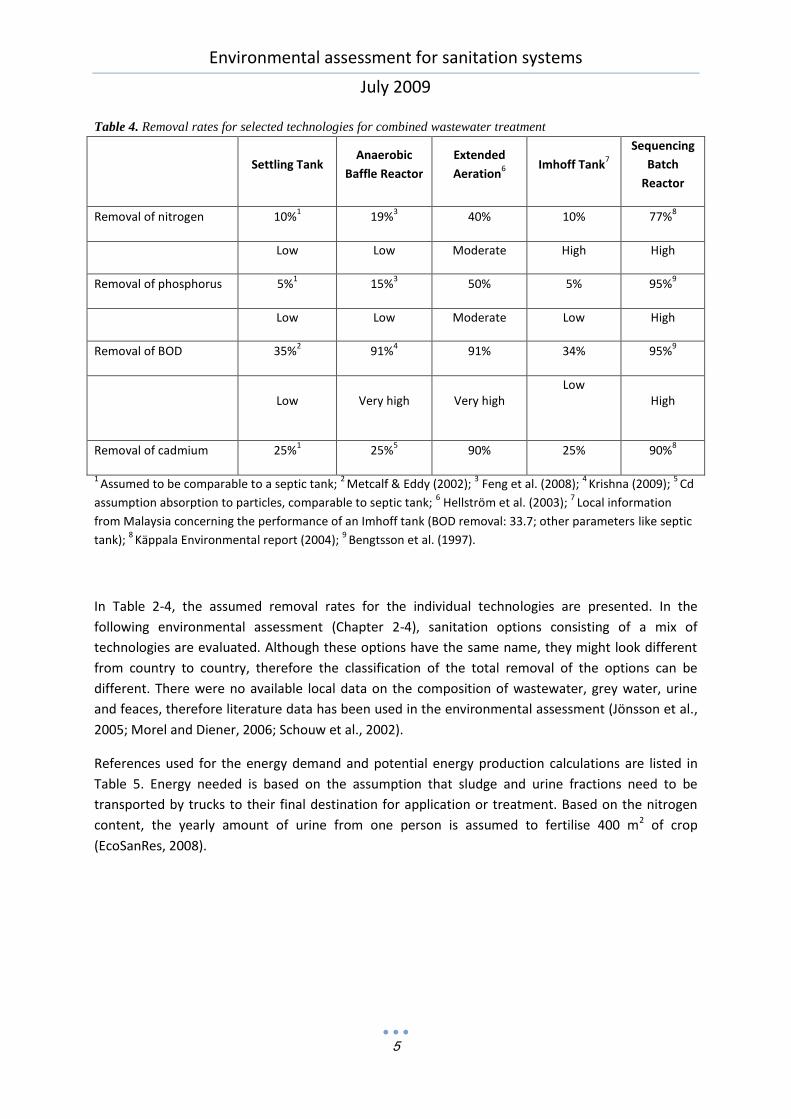
Table 4. Removal rates for selected technologies for combined wastewater treatment
Settling Tank Anaerobic
Baffle Reactor
Extended
Aeration6
Imhoff Tank7
Sequencing
Batch
Reactor
Removal of nitrogen 10%1 19%
3 40% 10% 77%
8
Low Low Moderate High High
Removal of phosphorus 5%1 15%
3 50% 5% 95%
9
Low Low Moderate Low High
Removal of BOD 35%2 91%
4 91% 34% 95%
9
Low Very high Very high Low
High
Removal of cadmium
25%1 25%
5 90% 25% 90%
8
1 Assumed to be comparable to a septic tank;
2 Metcalf & Eddy (2002);
3 Feng et al. (2008);
4 Krishna (2009);
5 Cd
assumption absorption to particles, comparable to septic tank; 6 Hellström et al. (2003);
7 Local information
from Malaysia concerning the performance of an Imhoff tank (BOD removal: 33.7; other parameters like septic
tank); 8
Käppala Environmental report (2004); 9
Bengtsson et al. (1997).
In Table 2-4, the assumed removal rates for the individual technologies are presented. In the
following environmental assessment (Chapter 2-4), sanitation options consisting of a mix of
technologies are evaluated. Although these options have the same name, they might look different
from country to country, therefore the classification of the total removal of the options can be
different. There were no available local data on the composition of wastewater, grey water, urine
and feaces, therefore literature data has been used in the environmental assessment (Jönsson et al.,
2005; Morel and Diener, 2006; Schouw et al., 2002).
References used for the energy demand and potential energy production calculations are listed in
Table 5. Energy needed is based on the assumption that sludge and urine fractions need to be
transported by trucks to their final destination for application or treatment. Based on the nitrogen
content, the yearly amount of urine from one person is assumed to fertilise 400 m2 of crop
(EcoSanRes, 2008).
Environmental assessment for sanitation systems
July 2009
6
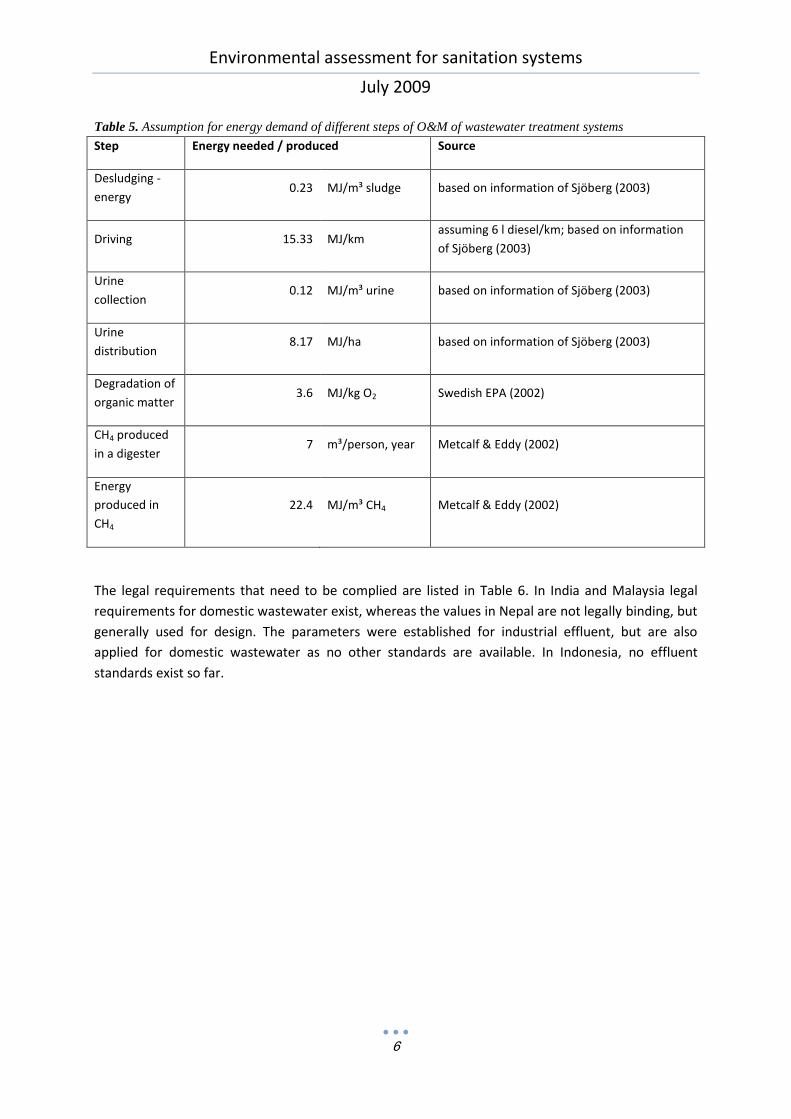
Table 5. Assumption for energy demand of different steps of O&M of wastewater treatment systems
Step Energy needed / produced Source
Desludging -
energy 0.23 MJ/m³ sludge based on information of Sjöberg (2003)
Driving 15.33 MJ/km assuming 6 l diesel/km; based on information
of Sjöberg (2003)
Urine
collection 0.12 MJ/m³ urine based on information of Sjöberg (2003)
Urine
distribution 8.17 MJ/ha based on information of Sjöberg (2003)
Degradation of
organic matter 3.6 MJ/kg O2 Swedish EPA (2002)
CH4 produced
in a digester 7 m³/person, year Metcalf & Eddy (2002)
Energy
produced in
CH4
22.4 MJ/m³ CH4 Metcalf & Eddy (2002)
The legal requirements that need to be complied are listed in Table 6. In India and Malaysia legal
requirements for domestic wastewater exist, whereas the values in Nepal are not legally binding, but
generally used for design. The parameters were established for industrial effluent, but are also
applied for domestic wastewater as no other standards are available. In Indonesia, no effluent
standards exist so far.

Environmental assessment for sanitation systems
July 2009
7
Table 6. Effluent requirements for treated domestic wastewater
INDIA1
MALAYSIA2
Standard A
MALAYSIA2
Standard B NEPAL
3
BOD mg/l 30 20 50 50
COD mg/l 250 50 100 250
N mg/l
NH4-N mg/l 50
P mg/l
Cd mg/l 0.01 0.02 2
Suspended Solids mg/l 50 100 50
Solids – total mg/l 100
pH 5.5 – 9.0 6.0 – 9.0 5.5 – 9.0 5.5 – 9.0
Oil & grease mg/l 10 not detectable 10 10
1 Waste Water Management, Shivshankar Ranganathan;
www.indiawaterportal.org/tt/wastewater/res/Advanced%20Tutorial.doc); 2 Standard A for discharge upstream
of drinking water take-off; Standard B for inland waters
http://www.did.sarawak.gov.my/wqis/sgsarawak/water-qua-standard.htm); 3
Reference for Nepal? To be
added by Markus
Environmental assessment for sanitation systems
July 2009
8
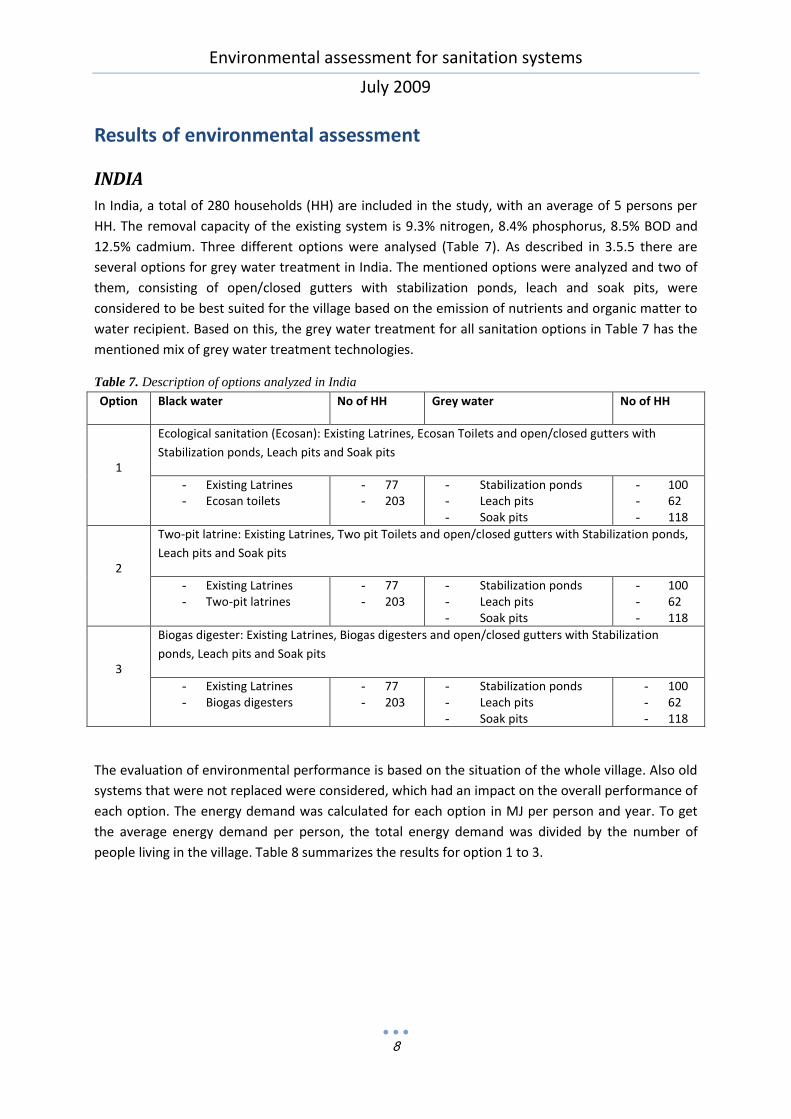
Results of environmental assessment
INDIA
In India, a total of 280 households (HH) are included in the study, with an average of 5 persons per
HH. The removal capacity of the existing system is 9.3% nitrogen, 8.4% phosphorus, 8.5% BOD and
12.5% cadmium. Three different options were analysed (Table 7). As described in 3.5.5 there are
several options for grey water treatment in India. The mentioned options were analyzed and two of
them, consisting of open/closed gutters with stabilization ponds, leach and soak pits, were
considered to be best suited for the village based on the emission of nutrients and organic matter to
water recipient. Based on this, the grey water treatment for all sanitation options in Table 7 has the
mentioned mix of grey water treatment technologies.
Table 7. Description of options analyzed in India
Option Black water No of HH Grey water No of HH
1
Ecological sanitation (Ecosan): Existing Latrines, Ecosan Toilets and open/closed gutters with
Stabilization ponds, Leach pits and Soak pits
- Existing Latrines - Ecosan toilets
- 77 - 203
- Stabilization ponds - Leach pits - Soak pits
- 100 - 62 - 118
2
Two-pit latrine: Existing Latrines, Two pit Toilets and open/closed gutters with Stabilization ponds,
Leach pits and Soak pits
- Existing Latrines - Two-pit latrines
- 77 - 203
- Stabilization ponds - Leach pits - Soak pits
- 100 - 62 - 118
3
Biogas digester: Existing Latrines, Biogas digesters and open/closed gutters with Stabilization
ponds, Leach pits and Soak pits
- Existing Latrines - Biogas digesters
- 77 - 203
- Stabilization ponds - Leach pits - Soak pits
- 100 - 62 - 118
The evaluation of environmental performance is based on the situation of the whole village. Also old
systems that were not replaced were considered, which had an impact on the overall performance of
each option. The energy demand was calculated for each option in MJ per person and year. To get
the average energy demand per person, the total energy demand was divided by the number of
people living in the village. Table 8 summarizes the results for option 1 to 3.

Environmental assessment for sanitation systems
July 2009
9
Table 8: Results of environmental assessment in India
India Option 1 Option 2 Option 3
Ecosan Two-pit latrine Biogas digester
Removal of nitrogen Very high Moderate Moderate
Removal of phosphorus Moderate Moderate Moderate
Removal of BOD Moderate Moderate Moderate
Removal of cadmium 73% 63% 63%
Removal of total eutrophication
potential (N+P)1
62% 47% 47%
Energy demand (MJ/person, year) 18.9 0 1.2
Energy production (MJ/person, year) 154
Quality of recycled product
(mg Cd/kg DM) Very high quality Very high quality Very high quality
Average nutrients in side products
(kg/person, year)
N: 2.3
P: 0.51
N: 1.32
P: 0.43
N: 1.32
P: 0.43
1 Total eutrophication potential is expressed in kg PO4
3- equivalent/yr (Guinée, 2002).
Option 1 – Ecosan system Environmental impact
This option performs best with respect to its environmental impact as no contaminants are polluting
the water recipient. No black water is generated and all side products are used in agriculture.
Nevertheless, the performance of BOD and phosphorus removal is only moderate due to the existing
systems that are still discharging their effluent into the receiving water body. It is worth to note that
compared to the other countries all the options in India include a more diverse mix of technologies
which affects the removal rate of the total system i.e. the option.
Energy demand
The energy demand of this option results from collection, transport and distribution of urine and
compost to farmland.
Option 2 – Two-pit latrine Environmental impact
Black water infiltrates into the groundwater and only solids that settle in the pits are removed. The
same assumption for substance fractions between the solid and liquid phase has been used in the
calculation for two-pit latrine as well as for biogas digester. This is based on the assumtion that the
Environmental assessment for sanitation systems
July 2009
10
pits are allowed to drain properly e.g. that there are no floods during rainy seasons, which should
imply that only initial soluble substances leaves the pit. The actual removal rate, i.e. substances that
are retained in the pit, is probably lower due to ongoing degradation and flushing while the pit is in
use as well as during the resting period.
Energy demand
The idea behing the two-pit latrine is that one pit is resting while the other one is being used. The
result is a soil-like material too solid to be removed with a vacuum truck and therefore it needs to be
excavated manually. According to local partners the content is distributed on nearby land as
fertilizer. In conclusion, there is no need for fossil energy in this option.
Option 3 – Biogas digester Environmental impact
The water phase is infiltrating into the soil while the slurry from the biogas digester is used as
fertilizer on the farmland. Substances remaining in the slurry are considered to be same amount as
the substances trapped in the solid phase in the latrine. However in the biogas digester 50% of the
organic matter is degraded in the process which increases the removal rate of the system.
Energy demand
This option has the best performance concerning energy demand as much more energy has the
potential to be produced in the form of biogas than is needed for operation and maintenance of the
systems. Energy production, in the form of biogas collection and usage, is considered in Options 1, 2
and 3 where black water is digested in a fixed dome digester. In option 2 there are 212 HH connected
to biogas digester system while in option 1 and 2 there are the existing 9 HH which produce biogas.
Energy is needed for desludging of the biogas digester and the transport of the dried sludge to the
farmland in 5 km distance, but is highly compensated by the produced energy.

Environmental assessment for sanitation systems
July 2009
11
INDONESIA
In Indonesia, a total of 566 households (HH) are included in the study, with an average of 5 persons
per HH. The removal capacity of the existing system is 1.1% nitrogen, 0.3% phosphorus, 3.3% BOD
and 2.2% cadmium. Four different options were analysed. The evaluation of environmental
performance is based on the situation of the whole village. For the on-site systems, old systems that
were not replaced were considered, which had an impact on the overall performance of the
technology, whereas the decentralised option all households are connected to the constructed
wetland (Table 9).
Table 9: Description of options analysed in Indonesia
Option Black water No of HH Grey water No of HH
1
Pour Flush Toilet (PFT) with Septic Tanks and constructed wetland
- Pour Flush Toilet - Septic Tank
- 499 - 499
- Constructed wetland - 499
2
Public Community Sanitation System
- Public toilets - Water from washing and bathing - Anaerobic digester and anaerobic baffle reactor (ABR)
- 6 - 499 - 1
3
Ecological Sanitation and constructed wetland
- Urine diverting toilets
- Urine application - Faeces utilization
- 50
- Constructed wetland - 499
4
Decentralised Sewerage System
- Pour Flush Toilet - Sewerage system - WWTP (constructed wetland)
- 566
- 499
The energy demand was calculated for each option in MJ per person and year. To get the average
energy demand per person, the total energy demand was divided by the number of people living in
the village. Table 10 summarizes the results of the calculations for option 1 to 4.
Environmental assessment for sanitation systems
July 2009
12
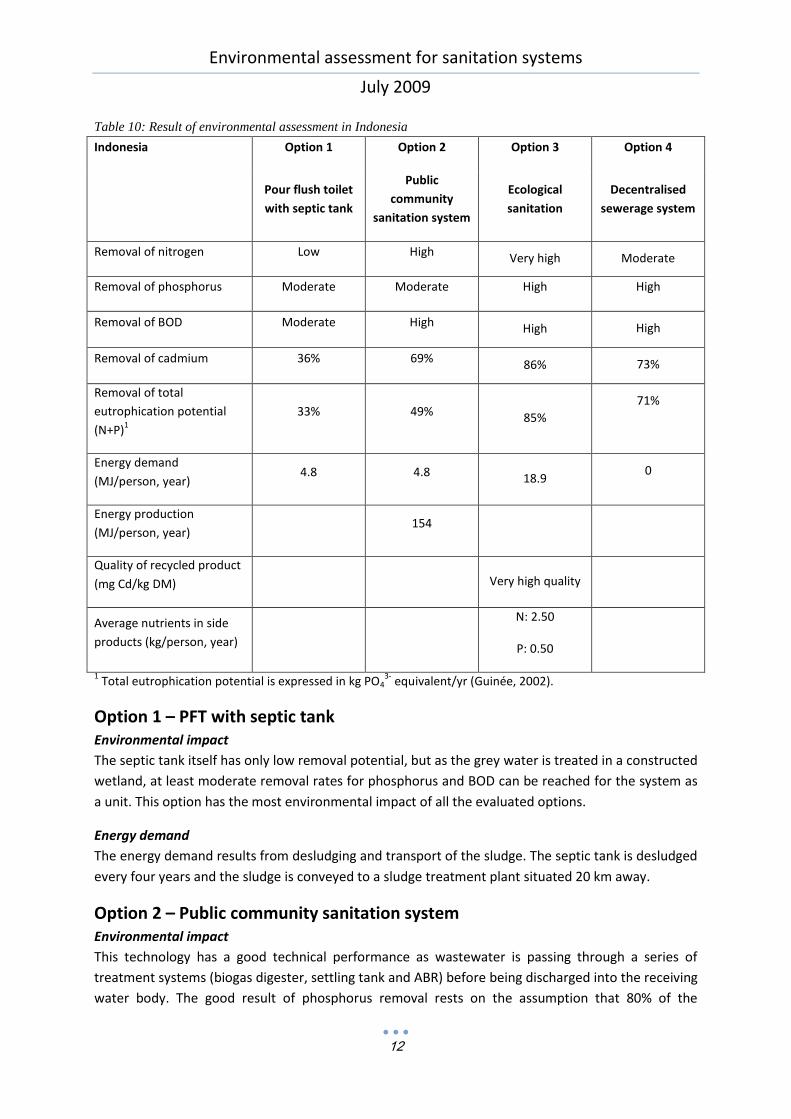
Table 10: Result of environmental assessment in Indonesia
Indonesia Option 1 Option 2 Option 3 Option 4
Pour flush toilet
with septic tank
Public
community
sanitation system
Ecological
sanitation
Decentralised
sewerage system
Removal of nitrogen Low High Very high Moderate
Removal of phosphorus Moderate Moderate High High
Removal of BOD Moderate High High High
Removal of cadmium 36% 69% 86% 73%
Removal of total
eutrophication potential
(N+P)1
33% 49% 85%
71%
Energy demand
(MJ/person, year) 4.8 4.8 18.9
0
Energy production
(MJ/person, year) 154
Quality of recycled product
(mg Cd/kg DM) Very high quality
Average nutrients in side
products (kg/person, year)
N: 2.50
P: 0.50
1 Total eutrophication potential is expressed in kg PO4
3- equivalent/yr (Guinée, 2002).
Option 1 – PFT with septic tank Environmental impact
The septic tank itself has only low removal potential, but as the grey water is treated in a constructed
wetland, at least moderate removal rates for phosphorus and BOD can be reached for the system as
a unit. This option has the most environmental impact of all the evaluated options.
Energy demand
The energy demand results from desludging and transport of the sludge. The septic tank is desludged
every four years and the sludge is conveyed to a sludge treatment plant situated 20 km away.
Option 2 – Public community sanitation system
Environmental impact
This technology has a good technical performance as wastewater is passing through a series of
treatment systems (biogas digester, settling tank and ABR) before being discharged into the receiving
water body. The good result of phosphorus removal rests on the assumption that 80% of the

Environmental assessment for sanitation systems
July 2009
13
phosphorus in black water is removed with the solid phase in the digester and thus not
contaminating the receiving water body.
Energy demand
The energy demand of this biogas system is comparatively higher than of the on-site biogas systems
as the sludge is not applied on the fields, but conveyed to a sludge treatment plant in 20 km distance.
Still the potential biogas production is very high, which makes this by far the most energy effective
technology of the evaluated options.
Option 3 – Ecological sanitation (urine-diverting toilets) Environmental impact
This option performs best with respect to its environmental impact as no contaminants from the
toilets are polluting the water recipient. All grey water is treated in a constructed wetland and all
side products are used in agriculture. Compared to the Ecosan option in India, there are fewer
households in Indonesia that are still discharging their wastewater from septic tanks into the
recipient and thus this option has lower environmental impact.
Energy demand
The energy demand of this option results from collection and distribution of urine and compost to
the farmland. Here a transport distance of 5 km is assumed.
Option 4 – Decentralised constructed wetland Environmental impact
Due to the connection of all users to the constructed wetland, the removal of phosphorus and BOD is
high but the nitrogen removal is only moderate.
Energy demand
As it is possible to run the whole system by gravity, no pumps are needed. A constructed wetland is
not aerated and the dried sludge of the pre-treatment does not have to be conveyed to a treatment
plant as it can be dried on-site and disposed next to the plant. There results no energy demand from
this treatment system.
Environmental assessment for sanitation systems
July 2009
14
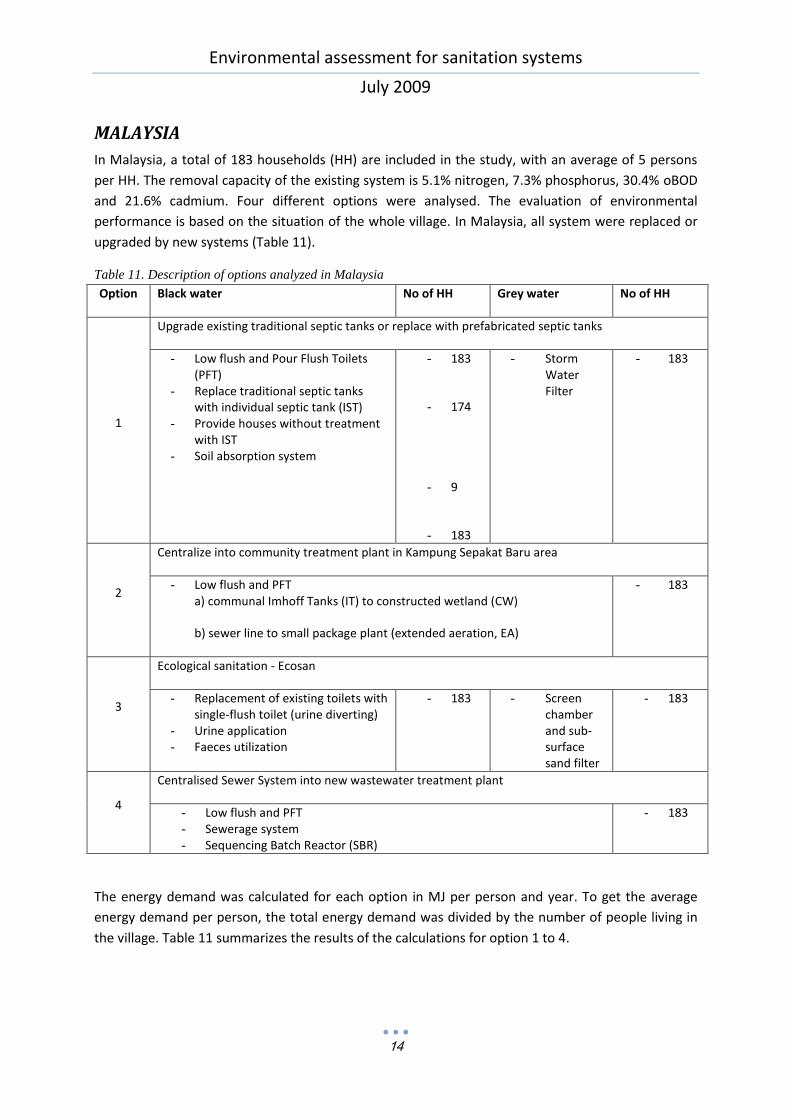
MALAYSIA
In Malaysia, a total of 183 households (HH) are included in the study, with an average of 5 persons
per HH. The removal capacity of the existing system is 5.1% nitrogen, 7.3% phosphorus, 30.4% oBOD
and 21.6% cadmium. Four different options were analysed. The evaluation of environmental
performance is based on the situation of the whole village. In Malaysia, all system were replaced or
upgraded by new systems (Table 11).
Table 11. Description of options analyzed in Malaysia
Option Black water No of HH Grey water No of HH
1
Upgrade existing traditional septic tanks or replace with prefabricated septic tanks
- Low flush and Pour Flush Toilets (PFT)
- Replace traditional septic tanks with individual septic tank (IST)
- Provide houses without treatment with IST
- Soil absorption system
- 183
- 174
- 9
- 183
- Storm Water Filter
- 183
2
Centralize into community treatment plant in Kampung Sepakat Baru area
- Low flush and PFT a) communal Imhoff Tanks (IT) to constructed wetland (CW)
b) sewer line to small package plant (extended aeration, EA)
- 183
3
Ecological sanitation - Ecosan
- Replacement of existing toilets with single-flush toilet (urine diverting)
- Urine application - Faeces utilization
- 183
- Screen chamber and sub-surface sand filter
- 183
4
Centralised Sewer System into new wastewater treatment plant
- Low flush and PFT - Sewerage system - Sequencing Batch Reactor (SBR)
- 183
The energy demand was calculated for each option in MJ per person and year. To get the average
energy demand per person, the total energy demand was divided by the number of people living in
the village. Table 11 summarizes the results of the calculations for option 1 to 4.
Environmental assessment for sanitation systems
July 2009
15
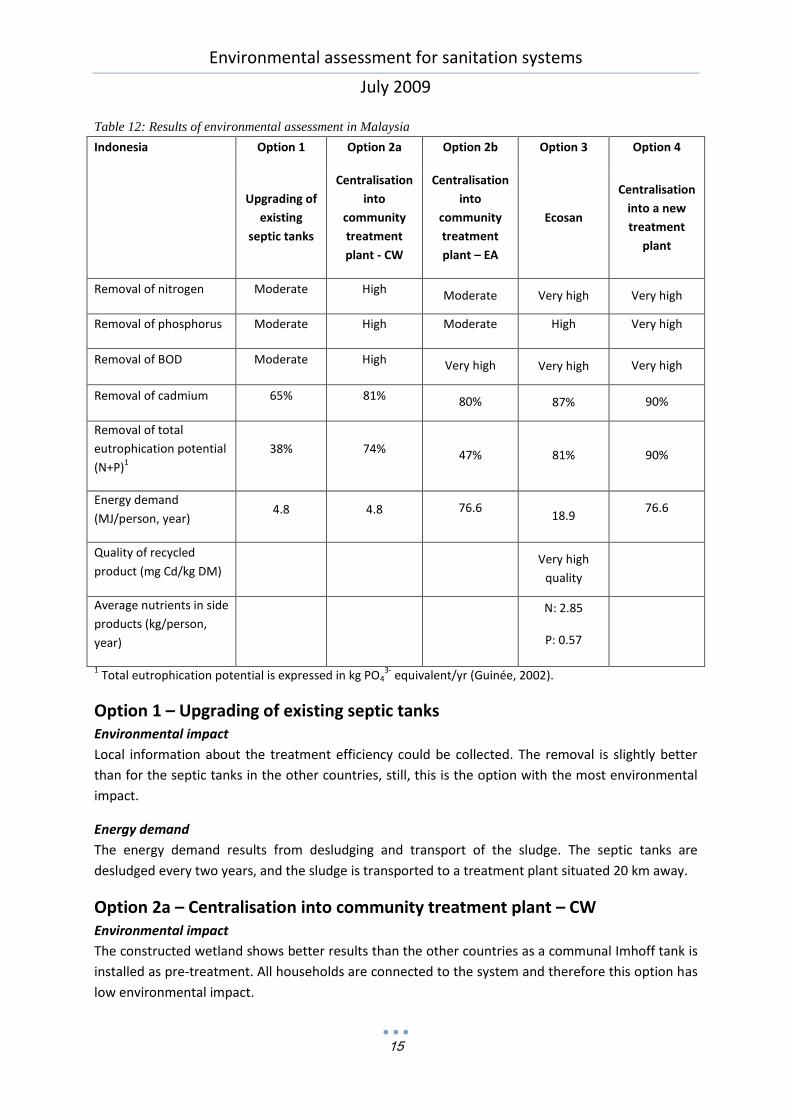
Table 12: Results of environmental assessment in Malaysia
Indonesia Option 1 Option 2a Option 2b Option 3 Option 4
Upgrading of
existing
septic tanks
Centralisation
into
community
treatment
plant - CW
Centralisation
into
community
treatment
plant – EA
Ecosan
Centralisation
into a new
treatment
plant
Removal of nitrogen Moderate High Moderate Very high Very high
Removal of phosphorus Moderate High Moderate High Very high
Removal of BOD Moderate High Very high Very high Very high
Removal of cadmium 65% 81% 80% 87% 90%
Removal of total
eutrophication potential
(N+P)1
38% 74% 47% 81% 90%
Energy demand
(MJ/person, year) 4.8 4.8 76.6
18.9 76.6
Quality of recycled
product (mg Cd/kg DM)
Very high
quality
Average nutrients in side
products (kg/person,
year)
N: 2.85
P: 0.57
1 Total eutrophication potential is expressed in kg PO4
3- equivalent/yr (Guinée, 2002).
Option 1 – Upgrading of existing septic tanks Environmental impact
Local information about the treatment efficiency could be collected. The removal is slightly better
than for the septic tanks in the other countries, still, this is the option with the most environmental
impact.
Energy demand
The energy demand results from desludging and transport of the sludge. The septic tanks are
desludged every two years, and the sludge is transported to a treatment plant situated 20 km away.
Option 2a – Centralisation into community treatment plant – CW
Environmental impact
The constructed wetland shows better results than the other countries as a communal Imhoff tank is
installed as pre-treatment. All households are connected to the system and therefore this option has
low environmental impact.
Environmental assessment for sanitation systems
July 2009
16
Energy demand
This system has a higher energy demand than the constructed wetlands in the other countries due to
the Imhoff tank which has to be desludged and conveyed to a sludge treatment plant 20 km away.
Option 2b – Centralisation into community treatment plant – EA Environmental impact
This technology provides very good removal of BOD, but only moderate removal of nutrients.
Energy demand
The energy demand of aerated systems is very high compared to non-aerated systems. To
decompose 1 kg of BOD, 3.6 MJ is necessary. This option has (together with option 4) the highest
energy demand of all options.
Option 3 – Ecosan Environmental impact
This option performs very good as no contaminants are polluting the recipient. All grey water is
treated in a constructed wetland and all side products are used in agriculture. All households will
receive this system and this option has the same low environmental impact as the centralised option.
Malaysia has the best overall BOD-removal of all Ecosan-options due to sand filter treatment of the
grey water.
Energy demand
The energy demand of this option results from collection and distribution of urine and compost to
the farmland.
Option 4 - Centralisation into another new treatment plant Environmental impact
This state-of-the-art technology is the best performing technology and has lowest environmental
impact of all options.
Energy demand
This option has the same high energy demand as option 2b as it is an aerated system as well.

Environmental assessment for sanitation systems
July 2009
17
NEPAL
In Nepal, a total of 173 households (HH) are included in the study, with an average of 7 persons per
HH. The removal capacity of the existing system is 5.8% nitrogen, 1.7% phosphorus, 18.4% BOD and
12.1% cadmium. Four different options were analysed. The evaluation of environmental
performance is based on the situation of the whole village. All systems were replaced except for in
option 3, the PFT with septic tank, where the existing systems were not replaced (Table 13).
Table 13. Description of options analysed in Nepal
Option Black water No of HH Grey water No of HH
1 Ecological sanitation (Ecosan) and constructed wetland
- Ecosan Toilets - 173 - Constructed wetland - 173
2
Pour Flush Toilet (PFT), biogas digester and constructed wetland
- PFT - Biogas digester
(ind+mult)
- 173 - 95+3
5
- Constructed wetland - 173
3
Pour Flush Toilet (PFT), septic tank and constructed wetland
- Existing PFT with septic tank
- PFT (new) - Septic tank (new)
- 113
- 60 - 60
- Constructed wetland - 173
4
Pour Flush Toilet, Centralized Sewer Line and Constructed Wetland or Waste Water Treatment
Plant (WWTP)
- PFT - 4a: Constructed wetland (only for ward N°2) - 4b: Centralized WWTP (System in Kathmandu)
- 173 - 173 - 173
The energy demand was calculated for each option in MJ per person and year. To get the average
energy demand per person, the total energy demand was divided by the number of people living in
the village. Table 14 summarizes the results of the calculations for option 1 to 4.

Environmental assessment for sanitation systems
July 2009
18
Table 14. Results of environmental assessment in Nepal
Nepal Option 1 Option 2 Option 3 Option 4a Option 4b
Ecosan
PFT with
Biogas
digester
PFT with
Septic tank
Decentralised
constructed
wetland
Centralised
treatment
plant (EA)
Removal of nitrogen Very high High Moderate High Moderate
Removal of phosphorus Very high High Moderate High Moderate
Removal of BOD High High Moderate High Very high
Removal of cadmium 93% 78% 38% 74% 90%
Removal of total
eutrophication potential
(N+P)1
92% 71% 54% 71% 47%
Energy demand
(MJ/person, year) 18.9 1.2 4.8
0 74.5
Energy production
(MJ/person, year) 154
Quality of recycled
product (mg Cd/kg DM)
Very high
quality
Very high
quality
Average nutrients in side
products (kg/person,
year)
N: 2.78
P: 0.57
N: 1.43
P: 0.46
1 Total eutrophication potential is expressed in kg PO4
3- equivalent/yr (Guinée, 2002).
Option 1 – Ecosan Environmental impact
This option performs best with respect to its environmental impact as no contaminants are polluting
the recipient. No black water is generated and all side products are used in agriculture. Nepal has the
best overall P-removal of all Ecosan-options due to treatment of all grey water in a constructed
wetland.
Energy demand
The energy demand of this option results from collection and distribution of urine and compost to
the farmland.
Option 2 – PFT with Biogas digester Environmental impact
The water phase is infiltrating into the soil while the slurry from the biogas digester is used as
fertilizer on the farmland.
Environmental assessment for sanitation systems
July 2009
19
Energy demand
This option has the best performance concerning energy demand as much more energy is produced
in the form of biogas than is needed for operation and maintenance of the systems.
Energy is needed for desludging of the biogas digester every two years and the transport of the dried
sludge to the farmland in 5 km distance, but is highly compensated by the produced energy.
Option 3 – PFT with septic tank Environmental impact
The septic tank itself has only low removal potential, but as the grey water is treated in a constructed
wetland, at least moderate removal rates for all parameters could be reached. This option has worst
environmental impact of the evaluated technologies.
Energy demand
The energy demand results from desludging and transport of the sludge. The septic tank is desludged
every four years and the sludge is conveyed to a WWTP in 20 km distance.
Option 4a – Decentralised constructed wetland Environmental impact
Due to the connection of all users to the constructed wetland, proper treatment of wastewater is
ensured. The removal of phosphorus and BOD is high and the environmental impact low.
Energy demand
As it is possible to run the whole system by gravity, no pumps are needed. A constructed wetland is
not aerated and the dried sludge of the pre-treatment does not have to be conveyed to a treatment
plant as it can be dried on-site and disposed next to the plant. There results no energy demand from
this treatment system.
Option 4b – Centralised treatment plant in Kathmandu Environmental impact
This technology shows moderate removal results for nutrients and very high removal of BOD.
Energy demand
The energy demand of this option is very high due to energy necessary for aeration of the system.
The effluent should observe the standard of 50mg/l BOD (compared to 20mg/l in Malaysia),
however, the difference in energy usage is very small between the countries due to the higher water
usage in Malaysia which dilute the concentration in the influent, i.e. almost the same amount of
organic matter needs to be removed in the two options.
Environmental assessment for sanitation systems
July 2009
20
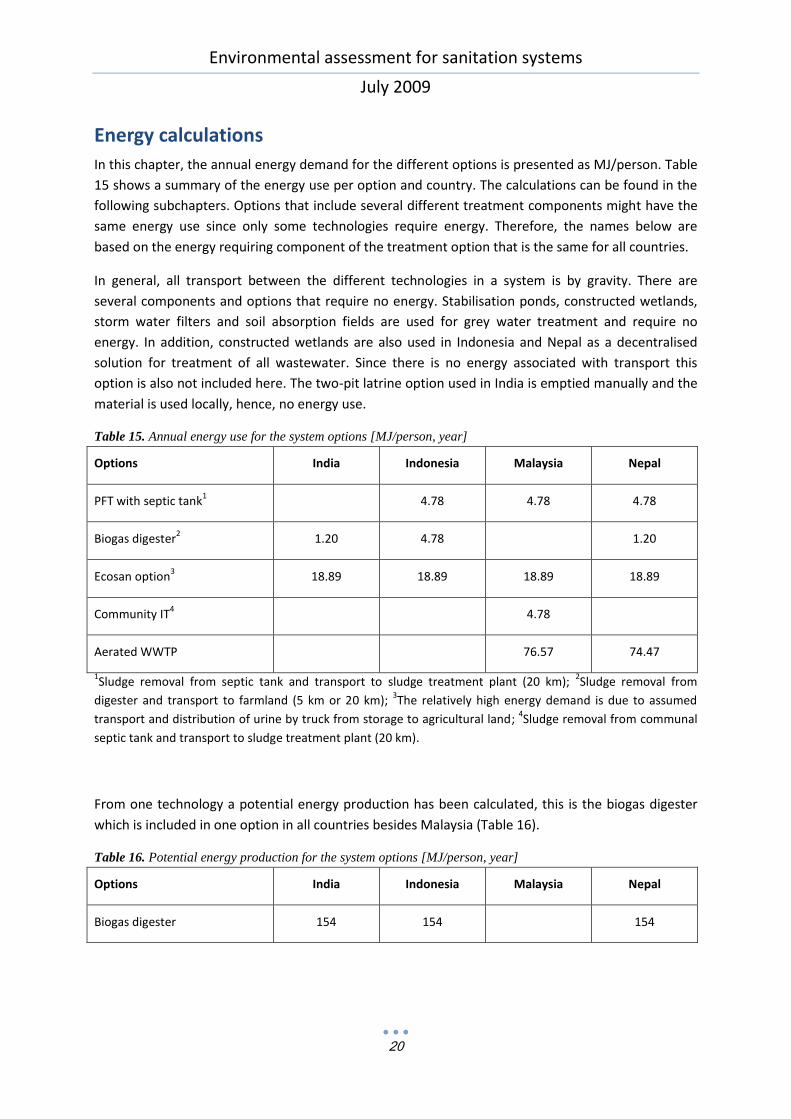
Energy calculations
In this chapter, the annual energy demand for the different options is presented as MJ/person. Table
15 shows a summary of the energy use per option and country. The calculations can be found in the
following subchapters. Options that include several different treatment components might have the
same energy use since only some technologies require energy. Therefore, the names below are
based on the energy requiring component of the treatment option that is the same for all countries.
In general, all transport between the different technologies in a system is by gravity. There are
several components and options that require no energy. Stabilisation ponds, constructed wetlands,
storm water filters and soil absorption fields are used for grey water treatment and require no
energy. In addition, constructed wetlands are also used in Indonesia and Nepal as a decentralised
solution for treatment of all wastewater. Since there is no energy associated with transport this
option is also not included here. The two-pit latrine option used in India is emptied manually and the
material is used locally, hence, no energy use.
Table 15. Annual energy use for the system options [MJ/person, year]
Options India Indonesia Malaysia Nepal
PFT with septic tank1
4.78 4.78 4.78
Biogas digester2
1.20 4.78 1.20
Ecosan option3
18.89 18.89 18.89 18.89
Community IT4
4.78
Aerated WWTP 76.57 74.47
1Sludge removal from septic tank and transport to sludge treatment plant (20 km);
2Sludge removal from
digester and transport to farmland (5 km or 20 km); 3The relatively high energy demand is due to assumed
transport and distribution of urine by truck from storage to agricultural land; 4Sludge removal from communal
septic tank and transport to sludge treatment plant (20 km).
From one technology a potential energy production has been calculated, this is the biogas digester
which is included in one option in all countries besides Malaysia (Table 16).
Table 16. Potential energy production for the system options [MJ/person, year]
Options India Indonesia Malaysia Nepal
Biogas digester
154 154 154

Environmental assessment for sanitation systems
July 2009
21
Pour Flush Toilet with septic tank
The assumed annual sludge production is 0.035 m3/person in all countries, hence, the calculated
energy for desludging is the same in the three countries with septic tank options. By chance, the
average distance from the settlements to the sludge treatment plants is also the same. Therefore,
the total energy per person for this option is the same in all countries.
sludge
m3/pers, yr
desludging
MJ/m3 sludge
Energy use
MJ/pers, yr
Nepal &
Indonesia &
Malaysia
Desludging of
septic tanks 0.035 0.23 0.0079
distance km
driving
MJ/km size truck m3 trips/yr
Energy use
MJ/pers, yr
Transport of
sludge to
WWTP 20 15.33 4.5 0.008 4.77
Option with a biogas digester
The assumed annual sludge production in the biogas digester is the same in all options. In India and
Nepal the dried sludge is used as fertilizer on farmland close to the system (average 5 km) compared
to Indonesia where longer transport is required (average 20 km). Therefore, the energy use in
Indonesia is higher than for the other two options.
Biogas is produced in the biogas digesters, and the potential energy production is calculated based
on the assumed amount of CH4 that can be used as an energy source. Energy produced per person is
the same in all options. However, it should be noted that the amount of people connected to this
technology in the different biogas options varies.

Environmental assessment for sanitation systems
July 2009
22
sludge
m3/pers, yr
desludging
MJ/m3 sludge
Energy use
MJ/pers, yr
India & Nepal
Desludging of
biogas plants 0.035 0.23 0.0079
distance km
driving
MJ/km size truck m3 trips/yr
Energy use
MJ/pers, yr
Transport of
dired sludge to
farmland 5 15.33 4.5 0.008 1.19
Biogas
produced
m3/pers, yr
Energy MJ/m3
CH4
Energy
produced
MJ/pers, yr
Potential
energy
production 7 22 154
sludge
m3/pers, yr
desludging
MJ/m3 sludge
Energy use
MJ/pers, yr
Indonesia
Desludging of
biogas plants 0.035 0.23 0.0079
distance km
driving
MJ/km size truck m3 trips/yr
Energy use
MJ/pers, yr
Transport of
sludge to
WWTP 20 15.33 4.5 0.008 4.77
Biogas
produced
m3/pers, yr
Energy MJ/m3
CH4
Energy
produced
MJ/pers, yr
Potential
energy
production 7 22 154
Environmental assessment for sanitation systems
July 2009
23
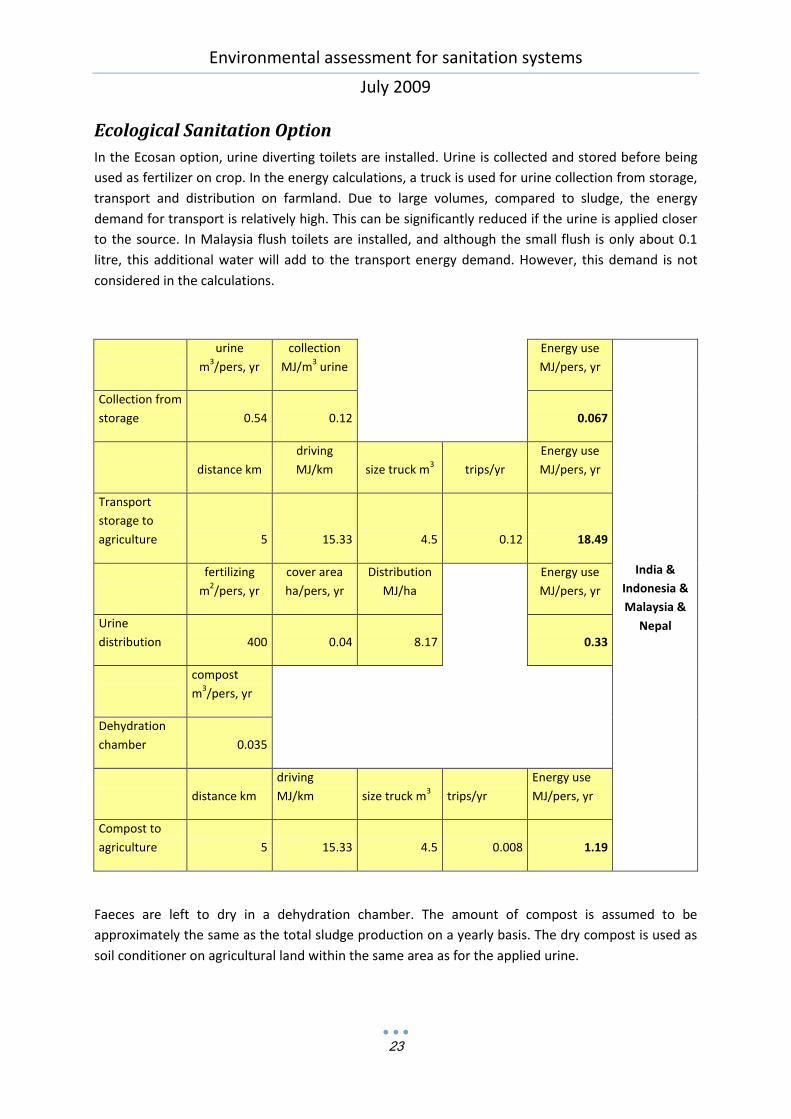
Ecological Sanitation Option
In the Ecosan option, urine diverting toilets are installed. Urine is collected and stored before being
used as fertilizer on crop. In the energy calculations, a truck is used for urine collection from storage,
transport and distribution on farmland. Due to large volumes, compared to sludge, the energy
demand for transport is relatively high. This can be significantly reduced if the urine is applied closer
to the source. In Malaysia flush toilets are installed, and although the small flush is only about 0.1
litre, this additional water will add to the transport energy demand. However, this demand is not
considered in the calculations.
urine
m3/pers, yr
collection
MJ/m3 urine
Energy use
MJ/pers, yr
India &
Indonesia &
Malaysia &
Nepal
Collection from
storage 0.54 0.12 0.067
distance km
driving
MJ/km size truck m3 trips/yr
Energy use
MJ/pers, yr
Transport
storage to
agriculture 5 15.33 4.5 0.12 18.49
fertilizing
m2/pers, yr
cover area
ha/pers, yr
Distribution
MJ/ha
Energy use
MJ/pers, yr
Urine
distribution 400 0.04 8.17 0.33
compost
m3/pers, yr
Dehydration
chamber 0.035
distance km
driving
MJ/km size truck m3 trips/yr
Energy use
MJ/pers, yr
Compost to
agriculture 5 15.33 4.5 0.008 1.19
Faeces are left to dry in a dehydration chamber. The amount of compost is assumed to be
approximately the same as the total sludge production on a yearly basis. The dry compost is used as
soil conditioner on agricultural land within the same area as for the applied urine.

Environmental assessment for sanitation systems
July 2009
24
Community Imhoff Tank
In this option, a community septic tank is used for collection or wastewater before the liquid part is
transported by gravity to a constructed wetland for further treatment. The energy use is for
desludging of the septic tank and transport to a sludge treatment plant. The transport distance is in
average 20 km.
sludge
m3/pers, yr
desludging
MJ/m3 sludge
Energy use
MJ/pers, yr
Malaysia
Desludging of
septic tanks 0.035 0.23 0.0079
distance km
driving
MJ/km size truck m3 trips/yr
Energy use
MJ/pers, yr
Transport of
sludge to
WWTP 20 15.33 4.5 0.008 4.77
Environmental assessment for sanitation systems
July 2009
25
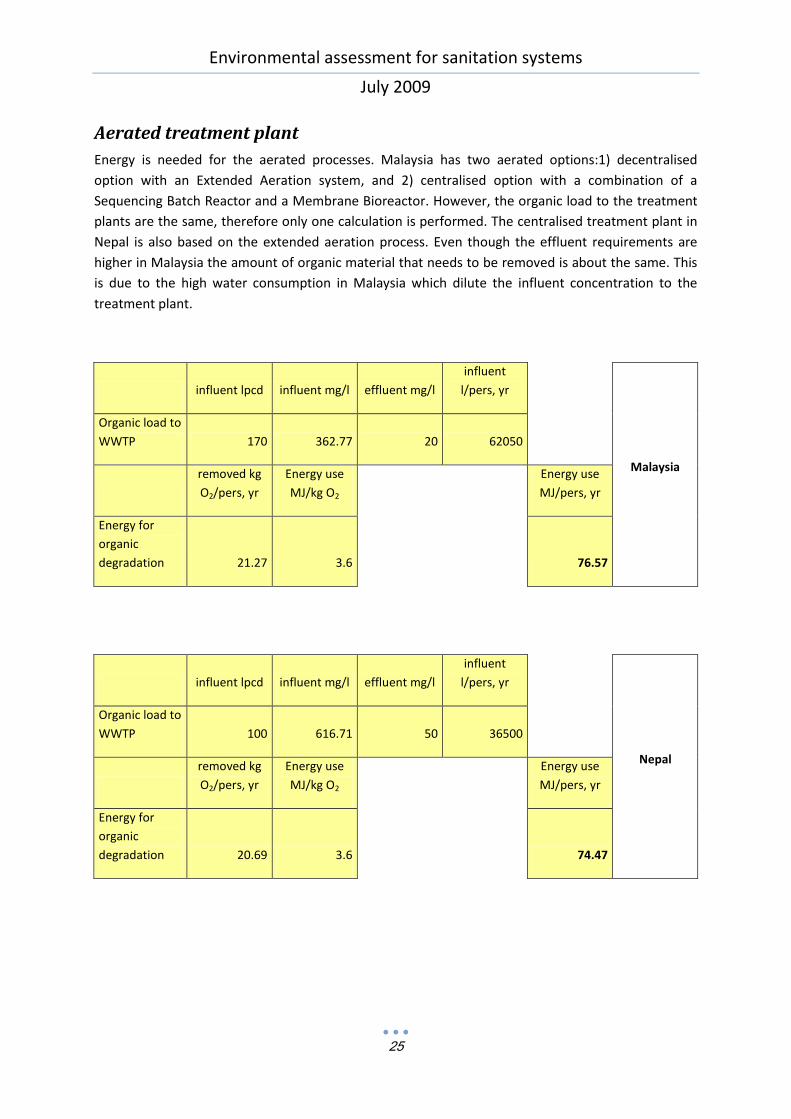
Aerated treatment plant
Energy is needed for the aerated processes. Malaysia has two aerated options:1) decentralised
option with an Extended Aeration system, and 2) centralised option with a combination of a
Sequencing Batch Reactor and a Membrane Bioreactor. However, the organic load to the treatment
plants are the same, therefore only one calculation is performed. The centralised treatment plant in
Nepal is also based on the extended aeration process. Even though the effluent requirements are
higher in Malaysia the amount of organic material that needs to be removed is about the same. This
is due to the high water consumption in Malaysia which dilute the influent concentration to the
treatment plant.
influent lpcd influent mg/l effluent mg/l
influent
l/pers, yr
Malaysia
Organic load to
WWTP 170 362.77 20 62050
removed kg
O2/pers, yr
Energy use
MJ/kg O2
Energy use
MJ/pers, yr
Energy for
organic
degradation 21.27 3.6 76.57
influent lpcd influent mg/l effluent mg/l
influent
l/pers, yr
Nepal
Organic load to
WWTP 100 616.71 50 36500
removed kg
O2/pers, yr
Energy use
MJ/kg O2
Energy use
MJ/pers, yr
Energy for
organic
degradation 20.69 3.6 74.47
Environmental assessment for sanitation systems
July 2009
26
REFERENCES
Álvarez, J. A., Armstrong, E., Gómez, M. & Soto, M. (2008) Anaerobic treatment of low-strength
municipal wastewater by a two-stage pilot plant under psychrophilic conditions. Bioresource
Technology, 99(15), 7051-7062.
Bengtsson, M., Lundin, M & Molander, S. (1997) Life cycle assessment of wastewater systems. Case
studies of conventional treatment, urine sorting and liquide composting in three Swedish
municipalities. Report 1997:9, Chalmers University of Technology, Göteborg, Sweden.
Cui, L. H., Luo, S. M., Zhu, X. Z. & Liu, Y. H. (2003) Treatment and utilization of septic tank effluent
using vertical-flow constructed wetlands and vegetable hydroponics. Journal of Environmental
Sciences China, 15(1), 75-82.
EcoSanRes (2008) Guidelines on the use of urine and faeces in crop production. EcoSanRes Factsheet
6. Available from: http://www.ecosanres.org/pdf_files/ESR-factsheet-06.pdf [Accessed 5 May 2009].
Feng, H., Hu, L., Mahmood, Q., Qiu, C., Fang, C. & Shen, D. (2008) Anaerobic domestic wastewater
treatment with bamboo carrier anaerobic baffled reactor. International Biodeterioration &
Biodegradation, 62, 232-238.
Guinée, J.B. (Ed.) (2002) Handbook on Life Cycle Assessment. Kluwer Academic Publisher.
Hellström, D., Jonsson, L. & Sjöström, M. (2003) Good small wastewater systems: evaluation of 15
onsite wastewater treatment systems [Bra små avlopp. Utvärdering av 15 enskilda
avloppsanläggningar] Report 13, Stockholm Vatten, Stockholm, Sweden. In Swedish.
India Feasibility Study (2009) Dim-Sum Project.
Indonesia Feasibility Study (2008) Dim-Sum Project.
Jönsson, H., Baky, A., Jeppsson, U., Hellström, D. & Kärrman, E. (2005) Composition of urine, faeces,
greywater and biowaste for utilisation in the URWARE model. Report 2005-6, Urban Water, Chalmers
University of Technology, Göteborg, Sweden.
Kaplan, D., Abeliovich, A. & Yaakov, S. B. (1986) The fate of heavy metals in wastewater stabilization
ponds. Water Research, 21(10), 1189-1194.
Krishna, G.G.V.T., Kumar, P. & Kumar, P. (2009) Treatment of low-strength soluble wastewater using
an anaerobic baffled reactor (ABR). Journal of Environmental Management, 90, 166-176.
Käppala Environmental report (2004) [Käppala miljörapport (2004). Miljörapport enligt miljöbalken].
Käppala förbundet, Lidingö, Sweden. In Swedish.
Malaysia Feasibility Study (2008) Dim-Sum Project.
Mbwele, L. A. (2006) Microbial Phosphorus Removal in Waste Stabilisation Pond Wastewater
Treatment Systems. Licentiate Thesis. KTH, The Royal Institute of Technology, Stockholm, Sweden.
Metcalf & Eddy (2002) Treatment, Reuse, and Disposal of Solids and Biosolids. In: Tchobanoglous, G.,
Burton, F. L. & Stensel, H. D. (eds.) Wastewater Engineering: treatment and reuse. 4th edition. New
York, McGraw-Hill, pp. 1505-1523.
Environmental assessment for sanitation systems
July 2009
27
Morel, A. & Diener, S. (2006) Greywater Management in Low and Middle-Income Countries, Review
of different treatment systems for households or neighbourhoods. Report 14/06, Swiss Federal
Institute of Aquatic Science and Technology (Eawag), Dübendorf, Switzerland.
Nepal Feasibility Study (2008) Dim-Sum Project.
Nilsson, P. Nyberg, F. & Karlsson, M. (1998) The function of filter beds– monitoring and evaluation of
filter beds. [Markbäddars funktion: kontroll och utvärdering av markbäddar] Report 4895, Svenska
naturvårdsverket SNV (Swedish EPA). In Swedish.
Palm, O. Malmén, L. & Jönsson, H. (2002) Robust, sustainable small sewage systems: a review.
[Robusta, uthålliga små avlopp: en kunskapssammanställning] Report 5224, Svenska
naturvårdsverket SNV (Swedish EPA). In Swedish.
Picot, B., Andrianarison, T., Gosselin, J. P. & Brissaud, F. (2005) Twenty years' monitoring of Meze
stabilisation ponds: part I - removal of organic matter and nutrients. Water Science and Technology,
51(12), 23-31.
Schouw, N. L., Danteravanich, S., Mosbaek, H. & Tjell, J. C. (2002) Composition of human excreta-a
case study from Southern Thailand. The Science of the Total Environment, 286(1-3), 155-166.
Sjöberg, C. (2003) Recirculation of sewage products from on-site systems within the Oxundaån
watershed area [Lokalt omhändertagande av restprodukter från enskilda avlopp i Oxundaåns
avrinningsområde]. M.Sc. Thesis. Swedish University of Agricultural Sciences, Uppsala, Sweden. In
Swedish.
Swedish EPA (1985) Wastewater infiltration – Presumption, function, environmental effects.
[Infiltration av avloppsvatten: förutsättningar, funktion och miljökonsekvenser] Nordisk
Samproduktion, Svenska naturvårdsverket SNV (Swedish EPA). In Swedish.
Swedish EPA (2002) Systems for reuse of phosphorus from wastewater [System för återanvändning av
fosfor ur avlopp]. Nordisk Samproduktion, Svenska naturvårdsverket SNV (Swedish EPA). In Swedish.
Wittgren, H. B., Baky, A. & Palm, O. (2003) Environmental systems analysis of small-scale sanitation
solutions. In: proceedings of 2nd international symposium on ecological sanitation, Lübeck, Germany,
7-11 april 2003.