Embed Size (px)
Citation preview

Environment & Transportation Committee Meeting
June 19, 2013
1:30 – 2:00pm, coffee, conversation & networking
2:00 – 4:00pm, meeting
NXP Semiconductor
411 East Plumeria Drive, San Jose
Agenda
Time Item Who Outcome
1:30 Coffee & Conversation
All
2:00 Welcome & Introductions
Betty Garza, NXP Information
2:03 Approve May Committee Minutes Rose Grymes, NASA – Env.
Cmte
Chris Wall, CNB & Melissa
Zucker, Solaria – Transp. Cmte
Action
2:05 Presentation: Low Carbon Fuel
Standard – Opportunities & Obstacles
Anthony Eggert, Exec. Director
UC Davis Policy Institute for
Energy, Environment and the
Economy
Information
2:45 Discussion: California’s Low Carbon Fuel
Standard
AB32 FAQs
LCFS Brief
Mike Mielke Information
3:25 CA Funding sources: Update
Funding matrix
Mike Mielke
Information
3:45 Open forum / Items of interest / announcements
4:00 Adjourn
1
May 2013 SVLG Environment Committee Meeting Notes & Action Items Host
Brian Glazebook, NetApp
Attendees
Co-Chairs: Jim Davis (KPMG) and Rose Grymes (NASA Ames)
Members: Chuck Wilhelm (Enlight Energy), James Charley (Intel), Lou Ramondetta (Surplus Service), Mary Ellen Leciejewski (Dignity Health), Roy Hays (AERC Recycling), Robin Weiland (KPMG), and Tonie Hansen (NVIDIA)
Members calling in: Lori Duvall (Ebay), Jason L lundgaard (Apple), Virginia Klausmeier (Sylvatex),
SVLG: Mike Mielke, Priyanka Srinivasan, Shaila Narang
Guests
Katie Schmitz Eulitt, Sustainability Accounting Standards Board
Agenda Items
1. April meeting minutes Approved unanimously with no changes
2. Presentation - Katie Schmitz Eulitt: Sustainability Accounting Standards Board (Accounting
Standards development for the tech sector)
Katie underscored the importance of SASB Accounting Standards as 80% of S&P market value is
now in intangible assets and Environmental, Social & Corporate Governance (ESG) is an
important part of that. SASB is trying to help companies account for all forms of capital and
works on business specific ESG issues. SASB works with Industry Working Groups that review
output from SASB research team to determine materiality issues and this is then followed by a
public comment period and the creation of draft Sustainability Standards. By end of 2015,
standards for 88 industry groups are expected to be created. SASB also briefs the SEC on a
quarterly basis and SEC gives SASB guidelines on how to disclose material issues in mandatory
filings.
There are openings for Industry members in the Public Interest, Telecommunications, and
Semiconductors Groups at present.
3. Sacramento Advocacy trip Top items
Water – BDCP + Water Bond: Investment for a Sound State Water System – Leadership
Group is supportive of Water Bond and BDCP.
Extended Producer Responsibility – Leadership Group is supportive of effective and
efficient waste reduction measures; AB 488 is still alive.
Cap and trade: Invest in a Clean Energy Future and a Healthy Environment
(Transportation) – Leadership Group is supportive of the cap and trade program and
recommends the use of auction revenues as per the guiding principles. We are not
supportive of cap-and-trade funds being loaned to the General Fund.

2
Questions from members on SB454 (Electric vehicle charging) – To be discussed in the
Transportation Committee.
4. Legislative/Regulatory items
SB 279 (Hancock) – SF Bay Restoration Authority
The legislation would provide provisions for submitting a multi-county ballot measure to
allow the San Francisco Bay Restoration Authority (SFBRA) to continue to move forward in
seeking voter approval consistent with its mission. The Leadership Group supported the
original enabling legislation back in 2008 – AB 2954 (Lieber). SVLG staff (Mike Mielke) sits
on the SFBRA Advisory Committee.
The legislation received unanimous support with all committee members in favor and no
abstentions.
AB 1375 (Chau) – Clean Technology Account
The legislation would establish a Clean Technology Investment Account within the
Greenhouse Gas Reduction Fund and utilize Cap-and-Trade auction revenues to fund
development and deployment of innovative clean technologies. Cleantech Open would vet
the several proposals on clean technology for the State and recommend investments.
This is SEED funding to help technologies develop prior to the venture capital stage.
The legislation received support with 9 votes in favor and 2 abstentions.
SB 405 (Padilla) – Single-use Carryout Bags
The legislation would prohibit grocery stores and large retailers from providing single-use
bags to customers and require these stores to meet specified requirements regarding
providing recycled/reusable grocery bags for purchase by customers. The Leadership Group
supported similar statewide single-use plastic bag ban legislation (AB 1998, Brownley) in
2010. Staff has been in direct contact with the Author’s office and the California Grocers
Association and we are working together to ensure that the bill is written so that we may
support the measure this year. Some language change was suggested at the meeting by
members. *Action: Staff will follow-up with members on language change
recommendations.
The legislation received support with 9 votes in favor and 2 abstentions.
Update: This legislation fell three votes shy and did not get out of the Senate during a floor
vote on May 30 (18-17, with 4 members not voting).
5. Open forum /Items of Interest None
6. Next meeting – June 19 (Joint Environment – Transportation meeting), Host NXP, Primary item of discussion: California Low Carbon Fuel Standard
May 1, 2013
1:30 – 3:30 pm
NXP Semiconductor
411 East Plumeria Drive*
San Jose, CA 95134
Minutes
Transportation Policy Committee Meeting
Click for original background Agenda & Materials at the http://svlg.org/policy-
areas/transportation/transportation-committee/transportation-committee-only
(password BARTtoSV)
1. WELCOME AND INTRODUCTIONS
The Transportation Policy Committee meeting was called to order at 1:30 p.m.
Transportation Committee Members:
Chris Wall, City National Bank (TPC co-chair)
Melissa Zucker, Solaria (TPC co-chair)
Denny Yau, SJSU
Ron Gonzales, Presencia LLC
Brenda Livingston, Chevron
Mike Dabbs, Applied Materials
Colin Read, Ecotality
Betty Garza, NXP Semiconductor
Patty Pine, eBay
Jennifer Paedon, Lockheed Martin
Staff:
Jessica Zenk, Senior Director of Transportation
Bena Chang, Director of Transportation and Housing
2. TPC Minutes Approval
Motion—M/S Ron Gonzalez / Chris Wall—Carried unanimously.
Approve the minutes of the April 2013 TPC meeting.
3. SB 454 Electric Vehicle Interoperability – Bena Chang
Bena Chang provided an overview of SB 454, including the request this morning that,
given changes to the bill under consideration, Senator Corbett’s team has asked that the
Silicon Valley Leadership Group not take a position today (shifting what was to be an
action item to a discussion item).
Questions & Discussion
Colin: Everything being mandated in this bill – transparency and pricing – already
Federal requirements (Standards of Weights & Measures) and other industry; 100%
in favor of open access, with members and non-members; only 1 charging station
in CA that currently isn’t open (company went under, station still up and running);
tried working with the author but the author hasn’t been responsive to industry or
the Senate Committee staff (only accepted 1 suggested amendment, moving
jurisdiction from CEC to CARB); went through the issues that Ecotality and
ChargePoint have (see SB 454 - Collaboratev Opposition Letter), in particular
concerned that it creates a new definition of public parking spaces to include
“designating visitor parking spaces in private lots.” Requesting a no vote unless
amended.
Jessica: Brought up comments from Richard Lowenthal
Denny: We are installing EV Charging at SJSU, and it’s hard enough as is – don’t
need another hurdel
Bena: Bill itself is contradictory about the definition of public/visitor parking
Ron: What is the Author trying to do? Bena: allow for easy interoperability. Ron:
interjecting State into area, that will have unintended consequences that will
take years to fix
Chris: Why not just oppose? Not a good precedent
Melissa: Agreed - doesn’t seem to be a baby here, it’s mostly bathwater. Rather
than try to amend it, wouldn’t it be more prudent to send them back to the
drawing board.
Ron: Really would like to back up and ask why the state has a role in this. Flat out
oppose might be in order.
Colin: The bill is redundant with federal regulations; are trying to be collaborative,
but our amendments would delete the second half.
Chris: Flat out oppose would send a strong message – this is not an area that the
State will play a productive role in.
Jessica: Senator Corbett’s office made the offer to sit down with her (personally),
and we will send the date/time of that meeting to all TPC members.
4. Rail Extention to Monterey, Christina Watson (Transportation Agency for Monterey
County, TAMC) (See Brief - Monterey/Salinas Rail, Fact Sheet - Monterey/Salinas
Rail)
Christina Watson, TAMC, provided an overview of the Rail Extension to Salinas/Monterey
County. Last Wednesday the TAMC Board approved a $55M “kickstarter” project, which
will be fully funded with the combination of existing funding, VTA reallocation of $18M to
Gilroy Station improvements, and $5M from the County’s STIP share. Full buildout scenario
funding is undetermined, but potential sources include Federal TIGER grants (admittedly
oversubscribed) and other Federal sources.
Questions & Discussion
Ron: Relationship with Union Pacific and timeline? Christina: Working with UP since
2000. A few things in our favor: 1 - CC has good operating relationship and are
taking the lead on the negotiations; 2 – UP is not using this for freight at commute
hours already given SJ-Gilroy service;
Ron: What is the long term plan for people getting between Monterey and
Salinas? Christina: Described overall strategy.
Christina Watson left.
Ron: Move to support per staff request; Chris: 2nd; Unanimously approved
5. Tax Increment Financing Legislation – Jessica Zenk (See Revised Principles for Tax
Increment Financing Legislation)
Jessica provided overview and graphic representation of TIF programs under
redevelopment. The committee discussed and approved the revised principles (first
discussed in March 2013) and turning them into a letter to send to legislators.
Meeting adjourned at 3:35.
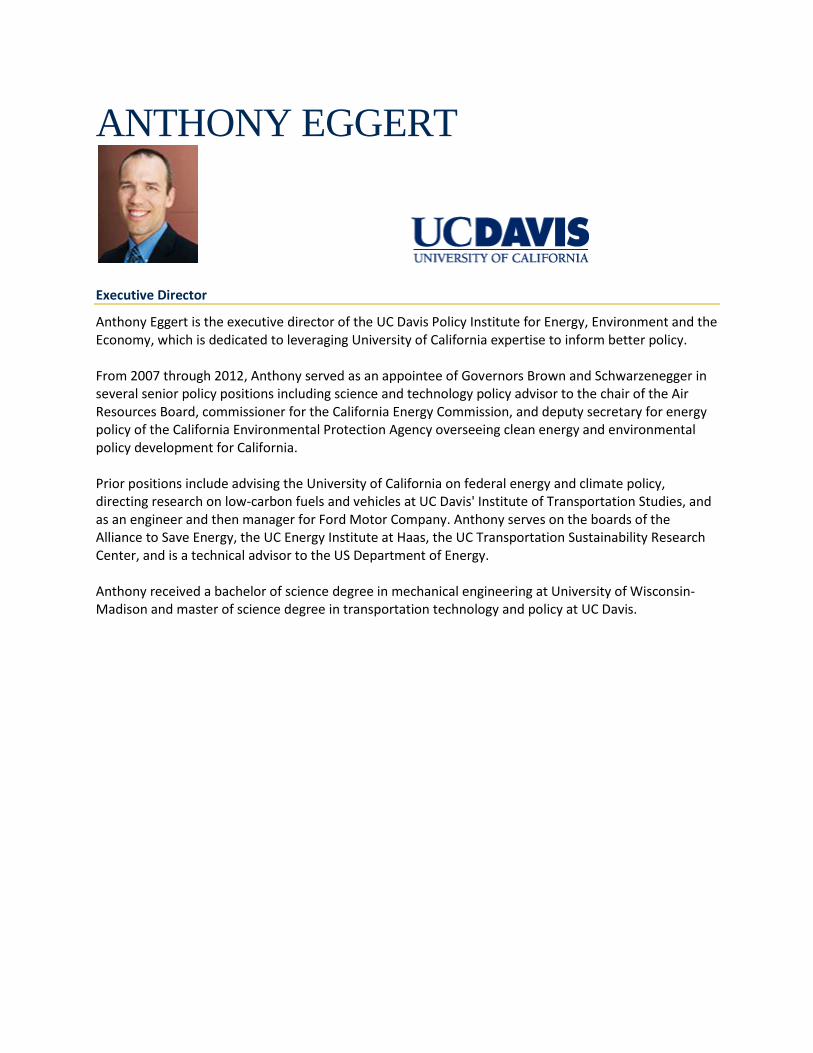
ANTHONY EGGERT
Executive Director
Anthony Eggert is the executive director of the UC Davis Policy Institute for Energy, Environment and the Economy, which is dedicated to leveraging University of California expertise to inform better policy. From 2007 through 2012, Anthony served as an appointee of Governors Brown and Schwarzenegger in several senior policy positions including science and technology policy advisor to the chair of the Air Resources Board, commissioner for the California Energy Commission, and deputy secretary for energy policy of the California Environmental Protection Agency overseeing clean energy and environmental policy development for California. Prior positions include advising the University of California on federal energy and climate policy, directing research on low-carbon fuels and vehicles at UC Davis' Institute of Transportation Studies, and as an engineer and then manager for Ford Motor Company. Anthony serves on the boards of the Alliance to Save Energy, the UC Energy Institute at Haas, the UC Transportation Sustainability Research Center, and is a technical advisor to the US Department of Energy. Anthony received a bachelor of science degree in mechanical engineering at University of Wisconsin-Madison and master of science degree in transportation technology and policy at UC Davis.

1
AB 32 FAQs
What is AB32, the Global Warming Solutions Act and what is the Scoping Plan? It’s a 2006 California law that requires greenhouse gases (GHGs), such as carbon dioxide, methane, and nitrous oxide, to be reduced to 1990 levels by 2020. AB 32 required the California Air Resources Board (CARB) to develop a Scoping Plan that describes how the state will reduce GHGs to 1990 levels. The Scoping Plan was first approved by the CARB in 2008 and must be updated every five years to evaluate the mix of AB 32 policies to ensure that California is on track to achieve the 2020 GHG reduction goal. Since the Scoping Plan was finalized in 2008 and again in 2011 (after court challenge), the CARB has been working to implement a comprehensive set of policies that meet the goals of the law in a cost effective manner, while also helping drive economic growth and improving the environment. As part of the scoping plan, the state’s utilities must meet 33% of their energy needs from renewable sources by 2020. Another part of the plan is a cap-and-trade system, which took effect in January, 2013. Still another important part is the Low Carbon Fuel Standard (LCFS), which aims to reduce the carbon intensity of transportation fuels.
What is cap-and-trade? It’s a system that sets a yearly maximum amount (cap) on GHG emissions for large energy users, such as electric utilities, oil refineries, and heavy manufacturers. Under a cap-and-trade system, a covered entity must hold enough emission allowances to cover their emissions. If, however, a covered entity exceeds the cap, they can buy credits from another entity that stayed under the cap, thereby helping the state meet its emission standards. For example, a utility operating a large number of coal-fired power plants might buy credits from a utility operating mostly solar or wind projects. These credits, also called “allowances,” can also be given away for free or sold in an auction by the state of California as part of the cap and trade program. Entities without enough allowances to cover their emissions face a fine. Each year, the overall cap is reduced to bring the economy closer to the target emission level. The CARB adopted the state’s cap-and-trade rule on October 20, 2011, and it implements and enforces the program. The cap-and-trade program applies to electric power plants and industrial plants that emit 25,000 metric tons of carbon dioxide equivalent (CO2e) per year or more. In 2015, the rules will also apply to fuel distributors (including distributors of heating and transportation fuels) that meet the 25,000 metric ton threshold, ultimately affecting a total of around 360 businesses throughout California.
How much money will California’s cap-and-trade auctions generate? Governor Brown’s budget for the 2013-14 fiscal year estimates revenue of approximately $400 million from the sale of carbon allowances. Utilities, which will be given their own allowances to sell, will earn between $650 million and $2.6 billion from the first year of auctions according to estimates from the California Public Utilities Commission, with 85% of this money returned to ratepayers.
1
Have any other cap-and-trade programs been successfully implemented? The first ever cap-and-trade program was the Acid Rain Program implemented by the Reagan Administration in the 1980s, which limited sulfur dioxide emissions. In 2008, ten northeastern states created the U.S.’s first cap-and-trade system for greenhouse gasses, called the Regional Greenhouse Gas Initiative, or RGGI. Since then, regular greenhouse gas allowance auctions have generated close to $1 billion for the region, which has led to the creation of 16,000 new jobs in energy efficiency and renewable energy. In part as a result of this program, greenhouse gas emissions in the RGGI states have declined by 23%. California’s program is second in size only to the European Union’s Emissions Trading System based on the amount of emissions covered.
How will the cap-and-trade program affect California’s economy?
1 The dividend, estimated from $20-$40, will appear as an automatic credit on utility bills every 6 mos., starting July 2013.

2
Cap-and-trade auction proceeds, if invested wisely, can benefit large sections of the economy, while limiting negative impacts. In particular, energy efficiency expenditures multiply in value in a few ways, including:
Energy efficiency upgrades generate jobs and income. RGGI has created 16,000 new jobs.
States in RGGI have made energy efficiency retrofits that will save $1.1 billion on electric bills and $174 million on natural gas and heating bills over the next decade.
As a result of increased household energy savings and green jobs, the rest of the economy benefits from greater household expenditures.
According to the U.S. Energy Information Administration, California leads all U.S. states in electricity imports. Increased energy savings and renewable energy deployment will reduce the amount of money spent outside of California to import energy. This money will increase the multiplier effect within California.
What is the Low Carbon Fuel Standard? One of several programs under AB 32 implemented by the CARB is a low carbon fuels program intended to reduce the “carbon intensity” of transportation fuels. The Low Carbon Fuel Standard (LCFS) is a performance-based regulation adopted in California in 2009 that requires regulated parties (e.g., oil producers and importers to California) to reduce the carbon intensity (CI) of their fuel mix by at least 10% by 2020. Carbon intensity (CI) is a calculated number for specific categories of motor fuels and motor fuel substitutes (such as biofuels) that takes into account the life-cycle GHG emissions.
2
How does LCFS work? Like cap-and-trade, the LCFS sets declining annual targets, starting with a 0.25% reduction in 2011, 0.5% reduction in 2012, and a 1% reduction in 2013. The speed of reduction quickens as time passes, with a 5% reduction mandated by 2017, and another 5% reduction by 2020. The regulated parties have several options to meet the standard. They can produce their own low carbon fuels, buy fuels from producers to sell on the market, purchase credits generated by others, or some combination of these strategies. Biofuels from waste and cellulosic materials, natural gas, electricity used in plug-in vehicles, and hydrogen used in fuel cell vehicles are potential low carbon fuel technologies. Petroleum and biofuels providers are the “regulated parties.”
Why is it necessary? LCFS is complementary to the cap-and-trade program. Cap-and-trade addresses the failure of the market to stop GHG pollution. However, cap-and-trade does not directly address specific sources of GHG emissions where innovation is needed, such as fuels. The carbon price signal provided by cap-and-trade is unlikely to spur large-scale investments in new fuels technology because the price signal will not be high enough and the cross-sector trading that is likely to be allowed means that most reductions under cap-and-trade will come from stationary sources in the near term. The state’s intent is to send a “price signal” to address GHG emissions from the transportation sector in order to reduce fossil fuel use; LCFS spurs research and development into a wider array of transportation fuels. This is why complementary policies like LCFS are needed.
What is the history of renewable fuels legislation? The Renewable Fuel Standard (RFS) program was created under the Energy Policy Act (EPAct) of 2005, and established the first renewable fuel volume mandate in the United States. The EPA is responsible for developing and implementing regulations to ensure that transportation fuel sold in the United States contains a minimum volume of renewable fuel. Several US states are examining a comprehensive standard like the LCFS, such as Washington and Oregon. Some are hoping to create a “low-carbon fuels corridor” with harmonized policies and clear market signals that generate alternative transportation fuels. Similar legislation was also pproved in British Columbia in April 2008, and by the European Union in December 2008.
How will the LCFS program affect California’s economy? Please see the accompanying brief on the LCFS for details.
2 Carbon intensity refers to the full lifecycle greenhouse gas emissions associated with a specific fuel “pathway,” including the production,
transport, storage, dispensing, and use of the fuel.

1
Date: June 12, 2013
To: Environment Committee & Transportation Committee
From: Mike Mielke, VP, Environmental Programs and Policy; Shabab Hussain, Environment Coordinator
Re: AB 32 & California’s Low Carbon Fuel Standard
Issue California’s Low Carbon Fuel Standard (LCFS) is one of a series of measures that are part of a suite of policies under AB 32, the Global Warming Solutions Act of 2006.
1 The LCFS is meant to drive greenhouse gas (GHG)
emissions reductions in the transportation sector. The LCFS has come under recent increased scrutiny with the advent of the Fueling California and Fooling California campaigns and the release of a number of recent studies. AB 32 History The Silicon Valley Leadership Group has supported AB 32 since its inception in 2006; in fact, the organization was one of the first trade associations to support the law. The Leadership Group supports AB 32 because we believe that reducing the state’s global warming pollution presents an opportunity to transform our economy from one based on coal, oil, and gas to one that runs on renewable energy while also producing thousands of good jobs and helping clean our air, and protect our land and water. Recommendation Develop principles to guide advocacy on the LCFS which builds on long-standing positions of the Leadership Group such as: (1) Support for AB 32; (2) Setting and maintaining clear and consistent policy signals; (3) Minimizing environmental harm and protecting human health; (4) Better connecting communities through coordinated land use, housing and transportation policies; (5) Driving technological innovation and creating markets; (6) Encouraging job creation; and, (7) Providing a positive cost-benefit. Background California’s LCFS was developed in cooperation with the fossil fuel industry. Adopted by the CA Air Resources Board (CARB) in 2009, the LCFS requires fuel providers (e.g. oil producers and importers to California) to reduce the carbon intensity of their fuel mix by at least 10% (from a 2010 baseline) by 2020. Carbon intensity refers to the full lifecycle greenhouse gas emissions associated with a specific fuel “pathway,” including the production, transport, storage, dispensing, and use of the fuel. The LCFS sets declining annual targets, starting with a 0.25% reduction in 2011, 0.5% reduction in 2012, and a 1% reduction in 2013. The speed of reduction quickens as time passes, with a 5% reduction mandated by 2017, and another 5% reduction by 2020. The regulated parties have several options to meet the standard. They can produce their own low carbon fuels or buy fuels from producers to sell on the market. Potential low carbon fuel technologies include biofuels made from waste and cellulosic materials, natural gas, electricity used in plug-in vehicles, and hydrogen used in fuel cell vehicles. Additionally, the LCFS sets up a credits market, so parties can purchase credits generated by others to come into compliance. Each credit is equal to one metric ton of carbon dioxide emitted. Exceeding the performance required by the LCFS generates credits, while using fuels with a higher carbon intensity than the standard creates deficits. Legal status The LCFS is currently in a state of legal limbo. Two separate legal challenges have been launched against the standard. The first is a lawsuit that charges that the LCFS discriminates against crude oil and biofuels producers outside California and thus violates the Interstate Commerce Clause. In 2011, a federal judge sided with opponents of the standard and issued an injunction against the LCFS, though this injunction has been stayed while the CARB appeals. Additionally, a separate lawsuit, filed by POET LLC, the nation’s second-largest ethanol producer, has been working its way through the state courts. The lawsuit charges that the LCFS unfairly penalizes ethanol producers by counting their indirect carbon emissions. An appeals court has ruled that the ARB will have to fix certain procedural issues but that the standard will continue to operate in the meantime. As such, a great deal of regulatory uncertainty surrounds the LCFS, which is not conducive to investment in clean fuels.
1 Policies include: Cap-and-Trade; Combined Heat & Power (Cogeneration); Efficiency Measures; Low Carbon Fuel Standard; Pavley II Fuel Efficiency
Standards; 33% Renewable Portfolio Standard; SB 375 Vehicle Miles Traveled (VMT) Reductions

2
Operational status – The LCFS so far A recent status report by UC Davis reveals that California is currently exceeding the LCFS targets. There is currently a surplus of 1.3 million credits, which alone represents about half of what is needed to cover the 2013 obligation. Additionally, parties will be able to maintain compliance through 2016 through the continued growth in credits from already accomplished reductions in carbon intensity. A breakdown of fuel types shows that roughly 78% of net LCFS credits were generated from ethanol, 12% from fossil and bio-based natural gas, 9% from biodiesel, and 1% from electricity. Among biofuels, corn and corn+ (corn/sorghum/wheat mixed ethanol) constituted 95% of the fuel volume, sugarcane composed 4% of the fuel volume, and biofuels using waste as a feedstock comprised less than 1% of the total biofuel volume. Overall, in 2012, non-petroleum based fuels contributed 6.19% of the total transportation mix (18 billion gallons total of liquid fuel used in California). This amounts to an annual average displacement of about 1.06 billion gallons of gasoline and 45 million gasoline gallon equivalents of diesel. The following four issues will be critical in determining the success or failure of the LCFS:
1. Availability of advanced biofuels and sugarcane: To date, corn ethanol has been the primary method through which fuel providers have met the standard, due to a mature industry and comparable price points. However, the greenhouse has impacts of corn ethanol are high compared to other forms of biofuels, and a third of the corn ethanol blends that the ARB tracks have a carbon intensity similar to or higher than that of gasoline. As the LCFS standards mandate further reductions as time goes on, fuel providers will need to transition away from corn ethanol and towards a greater use of advanced, cellulosic biofuels and Brazilian sugarcane. However, there is substantial debate over the viability of supplies of such fuels coming online in time for fuel providers to meet their LCFS obligations. While there was a national production capacity of 685 million gallons of advanced biofuels in 2012, actual production was only 21,000 gallons, none of which reached California’s market. Given the current production of close to nothing, fuel providers in California are concerned about their ability to meet the LCFS standards starting in 2015, when the pace of reductions in carbon intensity quickens. Environmental Entrepreneurs estimates that national biofuel production capacity by 2015 will be between 1.6 and 2.6 billion gallons, which would be more than enough to cover the LCFS obligations. Whether or not that capacity translates to actual production is another question entirely. There are a number of factors that pose challenges to the scaling of advanced biofuels. Regulatory uncertainty, both with the LCFS and the federal RFS2, deters investment in the biofuels industry. Additionally, advanced biofuel production is currently phasing out of the demonstration phase and moving into the commercial production phase, placing it squarely in the commercialization “valley of death,” when new technologies are most susceptible to failure. Brazilian sugarcane ethanol is the other major biofuel that is associated with the LCFS. It has a lower CI than corn ethanol, though its use is still limited to about 4% of total biofuel volumes in California. Sugarcane has the advantage of already being at commercial scale production, something that advanced biofuels lack. While the ARB estimates that up to 2.73 billion gallons of ethanol per year from sugarcane will be available for California by 2020, the Brazilian government’s own export projections suggest only 500 million gallons of sugarcane ethanol will be sent to the entire U.S. market in 2020. If the latter projection turns out to be correct and supplies of sugarcane ethanol are limited, Californian fuel providers would be forced to outbid other purchasers, which would drive up fuel costs for consumers.
2. Vehicle fleet: Another major issue affecting the rollout of new transportation fuels is the makeup of California’s vehicle fleet. In order for companies to economically increase production of biofuels and natural gas, there need to be vehicles capable of running on these alternative fuels. One of these alternative fuels is E85, which is only capable of being consumed by flex-fuel vehicles. In 2010, California’s consumption of E85 was about 10 million gallons; in comparison, the state’s entire liquid fuel use was about 18 billion gallons. However, the ARB estimates that the demand for E85 will grow. By 2015, the estimate is that 521-528 million gallons of E85 will be consumed, and by 2020, that number should increase to 1.63-1.74 billion gallons of E85. This rate of growth depends in part on the growth of flex-fuel vehicles (FFVs). The ARB believes there will be an ample number of FFVs available to consume E85 volumes that may play a role in meeting the LCFS. The 2010 population of FFVs in the state was 359,000, and the ARB estimated that by 2015, there would be between 1.5-1.7 million FFVs in California. By 2020, it is estimated that the number of FFVs could be as high as 4.6 million vehicles. These numbers have been attacked as unrealistic by other parties. A study sponsored by the Western States Petroleum Association notes that changes in federal incentives to build more FFVs will phase out starting in 2015. The ARB itself notes that there will need to be a significant increase in E85 dispensers in order to provide adequate levels of the fuel to FFV users. This increase in

3
dispensers will have a cost range of $50,000 to $200,000 per installation, which makes it a difficult investment for retail station operators.
3. Economic impacts: The LCFS’s economic impacts have also been a matter of deep contention. A 2012 Boston Consulting Group report, sponsored by the WSPA, was highly critical of the Low Carbon Fuel Standard. It estimated that in the second compliance period (2015-2017), there could be a loss of 20-30% of California’s refining capacity, and 25-35% of the state’s refining capacity could be lost by 2020. This could result in California losing 28,000-51,000 jobs, of which 20-25% would come from refineries ceasing production. Many of these would be high-paying skilled manufacturing jobs, and the BCG estimates that only a small number of jobs (2,500-5,000) will be added in California due to the LCFS. Because many biofuels will be imported, the majority of green jobs created will be outside the state. Additionally, the state could lose up to $2.9 billion per year by 2020 from lost excise taxes on fuels. Finally, though California will reduce its emissions as a result of these policies, some of this reduction will be at the expense of increased emissions elsewhere, as refineries move out of the state. The BCG report was found to be lacking in several areas by an expert review panel of academics organized by UC Davis. It did not take into account impacts on other industries, like suppliers of low-carbon fuels, electric utilities, and other manufacturing enterprises. Nor does it consider impacts on consumer electricity prices, public health effects, or changes in employment not directly tied to oil refining. Additionally, more recent behavior of fuel providers and consumers paints a more optimistic picture than that suggested by the BCG report. The CI of conventional biofuels has decreased substantially, which has generated credits within the program. New low-carbon biofuels that do not require dedicated infrastructure or advanced technology vehicles have emerged. And the accumulation of LCFS credits has been substantial, which will make it easier to satisfy the requirements of the LCFS. Regarding the BCG’s claim of closed refineries and lost jobs because of the LCFS, the reviewers note that small refineries will likely shut down anyway due to federal fuels regulation and an overall trend towards reduced demand for gasoline. Additionally, California refineries have been resilient, and some refiners have already diversified upstream into the biofuels supply industries. In sum, the UC Davis review concludes that the BCG report makes a number of assumptions that could be classified as “worst-case scenarios”—not impossible, but highly improbable.
4. Future revisions to the LCFS: The ARB is considering a number of amendments to further incentivize low CI fuels and help contain costs by providing additional options for compliance. Five different cost containment provisions are being considered by the ARB. Option 1—A credit window, where if the regulated party is unable to purchase credits at the end of the compliance year, they can purchase compliance-only credits from the ARB. The proceeds from the credit purchases are distributed to parties who use or produce low-CI fuels. Option 2—Reinvestment, where instead of purchasing compliance-only credits, RPs would invest in projects outlined in the regulation that further the goals of the LCFS. Option 3—A credit multiplier, where additional LCFS credits are introduced by adding a multiplier for low-CI fuels. This approach amplifies the signal that low-CI fuels are valuable in the market. Option 4—Credit clearance, where RPs that are running deficits have two options to reconcile those deficits. If they are less than 10% short, they carry the deficit into the following year. If they are greater than 10% short, they can choose to purchase pro rata share of pledged credits in order to carry the negative balance into the following year. Option 5—A noncompliance penalty, where the RP out of compliance after the purchase of carry-back credits can opt to pay a pre-established, noncompliance penalty, with the funds deposited into the Air Pollution Control Fund.
Support Business & Municipalities: 8minutenergy Renewables; AliphaJet; City of Azusa Light & Water; BLU MOON Group; Bowman Design Group; Burbank Water and Power; Calgren Renewable Fuels; California Clean Energy Fund; California Electric Transportation Coalition; California Municipal Utilities Association; California Natural Gas Vehicle Coalition; Clean Energy; CleanTECH San Diego; Clean World Partners; Conscious Ventures Group; Coulomb Technologies; Craton Equity Partners; Dreyfuss & Blackford Architects; ECOtality, Inc.; Environment & Enterprise Strategies; Every Watt Matters, LLC; Fulcrum BioEnergy, Inc.; General Motors Company; Geoexchange Solutions, Inc.; Glendale Water & Power; Green Chamber of Commerce; Harrington Design; Intex Solutions, Inc.; Latin Business Association; Law Offices of John H. Reaves; Levi Strauss & Co.; Los Angeles Department; of Water & Power; LS9; Luminesa; Next Energy Technologies, Inc.; Nissan North America, Inc.; OneID, Inc.; OriginOil; Pacific Gas and Electric Company; Professional Engineers in California Government (PECG); Propel Fuels; Sacramento Municipal Utility District; San Diego Gas & Electric; San Francisco Chamber of Commerce; Seasonal Energy; The Sexton Company; Siliken USA; Small Business California; Small Business Majority; Solana Energy; Solazyme, Inc.; Southern California Edison; Southern California Gas Company;

4
Sustainable Business Council of LA; SynGest; TerraPass, Inc.; Transportation Power, Inc.; USGBC, California; The Westly Group; Western Grid Group; Yulex Corporation. NGOs: (partial list; these are the leading groups): American Lung Association in California; Asian Pacific Environmental Network; BlueGreen Alliance; Breathe California; California Interfaith Power and Light; Catholic Charities; Stockton Diocese; CEERT; Center for Biological Diversity; CLCV; Climate Resolve; Coalition for Clean Air; Communities for a Better Environment; Consumer Action; Environment California; Environmental Defense Fund; Fresno-Madera Medical Society; Greenlining Institute; Natural Resources Defense Council; Next Generation; Physicians for Social Responsibility – LA; Sierra Club; The Nature Conservancy; TransForm; Truman Nat'l Security Project/Op. Free; Union of Concerned Scientists Opposition WSPA, CMTA, Cal Chamber, Fueling California members

1
Invest in a Clean Energy Future and a Healthy Environment:
AB 32 Cap-and-Trade Investment Opportunities
The Silicon Valley Leadership Group has identified areas in each of the broad categories contained in the Governor’s budget where investments can achieve significant GHG reductions and yield meaningful co-benefits such as job creation and improved public health. The areas include:
1. Clean and Efficient Energy and Next-generation Low-carbon Transportation Large scale clean technology development and deployment will help reduce California’s reliance on fossil fuels and significantly reduce the amount of GHGs the state produces. Further, deployment of these technologies will help create jobs across the state. a. Sustainable Development Bank (“Green Bank”): Such a bank would provide low interest
loans, performance-based grants and/or loan guarantees to those that want to invest in clean energy, energy efficiency, or electric and alternative fuel infrastructure. The bank is important as adequate financing is one of the key obstacles to the widespread deployment of clean and efficient energy solutions. In effect, the Bank would help ease transition to a clean economy by making clean and efficient energy technologies more cost competitive with fossil fuels. We believe the Bank should be structured as a public-private partnership and as such, could better leverage private capital (we believe at up to a 10:1 ratio) in a fashion that mitigates investment risk, catalyzes market activity and lowers borrowing costs. The Sustainable Development Bank will enable innovative, commercially viable clean-energy technologies in such areas as wind, solar, geothermal, advanced biomass, increased efficiency, and clean and efficient transportation infrastructure and deployment of next-generation electric vehicles —to be deployed at greater scale. The Bank should support deployment in a technology neutral fashion, so that the state is not in the role of picking winners and losers. The Bank should take into account and coordinate with new programs that are currently being implemented such as Prop 39 and other ongoing state programs. Finally, we believe the state can create an effective Sustainable Development Bank using a relatively small amount of funding (approximately $100 million) per year.
b. Existing Programs with GHG Reduction Benefits: The state has existing programs with proven GHG reduction benefits. Investing in these programs would allow the state to quickly achieve near-term GHG reductions through existing channels by avoiding the time it takes to create entirely new programs. Existing vehicles that could benefit from new funding include such as PACE programs, distributed generation deployments, clean energy generation and energy efficiency upgrades at public facilities, clean and efficient transportation infrastructure, and deployment of next-generation electric vehicles. Examples include:
Commercial PACE programs
California Solar Initiative (set to expire by 2017)

2
Energy efficiency retrofit and rebate programs
Emerging Renewables Program / Self Generation Incentive Program
New Solar Homes Partnership
AB 118 Program
c. New Programs with GHG Reduction Benefits: We agree with Clean Energy Working Group that the state should invest in new programs to help remove key barriers to clean and efficient technology deployment. These investments should be overseen by a single state agency and coordinated with existing programs. Gaps exist in the following areas:
Implementation of home/business energy efficiency, energy management and demand response technologies through rebates;
Funding to accelerate and demonstrate integration of distributed generation and energy storage technologies with existing smart grid systems;
Market facilitation for emerging technologies to help bridge the “valley of death”;
Incentivize utilities and/or third parties to adopt and deploy smart grid-connected EVs;
Direct grants for state/local investment in distributed generation - i.e. schools;
Financing to encourage agricultural biogas production for the pipeline.
d. Spur R&D to Help Reach 2050 Goal: Deployment of existing technology, even at scale, will not enable California to reach its goal of reducing GHG emissions to 80 percent below 1990 levels by 2050, according to the California Council on Science and Technology.31 The report states that achieving this goal will require "intensive and sustained investment in new technologies.” Thus, we believe the state should consider creating a “Green Prize” or a technology investment account which would help spur innovation in groundbreaking technology in any of a number of areas such as large-scale, commercially viable carbon sequestration.42 This should complement the already existing EPIC program, which supports R&D, but currently will not fund research on carbon reduction, at least in the upcoming program cycle. We believe this could be created using a relatively small amount of funding (approximately $5 - 10 million) per year. Finally, we believe this effort would best be administered by a non-profit, working in close coordination with the state.
2. Natural Resources Management Climate change is already leading to rising temperatures, increased rainfall variability, rising sea levels and other climatic changes such as more extreme weather events. It is critical for the state to begin addressing the impacts of current climate variability and future climate change by investing in natural resource measures that provide the co-benefits of GHG mitigation via sequestration while also helping the state prepare for a very different future. We agree with a consortium of leading natural resources groups including the Nature Conservancy, the Pacific Forest Trust, etc., that some portion of the pollution fee dollars should support natural resources management activities that sequesters GHGs, whereby atmospheric
3 http://ccst.us/publications/2011/2011energy.pdf
4 Prizes designed to facilitate technological breakthroughs have a proven track record. The Orteig Prize inspired Charles Lindbergh in 1927 to be
the first to fly nonstop from New York to Paris. The $10 million Ansari X Prize was awarded to Paul Allen's team in 2004 for the creation of a privately financed spacecraft, and the contest generated more than $100 million in private investment in spacecraft innovation. Both prizes launched new industries.

3
carbon or methane is incorporated into plants, soils, and water. Highly productive sources of carbon sequestration include wetlands, forests and watersheds. a. Forest Conservation and Restoration: California forests and vegetation remove vast
amounts of carbon dioxide from the atmosphere. Forest conservation and, especially reforestation and afforestoration programs have the capacity to reduce GHG emissions and achieve multiple public and environmental benefits, including the protection of air and water quality, fish and wildlife habitat and recreation. Key programs that should be identified in the Investment Plan include:
California Forest Improvement Program administered by CAL FIRE
Working Forest Conservation Easement programs including CAL FIRE’s Forest Legacy;
Program, the Wildlife Conservation Board’s (WCB) Forest Conservation Program;
The Sierra Nevada Conservancy, Tahoe Conservancy and State Coastal Conservancy.
b. Wetlands and Watershed Restoration: Wetlands and watershed restoration efforts in the Sacramento San Joaquin Delta, the San Francisco Bay and elsewhere provide opportunities to reduce methane and carbon dioxide emissions while also sequestering additional GHGs. These efforts can also help reduce land subsidence, protect areas from sea level rise, and enhance water quality. Existing State programs that could immediately supports these efforts include:
The Inland Wetlands Conservation Program administered by the Wildlife Conservation Board;
The Delta Conservancy and State Coastal Conservancy;
The Watershed Program administered by the Department of Conservation.
3. Sustainable Infrastructure Development Our land use patterns drive heavy greenhouse gas emissions from the transportation sector. Between 1975 and 2004, the number of miles driven by Californians increased more than 3% per year. In contrast, California’s population growth was less than 2% per year during the same period.53 Doubling neighborhood density can reduce both vehicle trips and the number of miles driven by about 5%.64 SB 375 required regional planning agencies to create a plan for how transportation and land use could reduce greenhouse gas emissions. The Leadership Group supported the legislation and is working to implement the bill at regional and local levels. The major challenge in the process is obtaining local buy-in. Local cities and counties push back on issues like tying transportation funds to future housing production or planning for more homes. Communities cite challenges such as reduced money for affordable housing and inadequate sewer and school infrastructure as impediments to building compact infill. Therefore, we agree with the Transportation Coalition for Livable Communities that auction monies derived from vehicle fuels should be used to fund transportation system needs in a way that achieves AB 32 objectives and builds on the framework of SB 375. Based on research, the proposed Livable Community Infrastructure Program would leverage a cost effective investment
5 State of California, Department of Finance, Race/Ethnic Population with Age and Sex Detail, 1970-2004. Sacramento, CA, December 1998 and
United States Government, Federal Highway Authority, Highway Statistics 1975-2004, Washington D.C., 2005. 6 Ewing R. and R. Cervero, “Travel and the Built Environment,” Transportation Research Record, Vol. 1780, pp. 87–114, 2001.

4
portfolio across transportation efficiency measures, land use incentives, and improved transportation options to yield the greatest GHG reductions associated with the transportation sector. We support an array of transportation efficiency and land use incentives and improvements put forward by the Coalition, including: a. Transportation efficiency measures:
Network and demand management (e.g. transit/bike priority signalization; trip reduction programs; roundabouts/roadway modifications; congestion pricing);
Transit service, maintenance and operating costs (e.g. Bus Rapid Transit);
Increase funding for bike networks and pedestrian amenities, with an emphasis on bicycle and pedestrian connections to transit;
Multi-modal network connectivity to reduce travel distances and improve access to parks, schools, jobs, housing, and markets for rural and urban communities (e.g. neighborhood scale planning);
Augment funding for alternative fuel programs that promote the mass adoption of new technologies;
b. Land use incentives and improved transportation options:
Funding to develop and implement land use modifications to support regional plans (e.g. updating zoning codes, parking standards, Level of Service policies);
Other community infrastructure (e.g. water, sewer, greening) to support Transit Oriented Development, affordable housing, urban infill and small walkable communities in rural neighborhoods;
Enact planning and zoning changes in Priority Development Areas.75
Reward jurisdictions with flexible infrastructure funds when it approves compact homes and/or workplaces. This could be done through a program like the One Bay Area Grant or Transportation for Livable Communities;
Plan and build compact, affordable homes and dense offices near transit paired with car-share memberships and transit passes.
We believe that investing in the areas detailed above, guided by the principles we also outline, will help the state achieve measureable GHG reductions in both the near- and long-term, realize meaningful co-benefits, and help maintain public support for California’s leadership in addressing climate change and clean air.
7 Priority Development Areas are local government nominated areas slated to take on more intense future growth.

Date: June 12, 2013
To: Environment Committee & Transportation Committee
From: Mike Mielke, VP, Environmental Programs and Policy; Shaila Narang, Environment Coordinator
Re: AB 32 Implementation: Funding Source Matrix
The matrix below summarizes potential funding sources to drive technological innovation and GHG reductions in support of the state’s goals. As we consider tactics and funding to move the State towards greater sustainability, we must think holistically about how these pots of money and supporting regulation/legislation work together.
Prop 39 AB 32 C&T EPIC AB 118/Carl Moyer OBAG
Overview Prop 39 closes a tax loophole by requiring out-of-state businesses to calculate their California income tax liability based solely on the percentage of their sales in California and repealing an existing law previously gave out-of-state businesses an option to choose favorable tax treatment due to their property and payroll outside California.
AB 32 C&T regulation is a market-based compliance mechanism to impose a cap on the aggregate GHG emissions allowed from “capped sectors.” Each year the cap declines by 3%, thus resulting in a reduction in GHG emissions over time. Entities can either purchase “allowances” to emit GHGs, or use “offsets” resulting from an emissions reduction achieved in an uncapped sector.
EPIC is a clean energy research, development and demonstration (RD&D) program overseen by the California Public Utilities Commission (CPUC). The program is budget neutral because investments are included in electricity rates.
AB 118 established the following three funding programs for modernizing transportation infrastructure to meet climate and clean air goals: 1) Alternative and Renewable Fuels and Vehicle Technology Program (ARFVTP) overseen by CEC; 2) Air Quality Improvement Program (AQIP) by ARB; and 3) Enhanced Fleet Modernization Program (EFMP) by Bureau of Automotive Repair (BAR).
One Bay Area Grant (OBAG) program from MTC is a new funding approach that better integrates the region’s federal transportation program with California’s climate law (Senate Bill 375) and the Sustainable Communities Strategy.
Amount of revenue expected
$1 billion annually and overall $5 billion over five years. Half of that - roughly $2.5 billion over five years would go to Energy efficiency and clean energy projects at California’s schools &
The three auctions conducted so far, covering Utilities and large industrial polluters, raised over $260 million in state revenue. The future auctions are expected to produce
A $162 million/year program. Of that, $55 million allocated to research, $75 million on demonstration, $15 million on marketing, and $17 million on administration. 80%
1) The CEC has an annual program budget of approximately $100 million funded by various fee surcharges to support projects
OBAG establishes commitments for investing roughly $800 million over the four-year Cycle 2 period, funded through continuations of the

community colleges. The other half will go to the state's general fund.
over $1 billion annually as the program expands in 2015 to cover the distributors of transportation fuels.
funds administered by CEC and rest by Utilities.
under ARFVTP. 2) AQIP receives
between $30-36 million per year from various fees.
3) EFMP receives roughly $30 million per year.
SB 11 has proposed continuation of above annual revenues of $180 million from fee surcharges for various AB 118 programs until 2024.
Federal surface transportation legislation (currently MAP-21).
Timeline Five years (2013-14 through 2017-18)
All sectors will be covered through 2020
Eight years (Jan 2013 through Dec 2020)
SB 11 & AB 8 would extend until January 1, 2024, extra charges on vehicle registrations and others in order to fund the AB 118 programs.
Four-year Cycle 2 period (2012-13 through 2015-16).
Types of activities meant to address
Much of the Prop 39 money would go to improving heating and cooling systems, as well as upgrading lights in public schools.
Several – Energy Efficiency, Clean energy, Natural Resources conservation, Low-Carbon Transportation etc.
EPIC funds energy efficiency, renewable energy, and RD&D programs in California. Applicable sectors - Commercial, Industrial, Residential, General Public/Consumer, Utility, and Institutional.
AB 118 programs fund development and deployment of emerging clean transportation technologies and infrastructure needed to meet clean air and climate goals.
Funding targeted toward achieving local land-use and housing policies by: • Rewarding jurisdictions that accept Regional Housing Need Allocation (RHNA) process. • Supporting the Sustainable Communities Strategy. • Flexibility to invest in Transportation for Livable Communities, etc
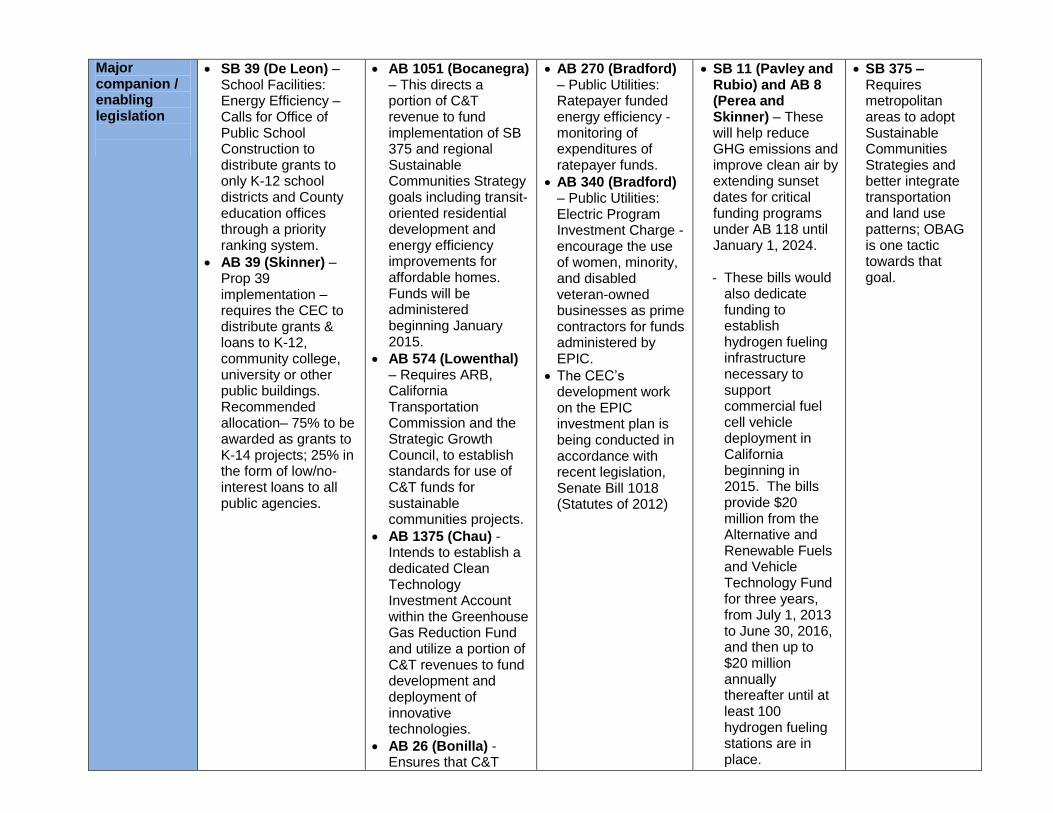
Major companion / enabling legislation
SB 39 (De Leon) – School Facilities: Energy Efficiency – Calls for Office of Public School Construction to distribute grants to only K-12 school districts and County education offices through a priority ranking system.
AB 39 (Skinner) – Prop 39 implementation – requires the CEC to distribute grants & loans to K-12, community college, university or other public buildings. Recommended allocation– 75% to be awarded as grants to K-14 projects; 25% in the form of low/no-interest loans to all public agencies.
AB 1051 (Bocanegra) – This directs a portion of C&T revenue to fund implementation of SB 375 and regional Sustainable Communities Strategy goals including transit-oriented residential development and energy efficiency improvements for affordable homes. Funds will be administered beginning January 2015.
AB 574 (Lowenthal) – Requires ARB, California Transportation Commission and the Strategic Growth Council, to establish standards for use of C&T funds for sustainable communities projects.
AB 1375 (Chau) - Intends to establish a dedicated Clean Technology Investment Account within the Greenhouse Gas Reduction Fund and utilize a portion of C&T revenues to fund development and deployment of innovative technologies.
AB 26 (Bonilla) - Ensures that C&T
AB 270 (Bradford) – Public Utilities: Ratepayer funded energy efficiency - monitoring of expenditures of ratepayer funds.
AB 340 (Bradford) – Public Utilities: Electric Program Investment Charge - encourage the use of women, minority, and disabled veteran-owned businesses as prime contractors for funds administered by EPIC.
The CEC’s development work on the EPIC investment plan is being conducted in accordance with recent legislation, Senate Bill 1018 (Statutes of 2012)
SB 11 (Pavley and Rubio) and AB 8 (Perea and Skinner) – These will help reduce GHG emissions and improve clean air by extending sunset dates for critical funding programs under AB 118 until January 1, 2024. - These bills would
also dedicate funding to establish hydrogen fueling infrastructure necessary to support commercial fuel cell vehicle deployment in California beginning in 2015. The bills provide $20 million from the Alternative and Renewable Fuels and Vehicle Technology Fund for three years, from July 1, 2013 to June 30, 2016, and then up to $20 million annually thereafter until at least 100 hydrogen fueling stations are in place.
SB 375 – Requires metropolitan areas to adopt Sustainable Communities Strategies and better integrate transportation and land use patterns; OBAG is one tactic towards that goal.

investment plan considers regional reinvestment and workforce skills transition as important priorities.
These programs are paid for by dedicated vehicle, tire, vessel, and smog abatement fees and do not require general fund revenues.
Established SVLG positions
1. Prop 39 – Public K-12 Schools, Community Colleges, and Public Colleges and Universities Should All Be Eligible for Prop 39 funding.
2. EPIC – There should not be a set 80/20 split of the funds between the California Energy Commission (CEC) and the utilities, but rather should be allocated based on the qualifying projects or programs presented for consideration.
3. EPIC – The Leadership Group supports a technology neutral investment strategy for the EPIC program (instead of 20% earmarked for Bioenergy) to ensure a level playing field for each technology to compete in the marketplace.
4. C&T – See brief on AB 32 Cap and Trade Investment Opportunities Key questions to guide discussion:
1. What other funding sources should be considered in this mix, if any? 2. For Transportation and Housing and Land-use Committees – Whether Cap-and-Trade revenue should be spent to develop transit-
oriented development, improve energy efficiency for affordable multi-family homes and secure open space (SB 375). 3. Should cap-and-trade funds should be distributed at a statewide or regional level?
_______________ General Notes
Automakers are poised to introduce hydrogen fuel cell vehicles in California and several have announced plans to launch beginning in 2015, but the lack of sufficient fueling infrastructure remains a significant obstacle. Hence SB 11 and AB 8 are very important enablers in this regard.
California has about 10,000 public schools in nearly 60,000 school buildings to educate its roughly 6 million students. State Superintendent of Public Instruction Tom Torlakson, a Democrat said 70 percent of those school buildings are more than 25 years old, and a large portion of those are more than 50 years old.
Under the governor’s plan for Prop 39 implementation, exceptionally small districts – those with ADA of 200 or less – would receive the minimum grant of $15,000. All other districts would receive a minimum grant of $50,000 or a per-ADA allocation of $65.46, whichever is larger. Therefore, districts with an ADA up to 764 would get $50,000 each while all others would receive $65.46 per ADA.

Institute of Transportation Studies ◦ University of California, Davis
1605 Tilia Street ◦ Davis, California 95616
PHONE (530) 752-6548 ◦ FAX (530) 752-6572
www.its.ucdavis.edu
Research Report – UCD-ITS-RR-13-06
Status Review of California's Low Carbon Fuel Standard
Spring 2013 (REVISED VERSION)
Sonia Yeh Julie Witcover
Jeff Kessler

Status Review of California’s Low Carbon Fuel Standard Spring 2013
1
Status Review of California’s Low Carbon Fuel Standard
Sonia Yeh ([email protected]), Julie Witcover ([email protected]) and Jeff Kessler
([email protected]) Institute of Transportation Studies, University of California, Davis
Spring 2013 (REVISED VERSION)1
The Low Carbon Fuel Standard (LCFS) is a performance-based regulation adopted in California in 2009 that requires regulated parties (e.g., oil producers and importers to California) to reduce the carbon intensity (CI) of their fuel mix by at least 10% by 2020. It sets declining annual targets, starting slowly with a 0.25% reduction in 2011 and increasing to 10% reduction by 2020. This regulation contributes to California’s overall greenhouse gas (GHG) emission reduction goals under the Global Warming Solutions Act of 2006 (AB 32). This is the second in a series of periodic status reports of California’s LCFS. Each report will provide updates on LCFS compliance and markets, and address selected special topics. The reports review data, analyze trends, and identify potential challenges, but avoid making predictions. This second report addresses the following topics:
1. Credits and deficits 2. Carbon intensity of fuels 3. Credit trading and credit prices 4. Federal Renewable Fuel Standard (RFS2) and implications for LCFS feedstocks 5. Issues that affect compliance (special topic)
Highlights: • In 2012, low carbon fuels displaced roughly 1.06 billion gallons of gasoline and 45 million gasoline
gallon equivalents (gge) of diesel (representing 6.2% of total gasoline and diesel fuel) at average carbon intensities of 84.95 gCO2e/MJ (grams of carbon dioxide equivalent per megajoule) and 58.34 gCO2e/MJ respectively.
• By the end of 2012, the program recorded net excess credits of 1.285 million metric tons (MMT) of CO2e. This bank of excess credits represents about half of that needed to meet the 2013 LCFS obligation, though some of these credits may be required to offset deficits created from use of higher carbon petroleum fuels in 2011 and 2012.
• Of these net LCFS credits 78% were generated from ethanol, 12% from natural gas and bio-based gases (as liquid and compressed natural gas), 9% from biodiesel/renewable diesel, and 1% from electricity. Biofuels made from waste materials comprised less than 1% of biofuel volumes but generated 10% of biofuel credits, due to their very low CI.
• LCFS credit prices reported to the California Air Resources Board (ARB) averaged about $13.50/MT CO2e (metric tons of carbon dioxide equivalents) in 2012 and $27.70 for the first two months of 2013. Credit prices increased to over $35 between mid-January and late February 2013, according to Oil Petroleum Information Service (OPIS) and Argus Media (Argus) reports.
• Since implementation, regulated parties have responded to the LCFS by lowering the CI of the California fuel pool. Continued LCFS compliance will require continued CI reductions.
1 This revision corrects an error in Section 5a on compliance issues, and in the associated highlight (final bullet on Page 1), that appeared in the initial release of this Spring 2013 Status Review. We apologize for the mistake.

Status Review of California’s Low Carbon Fuel Standard Spring 2013
2
Introduction
In January 2010, the California Air Resources Board (ARB) began implementation of the Low Carbon Fuel Standard (LCFS), a performance-based regulation that requires sellers of transportation fuels (e.g. oil companies, refiners) to reduce the average carbon intensity (CI) of the transportation fuel mix by at least 10% by 2020. The standard is back-loaded with increasing stringency in later years, starting with required reductions of 0.25%, 0.5%, and 1% in 2011, 2012, and 2013, respectively.
The LCFS policy aims to reduce emissions of greenhouse gases (GHGs) by creating financial incentives for innovation and deployment of low carbon fuels. Regulated parties have several options to meet the standard. They can produce their own low carbon fuels, buy fuels from producers to sell on the market, purchase credits generated by others, or use some combination of these strategies. Potential low carbon fuel technologies include biofuels from waste and cellulosic materials, natural gas, electricity used in plug-in vehicles, and hydrogen used in fuel cell vehicles.
In the last status review, which examined compliance in 2011 through August 2012, we found California’s low carbon fuel market was growing and regulated parties were exceeding the requirements for 2011 and Q1 2012 by a substantial margin. Based on available data, we found the average compliance cost in August 2012 (the first period that LCFS credit prices were tracked by the industry) was $13/MT CO2e, adding about $0.1 per gallon to the production cost of gasoline (Yeh and Witcover 2012). In this issue, we review LCFS compliance for 2011 through December 2012. We examine credits and deficits generated and fuel volumes (Section 1), carbon intensity of fuels (Section 2), and credit trading and prices (Section 3). We turn to the Federal Renewable Fuel Standard (RFS2) and implications for LCFS feedstocks with a focus on Brazilian sugarcane, cellulosic
biofuels, and corn ethanol (Section 4). Finally, we examine three issues related to compliance (Section 5). Those three issues are: (1) meeting the standard under the status quo; (2) the link between the California LCFS compliance schedule and the potential changes in the corn ethanol indirect land-use change (ILUC) carbon intensity value; and (3) interactions between the LCFS and California’s Cap-and-Trade program under AB 32.
1. Credits and Deficits
From 2011 through Q4 2012, cumulative credits generated under the LCFS total 2,835,662 metric tons of CO2e, while cumulative deficits total 1,550,698 metric tons CO2e, for a net excess of 1.285 million credits (metric tons of CO2e) (Figure 1). If all available for use,1 the bank of excess credits represents about half of what is needed to cover the 2013 obligation.2
Figure 1. California LCFS carbon credits and
deficits generated in each quarter. Net LCFS credits (excess of credits over deficits) generated per quarter showed an upward trend (Figure 2, top). Credit shares for most fuel types remained relatively constant (Figure 2, bottom). Roughly 78% of net LCFS credits were generated from ethanol, 12% from fossil and bio-based LNG or CNG, and 9% from biodiesel/renewable diesel. Electricity generated 1% of the net credits. The share of electricity grew from negligible levels in 2011 to reach about 2% by the final quarter of 2012.

Status Review of California’s Low Carbon Fuel Standard Spring 2013
3
Figure 2. Total net LCFS credits by fuel type per quarter: number of credits (top) and percentage
shares (bottom). Among biofuels, corn and corn/sorghum/wheat mixed ethanol pathways (corn+) constituted the majority of the fuel volume (95%, Figure 3, top) and net credits (80%, Figure 3, bottom). Biofuels using waste as a feedstock (for biodiesel and ethanol) comprised less than 1% of biofuel volumes but 10% of biofuel credits due to their low CI (see next section). Corn/sorghum/wheat mixed ethanol pathways (corn+ in the figure) contributed about 19% of biofuel credits.
Rolling four-quarter averages of net biofuel credits show an increased but still modest contribution from sugarcane ethanol, plus subtle shifts in the feedstock mix towards lower-CI ethanol grain mixes (corn+) and waste (Figure 4 and next section).
Overall, in 2012, non-petroleum based fuels contributed 6.19% (energy content) of the total transportation fuel mix (Table 1). This amounts to an annual average displacement of about 1.06 billion gallons of gasoline and 45 million gasoline gallon
equivalents (gge) of diesel. The average fuel mix was about 11.5% (by volume) ethanol in the gasoline mix (some fuels are sold as E85, 85% ethanol blended in gasoline) and 0.5% biodiesel/renewable diesel in the diesel mix.
Figure 3. LCFS biofuels by feedstock per quarter:
volumes (top) and number of net credits generated (bottom).
Corn+ refers to corn/sorghum/wheat mixed ethanol pathways.
Figure 4. Rolling four-quarter averages of LCFS net
credits generated by biofuel feedstock.

Status Review of California’s Low Carbon Fuel Standard Spring 2013
4
Table 1. Total transportation fuel volumes (in billion gge, unless specified as million gge (mgge)) reported in California LCFS program.
2011 2012 CARBOB (gasoline) 12.90 12.78 ULSD (ultra-low sulfur diesel) 3.91 4.02 Ethanol 1.02 1.00 Biodiesel/renewable diesel (mgge) 13.2 21.9 CNG/LNG (mgge) 74.4 84.0 Electricity (mgge) 0.12 1.06 Total 17.92 17.91
2. Carbon Intensity of Fuels
The average fuel carbon intensity (AFCI) of gasoline and diesel substitutes declined over the period, from 87.7 and 63.4 gCO2e/MJ, respectively, in Q1 2011 to just below 83.2 gCO2e/MJ and 59.6 gCO2e/MJ, respectively, in Q4 2012 (Figure 5).
Figure 5. Average fuel carbon intensities (AFCI) of
gasoline and diesel substitutes.
CI within fuel types and feedstock pathways in California’s LCFS fuel pool remained relatively stable over the review period (Figure 6). From this and previous figures and tables (Figures 2-4, Table 1), we conclude that, over the period, California achieved a gradual decline in AFCI with a fairly stable contribution from alternative fuels. The reduced AFCI came mostly from moderate CI reductions within corn and corn+ pathways and slightly greater reliance on pathways with lower carbon intensities.
Figure 6. Change in AFCIs over time by fuel type (top) and AFCIs of biofuels by feedstock pathway
(bottom).
Figure 7 shows California transportation fuel CIs by individual pathways by the end of 2012, including default values set by the ARB and values provided by regulated parties through Method 2A (improvement through existing pathways) and Method 2B (improvement through new pathways) approaches3 for a total of 129 default pathways and 105 pathways from regulated parties.

Status Review of California’s Low Carbon Fuel Standard Spring 2013
5
Figure 7. Carbon intensity (CI) values of fuel pathways in use in California’s LCFS as of February 2013.
Bars represent the default values determined by the ARB. Glowing lines represent values provided by regulated parties through Methods 2A and 2B. The horizontal line represents the default gasoline (CARBOB) and diesel
(ULSD) values (not distinguished at this scale). Numbers under each bar represent the number of default and opt-in CI values for each pathway. Some opt-in values can be lower than the default values in a particular pathway due to
differences in the designed vs. actual technologies used. CI values are adjusted with an energy efficiency ratio (EER) of 3.4 for electricity and 2.5 for hydrogen (gasoline displacement). Corn+ pathway is ethanol produced from a mix of
grain-based feedstock including corn, sorghum, and wheat slurry. “Ethanol other” includes feedstock from other grains (e.g. sorghum) or waste (e.g. waste beverage). “BD/RD other” includes biodiesel or renewable diesel from
other oil seeds or corn oil.
3. Credit Trading and Credit Prices
There is no official record of credit trades and corresponding prices among regulated parties, but the ARB as well as industry trade groups (Oil Price Information Service and Argus Media Limited — OPIS and Argus, respectively) provide some information on the California LCFS credit market.
The ARB’s quarterly LCFS summaries track a rise in total number of transactions reported, from five in Q1 2012 to 17 through Q3 2012, to 32 through Q4 2012, with trade volumes ranging from 60–47,500 MT. The most recent ARB summary data indicate a total of about 45 transactions, with 13 occurring thus far in 2013, and more than 250,000 credits traded overall.
Reported credit trade prices ranged from $10–$31 for 2012 and from $25–$35 for 2013 thus far. As of mid-March 2013, the average 2012 LCFS credit trade price reported was $13.50, and the 2013 the average was $27.70.

Status Review of California’s Low Carbon Fuel Standard Spring 2013
6
Figure 8. Range of daily price assessment (traded price range or range of bids and offers) on LCFS
credit prices. Based on data extracted from the
OPIS Daily Market Overview.
OPIS and Argus both began regular reporting on the LCFS credit market in August 2012.4 OPIS data show that average daily credit value remained close to $12.50 until late November 2012, rose over the next month to plateau at about $26, and underwent another increase after mid-January 2013 to over $35 in late February (Figure 8).5 Argus’s reported credit values follow a similar trend.
4. Federal Renewable Fuel Standard (RFS2) and Implications for LCFS Feedstocks Because the RFS2 mandates specific volumes of fuels at particular CI thresholds, it affects the feedstock used to produce U.S. fuels. Such RFS2 feedstock decisions, in turn, have implications for fuel and feedstock use under the LCFS. We examine several feedstock-specific issues in this section. 4a. Brazilian sugarcane ethanol “Fuel shuffling” generally refers to a case when fuels are moved or “shuffled” from one market to another without any significant change in overall production or fuel characteristics. Low carbon fuel policies provide incentives to use lower CI fuels (such as Brazilian sugarcane ethanol) in place of higher CI ones (such as corn ethanol). Shuffled fuels could indicate that markets are responding to policies that differentiate fuels on the basis of CI. At the same time, if policy incentives do not ultimately encourage the production of more low carbon fuel and less high carbon fuel, shuffling may not reduce emissions and may even increase emissions from transport of the fuels (Meyer, Schmidhuber, and Barreiro-Hurlé 2012).
Many pointed to the fact that U.S. exports of corn ethanol to Brazil increased from zero prior to 2011 to near 1.7 million barrels in December 2011, while U.S. imports of Brazilian ethanol followed a similar pattern (but with lower volume) over the same period. The following year, U.S. corn ethanol exports dropped off due to the summer drought and sugarcane ethanol imports increased, but a two-way trading pattern still existed. Were these examples of policy-induced fuel shuffling?
Factors other than policy play an important role. The global production and trade of ethanol are significantly affected by weather (including the U.S. drought in summer 2012 and poor Brazilian sugar harvest of 2011), prices, and domestic and global demand for biofuels. Global demand is influenced by economic growth, global oil prices, and biofuel and other policies at subnational and national levels in the U.S., Brazil, and elsewhere. The lack of a formal definition of fuel shuffling and the many factors that affect fuel production levels and trade patterns make it difficult to make a conclusive

Status Review of California’s Low Carbon Fuel Standard Spring 2013
7
statement about fuel shuffling between corn ethanol and Brazilian sugarcane ethanol during the review period. Several observations emerge from our analysis of monthly trade data6 (Figure 9):
1. U.S. corn ethanol exports were driven in large part by favorable production economics and soft demand due to economic recession and the E10 “blend wall” that limits the mix of ethanol to no more than 10% of the volume of blended gasoline. A poor sugarcane harvest in Brazil created opportunities for U.S. exports to Brazil and other markets that Brazil usually supplied.7 Of total corn ethanol exports in 2011–2012, 25% went to Brazil; the rest were delivered to Canada, the United Kingdom, the Netherlands, United Arab Emirates, and others.
2. Federal mandates for advanced biofuels may have been a key factor driving U.S. sugarcane ethanol imports. At the same time, California used 19% of total U.S. imports of sugarcane ethanol during this review period while accounting for only 10% of U.S. consumption of corn ethanol and total fuel. This usage pattern could well be due to the more favorable treatment of Brazilian sugarcane ethanol under the LCFS.
Figure 9. U.S. fuel ethanol exports and imports.
4b. Availability of cellulosic biofuels In 2012, 21,093 gallons of cellulosic biofuels were produced from waste materials (including 20,069 gallons of cellulosic ethanol and 1,024 gallons of cellulosic diesel). None reached California’s market. The actual production was far short of the 8.65 million gallons revised requirement set by the U.S. Environmental Protection Agency (U.S. EPA) under the RFS2. The 2012 requirements were recently vacated by a federal appeals court.8 For 2013, the U.S. EPA proposed an RFS2 cellulosic biofuel requirement of 14 million gallons, citing likely production from two companies: KiOR (producing gasoline and diesel from wood waste at its plant in Columbus, Miss.) and INEOS Bio (producing cellulosic ethanol from vegetative waste at its plant in Vero Beach, Fla.).9
4c. Corn ethanol and RIN values Renewable Identification Numbers (RINs) are codes assigned to renewable fuel volumes to track RFS2 compliance. RIN prices associated with corn ethanol rose sharply from less than $0.10 per gallon in late 2012 to over $0.40 per gallon in late February 2013 (Figure 10, top), to over a dollar in March 2013 (beyond the period for which we currently have daily data).
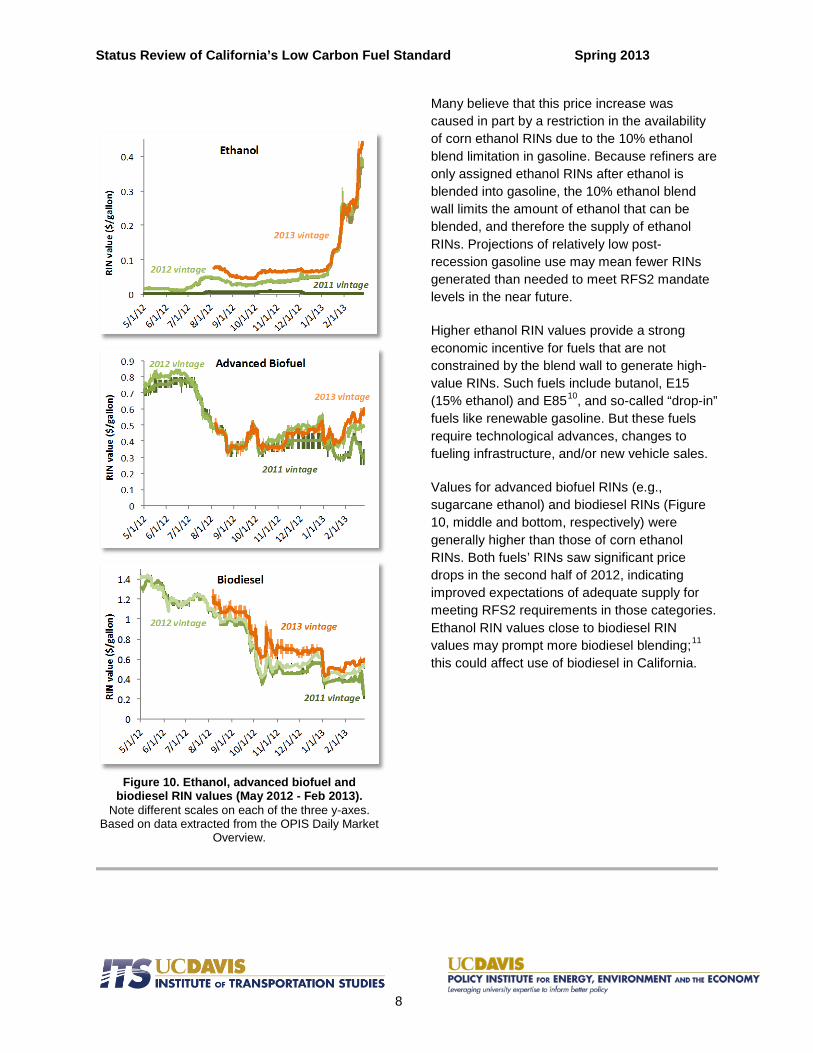
Status Review of California’s Low Carbon Fuel Standard Spring 2013
8
Figure 10. Ethanol, advanced biofuel and
biodiesel RIN values (May 2012 - Feb 2013). Note different scales on each of the three y-axes.
Based on data extracted from the OPIS Daily Market Overview.
Many believe that this price increase was caused in part by a restriction in the availability of corn ethanol RINs due to the 10% ethanol blend limitation in gasoline. Because refiners are only assigned ethanol RINs after ethanol is blended into gasoline, the 10% ethanol blend wall limits the amount of ethanol that can be blended, and therefore the supply of ethanol RINs. Projections of relatively low post-recession gasoline use may mean fewer RINs generated than needed to meet RFS2 mandate levels in the near future.
Higher ethanol RIN values provide a strong economic incentive for fuels that are not constrained by the blend wall to generate high-value RINs. Such fuels include butanol, E15 (15% ethanol) and E8510, and so-called “drop-in” fuels like renewable gasoline. But these fuels require technological advances, changes to fueling infrastructure, and/or new vehicle sales.
Values for advanced biofuel RINs (e.g., sugarcane ethanol) and biodiesel RINs (Figure 10, middle and bottom, respectively) were generally higher than those of corn ethanol RINs. Both fuels’ RINs saw significant price drops in the second half of 2012, indicating improved expectations of adequate supply for meeting RFS2 requirements in those categories. Ethanol RIN values close to biodiesel RIN values may prompt more biodiesel blending;11 this could affect use of biodiesel in California.
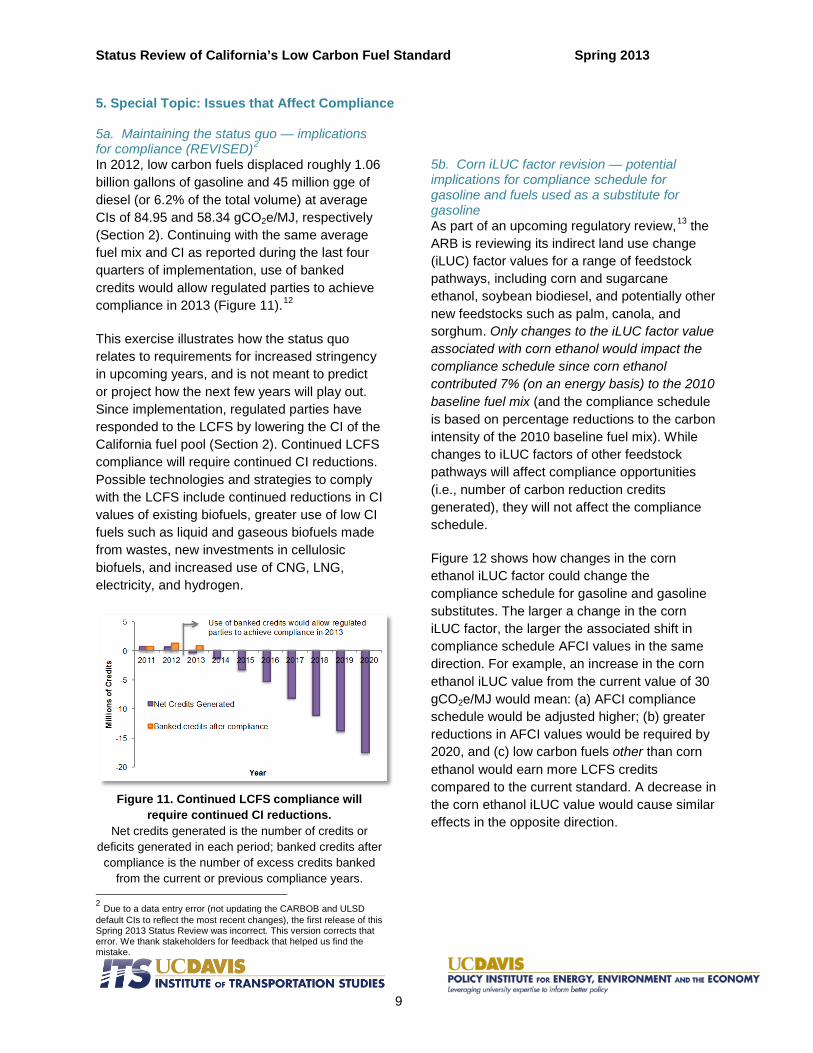
Status Review of California’s Low Carbon Fuel Standard Spring 2013
9
5. Special Topic: Issues that Affect Compliance 5a. Maintaining the status quo — implications for compliance (REVISED)2 In 2012, low carbon fuels displaced roughly 1.06 billion gallons of gasoline and 45 million gge of diesel (or 6.2% of the total volume) at average CIs of 84.95 and 58.34 gCO2e/MJ, respectively (Section 2). Continuing with the same average fuel mix and CI as reported during the last four quarters of implementation, use of banked credits would allow regulated parties to achieve compliance in 2013 (Figure 11).12
This exercise illustrates how the status quo relates to requirements for increased stringency in upcoming years, and is not meant to predict or project how the next few years will play out. Since implementation, regulated parties have responded to the LCFS by lowering the CI of the California fuel pool (Section 2). Continued LCFS compliance will require continued CI reductions. Possible technologies and strategies to comply with the LCFS include continued reductions in CI values of existing biofuels, greater use of low CI fuels such as liquid and gaseous biofuels made from wastes, new investments in cellulosic biofuels, and increased use of CNG, LNG, electricity, and hydrogen.
Figure 11. Continued LCFS compliance will require continued CI reductions.
Net credits generated is the number of credits or deficits generated in each period; banked credits after
compliance is the number of excess credits banked from the current or previous compliance years.
2 Due to a data entry error (not updating the CARBOB and ULSD default CIs to reflect the most recent changes), the first release of this Spring 2013 Status Review was incorrect. This version corrects that error. We thank stakeholders for feedback that helped us find the mistake.
5b. Corn iLUC factor revision — potential implications for compliance schedule for gasoline and fuels used as a substitute for gasoline As part of an upcoming regulatory review,13 the ARB is reviewing its indirect land use change (iLUC) factor values for a range of feedstock pathways, including corn and sugarcane ethanol, soybean biodiesel, and potentially other new feedstocks such as palm, canola, and sorghum. Only changes to the iLUC factor value associated with corn ethanol would impact the compliance schedule since corn ethanol contributed 7% (on an energy basis) to the 2010 baseline fuel mix (and the compliance schedule is based on percentage reductions to the carbon intensity of the 2010 baseline fuel mix). While changes to iLUC factors of other feedstock pathways will affect compliance opportunities (i.e., number of carbon reduction credits generated), they will not affect the compliance schedule.
Figure 12 shows how changes in the corn ethanol iLUC factor could change the compliance schedule for gasoline and gasoline substitutes. The larger a change in the corn iLUC factor, the larger the associated shift in compliance schedule AFCI values in the same direction. For example, an increase in the corn ethanol iLUC value from the current value of 30 gCO2e/MJ would mean: (a) AFCI compliance schedule would be adjusted higher; (b) greater reductions in AFCI values would be required by 2020, and (c) low carbon fuels other than corn ethanol would earn more LCFS credits compared to the current standard. A decrease in the corn ethanol iLUC value would cause similar effects in the opposite direction.

Status Review of California’s Low Carbon Fuel Standard Spring 2013
10
Figure 12. Possible change in requirement for
gasoline and gasoline substitutes (from 2013) for a range of corn iLUC factors.
The current compliance schedule corresponds to a corn iLUC factor of 30 gCO2e/MJ.
5c. Interactions between LCFS and the Cap-and-Trade program Increased activity in the LCFS credit market occurred in the same timeframe that California held its first two auctions for carbon allowances under its Cap-and-Trade (C&T) program (November 2012 and February 2013, respectively). C&T is meant to incentivize emissions reductions as part of California legislation to reduce GHG emissions to 1990 levels by 2020. The two C&T auctions resulted in carbon allowance prices of $10.09/MT CO2e and $13/MT CO2e, respectively. While both the LCFS and C&T involve carbon prices, the two carbon markets are not currently linked. Therefore, there is no expectation that the LCFS credit price and C&T allowance price will affect one another.
That said, there are areas of potential overlap between the two programs that could influence carbon prices in both markets in the future for
three reasons. First, refinery emissions are counted under the C&T program as well as included in fuel pathway lifecycle emissions accounting under the LCFS. (Under the C&T program, refineries currently receive free allowances covering 75%–100% of emissions in the first compliance period, depending on the complexity of the refinery. On average, 75% of emissions would be freely allocated through 2017, and 50% thereafter.) Improvements in refinery efficiencies can earn allowances under the C&T program but no credits in the current LCFS (though future changes might be possible as discussed in footnote 13).
Second, distributors of transport fuels (including gasoline, diesel and natural gas providers), a group currently covered under the LCFS, will be covered under the C&T program after 2015.
Finally, forest and livestock sectors can generate offset credits under the C&T program. Activity in these sectors could also potentially affect lifecycle emissions of biofuel production.
We are not aware of any quantitative analysis examining the interaction between these two programs. An exploration of possible interactive effects between the programs is a potential special topic in a future issue in this series.
Acknowledgments The authors would like to thank Air Resources Board staff for generously providing data for this status review. We appreciate research input and comments by Daniel Sperling (Institute of Transportation Studies) and Anthony Eggert (Policy Institute for Energy, Environment and the Economy), University of California, Davis. We also want to thank Bill Peters of Argus Media for his useful insights and generous discussion of various topics covered in this report. The Air Resources Board provided funding for this report as part of a research contract with UC Davis supporting environmental and economic impacts assessments of California’s Low Carbon Fuel Standard (contract #11-409).

Status Review of California’s Low Carbon Fuel Standard Spring 2013
11
References Meyer, Seth, Josef Schmidhuber, and Jesús Barreiro-Hurlé. 2012. Intra-industry trade in biofuels: How
environmental legislation fuels resource use and GHG emissions. Food and Agriculture Organization of the United Nations.
Yeh, Sonia, Nicholas P. Lutsey, and Nathan C. Parker. 2009. "Assessment of Technologies to Meet a Low Carbon Fuel Standard." Environmental Science & Technology no. 43 (18):6907-6914. doi: 10.1021/es900262w.
Yeh, Sonia, and Julie Witcover. Status Review of California's Low Carbon Fuel Standard (LCFS) 2011- August 2012. Institute of Transportation Studies, University of California, Davis 2012. Available from http://papers.ssrn.com/sol3/papers.cfm?abstract_id=2174817.
Suggested Citation Yeh, Sonia, Julie Witcover and Jeff Kessler. Status Review of California's Low Carbon Fuel Standard Spring 2013. Institute of Transportation Studies, University of California, Davis 2013. Endnotes 1 Regulated parties must use banked credits to offset any deficits incurred from importing high carbon crudes in 2011 and 2012. At a recent public workshop, the ARB indicated it would interact with regulated parties to resolve this issue soon. All credits and debits are based on reported quarterly data that may undergo some adjustment after initial reporting but prior to annual reporting deadlines. 2 Based on ARB projections, and a study of the implementation of a California LCFS (Yeh, Lutsey, and Parker 2009), gasoline and diesel demand will be declining in coming years. Using a more conservative estimate and assuming gasoline and diesel demand remain static at 18.1 billion gge in 2013, meeting the 1% reduction target in 2013 would require approximately 2.55 million credits (metric tons of CO2e savings). 3 http://www.arb.ca.gov/fuels/lcfs/lu_tables_11282012.pdf 4 OPIS makes a daily price assessment, reporting on bids and offers or actual trading range. Argus reports trading prices and volumes for transactions. In the fall 2012 issue of this Status Review, we used the differential in corn ethanol spot prices of varying carbon intensities (reported by OPIS) to compute an implicit price of carbon, to compare against LCFS credit trades. As of October 2012, OPIS reports on corn ethanol only with CI 90.1, so this analysis is no longer possible. 5 The initial price increase came just after official approval of LCFS regulatory amendments (11/26/2012), and before the onset of 2013 CI reduction requirements (of 1% from 2010 baseline, compared to the 0.5% CI reduction required in 2012). Regulated parties have until they submit 2012 annual reports at the end of April 2013 to trade credits to meet 2012 compliance. 6 EIA online data, Petroleum & Other Liquids, http://www.eia.gov/petroleum/data.cfm#imports 7 http://www.reuters.com/article/2011/08/25/us-usa-ethanol-exports-idUSTRE77O3EO20110825 8 The court found that the requirement had been set with the intention of furthering the technology innovation goals of the RFS2, rather than in line with expectations (as the court interpreted the legislation). 9 http://www.epa.gov/otaq/fuels/renewablefuels/documents/rfs-2013-standards-nrpm.pdf 10 U.S. Energy Information Administration. Short-term energy and summer fuels outlook. April 2013. http://www.eia.gov/forecasts/steo/ 11 ibid 12 Assuming fuel demand remains the same as noted in Section 1. Since a full accounting for high carbon crudes during the review period is pending, this could mean fewer net credits generated and banked credits for 2011 and 2012. As a result, the “status quo” described here could change, along with compliance implications of maintaining the status quo. Given the lack of information, we do not know the magnitude of this effect at this time. 13 Issues that may be addressed in a scheduled Fall 2013 regulatory review include indirect land use change values, a refinery-specific approach to calculating carbon intensity, electricity credits for fixed guideway transportation and forklifts, and cost containment provisions (the so-called safety valve or price cap).

http://www.mercurynews.com/opinion/ci_22800028/low-carbon-fuel-standard-californias-new-regulations-are
Page 1 of 1 Jun 05, 2013 02:06:45PM MDT
Low carbon fuel standard: California's new regulations are infeasible forgasoline and dieselBy Catherine Reheis-Boyd Special to the Mercury News San Jose Mercury NewsPosted: MercuryNews.com
For close to a year, the companies that provide California with gasoline and diesel have warned that the state's LowCarbon Fuel Standard is infeasible. A failure to recognize the implications of this warning risks potential fuelshortages and market disruptions in a few short years.
In response to these concerns, supporters of the standard argue the only thing making this regulation infeasible is therefusal of oil companies to invest sufficient dollars in the emerging fuels and technologies needed to make it work.This view was expressed with great clarity recently by venture capitalist Vinod Khosla who, perhaps inadvertentlyoffered a compelling explanation why the low carbon standard cannot succeed.
Khosla admitted private sector investors are not flocking to invest in alternative technologies like cellulosic ethanol,and he criticized oil companies for not investing more. Without those technologies providing huge amounts oflow-carbon alternatives to petroleum in a very short amount of time, the fuel standard cannot succeed.
When the standard was introduced in 2007, we were told it was a performance-based standard that would let themarketplace determine what fuels and technologies were best suited to lower California's collective carbon footprint.
Now we're being told the only hope for the standard is to compel some industries (oil companies) to invest intechnologies they may not feel are economically viable or are incompatible with their long-term business objectives.
The problem is that no amount of money can change the laws of physics. Unlocking the secret to producing hugequantities of energy from things like wood chips and municipal waste has proved to be more difficult than imaginedin 2007 when the standard was introduced. As the U.S. Energy Information Administration has reported, "Progresson the commercialization of cellulosic biofuels has been slower than envisioned in 2007."
There is no question wood chips and waste can be converted into fuels in a laboratory. The trick is making thatconversion in volumes sufficient to supply the vast amounts of transportation fuel needed to keep California movingon a daily basis. The numbers are staggering.
Every day in California, we consume about 42 million gallons of gasoline, in addition to huge quantities of dieseland jet fuels. In order to reduce the carbon intensity of that fuel 10 percent by 2020, we need large quantities of lowcarbon biofuels like cellulosic ethanol. Neither corn ethanol nor ethanol from sugar cane has low enough carbonintensities to be useful in complying with the standard in the next few years.
For cellulosic ethanol to meet just one percent of California's demand for gasoline, annual production would have toincrease to 153 million gallons a year in the next few years.
In 2012, according to the U.S. Environmental Protection Agency, the total amount of cellulosic ethanol produced inthe United States was 20,069 gallons.
The math doesn't work, and no amount of investment dollars will change that. We need to go back to the drawingboard and find better, more realistic ways of reducing carbon emissions from transportation fuels.
Catherine Reheis-Boyd is president of the Western States Petroleum Association. She wrote this for this newspaper.

http://www.mercurynews.com/opinion/ci_22950443/low-carbon-fuel-standard-consumer-choice-is-key
Page 1 of 1 Jun 05, 2013 02:08:51PM MDT
Low Carbon Fuel Standard: Consumer choice is key to California successBy Matt Horton Special to the Mercury News San Jose Mercury NewsPosted: MercuryNews.com
"You can have any color Ford you want, as long as it's black," Henry Ford is famously credited with saying in theearly years of the U.S. automobile industry, when Fords came in only one color.
Why so many color options today? Consumers. Consumers are one of the most powerful drivers of change on theplanet. We vote with our wallets, and we vote with our values. And we have the power to make changes far greaterthan a car's color.
Yet at the fuel pump, consumers still have no power. We all know our dependence on fossil fuels weakens oureconomy and security while threatening our environment. We simply feel powerless to address it because there is notrue alternative.
Rather than being able to choose fuels made in the U.S. or from renewable sources or from local businesses, thechoices remain regular, super and premium unleaded. Even if you are one of the 1 million California drivers with aflex fuel or diesel vehicle, alternative fuels are rare and very hard to find despite domestic alternative fuel productionreaching 14 billion gallons annually.
In our state, that's starting to change. In 2010, voters defeated an attempt to repeal the state's Low Carbon FuelStandard, California's landmark clean-energy law, and committed to cleaner fuels by a 23-point margin. Today, as aconsequence, the standard and new technologies are helping consumers and businesses access a brand-newcompetitive market with a full spectrum of fueling options.
Whether by blending alternative fuels into gasoline or developing entirely new fuel types, the low carbon standard isdriving the development of clean alternatives to oil. Demand for them will accelerate innovation and create jobs righthere in California.
In Propel's case alone, thanks in part to the standard, our customers have reduced more than 60 million pounds ofcarbon dioxide and have displaced more than 150,000 barrels of petroleum across our statewide network of fillingstations. Looking forward to even cleaner fuels, in partnership with California-based Solazyme, in late 2012 weoffered the nation's first consumer access to next-generation, low-carbon algae-based fuels.
But the oil and gas industry is pressuring the Legislature to dilute or dismantle the fuel standard. While Propel andmany other California companies are moving forward, this questioning and second-guessing of established law runsthe risk of creating uncertainty in the private markets.
We believe the standard will continue to spur private sector investment and innovation and benefit consumers in itsremaining seven years, as long as our elected leaders remain committed to this program and to moving California'sfuel system toward greater diversity and choice.
California has long been a leader in making forward-looking decisions that support both economic andenvironmental goals. Our state's effort to lower the carbon footprint of our electric grid has resulted in cleaner, moreenergy-efficient power plants replacing older, more polluting technologies, and stimulated major increases in rooftopsolar installations.
If history has taught us anything, it's that the clearest way to make changes for the better is to enable choice in themarketplace. Continued support for the low carbon standard will allow consumers to keep voting with their walletand signal to the marketplace that sustainable and domestically produced fuels are the preferred choice of driversacross our state.
Matt Horton is CEO of Propel Fuels. He wrote this for this newspaper.

Editorial: State should use carbon funds to cut emissions PUBLISHED FRIDAY, JUN. 07, 2013
Voters have sent a clear message on California's leadership role in reducing energy emissions and costs.
By a 22-point margin, voters in 2010 rejected an oil industry-led voter initiative that sought to roll back
implementation of the landmark Assembly Bill 32, the California Global Warming Solutions Act of 2006
that would reduce greenhouse gas emissions to 1990 levels by 2020. The money from four cap-and-
trade auctions a year – February, May, August and November – is supposed to go into the Greenhouse
Gas Reduction Fund. The first three auctions have raised $256.9 million, ready to be distributed for
projects.
Also by a 22-point margin, voters in 2012 supported Proposition 39, which would put half of the
proceeds from eliminating tax loopholes for out-of-state corporations – about $500 million a year for
five years – into a Clean Energy Job Creation Fund for efficiency programs in public buildings.
Californians have a right to expect that the monies raised will be spent for the intended purposes.
However, Gov. Jerry Brown is proposing to betray Californians by raiding both the Greenhouse Gas
Reduction Fund and the Clean Energy Job Creation Fund – unless legislators stop him between now and
the June 15 budget deadline.
Brown is proposing to take $500 million from the Greenhouse Gas Reduction Fund and put it into the
state's general fund. He is calling this a "one-time loan" from auction proceeds for 2012-13 and 2013-14.
Before a dime is spent on reducing greenhouse gas emissions, the money would be used for other
purposes, going against everything AB 32 proponents told Californians. The aim of cap and trade is not,
they assured voters, to raise money for the state to solve its budget problems. That money, they
insisted, can go only toward energy efficiency, clean and renewable energy generation, transmission and
storage, and projects in disadvantaged areas disproportionately affected by pollution.
The state has had six years to craft a comprehensive strategy for next steps that new money could buy
and should not squander the opportunity. The projects spelled out are exactly what California needs to
boost jobs now and reduce emissions – such as retrofits for utilities and large industrial plants, charging
stations for electric vehicles, and efficiency upgrades in low-income and middle-income homes.

The state doesn't need "more time" to flesh out projects; it needs political will to avoid diversions and
lobbyist-driven pork barrel projects.
The Legislative Analyst's Office has said that "revenues from the cap-and-trade auctions must be used
only to mitigate greenhouse gas emissions or the harms caused by greenhouse gas emissions."
Then there is the $500 million-a- year Clean Energy Job Creation Fund. Brown wants to count the money
as general revenue, which means 40 percent automatically would go to fund school operations.
The LAO concludes this would be "directly contrary to what the voters were told in the official voter
guide as to how the revenues would be treated." And all so unnecessary. After five years, the Clean
Energy Job Creation Fund goes away and the money goes into the general fund.
Proposition 39 proponents want to focus the full $500 million a year for energy efficiency projects in
public schools with above-average energy consumption in economically disadvantaged communities,
distributed on a competitive basis. Districts would have to prove that projects actually reduce utility
bills.
Brown, however, wants to spread a smaller amount on a per-pupil basis statewide regardless of need,
diluting the funding so much that the state would not get the big utility bill reductions that Prop. 39
advocates intended. Moreover, this doesn't jibe with Brown's much-touted philosophical view that
dollars should go to where they are needed most.
Legislators considering proposals for using the Greenhouse Gas Reduction Fund and the Clean Energy
Job Creation Fund must ask: Will the money go to projects that permanently, verifiably reduce
greenhouse gas emissions and increase energy efficiency?
If not, that's an improper use they should reject.
Californians should insist that the governor and legislators back off these two raids.