Embed Size (px)
Citation preview
i
Environment Baseline Vol. 4:
Energy-Water Nexus
Prepared by the Office of Energy Policy and Systems Analysis,
U.S. Department of Energy
January 2017
Disclaimer: This report was prepared as an account of work sponsored by an agency of the
United States Government. Neither the United States Government nor any agency thereof, nor
any of their employees, makes any warranty, express or implied, or assumes any legal liability or
responsibility for the accuracy, completeness, or usefulness of any information, apparatus,
product, or process disclosed, or represents that its use would not infringe privately owned rights.
Reference therein to any specific commercial product, process, or service by trade name,
trademark, manufacturer, or otherwise does not necessarily constitute or imply its endorsement,
recommendation, or favoring by the United States Government or any agency thereof. The views
of the authors do not necessarily reflect those of the United States Government or any agency
thereof.
Note: Some of the content in this baseline is adapted from The Water-Energy Nexus: Challenges
and Opportunities report, released by DOE in 2014.

ii
Quadrennial Energy Review 1.2 Baseline Reports
This report is a DOE EPSA product and part of a series of “baseline” reports intended to inform
the second installment of the Quadrennial Energy Review (QER 1.2). QER 1.2 will provide a
comprehensive review of the nation’s electricity system and covers the current state and key
trends related to the electricity system, including generation, transmission, distribution, grid
operations and planning, and end use. The baseline reports provide an overview of elements of
the electricity system.

iii
Acknowledgements: The U.S. Department of Energy’s Office of Energy Policy and Systems
Analysis drafted this report under the leadership of Diana Bauer, Director of the Office of
Energy Systems Integration Analysis. Samuel Bockenhauer was the lead author of the report.
Contributors providing supporting analysis and visualizations included Fletcher Fields, Zachary
Clement, Alice Chao, Robert Schmitt, Caitlin Grady, and David Schoeberlein. Other key offices
in the U.S. Department of Energy providing comments included the Office of Energy Efficiency
and Renewable Energy and the Western Area Power Administration. Interagency review of the
report was provided by the White House Office of Science and Technology Policy and the
Environmental Protection Agency. External review of the report was graciously provided by
Newsha Ajami of Stanford University; David L. Feldman of the University of California, Irvine;
and Kent Zammit of the Electric Power Research Institute.
iv
Executive Summary
Volume 4 of the Environment Baseline provides background information on aspects of the energy-water
nexus that relate to electricity generation and use in the United States. This volume:
Describes current water demands for electricity generation and electricity demands for water
conveyance, treatment, and distribution, including discussion of relevant technologies and
tradeoffs;
Summarizes available energy-water data sources and data gaps;
Summarizes policies related to water in electricity generation;
Reviews impacts of future climate change and trends relating to the provisioning of water and
electricity generation; and
Concludes with a summary of findings.
Present day energy and water systems are tightly intertwined. Water is used in most phases of energy
production and electricity generation. Energy is required to extract, convey, and deliver water of
appropriate quality for diverse human uses, and then again to treat wastewaters prior to their return to the
environment. Historically, interactions between energy and water have been considered on a regional or
technology-by-technology basis. At the national and international levels, energy and water systems have
been developed, managed, and regulated independently and without significant acknowledgement of the
connections between them.
Several current trends are increasing the urgency to address the energy-water nexus in an integrated and
proactive way. First, climate change has already begun to affect precipitation and temperature patterns
across the United States. Second, U.S. population growth and regional migration trends indicate that the
population in arid areas such as the Southwest is likely to continue to increase, further complicating the
management of both energy and water systems. Third, introduction of new technologies in the energy
and the water domains could shift energy and water demands. Finally, developments in policies
addressing water rights and water impacts of electricity generation are introducing additional incentives
and challenges for decision-making.
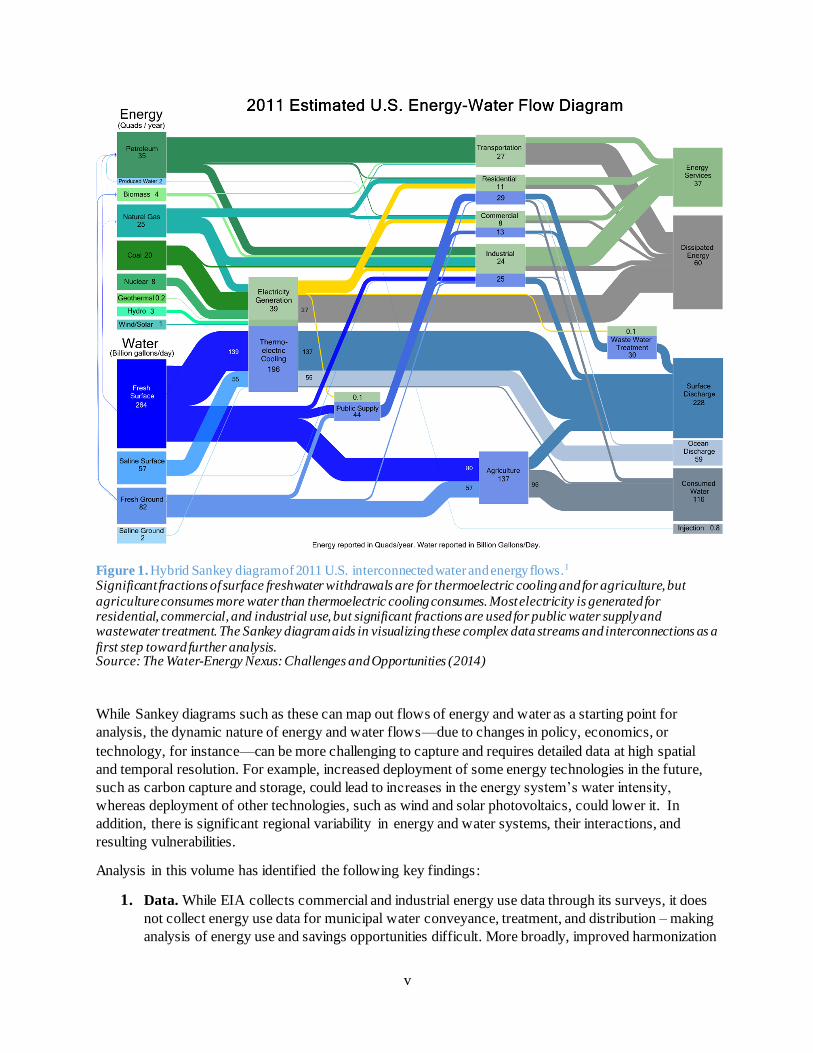
Flows of energy and water are intrinsically interconnected, due both to the characteristics and properties
of water that make it so useful for producing energy, and to the significant amount of energy required to
treat and distribute water for human use. This interconnectivity is illustrated in the Sankey Diagram in
Figure 1, which captures the magnitude of energy and water flows in the United States on a national scale.
As shown in the diagram, thermoelectric power generation withdraws large quantities of water for
coolinga and also dissipates large quantities of primary energy due to inefficiencies in converting thermal
energy to electricity. The intensity of water use and energy dissipated varies significantly with generation
and cooling technology. In addition, water treatment and distribution for drinking water supply and
municipal wastewater also require significant amounts of energy.
a “Withdrawal” designates any water diverted from a surface or groundwater source. “Consumed water” designates withdrawn water that is not returned to its source (e.g., because it has evaporated, been transpired by plants, or
incorporated into products).
v
Figure 1. Hybrid Sankey diagram of 2011 U.S. interconnected water and energy flows.1 Significant fractions of surface freshwater withdrawals are for thermoelectric cooling and for agriculture, but
agriculture consumes more water than thermoelectric cooling consumes. Most electricity is generated for residential, commercial, and industrial use, but significant fractions are used for public water supply and wastewater treatment. The Sankey diagram aids in visualizing these complex data streams and interconnections as a
first step toward further analysis. Source: The Water-Energy Nexus: Challenges and Opportunities (2014)
While Sankey diagrams such as these can map out flows of energy and water as a starting point for
analysis, the dynamic nature of energy and water flows—due to changes in policy, economics, or
technology, for instance—can be more challenging to capture and requires detailed data at high spatial
and temporal resolution. For example, increased deployment of some energy technologies in the future,
such as carbon capture and storage, could lead to increases in the energy system’s water intensity,
whereas deployment of other technologies, such as wind and solar photovoltaics, could lower it. In
addition, there is significant regional variability in energy and water systems, their interactions, and
resulting vulnerabilities.
Analysis in this volume has identified the following key findings:
1. Data. While EIA collects commercial and industrial energy use data through its surveys, it does
not collect energy use data for municipal water conveyance, treatment, and distribution – making
analysis of energy use and savings opportunities difficult. More broadly, improved harmonization
vi
and integration of energy-water data sets, particularly among federal agencies such as EIA and
USGS, is a critical need for improving confidence in energy-water data and allowing advanced
analyses of regional variability and trends over time.
2. Dry cooling. There are a number of options to reduce the reliance of thermoelectric generation on
fresh water. Dry and hybrid cooling systems allow zero- or low-water operation, but these
systems impose higher capital costs and lower efficiencies. Improved technologies and/or
deployment incentives could reduce the dependence of thermoelectric generation on water. It is
particularly important to identify and pursue opportunities for lower-cost and more efficient dry
and hybrid cooling (or other avenues for water efficiency) for technologies such as nuclear,
geothermal, CSP, and CCS, all of which are components of a low-carbon future.
3. Hydropower. Existing hydropower facilities may be able to increase their contributions to zero-
GHG electricity generation and grid flexibility if issues such slow technology upgrade, regulatory
constraints, and challenges in valuation of ancillary services are addressed.
4. Finance and Systems Integration. Considering energy performance in decisions to finance
water infrastructure, and vice versa, may bring opportunities to realize additional energy and
water benefits. This approach could also provide a pathway for demonstration and deployment of
energy efficiency and energy recovery technologies.
5. Policy Alignment. Although energy and water flows are often physically interconnected, the
energy and water policy landscape is highly fragmented in the U.S., making it difficult for
decision makers in industry and government to effectively balance energy and water goals.
Improved understanding and alignment of federal and state policies affecting the energy-water
nexus could allow decision makers to better balance energy and water goals and avoid unintended
consequences.

vii
The Scope
A brief framing of connections between electricity and water systems is described in Chapter 1. These
connections form the outline for Chapters 2, 3, and 4. Chapter 2 describes water demands for
thermoelectric generation, which includes plants powered by coal, gas, nuclear, concentrated solar power
(CSP), and geothermal energy. Carbon capture and storage (CCS) technologies are also discussed in
Chapter 2. Chapter 3 describes key characteristics of hydropower, including capabilities to provide zero-
GHG generation as well as flexibility and ancillary services to balance an increasing share of variable
renewables. Chapter 4 describes the electricity demand for various water systems, including water and
wastewater conveyance, treatment, and distribution. The variation in energy demands between types of
water treatment technologies is also examined.
Chapters 5, 6, and 7 explore complex coupled aspects of the energy-water system including data, policy,
and impacts of climate change. Chapter 5 discusses several of the data sources available as well as data
challenges associated with the energy-water nexus. Chapter 6 discusses relevant policies relating to water
and electricity connections. Variations in surface water and groundwater governance policies throughout
the country are described. This chapter also discusses water permitting for thermoelectric cooling, broad
policies affecting hydropower, and finance opportunities for energy and water infrastructure. Chapter 7
describes future climate change impacts on thermoelectric and hydropower generation. Finally, Chapter 8
concludes with overarching findings identified in the preceding chapters.
Water temperature impacts are considered in this volume, but other aspects of water quality are not within
the scope, and are instead treated in Environmental Quality and the U.S. Power Sector: Air Quality, Water
Quality, Land Use and Environmental Justice (Vol. 2).
viii
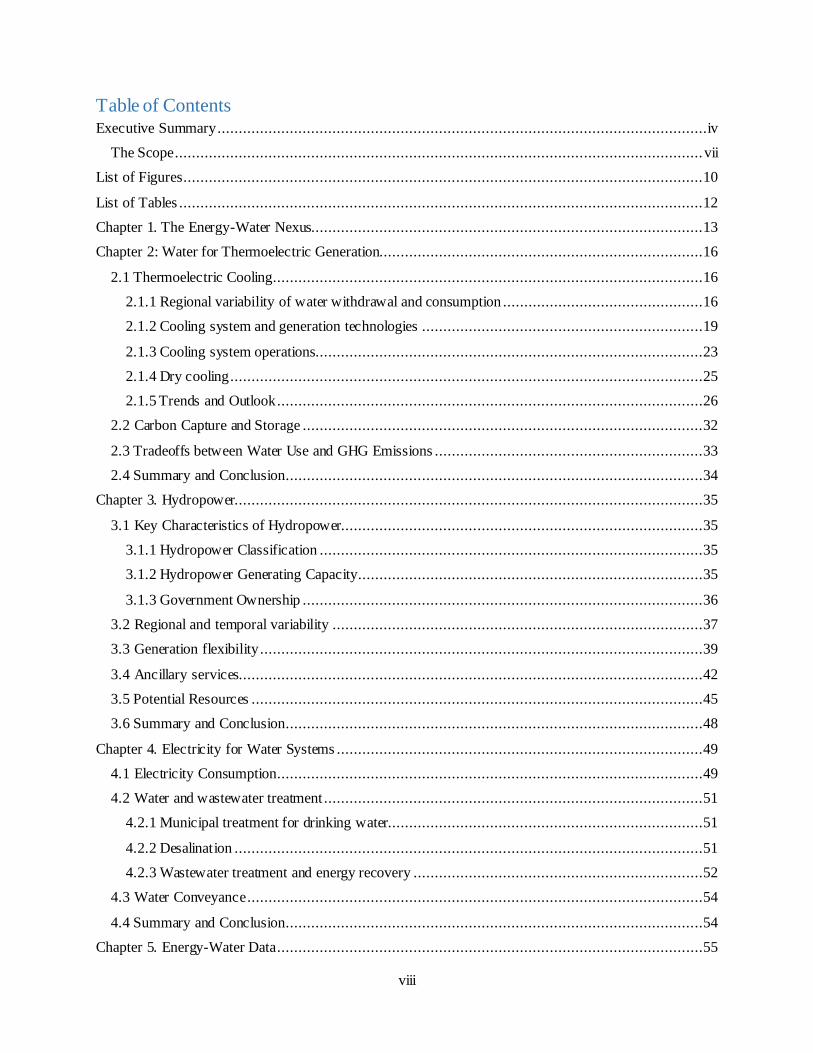
Table of Contents Executive Summary ...................................................................................................................iv
The Scope ............................................................................................................................ vii
List of Figures ..........................................................................................................................10
List of Tables ...........................................................................................................................12
Chapter 1. The Energy-Water Nexus............................................................................................13
Chapter 2: Water for Thermoelectric Generation............................................................................16
2.1 Thermoelectric Cooling.....................................................................................................16
2.1.1 Regional variability of water withdrawal and consumption ...............................................16
2.1.2 Cooling system and generation technologies ..................................................................19
2.1.3 Cooling system operations...........................................................................................23
2.1.4 Dry cooling ...............................................................................................................25
2.1.5 Trends and Outlook ....................................................................................................26
2.2 Carbon Capture and Storage ..............................................................................................32
2.3 Tradeoffs between Water Use and GHG Emissions ...............................................................33
2.4 Summary and Conclusion ..................................................................................................34
Chapter 3. Hydropower..............................................................................................................35
3.1 Key Characteristics of Hydropower.....................................................................................35
3.1.1 Hydropower Classification ..........................................................................................35
3.1.2 Hydropower Generating Capacity .................................................................................35
3.1.3 Government Ownership ..............................................................................................36
3.2 Regional and temporal variability .......................................................................................37
3.3 Generation flexibility ........................................................................................................39
3.4 Ancillary services.............................................................................................................42
3.5 Potential Resources ..........................................................................................................45
3.6 Summary and Conclusion ..................................................................................................48
Chapter 4. Electricity for Water Systems ......................................................................................49
4.1 Electricity Consumption ....................................................................................................49
4.2 Water and wastewater treatment .........................................................................................51
4.2.1 Municipal treatment for drinking water..........................................................................51
4.2.2 Desalination ..............................................................................................................51
4.2.3 Wastewater treatment and energy recovery ....................................................................52
4.3 Water Conveyance ...........................................................................................................54
4.4 Summary and Conclusion ..................................................................................................54
Chapter 5. Energy-Water Data ....................................................................................................55
ix
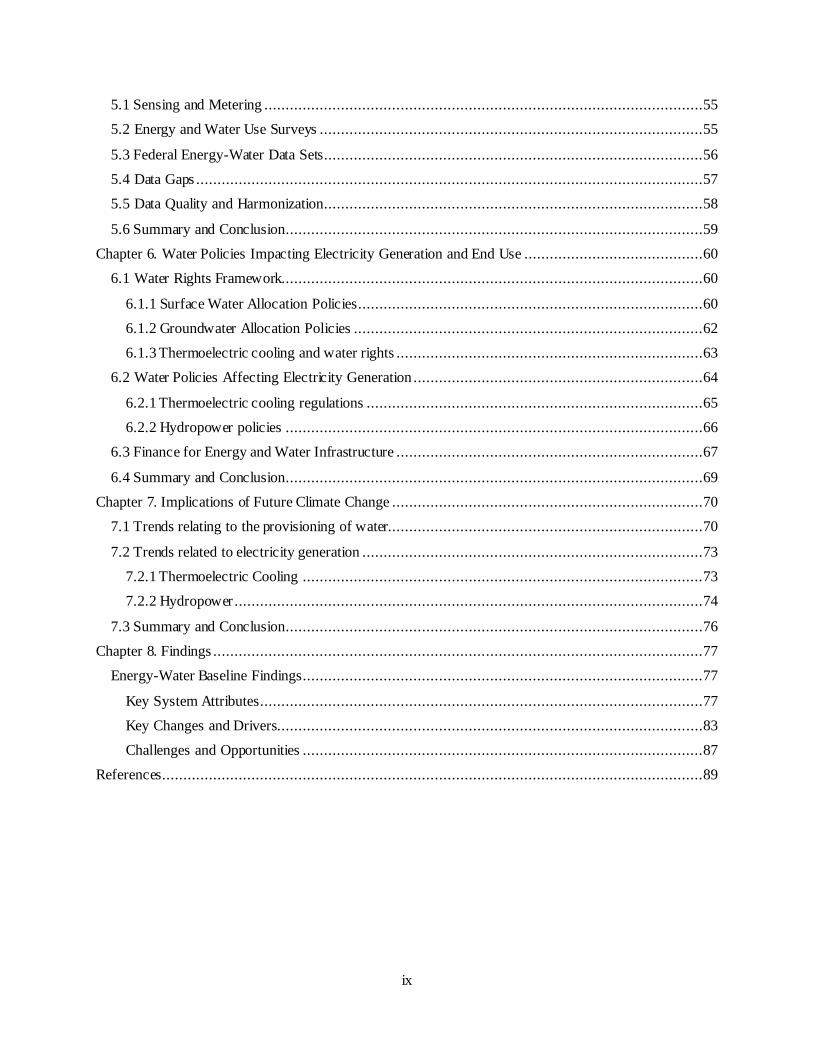
5.1 Sensing and Metering .......................................................................................................55
5.2 Energy and Water Use Surveys ..........................................................................................55
5.3 Federal Energy-Water Data Sets .........................................................................................56
5.4 Data Gaps .......................................................................................................................57
5.5 Data Quality and Harmonization.........................................................................................58
5.6 Summary and Conclusion ..................................................................................................59
Chapter 6. Water Policies Impacting Electricity Generation and End Use ..........................................60
6.1 Water Rights Framework...................................................................................................60
6.1.1 Surface Water Allocation Policies.................................................................................60
6.1.2 Groundwater Allocation Policies ..................................................................................62
6.1.3 Thermoelectric cooling and water rights ........................................................................63
6.2 Water Policies Affecting Electricity Generation ....................................................................64
6.2.1 Thermoelectric cooling regulations ...............................................................................65
6.2.2 Hydropower policies ..................................................................................................66
6.3 Finance for Energy and Water Infrastructure ........................................................................67
6.4 Summary and Conclusion ..................................................................................................69
Chapter 7. Implications of Future Climate Change .........................................................................70
7.1 Trends relating to the provisioning of water..........................................................................70
7.2 Trends related to electricity generation ................................................................................73
7.2.1 Thermoelectric Cooling ..............................................................................................73
7.2.2 Hydropower ..............................................................................................................74
7.3 Summary and Conclusion ..................................................................................................76
Chapter 8. Findings ...................................................................................................................77
Energy-Water Baseline Findings..............................................................................................77
Key System Attributes ........................................................................................................77
Key Changes and Drivers....................................................................................................83
Challenges and Opportunities ..............................................................................................87
References ...............................................................................................................................89
10
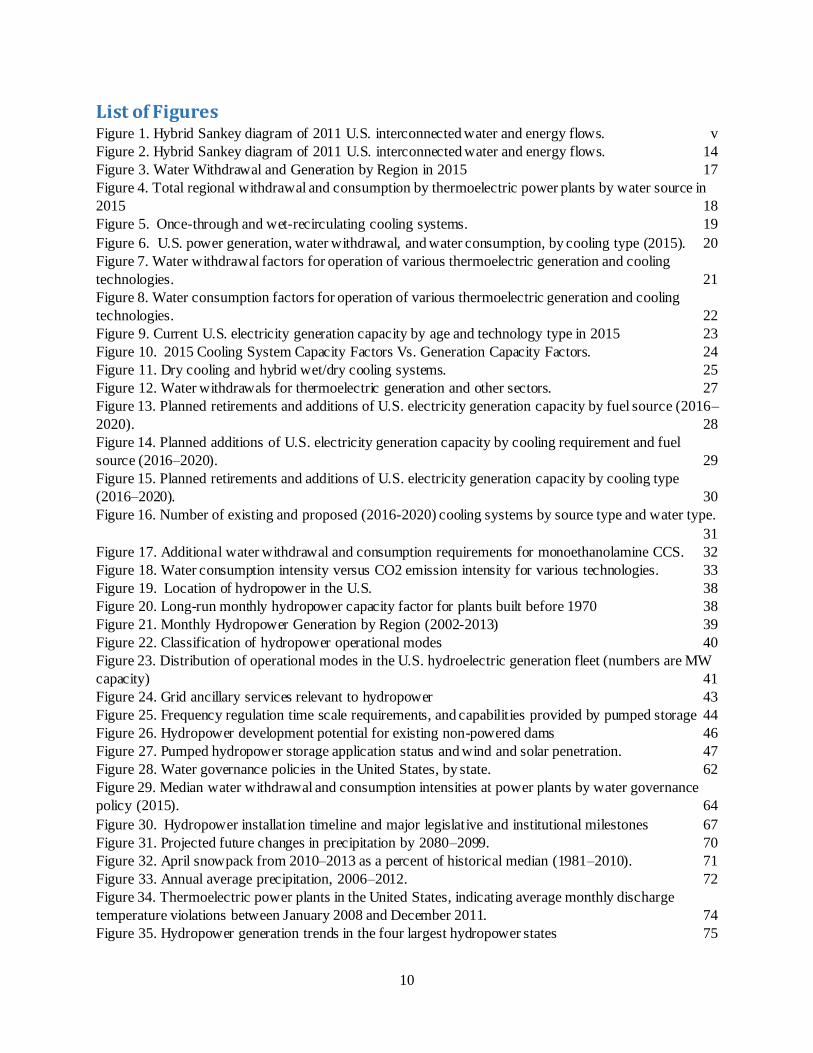
List of Figures Figure 1. Hybrid Sankey diagram of 2011 U.S. interconnected water and energy flows. v
Figure 2. Hybrid Sankey diagram of 2011 U.S. interconnected water and energy flows. 14
Figure 3. Water Withdrawal and Generation by Region in 2015 17
Figure 4. Total regional withdrawal and consumption by thermoelectric power plants by water source in
2015 18
Figure 5. Once-through and wet-recirculating cooling systems. 19
Figure 6. U.S. power generation, water withdrawal, and water consumption, by cooling type (2015). 20
Figure 7. Water withdrawal factors for operation of various thermoelectric generation and cooling
technologies. 21
Figure 8. Water consumption factors for operation of various thermoelectric generation and cooling
technologies. 22
Figure 9. Current U.S. electricity generation capacity by age and technology type in 2015 23
Figure 10. 2015 Cooling System Capacity Factors Vs. Generation Capacity Factors. 24
Figure 11. Dry cooling and hybrid wet/dry cooling systems. 25
Figure 12. Water withdrawals for thermoelectric generation and other sectors. 27
Figure 13. Planned retirements and additions of U.S. electricity generation capacity by fuel source (2016–
2020). 28
Figure 14. Planned additions of U.S. electricity generation capacity by cooling requirement and fuel
source (2016–2020). 29
Figure 15. Planned retirements and additions of U.S. electricity generation capacity by cooling type
(2016–2020). 30
Figure 16. Number of existing and proposed (2016-2020) cooling systems by source type and water type.
31
Figure 17. Additional water withdrawal and consumption requirements for monoethanolamine CCS. 32
Figure 18. Water consumption intensity versus CO2 emission intensity for various technologies. 33
Figure 19. Location of hydropower in the U.S. 38
Figure 20. Long-run monthly hydropower capacity factor for plants built before 1970 38
Figure 21. Monthly Hydropower Generation by Region (2002-2013) 39
Figure 22. Classification of hydropower operational modes 40
Figure 23. Distribution of operational modes in the U.S. hydroelectric generation fleet (numbers are MW
capacity) 41
Figure 24. Grid ancillary services relevant to hydropower 43
Figure 25. Frequency regulation time scale requirements, and capabilities provided by pumped storage 44
Figure 26. Hydropower development potential for existing non-powered dams 46
Figure 27. Pumped hydropower storage application status and wind and solar penetration. 47
Figure 28. Water governance policies in the United States, by state. 62
Figure 29. Median water withdrawal and consumption intensities at power plants by water governance
policy (2015). 64
Figure 30. Hydropower installation timeline and major legislative and institutional milestones 67
Figure 31. Projected future changes in precipitation by 2080–2099. 70
Figure 32. April snowpack from 2010–2013 as a percent of historical median (1981–2010). 71
Figure 33. Annual average precipitation, 2006–2012. 72
Figure 34. Thermoelectric power plants in the United States, indicating average monthly discharge
temperature violations between January 2008 and December 2011. 74
Figure 35. Hydropower generation trends in the four largest hydropower states 75
11
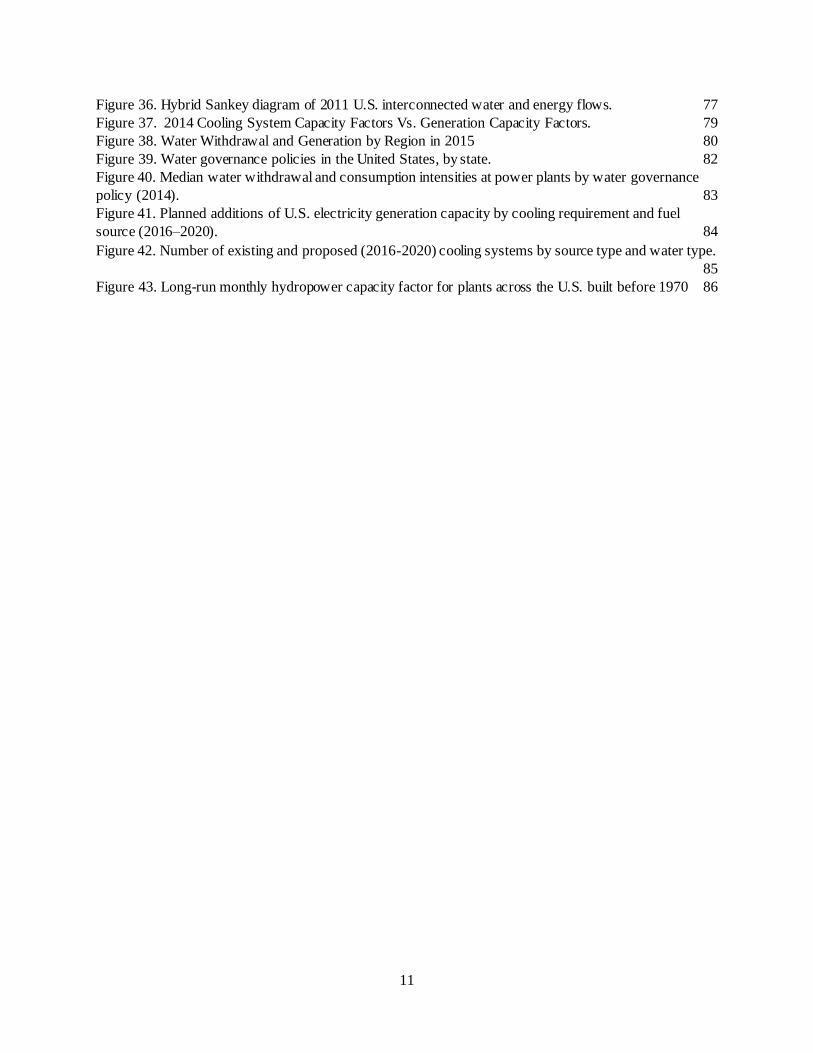
Figure 36. Hybrid Sankey diagram of 2011 U.S. interconnected water and energy flows. 77
Figure 37. 2014 Cooling System Capacity Factors Vs. Generation Capacity Factors. 79
Figure 38. Water Withdrawal and Generation by Region in 2015 80
Figure 39. Water governance policies in the United States, by state. 82
Figure 40. Median water withdrawal and consumption intensities at power plants by water governance
policy (2014). 83
Figure 41. Planned additions of U.S. electricity generation capacity by cooling requirement and fuel
source (2016–2020). 84
Figure 42. Number of existing and proposed (2016-2020) cooling systems by source type and water type.
85
Figure 43. Long-run monthly hydropower capacity factor for plants across the U.S. built before 1970 86

12
List of Tables
Table 1. Ten Largest Conventional Hydroelectric Facilities .............................................................36
Table 2. Ten Largest Hydroelectric Pumped Storage Facilities .........................................................36
Table 3. Energy Intensity of Water Treatment and Pumping in California (kWh/MG) .........................49
Table 4. Energy Drivers in the Municipal and Agricultural Water Sectors..........................................50
Table 5. Energy Intensity of Water Treatment ...............................................................................53
Table 6. Examples of Federal Energy-Water Data Sources ..............................................................57
Table 7. Framework for Surface Water Law..................................................................................61
Table 8. Summary of NPDES effluent temperature limits for three TVA nuclear power plants..............65
13
Chapter 1. The Energy-Water Nexus Present-day energy and water systems are tightly intertwined. Water is used in most phases of energy
production and electricity generation. Energy is required to extract, convey, and deliver water of
appropriate quality for diverse human uses, and then again to treat wastewaters prior to their return to the
environment. Historically, interactions between energy and water have been considered on a regional or
technology-by-technology basis. At the national and international levels, energy and water systems have
been developed, managed, and regulated independently and without significant acknowledgement of the
connections between them.
Several current trends are increasing the urgency to address the energy-water nexus in an integrated and
proactive way. First, climate change has already begun to affect precipitation and temperature patterns
across the United States. Second, U.S. population growth and regional migration trends indicate that the
population in arid areas such as the Southwest is likely to continue to increase, further complicating the
management of both energy and water systems. Third, introduction of new technologies in the energy
and the water domains could shift energy and water demands. Finally, developments in policies
addressing water rights and water impacts of electricity generation are introducing additional incentives
and challenges for decisionmaking.
Recent trends have focused national attention on the connections between energy and water infrastructure.
For example, when severe drought affected more than a third of the United States in 2012, limited water
availability constrained the operation of some power plants and other energy production activities.
Hurricane Sandy demonstrated that vital water infrastructure can be highly vulnerable to electricity
outage.
These trends may present challenges, but they also present opportunities. An integrated, strategic
approach can guide technology research and development (R&D) to address regional energy-water issues
and also have impact at the national and global scale. Enhancing and integrating data, modeling, and
analysis capabilities will better inform researchers, decision makers, and the public.
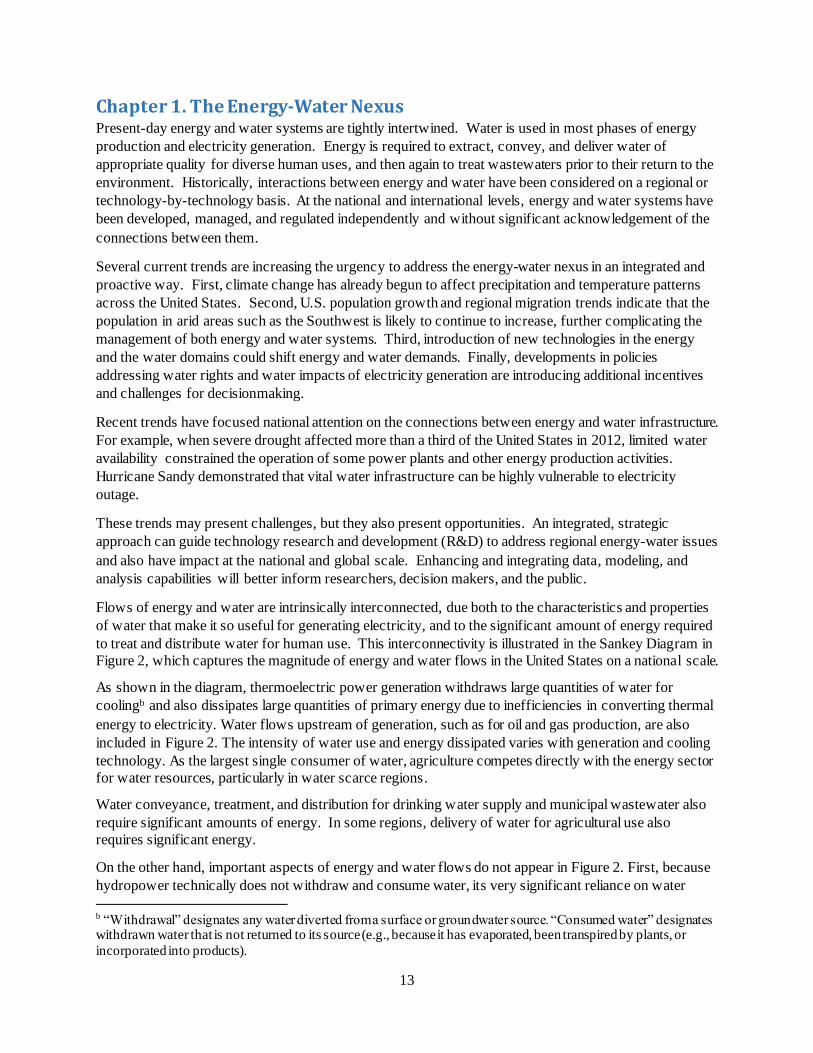
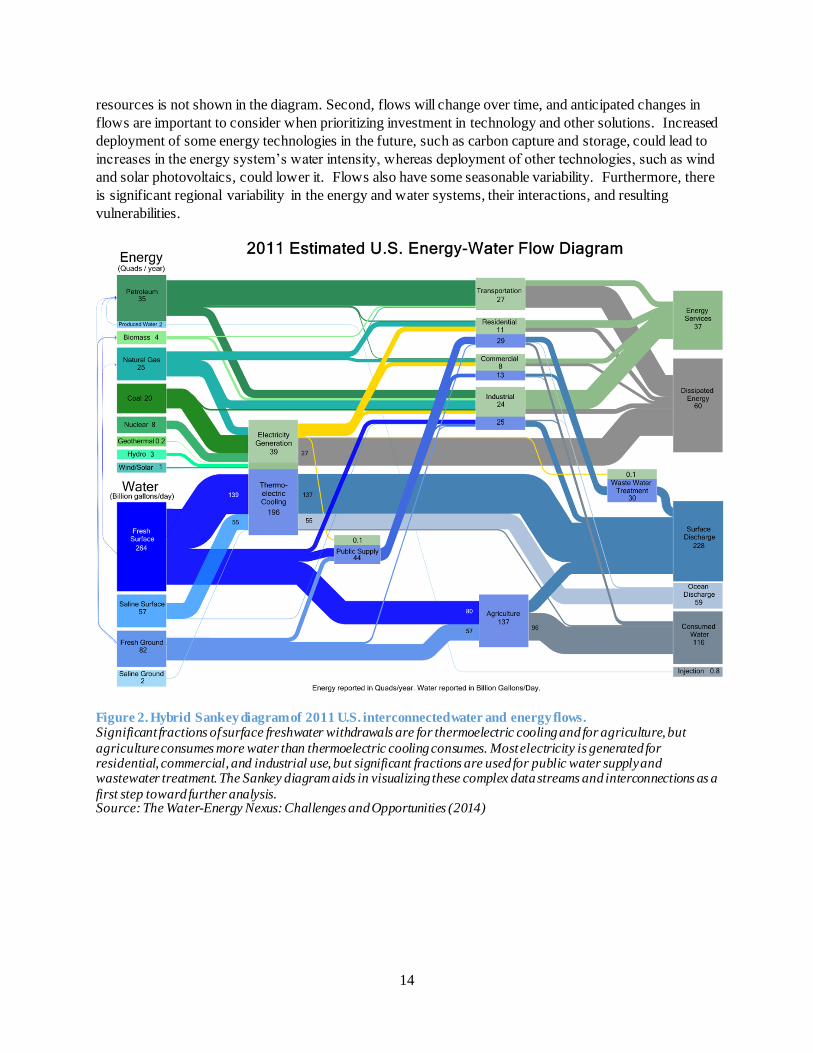
Flows of energy and water are intrinsically interconnected, due both to the characteristics and properties
of water that make it so useful for generating electricity, and to the significant amount of energy required
to treat and distribute water for human use. This interconnectivity is illustrated in the Sankey Diagram in
Figure 2, which captures the magnitude of energy and water flows in the United States on a national scale.
As shown in the diagram, thermoelectric power generation withdraws large quantities of water for
coolingb and also dissipates large quantities of primary energy due to inefficiencies in converting thermal
energy to electricity. Water flows upstream of generation, such as for oil and gas production, are also
included in Figure 2. The intensity of water use and energy dissipated varies with generation and cooling
technology. As the largest single consumer of water, agriculture competes directly with the energy sector
for water resources, particularly in water scarce regions.
Water conveyance, treatment, and distribution for drinking water supply and municipal wastewater also
require significant amounts of energy. In some regions, delivery of water for agricultural use also
requires significant energy.
On the other hand, important aspects of energy and water flows do not appear in Figure 2. First, because
hydropower technically does not withdraw and consume water, its very significant reliance on water
b “Withdrawal” designates any water diverted from a surface or groundwater source. “Consumed water” designates withdrawn water that is not returned to its source (e.g., because it has evaporated, been transpired by plants, or
incorporated into products).
14
resources is not shown in the diagram. Second, flows will change over time, and anticipated changes in
flows are important to consider when prioritizing investment in technology and other solutions. Increased
deployment of some energy technologies in the future, such as carbon capture and storage, could lead to
increases in the energy system’s water intensity, whereas deployment of other technologies, such as wind
and solar photovoltaics, could lower it. Flows also have some seasonable variability. Furthermore, there
is significant regional variability in the energy and water systems, their interactions, and resulting
vulnerabilities.
Figure 2. Hybrid Sankey diagram of 2011 U.S. interconnected water and energy flows. Significant fractions of surface freshwater withdrawals are for thermoelectric cooling and for agriculture, but
agriculture consumes more water than thermoelectric cooling consumes. Most electricity is generated for residential, commercial, and industrial use, but significant fractions are used for public water supply and wastewater treatment. The Sankey diagram aids in visualizing these complex data streams and interconnections as a
first step toward further analysis. Source: The Water-Energy Nexus: Challenges and Opportunities (2014)

15
Dynamics such as changing water availability under climate change will affect the future of the energy-
water nexus. While there is significant uncertainty regarding the magnitude of effects, water resource
availability and predictability may be altered by projected air temperature changes, shifting precipitation
patterns, and more extreme weather. Shifts in precipitation and temperature patterns—including changes
in snowmelt magnitude and timing—will likely lead to more regional variation in water availability for
hydropower, thermoelectric generation, and other energy needs. Higher temperatures also have the
potential to decrease the efficiency of thermoelectric generation, which could increase water requirements
for thermoelectric cooling when water demand for non-energy purposes is also high. Such changes may
pose challenges for energy infrastructure resilience.
Energy and water needs will also be shaped by population growth and migration patterns, as well as by
changes in fuels used and energy technologies deployed. For example, projected population growth in the
arid Southwest will likely intensify pressure on energy and water systems in that region. According to
Energy Information Administration (EIA) data, planned retirements and additions of electricity generation
units and cooling systems will likely decrease water withdrawals, increase water consumption, and
increase the diversity of water sources used.
Addressing challenges and opportunities at the energy-water nexus will require informed decision-making
by stakeholders and policymakers. The decision-making landscape for the energy-water nexus is shaped
by political, regulatory, economic, environmental, and social factors, as well as available technologies.
The landscape is fragmented, complex, and changing; the incentive structures are overlapping but not
necessarily consistent. Water is inherently multi-jurisdictional, and managing water is primarily a state
and local responsibility. States and localities vary in philosophies regarding water rights. There is also
variation across states in relevant energy policies, including renewable portfolio standards and regulation
of thermoelectric water intake and discharge. Regulations for thermoelectric water use are currently
undergoing substantial change. Energy use for water conveyance, treatment, and distribution is also the
subject of policy activity at multiple scales, from pump efficiency standards to municipal water treatment
funding mechanisms. A more integrated approach to the interconnected energy and water challenges
could stimulate the development and deployment of solutions that address objectives in both domains.
DOE’s role in the energy-water nexus is primarily in technology R&D investment and data, modeling,
and analysis. Many other departments are well-positioned to complement and coordinate with DOE. For
example, the Environmental Protection Agency has both a regulatory and a research role related to water
quality in drinking water and wastewater treatment, and thermoelectric cooling systems. The Department
of Agriculture has a strong interest in understanding the effects of agriculture on water resources and vice
versa. Within the Department of Interior, the U.S. Geological Survey has responsibility for water-related
data and modeling and the Bureau of Reclamation has responsibility for beneficial use of nontraditional
waters. Within the Department of Defense, the Army Corps of Engineers is responsible for managing
hydropower and other uses of waterways. The Department of Defense also pursues energy-efficient water
and wastewater treatment technologies appropriate for use on military bases. Relevant research
throughout the energy-water nexus is supported by the National Science Foundation. The Department of
Homeland Security is responsible for understanding factors underlying resilience and vulnerability of
water and energy infrastructure. The National Oceanic and Atmospheric Administration and the National
Aeronautics and Space Administration collect data, develop models, and support research relevant to the
energy-water nexus.
Finally, the policy challenges related to energy and water are not unique to the United States; many other
nations are addressing the nexus based on their own circumstances. Therefore, there may be benefits to
sharing knowledge and insight internationally.
16
Chapter 2: Water for Thermoelectric Generation This chapter describes water demands for thermoelectric generation technologies, including associated
technologies such as carbon capture and storage (CCS). While other generation technologies such as wind
and solar photovoltaic generation may have water requirements, these requirements are minimal (see
Figure 2) and will not be discussed extensively in Chapter 2.
2.1 Thermoelectric Cooling
Two-thirds of total U.S. electricity generation—including many thermoelectric generation sources such as
coal, natural gas, nuclear, concentrated solar power (CSP), and geothermal plants—requires water for
cooling. However, water demands vary significantly by region, technology, and operational strategy. The
changing profile of the generation fleet—including retirement of aging coal-fired generators as well as
deployment of advanced technologies such as dry and hybrid cooling systems and CCS—will strongly
affect future water demands.
2.1.1 Regional variability of water withdrawal and consumption
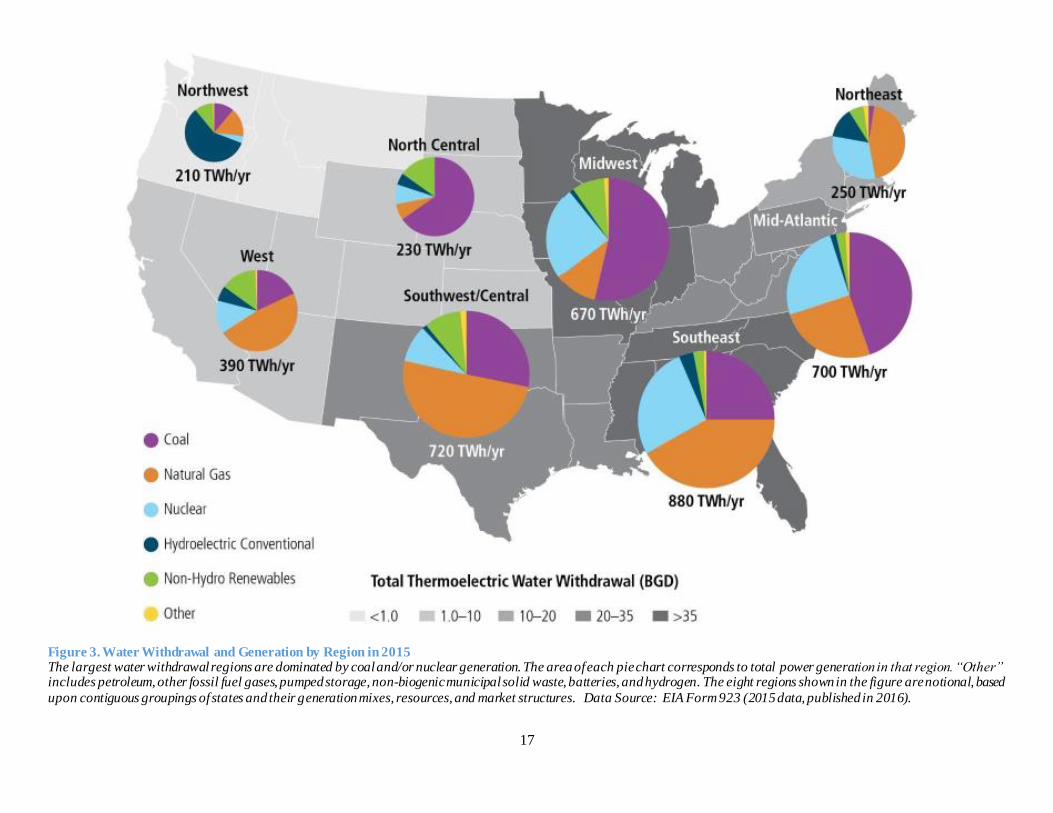
Water withdrawal and consumption for thermoelectric generation vary across regions of the United
States. Figure 3 further describes the regional variation of the water withdrawal for thermoelectric power.
As shown, the largest water withdrawal regions are dominated by a combination of coal and nuclear
generation. Hydropower dominates in the Northwest and also makes up more than 10 percent of
generation in Alaska and the Northeast. Comparisons between regions can yield interesting insights. The
North Central and West regions have similar total generation and water withdrawal; however, the North
Central region is dominated by coal while the West has a more diversified generation portfolio that relies
heavily on natural gas.
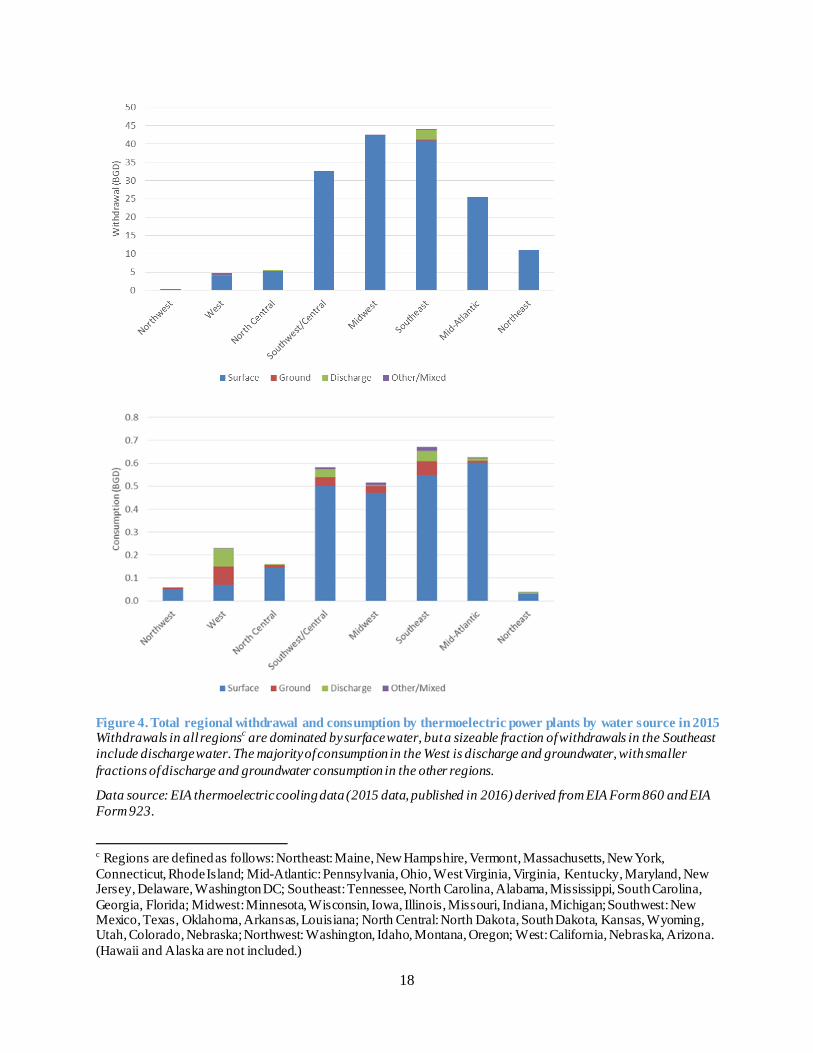
The type of water withdrawn and consumed by thermoelectric generators can also vary across regions
(Figure 4). Surface and groundwater categories in Figure 4 include fresh, brackish, and saline water
combined. Discharge water is water that is discharged from another facility, such as treated wastewater
effluent. Other/Mixed includes water sources that survey respondents did not classify as any of the other
categories, and water that is a mixture of other categories. Figure 4 indicates that while water withdrawals
in all eight regions are dominated by surface water, the Southeast withdraws a sizable fraction of
discharge water. Water sources for consumption are somewhat more varied, with more than 10 percent of
consumption by the West, Southwest/Central, and Southeast regions originating from groundwater and
discharge water.
17
Figure 3. Water Withdrawal and Generation by Region in 2015 The largest water withdrawal regions are dominated by coal and/or nuclear generation. The area of each pie chart corresponds to total power generation in that region. “Other” includes petroleum, other fossil fuel gases, pumped storage, non-biogenic municipal solid waste, batteries, and hydrogen. The eight regions shown in the figure are notional, based
upon contiguous groupings of states and their generation mixes, resources, and market structures. Data Source: EIA Form 923 (2015 data, published in 2016).
18
Figure 4. Total regional withdrawal and consumption by thermoelectric power plants by water source in 2015 Withdrawals in all regions
c are dominated by surface water, but a sizeable fraction of withdrawals in the Southeast
include discharge water. The majority of consumption in the West is discharge and groundwater, with smaller
fractions of discharge and groundwater consumption in the other regions.
Data source: EIA thermoelectric cooling data (2015 data, published in 2016) derived from EIA Form 860 and EIA
Form 923.
c Regions are defined as follows: Northeast: Maine, New Hampshire, Vermont, Massachusetts, New York,
Connecticut, Rhode Island; Mid-Atlantic: Pennsylvania, Ohio, West Virginia, Virginia, Kentucky, Maryland, New Jersey, Delaware, Washington DC; Southeast: Tennessee, North Carolina, Alabama, Mississippi, South Carolina,
Georgia, Florida; Midwest: Minnesota, Wisconsin, Iowa, Illinois, Missouri, Indiana, Michigan; Southwest: New Mexico, Texas, Oklahoma, Arkansas, Louisiana; North Central: North Dakota, South Dakota, Kansas, Wyoming, Utah, Colorado, Nebraska; Northwest: Washington, Idaho, Montana, Oregon; West: California, Nebraska, Arizona.
(Hawaii and Alaska are not included.)
19
2.1.2 Cooling system and generation technologies
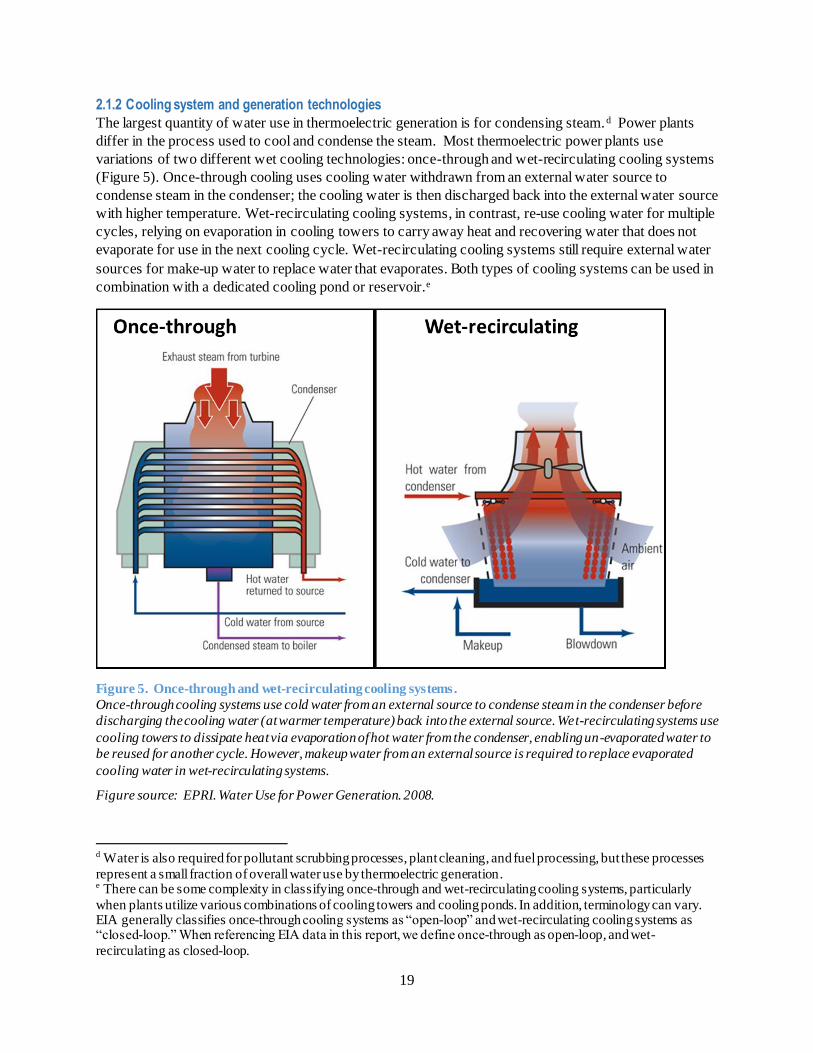
The largest quantity of water use in thermoelectric generation is for condensing steam.d Power plants
differ in the process used to cool and condense the steam. Most thermoelectric power plants use
variations of two different wet cooling technologies: once-through and wet-recirculating cooling systems
(Figure 5). Once-through cooling uses cooling water withdrawn from an external water source to
condense steam in the condenser; the cooling water is then discharged back into the external water source
with higher temperature. Wet-recirculating cooling systems, in contrast, re-use cooling water for multiple
cycles, relying on evaporation in cooling towers to carry away heat and recovering water that does not
evaporate for use in the next cooling cycle. Wet-recirculating cooling systems still require external water
sources for make-up water to replace water that evaporates. Both types of cooling systems can be used in
combination with a dedicated cooling pond or reservoir.e
Figure 5. Once-through and wet-recirculating cooling systems.
Once-through cooling systems use cold water from an external source to condense steam in the condenser before
discharging the cooling water (at warmer temperature) back into the external source. Wet-recirculating systems use
cooling towers to dissipate heat via evaporation of hot water from the condenser, enabling un-evaporated water to
be reused for another cycle. However, makeup water from an external source is required to replace evaporated
cooling water in wet-recirculating systems.
Figure source: EPRI. Water Use for Power Generation. 2008.
d Water is also required for pollutant scrubbing processes, plant cleaning, and fuel processing, but these processes
represent a small fraction of overall water use by thermoelectric generation. e There can be some complexity in classifying once-through and wet-recirculating cooling systems, particularly
when plants utilize various combinations of cooling towers and cooling ponds. In addition, terminology can vary. EIA generally classifies once-through cooling systems as “open-loop” and wet-recirculating cooling systems as “closed-loop.” When referencing EIA data in this report, we define once-through as open-loop, and wet-
recirculating as closed-loop.
20
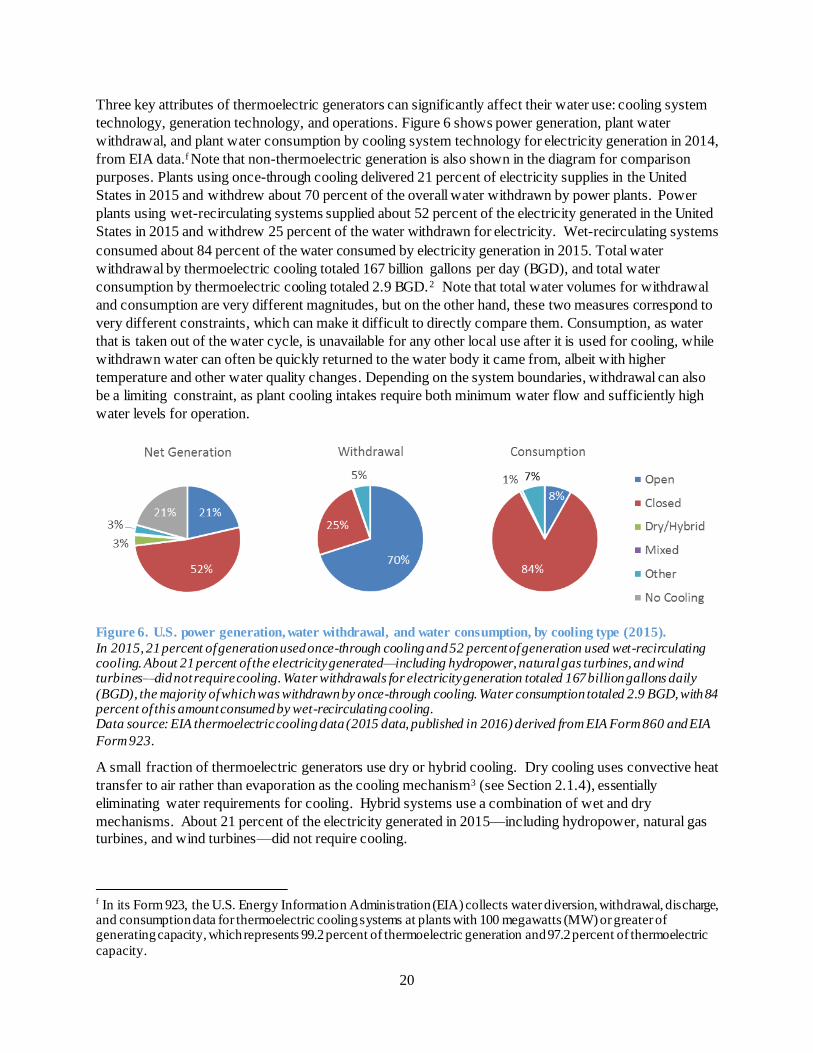
Three key attributes of thermoelectric generators can significantly affect their water use: cooling system
technology, generation technology, and operations. Figure 6 shows power generation, plant water
withdrawal, and plant water consumption by cooling system technology for electricity generation in 2014,
from EIA data.f Note that non-thermoelectric generation is also shown in the diagram for comparison
purposes. Plants using once-through cooling delivered 21 percent of electricity supplies in the United
States in 2015 and withdrew about 70 percent of the overall water withdrawn by power plants. Power
plants using wet-recirculating systems supplied about 52 percent of the electricity generated in the United
States in 2015 and withdrew 25 percent of the water withdrawn for electricity. Wet-recirculating systems
consumed about 84 percent of the water consumed by electricity generation in 2015. Total water
withdrawal by thermoelectric cooling totaled 167 billion gallons per day (BGD), and total water
consumption by thermoelectric cooling totaled 2.9 BGD.2 Note that total water volumes for withdrawal
and consumption are very different magnitudes, but on the other hand, these two measures correspond to
very different constraints, which can make it difficult to directly compare them. Consumption, as water
that is taken out of the water cycle, is unavailable for any other local use after it is used for cooling, while
withdrawn water can often be quickly returned to the water body it came from, albeit with higher
temperature and other water quality changes. Depending on the system boundaries, withdrawal can also
be a limiting constraint, as plant cooling intakes require both minimum water flow and sufficiently high
water levels for operation.
Figure 6. U.S. power generation, water withdrawal, and water consumption, by cooling type (2015).
In 2015, 21 percent of generation used once-through cooling and 52 percent of generation used wet-recirculating cooling. About 21 percent of the electricity generated—including hydropower, natural gas turbines, and wind turbines—did not require cooling. Water withdrawals for electricity generation totaled 167 billion gallons daily
(BGD), the majority of which was withdrawn by once-through cooling. Water consumption totaled 2.9 BGD, with 84 percent of this amount consumed by wet-recirculating cooling. Data source: EIA thermoelectric cooling data (2015 data, published in 2016) derived from EIA Form 860 and EIA
Form 923.
A small fraction of thermoelectric generators use dry or hybrid cooling. Dry cooling uses convective heat
transfer to air rather than evaporation as the cooling mechanism3 (see Section 2.1.4), essentially
eliminating water requirements for cooling. Hybrid systems use a combination of wet and dry
mechanisms. About 21 percent of the electricity generated in 2015—including hydropower, natural gas
turbines, and wind turbines—did not require cooling.
f In its Form 923, the U.S. Energy Information Administration (EIA) collects water diversion, withdrawal, discharge, and consumption data for thermoelectric cooling systems at plants with 100 megawatts (MW) or greater of generating capacity, which represents 99.2 percent of thermoelectric generation and 97.2 percent of thermoelectric
capacity.
21
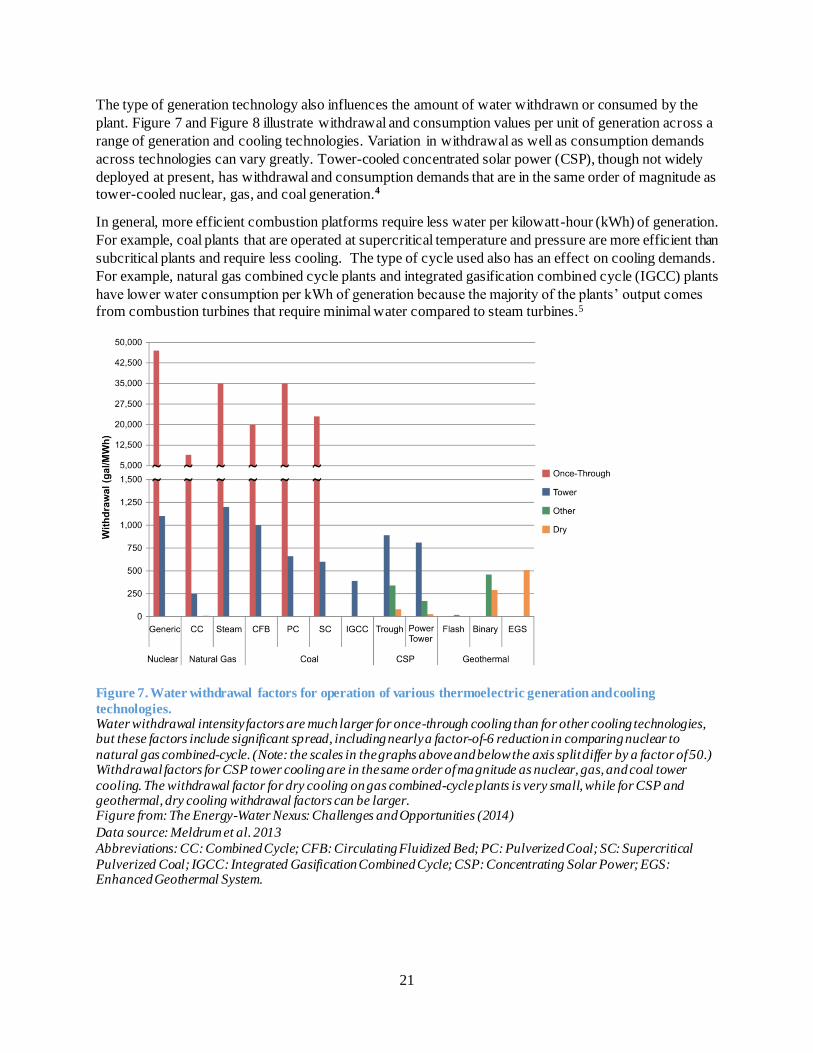
The type of generation technology also influences the amount of water withdrawn or consumed by the
plant. Figure 7 and Figure 8 illustrate withdrawal and consumption values per unit of generation across a
range of generation and cooling technologies. Variation in withdrawal as well as consumption demands
across technologies can vary greatly. Tower-cooled concentrated solar power (CSP), though not widely
deployed at present, has withdrawal and consumption demands that are in the same order of magnitude as
tower-cooled nuclear, gas, and coal generation.4
In general, more efficient combustion platforms require less water per kilowatt-hour (kWh) of generation.
For example, coal plants that are operated at supercritical temperature and pressure are more efficient than
subcritical plants and require less cooling. The type of cycle used also has an effect on cooling demands.
For example, natural gas combined cycle plants and integrated gasification combined cycle (IGCC) plants
have lower water consumption per kWh of generation because the majority of the plants’ output comes
from combustion turbines that require minimal water compared to steam turbines.5
Figure 7. Water withdrawal factors for operation of various thermoelectric generation and cooling
technologies. Water withdrawal intensity factors are much larger for once-through cooling than for other cooling technologies, but these factors include significant spread, including nearly a factor-of-6 reduction in comparing nuclear to
natural gas combined-cycle. (Note: the scales in the graphs above and below the axis split differ by a factor of 50.) Withdrawal factors for CSP tower cooling are in the same order of magnitude as nuclear, gas, and coal tower
cooling. The withdrawal factor for dry cooling on gas combined-cycle plants is very small, while for CSP and geothermal, dry cooling withdrawal factors can be larger. Figure from: The Energy-Water Nexus: Challenges and Opportunities (2014)
Data source: Meldrum et al. 2013
Abbreviations: CC: Combined Cycle; CFB: Circulating Fluidized Bed; PC: Pulverized Coal; SC: Supercritical
Pulverized Coal; IGCC: Integrated Gasification Combined Cycle; CSP: Concentrating Solar Power; EGS: Enhanced Geothermal System.
22
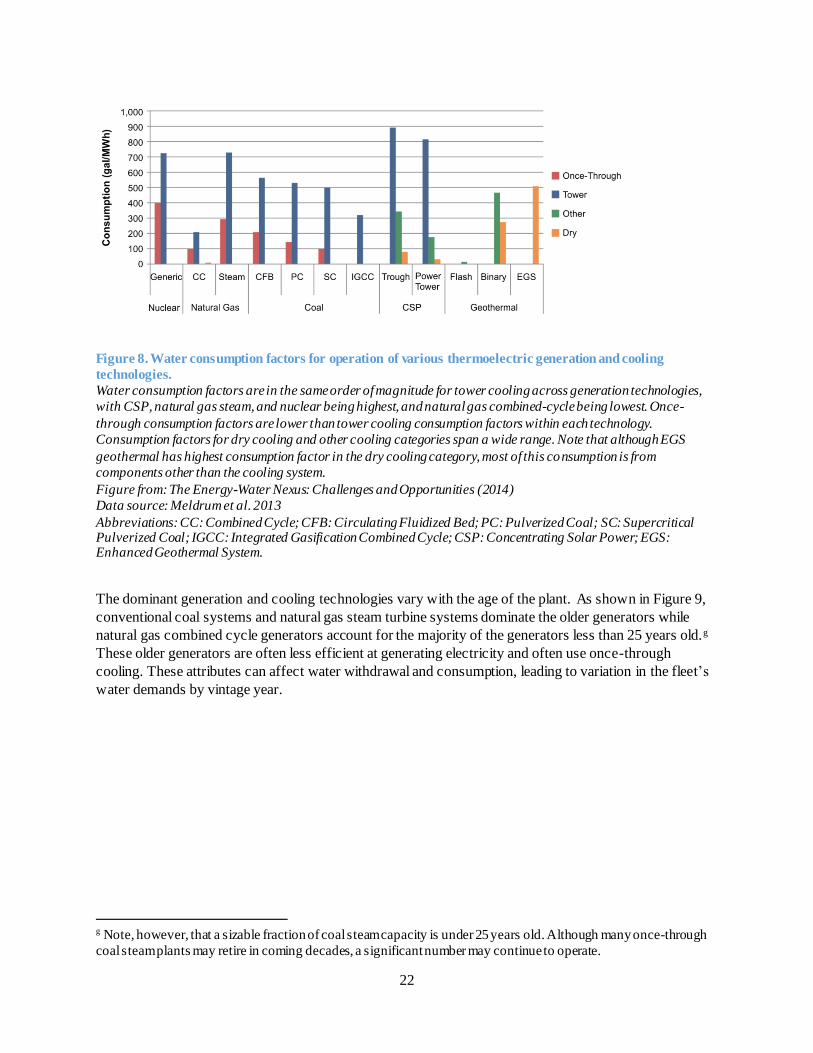
Figure 8. Water consumption factors for operation of various thermoelectric generation and cooling
technologies.
Water consumption factors are in the same order of magnitude for tower cooling across generation technologies,
with CSP, natural gas steam, and nuclear being highest, and natural gas combined-cycle being lowest. Once-
through consumption factors are lower than tower cooling consumption factors within each technology.
Consumption factors for dry cooling and other cooling categories span a wide range. Note that although EGS
geothermal has highest consumption factor in the dry cooling category, most of this consumption is from
components other than the cooling system.
Figure from: The Energy-Water Nexus: Challenges and Opportunities (2014)
Data source: Meldrum et al. 2013
Abbreviations: CC: Combined Cycle; CFB: Circulating Fluidized Bed; PC: Pulverized Coal; SC: Supercritical Pulverized Coal; IGCC: Integrated Gasification Combined Cycle; CSP: Concentrating Solar Power; EGS: Enhanced Geothermal System.
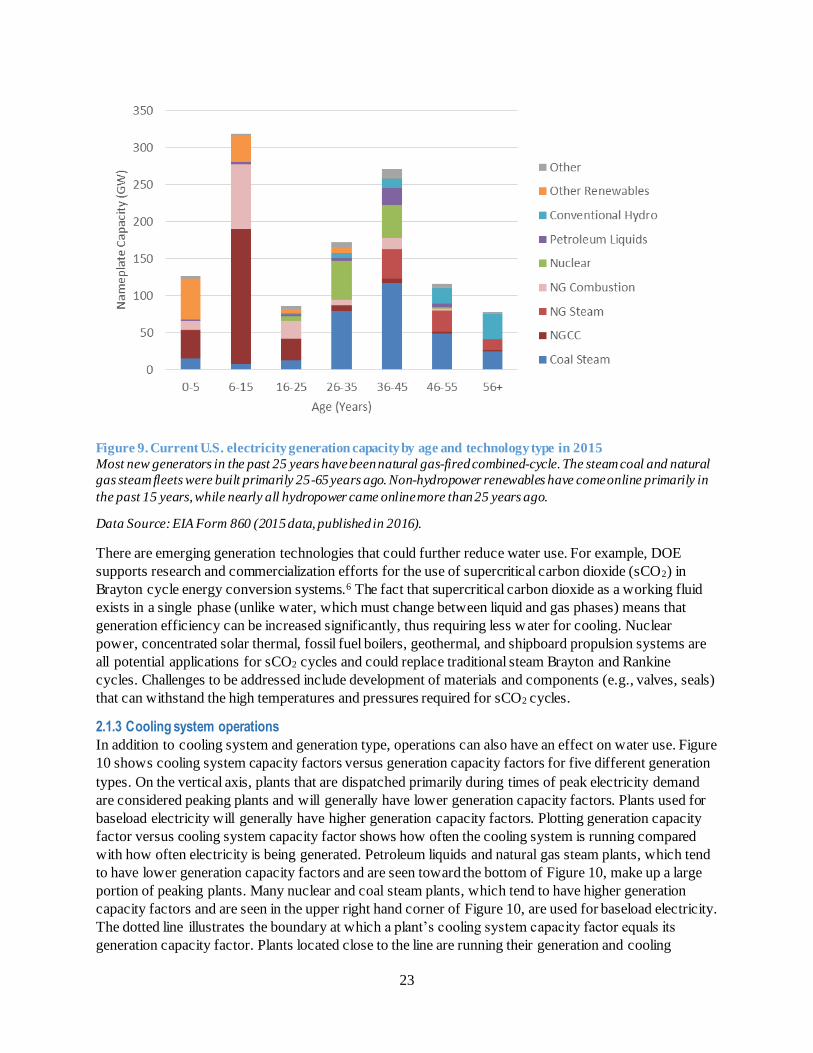
The dominant generation and cooling technologies vary with the age of the plant. As shown in Figure 9,
conventional coal systems and natural gas steam turbine systems dominate the older generators while
natural gas combined cycle generators account for the majority of the generators less than 25 years old.g
These older generators are often less efficient at generating electricity and often use once-through
cooling. These attributes can affect water withdrawal and consumption, leading to variation in the fleet’s
water demands by vintage year.
g Note, however, that a sizable fraction of coal steam capacity is under 25 years old. Although many once-through
coal steam plants may retire in coming decades, a significant number may continue to operate.
23
Figure 9. Current U.S. electricity generation capacity by age and technology type in 2015
Most new generators in the past 25 years have been natural gas-fired combined-cycle. The steam coal and natural
gas steam fleets were built primarily 25-65 years ago. Non-hydropower renewables have come online primarily in
the past 15 years, while nearly all hydropower came online more than 25 years ago.
Data Source: EIA Form 860 (2015 data, published in 2016).
There are emerging generation technologies that could further reduce water use. For example, DOE
supports research and commercialization efforts for the use of supercritical carbon dioxide (sCO2) in
Brayton cycle energy conversion systems.6 The fact that supercritical carbon dioxide as a working fluid
exists in a single phase (unlike water, which must change between liquid and gas phases) means that
generation efficiency can be increased significantly, thus requiring less water for cooling. Nuclear
power, concentrated solar thermal, fossil fuel boilers, geothermal, and shipboard propulsion systems are
all potential applications for sCO2 cycles and could replace traditional steam Brayton and Rankine
cycles. Challenges to be addressed include development of materials and components (e.g., valves, seals)
that can withstand the high temperatures and pressures required for sCO2 cycles.
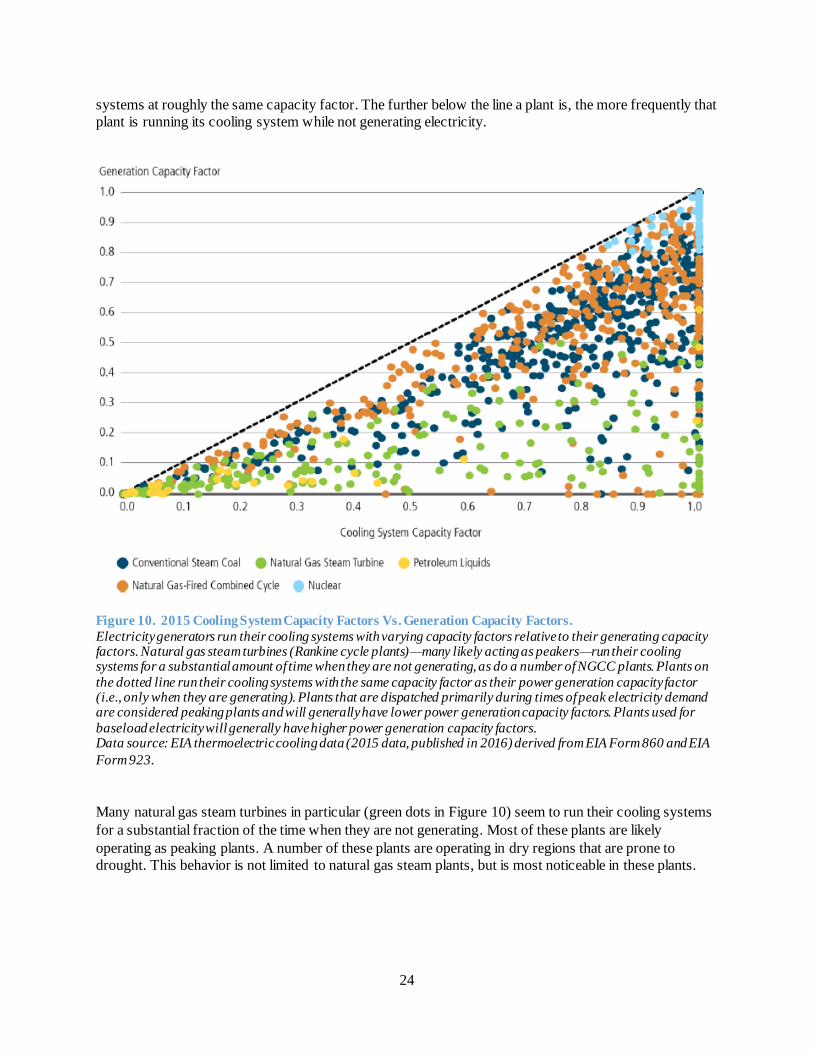
2.1.3 Cooling system operations
In addition to cooling system and generation type, operations can also have an effect on water use. Figure
10 shows cooling system capacity factors versus generation capacity factors for five different generation
types. On the vertical axis, plants that are dispatched primarily during times of peak electricity demand
are considered peaking plants and will generally have lower generation capacity factors. Plants used for
baseload electricity will generally have higher generation capacity factors. Plotting generation capacity
factor versus cooling system capacity factor shows how often the cooling system is running compared
with how often electricity is being generated. Petroleum liquids and natural gas steam plants, which tend
to have lower generation capacity factors and are seen toward the bottom of Figure 10, make up a large
portion of peaking plants. Many nuclear and coal steam plants, which tend to have higher generation
capacity factors and are seen in the upper right hand corner of Figure 10, are used for baseload electricity.
The dotted line illustrates the boundary at which a plant’s cooling system capacity factor equals its
generation capacity factor. Plants located close to the line are running their generation and cooling
24
systems at roughly the same capacity factor. The further below the line a plant is, the more frequently that
plant is running its cooling system while not generating electricity.
Figure 10. 2015 Cooling System Capacity Factors Vs. Generation Capacity Factors.
Electricity generators run their cooling systems with varying capacity factors relative to their generating capacity factors. Natural gas steam turbines (Rankine cycle plants)—many likely acting as peakers—run their cooling systems for a substantial amount of time when they are not generating, as do a number of NGCC plants. Plants on
the dotted line run their cooling systems with the same capacity factor as their power generation capacity factor (i.e., only when they are generating). Plants that are dispatched primarily during times of peak electricity demand are considered peaking plants and will generally have lower power generation capacity factors. Plants used for
baseload electricity will generally have higher power generation capacity factors. Data source: EIA thermoelectric cooling data (2015 data, published in 2016) derived from EIA Form 860 and EIA
Form 923.
Many natural gas steam turbines in particular (green dots in Figure 10) seem to run their cooling systems
for a substantial fraction of the time when they are not generating. Most of these plants are likely
operating as peaking plants. A number of these plants are operating in dry regions that are prone to
drought. This behavior is not limited to natural gas steam plants, but is most noticeable in these plants.
25
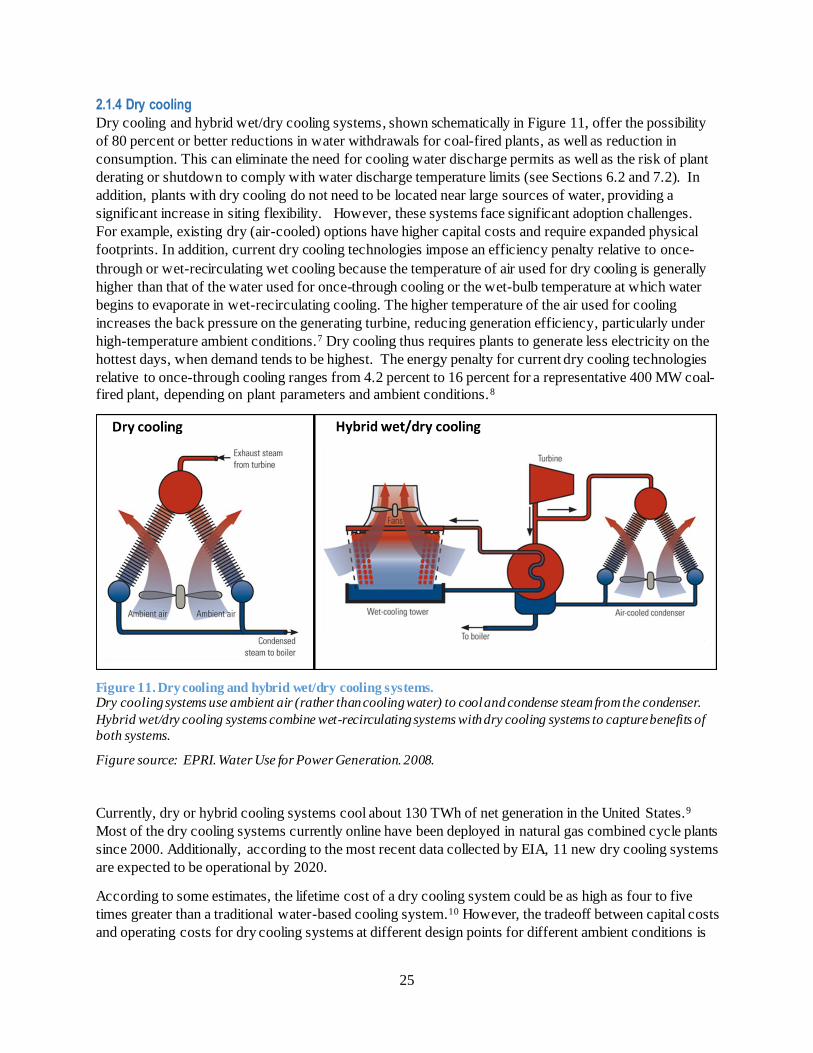
2.1.4 Dry cooling
Dry cooling and hybrid wet/dry cooling systems, shown schematically in Figure 11, offer the possibility
of 80 percent or better reductions in water withdrawals for coal-fired plants, as well as reduction in
consumption. This can eliminate the need for cooling water discharge permits as well as the risk of plant
derating or shutdown to comply with water discharge temperature limits (see Sections 6.2 and 7.2). In
addition, plants with dry cooling do not need to be located near large sources of water, providing a
significant increase in siting flexibility. However, these systems face significant adoption challenges.
For example, existing dry (air-cooled) options have higher capital costs and require expanded physical
footprints. In addition, current dry cooling technologies impose an efficiency penalty relative to once-
through or wet-recirculating wet cooling because the temperature of air used for dry cooling is generally
higher than that of the water used for once-through cooling or the wet-bulb temperature at which water
begins to evaporate in wet-recirculating cooling. The higher temperature of the air used for cooling
increases the back pressure on the generating turbine, reducing generation efficiency, particularly under
high-temperature ambient conditions.7 Dry cooling thus requires plants to generate less electricity on the
hottest days, when demand tends to be highest. The energy penalty for current dry cooling technologies
relative to once-through cooling ranges from 4.2 percent to 16 percent for a representative 400 MW coal-
fired plant, depending on plant parameters and ambient conditions.8
Figure 11. Dry cooling and hybrid wet/dry cooling systems. Dry cooling systems use ambient air (rather than cooling water) to cool and condense steam from the condenser.
Hybrid wet/dry cooling systems combine wet-recirculating systems with dry cooling systems to capture benefits of
both systems.
Figure source: EPRI. Water Use for Power Generation. 2008.
Currently, dry or hybrid cooling systems cool about 130 TWh of net generation in the United States.9
Most of the dry cooling systems currently online have been deployed in natural gas combined cycle plants
since 2000. Additionally, according to the most recent data collected by EIA, 11 new dry cooling systems
are expected to be operational by 2020.
According to some estimates, the lifetime cost of a dry cooling system could be as high as four to five
times greater than a traditional water-based cooling system.10 However, the tradeoff between capital costs
and operating costs for dry cooling systems at different design points for different ambient conditions is
26
complex. A power plant that is sizing a dry cooling system must balance the additional capital and
maintenance costs of a larger system with the reduced ability for the system to sufficiently handle heat
loads during especially warm or windy days. Without a detailed analysis for the proposed location that
captures the variety of ambient conditions at a granular enough time scale, it is difficult to estimate the
lifetime costs of a dry cooling system. These issues make it difficult to optimize the design of a dry
cooling system; the industry tends to settle for summer average temperature as a design point. While this
strategy may be effective for locations with consistent summer temperatures, it would be difficult for a
system in a location with highly variable ambient conditions to keep up with the heat load on a
particularly warm or windy day. During such conditions, the plant would incur heat rate penalties or, in
extreme cases, capacity shortfalls.
Hybrid systems mitigate some of the problems associated specifically with dry cooling, particularly in dry
climates where their wet system performance is not constrained by humidity, but they introduce
additional layers of complexity, which translate into increased capital costs compared to traditional wet-
cooling systems. An outstanding challenge is to develop dry and hybrid cooling technologies that are
economically feasible for deployment, together with operational strategies to maximize the benefits they
provide.
2.1.5 Trends and Outlook
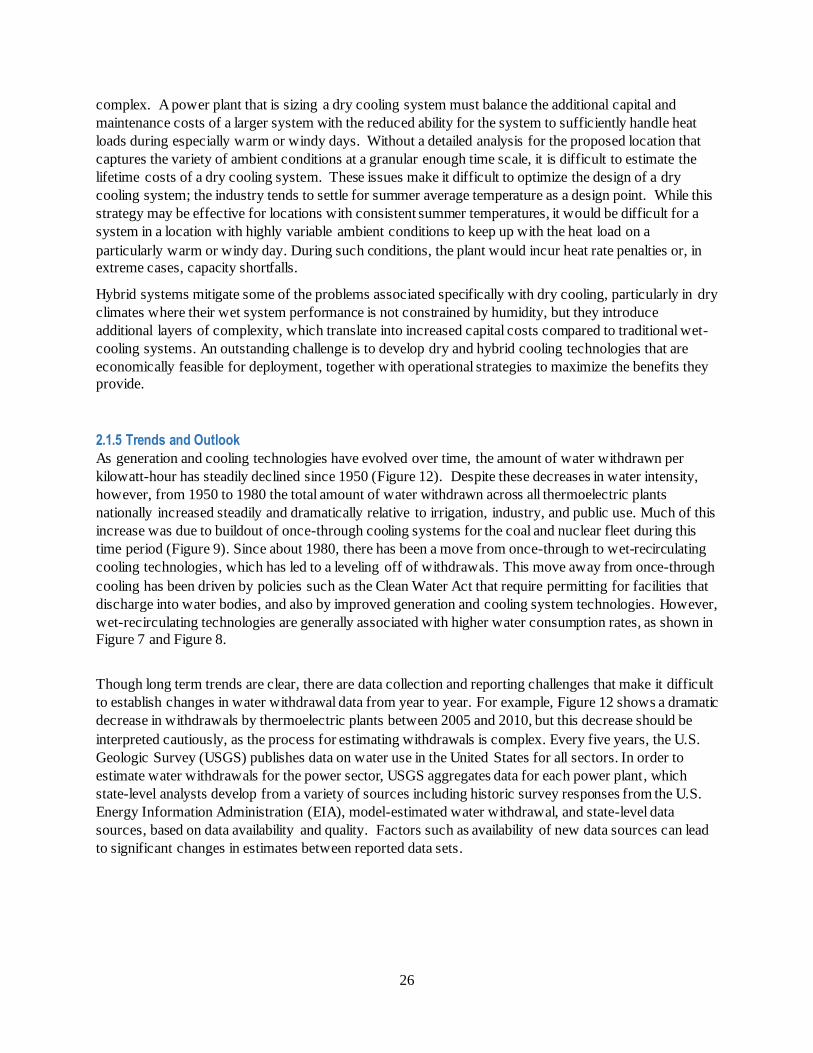
As generation and cooling technologies have evolved over time, the amount of water withdrawn per
kilowatt-hour has steadily declined since 1950 (Figure 12). Despite these decreases in water intensity,
however, from 1950 to 1980 the total amount of water withdrawn across all thermoelectric plants
nationally increased steadily and dramatically relative to irrigation, industry, and public use. Much of this
increase was due to buildout of once-through cooling systems for the coal and nuclear fleet during this
time period (Figure 9). Since about 1980, there has been a move from once-through to wet-recirculating
cooling technologies, which has led to a leveling off of withdrawals. This move away from once-through
cooling has been driven by policies such as the Clean Water Act that require permitting for facilities that
discharge into water bodies, and also by improved generation and cooling system technologies. However,
wet-recirculating technologies are generally associated with higher water consumption rates, as shown in
Figure 7 and Figure 8.
Though long term trends are clear, there are data collection and reporting challenges that make it difficult
to establish changes in water withdrawal data from year to year. For example, Figure 12 shows a dramatic
decrease in withdrawals by thermoelectric plants between 2005 and 2010, but this decrease should be
interpreted cautiously, as the process for estimating withdrawals is complex. Every five years, the U.S.
Geologic Survey (USGS) publishes data on water use in the United States for all sectors. In order to
estimate water withdrawals for the power sector, USGS aggregates data for each power plant, which
state-level analysts develop from a variety of sources including historic survey responses from the U.S.
Energy Information Administration (EIA), model-estimated water withdrawal, and state-level data
sources, based on data availability and quality. Factors such as availability of new data sources can lead
to significant changes in estimates between reported data sets.
27
Figure 12. Water withdrawals for thermoelectric generation and other sectors.
While the water intensity of thermoelectric generation has decreased, total water withdrawn by thermoelectric generation increased significantly relative to other sectors from 1950-1980, but has leveled off in recent decades.
Data source: Maupin, M.A. et al., 2014, Estimated use of water in the United States in 2010: U.S. Geological Survey Circular 1405; and EIA. 2011. Annual Energy Review 2011.
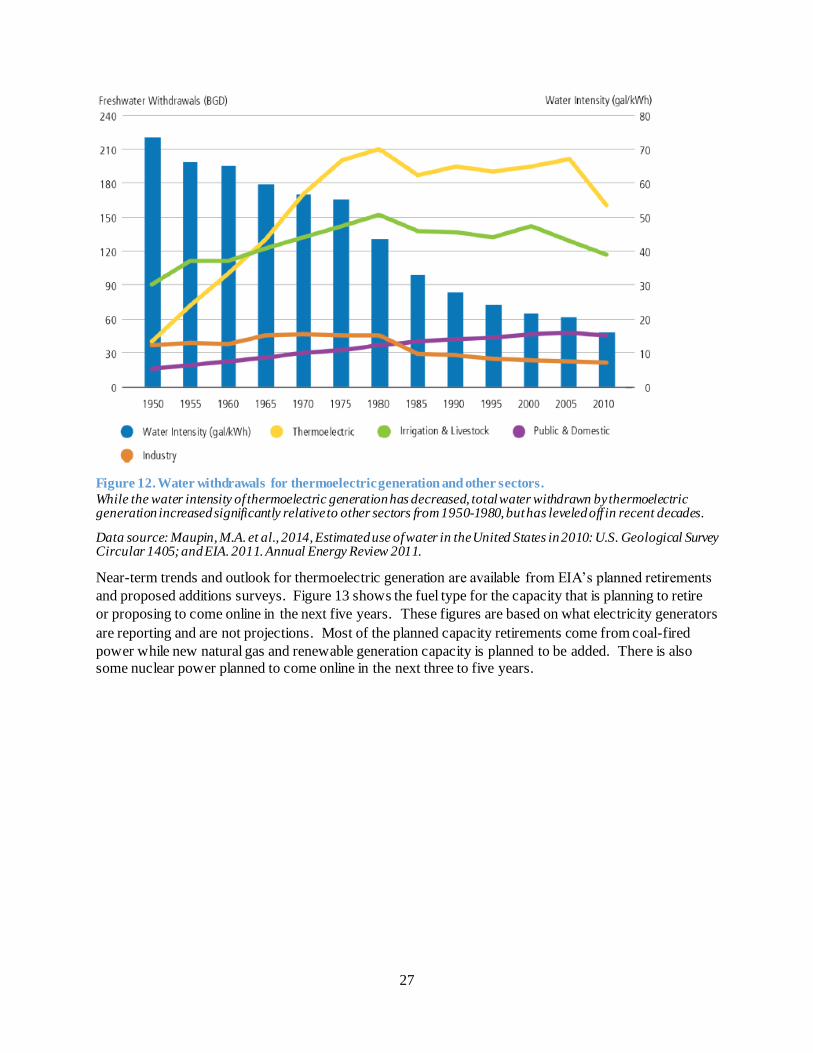
Near-term trends and outlook for thermoelectric generation are available from EIA’s planned retirements
and proposed additions surveys. Figure 13 shows the fuel type for the capacity that is planning to retire
or proposing to come online in the next five years. These figures are based on what electricity generators
are reporting and are not projections. Most of the planned capacity retirements come from coal-fired
power while new natural gas and renewable generation capacity is planned to be added. There is also
some nuclear power planned to come online in the next three to five years.
28
Figure 13. Planned retirements and additions of U.S. electricity generation capacity by fuel source (2016–
2020). Planned retirements are dominated by coal, while planned additions include large fractions of not only natural gas,
but also renewables.
Data source: EIA Form 860 (2015 data, published in 2016)
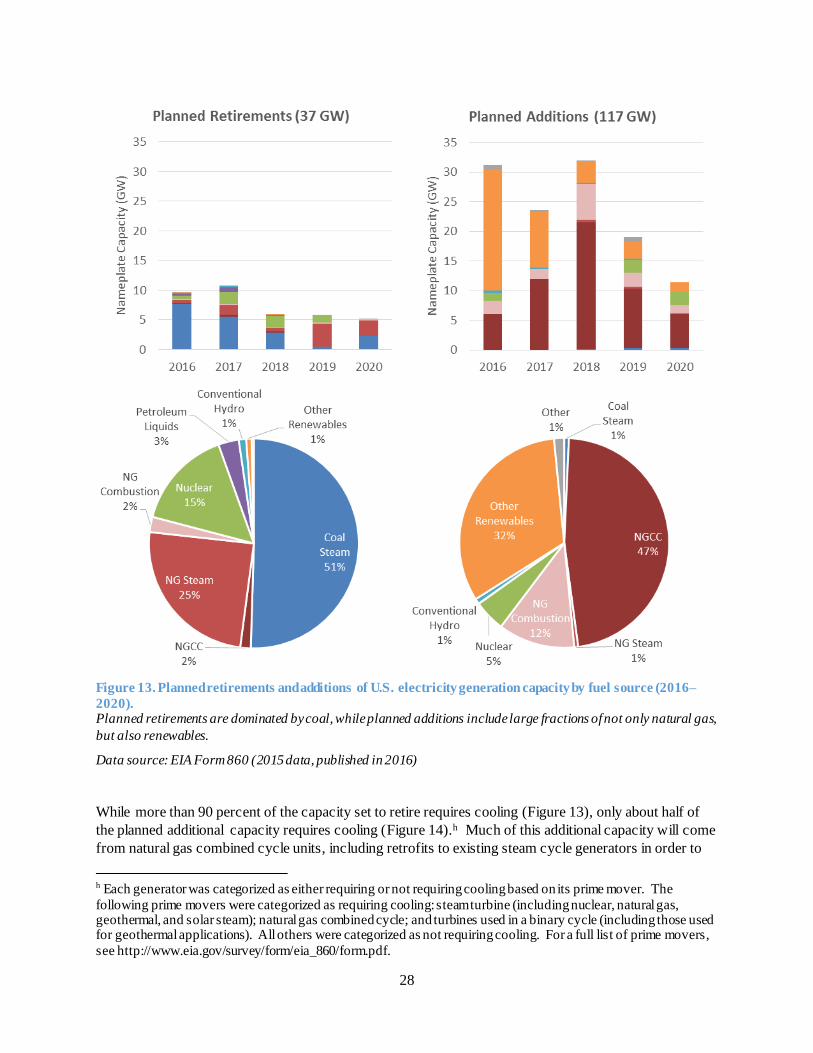
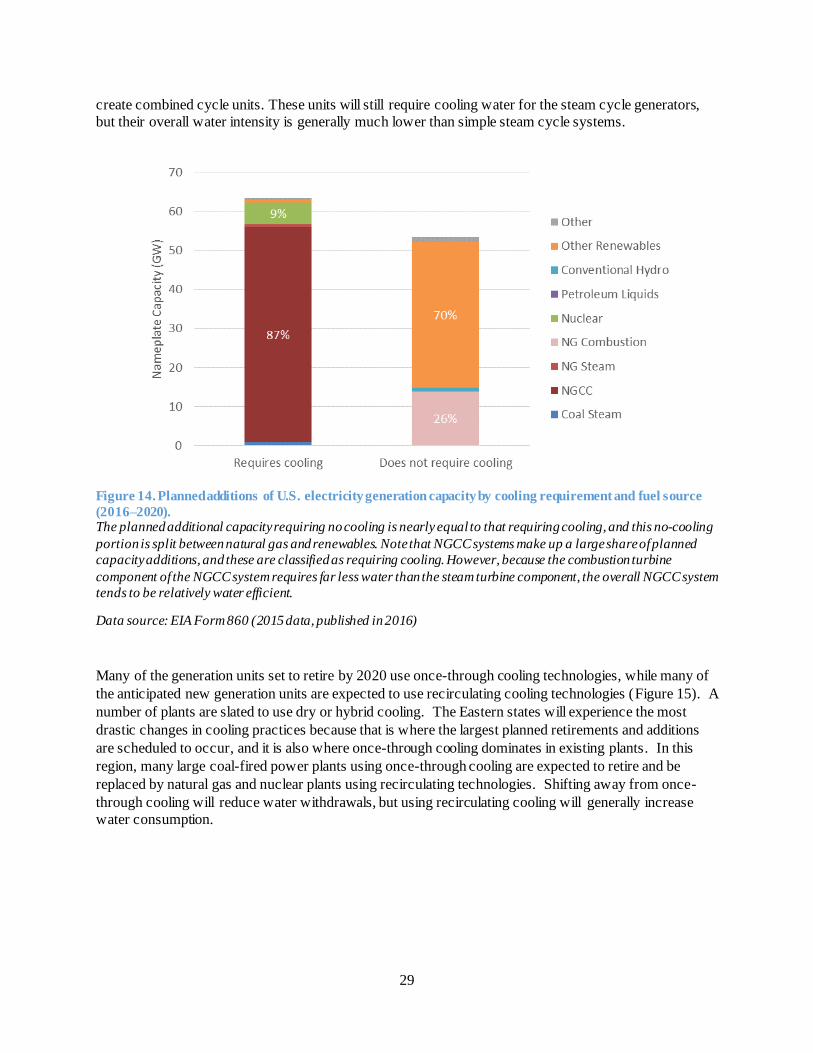
While more than 90 percent of the capacity set to retire requires cooling (Figure 13), only about half of
the planned additional capacity requires cooling (Figure 14).h Much of this additional capacity will come
from natural gas combined cycle units, including retrofits to existing steam cycle generators in order to
h Each generator was categorized as either requiring or not requiring cooling based on its prime mover. The
following prime movers were categorized as requiring cooling: steam turbine (including nuclear, natural gas, geothermal, and solar steam); natural gas combined cycle; and turbines used in a binary cycle (including those used for geothermal applications). All others were categorized as not requiring cooling. For a full list of prime movers,
see http://www.eia.gov/survey/form/eia_860/form.pdf.
29
create combined cycle units. These units will still require cooling water for the steam cycle generators,
but their overall water intensity is generally much lower than simple steam cycle systems.
Figure 14. Planned additions of U.S. electricity generation capacity by cooling requirement and fuel source
(2016–2020). The planned additional capacity requiring no cooling is nearly equal to that requiring cooling, and this no-cooling
portion is split between natural gas and renewables. Note that NGCC systems make up a large share of planned
capacity additions, and these are classified as requiring cooling. However, because the combustion turbine
component of the NGCC system requires far less water than the steam turbine component, the overall NGCC system
tends to be relatively water efficient.
Data source: EIA Form 860 (2015 data, published in 2016)
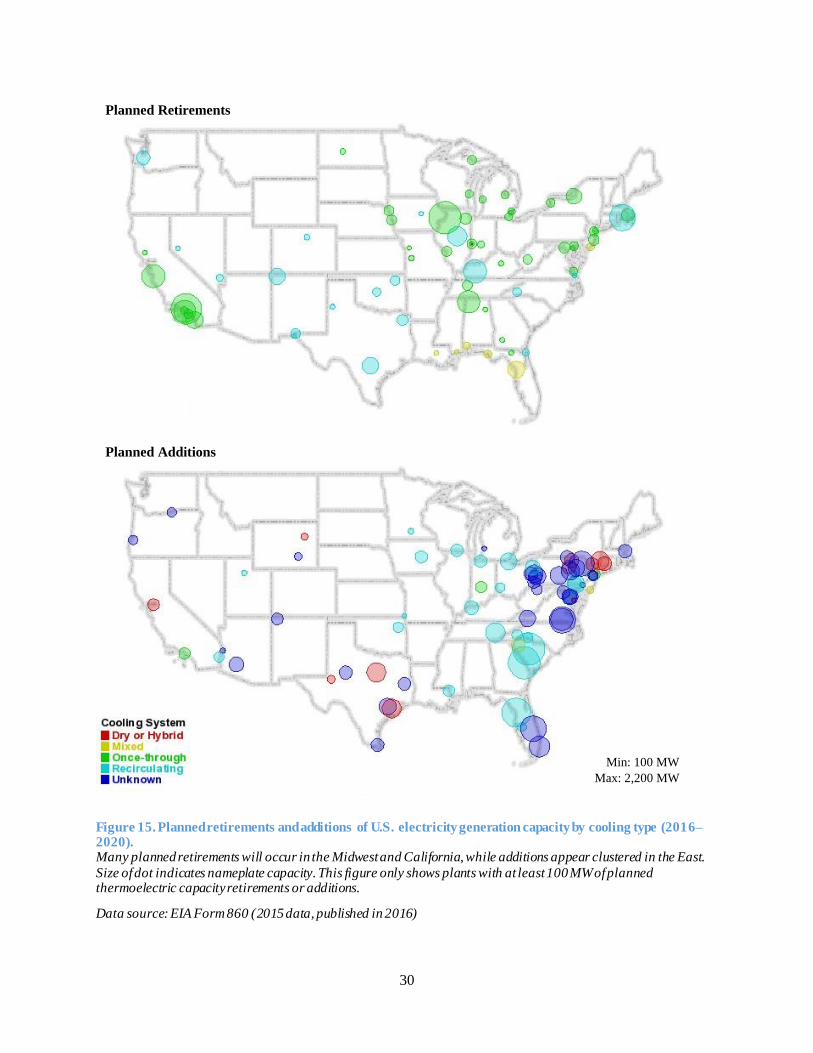
Many of the generation units set to retire by 2020 use once-through cooling technologies, while many of
the anticipated new generation units are expected to use recirculating cooling technologies (Figure 15). A
number of plants are slated to use dry or hybrid cooling. The Eastern states will experience the most
drastic changes in cooling practices because that is where the largest planned retirements and additions
are scheduled to occur, and it is also where once-through cooling dominates in existing plants. In this
region, many large coal-fired power plants using once-through cooling are expected to retire and be
replaced by natural gas and nuclear plants using recirculating technologies. Shifting away from once-
through cooling will reduce water withdrawals, but using recirculating cooling will generally increase
water consumption.
30
Figure 15. Planned retirements and additions of U.S. electricity generation capacity by cooling type (2016–2020). Many planned retirements will occur in the Midwest and California, while additions appear clustered in the East.
Size of dot indicates nameplate capacity. This figure only shows plants with at least 100 MW of planned thermoelectric capacity retirements or additions.
Data source: EIA Form 860 (2015 data, published in 2016)
Min: 100 MW
Max: 2,200 MW
Planned Retirements
Planned Additions
31
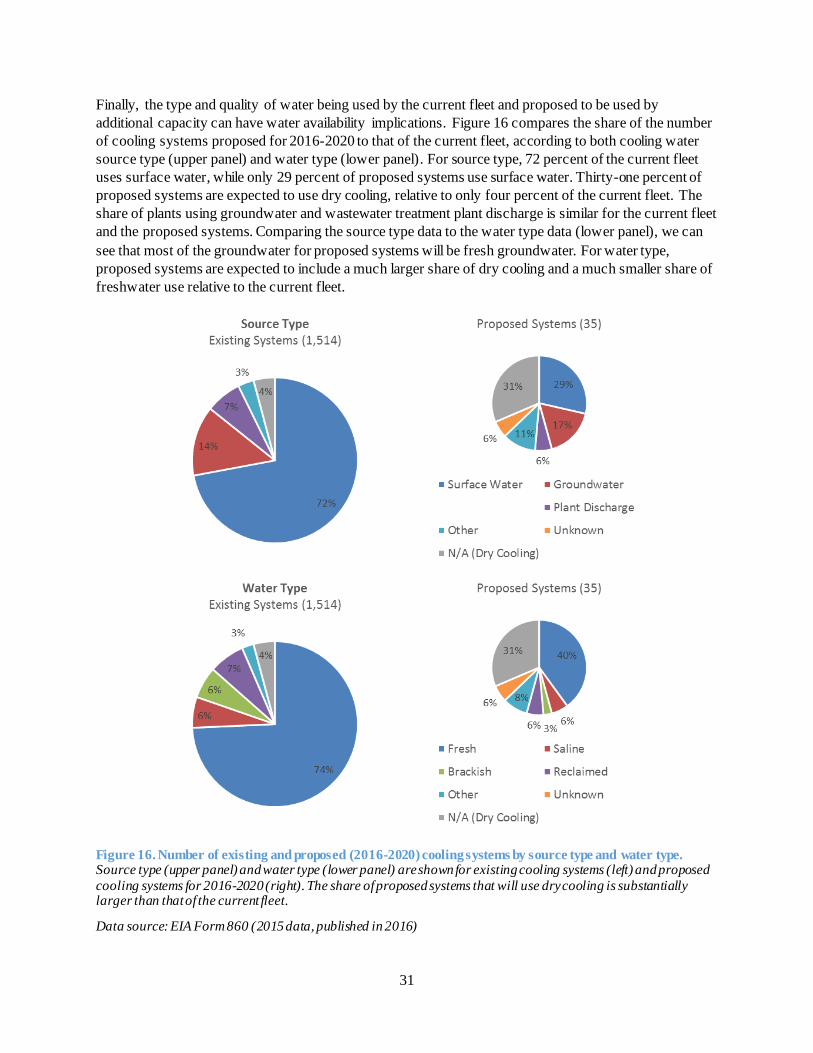
Finally, the type and quality of water being used by the current fleet and proposed to be used by
additional capacity can have water availability implications. Figure 16 compares the share of the number
of cooling systems proposed for 2016-2020 to that of the current fleet, according to both cooling water
source type (upper panel) and water type (lower panel). For source type, 72 percent of the current fleet
uses surface water, while only 29 percent of proposed systems use surface water. Thirty-one percent of
proposed systems are expected to use dry cooling, relative to only four percent of the current fleet. The
share of plants using groundwater and wastewater treatment plant discharge is similar for the current fleet
and the proposed systems. Comparing the source type data to the water type data (lower panel), we can
see that most of the groundwater for proposed systems will be fresh groundwater. For water type,
proposed systems are expected to include a much larger share of dry cooling and a much smaller share of
freshwater use relative to the current fleet.
Figure 16. Number of existing and proposed (2016-2020) cooling systems by source type and water type. Source type (upper panel) and water type (lower panel) are shown for existing cooling systems (left) and proposed
cooling systems for 2016-2020 (right). The share of proposed systems that will use dry cooling is substantially larger than that of the current fleet.
Data source: EIA Form 860 (2015 data, published in 2016)
32
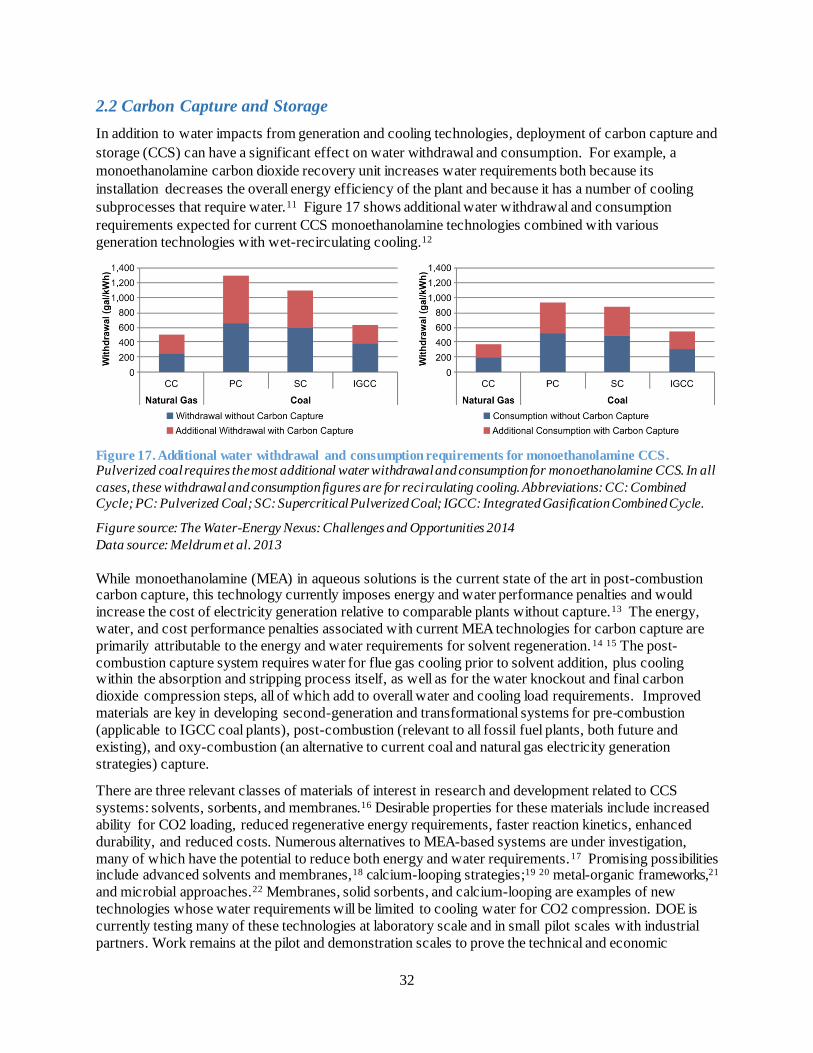
2.2 Carbon Capture and Storage
In addition to water impacts from generation and cooling technologies, deployment of carbon capture and
storage (CCS) can have a significant effect on water withdrawal and consumption. For example, a
monoethanolamine carbon dioxide recovery unit increases water requirements both because its
installation decreases the overall energy efficiency of the plant and because it has a number of cooling
subprocesses that require water.11 Figure 17 shows additional water withdrawal and consumption
requirements expected for current CCS monoethanolamine technologies combined with various
generation technologies with wet-recirculating cooling.12
Figure 17. Additional water withdrawal and consumption requirements for monoethanolamine CCS. Pulverized coal requires the most additional water withdrawal and consumption for monoethanolamine CCS. In all
cases, these withdrawal and consumption figures are for recirculating cooling. Abbreviations: CC: Combined
Cycle; PC: Pulverized Coal; SC: Supercritical Pulverized Coal; IGCC: Integrated Gasification Combined Cycle.
Figure source: The Water-Energy Nexus: Challenges and Opportunities 2014
Data source: Meldrum et al. 2013
While monoethanolamine (MEA) in aqueous solutions is the current state of the art in post-combustion carbon capture, this technology currently imposes energy and water performance penalties and would
increase the cost of electricity generation relative to comparable plants without capture.13 The energy,
water, and cost performance penalties associated with current MEA technologies for carbon capture are
primarily attributable to the energy and water requirements for solvent regeneration. 14 15 The post-
combustion capture system requires water for flue gas cooling prior to solvent addition, plus cooling within the absorption and stripping process itself, as well as for the water knockout and final carbon
dioxide compression steps, all of which add to overall water and cooling load requirements. Improved
materials are key in developing second-generation and transformational systems for pre-combustion
(applicable to IGCC coal plants), post-combustion (relevant to all fossil fuel plants, both future and
existing), and oxy-combustion (an alternative to current coal and natural gas electricity generation
strategies) capture.
There are three relevant classes of materials of interest in research and development related to CCS
systems: solvents, sorbents, and membranes.16 Desirable properties for these materials include increased
ability for CO2 loading, reduced regenerative energy requirements, faster reaction kinetics, enhanced
durability, and reduced costs. Numerous alternatives to MEA-based systems are under investigation,
many of which have the potential to reduce both energy and water requirements.17 Promising possibilities include advanced solvents and membranes,18 calcium-looping strategies;19 20 metal-organic frameworks,21
and microbial approaches.22 Membranes, solid sorbents, and calcium-looping are examples of new
technologies whose water requirements will be limited to cooling water for CO2 compression. DOE is
currently testing many of these technologies at laboratory scale and in small pilot scales with industrial
partners. Work remains at the pilot and demonstration scales to prove the technical and economic
33
feasibility of alternatives to MEA processes that deliver energy, water, and cost savings compared to
existing options.
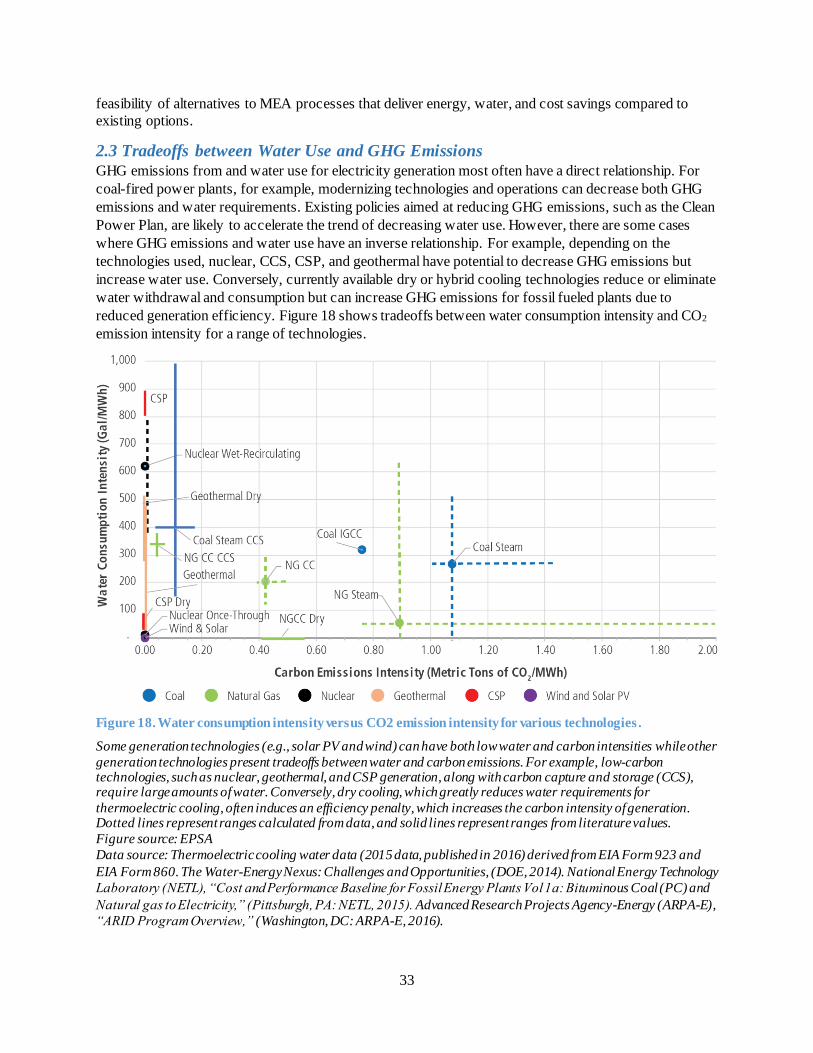
2.3 Tradeoffs between Water Use and GHG Emissions
GHG emissions from and water use for electricity generation most often have a direct relationship. For
coal-fired power plants, for example, modernizing technologies and operations can decrease both GHG
emissions and water requirements. Existing policies aimed at reducing GHG emissions, such as the Clean
Power Plan, are likely to accelerate the trend of decreasing water use. However, there are some cases
where GHG emissions and water use have an inverse relationship. For example, depending on the
technologies used, nuclear, CCS, CSP, and geothermal have potential to decrease GHG emissions but
increase water use. Conversely, currently available dry or hybrid cooling technologies reduce or eliminate
water withdrawal and consumption but can increase GHG emissions for fossil fueled plants due to
reduced generation efficiency. Figure 18 shows tradeoffs between water consumption intensity and CO2
emission intensity for a range of technologies.
Figure 18. Water consumption intensity versus CO2 emission intensity for various technologies .
Some generation technologies (e.g., solar PV and wind) can have both low water and carbon intensities while other
generation technologies present tradeoffs between water and carbon emissions. For example, low-carbon technologies, such as nuclear, geothermal, and CSP generation, along with carbon capture and storage (CCS), require large amounts of water. Conversely, dry cooling, which greatly reduces water requirements for
thermoelectric cooling, often induces an efficiency penalty, which increases the carbon intensity of generation. Dotted lines represent ranges calculated from data, and solid lines represent ranges from literature values.
Figure source: EPSA
Data source: Thermoelectric cooling water data (2015 data, published in 2016) derived from EIA Form 923 and
EIA Form 860. The Water-Energy Nexus: Challenges and Opportunities, (DOE, 2014). National Energy Technology
Laboratory (NETL), “Cost and Performance Baseline for Fossil Energy Plants Vol 1a: Bituminous Coal (PC) and
Natural gas to Electricity,” (Pittsburgh, PA: NETL, 2015). Advanced Research Projects Agency-Energy (ARPA-E),
“ARID Program Overview,” (Washington, DC: ARPA-E, 2016).

34
Government support has sought to address some of these tradeoffs. Through the Advanced Research in
Dry Cooling (ARID) program, ARPA-E has invested about $30 million to advance dry cooling
technologies. The program aims to develop dry cooling technologies that do not consume any water,
eliminate efficiency penalties, and do not increase the levelized cost of electricity cost by more than 5
percent. Reaching this target would allow for reduced water use for cooling without an additional
efficiency penalty. In addition, DOE has supported designs for advanced nuclear reactors that use molten
salt rather than water as a cooling fluid.
2.4 Summary and Conclusion
Thermoelectric generation requires significant water use for operation, as do associated technologies such
as CCS. Advanced technologies have potential to decrease these water demands substantially. Increased
deployment of dry and hybrid cooling technologies can reduce or eliminate cooling water demands.
Further deployment of wet-recirculating systems can greatly reduce water withdrawal relative to once-
through cooling, but can increase water consumption. Improved cooling system operations can also
reduce water demands, as can more advanced CCS technologies.
A changing generation mix resulting from policy and technology drivers can reduce GHG emissions and
water use, but some technology deployment scenarios such as high nuclear, CCS, and dry cooling can
create tradeoffs among energy, water, and GHG goals that must be considered and balanced. These and
other issues can be addressed in region-specific analytical tools to inform decisions such as water
management, energy facility siting, and technology selection.
35
Chapter 3. Hydropower U.S. hydropoweri has the ability to provide both flexible, zero-GHG generation and a suite of ancillary
services for the evolving modern electric grid, but policy constraints, high cost, and valuation challenges
have in some cases limited its provision of these services. Hydropower is unique in that, more than other
generation types, its siting and operations are tightly intertwined with competing non-energy goals such
as providing ecosystem services, navigation, flood control, agriculture, and recreation. Such non-energy
constraints can in some cases limit the ability of existing hydropower to provide flexibility and ancillary
services even when it is technically capable of providing them. Ancillary services markets offer additional
potential revenue streams for hydropower, but complexities in valuation and market rules can present
challenges.
3.1 Key Characteristics of Hydropower
Hydropower comprises a significant share of electricity generation and depends on water to operate.
Although the process of hydropower generation itself does not technically withdraw or consume water,
hydropower requires suitable water to be available for electricity generation. Furthermore, the significant
government ownership of dams used for hydropower can have operational as well as budgetary
implications.
3.1.1 Hydropower Classification
Hydropower generation is often divided into two categories: conventional hydroelectric and hydroelectric
pumped storage.23 Most large conventional hydroelectric plants utilize dammed reservoirs in river
systems to drive generating turbines; generating capacity increases linearly with the height of the
reservoir (“hydraulic head”) and the available flow. These types of plants are referred to as impoundment
hydroelectric plants. Other conventional hydroelectric plants can be “run-of-river” plants, also known as
diversion plants, which tend to be smaller in generating capacity and have no large storage reservoir,
instead relying directly on natural river flow to drive generating turbines.
Hydroelectric pumped storage plants generate electricity in a similar fashion to impoundment
hydroelectric plants, but they are in addition able to reverse their turbines to pump water upward into a
storage reservoir, thereby storing electricity. Pumped storage plants can be either open-loop, meaning that
they require connection to natural water flow to operate, or closed-loop, meaning that they can reuse
water to operate without significant connection to natural water flow. Combinations of pumped storage
and hydroelectric plants in the same location are also possible, and indeed, sufficiently large
impoundment hydroelectric plants can serve a similar function to pumped storage by storing water and
thus deferring generation until it is needed.
3.1.2 Hydropower Generating Capacity
Hydroelectricity in 2015 accounted for about 6 percent of total U.S. electricity generation.24 Net summer
capacity of conventional hydroelectric generation in the U.S. was 79.7 GW in 2015, accounting for 7.5
percent of total utility-scale capacity from all energy sources.25 Net summer capacity for hydroelectric
pumped storage was 22.6 GW, or 2.1 percent of total generating capacity.26 Pumped storage can be
alternately viewed as either generating capacity or electricity storage capacity. From the storage
perspective, pumped storage accounts for about 98 percent of all utility-scale grid storage in the U.S.,
with the remaining 2 percent made up of batteries, compressed air, and flywheels.27 A given hydroelectric
i The term “hydropower” in this report includes both conventional hydroelectric plants and hydroelectric pumped
storage, which will be distinguished when necessary.
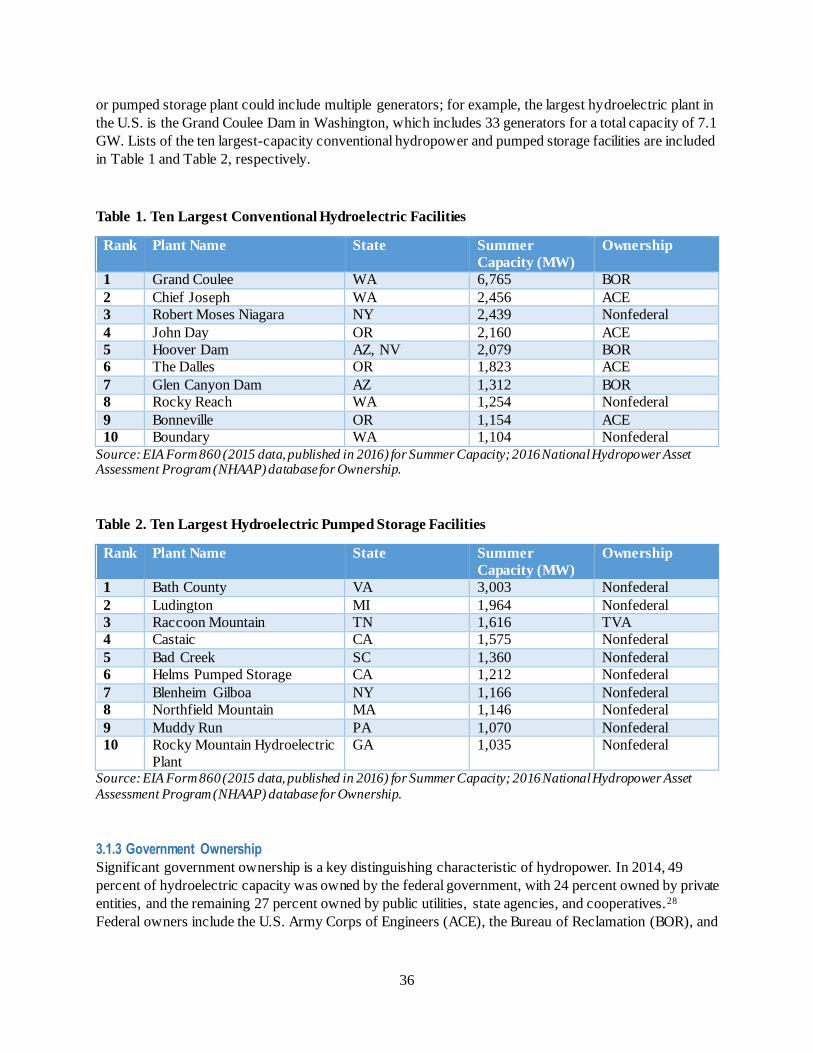
36
or pumped storage plant could include multiple generators; for example, the largest hydroelectric plant in
the U.S. is the Grand Coulee Dam in Washington, which includes 33 generators for a total capacity of 7.1
GW. Lists of the ten largest-capacity conventional hydropower and pumped storage facilities are included
in Table 1 and Table 2, respectively.
Table 1. Ten Largest Conventional Hydroelectric Facilities
Rank Plant Name State Summer
Capacity (MW)
Ownership
1 Grand Coulee WA 6,765 BOR
2 Chief Joseph WA 2,456 ACE
3 Robert Moses Niagara NY 2,439 Nonfederal
4 John Day OR 2,160 ACE
5 Hoover Dam AZ, NV 2,079 BOR
6 The Dalles OR 1,823 ACE
7 Glen Canyon Dam AZ 1,312 BOR
8 Rocky Reach WA 1,254 Nonfederal
9 Bonneville OR 1,154 ACE
10 Boundary WA 1,104 Nonfederal
Source: EIA Form 860 (2015 data, published in 2016) for Summer Capacity; 2016 National Hydropower Asset Assessment Program (NHAAP) database for Ownership.
Table 2. Ten Largest Hydroelectric Pumped Storage Facilities
Rank Plant Name State Summer
Capacity (MW)
Ownership
1 Bath County VA 3,003 Nonfederal
2 Ludington MI 1,964 Nonfederal
3 Raccoon Mountain TN 1,616 TVA
4 Castaic CA 1,575 Nonfederal
5 Bad Creek SC 1,360 Nonfederal
6 Helms Pumped Storage CA 1,212 Nonfederal
7 Blenheim Gilboa NY 1,166 Nonfederal
8 Northfield Mountain MA 1,146 Nonfederal
9 Muddy Run PA 1,070 Nonfederal
10 Rocky Mountain Hydroelectric
Plant
GA 1,035 Nonfederal
Source: EIA Form 860 (2015 data, published in 2016) for Summer Capacity; 2016 National Hydropower Asset
Assessment Program (NHAAP) database for Ownership.
3.1.3 Government Ownership
Significant government ownership is a key distinguishing characteristic of hydropower. In 2014, 49
percent of hydroelectric capacity was owned by the federal government, with 24 percent owned by private
entities, and the remaining 27 percent owned by public utilities, state agencies, and cooperatives.28
Federal owners include the U.S. Army Corps of Engineers (ACE), the Bureau of Reclamation (BOR), and
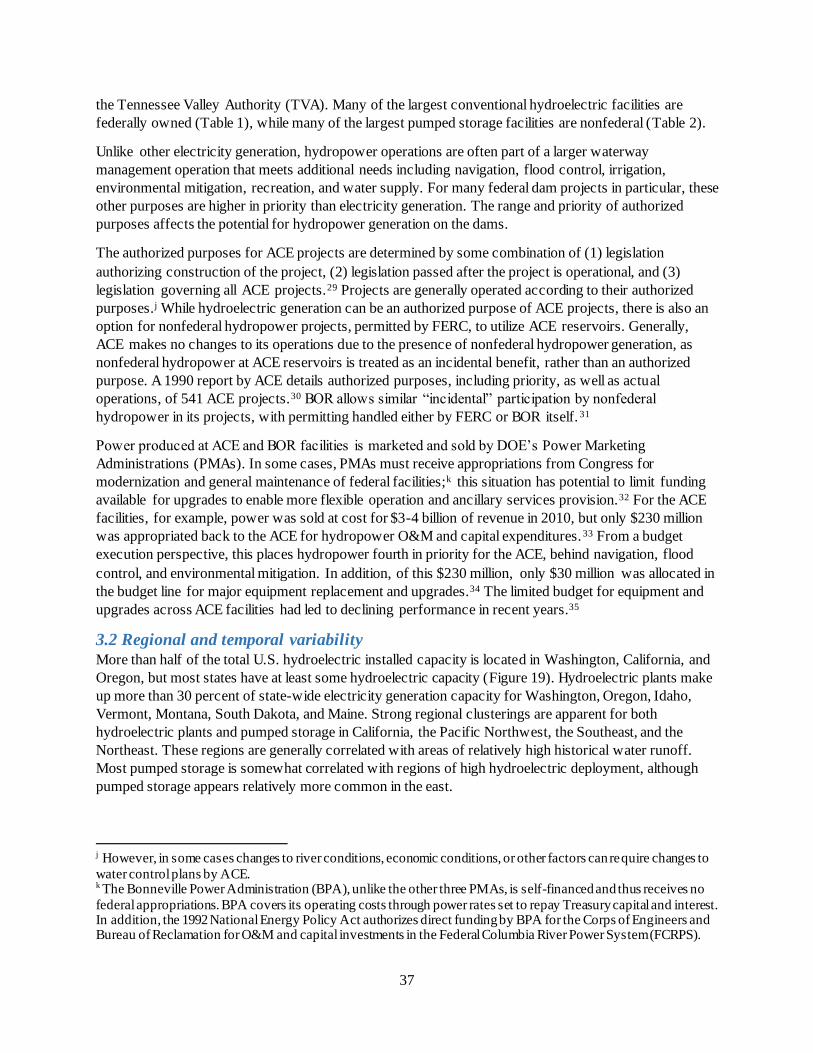
37
the Tennessee Valley Authority (TVA). Many of the largest conventional hydroelectric facilities are
federally owned (Table 1), while many of the largest pumped storage facilities are nonfederal (Table 2).
Unlike other electricity generation, hydropower operations are often part of a larger waterway
management operation that meets additional needs including navigation, flood control, irrigation,
environmental mitigation, recreation, and water supply. For many federal dam projects in particular, these
other purposes are higher in priority than electricity generation. The range and priority of authorized
purposes affects the potential for hydropower generation on the dams.
The authorized purposes for ACE projects are determined by some combination of (1) legislation
authorizing construction of the project, (2) legislation passed after the project is operational, and (3)
legislation governing all ACE projects.29 Projects are generally operated according to their authorized
purposes.j While hydroelectric generation can be an authorized purpose of ACE projects, there is also an
option for nonfederal hydropower projects, permitted by FERC, to utilize ACE reservoirs. Generally,
ACE makes no changes to its operations due to the presence of nonfederal hydropower generation, as
nonfederal hydropower at ACE reservoirs is treated as an incidental benefit, rather than an authorized
purpose. A 1990 report by ACE details authorized purposes, including priority, as well as actual
operations, of 541 ACE projects.30 BOR allows similar “incidental” participation by nonfederal
hydropower in its projects, with permitting handled either by FERC or BOR itself. 31
Power produced at ACE and BOR facilities is marketed and sold by DOE’s Power Marketing
Administrations (PMAs). In some cases, PMAs must receive appropriations from Congress for
modernization and general maintenance of federal facilities;k this situation has potential to limit funding
available for upgrades to enable more flexible operation and ancillary services provision.32 For the ACE
facilities, for example, power was sold at cost for $3-4 billion of revenue in 2010, but only $230 million
was appropriated back to the ACE for hydropower O&M and capital expenditures.33 From a budget
execution perspective, this places hydropower fourth in priority for the ACE, behind navigation, flood
control, and environmental mitigation. In addition, of this $230 million, only $30 million was allocated in
the budget line for major equipment replacement and upgrades.34 The limited budget for equipment and
upgrades across ACE facilities had led to declining performance in recent years.35
3.2 Regional and temporal variability
More than half of the total U.S. hydroelectric installed capacity is located in Washington, California, and
Oregon, but most states have at least some hydroelectric capacity (Figure 19). Hydroelectric plants make
up more than 30 percent of state-wide electricity generation capacity for Washington, Oregon, Idaho,
Vermont, Montana, South Dakota, and Maine. Strong regional clusterings are apparent for both
hydroelectric plants and pumped storage in California, the Pacific Northwest, the Southeast, and the
Northeast. These regions are generally correlated with areas of relatively high historical water runoff.
Most pumped storage is somewhat correlated with regions of high hydroelectric deployment, although
pumped storage appears relatively more common in the east.
j However, in some cases changes to river conditions, economic conditions, or other factors can require changes to
water control plans by ACE. k The Bonneville Power Administration (BPA), unlike the other three PMAs, is self-financed and thus receives no
federal appropriations. BPA covers its operating costs through power rates set to repay Treasury capital and interest. In addition, the 1992 National Energy Policy Act authorizes direct funding by BPA for the Corps of Engineers and Bureau of Reclamation for O&M and capital investments in the Federal Columbia River Power System (FCRPS).
38
Figure 19. Location of hydropower in the U.S.
Strong regional clusterings are apparent in California, the Northwest, and the Southeast.
Data source: EIA. Hydroelectric power resources form regional clusters. Today in Energy. 2011.
Figure 20. Long-run monthly hydropower capacity factor for plants built before 1970 Capacity factor varies by year, but a downward trend is apparent.
Data: EIA Form 920/921/923 Figure: 2014 Hydropower Market Report
Nationally, there has been a slow downward trend in hydropower capacity factor since the 1970’s (Figure
20). The factors contributing to this downward trend include some combination of changes in operational
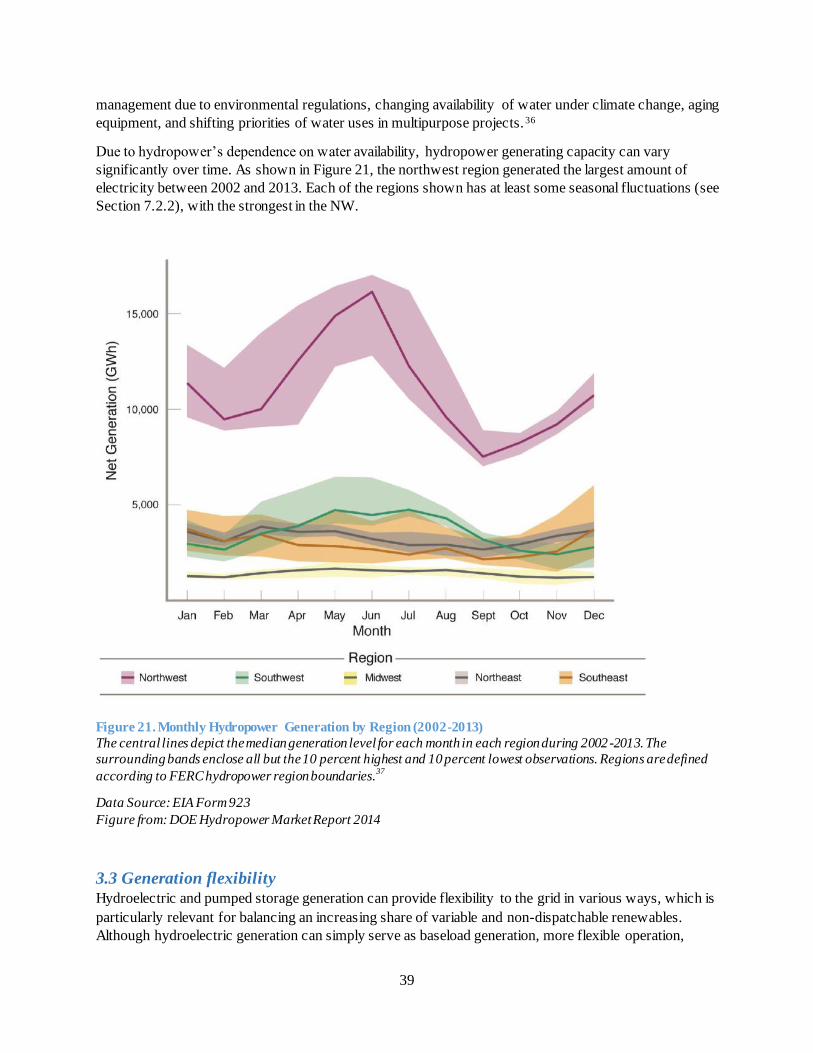
39
management due to environmental regulations, changing availability of water under climate change, aging
equipment, and shifting priorities of water uses in multipurpose projects.36
Due to hydropower’s dependence on water availability, hydropower generating capacity can vary
significantly over time. As shown in Figure 21, the northwest region generated the largest amount of
electricity between 2002 and 2013. Each of the regions shown has at least some seasonal fluctuations (see
Section 7.2.2), with the strongest in the NW.
Figure 21. Monthly Hydropower Generation by Region (2002-2013)
The central lines depict the median generation level for each month in each region during 2002-2013. The
surrounding bands enclose all but the 10 percent highest and 10 percent lowest observations. Regions are defined
according to FERC hydropower region boundaries.37
Data Source: EIA Form 923
Figure from: DOE Hydropower Market Report 2014
3.3 Generation flexibility Hydroelectric and pumped storage generation can provide flexibility to the grid in various ways, which is
particularly relevant for balancing an increasing share of variable and non-dispatchable renewables.
Although hydroelectric generation can simply serve as baseload generation, more flexible operation,
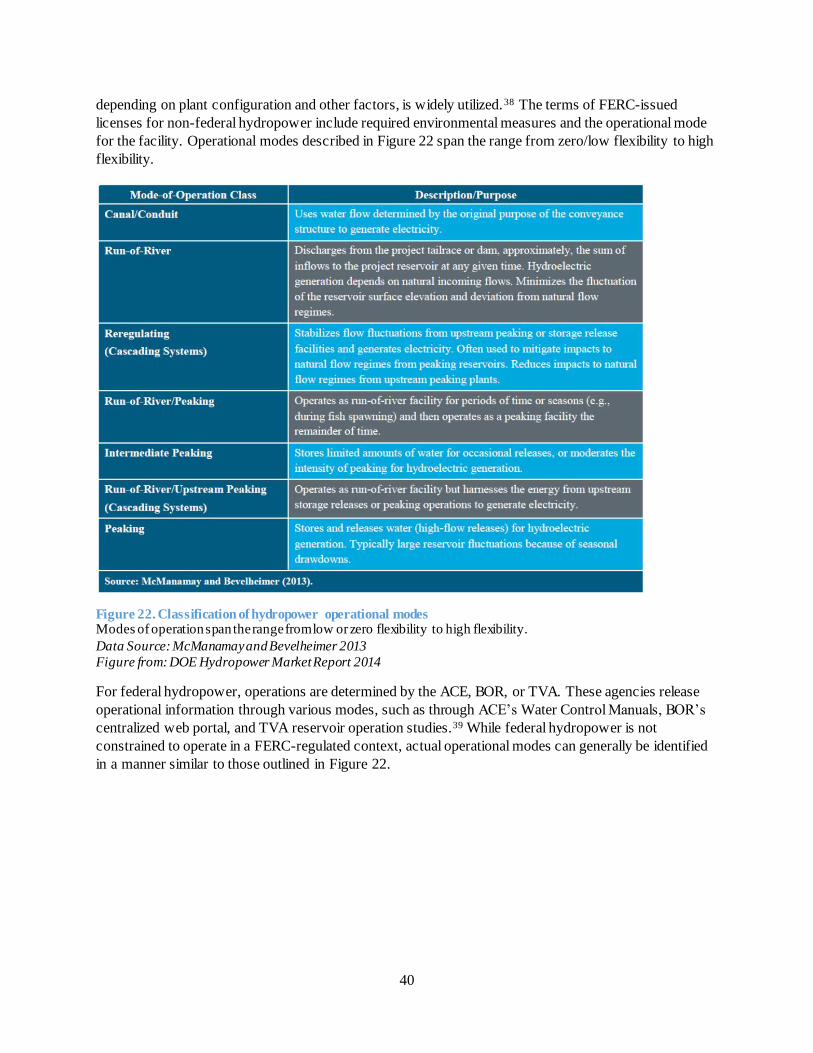
40
depending on plant configuration and other factors, is widely utilized.38 The terms of FERC-issued
licenses for non-federal hydropower include required environmental measures and the operational mode
for the facility. Operational modes described in Figure 22 span the range from zero/low flexibility to high
flexibility.
Figure 22. Classification of hydropower operational modes Modes of operation span the range from low or zero flexibility to high flexibility.
Data Source: McManamay and Bevelheimer 2013
Figure from: DOE Hydropower Market Report 2014
For federal hydropower, operations are determined by the ACE, BOR, or TVA. These agencies release
operational information through various modes, such as through ACE’s Water Control Manuals, BOR’s
centralized web portal, and TVA reservoir operation studies.39 While federal hydropower is not
constrained to operate in a FERC-regulated context, actual operational modes can generally be identified
in a manner similar to those outlined in Figure 22.
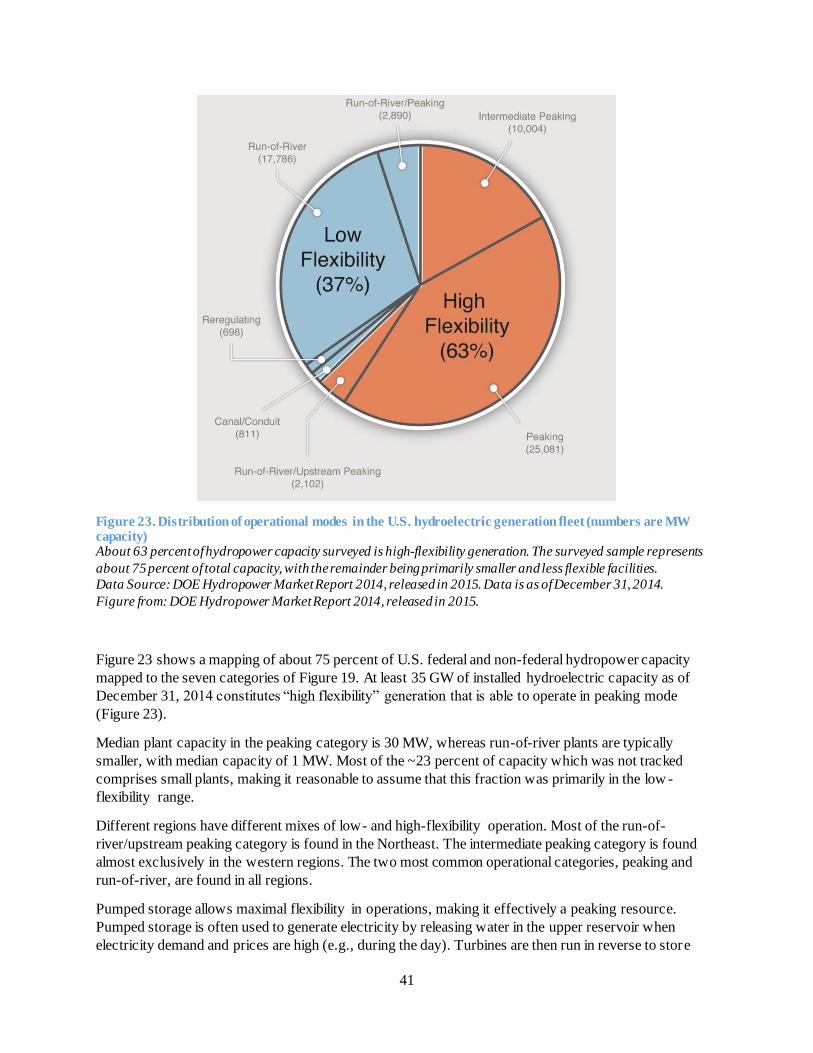
41
Figure 23. Distribution of operational modes in the U.S. hydroelectric generation fleet (numbers are MW capacity) About 63 percent of hydropower capacity surveyed is high-flexibility generation. The surveyed sample represents
about 75 percent of total capacity, with the remainder being primarily smaller and less flexible facilities.
Data Source: DOE Hydropower Market Report 2014, released in 2015. Data is as of December 31, 2014.
Figure from: DOE Hydropower Market Report 2014, released in 2015.
Figure 23 shows a mapping of about 75 percent of U.S. federal and non-federal hydropower capacity
mapped to the seven categories of Figure 19. At least 35 GW of installed hydroelectric capacity as of
December 31, 2014 constitutes “high flexibility” generation that is able to operate in peaking mode
(Figure 23).
Median plant capacity in the peaking category is 30 MW, whereas run-of-river plants are typically
smaller, with median capacity of 1 MW. Most of the ~23 percent of capacity which was not tracked
comprises small plants, making it reasonable to assume that this fraction was primarily in the low -
flexibility range.
Different regions have different mixes of low- and high-flexibility operation. Most of the run-of-
river/upstream peaking category is found in the Northeast. The intermediate peaking category is found
almost exclusively in the western regions. The two most common operational categories, peaking and
run-of-river, are found in all regions.
Pumped storage allows maximal flexibility in operations, making it effectively a peaking resource.
Pumped storage is often used to generate electricity by releasing water in the upper reservoir when
electricity demand and prices are high (e.g., during the day). Turbines are then run in reverse to store

42
electricity when demand and prices are low (e.g., at night). Often, plants will begin to release water and
generate electricity once the sale price is high enough to cover their pumping losses. This strategy for
smoothing out demand and generating revenue through arbitrage is known as “peak-shaving.”
The existing fleet of pumped storage plants was built primarily in the 1960s through the 1980s to
complement nuclear and other thermoelectric baseload generation. However, pumped storage is well-
suited to balance an increasing penetration of variable renewables, particularly with increasing
retirements of older nuclear and thermoelectric plants. Closed-loop pumped storage plants are particularly
suitable for flexible operations because they are less constrained by environmental regulations than open-
loop plants.
3.4 Ancillary services
Both hydroelectric and pumped storage plants are technically capable of providing a variety of ancillary
services, which may become increasingly valuable as variable generation grows.40 In the Western
Electricity Coordinating Council region, for example, hydropower is a major source of inertia and
primary frequency response, but hydropower is not specifically compensated for either service.41 Figure
24 gives definitions of ancillary services relevant to hydropower.
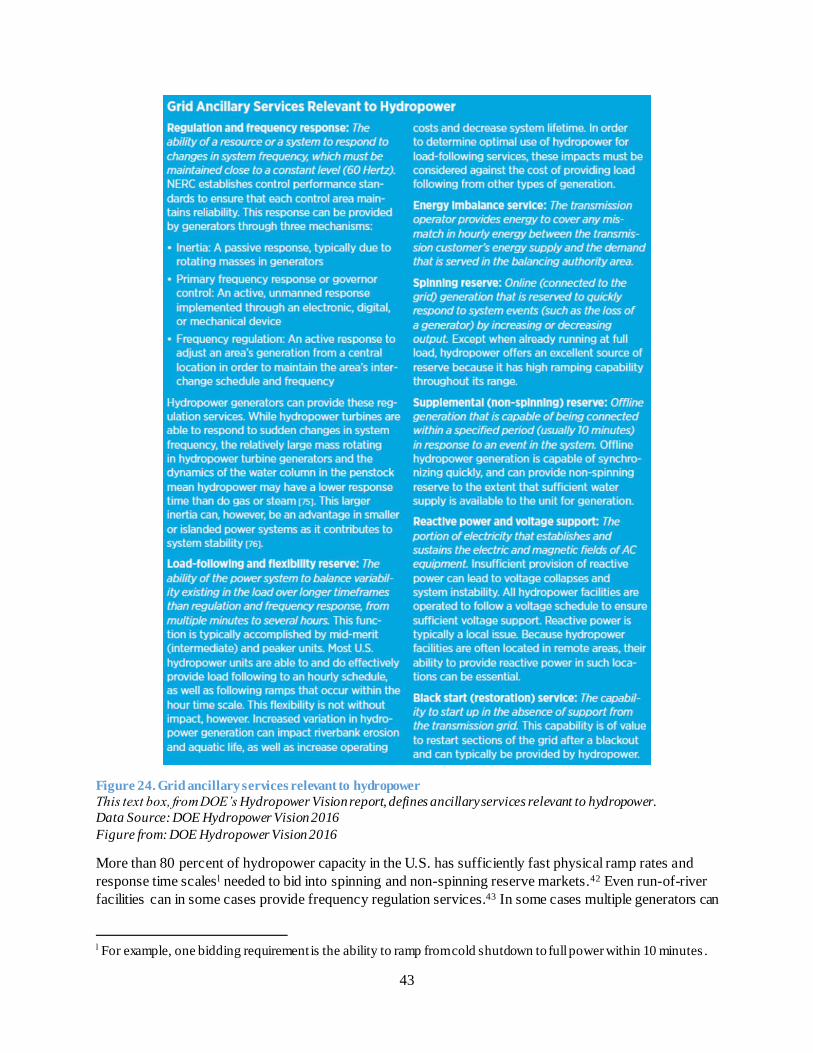
43
Figure 24. Grid ancillary services relevant to hydropower
This text box, from DOE’s Hydropower Vision report, defines ancillary services relevant to hydropower.
Data Source: DOE Hydropower Vision 2016
Figure from: DOE Hydropower Vision 2016
More than 80 percent of hydropower capacity in the U.S. has sufficiently fast physical ramp rates and
response time scalesl needed to bid into spinning and non-spinning reserve markets.42 Even run-of-river
facilities can in some cases provide frequency regulation services.43 In some cases multiple generators can
l For example, one bidding requirement is the ability to ramp from cold shutdown to full power within 10 minutes .
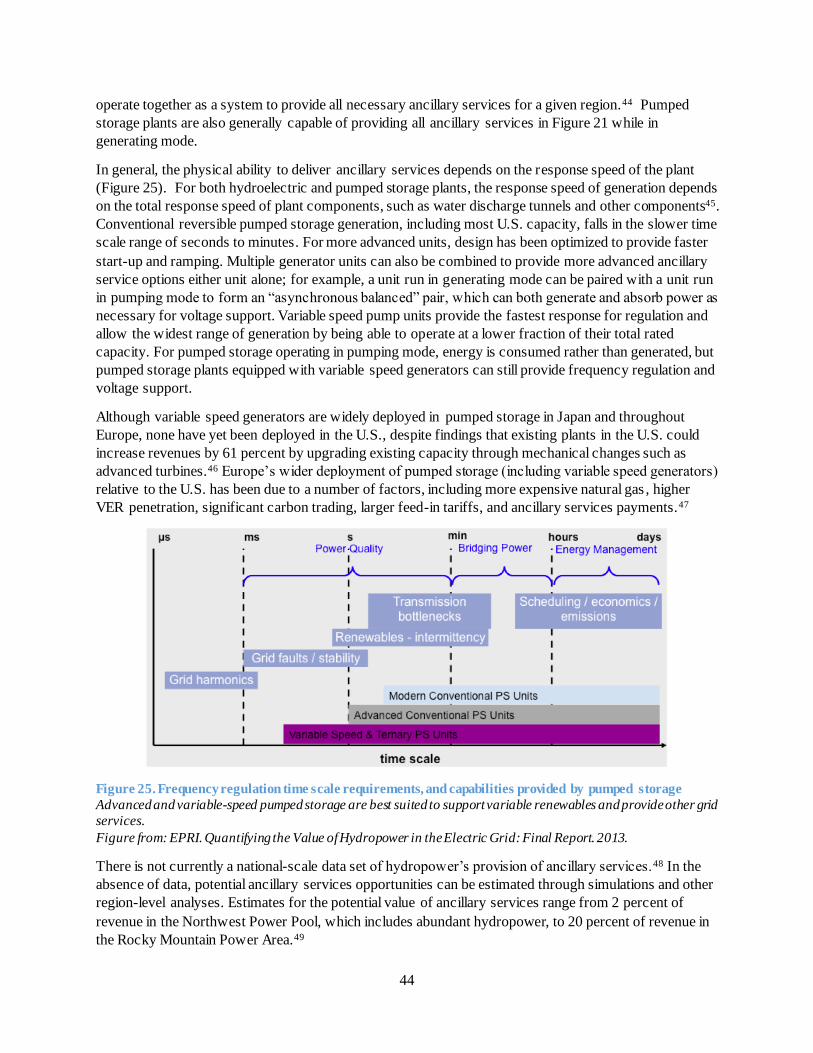
44
operate together as a system to provide all necessary ancillary services for a given region.44 Pumped
storage plants are also generally capable of providing all ancillary services in Figure 21 while in
generating mode.
In general, the physical ability to deliver ancillary services depends on the response speed of the plant
(Figure 25). For both hydroelectric and pumped storage plants, the response speed of generation depends
on the total response speed of plant components, such as water discharge tunnels and other components45.
Conventional reversible pumped storage generation, including most U.S. capacity, falls in the slower time
scale range of seconds to minutes. For more advanced units, design has been optimized to provide faster
start-up and ramping. Multiple generator units can also be combined to provide more advanced ancillary
service options either unit alone; for example, a unit run in generating mode can be paired with a unit run
in pumping mode to form an “asynchronous balanced” pair, which can both generate and absorb power as
necessary for voltage support. Variable speed pump units provide the fastest response for regulation and
allow the widest range of generation by being able to operate at a lower fraction of their total rated
capacity. For pumped storage operating in pumping mode, energy is consumed rather than generated, but
pumped storage plants equipped with variable speed generators can still provide frequency regulation and
voltage support.
Although variable speed generators are widely deployed in pumped storage in Japan and throughout
Europe, none have yet been deployed in the U.S., despite findings that existing plants in the U.S. could
increase revenues by 61 percent by upgrading existing capacity through mechanical changes such as
advanced turbines.46 Europe’s wider deployment of pumped storage (including variable speed generators)
relative to the U.S. has been due to a number of factors, including more expensive natural gas , higher
VER penetration, significant carbon trading, larger feed-in tariffs, and ancillary services payments.47
Figure 25. Frequency regulation time scale requirements, and capabilities provided by pumped storage
Advanced and variable-speed pumped storage are best suited to support variable renewables and provide other grid
services.
Figure from: EPRI. Quantifying the Value of Hydropower in the Electric Grid: Final Report. 2013.
There is not currently a national-scale data set of hydropower’s provision of ancillary services.48 In the
absence of data, potential ancillary services opportunities can be estimated through simulations and other
region-level analyses. Estimates for the potential value of ancillary services range from 2 percent of
revenue in the Northwest Power Pool, which includes abundant hydropower, to 20 percent of revenue in
the Rocky Mountain Power Area.49
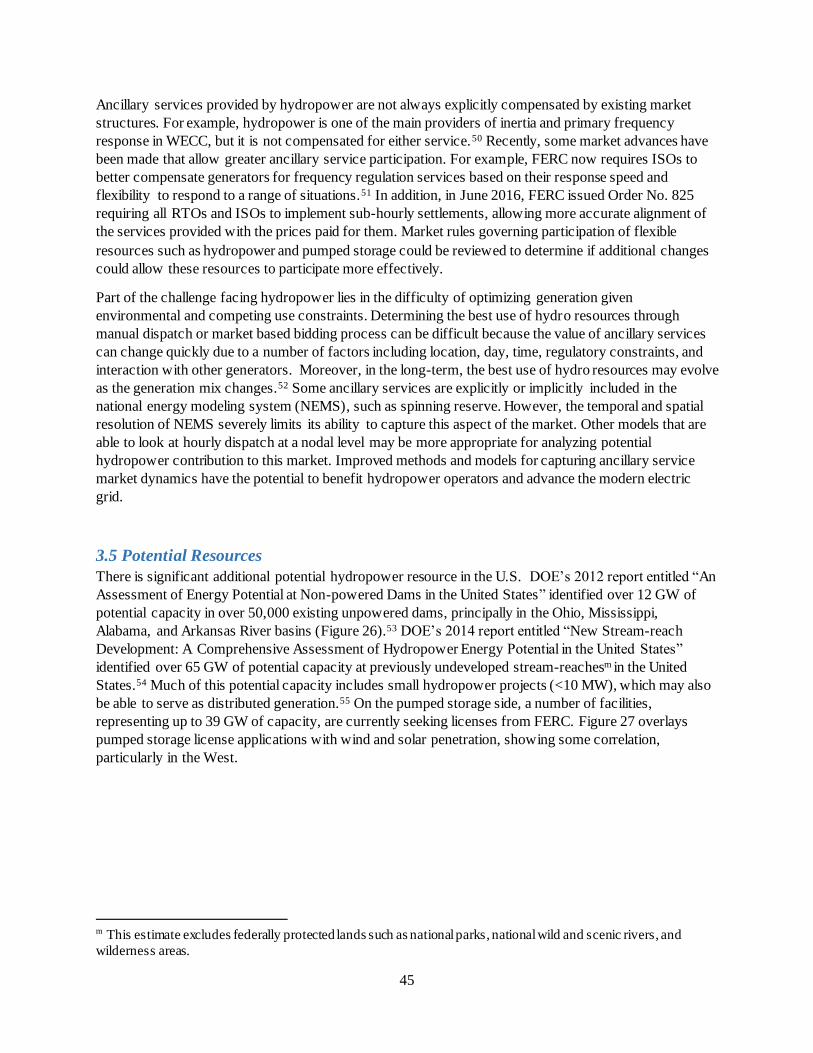
45
Ancillary services provided by hydropower are not always explicitly compensated by existing market
structures. For example, hydropower is one of the main providers of inertia and primary frequency
response in WECC, but it is not compensated for either service.50 Recently, some market advances have
been made that allow greater ancillary service participation. For example, FERC now requires ISOs to
better compensate generators for frequency regulation services based on their response speed and
flexibility to respond to a range of situations.51 In addition, in June 2016, FERC issued Order No. 825
requiring all RTOs and ISOs to implement sub-hourly settlements, allowing more accurate alignment of
the services provided with the prices paid for them. Market rules governing participation of flexible
resources such as hydropower and pumped storage could be reviewed to determine if additional changes
could allow these resources to participate more effectively.
Part of the challenge facing hydropower lies in the difficulty of optimizing generation given
environmental and competing use constraints. Determining the best use of hydro resources through
manual dispatch or market based bidding process can be difficult because the value of ancillary services
can change quickly due to a number of factors including location, day, time, regulatory constraints, and
interaction with other generators. Moreover, in the long-term, the best use of hydro resources may evolve
as the generation mix changes.52 Some ancillary services are explicitly or implicitly included in the
national energy modeling system (NEMS), such as spinning reserve. However, the temporal and spatial
resolution of NEMS severely limits its ability to capture this aspect of the market. Other models that are
able to look at hourly dispatch at a nodal level may be more appropriate for analyzing potential
hydropower contribution to this market. Improved methods and models for capturing ancillary service
market dynamics have the potential to benefit hydropower operators and advance the modern electric
grid.
3.5 Potential Resources
There is significant additional potential hydropower resource in the U.S. DOE’s 2012 report entitled “An
Assessment of Energy Potential at Non-powered Dams in the United States” identified over 12 GW of
potential capacity in over 50,000 existing unpowered dams, principally in the Ohio, Mississippi,
Alabama, and Arkansas River basins (Figure 26).53 DOE’s 2014 report entitled “New Stream-reach
Development: A Comprehensive Assessment of Hydropower Energy Potential in the United States”
identified over 65 GW of potential capacity at previously undeveloped stream-reachesm in the United
States.54 Much of this potential capacity includes small hydropower projects (<10 MW), which may also
be able to serve as distributed generation.55 On the pumped storage side, a number of facilities,
representing up to 39 GW of capacity, are currently seeking licenses from FERC. Figure 27 overlays
pumped storage license applications with wind and solar penetration, showing some correlation,
particularly in the West.
m This estimate excludes federally protected lands such as national parks, national wild and scenic rivers, and
wilderness areas.
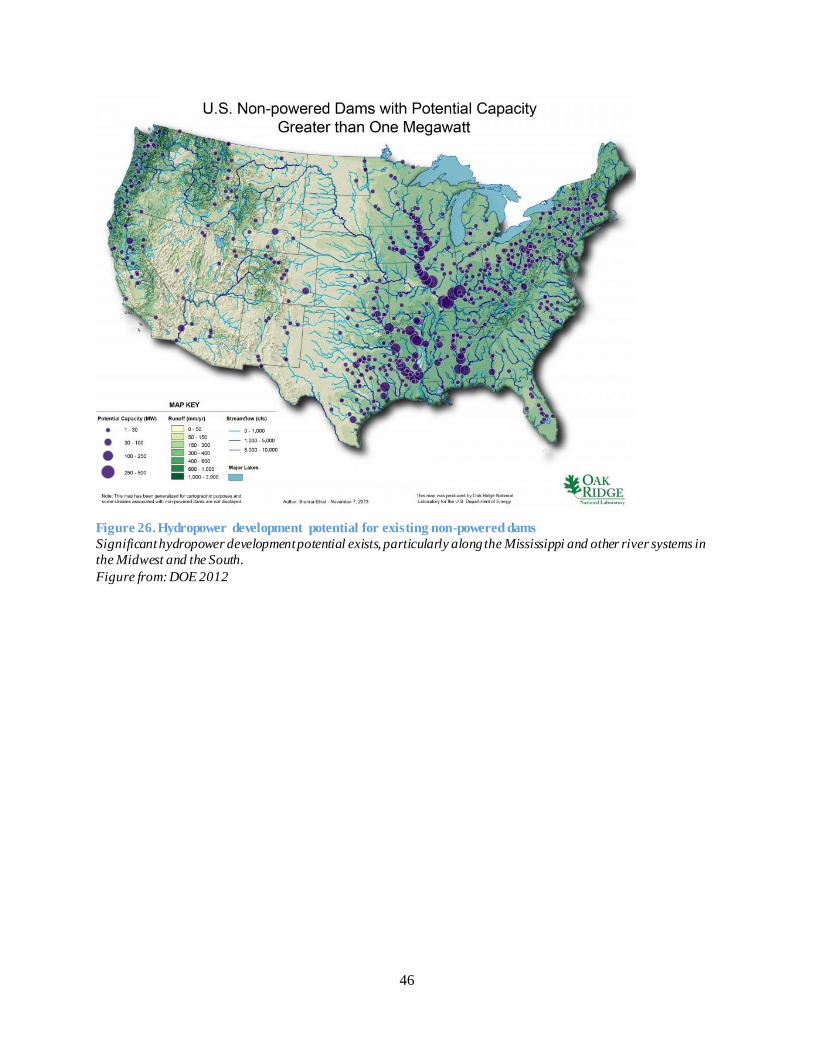
46
Figure 26. Hydropower development potential for existing non-powered dams
Significant hydropower development potential exists, particularly along the Mississippi and other river systems in
the Midwest and the South.
Figure from: DOE 2012
47
Figure 27. Pumped hydropower storage application status and wind and solar penetration.
Most pumped storage permits are located in the West, and in some cases overlap with areas of high wind and solar
penetration. Pending Permit and Issued Permit categories refer to permits for an initial feasibility study. These
categories have high attrition rates. Pending Application refers to an applicant that has applied for a license to
operate. Issued Authorization means that the applicant has received a license to operate. Note, however, that
holding a license does not guarantee construction of a plant.
Figure from: DOE Hydropower Market Report 2014
As discussed in Section 3.3 and 3.4, there has been renewed interest in recent years in using pumped
storage to balance variable renewables. FERC permit and license applications for new pumped storage
facilities have trended toward configurations that can enable greater flexibility and ancillary services
provision. Of the 51 projects in the development pipeline as of December 2014 (including pending
permits, issued permits, pending applications, and issued authorizations), 33 are closed-loop.56 Closed-
loop plants are more capital-intensive than open-loop plants, but they may be more capable of providing
flexible generation and ancillary services because they are separated from natural water bodies and thus
face fewer environmental constraints in their operations. In addition, 9 of these 51 projects list adjustable-
speed turbines as the planned technology, which can enable frequency regulation and provision of other
ancillary services. While a designation of planned turbine technology on a preliminary permit is very
tentative, nevertheless these applications demonstrate interest in more flexible operation.57
For pumped storage plants in particular, the decision to develop new projects or add capacity to existing
projects will continue to be strongly site-specific. Only particular geographies are appropriate for siting,
such as areas that include a high reservoir that is naturally separate from a lower reservoir. Appropriate
geographies must also be feasible to develop based on environmental and other land- and water-use
considerations.

48
3.6 Summary and Conclusion
The current hydropower fleet is capable of providing significant grid flexibility and ancillary services to
balance variable energy resources, but it may be discouraged from doing so due to low budgets for
upgrading technology at federal facilities, regulatory constraints on nonfederal facilities, and limited
market valuation of ancillary services. Hydropower’s heavy government ownership together with the
multipurpose nature of many large federal dams can create challenges associated with modernizing the
federal hydropower fleet, but on the other hand, many hydropower opportunities fall within the federal
domain. Adding hydropower capacity to existing dams, upgrading equipment for greater flexibility, and
siting new pumped storage facilities are potential opportunities for improving hydropower’s contributions
to the modern electricity system.
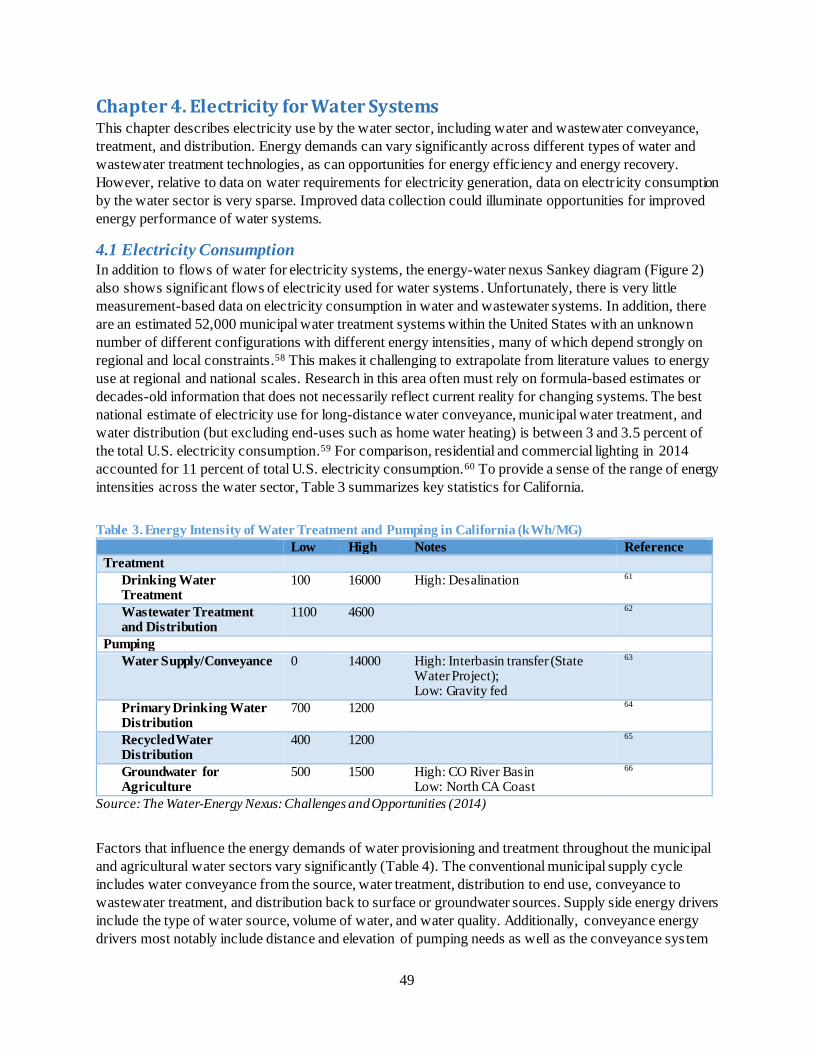
49
Chapter 4. Electricity for Water Systems This chapter describes electricity use by the water sector, including water and wastewater conveyance,
treatment, and distribution. Energy demands can vary significantly across different types of water and
wastewater treatment technologies, as can opportunities for energy efficiency and energy recovery.
However, relative to data on water requirements for electricity generation, data on electricity consumption
by the water sector is very sparse. Improved data collection could illuminate opportunities for improved
energy performance of water systems.
4.1 Electricity Consumption
In addition to flows of water for electricity systems, the energy-water nexus Sankey diagram (Figure 2)
also shows significant flows of electricity used for water systems. Unfortunately, there is very little
measurement-based data on electricity consumption in water and wastewater systems. In addition, there
are an estimated 52,000 municipal water treatment systems within the United States with an unknown
number of different configurations with different energy intensities, many of which depend strongly on
regional and local constraints.58 This makes it challenging to extrapolate from literature values to energy
use at regional and national scales. Research in this area often must rely on formula-based estimates or
decades-old information that does not necessarily reflect current reality for changing systems. The best
national estimate of electricity use for long-distance water conveyance, municipal water treatment, and
water distribution (but excluding end-uses such as home water heating) is between 3 and 3.5 percent of
the total U.S. electricity consumption.59 For comparison, residential and commercial lighting in 2014
accounted for 11 percent of total U.S. electricity consumption.60 To provide a sense of the range of energy
intensities across the water sector, Table 3 summarizes key statistics for California.
Table 3. Energy Intensity of Water Treatment and Pumping in California (kWh/MG)
Low High Notes Reference
Treatment
Drinking Water Treatment
100 16000 High: Desalination 61
Wastewater Treatment and Distribution
1100 4600 62
Pumping
Water Supply/Conveyance 0 14000 High: Interbasin transfer (State Water Project); Low: Gravity fed
63
Primary Drinking Water Distribution
700 1200 64
Recycled Water Distribution
400 1200 65
Groundwater for Agriculture
500 1500 High: CO River Basin Low: North CA Coast
66
Source: The Water-Energy Nexus: Challenges and Opportunities (2014)
Factors that influence the energy demands of water provisioning and treatment throughout the municipal
and agricultural water sectors vary significantly (Table 4). The conventional municipal supply cycle
includes water conveyance from the source, water treatment, distribution to end use, conveyance to
wastewater treatment, and distribution back to surface or groundwater sources. Supply side energy drivers
include the type of water source, volume of water, and water quality. Additionally, conveyance energy
drivers most notably include distance and elevation of pumping needs as well as the conveyance sys tem
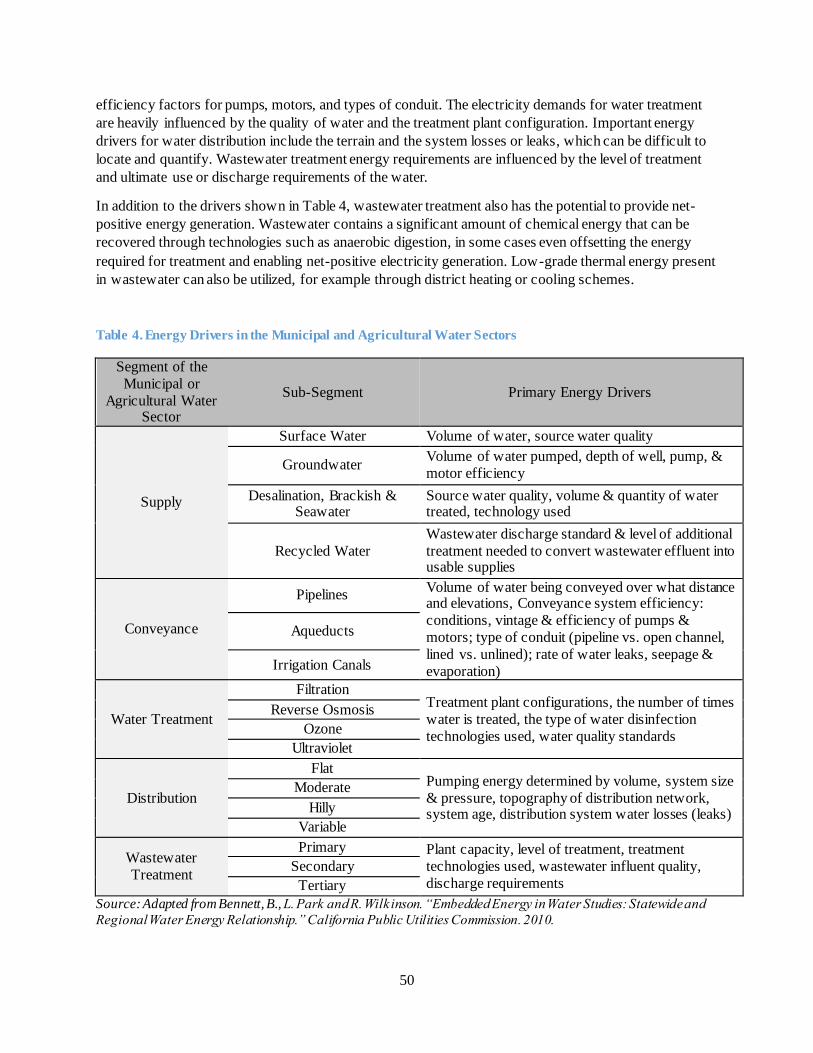
50
efficiency factors for pumps, motors, and types of conduit. The electricity demands for water treatment
are heavily influenced by the quality of water and the treatment plant configuration. Important energy
drivers for water distribution include the terrain and the system losses or leaks, which can be difficult to
locate and quantify. Wastewater treatment energy requirements are influenced by the level of treatment
and ultimate use or discharge requirements of the water.
In addition to the drivers shown in Table 4, wastewater treatment also has the potential to provide net-
positive energy generation. Wastewater contains a significant amount of chemical energy that can be
recovered through technologies such as anaerobic digestion, in some cases even offsetting the energy
required for treatment and enabling net-positive electricity generation. Low-grade thermal energy present
in wastewater can also be utilized, for example through district heating or cooling schemes.
Table 4. Energy Drivers in the Municipal and Agricultural Water Sectors
Segment of the
Municipal or
Agricultural Water Sector
Sub-Segment Primary Energy Drivers
Supply
Surface Water Volume of water, source water quality
Groundwater Volume of water pumped, depth of well, pump, &
motor efficiency
Desalination, Brackish & Seawater
Source water quality, volume & quantity of water treated, technology used
Recycled Water
Wastewater discharge standard & level of additional
treatment needed to convert wastewater effluent into usable supplies
Conveyance
Pipelines Volume of water being conveyed over what distance and elevations, Conveyance system efficiency:
conditions, vintage & efficiency of pumps &
motors; type of conduit (pipeline vs. open channel,
lined vs. unlined); rate of water leaks, seepage &
evaporation)
Aqueducts
Irrigation Canals
Water Treatment
Filtration Treatment plant configurations, the number of times
water is treated, the type of water disinfection
technologies used, water quality standards
Reverse Osmosis
Ozone
Ultraviolet
Distribution
Flat Pumping energy determined by volume, system size
& pressure, topography of distribution network, system age, distribution system water losses (leaks)
Moderate
Hilly
Variable
Wastewater
Treatment
Primary Plant capacity, level of treatment, treatment
technologies used, wastewater influent quality,
discharge requirements
Secondary
Tertiary
Source: Adapted from Bennett, B., L. Park and R. Wilkinson. “Embedded Energy in Water Studies: Statewide and
Regional Water Energy Relationship.” California Public Utilities Commission. 2010.
51
4.2 Water and wastewater treatment
Water and wastewater treatment processes consume significant amounts of energy.67 68 Even freshwater
sources rarely meet drinking water standards under the Safe Drinking Water Act without some form of
treatment. According to some estimates, national energy demand for water and wastewater treatment
increased by more than 30 percent between 1996 and 2013.69 These increases are due primarily to
increases in population (about 17 percent) and more stringent water quality regulations. Irrigation for
agriculture, inputs for aquaculture, supplies for livestock watering, and cooling sources for power plants
can also require treatment. These uses have different water quality needs, which may correspond to
different energy requirements for treatment.70
Energy intensity of treatment also depends on the source of the water. Generally, treatment of water that
is either high in salinity—such as seawater, or produced water from some oil and gas operations—or
contains large amounts of organic material—such as municipal wastewater—has relatively high energy
requirements.71 Thus, as more nontraditionaln types of water are used, the associated energy requirements
will generally increase. Desalination can be one hundred times as energy-intensive as treatment of fresh
water (Table 3).72
4.2.1 Municipal treatment for drinking water
Conventional municipal water treatment for producing drinking water comprises about one percent of
national energy consumption.73 Although it represents only a small fraction of the total U.S. energy
requirements, electricity for water treatment can represent the largest single energy usage and expense for
a given municipality.74 75 In addition, the share of electricity required by water systems can have
significant regional variation.
Traditional drinking water treatment in the United States consists of four steps which include coagulation,
sedimentation, filtration, and disinfection. After treatment, water is pumped into a storage reservoir such
as a water tower where gravity can keep distribution lines pressurized before end use. Advanced treatment
options such as UV or ozone disinfection and membrane filtration are also being added to treatment
processes throughout the United States.
4.2.2 Desalination
Seawater and brackish water resources are widespread, and desalination has been practiced at commercial
scales for decades. Thermal methods such as multistage flash and multiple effect distillation are still
widely utilized in areas where energy is plentiful and fresh water is scarce, such as the Middle East.76
However, these technologies are energy-intensive. Reverse osmosis (RO) and nanofiltration (NF) have
emerged as the predominant technologies used in desalination operations in the United States, as they are
significantly less energy-intensive than traditional thermal techniques. Seawater reverse osmosis plants
generally consume between 3 and 4 kWh/m3 of water.77 78 This has decreased significantly over the last
40 years due to advances in technology, particularly through higher-permeability membranes, energy
recovery devices, and more efficient pumps. However, both capital and energy costs are still high, and
thus opportunities for improvement remain. In addition, brine discharge from desalination can cause
environmental impacts such as increased salinity of coastal waters, which may require more sophisticated
brine management strategies to mitigate.
Co-location of desalination plants with thermoelectric plants can provide an opportunity to reduce costs
and mitigate impacts of brine disposal. For example, the Carlsbad desalination plant, which began
n “Nontraditional” water refers generally to water sources other than surface freshwater, such as municipal
wastewater, brackish groundwater, seawater, produced water, etc.
52
operating in 2015 in Carlsbad, California, uses cooling water from the Encina Power Plant for its intake
supply.79 Two gallons of intake seawater are required for each gallon of potable water produced by the
Carlsbad plant; the remainder is concentrated brine that is diluted 5:1 with the post-condenser cooling
water from the Encina Power Plant before discharge. Co-location strategies such as this for electricity
generation and desalination can also reduce operational and permitting costs by allowing seawater intake
and discharge points to be shared.
Further opportunities exist for coupling desalination (or other wastewater treatment) with waste heat from
thermoelectric generating plants. For example, in the case of a forward osmosis/membrane distillation
combination, a properly scaled desalination operation could meet the vast majority of its energy needs via
unwanted steam from a thermoelectric plant. Additionally, productive use of waste heat decreases power
plant cooling requirements.
Brackish groundwater is also an important resource in water-scarce regions. Depending on initial salinity,
brine management requirements, and other factors, brackish groundwater may require less energy to
desalinate than seawater. Additionally, produced waters from oil and gas, geothermal electricity
generation, and potentially CCS operations have a range of salinities. Beneficial use of these waters
presents a significant opportunity that will be made more attractive with cost and energy-efficient
desalination solutions. Finally, the heat, pressure, and salinity available in produced waters from energy
operations constitute potential energy resources that could be used either to generate electricity or reduce
the costs of in-situ desalination.
4.2.3 Wastewater treatment and energy recovery
Wastewater treatment requires significant energy, but in some cases the chemical and thermal energy
embedded in wastewater can be extracted to offset the energy needed for treatment.
Wastewater treatment is typically described in three stages: primary, secondary, and tertiary. Primary
treatment, also referred to as mechanical treatment, includes initial screens and sedimentation to remove
solids. Primary treatment is typically the least energy-intensive step, consuming about 0.02-0.37 kWh/m3
in developed countries.80 Secondary treatment involves the breakdown of dissolved organic matter not
removed in primary treatment by microbes, potentially including a range of biological processes, filters,
and settling tanks. Secondary treatment is more energy-intense than primary treatment, ranging from
0.30-2.1 kWh/m3 in developed countries.81 Tertiary treatment refers to any additional treatment beyond
secondary treatment, which can include additional chemical treatment, and ranges in energy intensity
from 0.40-3.8 kWh/m3 in developed countries.82
Although the vast majority of treated wastewater is discharged directly back into the environment, there is
increased interest in reuse of the wastewater with additional treatment. There are numerous technologies
used for the additional (tertiary) treatment of wastewater in the United States, and these technologies can
be highly energy-intensive. Case studies throughout the literature have shown a wide variety of energy
intensities (kWh/MG) for this additional wastewater treatment (Table 5). In all of these studies, the
source water prior to tertiary treatment had already undergone primary and secondary treatment.
Unfortunately, these remain simply estimates because they are derived from energy requirements for the
entire facility; it is therefore difficult to separate the energy demands for each element of the treatment
configuration. Energy use for wastewater tertiary treatment may also vary depending on the end use of the
recycled wastewater.
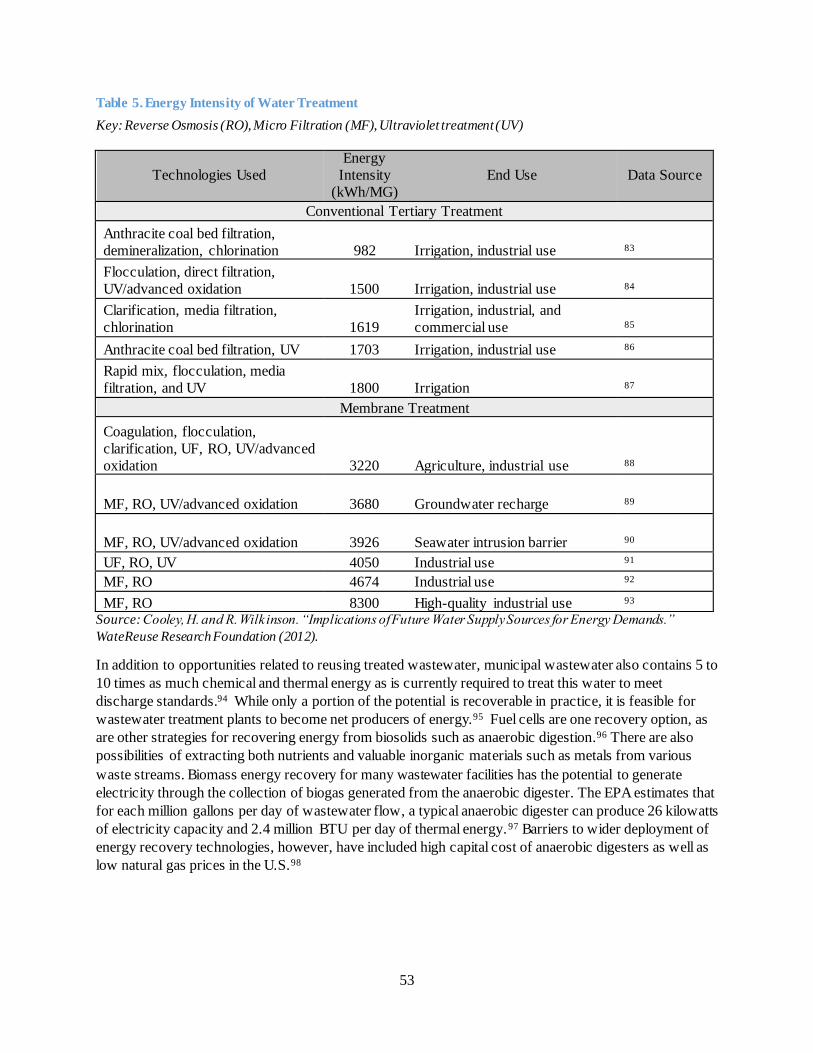
53
Table 5. Energy Intensity of Water Treatment
Key: Reverse Osmosis (RO), Micro Filtration (MF), Ultraviolet treatment (UV)
Technologies Used
Energy
Intensity
(kWh/MG)
End Use Data Source
Conventional Tertiary Treatment
Anthracite coal bed filtration,
demineralization, chlorination 982 Irrigation, industrial use 83
Flocculation, direct filtration,
UV/advanced oxidation 1500 Irrigation, industrial use 84
Clarification, media filtration,
chlorination 1619
Irrigation, industrial, and
commercial use 85
Anthracite coal bed filtration, UV 1703 Irrigation, industrial use 86
Rapid mix, flocculation, media
filtration, and UV 1800 Irrigation 87
Membrane Treatment
Coagulation, flocculation,
clarification, UF, RO, UV/advanced
oxidation 3220 Agriculture, industrial use 88
MF, RO, UV/advanced oxidation 3680 Groundwater recharge 89
MF, RO, UV/advanced oxidation 3926 Seawater intrusion barrier 90
UF, RO, UV 4050 Industrial use 91
MF, RO 4674 Industrial use 92
MF, RO 8300 High-quality industrial use 93 Source: Cooley, H. and R. Wilkinson. “Implications of Future Water Supply Sources for Energy Demands.”
WateReuse Research Foundation (2012).
In addition to opportunities related to reusing treated wastewater, municipal wastewater also contains 5 to
10 times as much chemical and thermal energy as is currently required to treat this water to meet
discharge standards.94 While only a portion of the potential is recoverable in practice, it is feasible for
wastewater treatment plants to become net producers of energy.95 Fuel cells are one recovery option, as
are other strategies for recovering energy from biosolids such as anaerobic digestion.96 There are also
possibilities of extracting both nutrients and valuable inorganic materials such as metals from various
waste streams. Biomass energy recovery for many wastewater facilities has the potential to generate
electricity through the collection of biogas generated from the anaerobic digester. The EPA estimates that
for each million gallons per day of wastewater flow, a typical anaerobic digester can produce 26 kilowatts
of electricity capacity and 2.4 million BTU per day of thermal energy.97 Barriers to wider deployment of
energy recovery technologies, however, have included high capital cost of anaerobic digesters as well as
low natural gas prices in the U.S.98
54
4.3 Water Conveyance
There are more than two million miles of water distribution pipelines in the United States in 2006.99
These pipelines utilize significant amounts of energy to operate the various pumps needed to transport
and pressurize water conveyance. This estimate includes the infrastructure from the source of water to the
end use but does not include the plumbing pipes within buildings. Additionally, this estimate does not
include the water conveyance infrastructure that carries water to agricultural and industrial sites outside of
the conventional municipal water treatment system.
Pumping for water conveyance also has a range of possible energy intensities, depending on the
configuration. The quantity of energy required for pumping primarily relates to elevation change. As
shown in Table 3, interbasin transfer can be an order of magnitude higher in energy intensity than local
distribution or groundwater pumping.
Energy efficiency in water conveyance has potential to be improved through development of standards.
For example, DOE has regulatory authority over pumps, including commercial and industrial water
pumps. In 2016, DOE finalized new energy conservation standards for pumps with compliance required
starting in 2020.o These standards could result in significant energy savings through minimum efficiency
standards. Moreover, requirements for compliance with these standards could have the ancillary benefit of
enhanced data collection on energy use by pumps.
4.4 Summary and Conclusion
Water conveyance, treatment, and distribution consume significant amounts of electricity. Opportunities
exist for improved energy efficiency in the water sector, as well as for energy recovery from wastewater.
Data on energy use by various processes and in various regions, however, is not collected in a centralized
way. Enhanced data collection on energy use by the water sector could enable identification of key energy
efficiency and energy recovery opportunities.
o 10 C.F.R. 429, 10 C.F.R. 431. The Energy Policy and Conservation Act of 1975 (EPCA), as amended, sets forth a variety of provisions designed to improve energy efficiency. Part C of Title III establishes the “Energy Conservation
Program for Certain Industrial Equipment.” The covered equipment includes pumps.
55
Chapter 5. Energy-Water Data Data collection, quality, resolution, and usability are critical issues in the energy-water space. Energy-
water data has relevance to both water-for-energy and energy-for-water technologies and systems.
Integrating and improving analytic capacity spanning diverse data domains at a range of spatial and
temporal scales is important for analysis at the energy-water nexus, and in a broader context, to improve
understanding of U.S. energy resilience and opportunities for increased energy efficiency and flexibility.
This chapter describes data, techniques, practices, and systems that have the potential to support advanced
analyses and inform better decisions relevant to energy and water.
5.1 Sensing and Metering
In the energy-for-water space, many systems suffer from a lack of comprehensive and reliable
measurement-based data. The development of relatively low-cost networks of widely distributed sensors
with attendant summarization and analytic capacities would provide a basis for further analysis,
modeling, and decision support. Depending on the application, these capabilities could improve
operations of wastewater treatment and desalination plants as well as benefit residential end-users of
energy and water. While smart meters are increasingly deployed in electrical grids, monitoring of water
infrastructure lags significantly.100 Networks of remote, automated leak detection could help in
prioritizing repairs to aging water infrastructure, with concomitant energy savings, particularly in locales
with high embedded energy costs of water,101 102 such as Southern California and the Southwest.
Additionally, more sophisticated process sensing would aid in enrolling drinking and wastewater
treatment systems in automated demand response programs, which, in addition to supporting flexible
operations, often facilitate energy efficiency gains as well.103
5.2 Energy and Water Use Surveys Surveys are in many cases the best tool available for periodic collection of aggregate data related to
energy and water. Even where sensor networks are in place, as is the case for energy and water metering,
the data is not always publicly available or lacks the resolution desirable for certain analysis needs.
Although self-reported information has its limitations,104 EIA relies heavily on this method, with full
awareness of the necessity for disciplined quality control techniques.
EIA uses existing large surveys such as the Form 860 and Form 923 to collect detailed information on
water use and other characteristics of cooling systems at electric power plants. EIA also quadrennially
collects residential energy use information via its Residential Energy Consumption Survey (RECS), most
recently in 2009. EIA gathers and publishes information on energy use in commercial buildings in its
Commercial Buildings Energy Consumption Survey (CBECS), including for water heating. p EIA does
not, however, collect energy use data from the water supply and treatment sectors (see also Section 5.4).
EIA collects a limited amount of residential water use data as part of its RECS energy surveys. The
current RECS includes a few questions on aspects of residential water usage, but does not collect total
water consumption data from residential consumers or water suppliers. According to EIA’s website, EIA
does not have statutory authority to collect water data from water suppliers.105 While expanding RECS to
survey residential water consumption would require additional effort, detailed information about home
water usage could be used to develop benchmarks for water performance that would inform DOE
appliance standards and would also be valuable to EPA’s WaterSense program.
p Relevant survey data for RECS 2013 and CBECS 2012 are not yet released to the public as of December 2016.
56
The CBECS 2007 collection included water consumption data for commercial buildings for the first time.
Data published from CBECS 2007 include tabulation of the ability of commercial buildings to provide
water consumption data, by building type and region, but do not include the actual water consumption
data.106 The CBECS 2007 water consumption survey questions were experimental, but EIA plans to
release water consumption data again for the CBECS 2012 collection.
While the U.S. Geological Survey (USGS) compiles a nationwide summary of water uses every five
years, it has not included water consumption since 1995. Although the recently release 2010 report
includes information from a new power plant consumption model, water consumption is not directly
surveyed. Urban water consumption is reported by many water utilities. However, agriculture and self-
supplied users are usually not reported. In addition, there is no national clearinghouse for this data.
5.3 Federal Energy-Water Data Sets
Data in the energy-water space is collected, stored, and utilized by the federal government, state and local
government, utilities, industry, academia, nonprofits, and other sectors. Responsibility for a significant
fraction of national-level energy-water data falls within the mission space of federal government agencies,
including DOE, EPA, DOI, ACE, USDA, and others. While additional data needs exist throughout the
energy-water nexus, available federal data on water for electricity systems is in general more detailed than
data on electricity for water systems. Table 6 lays out illustrative examples of federal energy-water data
sets currently available, including their key characteristics, spatial coverage, data collection method, and
temporal resolution. Spatial coverage varies across data sets, as does temporal resolution in terms of
reporting years, making analysis and integration of multiple data sets potentially challenging. Although
Table 6 is not comprehensive, the dearth of energy-for-water data sources relative to water-for-energy
data sources is broadly representative of federal energy-water data.

57
Table 6. Examples of Federal Energy-Water Data Sources
WATER FOR ENERGY ENERGY FOR WATER
# DATABASE AGENCY KEY ENERGY-WATER INFORMATION COVERAGE METHOD
Uni
t
Site
Coun
ty
Stat
e
1 EIA Form 860
EIA Generation and cooling system
equipment for existing and planned
generators
Survey
2 EIA Form 923
EIA Generation, fuel use, and cooling system operations
Survey
3 National Hydropower Asset
Assessment Program (NHAAP)
DOE Inventory of US hydropower resources
Hydropower resource potential
Compiled
database, Model
4 Water Use Data
DOI Water withdrawal by major economic
sector
Compiled
database
5 FERC Issued Licenses, Exemptions, and Conduit
Determination
FERC FERC license/exemption orders and amendments for hydropower projects
Compiled database
6 ECHO Database:
Enforcement and Compliance
History Online
EPA
Environmental violations (e.g.
temperature)
Inspection dates and findings Enforcement actions and penalties
Compiled
database
7 Farm and Ranch Irrigation
Survey
USDA On-farm energy expenses for pumping
irrigation water by water source and
type of Energy
Survey
REPORTING YEARS
5.4 Data Gaps A principal data gap in the energy-water nexus is collection of energy usage data for the water sector by
EIA. Energy usage in delivering water services represents a significant portion of U.S. electricity
consumption and may present major opportunities for both efficiency and renewable generation, but EIA
does not currently collect this data in its surveys. CBECS includes energy use for commercial buildings,
1 | | | | | | | | | | | | | | | | | | | | | | | | | | 1
2 |||||||||||||||||||||||||||||||||||||||||||||||||||||||||||||||||||||||||||||||||||||||||||||||||||||||||||||||||||||||| 2
3 | | | | | | | | | | | | 3
4 | | | | | | | | | 4
5 | | | | | | | | | 5
6 | | | | | | | 6
7 | | 7
1970 1975 1980 1985 1990 1995 2000 2005 2010 2015
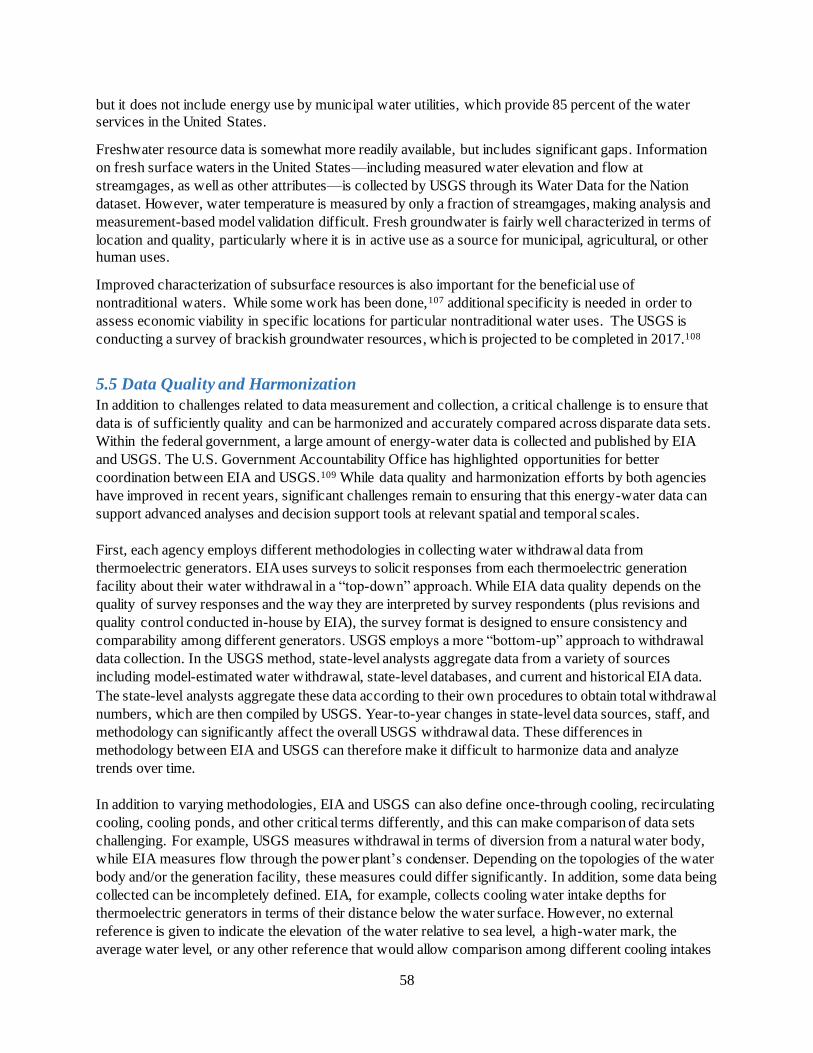
58
but it does not include energy use by municipal water utilities, which provide 85 percent of the water
services in the United States.
Freshwater resource data is somewhat more readily available, but includes significant gaps. Information
on fresh surface waters in the United States—including measured water elevation and flow at
streamgages, as well as other attributes—is collected by USGS through its Water Data for the Nation
dataset. However, water temperature is measured by only a fraction of streamgages, making analysis and
measurement-based model validation difficult. Fresh groundwater is fairly well characterized in terms of
location and quality, particularly where it is in active use as a source for municipal, agricultural, or other
human uses.
Improved characterization of subsurface resources is also important for the beneficial use of
nontraditional waters. While some work has been done,107 additional specificity is needed in order to
assess economic viability in specific locations for particular nontraditional water uses. The USGS is
conducting a survey of brackish groundwater resources, which is projected to be completed in 2017.108
5.5 Data Quality and Harmonization
In addition to challenges related to data measurement and collection, a critical challenge is to ensure that
data is of sufficiently quality and can be harmonized and accurately compared across disparate data sets.
Within the federal government, a large amount of energy-water data is collected and published by EIA
and USGS. The U.S. Government Accountability Office has highlighted opportunities for better
coordination between EIA and USGS.109 While data quality and harmonization efforts by both agencies
have improved in recent years, significant challenges remain to ensuring that this energy-water data can
support advanced analyses and decision support tools at relevant spatial and temporal scales.
First, each agency employs different methodologies in collecting water withdrawal data from
thermoelectric generators. EIA uses surveys to solicit responses from each thermoelectric generation
facility about their water withdrawal in a “top-down” approach. While EIA data quality depends on the
quality of survey responses and the way they are interpreted by survey respondents (plus revisions and
quality control conducted in-house by EIA), the survey format is designed to ensure consistency and
comparability among different generators. USGS employs a more “bottom-up” approach to withdrawal
data collection. In the USGS method, state-level analysts aggregate data from a variety of sources
including model-estimated water withdrawal, state-level databases, and current and historical EIA data.
The state-level analysts aggregate these data according to their own procedures to obtain total withdrawal
numbers, which are then compiled by USGS. Year-to-year changes in state-level data sources, staff, and
methodology can significantly affect the overall USGS withdrawal data. These differences in
methodology between EIA and USGS can therefore make it difficult to harmonize data and analyze
trends over time.
In addition to varying methodologies, EIA and USGS can also define once-through cooling, recirculating
cooling, cooling ponds, and other critical terms differently, and this can make comparison of data sets
challenging. For example, USGS measures withdrawal in terms of diversion from a natural water body,
while EIA measures flow through the power plant’s condenser. Depending on the topologies of the water
body and/or the generation facility, these measures could differ significantly. In addition, some data being
collected can be incompletely defined. EIA, for example, collects cooling water intake depths for
thermoelectric generators in terms of their distance below the water surface. However, no external
reference is given to indicate the elevation of the water relative to sea level, a high-water mark, the
average water level, or any other reference that would allow comparison among different cooling intakes

59
for purposes of drought vulnerability analyses, for example. Efforts to sharpen and standardize definitions
for data being collected could improve analytical usefulness of both EIA and USGS data.
EIA and USGS also collect data of differing spatial and temporal resolution, which can complicate
comparisons and analyses that require both data sets. While EIA provides water withdrawal for
thermoelectric cooling data at the level of individual plants, USGS provides this data primarily at the state
level. While the total national water withdrawal estimates for EIA and USGS have converged somewhat
in recent years, disparity remains at the regional and state levels. In the temporal domain, USGS collects
water withdrawal data every five years, with an approximately five-year delay before publication. EIA,
however, collects monthly water withdrawal data. Harmonization of these differing spatial and temporal
scales is important for analysis that utilizes both data sources.
Beyond EIA and USGS, many other federal agencies are partners in the collection, maintenance, and use
of energy-water data, including NASA, USDA, NOAA, and others. There is an opportunity for these
diverse data layers across the federal government to be better harmonized and integrated to enable
advanced analytics and decision support within government and for external stakeholders.
5.6 Summary and Conclusion
Data limitations can hinder analysis in the energy-water nexus. Analysis of various aspects of the energy-
water nexus suffer from a lack of data of sufficient quality, usability, and spatial and temporal resolution.
For example, while EIA collects commercial and industrial energy use data through its surveys, it does
not collect energy use data for municipal water and wastewater treatment and conveyance, which makes
analysis of energy use and savings opportunities challenging. Enhanced and more widely distributed
remote sensing, smart metering, networks of real-time sensors, improved survey methods, and attendant
summarization and analytic capabilities would provide a basis for improved analysis, modeling, and
decision support. Harmonization of data sets, particularly among federal agencies, is a critical need for
improving confidence in the data and allowing advanced analyses of regional variability and trends over
time. In particular, the diversity of federal data sets could benefit from improved integration to enable
novel analysis by a variety of users.
60
Chapter 6. Water Policies Impacting Electricity Generation and End Use Although energy and water flows are often physically interconnected, the energy and water policy
landscape is highly fragmented in the U.S., making it difficult for decision-makers in industry and
government to effectively balance energy and water goals. This chapter will outline several key policy
categories in the energy-water nexus: the water rights framework, water regulations affecting
thermoelectric generation, policies affecting hydropower, and finance mechanisms for energy and water
infrastructure. Other important policy drivers outside the scope of this chapter include river operation
requirements enforced by ACE, BOR, and TVA; and state-level integrated energy-water policies.
6.1 Water Rights Framework
The United States’ framework for water management is based on a wide range of legal directives. The
U.S. Constitution, federal and state legislation, judicial decisions, and common law distribute authority
over water among federal, tribalq, state, and local governments. International treaties involving
neighboring country governments also come into play. While the federal government is authorized to
develop and manage waters for commercial navigation, flood control, and other purposes, states otherwise
have primary authority for water rights allocation and permitting.
6.1.1 Surface Water Allocation Policies
States have a strong role in overseeing water rights and allocation permitting. State-level water rights and
permitting inform the decision-making of any significant water user. Because water issues vary greatly
by region, water resource policies—even policy frameworks—can vary greatly from state to state, or even
within states.110 With respect to surface water, states generally follow some variation of two governance
doctrines—the prior appropriation doctrine and the riparian doctrine. Groundwater governance is slightly
more complex and is discussed in Section 5.1.2.
q Along with federal lands, Indian lands are typically entitled to water rights based on federal law. These water rights, commonly referred to as "federal reserved water rights," are based on the premise that when Indian and federal reservations were established, enough water was reserved to fulfill the purpose of such reservations. In the
case of Indian tribes, this means sufficient water to fulfill the purpose of Indian reservations as homelands for the tribes. Federal reserved water rights also differ from state-based water rights in other ways, including priority dates,
quantification of rights, and types of use. While many tribes have either fully adjudicated or settled their water rights claims, most tribes in the West still have very large, and un-quantified, rights to water—including surface and groundwater—for their reservations (Newton, N. J. and R. Anderson. 2004. Cohen's Handbook of Federal Indian
Law 2005 Edition. LexisNexis Publisher).
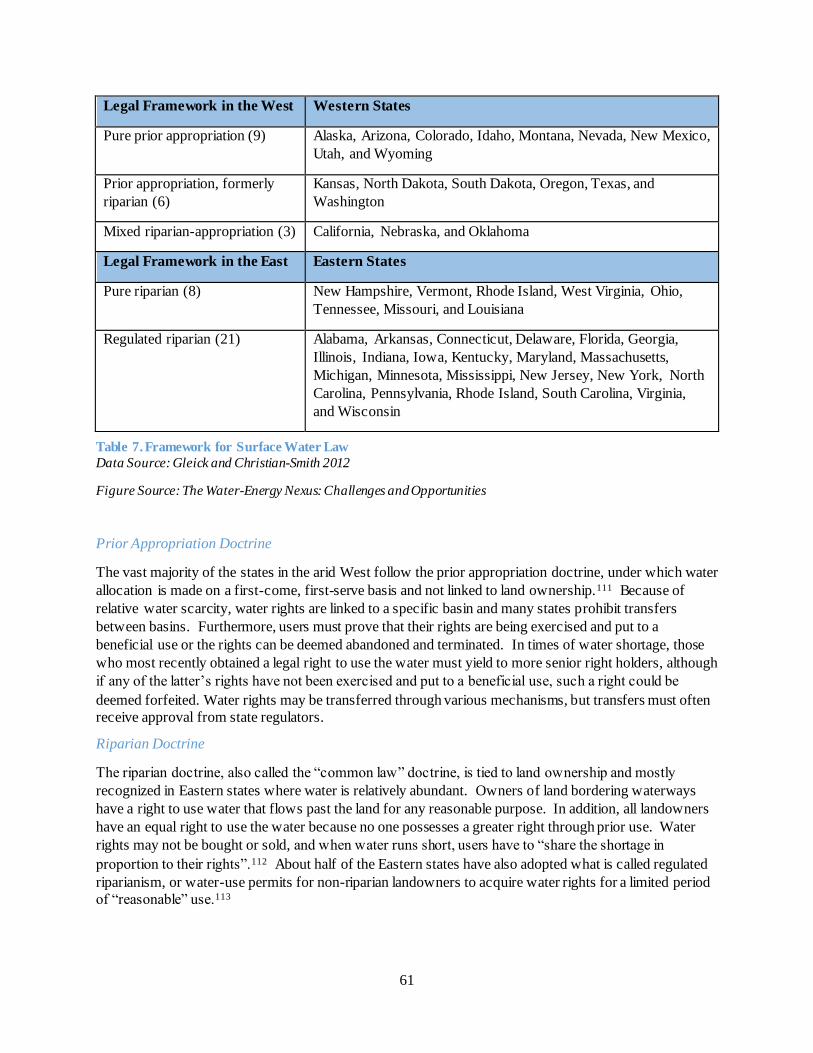
61
Legal Framework in the West Western States
Pure prior appropriation (9) Alaska, Arizona, Colorado, Idaho, Montana, Nevada, New Mexico,
Utah, and Wyoming
Prior appropriation, formerly
riparian (6)
Kansas, North Dakota, South Dakota, Oregon, Texas, and
Washington
Mixed riparian-appropriation (3) California, Nebraska, and Oklahoma
Legal Framework in the East Eastern States
Pure riparian (8) New Hampshire, Vermont, Rhode Island, West Virginia, Ohio,
Tennessee, Missouri, and Louisiana
Regulated riparian (21) Alabama, Arkansas, Connecticut, Delaware, Florida, Georgia,
Illinois, Indiana, Iowa, Kentucky, Maryland, Massachusetts,
Michigan, Minnesota, Mississippi, New Jersey, New York, North
Carolina, Pennsylvania, Rhode Island, South Carolina, Virginia,
and Wisconsin
Table 7. Framework for Surface Water Law
Data Source: Gleick and Christian-Smith 2012
Figure Source: The Water-Energy Nexus: Challenges and Opportunities
Prior Appropriation Doctrine
The vast majority of the states in the arid West follow the prior appropriation doctrine, under which water
allocation is made on a first-come, first-serve basis and not linked to land ownership.111 Because of
relative water scarcity, water rights are linked to a specific basin and many states prohibit transfers
between basins. Furthermore, users must prove that their rights are being exercised and put to a
beneficial use or the rights can be deemed abandoned and terminated. In times of water shortage, those
who most recently obtained a legal right to use the water must yield to more senior right holders, although
if any of the latter’s rights have not been exercised and put to a beneficial use, such a right could be
deemed forfeited. Water rights may be transferred through various mechanisms, but transfers must often
receive approval from state regulators.
Riparian Doctrine
The riparian doctrine, also called the “common law” doctrine, is tied to land ownership and mostly
recognized in Eastern states where water is relatively abundant. Owners of land bordering waterways
have a right to use water that flows past the land for any reasonable purpose. In addition, all landowners
have an equal right to use the water because no one possesses a greater right through prior use. Water
rights may not be bought or sold, and when water runs short, users have to “share the shortage in
proportion to their rights”.112 About half of the Eastern states have also adopted what is called regulated
riparianism, or water-use permits for non-riparian landowners to acquire water rights for a limited period
of “reasonable” use.113
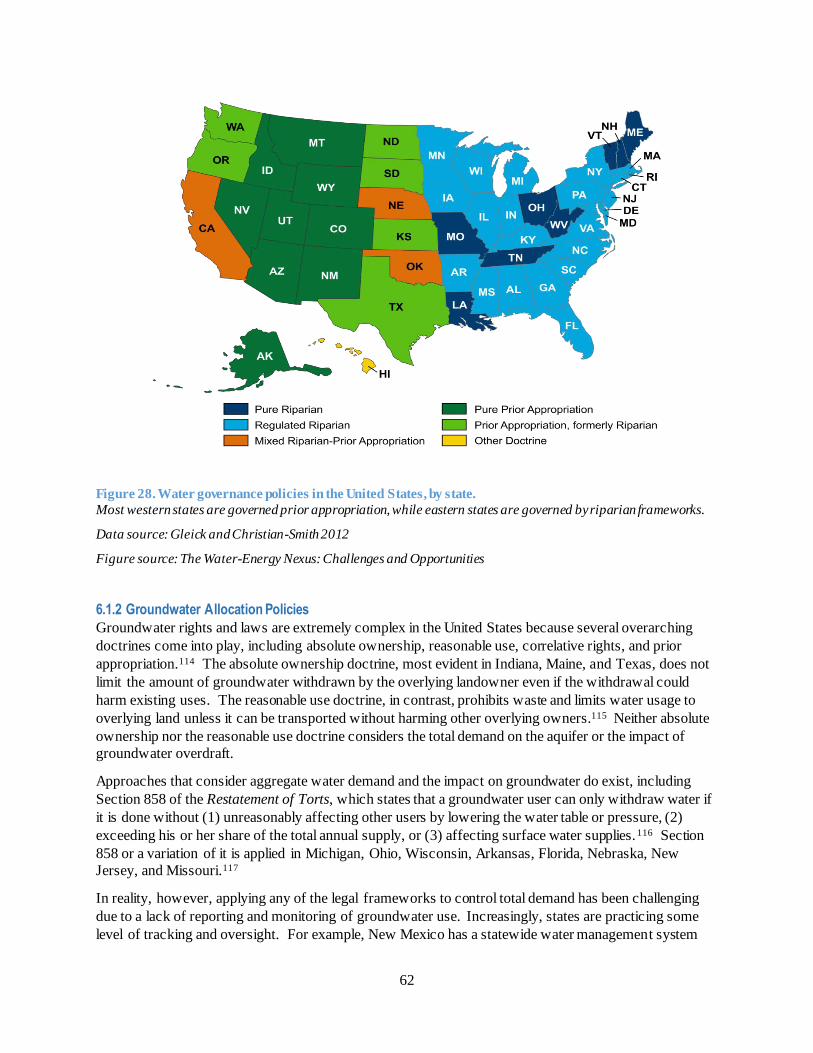
62
Figure 28. Water governance policies in the United States, by state.
Most western states are governed prior appropriation, while eastern states are governed by riparian frameworks.
Data source: Gleick and Christian-Smith 2012
Figure source: The Water-Energy Nexus: Challenges and Opportunities
6.1.2 Groundwater Allocation Policies
Groundwater rights and laws are extremely complex in the United States because several overarching
doctrines come into play, including absolute ownership, reasonable use, correlative rights, and prior
appropriation.114 The absolute ownership doctrine, most evident in Indiana, Maine, and Texas, does not
limit the amount of groundwater withdrawn by the overlying landowner even if the withdrawal could
harm existing uses. The reasonable use doctrine, in contrast, prohibits waste and limits water usage to
overlying land unless it can be transported without harming other overlying owners.115 Neither absolute
ownership nor the reasonable use doctrine considers the total demand on the aquifer or the impact of
groundwater overdraft.
Approaches that consider aggregate water demand and the impact on groundwater do exist, including
Section 858 of the Restatement of Torts, which states that a groundwater user can only withdraw water if
it is done without (1) unreasonably affecting other users by lowering the water table or pressure, (2)
exceeding his or her share of the total annual supply, or (3) affecting surface water supplies. 116 Section
858 or a variation of it is applied in Michigan, Ohio, Wisconsin, Arkansas, Florida, Nebraska, New
Jersey, and Missouri.117
In reality, however, applying any of the legal frameworks to control total demand has been challenging
due to a lack of reporting and monitoring of groundwater use. Increasingly, states are practicing some
level of tracking and oversight. For example, New Mexico has a statewide water management system
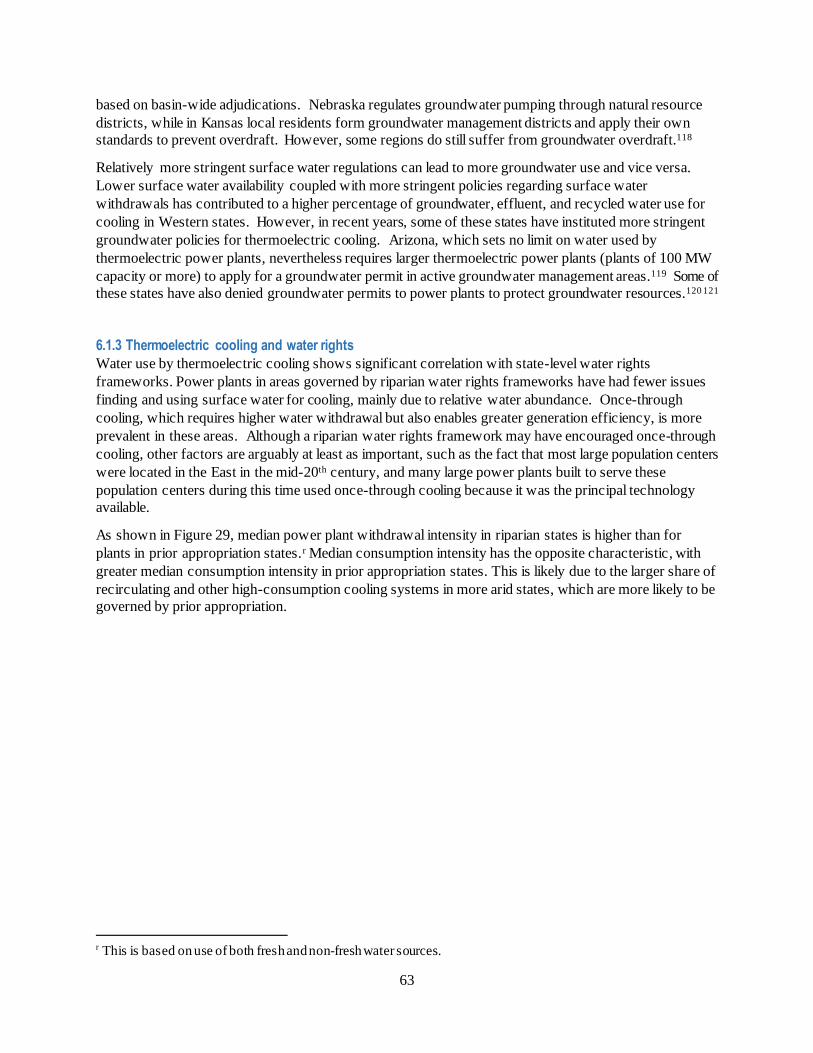
63
based on basin-wide adjudications. Nebraska regulates groundwater pumping through natural resource
districts, while in Kansas local residents form groundwater management districts and apply their own
standards to prevent overdraft. However, some regions do still suffer from groundwater overdraft.118
Relatively more stringent surface water regulations can lead to more groundwater use and vice versa.
Lower surface water availability coupled with more stringent policies regarding surface water
withdrawals has contributed to a higher percentage of groundwater, effluent, and recycled water use for
cooling in Western states. However, in recent years, some of these states have instituted more stringent
groundwater policies for thermoelectric cooling. Arizona, which sets no limit on water used by
thermoelectric power plants, nevertheless requires larger thermoelectric power plants (plants of 100 MW
capacity or more) to apply for a groundwater permit in active groundwater management areas.119 Some of
these states have also denied groundwater permits to power plants to protect groundwater resources.120 121
6.1.3 Thermoelectric cooling and water rights
Water use by thermoelectric cooling shows significant correlation with state-level water rights
frameworks. Power plants in areas governed by riparian water rights frameworks have had fewer issues
finding and using surface water for cooling, mainly due to relative water abundance. Once-through
cooling, which requires higher water withdrawal but also enables greater generation efficiency, is more
prevalent in these areas. Although a riparian water rights framework may have encouraged once-through
cooling, other factors are arguably at least as important, such as the fact that most large population centers
were located in the East in the mid-20th century, and many large power plants built to serve these
population centers during this time used once-through cooling because it was the principal technology
available.
As shown in Figure 29, median power plant withdrawal intensity in riparian states is higher than for
plants in prior appropriation states.r Median consumption intensity has the opposite characteristic, with
greater median consumption intensity in prior appropriation states. This is likely due to the larger share of
recirculating and other high-consumption cooling systems in more arid states, which are more likely to be
governed by prior appropriation.
r This is based on use of both fresh and non-fresh water sources.
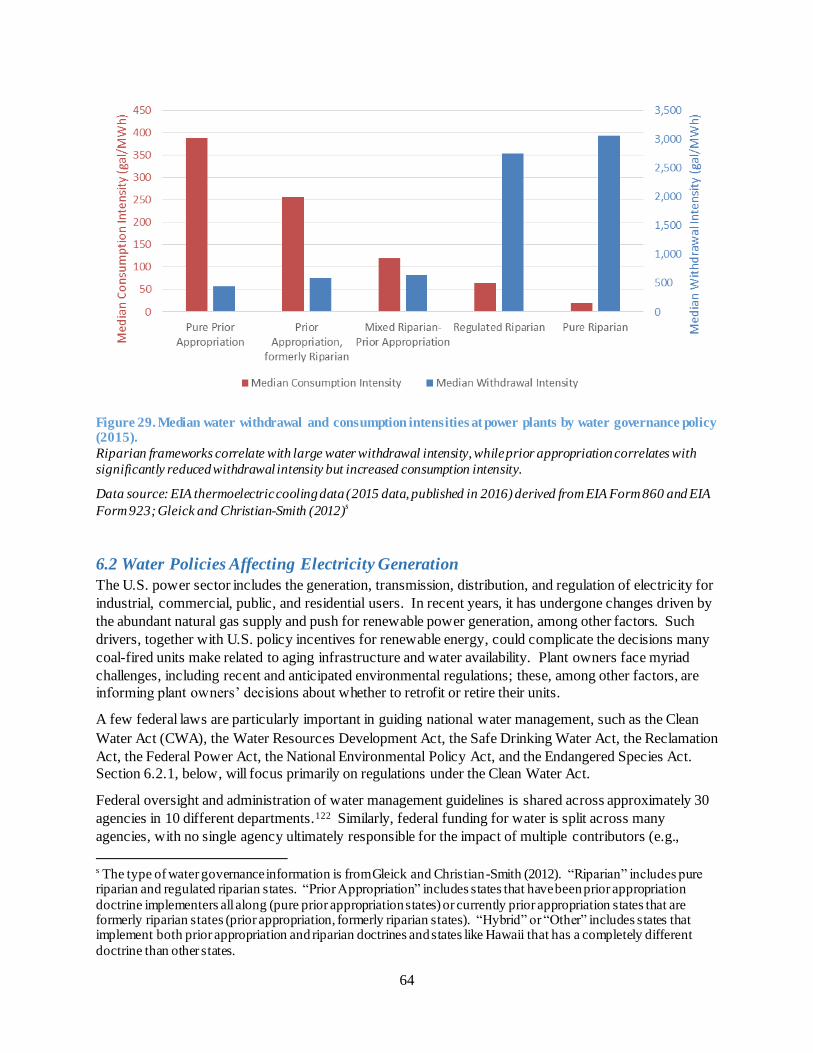
64
Figure 29. Median water withdrawal and consumption intensities at power plants by water governance policy (2015).
Riparian frameworks correlate with large water withdrawal intensity, while prior appropriation correlates with
significantly reduced withdrawal intensity but increased consumption intensity.
Data source: EIA thermoelectric cooling data (2015 data, published in 2016) derived from EIA Form 860 and EIA
Form 923; Gleick and Christian-Smith (2012)s
6.2 Water Policies Affecting Electricity Generation
The U.S. power sector includes the generation, transmission, distribution, and regulation of electricity for
industrial, commercial, public, and residential users. In recent years, it has undergone changes driven by
the abundant natural gas supply and push for renewable power generation, among other factors. Such
drivers, together with U.S. policy incentives for renewable energy, could complicate the decisions many
coal-fired units make related to aging infrastructure and water availability. Plant owners face myriad
challenges, including recent and anticipated environmental regulations; these, among other factors, are
informing plant owners’ decisions about whether to retrofit or retire their units.
A few federal laws are particularly important in guiding national water management, such as the Clean
Water Act (CWA), the Water Resources Development Act, the Safe Drinking Water Act, the Reclamation
Act, the Federal Power Act, the National Environmental Policy Act, and the Endangered Species Act.
Section 6.2.1, below, will focus primarily on regulations under the Clean Water Act.
Federal oversight and administration of water management guidelines is shared across approximately 30
agencies in 10 different departments.122 Similarly, federal funding for water is split across many
agencies, with no single agency ultimately responsible for the impact of multiple contributors (e.g.,
s The type of water governance information is from Gleick and Christian-Smith (2012). “Riparian” includes pure riparian and regulated riparian states. “Prior Appropriation” includes states that have been prior appropriation
doctrine implementers all along (pure prior appropriation states) or currently prior appropriation states that are formerly riparian states (prior appropriation, formerly riparian states). “Hybrid” or “Other” includes states that implement both prior appropriation and riparian doctrines and states like Hawaii that has a completely different
doctrine than other states.
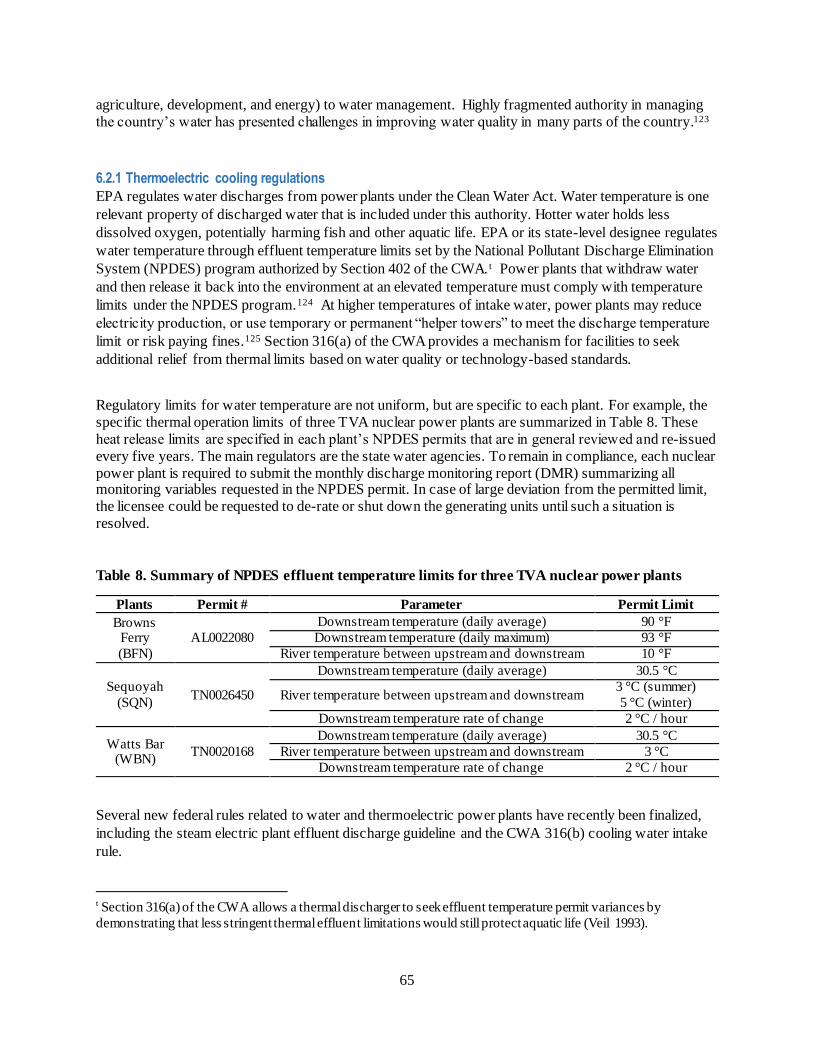
65
agriculture, development, and energy) to water management. Highly fragmented authority in managing
the country’s water has presented challenges in improving water quality in many parts of the country.123
6.2.1 Thermoelectric cooling regulations
EPA regulates water discharges from power plants under the Clean Water Act. Water temperature is one
relevant property of discharged water that is included under this authority. Hotter water holds less
dissolved oxygen, potentially harming fish and other aquatic life. EPA or its state-level designee regulates
water temperature through effluent temperature limits set by the National Pollutant Discharge Elimination
System (NPDES) program authorized by Section 402 of the CWA. t Power plants that withdraw water
and then release it back into the environment at an elevated temperature must comply with temperature
limits under the NPDES program.124 At higher temperatures of intake water, power plants may reduce
electricity production, or use temporary or permanent “helper towers” to meet the discharge temperature
limit or risk paying fines.125 Section 316(a) of the CWA provides a mechanism for facilities to seek
additional relief from thermal limits based on water quality or technology-based standards.
Regulatory limits for water temperature are not uniform, but are specific to each plant. For example, the
specific thermal operation limits of three TVA nuclear power plants are summarized in Table 8. These
heat release limits are specified in each plant’s NPDES permits that are in general reviewed and re-issued
every five years. The main regulators are the state water agencies. To remain in compliance, each nuclear
power plant is required to submit the monthly discharge monitoring report (DMR) summarizing all monitoring variables requested in the NPDES permit. In case of large deviation from the permitted limit,
the licensee could be requested to de-rate or shut down the generating units until such a situation is
resolved.
Table 8. Summary of NPDES effluent temperature limits for three TVA nuclear power plants
Plants Permit # Parameter Permit Limit
Browns Ferry
(BFN)
AL0022080
Downstream temperature (daily average) 90 °F
Downstream temperature (daily maximum) 93 °F
River temperature between upstream and downstream 10 °F
Sequoyah
(SQN) TN0026450
Downstream temperature (daily average) 30.5 °C
River temperature between upstream and downstream 3 °C (summer)
5 °C (winter)
Downstream temperature rate of change 2 °C / hour
Watts Bar (WBN)
TN0020168
Downstream temperature (daily average) 30.5 °C
River temperature between upstream and downstream 3 °C
Downstream temperature rate of change 2 °C / hour
Several new federal rules related to water and thermoelectric power plants have recently been finalized,
including the steam electric plant effluent discharge guideline and the CWA 316(b) cooling water intake
rule.
t Section 316(a) of the CWA allows a thermal discharger to seek effluent temperature permit variances by
demonstrating that less stringent thermal effluent limitations would still protect aquatic life (Veil 1993).

66
EPA in September 2015 finalized a rule revising the effluent limitations guidelines for the Steam Electric
Power Generating category. The rule sets the first federal limits on the levels of toxic metals in flue gas
desulfurization wastewater that can be discharged from power plants, based on technology improvements
in the steam electric power industry over the last three decades. The rule is projected to reduce the amount
of toxic metals, nutrients, and other pollutants that steam electric power plants are allowed to discharge.
Annual compliance costs for the final rule are estimated at $480 million, while estimated benefits
associated with the rule are $451 to $566 million.126
EPA also finalized the existing facility cooling water intake rule under CWA section 316(b) in August
2014. The rule seeks to prevent adverse environmental impact from impingement of fish and shellfish on
cooling water intake screens or entrainment of their eggs and larvae through a power plant’s cooling
system, where they may be killed by heat, physical stress, or chemicals. EPA states that this rule covers
roughly 544 existing power plants that are designed to withdraw at least 2 million gallons per day of
cooling water. The rule requires the covered facilities to choose one of seven options to reduce
impingement mortality to fish and other aquatic organisms, such as using advanced fish-friendly screen
technologies cooling intake structures, and also requires the permitting authority to make a case by case
determination for reducing entrainment mortality. One option that power plants covered by the rule can
use for compliance is wet-recirculating cooling (also known as “closed-loop” cooling), which eliminates
most of the adverse environmental impacts. EPA also requires new units at existing facilities to install
wet-recirculating cooling or its equivalent. As a result, the thermoelectric generation fleet is expected to
continue its shift from once-through to wet-recirculating (and/or dry) cooling systems.
6.2.2 Hydropower policies
While all electricity generation is subject to environmental and siting constraints in one form or another,
hydropower projects face particularly complex and multifaceted constraints. Many hydropower projects
are components of multipurpose dams that must balance electricity generation with requirements to
manage water for environmental mitigation, navigation, flood control, agriculture, recreation, and other
non-energy services. Key legislation in the 1970s such as the Endangered Species Act and the Clean
Water Act imposed environmental constraints on hydropower operations. The Electric Consumers
Protection Act in 1986 required FERC to give equal consideration to both power and non-power factors
during the licensing process, in some cases reducing flexibility of current installed capacity or reducing
attractiveness for new development.127 Adding new capacity to existing projects and changing operational
strategies must likewise balance these constraints. Figure 30 shows relevant policy milestones and
cumulative capacity for hydropower.
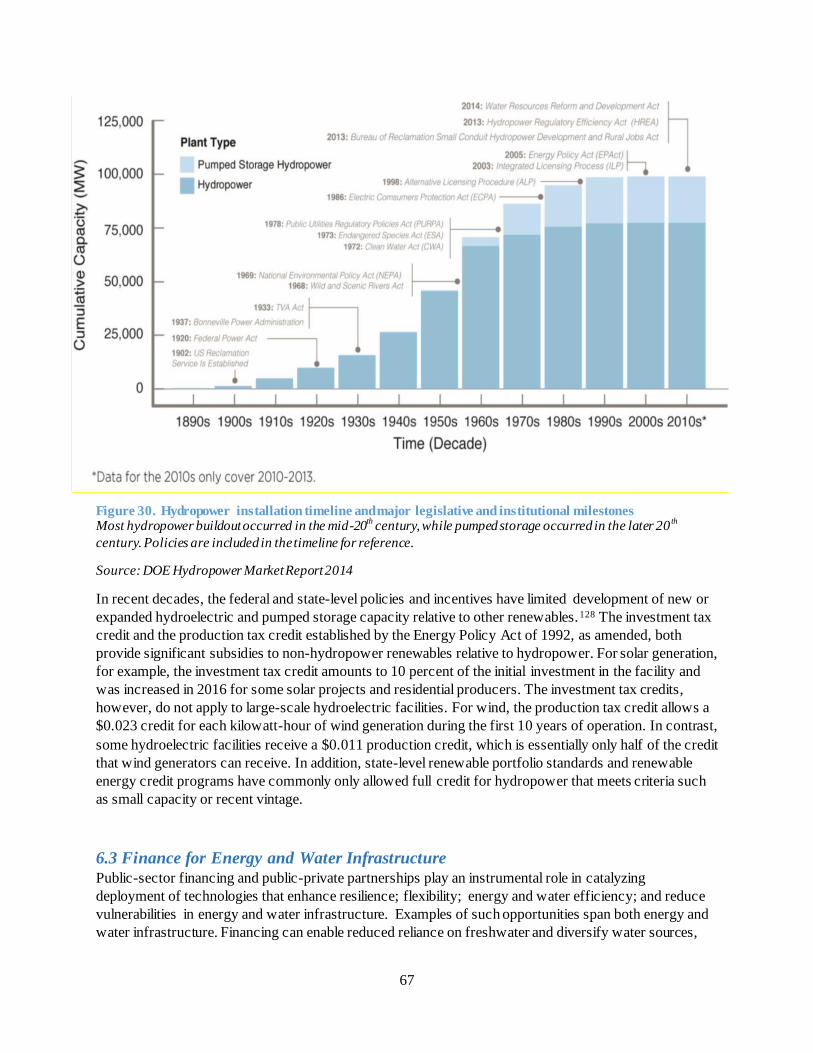
67
Figure 30. Hydropower installation timeline and major legislative and institutional milestones Most hydropower buildout occurred in the mid-20
th century, while pumped storage occurred in the later 20
th
century. Policies are included in the timeline for reference.
Source: DOE Hydropower Market Report 2014
In recent decades, the federal and state-level policies and incentives have limited development of new or
expanded hydroelectric and pumped storage capacity relative to other renewables.128 The investment tax
credit and the production tax credit established by the Energy Policy Act of 1992, as amended, both
provide significant subsidies to non-hydropower renewables relative to hydropower. For solar generation,
for example, the investment tax credit amounts to 10 percent of the initial investment in the facility and
was increased in 2016 for some solar projects and residential producers. The investment tax credits,
however, do not apply to large-scale hydroelectric facilities. For wind, the production tax credit allows a
$0.023 credit for each kilowatt-hour of wind generation during the first 10 years of operation. In contrast,
some hydroelectric facilities receive a $0.011 production credit, which is essentially only half of the credit
that wind generators can receive. In addition, state-level renewable portfolio standards and renewable
energy credit programs have commonly only allowed full credit for hydropower that meets criteria such
as small capacity or recent vintage.
6.3 Finance for Energy and Water Infrastructure
Public-sector financing and public-private partnerships play an instrumental role in catalyzing
deployment of technologies that enhance resilience; flexibility; energy and water efficiency; and reduce
vulnerabilities in energy and water infrastructure. Examples of such opportunities span both energy and
water infrastructure. Financing can enable reduced reliance on freshwater and diversify water sources,
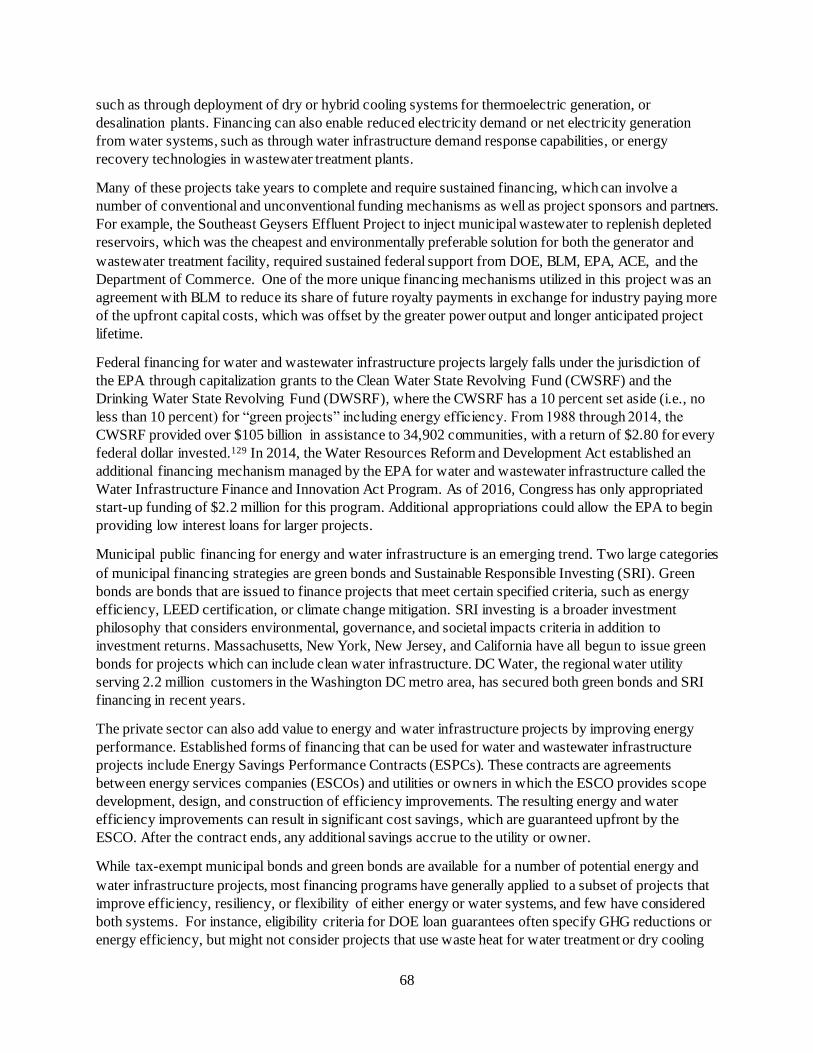
68
such as through deployment of dry or hybrid cooling systems for thermoelectric generation, or
desalination plants. Financing can also enable reduced electricity demand or net electricity generation
from water systems, such as through water infrastructure demand response capabilities, or energy
recovery technologies in wastewater treatment plants.
Many of these projects take years to complete and require sustained financing, which can involve a
number of conventional and unconventional funding mechanisms as well as project sponsors and partners.
For example, the Southeast Geysers Effluent Project to inject municipal wastewater to replenish depleted
reservoirs, which was the cheapest and environmentally preferable solution for both the generator and
wastewater treatment facility, required sustained federal support from DOE, BLM, EPA, ACE, and the
Department of Commerce. One of the more unique financing mechanisms utilized in this project was an
agreement with BLM to reduce its share of future royalty payments in exchange for industry paying more
of the upfront capital costs, which was offset by the greater power output and longer anticipated project
lifetime.
Federal financing for water and wastewater infrastructure projects largely falls under the jurisdiction of
the EPA through capitalization grants to the Clean Water State Revolving Fund (CWSRF) and the
Drinking Water State Revolving Fund (DWSRF), where the CWSRF has a 10 percent set aside (i.e., no
less than 10 percent) for “green projects” including energy efficiency. From 1988 through 2014, the
CWSRF provided over $105 billion in assistance to 34,902 communities, with a return of $2.80 for every
federal dollar invested.129 In 2014, the Water Resources Reform and Development Act established an
additional financing mechanism managed by the EPA for water and wastewater infrastructure called the
Water Infrastructure Finance and Innovation Act Program. As of 2016, Congress has only appropriated
start-up funding of $2.2 million for this program. Additional appropriations could allow the EPA to begin
providing low interest loans for larger projects.
Municipal public financing for energy and water infrastructure is an emerging trend. Two large categories
of municipal financing strategies are green bonds and Sustainable Responsible Investing (SRI). Green
bonds are bonds that are issued to finance projects that meet certain specified criteria, such as energy
efficiency, LEED certification, or climate change mitigation. SRI investing is a broader investment
philosophy that considers environmental, governance, and societal impacts criteria in addition to
investment returns. Massachusetts, New York, New Jersey, and California have all begun to issue green
bonds for projects which can include clean water infrastructure. DC Water, the regional water utility
serving 2.2 million customers in the Washington DC metro area, has secured both green bonds and SRI
financing in recent years.
The private sector can also add value to energy and water infrastructure projects by improving energy
performance. Established forms of financing that can be used for water and wastewater infrastructure
projects include Energy Savings Performance Contracts (ESPCs). These contracts are agreements
between energy services companies (ESCOs) and utilities or owners in which the ESCO provides scope
development, design, and construction of efficiency improvements. The resulting energy and water
efficiency improvements can result in significant cost savings, which are guaranteed upfront by the
ESCO. After the contract ends, any additional savings accrue to the utility or owner.
While tax-exempt municipal bonds and green bonds are available for a number of potential energy and
water infrastructure projects, most financing programs have generally applied to a subset of projects that
improve efficiency, resiliency, or flexibility of either energy or water systems, and few have considered
both systems. For instance, eligibility criteria for DOE loan guarantees often specify GHG reductions or
energy efficiency, but might not consider projects that use waste heat for water treatment or dry cooling

69
for thermoelectric generation. Improved integration of energy and water finance mechanisms could
unlock additional opportunities.
6.4 Summary and Conclusion
The energy and water policy landscape is highly fragmented. Policy interconnections between electricity
and water systems are complex and often are not well documented. Because energy and water flows are
often physically interconnected, policy and regulations designed separately for energy or water systems
can make it difficult to productively balance energy and water goals. Opportunities exist to better
integrate energy and water policies, and to pursue finance mechanisms that improve performance of both
energy and water infrastructure.
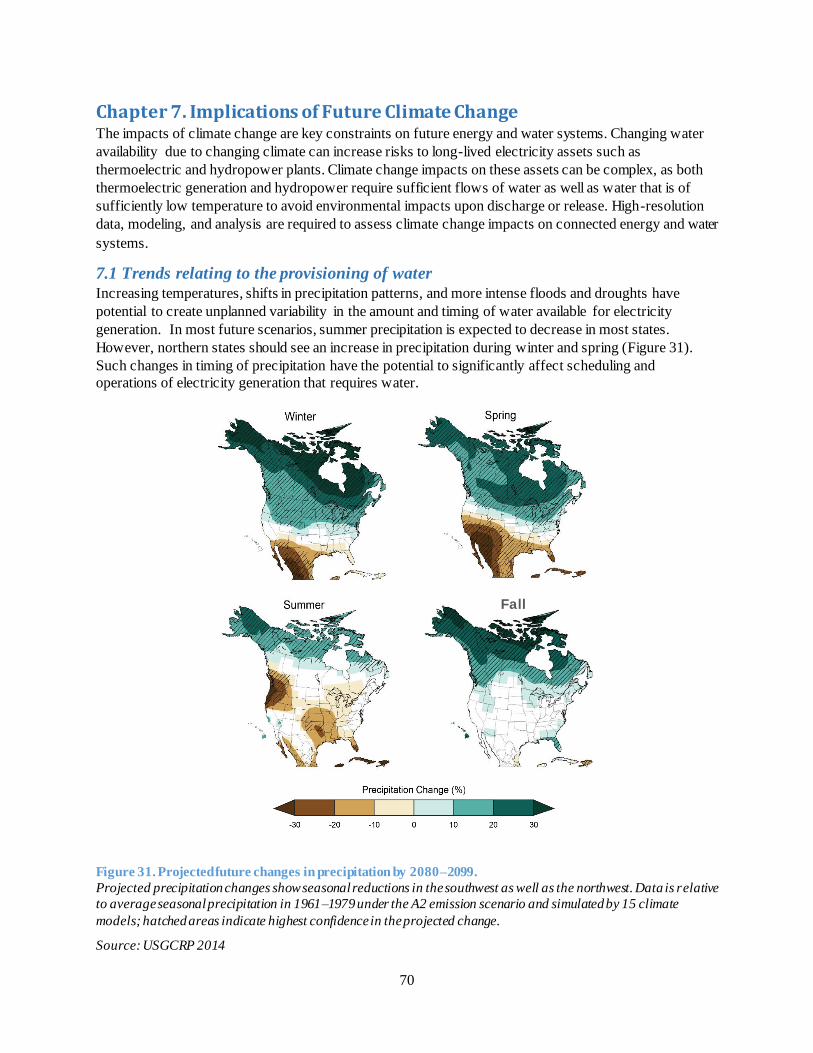
70
Chapter 7. Implications of Future Climate Change The impacts of climate change are key constraints on future energy and water systems. Changing water
availability due to changing climate can increase risks to long-lived electricity assets such as
thermoelectric and hydropower plants. Climate change impacts on these assets can be complex, as both
thermoelectric generation and hydropower require sufficient flows of water as well as water that is of
sufficiently low temperature to avoid environmental impacts upon discharge or release. High-resolution
data, modeling, and analysis are required to assess climate change impacts on connected energy and water
systems.
7.1 Trends relating to the provisioning of water
Increasing temperatures, shifts in precipitation patterns, and more intense floods and droughts have
potential to create unplanned variability in the amount and timing of water available for electricity
generation. In most future scenarios, summer precipitation is expected to decrease in most states.
However, northern states should see an increase in precipitation during winter and spring (Figure 31).
Such changes in timing of precipitation have the potential to significantly affect scheduling and
operations of electricity generation that requires water.
Figure 31. Projected future changes in precipitation by 2080–2099.
Projected precipitation changes show seasonal reductions in the southwest as well as the northwest. Data is relative
to average seasonal precipitation in 1961–1979 under the A2 emission scenario and simulated by 15 climate
models; hatched areas indicate highest confidence in the projected change.
Source: USGCRP 2014
Fall
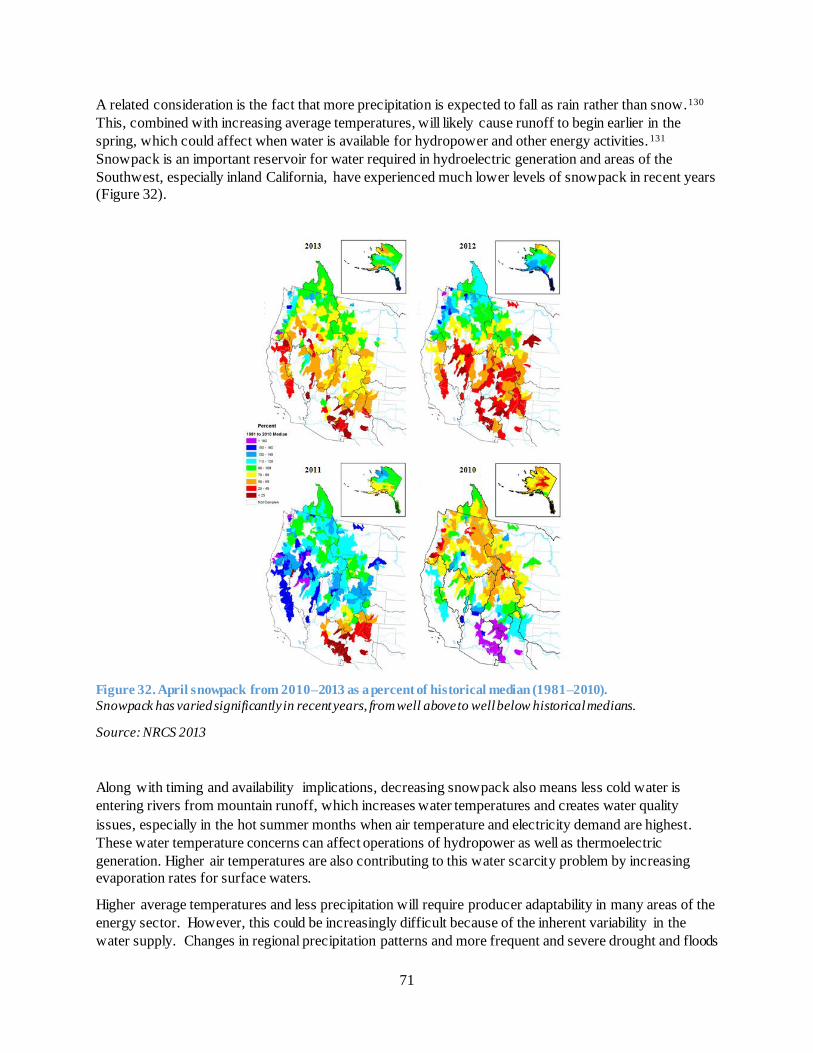
71
A related consideration is the fact that more precipitation is expected to fall as rain rather than snow.130
This, combined with increasing average temperatures, will likely cause runoff to begin earlier in the
spring, which could affect when water is available for hydropower and other energy activities. 131
Snowpack is an important reservoir for water required in hydroelectric generation and areas of the
Southwest, especially inland California, have experienced much lower levels of snowpack in recent years
(Figure 32).
Figure 32. April snowpack from 2010–2013 as a percent of historical median (1981–2010).
Snowpack has varied significantly in recent years, from well above to well below historical medians.
Source: NRCS 2013
Along with timing and availability implications, decreasing snowpack also means less cold water is
entering rivers from mountain runoff, which increases water temperatures and creates water quality
issues, especially in the hot summer months when air temperature and electricity demand are highest.
These water temperature concerns can affect operations of hydropower as well as thermoelectric
generation. Higher air temperatures are also contributing to this water scarcity problem by increasing
evaporation rates for surface waters.
Higher average temperatures and less precipitation will require producer adaptability in many areas of the
energy sector. However, this could be increasingly difficult because of the inherent variability in the
water supply. Changes in regional precipitation patterns and more frequent and severe drought and floods
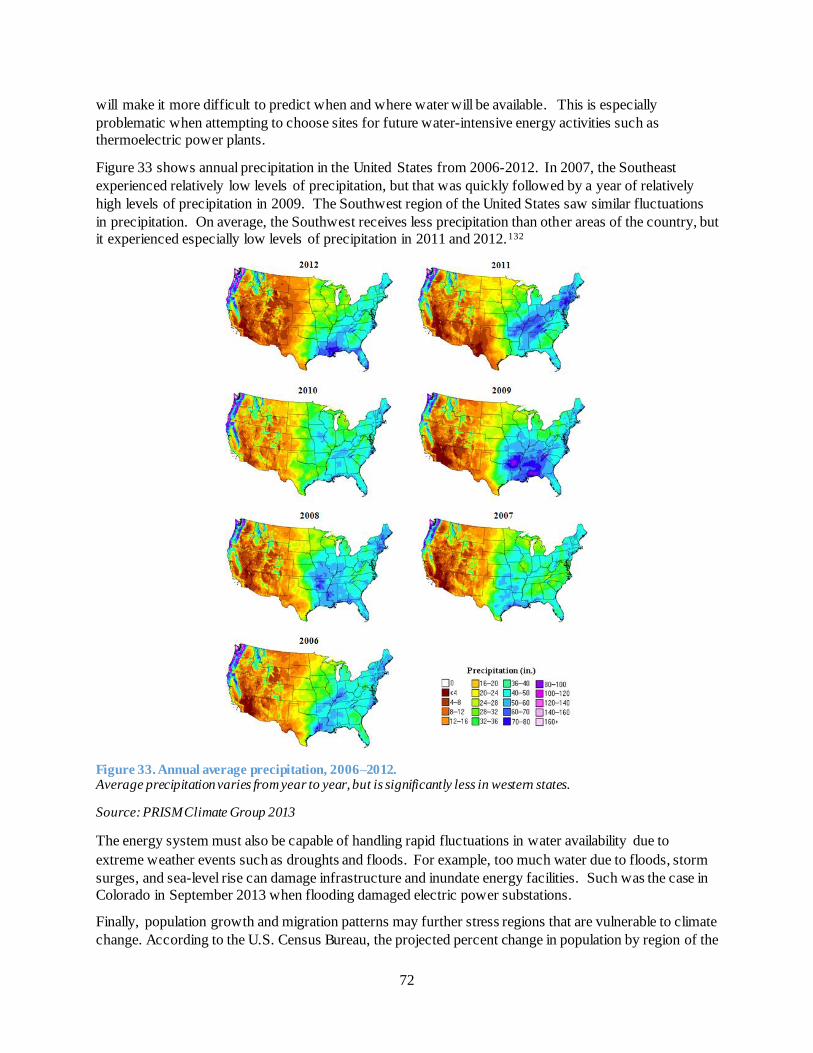
72
will make it more difficult to predict when and where water will be available. This is especially
problematic when attempting to choose sites for future water-intensive energy activities such as
thermoelectric power plants.
Figure 33 shows annual precipitation in the United States from 2006-2012. In 2007, the Southeast
experienced relatively low levels of precipitation, but that was quickly followed by a year of relatively
high levels of precipitation in 2009. The Southwest region of the United States saw similar fluctuations
in precipitation. On average, the Southwest receives less precipitation than other areas of the country, but
it experienced especially low levels of precipitation in 2011 and 2012.132
Figure 33. Annual average precipitation, 2006–2012. Average precipitation varies from year to year, but is significantly less in western states.
Source: PRISM Climate Group 2013
The energy system must also be capable of handling rapid fluctuations in water availability due to
extreme weather events such as droughts and floods. For example, too much water due to floods, storm
surges, and sea-level rise can damage infrastructure and inundate energy facilities. Such was the case in
Colorado in September 2013 when flooding damaged electric power substations.
Finally, population growth and migration patterns may further stress regions that are vulnerable to climate
change. According to the U.S. Census Bureau, the projected percent change in population by region of the
73
United States varies significantly. The South and the West are both expected to see over 40 percent
population growth by 2030, relative to 2000.133 The Northeast and Midwest are expected to see less than
10 percent growth by 2030, relative to 2000.134 Competing energy and water needs may become more
serious in regions such as the South and West where large projected population growth overlaps with
projected water constraints under climate change.
7.2 Trends related to electricity generation
Adverse events such as droughts and heat waves have had significant impacts on electricity generation in
recent years. Thermoelectric generation is particularly vulnerable to exceeding cooling water discharge
temperature limits during droughts or heat waves, in some cases requiring plant derating or shutdown.
Hydropower is vulnerable to earlier snowmelt shifting the timing of water available for generation.
Climate change may further intensify these impacts.
7.2.1 Thermoelectric Cooling
For thermoelectric generation, water temperature can pose problems in addition to water availability. As
discussed in Chapter 5, EPA regulates water discharge temperature from power plants under the authority
of the Clean Water Act. Since 2004, water stress has led to at least a dozen power plants to temporarily
reduce their power output or shut down entirely, and prompted at least eight states to deny new plant
proposals.135 During prolonged heat in the summer of 2010, for example, water temperatures in the
Tennessee River hit 90°F, forcing the Browns Ferry nuclear power plant to significantly reduce the power
output from its three reactors for nearly five consecutive weeks—all while cities in the region were
experiencing high power demands for air conditioning. Similar events occurred when intense heat and
drought in 2012 caused many operational problems for thermoelectric power plants throughout the
Midwest United States. Figure 34 shows U.S.-wide violations of average monthly discharge temperature
limits between January 2008 and December 2011.
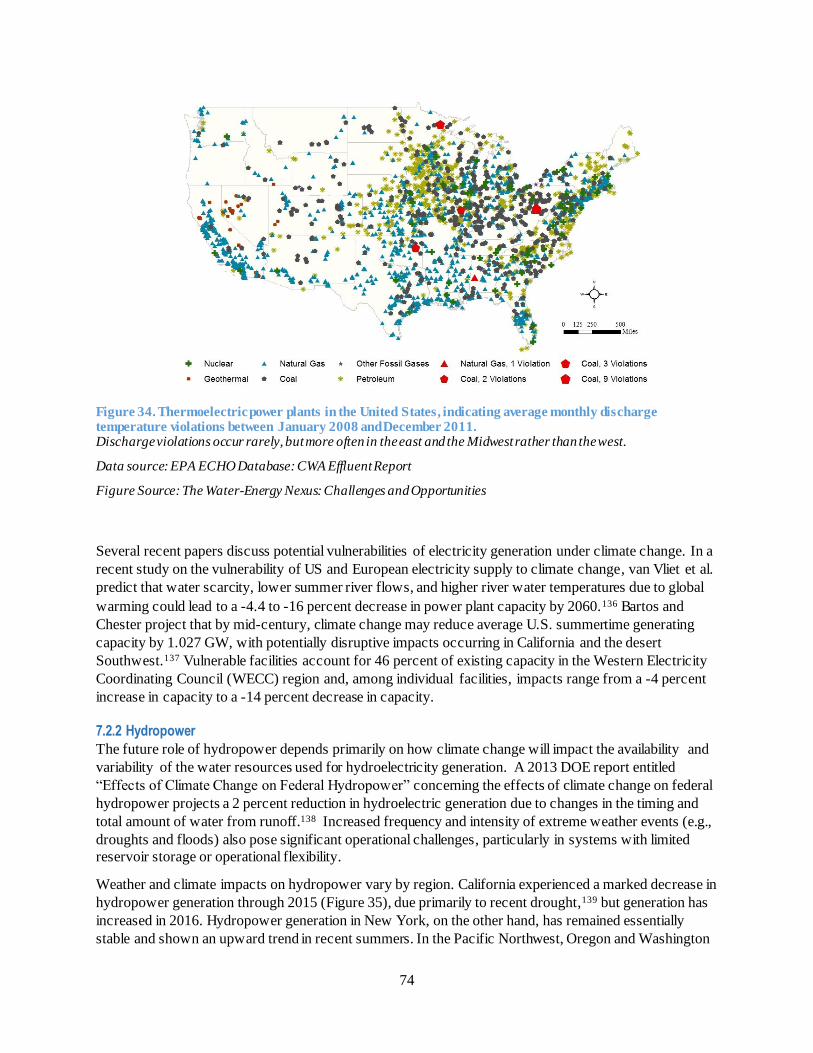
74
Figure 34. Thermoelectric power plants in the United States, indicating average monthly discharge temperature violations between January 2008 and December 2011. Discharge violations occur rarely, but more often in the east and the Midwest rather than the west.
Data source: EPA ECHO Database: CWA Effluent Report
Figure Source: The Water-Energy Nexus: Challenges and Opportunities
Several recent papers discuss potential vulnerabilities of electricity generation under climate change. In a
recent study on the vulnerability of US and European electricity supply to climate change, van Vliet et al.
predict that water scarcity, lower summer river flows, and higher river water temperatures due to global
warming could lead to a -4.4 to -16 percent decrease in power plant capacity by 2060.136 Bartos and
Chester project that by mid-century, climate change may reduce average U.S. summertime generating
capacity by 1.027 GW, with potentially disruptive impacts occurring in California and the desert
Southwest.137 Vulnerable facilities account for 46 percent of existing capacity in the Western Electricity
Coordinating Council (WECC) region and, among individual facilities, impacts range from a -4 percent
increase in capacity to a -14 percent decrease in capacity.
7.2.2 Hydropower
The future role of hydropower depends primarily on how climate change will impact the availability and
variability of the water resources used for hydroelectricity generation. A 2013 DOE report entitled
“Effects of Climate Change on Federal Hydropower” concerning the effects of climate change on federal
hydropower projects a 2 percent reduction in hydroelectric generation due to changes in the timing and
total amount of water from runoff.138 Increased frequency and intensity of extreme weather events (e.g.,
droughts and floods) also pose significant operational challenges, particularly in systems with limited
reservoir storage or operational flexibility.
Weather and climate impacts on hydropower vary by region. California experienced a marked decrease in
hydropower generation through 2015 (Figure 35), due primarily to recent drought,139 but generation has
increased in 2016. Hydropower generation in New York, on the other hand, has remained essentially
stable and shown an upward trend in recent summers. In the Pacific Northwest, Oregon and Washington
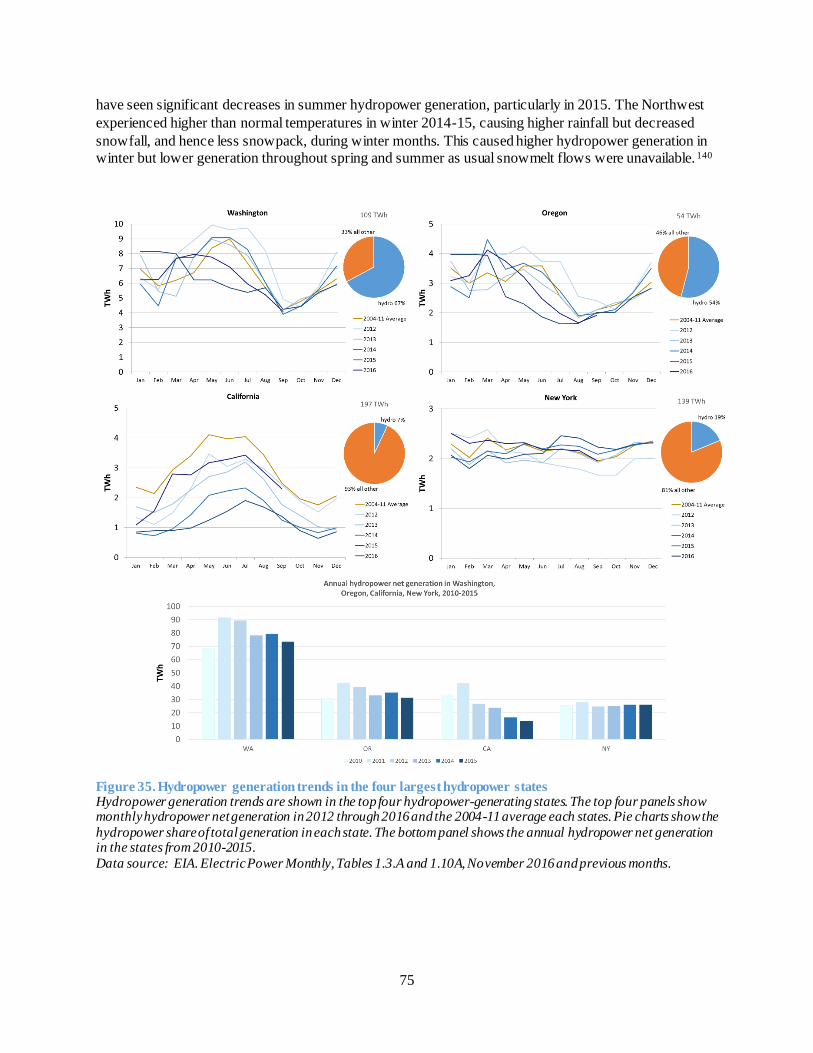
75
have seen significant decreases in summer hydropower generation, particularly in 2015. The Northwest
experienced higher than normal temperatures in winter 2014-15, causing higher rainfall but decreased
snowfall, and hence less snowpack, during winter months. This caused higher hydropower generation in
winter but lower generation throughout spring and summer as usual snowmelt flows were unavailable. 140
Figure 35. Hydropower generation trends in the four largest hydropower states Hydropower generation trends are shown in the top four hydropower-generating states. The top four panels show monthly hydropower net generation in 2012 through 2016 and the 2004-11 average each states. Pie charts show the
hydropower share of total generation in each state. The bottom panel shows the annual hydropower net generation in the states from 2010-2015.
Data source: EIA. Electric Power Monthly, Tables 1.3.A and 1.10A, November 2016 and previous months.

76
7.3 Summary and Conclusion
Climate change impacts such as higher temperatures, shifting precipitation patterns, and more frequent
extreme events may intensify water stress on the electricity system in some areas of the United States.
Relevant water stresses include both water availability and water quality (particularly temperature), and
affect hydropower as well as thermoelectric generation. Solutions involving enhanced operational
flexibility may be required to address climate change impacts.
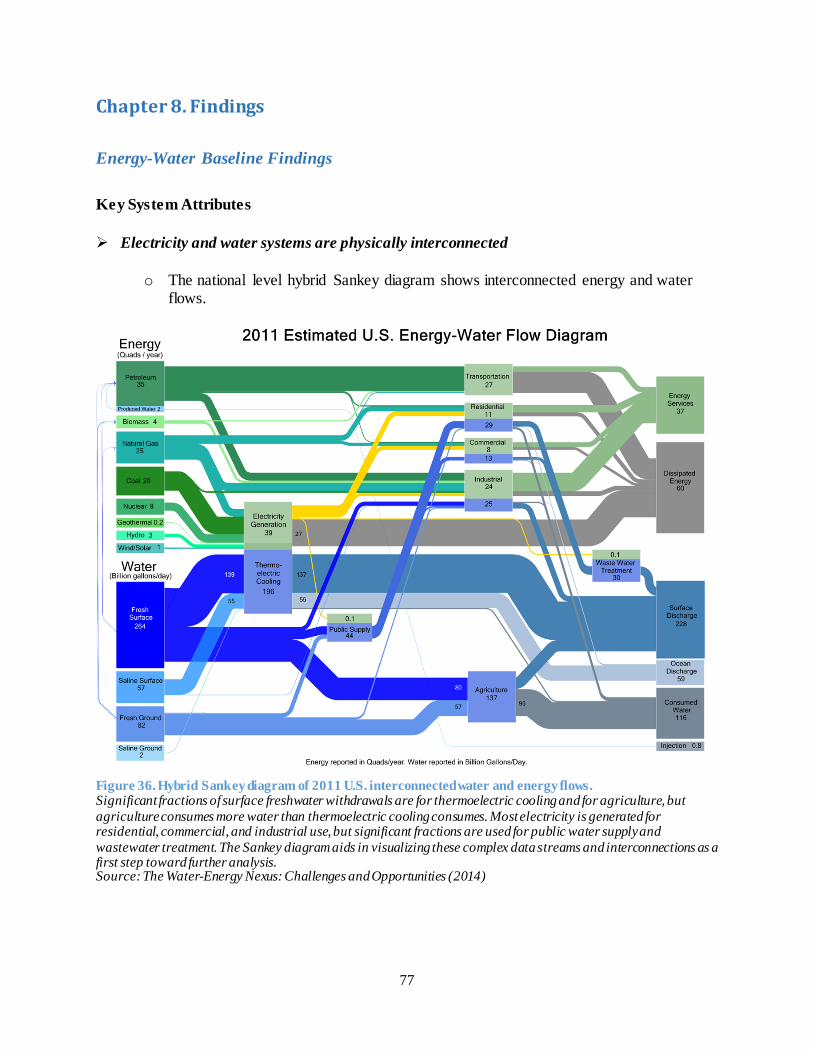
77
Chapter 8. Findings
Energy-Water Baseline Findings
Key System Attributes
Electricity and water systems are physically interconnected
o The national level hybrid Sankey diagram shows interconnected energy and water flows.
Figure 36. Hybrid Sankey diagram of 2011 U.S. interconnected water and energy flows. Significant fractions of surface freshwater withdrawals are for thermoelectric cooling and for agriculture, but
agriculture consumes more water than thermoelectric cooling consumes. Most electricity is generated for residential, commercial, and industrial use, but significant fractions are used for public water supply and
wastewater treatment. The Sankey diagram aids in visualizing these complex data streams and interconnections as a first step toward further analysis. Source: The Water-Energy Nexus: Challenges and Opportunities (2014)
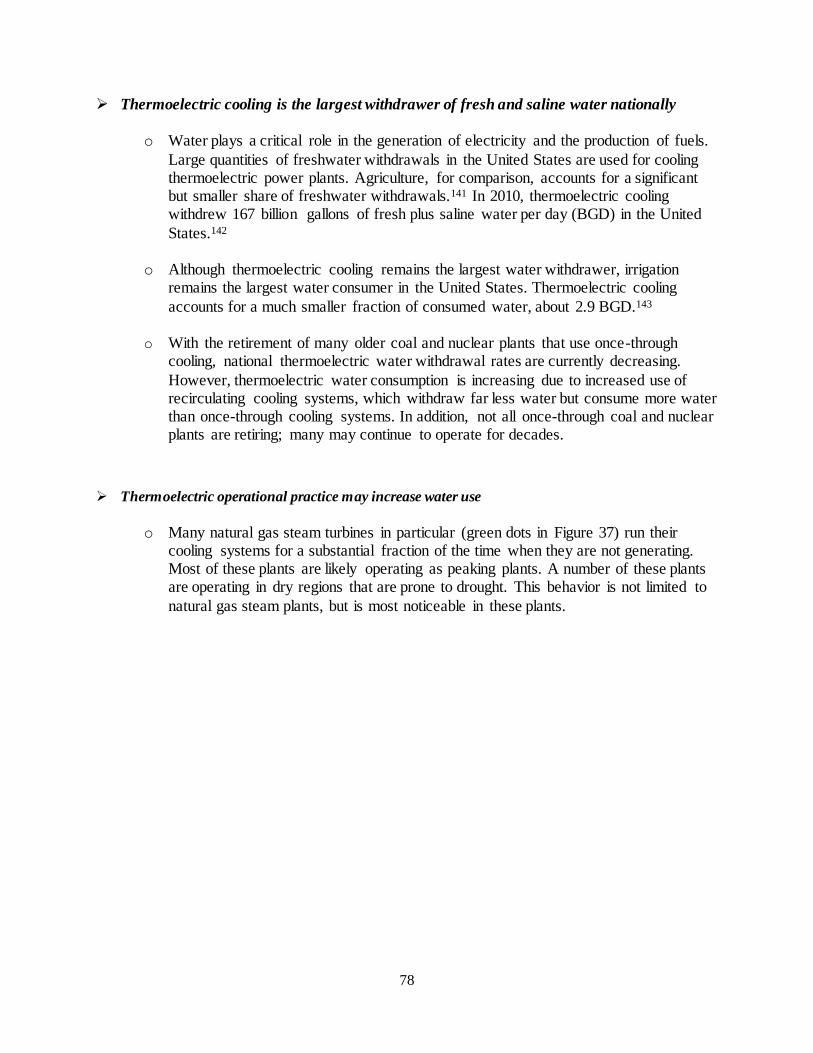
78
Thermoelectric cooling is the largest withdrawer of fresh and saline water nationally
o Water plays a critical role in the generation of electricity and the production of fuels.
Large quantities of freshwater withdrawals in the United States are used for cooling thermoelectric power plants. Agriculture, for comparison, accounts for a significant but smaller share of freshwater withdrawals.141 In 2010, thermoelectric cooling withdrew 167 billion gallons of fresh plus saline water per day (BGD) in the United
States.142
o Although thermoelectric cooling remains the largest water withdrawer, irrigation remains the largest water consumer in the United States. Thermoelectric cooling
accounts for a much smaller fraction of consumed water, about 2.9 BGD.143
o With the retirement of many older coal and nuclear plants that use once-through cooling, national thermoelectric water withdrawal rates are currently decreasing.
However, thermoelectric water consumption is increasing due to increased use of recirculating cooling systems, which withdraw far less water but consume more water than once-through cooling systems. In addition, not all once-through coal and nuclear plants are retiring; many may continue to operate for decades.
Thermoelectric operational practice may increase water use
o Many natural gas steam turbines in particular (green dots in Figure 37) run their cooling systems for a substantial fraction of the time when they are not generating. Most of these plants are likely operating as peaking plants. A number of these plants are operating in dry regions that are prone to drought. This behavior is not limited to
natural gas steam plants, but is most noticeable in these plants.
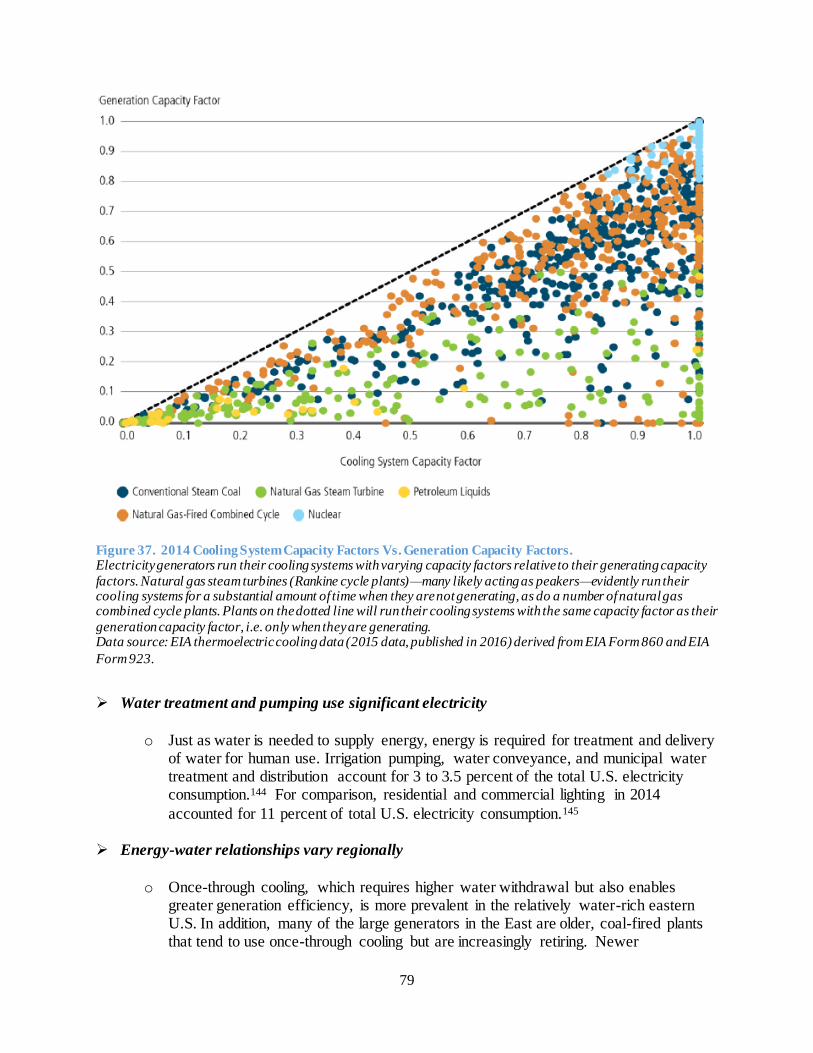
79
Figure 37. 2014 Cooling System Capacity Factors Vs. Generation Capacity Factors. Electricity generators run their cooling systems with varying capacity factors relative to their generating capacity
factors. Natural gas steam turbines (Rankine cycle plants)—many likely acting as peakers—evidently run their cooling systems for a substantial amount of time when they are not generating, as do a number of natural gas combined cycle plants. Plants on the dotted line will run their cooling systems with the same capacity factor as their
generation capacity factor, i.e. only when they are generating. Data source: EIA thermoelectric cooling data (2015 data, published in 2016) derived from EIA Form 860 and EIA
Form 923.
Water treatment and pumping use significant electricity
o Just as water is needed to supply energy, energy is required for treatment and delivery of water for human use. Irrigation pumping, water conveyance, and municipal water treatment and distribution account for 3 to 3.5 percent of the total U.S. electricity consumption.144 For comparison, residential and commercial lighting in 2014
accounted for 11 percent of total U.S. electricity consumption.145
Energy-water relationships vary regionally
o Once-through cooling, which requires higher water withdrawal but also enables greater generation efficiency, is more prevalent in the relatively water-rich eastern U.S. In addition, many of the large generators in the East are older, coal-fired plants that tend to use once-through cooling but are increasingly retiring. Newer
80
thermoelectric plants, such as those more common in the West, tend to use recirculating cooling. Figure 38 below shows quantitatively that regions of high water withdrawal for thermoelectric generation (dominated for all regions by surface water
withdrawal) correlate with significant coal-fired and nuclear generation. The western U.S. has a lower water withdrawal that correlates with more diverse generation portfolios and smaller overall shares of coal and nuclear.
Figure 38. Water Withdrawal and Generation by Region in 2015 The largest water withdrawal regions are dominated by coal and/or nuclear generation. The area of each pie chart
corresponds to total power generation in that region. “Other” includes petroleum, other fossil fuel gases, pumped storage, non-biogenic municipal solid waste, batteries, and hydrogen. The eight regions shown in the figure are notional, based upon contiguous groupings of states and their generation mixes, resources, and market structures.
Data Source: EIA Form 923 (2015 data, published in 2016).
Proportion of hydropower capacity owned by the government brings operational and
capital investment implications
o Many large hydropower plants are government-owned. As of 2014, federal agencies
including the U.S. Army Corps of Engineers, the Bureau of Reclamation, and the Tennessee Valley Authority own approximately half of the current installed hydropower capacity.146 Many of the largest conventional hydroelectric facilities are federally owned, while many of the largest pumped storage facilities are nonfederal.
81
o Of the federal hydropower owners, only TVA actually sells the power produced at its
facilities. Power produced at ACE and BOR facilities is marketed and sold by DOE’s
Power Marketing Administrations (PMAs). In some cases, PMAs must receive appropriations from Congress for modernization and general maintenance of federal facilities;u this situation has potential to limit funding available for upgrades to enable more flexible operation and ancillary services provision.147
Energy and water policy landscape is highly fragmented
o The energy-water decision landscape is highly complex and fragmented. This is a
result of multiple factors, including the distribution of jurisdictional responsibility among federal, state, and local law-makers; inherent differences in resource abundance and historical resource development across the nation; and a diverse set of actors and interests.
o State-level water rights and permitting inform the decisionmaking of any significant
water user. Because water issues vary greatly by region, water resource policies—even policy frameworks—can vary greatly from state to state.148 With respect to
surface water, states generally follow some variation of two governance doctrines—the prior appropriation doctrine and the riparian doctrine. Under the prior appropriation doctrine, water allocation is made on a first-come, first-serve basis and not linked to land ownership; during times of shortage, more senior rights holders
may use available water before more junior rights holders.149 Under the riparian doctrine, also called the “common law” doctrine, owners of land bordering waterways have a right to use water that flows past the land for any reasonable purpose. Figure 39, below, displays water rights doctrines by state.
u The Bonneville Power Administration (BPA), unlike the other three PMAs, is self-financed and thus receives no
federal appropriations. BPA covers its operating costs through power rates set to repay Treasury capital and interest. In addition, the 1992 National Energy Policy Act authorizes direct funding by BPA for the Corps of Engineers and Bureau of Reclamation for O&M and capital investments in the Federal Columbia River Power System (FCRPS).
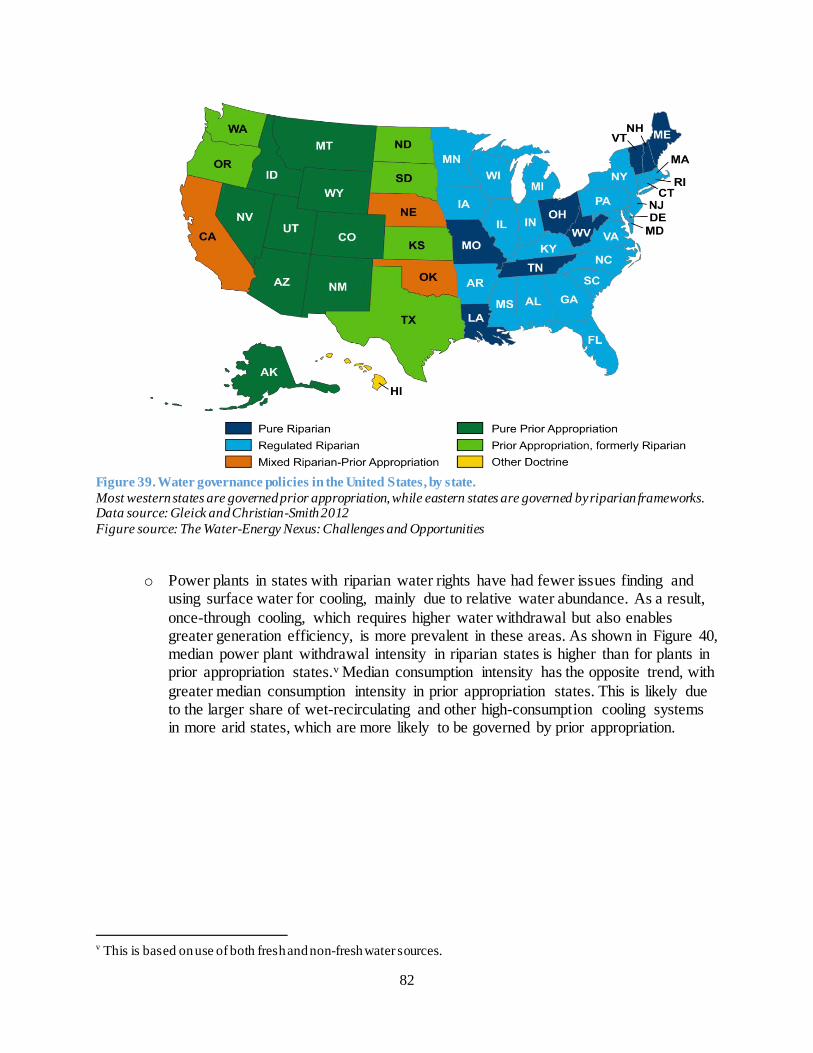
82
Figure 39. Water governance policies in the United States, by state.
Most western states are governed prior appropriation, while eastern states are governed by riparian frameworks. Data source: Gleick and Christian-Smith 2012
Figure source: The Water-Energy Nexus: Challenges and Opportunities
o Power plants in states with riparian water rights have had fewer issues finding and using surface water for cooling, mainly due to relative water abundance. As a result,
once-through cooling, which requires higher water withdrawal but also enables greater generation efficiency, is more prevalent in these areas. As shown in Figure 40, median power plant withdrawal intensity in riparian states is higher than for plants in prior appropriation states.v Median consumption intensity has the opposite trend, with
greater median consumption intensity in prior appropriation states. This is likely due to the larger share of wet-recirculating and other high-consumption cooling systems in more arid states, which are more likely to be governed by prior appropriation.
v This is based on use of both fresh and non-fresh water sources.
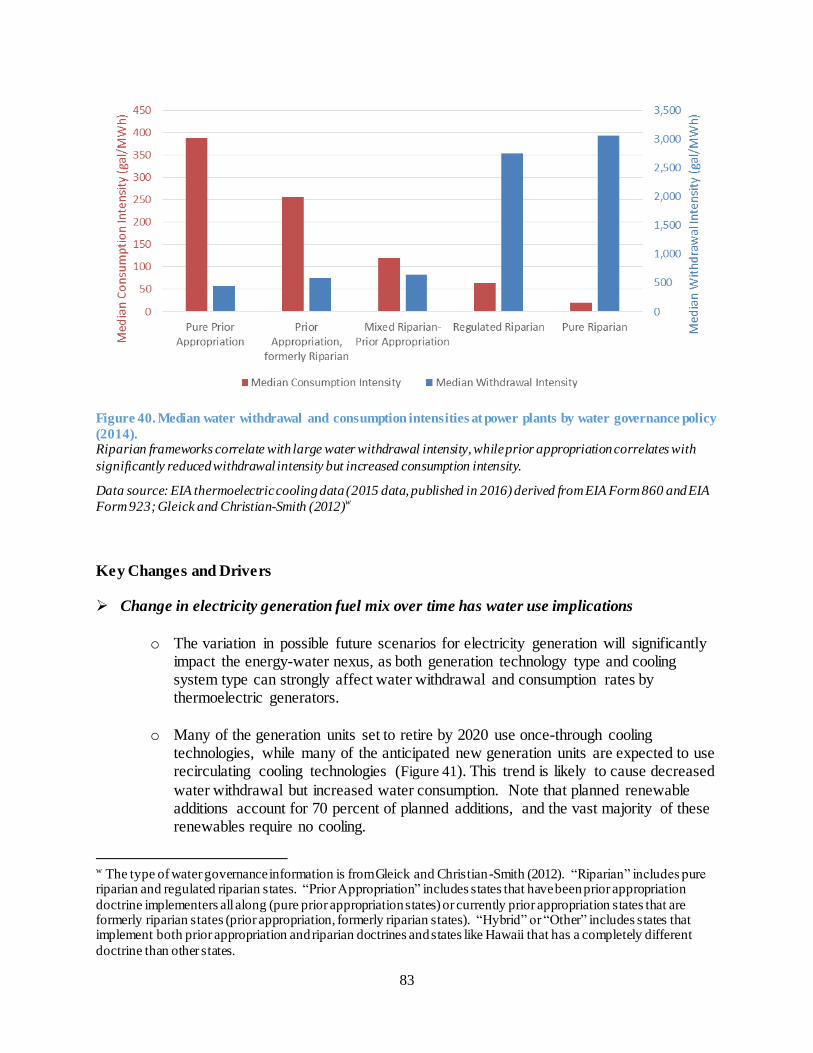
83
Figure 40. Median water withdrawal and consumption intensities at power plants by water governance policy
(2014). Riparian frameworks correlate with large water withdrawal intensity, while prior appropriation correlates with
significantly reduced withdrawal intensity but increased consumption intensity.
Data source: EIA thermoelectric cooling data (2015 data, published in 2016) derived from EIA Form 860 and EIA
Form 923; Gleick and Christian-Smith (2012)w
Key Changes and Drivers
Change in electricity generation fuel mix over time has water use implications
o The variation in possible future scenarios for electricity generation will significantly impact the energy-water nexus, as both generation technology type and cooling system type can strongly affect water withdrawal and consumption rates by thermoelectric generators.
o Many of the generation units set to retire by 2020 use once-through cooling
technologies, while many of the anticipated new generation units are expected to use recirculating cooling technologies (Figure 41). This trend is likely to cause decreased
water withdrawal but increased water consumption. Note that planned renewable additions account for 70 percent of planned additions, and the vast majority of these renewables require no cooling.
w The type of water governance information is from Gleick and Christian-Smith (2012). “Riparian” includes pure riparian and regulated riparian states. “Prior Appropriation” includes states that have been prior appropriation
doctrine implementers all along (pure prior appropriation states) or currently prior appropriation states that are formerly riparian states (prior appropriation, formerly riparian states). “Hybrid” or “Other” includes states that implement both prior appropriation and riparian doctrines and states like Hawaii that has a completely different
doctrine than other states.
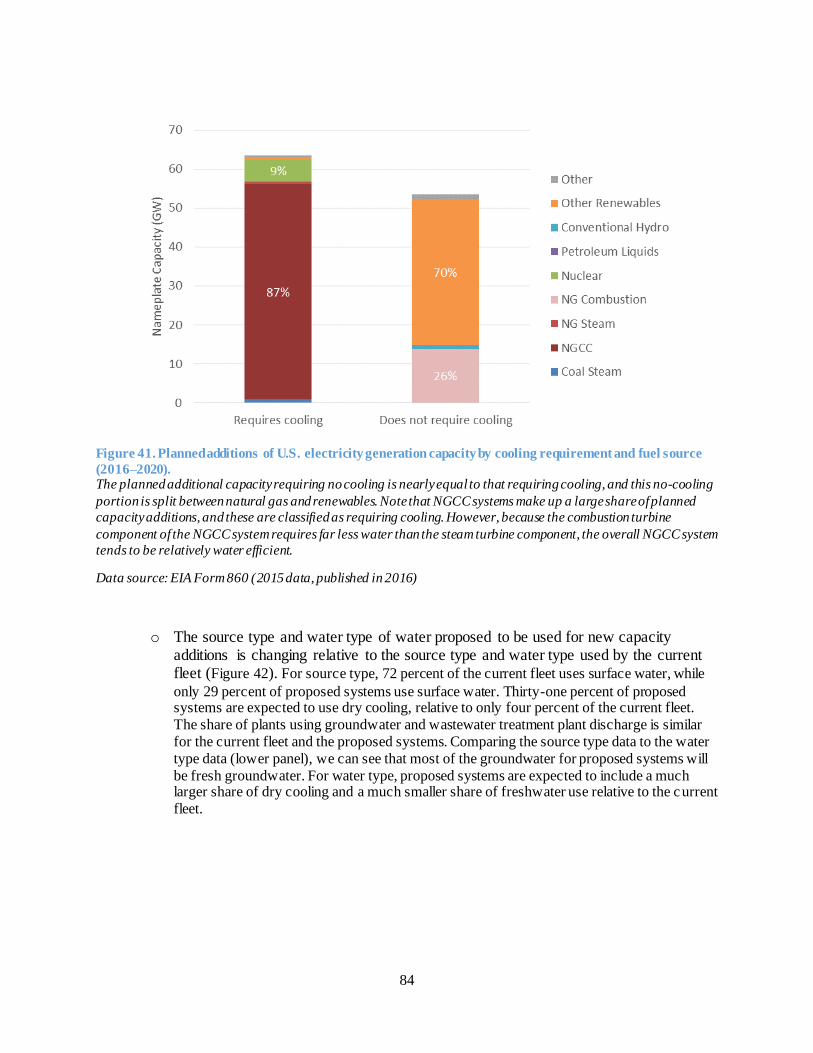
84
Figure 41. Planned additions of U.S. electricity generation capacity by cooling requirement and fuel source
(2016–2020). The planned additional capacity requiring no cooling is nearly equal to that requiring cooling, and this no-cooling
portion is split between natural gas and renewables. Note that NGCC systems make up a large share of planned
capacity additions, and these are classified as requiring cooling. However, because the combustion turbine
component of the NGCC system requires far less water than the steam turbine component, the overall NGCC system
tends to be relatively water efficient.
Data source: EIA Form 860 (2015 data, published in 2016)
o The source type and water type of water proposed to be used for new capacity additions is changing relative to the source type and water type used by the current fleet (Figure 42). For source type, 72 percent of the current fleet uses surface water, while
only 29 percent of proposed systems use surface water. Thirty-one percent of proposed systems are expected to use dry cooling, relative to only four percent of the current fleet.
The share of plants using groundwater and wastewater treatment plant discharge is similar
for the current fleet and the proposed systems. Comparing the source type data to the water
type data (lower panel), we can see that most of the groundwater for proposed systems will
be fresh groundwater. For water type, proposed systems are expected to include a much larger share of dry cooling and a much smaller share of freshwater use relative to the current
fleet.
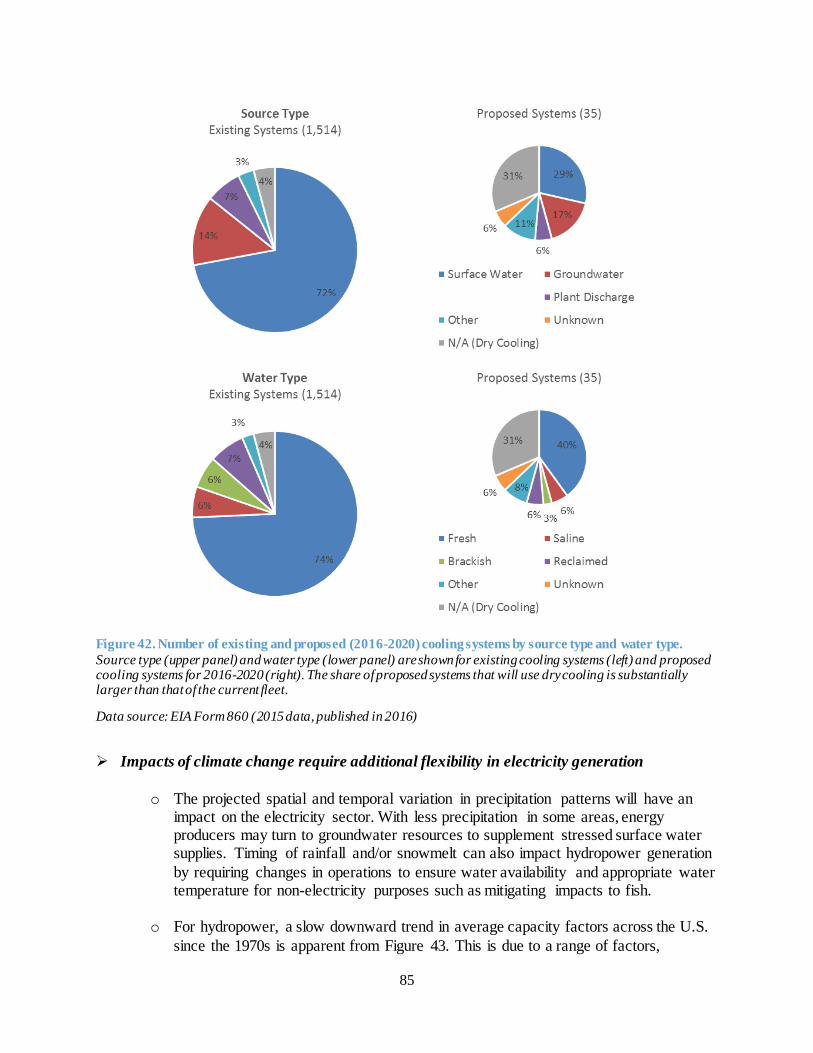
85
Figure 42. Number of existing and proposed (2016-2020) cooling systems by source type and water type.
Source type (upper panel) and water type (lower panel) are shown for existing cooling systems (left) and proposed cooling systems for 2016-2020 (right). The share of proposed systems that will use dry cooling is substantially larger than that of the current fleet.
Data source: EIA Form 860 (2015 data, published in 2016)
Impacts of climate change require additional flexibility in electricity generation
o The projected spatial and temporal variation in precipitation patterns will have an impact on the electricity sector. With less precipitation in some areas, energy producers may turn to groundwater resources to supplement stressed surface water supplies. Timing of rainfall and/or snowmelt can also impact hydropower generation
by requiring changes in operations to ensure water availability and appropriate water temperature for non-electricity purposes such as mitigating impacts to fish.
o For hydropower, a slow downward trend in average capacity factors across the U.S.
since the 1970s is apparent from Figure 43. This is due to a range of factors,
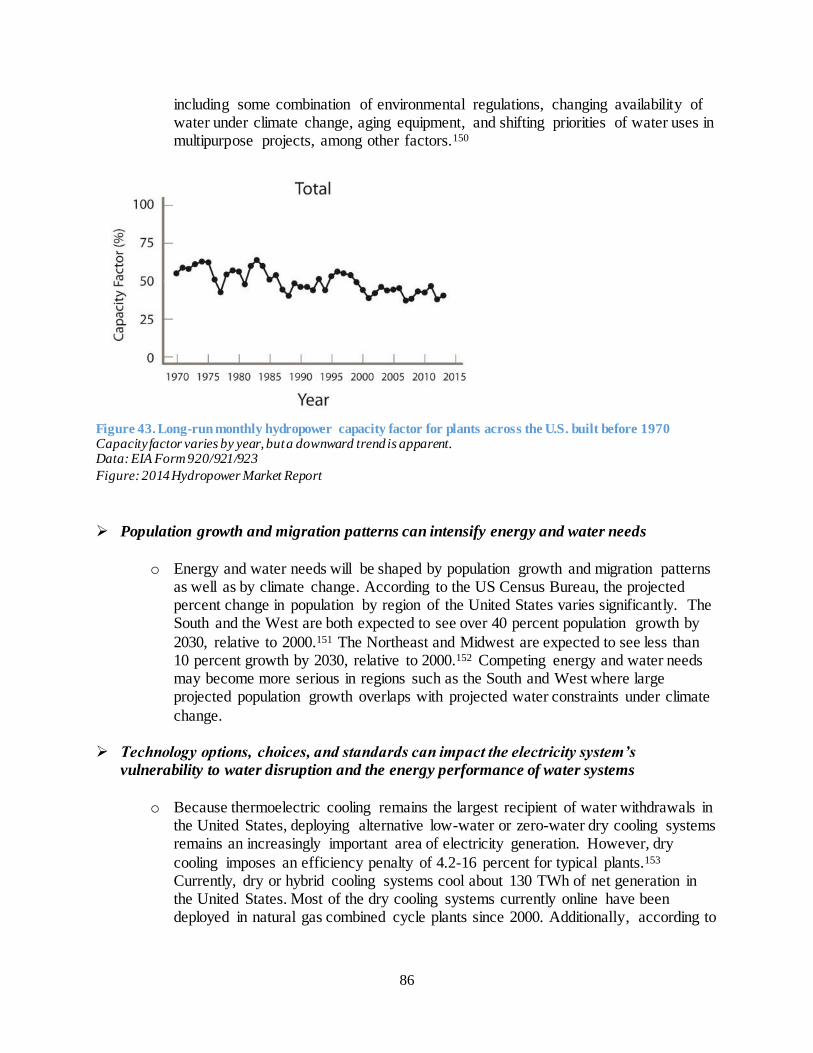
86
including some combination of environmental regulations, changing availability of water under climate change, aging equipment, and shifting priorities of water uses in multipurpose projects, among other factors.150
Figure 43. Long-run monthly hydropower capacity factor for plants across the U.S. built before 1970 Capacity factor varies by year, but a downward trend is apparent. Data: EIA Form 920/921/923
Figure: 2014 Hydropower Market Report
Population growth and migration patterns can intensify energy and water needs
o Energy and water needs will be shaped by population growth and migration patterns as well as by climate change. According to the US Census Bureau, the projected percent change in population by region of the United States varies significantly. The South and the West are both expected to see over 40 percent population growth by
2030, relative to 2000.151 The Northeast and Midwest are expected to see less than 10 percent growth by 2030, relative to 2000.152 Competing energy and water needs may become more serious in regions such as the South and West where large projected population growth overlaps with projected water constraints under climate
change.
Technology options, choices, and standards can impact the electricity system’s
vulnerability to water disruption and the energy performance of water systems
o Because thermoelectric cooling remains the largest recipient of water withdrawals in
the United States, deploying alternative low-water or zero-water dry cooling systems remains an increasingly important area of electricity generation. However, dry
cooling imposes an efficiency penalty of 4.2-16 percent for typical plants.153 Currently, dry or hybrid cooling systems cool about 130 TWh of net generation in the United States. Most of the dry cooling systems currently online have been deployed in natural gas combined cycle plants since 2000. Additionally, according to
87
the most recent data collected by EIA, 11 new dry cooling systems are expected to be operational by 2020.
o Wide-scale deployment of carbon capture and storage (CCS) could increase the demand for water for electricity production. The extent of the water demand increase is dependent on the CCS technology used.
o One example of how the development of standards can advance energy efficiency involves pumps; DOE has regulatory authority over pumps, including water pumps. In 2016, DOE finalized new energy conservation standards for pumps with compliance required starting in 2020.x These standards could result in significant
energy savings through minimum efficiency standards. Moreover, requirements for compliance with these standards could have the ancillary benefit of enhanced data collection on energy use by pumps.
Market structures and behavior impact hydropower’s ability to fully realize its potential
value to the electricity system.
o Ancillary services provided by hydropower are not always explicitly compensated
by existing market structures. For example, hydropower is one of the main providers of inertia and primary frequency response in WECC, but it is not explicitly
compensated for either service.154
o Although variable speed generators are widely deployed in Japan and throughout Europe, none have yet been deployed in U.S. pumped storage, despite findings that
existing pumped storage plants in the U.S. could increase revenues by 61 percent by upgrading existing capacity through mechanical changes such as advanced turbines.155 Europe’s wider deployment of pumped storage (including variable speed generators) relative to the U.S. has been due to a number of factors, including more
expensive natural gas, higher VER penetration, significant carbon trading, larger feed-in tariffs, and ancillary services payments.156 The distinctions of response speed are particularly important for balancing variable renewables, which require fast response down to the sub-second time scale.
Challenges and Opportunities
Data limitations can hinder analysis in the energy-water nexus
o Analysis of various aspects of the energy-water nexus suffer from a lack of data of
sufficient quality, usability, and spatial and temporal resolution. Enhanced and more widely distributed remote sensing, smart metering, networks of real-time sensors,
x 10 C.F.R. 429, 10 C.F.R. 431. The Energy Policy and Conservation Act of 1975 (EPCA), as amended, sets forth a variety of provisions designed to improve energy efficiency. Part C of Title III establishes the “Energy Conservation
Program for Certain Industrial Equipment.” The covered equipment includes pumps.
88
improved survey methods, and attendant summarization and analytic capabilities, would provide a basis for improved analysis, modeling, and decision support.
o There are some inconsistencies between USGS and EIA thermoelectric water withdrawal data values. Improved harmonization and integration of energy-water data sets, particularly among federal agencies, is a critical need for improving confidence in the data and allowing advanced analyses of regional variability and trends over
time.
o While EIA collects commercial and industrial energy use data through its surveys, it doesn’t collect data on energy used by the water sector for municipal water and
wastewater treatment and conveyance – making analysis of energy use and savings opportunities difficult.
Technologies deployed will create tradeoffs among energy, water, and GHG emissions
o Improvements in power plant efficiency could lead to substantial reductions in water
use.
o Some energy technologies that reduce GHG emissions, such as CCS, CSP, and geothermal, have the potential to increase energy’s water intensity; others, such as wind and PV, can lower it.
o Dry cooling can reduce water intensity, but may increase overall GHG emissions by decreasing generation efficiency.
The U.S. could potentially learn from integrated energy and water policy pursued by other
countries
o Policy challenges related to energy and water are not unique to the United States;
many other nations are addressing the energy-water nexus based on their own circumstances. Therefore, the United States could consider best practices from a wide range of efforts in water-scarce countries to integrate energy and water policies.

89
References
1 DOE. The Water-Energy Nexus: Challenges and Opportunities. 2014. 2 EIA thermoelectric cooling data (2015 data, published in 2016) derived from EIA Form 860 and EIA Form 923. 3 Carney, B. Reducing freshwater consumption at coal-fired power plants: Approaches used outside the US. NETL.
2011. 4 Meldrum, J., S. Nettles-Anderson, G. Heath, and J. Macknick. 2013. “Life cycle water use for electricity generation: a review and harmonization of literature estimates.” Environ. Res. Let. 8. 5 NETL. DOE/NETL Carbon Dioxide Capture and Storage RD&D Roadmap. Morgantown, WV, National Energy Technology Laboratory: 78. 2010. 6 DOE. Supercritical CO2 Tech Team. http://energy.gov/under-secretary-science-and-energy/supercritical-co2-tech-
team 7 Zammit, K. Water Conservation Options for Power Generation Facilities. http://www.powermag.com/water-
conservation-options-for-power-generation-facilities/?printmode=1. 2012. 8 Carney, B. Reducing freshwater consumption at coal-fired power plants: Approaches used outside the US. NETL. 2011. 9 EIA thermoelectric cooling data (2015 data, published in 2016) derived from EIA Form 860 and EIA Form 923. 10 EPRI (Electric Power Research Institute). 2012. Economic Evaluation of Alternative Cooling Technologies. Palo Alto, CA: EPRI. 1024805. 11 NETL (2010). “National Carbon Sequestration Database and Geographic Information System (NATCARB).” National Energy Technology Laboratory. http://www.netl.doe.gov/technologies/carbon_seq?natcarb/index/html. 12 Meldrum, J., S. Nettles-Anderson, G. Heath, and J. Macknick. 2013. “Life cycle water use for electricity
generation: a review and harmonization of literature estimates.” Environ. Res. Let. 8. 13 NETL (2010). “National Carbon Sequestration Database and Geographic Information System (NATCARB).”
National Energy Technology Laboratory. http://www.netl.doe.gov/technologies/carbon_seq?natcarb/index/html. 14 Bourcier, W. L., T. J. Wolery, et al. (2011). "A preliminary cost and engineering estimate for desalinating produced formation water associated with carbon dioxide capture and storage." International Journal of Greenhouse
Gas Control 5(5): 1319-1328. 15 Tidwell, V., L. A. Malczynski, et al. (2013). "Potential Impacts of Electric Power Production Utilizing Natural Gas, Renewables and Carbon Capture and Sequestration on U.S. Freshwater Resources." Environmental Science & Technology. 16 NETL (2013). DOE/NETL Advanced Carbon Dioxide Capture R&D Program: Technology Update. Morgantown,
WV, National Energy Technology Laboratory: 719. 17 Keairns, D., R. Newby, et al. (2012). Current and Future Technologies for Power Generation with Post -Combustion Carbon Capture. Morgantown, WV, National Energy Technology Laboratory: 229. 18 Boot-Handford, M. E., J. C. Abanades, et al. (2014). "Carbon capture and storage update." Energy & Environmental Science 7(1): 130-189. 19 Alonso, M., N. Rodriguez, et al. (2010). "Carbon dioxide capture from combustion flue gases with a calcium
oxide chemical loop. Experimental results and process development." International Journal of Greenhouse Gas Control 4(2): 167-173. 20 Blamey, J., E. J. Anthony, et al. (2010). "The calcium looping cycle for large-scale CO2 capture." Progress in Energy and Combustion Science 36(2): 260-279. 21 D'Alessandro, D. M., B. Smit, et al. (2010). "Carbon Dioxide Capture: Prospects for New Materials." Angewandte
Chemie-International Edition 49(35): 6058-6082 22 Kumar, A., S. Ergas, et al. (2010). "Enhanced CO2 fixation and biofuel production via microalgae: recent developments and future directions." Trends in Biotechnology 28(7): 371-380. 23 EIA. Form 860. 2016. 24 EIA. Electric Power Monthly (2015 data). 2016. 25 EIA. Electric Power Annual (2015 data). 2016. 26 EIA. Electric Power Annual (2015 data). 2016. 27 EIA. Nonhydro electricity storage increasing as new policies are implemented. Today in Energy. 2015. 28 DOE. Hydropower Market Report. 2014. 29 ACE. Authorized and Operating Purposes of Corps of Engineers Reservoirs. 1994. 30 ACE. Authorized and Operating Purposes of Corps of Engineers Reservoirs. 1994.
90
31 BOR. Hydropower Program: Lease of Power Privilege. http://www.usbr.gov/power/LOPP/. Accessed December 2016. 32 CRS. Power Marketing Administrations: Background and Current Issues. RS22564. 2008. 33 DOE. Hydropower Vision. 2016. 34 DOE. Hydropower Vision. 2016. 35 DOE. Hydropower Vision. 2016. 36 DOE. Hydropower Market Report. 2014. 37 FERC. http://www.ferc.gov/resources/projectsearch/SearchProjects.aspx. 2016. 38 DOE. Hydropower Market Report. 2014. 39 McManamay et al. Classification Of US Hydropower Dams By Their Modes Of Operation. 2016. 40 Sandia. Market and Policy Barriers to Energy Storage Deployment. 2013. 41 DOE. Hydropower Vision. 2016. 42 DOE. Hydropower Vision. 2016. 43 DOE. Hydropower Vision. 2016. 44 DOE. Hydropower Vision. 2016. 45 EPRI. Quantifying the Value of Hydropower in the Electric Grid: Final Report. 2013. 46 EPRI. Quantifying the Value of Hydropower in the Electric Grid: Final Report. 2013. 47 EPRI. Quantifying the Value of Hydropower in the Electric Grid: Final Report. 2013. 48 DOE. Hydropower Vision. 2016. 49 DOE. Hydropower Vision. 2016. 50 DOE. Hydropower Vision. 2016. 51 DOE. Hydropower Vision. 2016. 52 DOE. Hydropower Vision. 2016. 53 DOE. An Assessment of Energy Potential at Non-powered Dams in the United States. 2012. 54 DOE. New Stream Reach Development: A Comprehensive Assessment of Hydropower Energy Potential in the United States. 2014. 55 DOE. Hydropower Vision. 2016. 56 DOE. Hydropower Market Report. 2014. 57 DOE. Hydropower Market Report. 2014. 58 EPA (U.S. Environmental Protection Agency). 2007. “Factoids: drinking water and ground water statistics for 2007”. March 2008, April 2008. Accessed March 9, 2016. 59 DOE. The Water-Energy Nexus: Challenges and Opportunities. 2014. 60 EIA. “How much electricity is used for lighting in the United States?” https://www.eia.gov/tools/faqs/faq.cfm?id=99&t=3. 2016. 61 Klein, G. (2005). California's Water – Energy Relationship. Sacramento, CA, California Energy Commission: 180. 62 Klein, G. (2005). California's Water – Energy Relationship. Sacramento, CA, California Energy Commission:
180. 63 Klein, G. (2005). California's Water – Energy Relationship. Sacramento, CA, California Energy Commission: 180. 64 Klein, G. (2005). California's Water – Energy Relationship. Sacramento, CA, California Energy Commission: 180. 65 Klein, G. (2005). California's Water – Energy Relationship. Sacramento, CA, California Energy Commission: 180. 66 CPUC (2010). Statewide and Regional Water-Energy Relationship. Embedded Energy in Water Studies.
Sacramento, CA, California Public Utilities Commission: 155. 67 Burton, F.L. 1996. Water and Wastewater Industries: Characteristics and Energy Management Opportunities. Palo Alto, CA: Electric Power Research Institute. 68 Electric Power Research Institute (EPRI). 2000. Water and Sustainability: U.S. Electricity Consumption for Water Supply & Treatment—The Next Half Century. Palo Alto, CA: EPRI. 69 Electric Power Research Institute (EPRI). 2013. Electricity and Water Management in the Municipal Water Supply and Wastewater Industries. Palo Alto, CA: EPRI. 70 Guerra, K.L., K.G. Dahm, and S. Dundorf. 2011. Oil and Gas Produced Water Management and Beneficial Use in
the Western United States. Denver, CO: U.S. Bureau of Reclamation.
91
71 Hancock, N.T., N.D. Black, and T.Y. Cath. 2012. "A comparative life cycle assessment of hybrid osmotic dilution desalination and established seawater desalination and wastewater reclamation processes." Water Research 46(4):
1145–1154. 72 California Energy Commission (CEC). 2005. California's Water-Energy Relationship. Sacramento, CA: CEC. 73 Amarnath, A., B. Goldstein, et al. (2013). Electricity Use and Management in the Municipal Water Supply and
Wastewater Industries. Palo Alto, CA, Electric Power Research Institute: 194. 74 WERF (2011). Energy Production and Efficiency Research – The Roadmap to Net-Zero Energy. Alexandria, VA. Water Environment Research Foundation: 8. 75 WEF (2012). Drinking Water and Wastewater Utilities to More Sustainable Energy Management. Alexandria, Va. Water Environment Federation: 16. 76 NRC (National Research Council). 2008. Water Implications of Biofuels Production in the United States. Washington, DC: The National Academies Press. 77 von Medeazza, G. L. M. 2005. “Direct and socially-induced environmental impacts of desalination” Desalination
185 (1-3):57-70. doi:10.1016/j.desal.2005.03.071 78 Fritzmann, C., J. Lowenberg, T. Wintgens, and T. Melin, 2007. “State-of-the-art of reverse osmosis desalination”. Desalination 216 (1): 1-76. doi:10.1016/j.desal.2006.12.009 79 Poseidon Water. Carlsbad Desalination Plant. http://carlsbaddesal.com/desalination-plant. Accessed December 2016. 80 Bodik and Kubaska, Energy and Sustainability of Operation of a Wastewater Treatment Plant. Environmental Protection Engineering 39. 2013. 81 Bodik and Kubaska, Energy and Sustainability of Operation of a Wastewater Treatment Plant. Environmental
Protection Engineering 39. 2013. 82 Bodik and Kubaska, Energy and Sustainability of Operation of a Wastewater Treatment Plant. Environmental Protection Engineering 39. 2013. 83 California Sustainability Alliance. The role of recycled water in energy efficiency and greenhouse gas reduction. Navigant Consulting. 2008. 84 Water Research Foundation. Desalination Facility Design and Operation for Maximum Efficiency. 2011. 85 GEI Consultants/Navigant Consulting. Embedded Energy in Water Studies, Study 1: Statewide and Regional Water-Energy Relationship. California Public Utilities Commission. 2010. 86 California Sustainability Alliance. The role of recycled water in energy efficiency and greenhouse gas reduction. Navigant Consulting. 2008. 87 Water Research Foundation. Desalination Facility Design and Operation for Maximum Efficiency. 2011. 88 Water Research Foundation. Desalination Facility Design and Operation for Maximum Efficiency. 2011. 89 Patel, M. Personal communication in 2011. Cited in Implications of Future Water Supply Sources for Energy
Demands, WateReuse, 2012. 90 Water Research Foundation. Desalination Facility Design and Operation for Maximum Efficiency. 2011. 91 Water Research Foundation. Desalination Facility Design and Operation for Maximum Efficiency. 2011. 92 Water Research Foundation. Desalination Facility Design and Operation for Maximum Efficiency. 2011. 93 Water Research Foundation. Desalination Facility Design and Operation for Maximum Efficiency. 2011. 94 WERF (2011). Energy Production and Efficiency Research – The Roadmap to Net-Zero Energy. Alexandria, VA.
Water Environment Research Foundation: 8. 95 Frijns, J., J. Hofman, et al. (2013). “The potential of (waste)water as energy carrier.” Energy Conversion and
Management 65:357-363. 96 DOE (2013). Energy Conservation Standards Rulemaking Framework Document for Commercial and Industrial Pumps. Washington, DC, Department of Energy: 134. 97 EPA. Opportunities for Combined Heat and Power at Wastewater Treatment Facilities: Market Analysis and Lessons from the Field U.S. Environmental Protection Agency Combined Heat and Power Partnership. October 2011. 98 Biofuels Digest. Wastewater treatment facilities turning to anaerobic digestion for energy uses. http://www.biofuelsdigest.com/bdigest/2015/10/25/wastewater-treatment-facilities-turning-to-anaerobic-digestion-
for-energy-uses/. 2015. 99 EPA. 2006 Community Water System Survey. 2006. 100 WEF (2012). Drinking Water and Wastewater Utilities to More Sustainable Energy Management. Alexandria,
Va. Water Environment Federation: 16. 101 Klein, G. (2005). California's Water – Energy Relationship. Sacramento, CA, California Energy Commission: 180.
92
102 Stokes, J. R. and A. Horvath (2009). "Energy and Air Emission Effects of Water Supply." Environmental Science & Technology 43(8): 2680-2687. 103 Daw, J., K. Hallet, et al. (2012). Energy Efficiency Strategies for Municipal Wastewater Treatment Facilities Golden, CO, National Renewable Energy Laboratory: 25. 104 Averyt, K.,Macknick, J., Rogers, J., Madden, N., Fisher, J., Meldrum, J., Newmark, R. “Water Use for Electricity
in the United States: An Analysis of reported and Calculated Water Use Information for 2008”. Environmental Research Letters. 2013. 105 EIA. Water Data Collection in the 2007 CBECS.
http://www.eia.gov/consumption/commercial/reports/2007/hospital-water-data-collection.cfm#fn2ref. Accessed December 2016. 106 EIA. Water Data Collection in the 2007 CBECS. http://www.eia.gov/consumption/commercial/reports/2007/hospital-water-data-collection.cfm#fn2ref. Accessed December 2016. 107 Tidwell, V., L. A. Malczynski, et al. (2013). "Potential Impacts of Electric Power Production Utilizing Natural Gas, Renewables and Carbon Capture and Sequestration on U.S. Freshwater Resources." Environmental Science & Technology. 108 USGS. National Brackish Groundwater Assessment. http://water.usgs.gov/ogw/gwrp/brackishgw/approach.html. Accessed December 2016. 109 GAO. Energy-Water Nexus: Improvements to Federal Water Use Data Would Increase Understanding of Trends in Power Plant Water Use. 2009. 110 Kimmell, T. A., and J. A. Veil. 2009. Impact of Drought on U.S. Steam Electric Power Plant Cooling Water
Intakes and Related Water Resources Management Issues. DOE/NETL-2009/1364. Prepared by Argonne National Laboratory, Argonne, IL. Washington, DC: U.S. Department of Energy, National Energy Technology Laboratory. 111 Getches, David H. 2009. Water Law in a Nutshell. St. Paul, MN: West Publishing Co. 112 Kimmell, T. A., and J. A. Veil. 2009. Impact of Drought on U.S. Steam Electric Power Plant Cooling Water Intakes and Related Water Resources Management Issues. DOE/NETL-2009/1364. Prepared by Argonne National
Laboratory, Argonne, IL. Washington, DC: U.S. Department of Energy, National Energy Technology Laboratory. 113 Gleick, Peter H. and Juliet Christian-Smith. 2012. A Twenty-First Century US Water policy. New York: Oxford University Press. 114 Gleick, Peter H. and Juliet Christian-Smith. 2012. A Twenty-First Century US Water policy. New York: Oxford University Press. 115 Goldfarb, W. 1988. Water Law. Chelsea, MI: Lewis Publishers. 116 Gleick, Peter H. and Juliet Christian-Smith. 2012. A Twenty-First Century US Water policy. New York: Oxford University Press. 117 Goldfarb, W. 1988. Water Law. Chelsea, MI: Lewis Publishers. 118 Gleick, Peter H. and Juliet Christian-Smith. 2012. A Twenty-First Century US Water policy. New York: Oxford University Press. 119 Mittal, A., and M. Gaffigan. 2009. Energy-Water Nexus: Improvements to Federal Water Use Data Would Increase Understanding of Trends in Power Plant Water Use. Washington, DC: U.S. Government Accountability Office. 120 The Energy Foundation. The Last Straw: Water Use by Power Plants in the Arid West. 2003. 121 Adams-Ockrassa, Suzzane. 2010. “Hualapai Must Be Dry to Fly.” Daily Miner, October 21.
www.kingmandailyminer.com/main.asp?SectionID=1&SubsectionID=1&ArticleID=40780. 122 Gleick, Peter H. and Juliet Christian-Smith. 2012. A Twenty-First Century US Water policy. New York: Oxford University Press. 123 Gleick, Peter H. and Juliet Christian-Smith. 2012. A Twenty-First Century US Water policy. New York: Oxford University Press. 124 Veil, J. A. 1993. Impact on the Steam Electric Power Industry of deleting section 316(a) of the Clean Water Act:
Energy and Environmental Impacts, ANL/EAIS-5. Argonne, IL: Argonne National Laboratory. 125 Kimmell, T. A., and J. A. Veil. 2009. Impact of Drought on U.S. Steam Electric Power Plant Cooling Water
Intakes and Related Water Resources Management Issues. DOE/NETL-2009/1364. Prepared by Argonne National Laboratory, Argonne, IL. Washington, DC: U.S. Department of Energy, National Energy Technology Laboratory. 126 EPA. Steam Electric Power Generating Effluent Guidelines - 2015 Final Rule. https://www.epa.gov/eg/steam-
electric-power-generating-effluent-guidelines-2015-final-rule. 2015 127 DOE. Hydropower Market Report. 2014. 128 DOE. Hydropower Market Report. 2014.

93
129 EPA. Clean Water State Revolving Fund: Fiscal Year 2014 National Financial Reports. 2015. 130 USGCRP (U.S. Global Climate change Research Program). 2014. Global Climate Change Impacts in the United
States: The Third National Climate Assessment. J. M. Melillo, Terese (T.C.) Richmond, and G. W. Yohe, Eds., U.S. Global Change Research Program, 19-67. doi:10.7930/J0KW5CXT. New York: Cambridge University Press. 131 DOE (U.S. Department of Energy). 2013. U.S. Energy Sector Vulnerabilities to Climate Change and Extreme
Weather. Washington, DC: DOE. 132 PRISM Climate Group. 2013. “PRISM Products Matrix.” Oregon State University. June 13. Accessed August 2-13. www.prism.oregonstate.edu/recent/. 133 U.S. Census Bureau. 2005 Interim State Population Projections. 2005. 134 U.S. Census Bureau. 2005 Interim State Population Projections. 2005. 135 Rogers, J., K. Averyt, S. Clemmer, M. Davis, F. Flores-Lopez, P. Frumhoff, D. Kenney, J. Macknick, N. Madden, J. Meldrum, J. Overpeck, S. Sattler, E. Spanger-Siegfried, and D. Yates (2013), Water-smart power: Strengthening the U.S. electricity system in a warming world, Union of Concerned Scientists, Cambridge, MA. 136 van Vliet, M. T. H., J. R. Yearsley, F. Ludwig, S. Vögele, D. P. Lettenmaier, and P. Kabat (2012), Vulnerability of US and European electricity supply to climate change, Nature Climate Change, 2, 676–681, doi:10.1038/nclimate1546. 137 Bartos, M. D., and M. V. Chester (2015), Impacts of climate change on electric power supply in the Western United States, Nature Climate Change, 5, 748–752, doi:10.1038/nclimate2648. 138 DOE. Effects of Climate Change on Federal Hydropower. Report to Congress. 2013. 139 EIA. California drought leads to less hydropower, increased natural gas generation. Today in Energy. 2014. 140 EIA. Pacific Northwest electricity mix influenced by weather conditions, El Niño. Today in Energy. 2015. 141 DOE. The Water-Energy Nexus: Challenges and Opportunities. 2014. 142 EIA thermoelectric cooling data (2015 data, published in 2016) derived from EIA Form 860 and EIA Form 923. 143 EIA thermoelectric cooling data (2015 data, published in 2016) derived from EIA Form 860 and EIA Form 923. 144 DOE, 2014. “The Water-Energy Nexus: Challenges and Opportunities.” Accessed December 5, 2016. 145 EIA. “How much electricity is used for lighting in the United States?”
https://www.eia.gov/tools/faqs/faq.cfm?id=99&t=3. 2016. 146 DOE. Hydropower Market Report. 2014. 147 CRS. Power Marketing Administrations: Background and Current Issues. RS22564. 2008. 148 Kimmell, T. A., and J. A. Veil. 2009. Impact of Drought on U.S. Steam Electric Power Plant Cooling Water 149 Getches, David H. 2009. Water Law in a Nutshell. St. Paul, MN: West Publishing Co. 150 DOE. Hydropower Market Report. 2014. 151 U.S. Census Bureau. 2005 Interim State Population Projections. 2005. 152 U.S. Census Bureau. 2005 Interim State Population Projections. 2005. 153 Carney, B. Reducing freshwater consumption at coal-fired power plants: Approaches used outside the US. NETL. 2011. 154 DOE. Hydropower Vision. 2016. 155 EPRI. Quantifying the Value of Hydropower in the Electric Grid: Final Report. 2013. 156 EPRI. Quantifying the Value of Hydropower in the Electric Grid: Final Report. 2013.