Embed Size (px)
Citation preview


Environment-based Education Programs in Schools
and Their Effects on Academic Achievement Outcomes
by
Erin Curtiss
A Thesis Submitted in partial fulfillment
of the requirements for the degree
Master of Environmental Studies
The Evergreen State College
August 2012

© 2012 by Erin Curtiss. All rights reserved.
This Thesis for the Master of Environmental Studies Degree
by
Erin Curtiss
has been approved for
The Evergreen State College
by
__________________________
Martha L. Henderson
Member of the Faculty
__________________________
Date

Abstract
Environment-based Education Programs in Schools
and Their Effects on Academic Achievement Outcomes
Erin Curtiss
The purpose of this study is to examine the educational efficacy of school
programs that utilize an environmental-based education approach. The study focuses on
k-12 school programs that incorporate the components of the Environment as an
Integrating Concept (EIC) framework developed by the State Education and Environment
Roundtable to evaluate their effects on student academic achievement. Study schools
that have been utilizing an environment-based approach for at least three years were
identified and compared to demographically similar comparison schools using a
traditional education approach. To evaluate the educational efficacy of environment-
based education academic outcomes were compared between the study and comparison
schools. The findings suggest that there is a large amount of variability between
environment-based education programs and their use of the EIC framework. Some of the
comparison pairs included in the present study produced stronger contrasts than others,
leading to more applicable results. Three of the nine comparison pairs met the
parameters set by the study in regard to their implementation of EIC practices. The
standardized tests and portfolio results of these schools/programs suggest that students
participating in EBE programs perform better than students engaged in traditional
programs.
iv
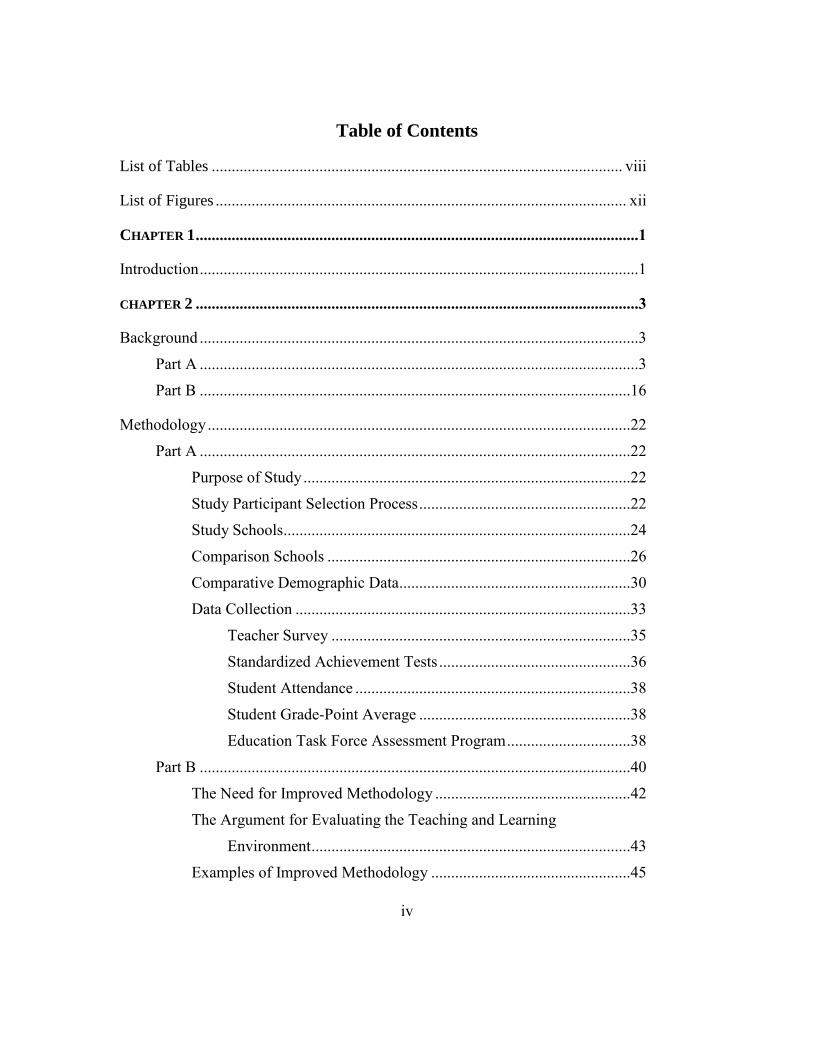
Table of Contents
List of Tables ....................................................................................................... viii
List of Figures ....................................................................................................... xii
CHAPTER 1 ...............................................................................................................1
Introduction ..............................................................................................................1
CHAPTER 2 ...............................................................................................................3
Background ..............................................................................................................3
Part A ..............................................................................................................3
Part B ............................................................................................................16
Methodology ..........................................................................................................22
Part A ............................................................................................................22
Purpose of Study ..................................................................................22
Study Participant Selection Process .....................................................22
Study Schools.......................................................................................24
Comparison Schools ............................................................................26
Comparative Demographic Data..........................................................30
Data Collection ....................................................................................33
Teacher Survey ...........................................................................35
Standardized Achievement Tests ................................................36
Student Attendance .....................................................................38
Student Grade-Point Average .....................................................38
Education Task Force Assessment Program ...............................38
Part B ............................................................................................................40
The Need for Improved Methodology .................................................42
The Argument for Evaluating the Teaching and Learning
Environment ................................................................................43
Examples of Improved Methodology ..................................................45

v
CHAPTER 3 .............................................................................................................50
Findings..................................................................................................................50
Teacher Surveys ............................................................................................50
School Profiles .....................................................................................50
Brookside Elementary School Profile (Study School)................50
Neil Cummins Elementary School Profile
(Comparison School) .........................................................53
Wade Thomas Elementary School Profile (Study School) .........55
Bel Aire Elementary School Profile (Comparison School) ........58
The Open Charter Elementary School Profile
(Study School) ...................................................................60
The Community Elementary School Profile
(Comparison School) .........................................................63
Laytonville Elementary /Middle School Profile
(Study School) ...................................................................65
Potter Valley Elementary/Junior High School Profile
(Comparison School) .........................................................70
Pinecrest Elementary/Middle School Profile (Study School) .....73
Bridgeport Elementary/Middle School Profile
(Comparison School) .........................................................75
Edna Maguire Elementary School Profile (Study School) .........77
Sir Francis Drake High School Profile (Study and
Comparison Programs) ......................................................80
Red Bluff High School Profile (Study and Comparison
Programs) ...........................................................................88
Lincoln High School Profile (Study and Comparison
Programs) ...........................................................................95
School Program Evaluation ...............................................................101

vi
Standardized Achievement Tests ................................................................107
Brookside Elementary – Neil Cummins Elementary .........................109
Wade Thomas Elementary – Bel Aire Elementary ............................110
Open Charter Elementary – Community Elementary ........................111
Laytonville Elementary/Middle – Potter Valley Elementary/
Middle .......................................................................................112
Pinecrest Elementary/Middle – Bridgeport Elementary/Middle .......113
Edna Maguire Elementary – Neil Cummins Elementary ..................114
Sir Francis Drake Integrated and Traditional Programs ....................115
Red Bluff Sacramento River Discover Center & Traditional
Program .....................................................................................116
Lincoln ISIS and Traditional Program ...............................................118
Student Attendance .....................................................................................119
Student Grade Point Average......................................................................120
Education Task Force Assessment Program ...............................................121
Brookside Elementary – Neil Cummins Elementary .........................121
Wade Thomas Elementary – Bel Aire Elementary ............................123
Edna Maguire Elementary – Neil Cummins Elementary ..................124
Sir Francis Drake Integrated and Traditional Programs ....................125
Ninth Grade ...............................................................................125
Tenth Grade ..............................................................................126
Twelfth Grade ...........................................................................128
CHAPTER 4 ...........................................................................................................130
Discussion ............................................................................................................130
Part A ..........................................................................................................130
Part B ..........................................................................................................133
Part C ..........................................................................................................138

vii
CHAPTER 5 ...........................................................................................................140
Conclusion ...........................................................................................................140
REFERENCES ........................................................................................................142
APPENDIX A .........................................................................................................147
APPENDIX B .........................................................................................................149
APPENDIX C .........................................................................................................157
APPENDIX D .........................................................................................................166
viii
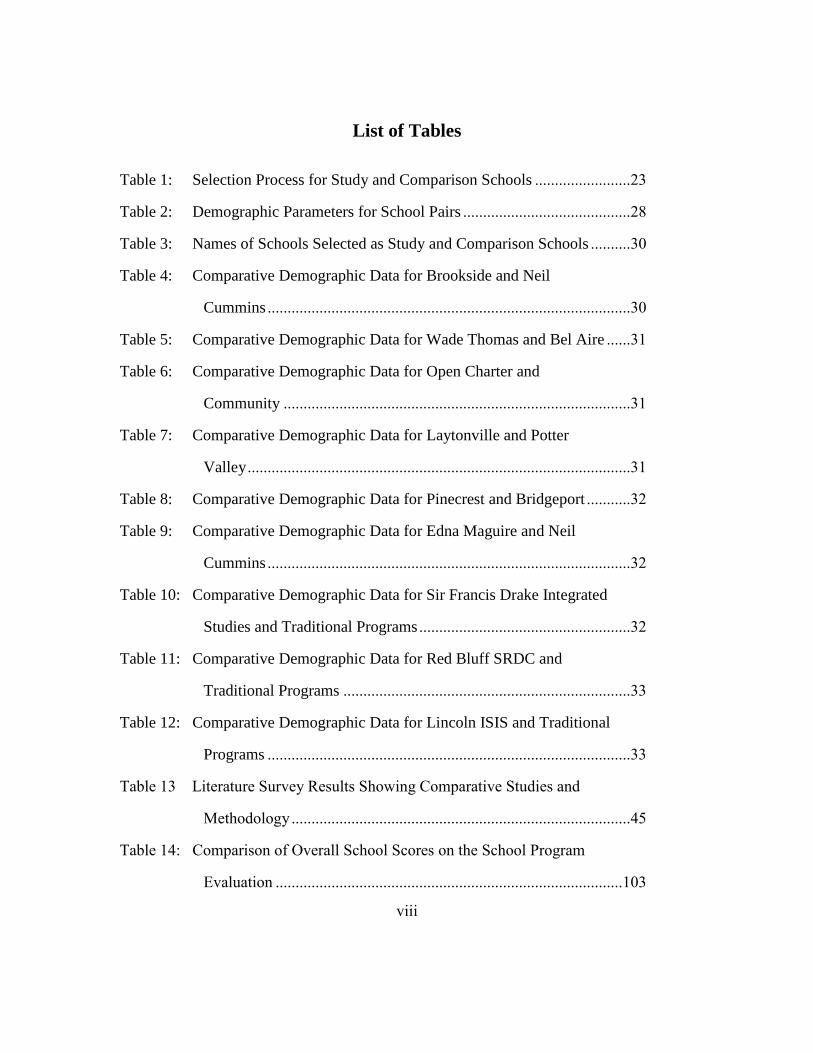
List of Tables
Table 1: Selection Process for Study and Comparison Schools ........................23
Table 2: Demographic Parameters for School Pairs ..........................................28
Table 3: Names of Schools Selected as Study and Comparison Schools ..........30
Table 4: Comparative Demographic Data for Brookside and Neil
Cummins ...........................................................................................30
Table 5: Comparative Demographic Data for Wade Thomas and Bel Aire ......31
Table 6: Comparative Demographic Data for Open Charter and
Community .......................................................................................31
Table 7: Comparative Demographic Data for Laytonville and Potter
Valley ................................................................................................31
Table 8: Comparative Demographic Data for Pinecrest and Bridgeport ...........32
Table 9: Comparative Demographic Data for Edna Maguire and Neil
Cummins ...........................................................................................32
Table 10: Comparative Demographic Data for Sir Francis Drake Integrated
Studies and Traditional Programs .....................................................32
Table 11: Comparative Demographic Data for Red Bluff SRDC and
Traditional Programs ........................................................................33
Table 12: Comparative Demographic Data for Lincoln ISIS and Traditional
Programs ...........................................................................................33
Table 13 Literature Survey Results Showing Comparative Studies and
Methodology .....................................................................................45
Table 14: Comparison of Overall School Scores on the School Program
Evaluation .......................................................................................103

ix
Table 15: Teacher Survey Results on Components of EIC for Brookside
and Neil Cummins Schools .............................................................104
Table 16: Teacher Survey Results on Components of EIC for Wade
Thomas and Bel Aire Elementary Schools .....................................104
Table 17: Teacher Survey Results on Components of EIC for Open
Charter and Community Elementary Schools.................................104
Table 18: Teacher Survey Results on Components of EIC Laytonville
and Potter Valley Schools ...............................................................105
Table 19: Teacher Survey Results on Components of EIC for Pinecrest
and Bridgeport Schools ...................................................................105
Table 20: Teacher Survey Results on Components of EIC for Edna
Maguire and Neil Cummins Elementary Schools ...........................105
Table 21: Teacher Survey Results on Components of EIC for Sir Francis
Drake Integrated and Traditional Programs ....................................106
Table 22: Teacher Survey Results on Components of EIC for Red Bluff
SRDC and Traditional Programs ....................................................106
Table 23: Teacher Survey Results on Components of EIC for Lincoln
ISIS and Traditional Programs ........................................................106
Table 24: Average Scores on Program Evaluation by Component ...................107
Table 25: Average GPA for ISIS students from 1997-1999 and a sample
of peers in the traditional program at Lincoln High School ...........120
Table 26: Average GPA for students participating in the SRDC
internship compared to students enrolled in the traditional
program at Red Bluff High School .................................................121

x
Table 27: Fifth grade core literacy portfolio results reported as mean
scores...............................................................................................122
Table 28: Percentage of students who met or exceeded proficiency
standards on the 5th grade core literacy portfolio ...........................122
Table 29: Fifth grade writing portfolio results reported as mean scores ...........123
Table 30: Percentage of students who met or exceeded proficiency
standards on the 5th grade writing portfolio ...................................123
Table 31: Fifth grade core literacy portfolio results reported as mean
scores...............................................................................................124
Table 32: Percentage of students who met or exceeded proficiency
standards on the 5th grade core literacy portfolio ...........................124
Table 33 Ninth grade writing portfolio results reported as mean scores ..........125
Table 34: Ninth grade mathematics portfolio results reported as mean
scores...............................................................................................125
Table 35: Percentage of ninth grade students who met or exceeded
proficiency standards on the writing and mathematics
portfolios .........................................................................................126
Table 36: Tenth grade core literacy portfolio results reported as mean
scores...............................................................................................127
Table 37: Percentage of tenth grade students who met or exceeded
proficiency standards on the core literacy portfolio .......................127
Table 38: Twelfth grade writing and reading portfolio results reported as
mean scores .....................................................................................128

xi
Table 39: Percentage of twelfth grade students who met or exceeded
proficiency standards on the writing and reading portfolios ..........129
xii
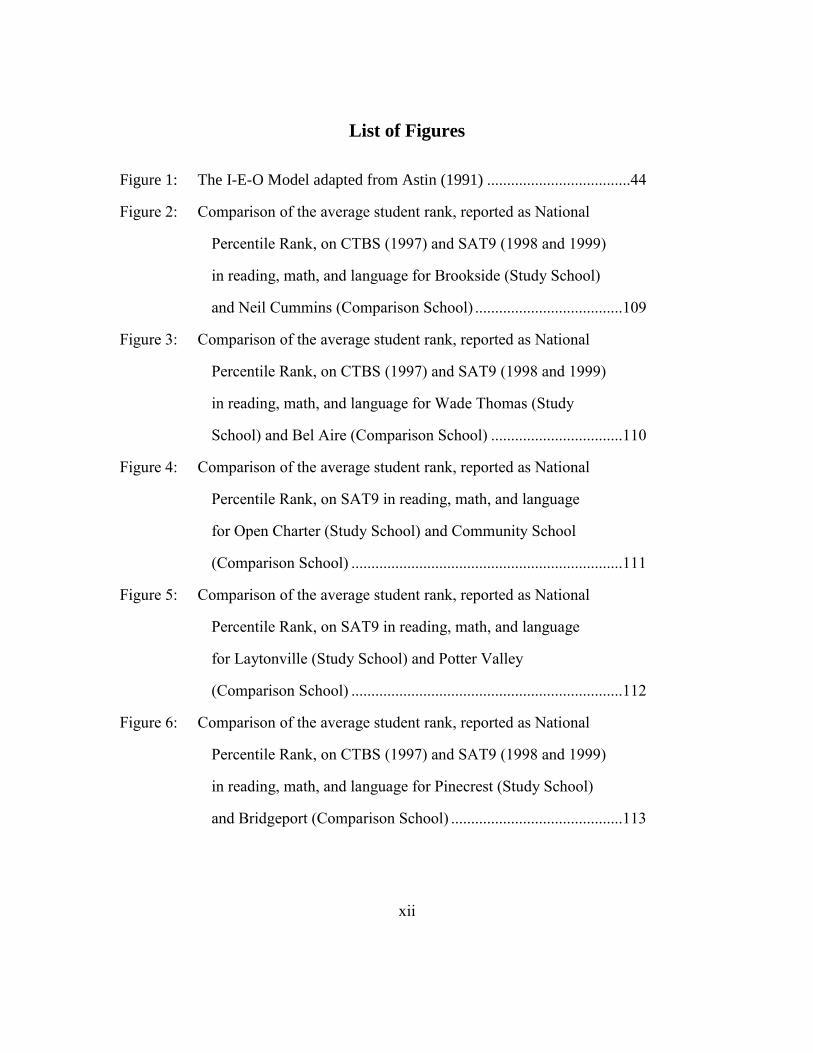
List of Figures
Figure 1: The I-E-O Model adapted from Astin (1991) ....................................44
Figure 2: Comparison of the average student rank, reported as National
Percentile Rank, on CTBS (1997) and SAT9 (1998 and 1999)
in reading, math, and language for Brookside (Study School)
and Neil Cummins (Comparison School) .....................................109
Figure 3: Comparison of the average student rank, reported as National
Percentile Rank, on CTBS (1997) and SAT9 (1998 and 1999)
in reading, math, and language for Wade Thomas (Study
School) and Bel Aire (Comparison School) .................................110
Figure 4: Comparison of the average student rank, reported as National
Percentile Rank, on SAT9 in reading, math, and language
for Open Charter (Study School) and Community School
(Comparison School) ....................................................................111
Figure 5: Comparison of the average student rank, reported as National
Percentile Rank, on SAT9 in reading, math, and language
for Laytonville (Study School) and Potter Valley
(Comparison School) ....................................................................112
Figure 6: Comparison of the average student rank, reported as National
Percentile Rank, on CTBS (1997) and SAT9 (1998 and 1999)
in reading, math, and language for Pinecrest (Study School)
and Bridgeport (Comparison School) ...........................................113

xiii
Figure 7: Comparison of the average student rank, reported as National
Percentile Rank, on CTBS (1997) and SAT9 (1998 and 1999)
in reading, math, and language for Edna Maguire (Study
School) and Neil Cummins (Comparison School)........................114
Figure 8: Comparison of the average student rank, reported as National
Percentile Rank, on SAT9 in reading, math, language,
science and social studies for Drake Integrated (Study
School) and Drake Traditional (Comparison School) ..................115
Figure 9: Comparison of the average student rank, reported as National
Percentile Rank, on SAT9 in reading, math, language,
science and social studies for Red Bluff SRDC (Study
School) and Red Bluff Traditional (Comparison School) ............117
Figure 10: Comparison of the average student rank, reported as National
Percentile Rank, on SAT9 in reading, math, language,
science and social studies for Lincoln ISIS (Study School)
and Lincoln Traditional (Comparison School) .............................118
Figure 11 : Average annual actual attendance rates for study schools
versus comparison schools ............................................................119
1
CHAPTER 1
Introduction
Environmental education (EE) is a field that has evolved for decades. What was
once geared toward raising environmental awareness and fostering environmental
stewardship is now a possible resolution to our nation’s failing schools. Supporters of
environmental education believe that it can at once help improve academic performance
by students and create generations of environmentally informed citizens. Many educators
and interested public groups tout the benefits of environment-based education as a means
for school reform.
American schools are in the midst of a standards-based educational reform
movement brought on by the 1983 report A Nation at Risk and the follow-up legislation
known as the No Child Left Behind Act. Educators and school administrators are in a
situation that requires them to substantiate their instructional practices with scientifically
based research and evidence. This requirement spurred supporters of environmental
education to conduct research into the academic benefits of environment-based education
to gather the data necessary to keep EE in schools.
This study, conducted in 1999, focuses on the educational efficacy of school
programs that utilize an environment-based educational approach. Study schools
employing environment-based strategies were compared to demographically similar
comparison schools utilizing a traditional education approach. The goal was to give
teachers and administrators the evidence they needed in support of EE. The findings
indicate that a large amount of variation exists between EBE programs. The strongest

2
programs included in the study suggest that students participating in EBE programs
perform better than their peers in traditional programs on the academic outcomes tested.
In addition to this research a literature review was conducted in search of similar
comparative research conducted between 2000 and 2011. Studies were sought out that
compare non-traditional programs, especially with an environmental focus, to traditional
programs. Particular attention is paid to the methodology of each study in the hopes of
uncovering methods for designing and conducting research to meet the rigorous demands
of scientifically based research.
While this study has some methodological shortcomings, it is valuable to the field
of EE in that it highlights important steps for future studies. Based on my original
research and the literature review recommendations for future studies are discussed.

3
CHAPTER 2
Background
PART A
The State Education and Environment Roundtable (SEER) is a cooperative
endeavor of departments of education, representing sixteen states, working to strengthen
the role of environmental education in k-12 curricula and education reform efforts.
SEER was established in 1995 in response to a study concluding that environmental
education has played a very minor role in education reform. The study, done on behalf of
The Pew Charitable Trusts, was designed to collect baseline data regarding the status of
EE throughout the United States; identify education reform initiatives and possible
connections with EE; and explore the factors limiting EE in the school setting. EE
coordinators from nine state agencies convened, as part of the study, to discuss methods
for improving the role of EE in education reform and strengthening the knowledge base
of their field. From these discussions, the group recommended the establishment of a
national entity to help facilitate communication and sharing between EE coordinators of
state agencies throughout the country (Lieberman, 1995). Today this entity is SEER.
SEER’s current program mission is to help states improve student achievement
and improve k-12 instruction practices by incorporating environment-based education
into schools. They define environment-based education (EBE) as a “framework for
instruction that focuses on standards-based educational results by using the environment
and related issues as a context for instruction” (www.seer.org). SEER pursues six
objectives to address their mission. First, they provide training for k-12 educators

4
interested in implementing their model of EBE and maintain a network of demonstration
schools to serve as examples. SEER also provides support for schools already
implementing the EIC model. Next, they actively research the academic and behavioral
effects of EBE. Finally, SEER provides member agencies and non-profit education
organizations with technical support on program planning and assessment.
Early in its formation, a research team from SEER attempted to compile
information on the potential of environment-based education to improve student learning
by conducting an extensive review of general and environmental-education literature.
Their 1995 search revealed a lack of existing research regarding environment-based
education and the educational efficacy of such programs. As a result, the Roundtable
designed their own study in search of insight into the relationship between environment-
based education and the educational experience of students. In 1998 SEER published
Closing the Achievement Gap, the results of this nation-wide research project.
The primary aim of their research was to study how using the environment as the
context for learning effects student learning and instruction in k-12 schools. SEER
sought to accomplish this goal by first identifying the most innovative and successful
environment-based education programs throughout the country. Representatives of the
Roundtable and educators from the member states recommended potential schools for the
study. Schools were then selected for inclusion in the study based on: program longevity;
level of integration of the environment through the curriculum; degree of student
involvement in meaningful problem-solving activities and projects; and, the level of
teacher collaboration existing in the program (Lieberman& Hoody, 1998).

5
The criterion used to determine inclusion in the study was based on an
educational framework developed by SEER. This framework, referred to as Environment
as an Integrating Context for Learning (EIC), lays out the practices that SEER believed
should form the foundation of environment-based education programs in k-12 schools.
EIC combines the power of using a school’s natural and social environments as a context
for learning with proven instructional practices. It is this foundation that makes EIC a
unique educational framework. The most critical characteristic of EIC is the integration
of the environment into a program’s curriculum. The other defining characteristics of
EIC represent instructional strategies used under many circumstances and known to be
effective for learning. By this definition an EIC program would integrate the school’s
surroundings throughout the curriculum, engage students in problem-solving and
projects, and rely on a collaborative effort amongst the program’s teachers.
After conducting initial screening interviews with a pool of potential study
programs the research team selected forty schools to participate in the study. Once
identified the research team studied the environment-based programs to:
describe the common features of the programs;
identify the instructional practices that characterize their pedagogies;
collect data on student achievement, teacher satisfaction, and instructional
practices; and,
identify and understand the factors that lead to the program’s success and those
that presented a challenge.

6
As a result of their in-depth study into these highly-revered school programs SEER
refined their original vision of the EIC framework and made preliminary conclusions
about the educational efficacy of environment-based education programs fitting into the
EIC framework.
With the experience of extensive interviews and site visits with staff and students
from the forty study schools SEER developed a richer definition of the EIC framework.
In addition to incorporating all of the qualities from the original definition of EIC the
successful environment-based programs included in the study were found to have several
fundamental commonalities. Each of the EIC programs at the study schools:
incorporated individual and cooperative learning experiences;
integrated knowledge from diverse disciplines;
emphasized learner-centered and constructivist approaches to learning; and,
used authentic assessments to monitor student learning.
These commonalities were integrated into the SEER EIC framework and are now among
the qualities which characterize exemplary EIC instruction.
Based on this updated framework, EIC is a methodology that requires the use of
seven pedagogical approaches. The major educational components of EIC include: using
natural and community settings as a context for learning; integrated, interdisciplinary
instruction; problem-, issue-based instruction; collaborative instruction; learner-centered,
constructivist methods; independent and cooperative learning; and, authentic assessment
of learning. In order to be considered EIC an environment-based education program
must incorporate each of these attributes.

7
The most critical and defining component of EIC is a program’s use of natural
and community environments as the context for learning. Because EIC programs can
exist in all geographic and socio-economic settings, EIC programs will be unique in the
aspects of the environment incorporated into the program and in the nature in which they
are integrated into the academic program. But, no matter if the EIC program exists in an
urban jungle or a rural paradise the goal in using the environment as the context for
learning will be the same. All EIC programs aim to provide students with the opportunity
to connect and integrate what they are learning to the surroundings in which they play,
learn, and live.
The ideal EIC program uses their natural and social settings as a context for
standards-based instruction. Thus EIC is the chosen framework used to help students
meet the educational benchmarks required by local, state, and national authorities. In
addition, by using the environment as the context for learning, an EIC program
incorporates their community’s cultural characteristics into the curriculum, assists
students in developing an understanding of natural and social systems, and offers students
opportunities to apply their skills and knowledge in local settings.
SEER chose to build their educational framework around natural and social
settings as the context for learning due to the potential benefits of this mode. Basing
students’ learning experiences in their natural and social environment has the potential to
improve student learning, develop strong relationships between students and their
community, and build an understanding and appreciation of these environments. This
model provides a real-world context for learning that engages students and gives their

8
learning meaning, thus motivating continued student inquiry. Research shows that we
learn best about something through autonomous experiences (Hart & Chawla, 1981;
Watson, 1995; Wolfe, 1998). The EIC framework is built upon providing students with
meaningful learning experiences in and about their natural and social surroundings. As
students work on issues in their community their learning becomes personal because they
can identify strongly with what is being studied.
Another essential component of EIC is the use of integrated, interdisciplinary
instruction. In an EIC program the focus in on providing students with a comprehensive
view of the world around them. In order to accomplish this, the traditional boundaries
between subject area disciplines are blurred and students and teachers work across
disciplines to achieve their educational goals. Teachers from separate disciplines often
team together to coordinate learning between subject areas, and students are encouraged
to explore the connections between the disciplines. The goal is for the students learning
in this comprehensive framework to begin to recognize how apparently unrelated
elements in their natural and social environments fit and work together.
Integrated, interdisciplinary instruction is a pedagogy with proven educational
value. This educational approach is supported by the International Reading Association,
National Council of Teachers of English, National Science Teachers Association,
National Council for the Social Studies, and many other professional education
associations. Through integrated, interdisciplinary instruction academic content areas
provide support for one another. Skills related to one subject area are simultaneously
strengthened while they facilitate learning in another subject area (Dickinson & Young,
9
1998; Venville & Wallace, 1998). In addition, studies comparing students in schools
using innovative, integrated approaches to those in traditional school programs have
found that students in the integrated programs have an improved attitude toward learning
(Arhar, Johnston & Markle, 1989; Kain, 1993), greater intellectual curiosity, and exhibit
higher academic achievement (Vars, 1991). In fact, analysis of more than 80 normative
and comparative studies conducted since the 1930s on integrative, interdisciplinary
programs suggest that students participating in such programs perform as well or better
on standardized achievement tests that their counterparts enrolled in traditional programs
which separate subject areas (Vars, 1991).
Teachers also benefit from the positive effects of integrated, interdisciplinary
instruction (Arhar et al., 1989; Venville & Wallace, 1998). This type of instruction often
requires that teachers work collaboratively within and across disciplines.
Communication and mutual support between teachers inevitably increases. When
teaming in integrated, interdisciplinary programs, teachers report a rise in their level of
satisfaction with teaching. Teachers working collaboratively in these programs also have
been found to have improved communication skills (Erb & Stevenson, 1999).
EIC programs emphasize instructional approaches rooted in problem solving and
project-based learning experiences. Students are engaged in investigations of complex
projects centered around solving authentic problems. Because the context for learning is
the natural and social environment the problems and issues students face are real-world
issues existing in their community. The ideal EIC program encourages students to
develop an understanding of the complexity of community issues, supports students as
10
they undertake service-learning projects in their communities, and requires students to
report their progress and findings to a meaningful audience of peers and community
members.
The strength of problem-, issue-based learning as effective instruction is
supported by educational research and the strategy is widely recommended in curriculum
standards for science, social studies, English language arts and math. Effective
instruction is such that engages students to use their minds by connecting learning to the
world beyond the classroom, facilitating student engagement in substantive conversation
about an issue, and requiring the use of higher-order thinking skills (Newman &
Wehlage, 1993). All of these attributes of effective instruction are a fundamental part of
problem-, issue-based learning. As students are engaged in inquiry about a local issue
they actively develop high level thinking and processing skills (Donahue, Lewis, Price &
Schmidt, 1998). While working toward a solution to a particular problem, or developing
an understanding of a complex, real-world issue, students build a substantial knowledge
base across subject area disciplines while analyzing, synthesizing, and evaluating
information (Stepien & Gallagher, 1993).
Engaging in research and inquiry to solve a real-world issue of personal interest is
highly rewarding and motivating. Students have a real stake in their learning as they
work to define and solve a problem of personal interest. Student motivation toward
school and learning climbs because they are pursuing their own problem (Stepien &
Gallagher, 1993). The work students do while engaged in authentic problem solving also
has value beyond the walls of the classroom (Schack, 1993). The questions students ask

11
and the answer they pursue could potentially affect their community. By doing
meaningful academic work students see that they have the ability to pursue their interests
in a “high-quality” way (Schack, 1993, p. 31). This is an empowering realization for
students. Individuals who believe they have the ability and power to make change and
resolve issues are more likely to be an active, responsible citizen in their community
(Hungerford & Volk, 1990).
The use of collaborative instruction is another essential component of EIC. In an
EIC program collaborative instruction refers to diverse teams working together to plan
curriculum and deliver instruction. The teams generally include teachers, students,
parents, community members and experts from universities, zoos, nature centers, or
government agencies. Together, these people represent diverse backgrounds, several
subject area disciplines, varying areas of expertise, and different viewpoints. Students
benefit from being exposed to, and working with a diverse team. With this framework
students, especially in middle and high school, are able to work simultaneously on related
aspects of the same project in multiple classes. Students also benefit from watching their
teachers work together and model positive teamwork.
The benefits of a team teaching arrangement span across cognitive, affective, and
social domains. Teaming can make such a widespread impact because the commitment
to collaborate creates an opportunity for things to be done differently in schools. A team
organization restructures interactions among teachers and between teacher and students
(Aher et al., 1989). The collaboration that exists between teachers in a team arrangement
leads to improved teacher satisfaction with teaching (Ahar et al., 1989; Venville &
12
Wallace, 1998). Teachers working collaboratively with a common group of students
have the opportunity to get to know the students better. In addition, teacher resources can
be pooled to have a greater impact on students in need of extra support. These benefits
do not go unnoticed by students. Students enrolled in schools with a team organization
expressed more enthusiasm toward school and their teachers, and found the learning
environment more supportive than students enrolled in schools with a traditional
departmentalized structure (Ahar et al., 1989). Teaming has also been found to have a
positive effect on interracial relationships and attitudes among students (Damico, Bell-
Nathaniel & Green, 1981).
Teaming can also influence academic instruction because it allows specific
conditions to occur that are directly related to effective instruction and student success.
Collaboration amongst a group of teachers gives them an opportunity to refine their
instructional objectives, thus improving their effectiveness. Research, however, is
somewhat contradictory regarding the effect of teaming on student’s academic
achievement. While evidence can be found to suggest students in team teaching
arrangements achieve at lower levels than those in traditional arrangements, the majority
of studies conclude that academic achievement is unaffected or moderately improved in
team organization (Ahar et al., 1989). It can be concluded that the effects of teaming on
students is not easy to measure using standardized tests.
The roles of students and teachers in an EIC program are different from their roles
in a traditional education program. As instructional strategies shift toward
interdisciplinary studies, project-based learning, and team teaching the role of teachers
13
and students also shift. Ideally, teachers become the facilitators while students take
charge of their own learning. Students are given the opportunity to pursue issues of
personal interest to them, and in turn are asked to define their own learning goals and
objectives. Teachers guide students as they select a project and develop a plan of action,
oversee the project implementation, discuss with their students methods for analyzing
information, and counsel students as they develop a plan to communicate their findings.
The core instructional strategies of EIC-based education provide a perfect
opportunity to combine independent and cooperative learning. Students in an EIC
program often work in teams toward the common goal of solving problems connected to
a real-world community project. In an ideal EIC program the teachers utilize student-
derived teams and teacher-derived teams, assuring teams reflect a wide range of ability
levels and learning styles. Teachers of EIC-based education assist students to develop
positive interpersonal skills and act as models of constructive team members and
communicators.
The final educational component of EIC-based education is the method used to
assess student learning. EIC programs assess students’ knowledge and skills, using
authentic measures. EIC teachers often rely on student portfolios, presentations, in the
context of real-world tasks and require teachers to judge students on the demonstration of
their knowledge and skills based on pre-established criteria. The criteria on which
students are judged is often made public through rubrics. EIC programs use authentic
methods to measure students’ comprehensive understanding of standards-based
knowledge and skills as well as the students’ ability to apply these skills to real-world
14
situations. Authentic assessment techniques also allow teachers in EIC programs to
provide multiple assessment measures in order to account for students’ diverse learning
styles and multiple intelligences. For example, EIC teachers often rely on student-created
portfolios, presentations, project outcomes, and performance measures such as
interviews, observations and work samples to assess student understanding.
Authentic assessment techniques are touted as being more comprehensive and
ultimately more valuable than traditional forms of academic assessments. “Tests are
important quantitative assessment tools, but in and of themselves do not constitute the
totality of assessment” (Webb, 1992). Traditional testing techniques provide little
information about student understanding and learning. Therefore, with only traditional
results, it is difficult to make inferences about student learning and how to improve it
(Adams, 1998). On the other hand, authentic assessment measures provide a
comprehensive picture of the learner, as they require the student to demonstrate their
learning and understanding in a multitude of ways and within a real-world context.
Authentic measures also push students to move beyond routine and discrete tasks and
into engaging, higher-level thinking and complex problem solving (Fushell, 1994). EIC
programs focus their attention on offering students a variety of authentic methods of
demonstrating their learning in order to collect the most comprehensive view of each
student as possible.
While the information gathered by SEER in Closing the Achievement Gap gave
strength and definition to the EIC framework, it also suggests that EIC-based education
as defined by the framework has valuable educational benefits. The observed benefits of

15
EIC-based programs cross all areas of the academic curriculum as well as the affective
well-being of students. They include:
better performance on standardized measures of academic achievement in
reading, writing, math, science and social studies;
reduced discipline and classroom management problems;
increased engagement and enthusiasm for learning; and,
greater pride and ownership in accomplishments.
The evidence gathered for SEER’s Closing the Achievement Gap came from school
visits, interviews with students and staff, survey results, and reported gains on both
standardized tests and grade point averages.
While their results were exciting, the members of SEER understood that they
were only a first step in gathering evidence of the effects of environment-based learning
on student achievement. This initial study had limitations. For example, the amount of
standardized and quantitative data documented in Closing the Achievement Gap was
minimal. The majority of data was qualitative in nature and the small number of study
schools collecting quantitative data made tests of statistical significance impossible.
It was recognized by the members of SEER that in order to continue to build a
base of information regarding the educational efficacy of EIC-based education more
systematic, qualitative data must be collected. The present research, part of SEER’s
effort to address the research needs, aims to determine if there are measurable changes in
academic achievement, as indicated by standardized data and behavioral effects for

16
students who have the opportunity to learn in EIC-based programs, when compared to
students in traditional education programs.
PART B
Significant changes in the field of environmental education research and
education in general preceded the release of Closing the Achievement Gap and continue
to evolve. At the time of the study’s release, the nation was in the midst of educational
reform spurred by the 1983 report A Nation at Risk. Standards-based reform, setting
learning goals across the grades and requiring students to demonstrate competency
through standardized tests, became the driving force in education and is a lasting result of
the landmark report issued by the National Commission on Excellence in Education
(Merrick, 2009). The move to standardize education and increase the performance of
students and schools forced many educators to abandon their use of environmental
education in their classrooms. Educators and administrators were not convinced of the
natural fit between EE and a standards-based classroom. A 1999 study by Kearney found
that most teachers did not recognize the potential of environment-based studies to
improve education.
In 2002 President Bush signed into law the No Child Left Behind Act (NCLB), a
bipartisan bill supporting standards-based school reform and requiring all schools
receiving federal funding to administer statewide standardized tests to all students
annually. Under NCLB each state was required to develop an assessment of basic skills
based on a set of standards created by that state. This standardized test is to be the same
for every student and meant to be administered to all students under the same conditions.

17
The results of these standardized tests became the main means of determining whether a
school was living up to the standards set out by their state. Schools are required by
NCLB to pass yearly tests and show improvement from year to year. If improvements
are not made a school faces decreased federal funding and other punishments meant to
increase accountability. In addition to the pressure to perform on standardized tests,
schools are now required by the Act to limit their school programs and teaching methods
to those supported by scientifically based research. No Child Left Behind defines
scientifically based research as that involving “the application of rigorous, systematic,
and objective procedures to obtain reliable and valid knowledge relevant to education
activities and programs”. It requires that the research findings be replicable and
applicable. Under the Act school programs and teaching methods based on following
tradition, case studies, personal interviews, action research, and other forms of qualitative
research are not acceptable (No Child Left Behind [NCLB], 2003).
The EE field responded to the standards-based, high stakes climate in education
with a clear message that EE has a place in education reform. In 1999 the North
American Association for Environmental Education (NAAEE, 1999) released Excellence
in Environmental Education: Guidelines for Learning. The guidelines are a response to
the national movement toward standardization and are correlated to national standards for
mathematics, science, language arts and social studies. They “set a standard for high
quality environmental education across the country, based on what an environmentally
literate person should know and be able to do” (NAAEE, 1999, p.1). Importantly the
guidelines also aimed to demonstrate that “environmental education can be used to meet

18
standards set by the traditional disciplines,” thus offering EE as a means to aid education
reform rather than distract from it (p.5).
To continue this conversation the NAAEE and the National Environmental
Education and Training Foundation (NEETF) published the reports Environment-Based
Education: Creating High Performance Schools and Students (2000), Using
Environment-Based Education to Advance Learning Skills and Character Development
(2001), and Environmental Education and Educational Achievement: Promising
Programs, and Resources (2002). A main purpose for the reports was to introduce
educators to research studies and education programs across the country that highlight the
important role environment-based education plays in providing students a well-rounded
education. Thus, the reports focused attention once again on the potential of
environment-based education as a strategy for improving teaching and learning in the age
of education reform. In fact, according to NEETF environment-based education has the
“potential to revitalize our nation’s schools” (NEETF, 2001, p.3).
This time period between the late 1990s and early 2000s marks a significant shift
in the research in the field of EE. Prior to this time most research was focused on EE-
based outcomes such as measuring student’s knowledge, behavior and attitudes related to
the environment and environmental stewardship (Wheeler & Thumlert, 2007). Closing
the Achievement Gap, along with the reform movement in education spurred a new type
of EE research. Environmental educators began to ask “Do environmental education
programs support higher performance on standardized tests?” (Coyle, 2010, p.22). This
question lead educators to look more closely at the way EE was being delivered to
19
students. The spotlight was now focused on EE programs like those introduced by SEER
in Closing the Achievement Gap, schools using the environment as a way to integrate a
standards-based curriculum around issues of interest to students and teachers. This
instructional strategy was originally coined Environment as an Integrating Context (EIC)
by SEER but is more broadly referred to as Environment-Based Education (EBE).
Environment-based education, “a maturing discipline”, can be distinguished from
its parent field of environmental education (NEETF, 2000). The NAAEE states
environmental education “teaches children and adults how to learn about and investigate
their environment, and to make intelligent, informed decisions about how they can take
care of it” (www.naaee.net). EBE uses the environment more broadly, as a learning
strategy to engage students in their overall education. While environmental education
focuses on building a base of environmental knowledge and skill to be applied to
environmental stewardship, environment-based education uses a popular subject matter to
improve students’ learning skills and create a wider learning context for students,
teachers, and the community. EBE has the potential to increase the amount of time
teachers and students are engaged in studying environmental topics and issues while
achieving the goals of standards-based education reform.
The relatively new focus of EE research on EBE has studied such diverse
outcomes as academic achievement, student motivation and engagement, self-esteem,
career development, concentration and attention difficulties, student drop-out rates, and
civic responsibility (Wheeler & Thumlert, 2007; Coyle, 2010). According to the 2007
Environmental Education Report prepared by the Washington State Office of the

20
Superintendent of Public Instruction academic achievement was the most studied non-EE
specific outcome since 2000 (Wheeler & Thumlert, 2007). An exhaustive literature
review of current EE studies was conducted for the report. Using a rigorous set of
criteria, the report highlights what they defined as “Gold” or rigorous standard studies as
well as those deemed “Supporting” standard. Each study reviewed was evaluated based
on experimental design, use of inferential statistics, valid outcome measures, use of
techniques to randomize or match, and sample size. Such a discriminatory set of
evaluation criteria was necessary to ensure the studies reviewed met the NCLB
requirement for scientifically based research. Twenty studies, nine gold and eleven
supporting, were analyzed. Based on their analysis the studies indicate a positive
correlation between student participation in certain EE programs and improved academic
achievement. Specifically, the studies show a strong correlation between EE and
improved math and science achievement. The research suggests that the improvement in
achievement may occur for high-ranking students as well as low-ranking students.
An earlier literature survey of EE research, commissioned by the Source
Reduction and Recycling Board, focused solely on the possible link between EE and
academic achievement. The goal of the survey was to “determine whether there is sound
evidence that environmental education could support academic curriculum goals and to
identify program trends” (Norman, Jennings & Wahl, 2006). Again, the research team
applied rigorous quality criteria modeled after the evidence-based research standards
listed in the Education Sciences Reform Act of 2002, H.R. 3801. A total of 24 studies
met the criteria and were used for analysis. Of these, only eight were considered as
21
“Strongest Research.” The survey reports that there is “meaningful evidence of positive
impacts on academic achievement across many curriculum subjects as a result of
environmentally-related programs using best educational practices” (Norman et al., 2006,
p.iii).
Another way the environmental education field has responded to standards-based
education reform is through correlating their curricula, materials, and programs to state
and national learning standards. Correlations are a statement linking an activity (field
trip, lesson, curriculum material) to the standard it addresses. They offer educators a way
to illustrate the fit between EBE and standards-based reform. Correlations very
specifically target a standard in a particular subject area and grade level. Even though
there are both national and state-level standards, most educators believe EE correlated to
state standards is most valuable because they are accountable for these on state
assessments. This makes the process of correlating a program or curricula materials a
time consuming one. The work of the Environmental Education and Training Partnership
(EETAP) is one example of a large-scale attempt to correlate EE curricula nationwide.
They have provided funding for three well established EE curricula: Project Learning
Tree (PLT), Project WILD, and Project WET to correlate their activities and lessons to
state standards. As of 2009 their efforts have provided correlations in 45 states.
Efforts to correlate materials to state standards continue to occur in EE as well as
every subject area discipline without much research into its effectiveness. A recent
evaluation of correlation efforts was completed by EETAP with encouraging results.
They found that more than 70% of participants “agreed that they had used more PLT,
22
Project WET, or Project WILD activities because they were correlated to state standards”
(Merrick, 2009, p.6). In addition, an overwhelming 96.5% reported that their principal or
supervisor required state standards be addressed by classroom activities (Merrick, 2009).
These results suggest that correlations between EE curricula, activities, and materials and
state standards are an effective and necessary way to get EE into our nation’s schools.
Methodology
PART A
Purpose of Study
This study aims to compare the academic achievement of students participating in
EIC-based education against students in traditional educational programs. In order to
accomplish the goals of this study a sample of school/programs utilizing the EIC
framework needed to be identified. In addition, once the study schools were identified an
appropriate comparison school/program had to be found. The ultimate goal of this study
was to identify the schools/programs in California that were the strongest, most complete
examples of the EIC framework developed by SEER and compare them to
schools/programs most closely resembling them, but engaged in a traditional educational
model.
Study Participant Selection Process
The search for all study and comparison schools was conducted throughout the
state of California and encompassed all public school districts in the state. The search
spanned all grade levels from kindergarten to twelfth grade. Study and comparison
schools were identified through a rigorous selection process (Table 1).

23
Table 1: Selection Process for Study and Comparison Schools
STEP PURPOSE 1. Potential study schools
recommended to research team
by education professionals
throughout California
To build a base of schools and educational programs from
which to identify potential EIC-based programs
2. Initial information packet sent
out to each recommended
school/program (more than 200
sent)
Collected information regarding the operational and
instructional practices of potential study schools
Determined the level to which each school/program fit into
the EIC framework
Determined willingness to participate in study
3. Program surveys (included in
initial packet) examined to
identify the most promising
study candidates
Identified the schools/programs best meeting the criteria of
implementation of EIC components and duration of
program existence
51 schools were identified to continue the selection
process
4. Phone interviews conducted
with potential study
school/program staff
(administrators, teachers)
Gathered additional information regarding the depth in
which the EIC components were integrated into the
school/program
Collected specific information regarding the structure of
the school/program
5. Final selection of study
schools Narrowed the pool of potential schools to 11 based on the
combined information for Program Surveys and interviews
Determined availability of comparison data
6. Search for necessary
comparison schools Built a base of potential control populations for
comparison with the study schools engaged in a school-
wide EIC model using recommendations and the ED-Data
Database (used to compare demographic information
7. Initial information packet sent
out to all potential comparison
schools
Collected information regarding the operational and
instructional practices of potential comparison schools
Determined the level to which each school/program fit into
the EIC framework to ensure they were using traditional
methods rather than EIC-based strategies
Determined willingness to participate in study
8. Program surveys examined to
determine the most promising
comparison schools
Identified the schools/programs best meeting the
demographic criteria needed to make the best match with
study schools
9. Phone interviews conducted
with administrators from
potential comparison schools
Gathered additional information regarding the
school/program’s educational program
Collected specific information regarding the structure of
the program

24
Study Schools
Soliciting recommendations for potential study schools was the first step of the
sample process. Individuals from all levels of California’s education system,
representing both the formal and environmental education communities, were asked to
recommend potential treatment schools for the study. Those contacted included the
California Department of Education’s Office of Environmental Education, resource
agencies, school districts, teachers, professional development specialists, private
foundations and non-government organizations. All entities contacted to make
recommendations were familiar with SEER’s previous research and the purpose of the
current study. It was asked that recommendations be made based on a school/program’s
integration of the components of EIC into their educational philosophy. In searching for
the study schools the goal was to identify the schools/programs within California with the
highest degree of use of the instructional approaches comprising the EIC framework:
integration of the natural and social environments into the academic
curriculum;
use of the natural and social surroundings as a context for learning;
student involvement in problem- and issue-based investigation
interdisciplinary integration of subject areas;
collaboration among teachers and community members in curricular
planning and instruction;
learner-centered, constructivist practices being used;
combining independent and cooperative learning experiences; and,
assessment using authentic methods.

25
The idea was to learn the most about the educational efficacy of EIC-based education by
identifying and comparing the strongest EIC model schools/programs to traditional
models of education.
More than 200 schools from across California were recommended as potential
treatment schools. An initial information packet was faxed to each school. The packet
included: a letter explaining the request for information, the Program Survey (Appendix
1) consisting of questions regarding the school/program’s operational and instructional
practices, and a letter on behalf of the California Superintendent of Public Instruction and
the Office of Environmental Education encouraging the school to participate in the study.
Respondents of the Program Survey were asked to rate the degree (never, rarely,
often, or consistently) to which their school’s program used the components of EIC. Of
the more than 200 surveys disseminated, 120 (60%) were completed and returned. While
screening the surveys I looked for schools/programs that incorporated a majority of the
EIC components and ranked their use as “often” or “consistently.” In addition, only
schools/programs existing for three or more years were considered for further
examination. Study schools/programs were required to have existed for three or more
years because at least two years of data was needed for the study and data from the initial
year of a program was deemed unsuitable for study purposes. Half of the pool of
potential schools was eliminated based on the information gathered by the Program
Survey.
Telephone interviews were conducted with the 51 potential study schools meeting
the Program Survey criteria. The intention of the interview was to develop a better

26
understanding of how well the potential schools met the selection criteria. Every
interview followed the same format to ensure that all criteria were addressed in every
interview. The format of the interview followed the sequence of the questions addressed
in the Program Survey. The interviewee, generally a teacher or school administrator, was
asked to describe the educational philosophy of their school/program and to explain, in
detail, their responses on the Program Survey.
Interviews were conducted with the contact person from each school. In
numerous cases more than one representative from a school was interviewed. The length
of the interviews varied. Most took approximately 40 minutes but they ranged from 15
minutes in length to over two hours. Subsequent interviews were conducted with those
schools that matched the selection criteria most closely. These conversations allowed me
to clarify information from previous conversations, ask further questions and speak with
additional school representatives. These steps were taken to help ensure the strongest
candidates were selected.
From the telephone interviews eleven schools were selected as study schools.
Overall, the selected study schools represent diverse student populations: urban, rural,
and suburban settings; a wide range of cultural and socio-economic backgrounds; and,
large to very small school populations.
Comparison Schools
In order to determine the effectiveness of EIC-based programs compared to
traditional education programs, comparison populations were needed for all eleven of the
study school populations. Three of the study schools operated an EIC-based model and a

27
traditional program simultaneously within the same school. This allowed a comparison
to take place “within-school” between the study and comparison populations. The other
eight study schools operated their EIC programs school-wide, making it necessary to
match the study population with a comparison population from a different school.
Comparison populations were chosen on the basis of school demographics and
proximity to the study school. Although impossible to find a perfect replica of a study
school, I tried to match study and comparison schools so the only difference between
them was their involvement in EIC-based versus traditional education. In order to find
the best match I focused on demographic characteristics and educational model. Schools
were matched based on:
attendance area served by school (rural, urban, suburban);
number of students enrolled;
ethnic composition;
percentage of student body receiving free or reduced-price meals;
percentage of student body classified as Limited-English-Proficient (LEP);
average school-wide class size; and,
proximity to each other.
Whenever possible, comparison schools were selected from within the same school
district as the study school.
A base of potential comparison schools was identified through study school
representatives and through the Ed-Data Database. Representatives, usually a lead
teacher or administrator, from the study schools were asked to recommend schools within

28
their district or local area that were demographically similar but that didn’t employ the
EIC philosophy. In addition, the Ed-Data Database, an online database made available
by the Education Data Partnership (EDP) provided the study team with fiscal,
demographic, and performance data on all public k-12 schools in California. All data
obtained from the database was from the 1997-98 school year. The EDP represents a
joint effort between the Alameda County Office of Education, CDE, EdSource and the
Fiscal Crisis and Management Assistance Team.
Once a potential comparison school was identified through a recommendation or
the Ed-Data Database the school’s demographic characteristics were compared with the
study school it most closely matched. In order for a potential comparison school to be
considered for this study if had to match a study school within the required parameters
(Table 2).
Table 2: Demographic Parameters for School Pairs
Demographic Characteristic Required Parameter
Attendance Area Served by School (urban,
suburban, rural)
Same
Number of Students Enrolled Within 100 students
Ethnic Composition Within 5% for each category
Percent of Students Qualifying for Free/Reduced
Meals
Within 5%
Percent of Students Considered LEP Within 5%
Average Class Size Within 5 students
29
The same initial information packet sent out to potential study schools in the
beginning of the study was sent to those potential comparison schools with the strongest
demographic match to a study school. The purpose of this step was to collect information
regarding the operational and instructional practices of the schools. Representatives from
the pool of potential comparison schools were asked to complete the Program Survey as
well. Responses to the survey determined the level to which each school/program fit into
the EIC framework. The criteria to be considered a comparison school was a rank of
“never” or “rarely” used for a majority of the instructional components addressed on the
Program Survey. The intention was to ensure that the potential comparison schools were
using traditional methods of instruction rather than EIC-based education. This initial
contact with the pool of candidates also determined their willingness to participate in the
study.
The final step in selecting the best comparison schools was a phone interview
with the administrator of each school. The interviews were conducted to gather further
information on their response to the Program Survey, confirm availability and access to
comparison data, and inform the administrator of the obligations of a study participant.
Suitable comparison schools were found for each of the nine study schools requiring an
out of school comparison population. In the end each of the study schools was matched
with a comparison school/program (Table 3).
30
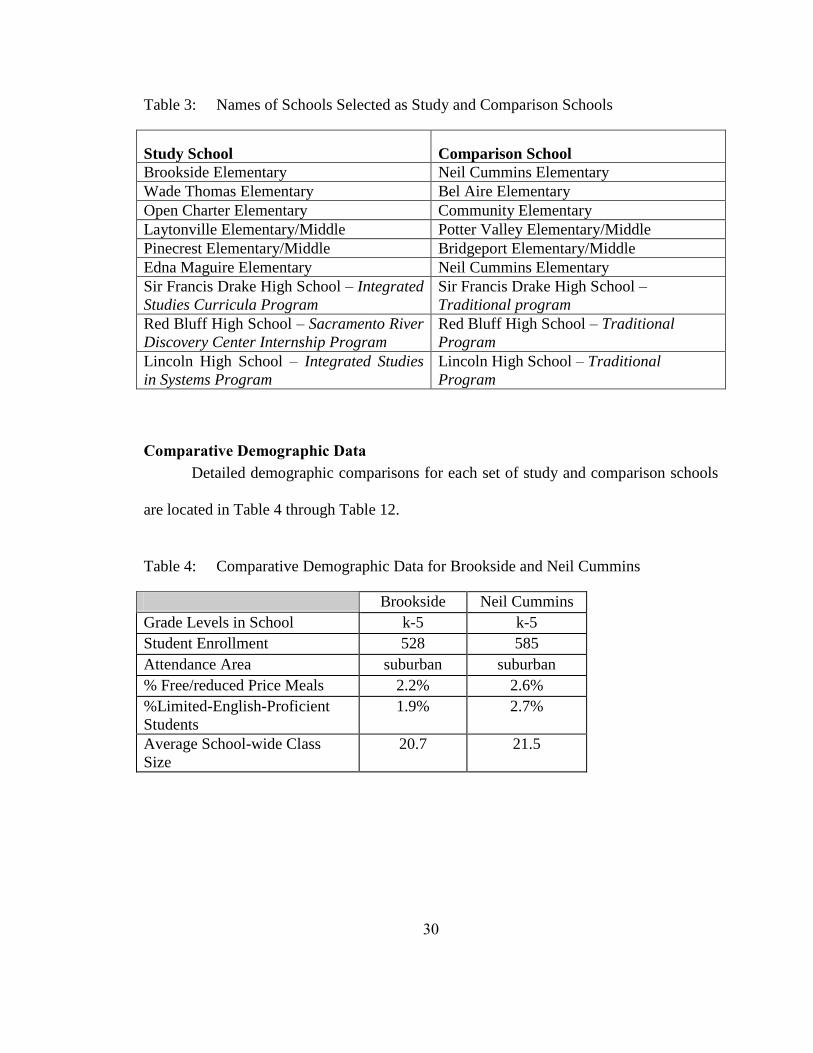
Table 3: Names of Schools Selected as Study and Comparison Schools
Study School Comparison School
Brookside Elementary Neil Cummins Elementary
Wade Thomas Elementary Bel Aire Elementary
Open Charter Elementary Community Elementary
Laytonville Elementary/Middle Potter Valley Elementary/Middle
Pinecrest Elementary/Middle Bridgeport Elementary/Middle
Edna Maguire Elementary Neil Cummins Elementary
Sir Francis Drake High School – Integrated
Studies Curricula Program
Sir Francis Drake High School –
Traditional program
Red Bluff High School – Sacramento River
Discovery Center Internship Program
Red Bluff High School – Traditional
Program
Lincoln High School – Integrated Studies
in Systems Program
Lincoln High School – Traditional
Program
Comparative Demographic Data
Detailed demographic comparisons for each set of study and comparison schools
are located in Table 4 through Table 12.
Table 4: Comparative Demographic Data for Brookside and Neil Cummins
Brookside Neil Cummins
Grade Levels in School k-5 k-5
Student Enrollment 528 585
Attendance Area suburban suburban
% Free/reduced Price Meals 2.2% 2.6%
%Limited-English-Proficient
Students
1.9% 2.7%
Average School-wide Class
Size
20.7 21.5
31
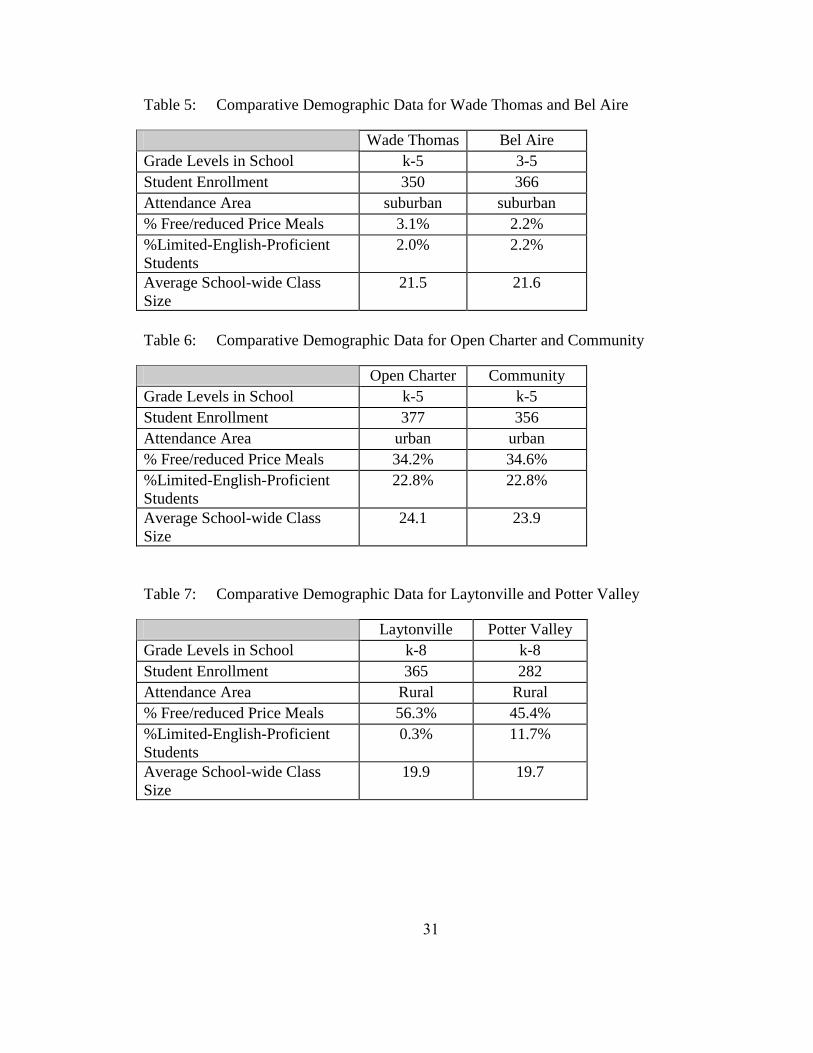
Table 5: Comparative Demographic Data for Wade Thomas and Bel Aire
Wade Thomas Bel Aire
Grade Levels in School k-5 3-5
Student Enrollment 350 366
Attendance Area suburban suburban
% Free/reduced Price Meals 3.1% 2.2%
%Limited-English-Proficient
Students
2.0% 2.2%
Average School-wide Class
Size
21.5 21.6
Table 6: Comparative Demographic Data for Open Charter and Community
Open Charter Community
Grade Levels in School k-5 k-5
Student Enrollment 377 356
Attendance Area urban urban
% Free/reduced Price Meals 34.2% 34.6%
%Limited-English-Proficient
Students
22.8% 22.8%
Average School-wide Class
Size
24.1 23.9
Table 7: Comparative Demographic Data for Laytonville and Potter Valley
Laytonville Potter Valley
Grade Levels in School k-8 k-8
Student Enrollment 365 282
Attendance Area Rural Rural
% Free/reduced Price Meals 56.3% 45.4%
%Limited-English-Proficient
Students
0.3% 11.7%
Average School-wide Class
Size
19.9 19.7

32
Table 8: Comparative Demographic Data for Pinecrest and Bridgeport
Pinecrest Bridgeport
Grade Levels in School k-8 k-8
Student Enrollment 56 104
Attendance Area rural rural
% Free/reduced Price Meals 17.9% 20.4%
% Limited-English-Proficient
Students
none 4.8%
Average School-wide Class
Size
22.3 20.7
Table 9: Comparative Demographic Data for Edna Maguire and Neil Cummins
Edna Maguire Neil Cummins
Grade Levels in School k-5 k-5
Student Enrollment 545 585
Attendance Area suburban suburban
% Free/reduced Price Meals 30.0% 2.6%
%Limited-English-Proficient
Students
9.2% 2.7%
Average School-wide Class
Size
20.7 21.5
Table 10: Comparative Demographic Data for Sir Francis Drake Integrated Studies and
Traditional Programs
Drake
Integrated
Studies
Curricula
Drake
Traditional
Program
Grade Levels in Program 9-10, 11-12 9-12
Student Enrollment 161 889
Attendance Area suburban (school-wide)
% Free/reduced Price Meals 3.1% (school-wide)
%Limited-English-Proficient
Students
0.8% (school-wide)
Average School-wide Class
Size
24.8 (school-wide)

33
Table 11: Comparative Demographic Data for Red Bluff SRDC and Traditional
Programs
Red Bluff
Union SRDC
Red Bluff
Union High
Grade Levels in Program 11, 12 9-12
Student Enrollment 21 2018
Attendance Area rural (school-wide)
% Free/reduced Price Meals 29.6% (school-wide)
%Limited-English-Proficient
Students
1.6% (school-wide)
Average School-wide Class
Size
26.6 (school-wide)
Table 12: Comparative Demographic Data for Lincoln ISIS and Traditional Programs
Lincoln -
ISIS
Lincoln -
Traditional
Grade Levels in Program 9-10 9-12
Student Enrollment 79 2376
Attendance Area suburban (school-wide)
% Free/reduced Price Meals 19.7% (school-wide)
%Limited-English-Proficient
Students
14.6 % (school-wide)
Average School-wide Class
Size
27.5 (school-wide)
Data Collection
Data was collected from all study and comparison schools through site visits
occurring April through September of 1999. During the visits I collected data, distributed
teacher surveys and conducted numerous additional interviews with school
administration, staff and teachers. Site visits were scheduled to coincide with pertinent
school events such as open houses, student research presentations, an interpretive river
rafting trip, a student invention fair and the filming of a video. Most schools were visited
on more than one occasion. In all cases, the schools were visited at least once while in
session.

34
The length of the site visits ranged from half a day to two full school days. The
variation in length of visit was due to the varying complexity of data collection at the
different sites. The standardized data, student GPA, and attendance information were
often challenging to secure. In some cases data collection was as simple as making
copies of files and in other cases it required extensive computer or hand file searches and
compilation of material.
The comparative information included in this report was gathered, with
cooperation, from the participating schools and their school districts. Student
identification was removed from all records to ensure confidentiality, however, the
demographic characteristics of each sample group were maintained for comparison.
Every available measure of student achievement and performance was collected in as
much detail as possible from each school. Because the study represents schools and
programs from many school districts throughout the state of California, not all
comparative measures were available for every school. For example, academic portfolios
scored by the Education Task Force are unique to selected districts.
Due to unforeseen circumstances surrounding data acquisition, two study schools,
and their respective comparison schools, were eliminated from the study. Nueva Vista
high School was dropped from the study because of issues surrounding attendance and
standardized test data acquisition. Yreka High School was dropped from the study due to
contract issues surrounding completion of the Teacher Survey. In both cases every step
possible was taken to secure the data.
35
Teacher Survey
Teacher surveys (Appendix 2) were distributed during site visits and were
completed by a sample of teachers from all study and comparison schools. In most cases
the completed surveys were returned to the research team through the mail. Teachers
surveyed from study schools/programs were chosen by the administrator or lead teacher
within the school. Teachers were selected to reflect the grade levels and discipline areas
included in their EIC-based programs. Measures were taken to ensure that the teachers
from comparison schools selected to complete the survey coordinated with the
corresponding study school teachers as closely as possible. To eliminate as many
confounding variables as possible, the groups of survey respondents were matched using
years of teaching experience along with grade level(s) and subject area(s) taught.
As part of a teacher survey teachers were asked to report on their years of
teaching experience, grade level and subject areas currently teaching, and their personal
instructional practices. Respondents were asked to identify, from a set of given
statements, those that reflected their personal instructional practices and then to describe
their selection using narrative. The instructional practices highlighted in the survey were
those identified by SEER as criteria for EIC-based education. The results of the survey
allowed for the evaluation of the similarities and differences in instructional practices
between the study and comparison schools.
Survey content was based on the Program Evaluation Rubrics (Appendix 3)
developed by SEER. The rubrics are a tool for use by teachers and administrators
working with EIC-based programs. The rubrics are a way to evaluate the level to which a
program incorporates the key instructional practices of EIC-based education.
36
Scoring of the surveys for this study was conducted using a four point scale based
on the best practices of EIC-based education as determined by SEER. A score of four,
the best practice, was given to a survey response that exemplified that of the ideal EIC
program. A score of one was awarded to a survey response that either did not, or barely
typified the characteristics of EIC. All surveys were scored anonymously by a group of
four educators. Each component of the survey was scored independently by each scorer.
A component was given a score determined by the average of the four individual scores it
received. School-wide averages were calculated to compare the components of the
survey between study and comparison schools/programs. An average for all study and
comparison schools was also calculated for comparison.
The number of responses from the schools varied according to the demographics
of the sample populations and availability. Response quantity depended on number of
teachers and students involved and the grade levels and subject areas included in the
sample populations. For example, the smallest sample population was comprised of a
variable population not exceeding 20 students taught by one teacher. On the other hand a
school-wide program serving more than 500 students involved eight teacher responses.
Standardized Achievement Tests
Each school supplied achievement test scores from their annual testing programs.
Results from the Stanford Achievement Test (SAT), the California Test of Basic Skills
(CTBS) and the California Achievement Test (CAT) were analyzed in this study. The
three tests are norm-referenced achievement tests used to assess basic skills for k-12

37
students. A combination of subtest scores was used including: reading, math, language,
science, and social studies.
All schools included in the study participated in the SAT test in the 1997-98 and
1998-99 school years. Open Charter Elementary and Community Elementary used the
SAT in 1996-97 as well. The 4th
edition of the SAT was administered by the high
schools and all elementary and middle schools used the 9th
edition. The CTBS, 4th
edition, was administered during the 1996-97 school year to students at Bel Air,
Brookside, Edna Maguire, Neil Cummins and Wade Thomas elementary schools and Sir
Francis Drake High School. During that same year, Pinecrest and Bridgeport middle
school students were tested with the CAT, 5th
edition.
All subtest scores were reported in the National Percentile Rank (NPR) metric.
This score was selected based on conversations with the CDE’s Standards, Curriculum
and Assessment Division. NPR is the score used for comparisons by school districts and
schools. NPR provides the relative standing of a student in comparison with others in the
same grade in a norm-referenced group who took the test at a comparable time. It is a
score given to either an individual test taker or a sample of test takers. However,
individual NPR scores cannot be averaged to obtain a group result. In some cases it was
necessary for me to calculate group scores from individual scores. Therefore, the NPR
for a group was calculated according to the test manufacturer’s procedure. The average
Normal Curve Equivalent for a group of students was calculated and converted into a
group NPR using a conversion chart provided by the CDE (Appendix 4).

38
Student Attendance
Student attendance rates were compared using annual percentages of actual
attendance. The comparison of actual attendance rates was chosen over apportioned
attendance rates due to the enactment of new state policy regarding apportionment. All
study schools tracked actual attendance rates uniformly. Data was tracked for the 1996-
97, 1997-98 and 1998-99 school years.
Student Grade-Point Average
Student grade-point averages (GPA) were included in the analysis of Red Bluff
Union and Lincoln High School’s study and comparison populations. Students involved
in the EIC program were compared to a random sample of analogous students in the
school’s traditional program. These comparisons include analyses of average group GPA
and the fluctuation of student GPA throughout their high school career. The percentage
of students exhibiting increased, maintained and decreased GPAs is reported.
Lincoln High School uses a traditional four point grading scale. Red Bluff Union
High School uses a five point scale. Grades given in an honors class earn one point more
than they would in a traditional class.
Education Task Force Assessment Program
Results from Education Task Force (ETF) assessments are included for three of
the paired comparisons included in this report. Student scores were compared between
Brookside and Neil Cummins elementary schools; Wade Thomas and Bel Aire
elementary schools; and the programs from Sir Francis Drake High School. Each of
these schools belongs to one of the twelve districts that participate in the ETF. Scores for
39
all ETF performance measures are reported by mean score and percentage of students
taking the test that met or exceeded the proficiency standard of a score of four or better.
The ETF develops and scores assessments for k-12 students. Alternative
assessments are emphasized by the ETF and students are given opportunities to
demonstrate their ability to apply knowledge and skills in multiple ways. The assessment
program utilizes criterion- and norm-referenced standardized tests; authentic assessments
(portfolios); and on-demand performance tasks (direct writing, reading and mathematical
problem solving). Portfolio and performance task outcomes were used for this analysis.
Student work is scored by groups of trained teachers representing participating
districts. All scoring is done anonymously. Typically two teachers grade each student’s
work. The student’s score represents the average of the two marks. If the two scores
differ by too great a margin a third teacher is involved to resolve the discrepancy.
The ETF uses a six point rubric to assess all student portfolios and performance
tasks. Students are given a handbook for each of the assessments. The handbook
includes the appropriate rubric, requirements and information pertinent to completing the
assignment successfully. Students in all grade-levels are required to demonstrate
proficiency on ETF assessments by scoring a four or better. There is no penalty when
assessments are taken multiple times.
Results from the fifth-grade core literacy portfolio were analyzed for Wade
Thomas, Bel Aire, Brookside, and Neil Cummins elementary schools. Scores from the
1997-98 and 1998-99 school year are included for each school. The portfolio aims to
assess a student’s ability to read, write and communicate in a variety of subjects.

40
Students are responsible for preparing the portfolio from work they have completed in
class throughout the year.
Analysis of student scores from Sir Francis Drake High School includes the ninth-
grade direct writing, ninth-grade math performance tasks, tenth-grade core literacy
portfolio, twelfth-grade reading performance tasks and twelfth-grade writing performance
tasks. Scores from the 1997-98 and 1998-99 school year are included.
PART B
After working on the current study and conducting a literature review of similar
research, it became clear that methodology has historically been an area of weakness in
EE research. Many researchers before me have come to the same conclusion. Extensive
literature reviews of EE research by Leeming et al. (1993), Hoody (1995), NEETF
(2000), Bartosh (2003, 2009), Norman et al. (2006), and Wheeler & Thumlert (2007)
concluded that the majority of EE research conducted over the past few decades has
employed insufficient methodologies. Specifically, the bulk of research is criticized for
being primarily qualitative in nature; utilizing a lack of valid research instruments; small
sample sizes; lack of inferential statistics; and not controlling for pre-existing differences
between populations. While it is conceded that all studies have inherent limitations, the
depth of the methodological shortcomings present in the body of EE research makes it
difficult to substantiate the findings of the EE field. In fact in two major literature
reviews EE research was measured using rigorous evaluation criteria, focused
specifically on study methodology (Wheeler & Thumlert, 2007; Norman et al., 2006).

41
The goal in both cases was to identify scientifically based research to determine whether
EBE supports education reform efforts. Of the 100 documents identified by the research
team for Stop Waste, only four met the most rigorous criteria defining their results as
“possible evidence.” The Environmental Education Report conducted for the
Washington State Office of the Superintendent of Public Instruction located 76 studies
and found that only nine could be classified as “gold,” indicating an experimental design
with strong use of statistical analysis.
The outcomes of EBE and education in general are difficult to study. Education
is a social science and thus affected by what Bartosh refers to as the “human dimension”
(Bartosh, 2003). All of the complexities of human existence: socio economic status;
belief systems; family structure; peer influence; etc. become part of the EBE experience
and are difficult to separate from the outcomes. In addition to the study subjects, the
EBE programs themselves are dynamic and complicated. No two EBE programs deliver
the exact same experience to their participants. Subtle and obvious differences such as
teacher, level of involvement, extent of teacher training, degree of program support by
administration, etc. abound. These variables interact with each other and with all of the
variables existing outside of the program itself. This complexity adds to the limitations
of the instruments used to measure the outcomes and the fact that education produces a
generally self-selected rather than a randomized population to create a challenging area to
study.

42
The Need for Improved Methodology
Although EE poses many challenges to a research team, it is critically important
that the field focus on improving their study methodology. As discussed earlier, the
NCLB Act has required that teaching strategies and curricula be based on scientific
research. “The highly politicized arena of education” requires that quantitative data be
collected and the methodology and findings be “defendable” (Duffin, Powers &
Tremblay, 2004). In order for EBE to have a place in education reform research teams
must take this to heart when designing their research.
Providing teachers and administrators with strong empirical data supporting EBE
as a reform strategy will improve the relevance and significance of EBE in our nation’s
schools. There is some concern that the efforts to legitimize EBE take the focus off of
the need to transform the nation’s education system as a whole (Gruenewald, 2003,
2004). If the results of the EETAP’s correlation data discussed earlier are any indication,
administrators and educators want and need this data to support the EBE already
occurring in schools. Many experts agree the move to improve the methodological
soundness of EE research will provide a stronger case for EBE and lend it credibility in
the education reform movement (Tudor, 2012; Norman et al., 2006; Wheeler & Thumlert,
2007; Duffin et al., 2004).
The EE field is reacting to the need for stronger research methodology.
According to researcher Oksana Bartosh the trend is pushing toward using innovative
methodology (personal communication, 2012). For example, her 2009 doctoral
dissertation relied on a mixed methods research approach, combining qualitative and

43
quantitative methods with a strong emphasis on using the strengths of each method as a
foundation to build upon (Bartosh, 2009).
Other research teams have put an emphasis on developing better instruments for
measuring possible outcomes of EBE and related educational approaches. The Program
Evaluation and Educational Research (PEER) Associates, aimed at evaluating the effect
of four place-based education programs, developed a “dose-response” measurement
strategy. This strategy utilizes inferential statistics to test whether participation in one of
their programs increased the desired outcomes. PEER claims this strategy is a useful tool
for looking at situations that have many contributing factors, such as EBE.
The Argument for Evaluating the Teaching and Learning Environment
For the purposes of this report I focused my attention on the methodologies of
studies similar to the current study, where a population of students engaged in an EBE
program was compared to a group of students participating in a more traditional program.
While conducting the current study and then again during the updated literature review it
became clear to me the importance of evaluating the level of EBE implementation
present at the study and comparison schools. In my opinion this is a critical step in the
research process and can greatly affect the reliability and applicability of study findings.
The importance of evaluating the similarities and differences between study and
comparison schools can be illustrated using Alexander Astin’s Input-Environment-
Outcome (I-E-O) model (Astin, 1991). Astin’s research model states that the outcomes
of an educational program are affected by the inputs to the program as well as the
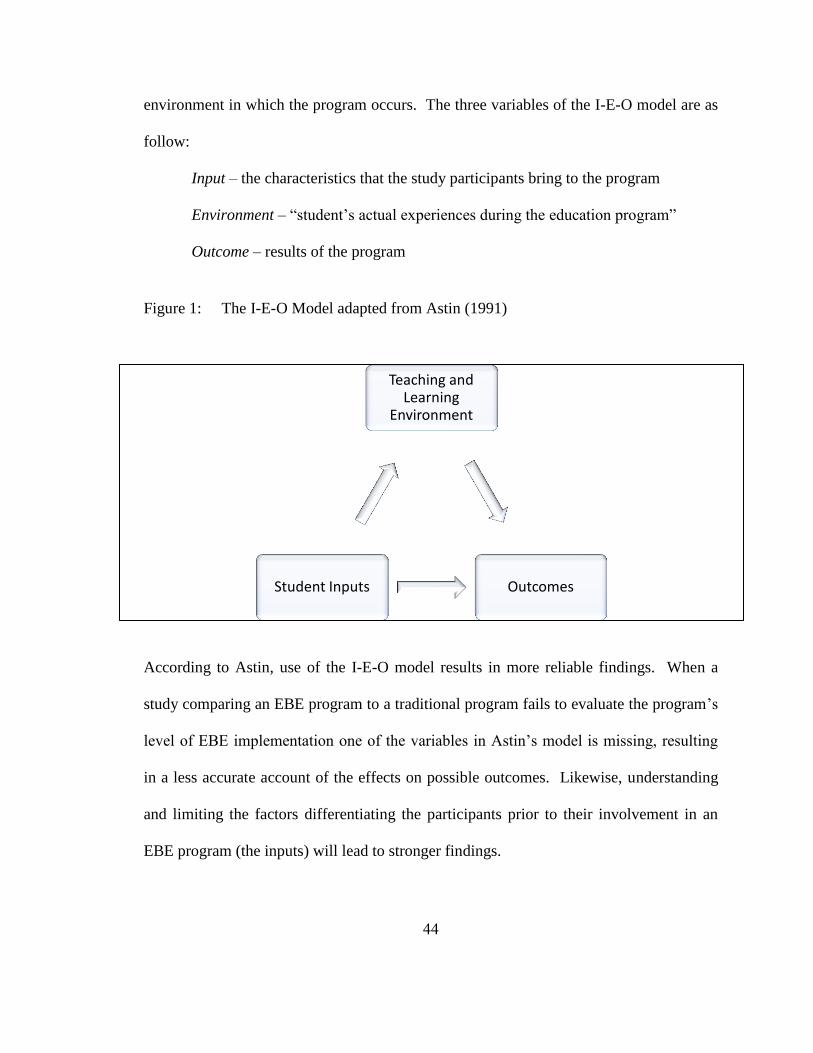
44
environment in which the program occurs. The three variables of the I-E-O model are as
follow:
Input – the characteristics that the study participants bring to the program
Environment – “student’s actual experiences during the education program”
Outcome – results of the program
Figure 1: The I-E-O Model adapted from Astin (1991)
According to Astin, use of the I-E-O model results in more reliable findings. When a
study comparing an EBE program to a traditional program fails to evaluate the program’s
level of EBE implementation one of the variables in Astin’s model is missing, resulting
in a less accurate account of the effects on possible outcomes. Likewise, understanding
and limiting the factors differentiating the participants prior to their involvement in an
EBE program (the inputs) will lead to stronger findings.
Teaching and Learning
Environment
Outcomes Student Inputs

45
Support for evaluating the level of a program’s implementation of EBE is noted
by other researches as well. Bartosh states in her 2003 thesis, “In those cases where it is
impossible to put the object of the research in similar environments, it is important to
understand the differences between them and take them into account when explaining the
results” (p. 62). Her highly regarded research made this an important element of her
research design. EBE programs vary greatly in their design and implementation, making
research findings difficult to apply to other situations. By evaluating these similarities
and differences researchers can better understand which program characteristics influence
outcomes most (Wheeler & Thumlert, 2007; Norman et al., 2006).
Examples of Improved Methodology
Few studies evaluate the level of implementation of EBE existing in study and
comparison schools included in comparative studies. Table 13 summarizes the current
studies comparing populations engaged in EBE versus those involved in a traditional
program and the methodology, if any, used to evaluate the teaching and learning
environment. In addition to my present study I found only three studies that incorporated
an evaluation of study and comparison school program characteristics into their research
design. Each of the studies used techniques and instruments unique to their work but
similar in their goal to include all three variables for Astin’s I-E-O model in their
research design.
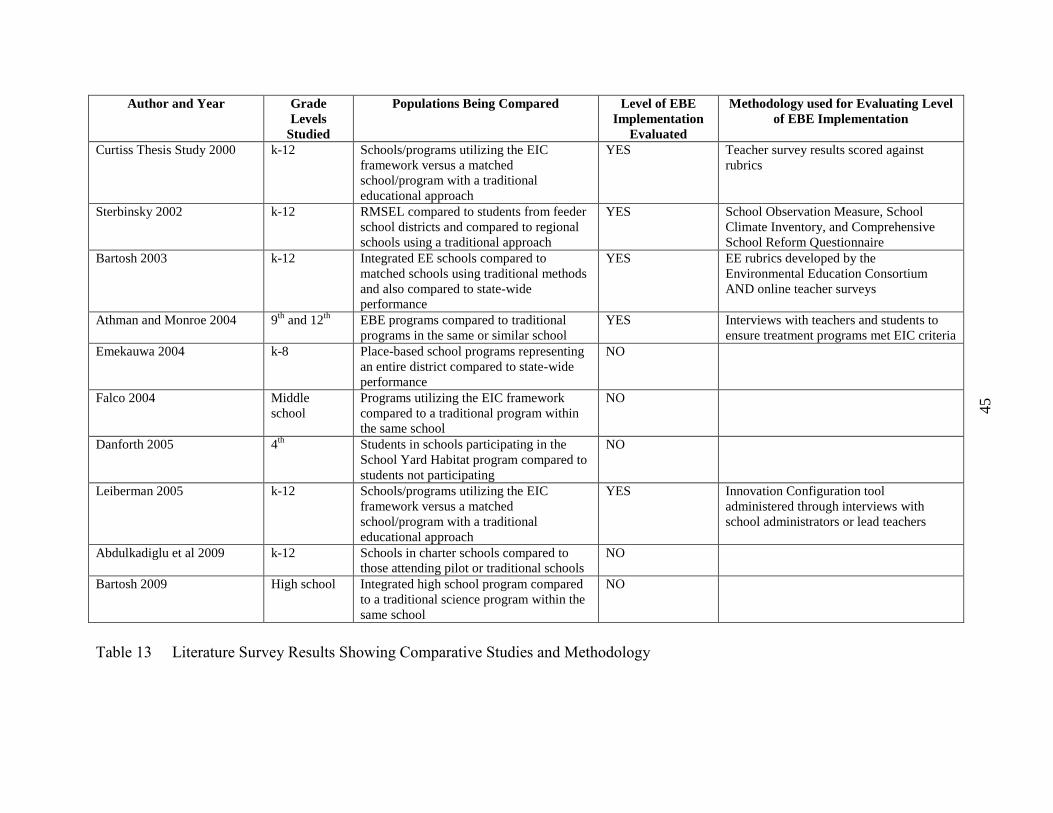
45
Author and Year Grade
Levels
Studied
Populations Being Compared Level of EBE
Implementation
Evaluated
Methodology used for Evaluating Level
of EBE Implementation
Curtiss Thesis Study 2000 k-12 Schools/programs utilizing the EIC
framework versus a matched
school/program with a traditional
educational approach
YES Teacher survey results scored against
rubrics
Sterbinsky 2002 k-12 RMSEL compared to students from feeder
school districts and compared to regional
schools using a traditional approach
YES School Observation Measure, School
Climate Inventory, and Comprehensive
School Reform Questionnaire
Bartosh 2003 k-12 Integrated EE schools compared to
matched schools using traditional methods
and also compared to state-wide
performance
YES EE rubrics developed by the
Environmental Education Consortium
AND online teacher surveys
Athman and Monroe 2004 9th
and 12th
EBE programs compared to traditional
programs in the same or similar school
YES Interviews with teachers and students to
ensure treatment programs met EIC criteria
Emekauwa 2004
k-8 Place-based school programs representing
an entire district compared to state-wide
performance
NO
Falco 2004 Middle
school
Programs utilizing the EIC framework
compared to a traditional program within
the same school
NO
Danforth 2005 4th
Students in schools participating in the
School Yard Habitat program compared to
students not participating
NO
Leiberman 2005 k-12 Schools/programs utilizing the EIC
framework versus a matched
school/program with a traditional
educational approach
YES Innovation Configuration tool
administered through interviews with
school administrators or lead teachers
Abdulkadiglu et al 2009 k-12 Schools in charter schools compared to
those attending pilot or traditional schools
NO
Bartosh 2009 High school Integrated high school program compared
to a traditional science program within the
same school
NO
Table 13 Literature Survey Results Showing Comparative Studies and Methodology
46
The State Education and Environment Roundtable continues to conduct research
into the academic potential of EBE since their foundational report Closing the
Achievement Gap and the follow-up research on the California Student Assessment
Project (Lieberman, 2005). Phase Two of the California Student Assessment Project,
completed in 2005, sought to gather additional evidence to substantiate earlier research.
For this phase of research the team utilized a couple instruments for matching and
evaluating study and comparison schools that were unavailable for use in the first phase
of the project. First, the process of identifying comparison schools during Phase Two
was enlightened by a new tool developed by the California Department of Education
(CDE). The “Similar Schools Ranks” is a classification system relying on a mixture of
demographic data to match schools within the state. The ranking uses a rigorous
comparative methodology accepted by the CDE as well as the formal education
community in general.
Second, SEER utilized a new diagnostic tool developed in cooperation with a
consultant from the Southwest Regional Educational Development Laboratory (SEDL) to
assess how EBE-specific strategies are being implemented by classroom teachers. The
Innovation Configuration (IC) instrument focuses on the instructional strategies
originally identified in Closing the Achievement Gap (integrated-interdisciplinary
instruction, community-based investigations, integration of natural and social systems,
collaborative instruction, learner-centered approaches, cooperative learning, authentic
assessment). The team used this IC tool to “collect uniform qualitative data on
instructional practices used at treatment and control schools for this study” (Lieberman,

47
2005, p. 4). The IC tool utilized an interview administered to school administrators or
lead teacher to gather the data.
Another study that analyzed the teaching and learning environment at treatment
and control schools was that conducted by Oksana Bartosh for the Environmental
Education Consortium (EEC). For her study, Bartosh compared 77 pairs of schools. In
addition to demographic data such as school size, economic status of students, ethnic
composition, and geographic location, Bartosh used a set of rubrics to rate all possible
study school participants. The rubrics were developed as part of the Environmental
Assessment Project headed by the EEC and are “used to determine the level and extent of
implementation and integration of environmental education” in schools (Bartosh, 2003, p.
63). A school is evaluated on six characteristics:
integration of EE into curriculum;
curriculum development (level of staff collaboration, type of
curriculum, link to natural environment);
type of instruction;
student-centered practices;
assessment style; and,
community involvement.
To assess the teaching and learning environment in study and comparison schools even
further Bartosh also created an online survey for administrators and teacher to complete.
The survey collected data on staff educational and professional background, attitudes
toward EE, use of EE in the school, and school funding.
48
The last study I found to incorporate an analysis of program characteristics into
the research design was a program evaluation of the Rocky Mountain School of
Expeditionary Learning (RMSEL). The evaluation was performed by the Center for
Educational Policy (CREP) to determine the impact of the school’s educational
philosophy and practices on student achievement as well as school climate and pedagogy.
PMSEL is a “school of choice” for students living in four school districts in Denver,
Colorado. To compare student achievement between RMSEL students and those from a
traditional education setting a comparison group of students was formed from
representative samples of students attending the four feeder districts.
The unique methodology present in this study was used to evaluate school climate
and pedagogy. It consisted of classroom observations and surveys. Classroom
observations were conducted at RMSEL and the 24 schools selected for the norm group.
CREP designed a School Observation Measure (SOM) to guide the observations and
collect data in six categories: instructional organization, classroom organization,
instructional strategies, student activities, technology use, and assessment. Ten 15-
minute observations were conducted in a single day at RMSEL and each comparison
school.
Adding to the classroom observation data were survey results gathered by the
School Climate Inventory (SCI) and the Comprehensive School Reform Teacher
Questionnaire (CSRTQ). Both instruments were designed for use in school-based
improvement planning and reform efforts. The SCI targeted program characteristics
including leadership, instruction, collaboration, and involvement while the CSRTQ

49
explored teacher perceptions regarding staff collaboration, community support and
curriculum development.

50
CHAPTER 3
Findings
TEACHER SURVEYS
School Profiles
Profiles were composed for each of the study and comparison schools as a way of
creating a picture of the essence of each school. The profiles are a narrative
representation of the school’s educational culture and instructional practices as they relate
to the instructional framework of EIC. The school profiles are comprised of information
provided by a school’s teachers and administration. The bulk of the information included
in the profiles was taken from the teacher surveys. The profiles were written to reflect
the diversity of the teacher responses from a given school. Other sources of information
include personal communication with teachers and administration during phone
interviews and site visits. All profiles were submitted to the school to confirm accuracy
prior to inclusion here.
Brookside Elementary School Profile (Study School)
Brookside Elementary School is part of the Ross Valley School District in Marin
County. The school serves a suburban population, educating approximately 500 students,
grades K-5, on two campuses. Brookside School earned the California Distinguished
School Award in 1996 and is also a recipient of the Golden Bell Award. Brookside is
committed to creating an environment that will encourage their students’ sense of
belonging and responsibility within their community.

51
Students at Brookside Elementary utilize an array of indoor and outdoor
instructional settings throughout the school year. Both Brookside campuses have gardens
and other outdoor areas that are used for specific subject matter instruction as well as
integrated studies. Work in the garden is used to connect students’ knowledge and skills
in a number of subject areas. Plant life cycles are observed and investigated; colonial
herbs are grown and researched; and, native plants and their uses are studied. The school
grounds are used to extend the learning environment to include outdoor locations for
writing, observing, and reading.
Brookside teachers incorporate field work into their studies of ecosystems and as
enrichment for classroom lessons. For example, students gain first-hand knowledge of
local riparian ecosystems and agricultural land-use practices through their work on
riparian restoration projects. They also have a chance to explore the complexity of
natural ecosystems.
Teachers at Brookside focus on using thematic units to connect multiple
disciplines. The number of disciplines involved in the units, and the degree to which they
are connected varies from teacher to teacher. For example, the second grade classes
participate in a unit on lighthouses, which incorporates local history, the study of native
plants and animals, literature, science and writing. A community member who grew up
in a lighthouse shares his historical perspective with the students, and a fieldtrip to a
working lighthouse provides students with a real-world experience. A culminating
project challenges students to create their own working lighthouse, demonstrating their
knowledge of electrical circuitry.

52
The school-wide effort to incorporate project-based instruction is supported
through partnerships with the Autodesk Foundation, Marin Community Foundation, and
the Center for Ecoliteracy. These partnerships provide the school with funding needed to
allow for planning time, professional development, and ongoing support of project-based
learning efforts.
The added planning time provided by their grants has allowed Brookside teachers
to model sharing and collaboration. Although the teachers at Brookside primarily
instruct alone, they take advantage of large blocks of planning time to collaborate. Most
curricular planning is done in grade-level teams with specific planning time for
environment-based projects. Community members are used as resources to enrich the
curriculum.
Brookside teachers report that their instructional practices combine investigation
of real-world problems and issues, textbook learning, and study of simulated problems
and/or issues. Students work on projects in their local community and school garden.
For instance, fourth-grade students frequently visit a special area they have chosen on a
ridge behind the school. This location becomes a place for reflection, observation, and
community action. The students use their spot to address issues in their local community
around open space.
The focus on project-based learning gives students opportunities to identify and
select projects from within their teacher’s curriculum to pursue. Large projects develop
from what students want to know, what they do know, and what they need to know. The
second grade Town Simulation project allowed students to use their local community
53
knowledge to establish the simulated town of Fernfield. Students assumed roles within
the Fernfield community and created businesses, parks, and residential areas modeled
after their real-life community. This project included interviews with local residents,
map construction, world trips, local history, and the use of present-day land-use policies.
In addition large group projects, some teachers also incorporate blocks of student-
directed project time within the school week.
The teachers at Brookside utilize a variety of cooperative learning strategies.
Students are engaged in individualized work as well as group-based work. The use of
groups varies throughout the school. Some teachers assign groups while others guide
their students on team building. Many teachers utilize group roles such as recorder and
time-keeper as a strategy.
Students at Brookside are assessed in a variety of ways. The school uses sets of
rubrics for their report card and many teachers have students develop their own rubrics
for assignments. Portfolios are used in multiple subjects to show student mastery of skill
as well as their academic growth over time. Brookside participates in the portfolio
proficiency assessments directed by the Education Task Force. Students are also
assessed on their presentations, performance on tasks, and final products.
Neil Cummins Elementary School Profile (Comparison School)
Neil Cummins Elementary School, located in suburban Marin County, is part of
the Larkspur School District. Nearly 600 students, grades K-5, are served by this award-
winning elementary school. Neil Cummins has twice been honored as a California
Distinguished School.

54
Teachers use field trips and other outdoor learning experiences to connect
multiple disciplines and enrich classroom lessons. For example, each year one class
builds a life-sized replica of a tule canoe and visits a site where such a boat might have
been used hundreds of years ago by native people. This experience helps the students
make connections between the use of natural resources in the past and present.
Teachers use projects and themes to connect multiple disciplines. Discipline-
specific skills are used to support the development of skills in other subject areas. For
example, math, social studies, language arts and fine arts are all connected in the fourth-
grade California Travel Project. In this project, students go on a make-believe trip to
various regions of California. As they “travel,” students keep track of expenses, write
about their experiences and create images to help describe the region.
Generally, teachers instruct alone, although some collaboration takes place. Once
a week, students have early dismissal to provide teachers with planning time. Grade-
level teams use this time to plan curriculum, offer each other support and insure
consistency across the grade levels.
The focus of the school’s curriculum is provided by state and district standards.
Authentic work, real-world issues, simulated projects and student research are used to
supplement the curriculum. Generally, student learning is directed by the teachers.
Large projects, often involving student choice, are frequently incorporated into the end of
major units of study. Students are also encouraged to make academic and personal goals
in the beginning of the year. These goals are the basis of reflection throughout the year.

55
Students work is conducted individually and in group settings. The organization
of the work groups varies with the lesson and instructor. Group composition ranges from
those randomly selected by teachers to those selected and organized by the students.
Teachers encourage students to learn and work in a variety of different groupings
throughout the year.
A variety of methods are used to assess student work. Teachers evaluate
knowledge acquisition through evaluation of creative writing, traditional tests, classroom
discussions and project products. Students at Neil Cummins prepare portfolios of their
work in a variety of subjects as part of the Education Task Force proficiency assessments.
Wade Thomas Elementary School Profile (Study School)
Wade Thomas Elementary School serves a suburban population within Marin
County. The small kindergarten through fifth-grade elementary school has an enrollment
of approximately 350 students. The school has eighteen full-time equivalent teachers and
one administrator.
Instruction at Wade Thomas occurs most often in the classroom setting. Outside
resources such as the Lawrence Hall of Science and various community members and
professionals are invited into the classroom to provide the students with a diversity of
classroom experiences. Out-of-classroom experiences in a variety of locations are
connected to the classroom experiences in order to meet specific learning objectives
and/or standards. Learning sites such as museums, local businesses and the school
garden are among those used by teachers.

56
The diversity of learning settings used by Wade Thomas teachers provide
opportunities for students to participate in many projects. Teachers use endeavors, both
inside and out of the classroom, to connect different subject areas. A school-wide effort
is made to present curriculum in an interdisciplinary manner. Particular focus is put on
combining reading, science and social studies. For example, fourth and fifth graders at
Wade Thomas participate in the regional STRAW (Students and Teachers Restoring A
Watershed) program. Through STRAW the students have assisted in creek restoration
efforts on local ranch lands. This work has enabled students to explore local natural
systems and land-use patterns while developing a sense of their role in the community.
Math, science and creative writing are all incorporated into the student's experience.
Instruction focuses on topics derived from real-world problems and issues
identified by the teachers and students. These problems and issues are often incorporated
into projects. For example, the story Velveteen Rabbit inspired a class of fourth graders
to design and build toys from recycled materials. Their toys were auctioned off and all
proceeds were donated to a homeless family in their community.
Although much of the curriculum is based on school district and state determined
learning objectives, students at Wade Thomas often help direct their learning. Students
are allowed to pursue individual areas of interest within a framework set up by teachers
and predetermined standards. The many projects undertaken at Wade Thomas are
frequently initiated and directed by students. In one instance a fourth/fifth-grade class
developed a language arts project after watching a production of Shakespeare's Much
Ado About Nothing. These inspired students decided to write and present their own

57
Shakespearean plays. The students developed their own rubrics for evaluation and
established a timeline for completion of the project.
Teachers employ cooperative learning strategies in all subject areas. Students
work as groups for Mathland, as literature circles, to complete reports and to develop
projects. Groups are organized both by teachers and by students themselves. Teachers
make an effort to organize teams that will take advantage of individual student's strengths
while encouraging group communication and teamwork skills.
Teachers at Wade Thomas work individually and as teams. Planning often occurs
within grade-level teams while instruction takes place primarily by individual teachers.
Some teachers do work together on interclass projects involving multiple grade levels.
Wade Thomas also has a mentor teacher program to provide one on one support for new
teachers.
Classroom instruction is enriched by the introduction of community professionals,
resource experts and parent volunteers. In one instance, a stock broker/father volunteered
to lead a unit on fractions using the stock market as a framework. The three-month unit
had students develop stock portfolios and follow their investments. Students learned to
add, subtract, multiply and divide fractions, and convert them into decimals to determine
their gains or losses in the stock market. The project culminated with a trip to the San
Francisco Stock Exchange to experience the market first-hand.
Student mastery of skills, knowledge and concepts is assessed using multiple
strategies. Conventional and standardized tests are utilized along with student self-
evaluations, student-teacher interviews, teacher observation and task-based assessments.

58
The school participates in the district-wide Education Task Force assessments, which
require students to develop portfolios of their work in various subject-areas. Much of the
assessment at Wade Thomas is based on teacher-and student-created rubrics.
Bel Aire Elementary School Profile (Comparison School)
Bel Aire Elementary School is located in suburban Marin County. The school
contains grades three through five. Enrollment is approximately 370 students.
Instruction takes place primarily in the classroom at Bel Aire. Guest speakers and
projects are used to broaden the classroom setting and make connections between
student’s classroom experiences with those outside of school. In addition, occasional
out-of-class experiences are combined with the classroom instruction to meet learning
objectives and standards. Field trips to local historical sites and exploration of the school
neighborhood are examples. One teacher uses neighborhood walks to reinforce student's
map skills and to accomplish team-building exercises.
Teachers at Bel Aire plan and instruct both individually and as grade-level teams.
Most grade-level teams meet on a regular basis to share ideas, develop learning units,
coordinate curriculum, utilize each other's strengths, pursue field trips and develop team-
teaching opportunities. A formal team-teaching effort was recently established at the
fifth-grade level for social studies and science instruction. Teachers now have the
opportunity to plan together and pursue specialized skills.
Curriculum design is based mostly on the learning objectives established by
school and state standards. Within this framework, student's interests, intelligence level
and needs are supported. As well, all student learning styles are addressed throughout the

59
curriculum. Some students participate in "I search" research projects. This project
allows students to pursue a question of interest to them, write a report and develop it into
a computerized hyperstudio stack.
Teachers make use of a variety of resources to develop the focus of study in their
classrooms. Textbooks, current events and simulation projects provide the majority of
the topics studied in the classroom. For example, as part of a social studies unit, fifth
grade students are required to plan a trip that will take them across the country. This
simulation project develops student's study skills, research skills and map skills as they
use their knowledge of math, reading and writing to develop a final product.
The cross-country trip is a good example of how teachers at Bel Aire use theme-
based units to connect various disciplines. Within these units elements from multiple
subject areas are combined to accomplish a final product. Teachers also utilize skills
from one discipline to strengthen those of another. For example, students use their
language arts skills to respond to math and science problems, or math is used to complete
calculations associated with a social studies project.
Collaborative student learning groups are heavily utilized at Bel Aire. Students
have the opportunity to work in a variety of group settings as well as individually.
Groups are organized in diverse ways depending on the nature of the project or goal to be
accomplished. For instance, students are combined in small groups of similar ability
level, by student interest, or to ensure balanced personality types or academic strengths
and weaknesses. Teachers also guide students as they select their own groups and roles
within the group.

60
A variety of tools are used to assess student learning at Bel Aire. Teachers rely
on conventional tests, student writing, project outcomes, portfolios and performance- and
task-based assessments. Rubrics are used to establish assessment criteria and make them
available for students. Self-reflection on the part of the student is also an important
element. All fifth grade students are responsible for presenting themselves as readers and
writers through a self-compiled portfolio of their work.
The Open Charter Elementary School Profile (Study School)
The Open Charter School is a public elementary school within the Los Angeles
Unified School District. It was founded in 1977 by parents looking for an alternative to
the traditional school program. Open is a magnet school that is fiscally dependent on the
district. The school’s approximately 375 kindergarten through fifth-grade students are a
diverse group representative of the racial, socio-economic and ethnic make-up of the Los
Angeles basin. Open Charter has been locally and internationally recognized for its
innovative teaching methods and instructional programs.
Open Charter is organized into seven multi-age (two grade levels) clusters, each
with a team of two teachers. Each cluster occupies a double-sized open classroom,
creating an environment in which students can move freely. The curriculum at Open is
organized around the school wide theme of “Interdependence: Human Interaction with
the Environment.” The school works from the philosophy that children are natural
learners. The learning environment provided by the school centers around experiential,
constructivist opportunities for students.
61
The use of a diversity of learning settings varies amongst the teachers. Some
teachers utilize field trips and the local community to extend their curriculum and provide
their students with first-hand experiences. Other teachers integrate field studies and
extensive trips as focal points in their curriculum. For instance, extensive field studies of
the school community provides one cluster with the framework they need to design and
build a city 100 years in the future. This theme integrates all aspects of the class as
students assume roles such as mayor and city council and work to establish their city.
Another group of students focuses on their local bioregion. Field studies of a local
wetland ecosystem, investigation of abandoned mines and a weekend trip to an outdoor
science school are examples of the learning settings used to initiate studies of wildlife,
literature and cultural arts.
Creating an interdisciplinary curriculum is a school wide effort at Open Charter.
Teachers consciously make connections between the different disciplines and encourage
students to examine them. Themes and ideas are employed to unify different aspects of
the curriculum, supporting and developing the acquisition of skills in a meaningful
context. The theme or idea serves as a focus which students need knowledge and skills in
all subjects to understand. In one cluster, systems and planet Earth are the unifying
themes. The idea that all things are connected is reinforced and threaded throughout the
curriculum. For example, in a theme examining the Gold Rush, students explored
historical perspectives, learned about the environmental impacts of the mining and
examined present day affects through classroom and outdoor experiences.
62
Curriculum is driven by real-world problems and issues related to the themes of
each cluster. Textbooks, novels, films, newspapers, magazines and technology are used
as supplementary materials. Current events and monumental historic events also impact
the focus of study. Student interest influences the topics studied within the framework
designed by the teachers. For example, students and teachers in the exploration cluster
brainstorm about what explorers do, what they would like to explore, how to explore and
why we explore, to determine the what to explore.
Teacher teams design their curriculum around themes and issues of interest to
them and their students. State and district frameworks and standards are the foundation
of the curriculum. Student skill level, interest and learning style influence curriculum
planning and style of instruction. Teachers are often taken in new, unexpected directions
as a result of student interest and issues.
The teachers at Open work in a highly collaborative environment. Teachers
rarely, if ever, plan or teach alone as they are organized into teams of two. As a result, all
aspects of their curriculum are planned as a team. Regular planning time is provided for
teaching partners, grade levels and across the grade levels. In addition, Open Charter was
founded with a Governing Council of parents, teachers and the administrator sharing the
decision making process. Consequently, parents and community members contribute a
great deal to the school and students. Local authors, community performing arts groups
and parents are invited into the school to share their talents and expertise with students.
Students at Open experience a variety of collaborative learning environments.
The school culture promotes cooperation and group work. Group organization and use

63
depends on the nature of the project, the purpose and the students. Heterogeneous groups
of mixed ability levels are the most commonly used. Temporary flexible homogenous
groups are used when a particular group of students needs to earn a specific skill.
Groupings remain fluid as students grow and change. Groups are sometimes organized
by students or according to interest.
Assessment of students at Open occurs in a wide variety of ways. Teacher
observation, authentic application of knowledge, projects, portfolios and journals are
among the assessment tools utilized by teachers. Students are also expected to do a
reflection of their own learning and write a self-evaluation as part of a student-led,
parent/teacher conference. Teachers also rely on a tremendous amount of conferencing
and dialoguing with students to evaluate student understanding and identify questions
they may still have. Rubrics are also a frequently used assessment tool. Both students
and teachers create and use rubrics to evaluate work.
The Community Elementary School Profile (Comparison School)
Community Elementary School serves approximately 350 students in
kindergarten through fifth grade. The school is located in the city of Los Angeles and
draws its students from an urban attendance area. There are two administrators and 17
full-time equivalent teachers. A diversity of instructional locations are used by the
teachers at Community to combine both in-classroom and out-of-classroom experiences.
These learning settings include the local community, field trips and school grounds. The
sites are incorporated into their instructional practice to give students hands-on learning
opportunities, connect multiple disciplines and to enrich classroom lessons. For example,

64
a third-grade class used a walking field trip around their school neighborhood to combine
math and language arts lessons and encourage discussions about their community.
Teacher collaboration is encouraged and practiced frequently at Community.
Most collaboration and teaming occurs within a given grade level. A “restructured week”
allows for common planning time one afternoon a week.
Instruction occurs both individually and in teams of teachers. Many teachers use
team-teaching strategies to deliver certain subjects and lessons. The second grade
teachers team-teach reading, science and social studies.
Parents and community members are invited by some teachers to participate in
instruction and planning. Their expertise is used to enrich classroom lessons. One grade-
level team uses a parent committee to supplement their art units.
The teachers use themes to coordinate student learning in multiple subject areas.
The disciplines are connected to simultaneously develop knowledge and skills in several
subject areas while exploring their interdisciplinary connections. “Scottish Storyline,”
for example, was a four-month program in which students created families and
communities in an historical context. Within these families the students explored
California state history and geography, planted gardens and practiced conflict resolution
and group management skills.
A combination of textbook activities, simulated study topics and real-world
problems and issues are used by Community teachers as focal points for instruction.
Thematic units and current world events are used to introduce and discuss real-world
issues. One group of second grade students expressed a concern for social issues within

65
their community. They collected personal grooming items and reading material to donate
to a local center for battered women.
The curriculum at Community is primarily directed by the teachers. It is designed
to incorporate students’ personal needs and interests and takes into account students’
experiences and learning styles. Students are encouraged to construct their own
understandings and perspectives, and are given some opportunity for independent study
and choice. The Writer’s Workshop, for example, allows students to choose topics for
their writing projects. Students are responsible for creating a portfolio, evaluating their
own work and developing goals and schedules for themselves.
Students at Community participate in both group and individual work. Group
composition varies widely according to the learning situation. Teachers and students
both have a role in organizing groups. While some groups are selected randomly, others
are organized to take advantage of students’ diverse skills, learning styles and
interpersonal abilities. Group members assume individual roles within their groups, such
as recorder, facilitator and artist.
Teachers evaluate students’ mastery of skills and knowledge using portfolios;
project assessments; oral and written tests; journal writing; peer assessment; and self-
reflection. Rubrics are used in a number of subject areas. Students are encouraged to
express acquired knowledge through creative means, including dance and song writing.
Laytonville Elementary /Middle School Profile (Study School)
The Laytonville Elementary and Middle School are housed on the same campus
in the middle of the small rural town. Approximately 365 kindergarten through eighth-

66
grade students attend the schools. With the help of numerous grants and partnerships
Laytonville schools have become a model of community-based education. Their
educational gardens, mid-scale vermicomposting (composting with worms) project and
learning landscapes have become models for other schools across the country.
Laytonville school reform began in the 1980s when a group of teachers started to
think about centering learning around student-lead projects. In 1986 a modest school
garden was created as a result of student interest. Once established, the garden gained
interest from students and teachers alike. A garden coordinator was hired to act as a
mentor teacher, helping others integrate the garden into their curriculum.
In 1990 a group of teachers, community members and administrators applied for,
and won, the six-year, SB 1274 school restructuring grant. Their objective was to gain
support for the continued integration of project-based learning into their curriculum.
Then in 1996 the school formed a partnership with the Center for Ecoliteracy. This
relationship strengthened the school's commitment to providing its students with an
education that links ecology, community and culture.
Laytonville students have the opportunity to use a diversity of locations as
learning settings. The local watershed is explored through walking field trips. A near-by
meadow and creek facilitate various field studies through which students can apply the
skills and knowledge they have learned in the classroom. Through Adopt-a-Watershed
students have the opportunity to become stewards of the local watershed. In addition, a
local nature preserve is used for overnight trips.
67
The Laytonville campus itself provides a diversity of learning settings. The
school's organic garden is used extensively by students in all grade levels. Applied
science students, and those in the garden elective specialize in maintaining the garden,
vermicompost project and the chicken coop. Products grown in the garden and the coop
are sold to the school cafeteria and community.
The campus is also rich with learning landscapes outside of every classroom.
These landscapes are being created to promote in students a sense of responsibility and
respect for their school grounds while providing a context for learning. Many of the
plants used in these landscapes are grown by students in their nursery. Each landscape
reflects the interests of the students and teachers. One garden displays all of the fifty
state flowers; another is planted with vegetation to attract butterflies. The butterfly
garden was part of an examination of the migration of monarch butterflies. In addition to
the garden a mural was designed and painted by students with the help of a local artist.
Teachers use themes and projects to weave together multiple subjects and connect
academic content areas. At the primary level teachers work to accomplish learning goals
by creating a web of interrelated activities that tie together many learning experiences.
For instance, independent study students, those students unable to attend school on a
daily basis due to the distance of their house from campus, studied a unit based on flight.
Within this theme students learned about the physics of aerodynamics, the history of
early aviation, filed simulated flight plans, kept a journal, built model planes, visited an
aviation museum and flew in small planes. Community support was instrumental in the
success of this learning experience.
68
At the middle school classes are arranged so that the core subjects, math, science,
English, social studies and literature, are taught in a block schedule. The blocks, at least
two periods long, combine math with science and English with social studies and
literature. This schedule allows students enough time to work on interdisciplinary
projects and helps them to make the connections between the subject areas. This
arrangement also allows teachers to specialize, teaching to their strengths and pursuing
their interests.
As part of the restructuring efforts at Laytonville the teachers have received a lot
of support to develop a shared vision school-wide. At the primary level teachers still plan
and instruct primarily alone. Therefore two classes at the same grade level may look very
different. Amongst these teachers shared instructional responsibilities include
enrichment programs such as science, music and health. The independent study teachers,
on the other hand, work together when planning activities and often involve parents in
designing the curriculum.
The middle-school teachers plan and instruct alone and as teams. School reform
has given the teachers a lot of freedom to meet and plan courses of study. Teaching
teams meet daily to discuss students and resolve scheduling issues. They often make
adjustments in the schedule to accommodate individual students and school projects.
Much of the curriculum at Laytonville is focused on community-based events,
issues and problems. Their partnership with the Center for Ecoliteracy stresses the
importance of linking the local ecology with community and culture. Many projects
conducted at Laytonville involve local tradespeople. This practice supports the local
69
economy while providing students with community mentors and teachers. Such a project
inspired students to research the possibility of creating local, ecologically sustainable
businesses. With the support of local investors students began making marketable
products such as birdhouses and handmade paper. Now, students are responsible for
developing and running a soup business that will make and supply fresh soups to the
school cafeteria.
Teachers often use current events as a jumping off place to teach global problems.
Middle school students conduct an integrated research project on a current social issue
within the United States. Students in the past have chosen to pursue such topics as
substance abuse, global warming and media violence. All core subject areas are
incorporated into their projects.
The curriculum is designed within the framework of state and district standards.
The needs, experiences, interests and goals of the students fill in this framework. Local,
community-based issues and projects also drive the direction of the curriculum. Teachers
allow students to follow their interests and use their experiences by offering many
options and choices on projects and assignments. The curriculum in one elementary
classroom was provided by their chosen class name, the Pandas. This lead to a study of
China and a study of panda bears in fiction and non-fiction literature.
In the middle school, teachers use Complex Instruction methods to promote
collaborative learning environments. Complex Instruction is an instructional strategy
designed to build students' higher level thinking skills through the use of complex and
challenging content in a cooperative group setting. All tasks are open-ended and require

70
the participation of each member in a team. Successful completion of a task requires the
application of multiple abilities and skills. The middle school staff was trained in using
these methods as a group at a summer institute. They also facilitate training workshops
designed to teach other teachers the methods of Complex Instruction.
A variety of tools are used to assess student learning. Conventional methods of
examination are combined with more authentic measures of learning such as journals,
portfolios and projects. Teachers give students the opportunity to choose from many
different work products including oral presentations, scrapbooks, dramatic presentations,
written reports and models. Students at all grade-levels are required to assess their own
learning and reflect on academic goals they set for themselves throughout the year. At
the middle school students' understanding of interdisciplinary connections is evaluated
using lessons that incorporate multiple disciplines. In addition teacher-generated and
student-generated rubrics are used to measure a students' progress toward essential
learning outcomes.
Potter Valley Elementary/Junior High School Profile (Comparison School)
Potter Valley Elementary/Junior High School is a small rural school. The school
has approximately 300 students in kindergarten through eighth-grade. Seventeen full-
time equivalent teachers and one administrator work at Potter Valley.
Instruction takes place primarily in the classroom environment. Field trips are
often linked to science units. For instance first through third graders visited a local gold
mine while studying geology, a local lake during their watershed study and a zoo while
exploring living things. In-classroom and out-of-classroom experiences are combined to
71
meet learning objectives and to provide students with experiences that connect the skills
and knowledge from multiple subject areas.
Teachers at times present disciplines as separate subject areas. Multiple
disciplines are also combined to develop knowledge and skills in all, while exploring
their connections. At the primary level, reading and writing are incorporated into all
social studies and science studies. Examples include science displays that develop
research skills while utilizing writing and art, and studies of ancient civilizations that
involve writing and art. At the junior high level, students in the Core course explore
language arts in the context of historical, geographical and cultural exploration.
Teachers combine textbook lessons and activities with real-world problems and
issues for instruction. Newspaper articles, books and magazines serve as a source of
classroom issues. Students at the elementary level have the opportunity to be involved in
writing letters about rainforest issues and participating in a river clean up through the
local 4H group.
At the junior high level students have the opportunity to enroll in a Project-Based
Learning course. This class instructs students in problem solving and communication
and organizational skills. Students apply these skills to develop projects within their
school and community.
Curriculum design is based primarily on district and school determined learning
objectives. Students' personal needs, learning styles and experiences are taken into
account as well. Student council creates an opportunity for students to be involved in

72
establishing the school climate. Students are also guided by teachers through a process of
evaluating their strengths and weaknesses for goal setting.
Teachers do most of their instruction alone. Grade-level teams meet weekly to
plan curriculum and discuss student progress and interventions. In some grade-levels,
teachers share students for activities such as targeted reading and math instruction.
A wide variety of assessment tools are used at Potter Valley to evaluate student
progress. Teachers actively prepare students for standardized testing. Students are
required to meet grade-level criteria to advance. The measures used include authentic,
meaningful activities that attempt to cross discipline boundaries. Examples of this are
genre-specific writing prompts, weekly math fact tests and tri-annual performance
assessments in reading. A comprehensive, language arts portfolio program was recently
implemented. Student portfolios culminate with a presentation to parents and the
community.
Students at Potter Valley have many opportunities to work collaboratively in
cooperative learning groups. Depending on the goal of the activity they work
independently, in pairs or as groups. Teams are organized to combine a variety of skill
levels, interests and learning styles. Teachers also employ cooperative groups to help
students develop their communication skills, teamwork skills and group dynamics.
Students at the junior high level are able to participate in the Project-Based Learning
course, which focuses on these skills in greater depth.
73
Pinecrest Elementary/Middle School Profile (Study School)
Pinecrest School is a small rural school with approximately 56 kindergarten
through eighth-grade students. The current study focused specifically on the sixth
through eighth-grade multi-age program. This group is comprised of approximately 23
students. One full-time equivalent teacher is responsible for working with this group of
students.
The learning environment for Pinecrest sixth through eighth graders includes
classroom experiences, local community settings and statewide settings. Experiences
within the classroom and outside help to connect various subject areas and accomplish
learning objectives. Students spend a lot of time exploring community issues through
field trips to local ranches and tree farms. The students actively utilize a 45-acre parcel
of forested land provided by the US Forest Service. This five-year partnership has
culminated in a student designed and constructed environmental education trail system.
Students use their trail system to educate younger Pinecrest students and students from
other schools about forest-related issues. Topics discussed include forestry practices,
local wildlife and local anthropology. To this date, Pinecrest students have lead more
than 800 students from throughout their county along their trail system.
Inquiry and investigation is focused around community-based, real-world issues.
Textbooks, novels, and outside resources, as well as local experts and community
members enrich topic areas. The timber industry and ranching, both of great local
importance, are woven into lessons of ecology, genetics and social sciences. Field
studies and tours of local businesses provide students with hands-on experience and

74
discussion of varying viewpoints from within their community. Students also did a
project based on the Forest Service National Environmental Protection Act,
communicating their findings through posters, speeches and skits.
Curriculum design is based on state standards and is adapted to fit the three-year
instructional schedule at the school. Students' needs, interests, experiences and learning
styles are also taken into account. The teacher provides many opportunities for students
to pursue projects in and outside of class. Students are responsible for developing and
presenting the lessons to students at their interpretive trail.
The multi-age structure of the sixth through eighth-grade classroom, and their
numerous community-based projects and field studies facilitate integrated,
interdisciplinary instruction. The teacher develops units based on real-world community
and environmental issues. These units integrate history, literature, art, science, math and
writing as students investigate all sides of an issue. For example, in a genetics unit
students explored the use of genetic engineering through field studies and discussions
with local cattlemen and a plant grower.
Community involvement provides great depth to the issue-based, integrated units
developed for Pinecrest’s sixth through eighth-graders. The teacher involves parents,
local specialists and forest service partners to augment and enhance her programs. The
students work with professionals in many capacities as they develop projects. Students
also take the role of teacher as they provide interpretive programs for other students.
The teachers at Pinecrest plan and instruct individually and together. As a team
they plan activities that are school-wide or those that cross grade-levels and ability levels.
75
The small staff also takes advantage of each teacher’s individual skills to provide
enriched theatre, art and science programs. They meet on a weekly basis to review plans,
develop future activities and encourage professional growth.
The sixth through eighth-grade teacher provides opportunities for her students to
work individually and in groups. Heterogeneous groups are organized for such activities
as art, science projects and discussions. Groups are organized by skill-level for math and
reading. Collaborative learning is used especially to develop strong communication skills
by presenting to various audiences, teaching at the interpretive trail and performing plays.
The teacher awards individual and group scores to encourage teamwork and help students
understand that all members contribute to the success of a group.
Several different strategies are employed by the teacher to assess student mastery
of skills and concepts. Conventional examinations, presentations, discussions, project
outcomes and performance-based assessments are among the assessment methods used.
Interdisciplinary connections are evaluated through art, English and speech projects in
science and social studies.
Bridgeport Elementary/Middle School Profile (Comparison School)
Bridgeport Elementary is a small school with a rural population. The K-8 school
has 104 students and six teachers. The sixth through eighth grade students comprise less
than half of the student population and work with two of the teachers.
The classroom is the primary learning setting for instruction at Bridgeport.
Outside resources such as speakers and local field trips are used to reinforce the

76
classroom instruction. Walking field trips and the adoption of a local forest area are
examples of the additional resources used by Bridgeport teachers.
Each teacher at Bridgeport teaches combined grade levels. As a result, lesson
planning and instruction occur individually. However, major events such as Earth Week
and Reading Across America are planned collaboratively amongst the teachers. The
upcoming adoption of two minimum instruction days per month will help to allow for
more teamwork in the future.
The curriculum at Bridgeport is driven by school district and state guidelines.
These standards provide the framework within which students select a course of study.
Teachers rely primarily on textbooks and supplementary activities from various curricula,
videos and the internet as their source of study topics. Current events are also selected by
the teacher and incorporated into activities. Authentic learning experiences are brought
into the classroom whenever possible.
An effort is made by the teachers to provide activities that combine the various
disciplines that they teach. These activities are used to strengthen learning of the
disciplines as separate subject areas and to examine their connections. For example, one
teacher frequently blends social studies with reading and math with science.
The use of collaborative learning at Bridgeport varies according to the teacher.
Students groups are used most frequently for science and social studies instruction. One
teacher organizes student teams only when the lesson lends itself to group work. Another
teacher uses teacher-organized and student-created teams as a means to develop life skills

77
and encourage communication within a diverse group setting. This teacher also
incorporates student roles and peer tutoring into group work.
Conventional methods of testing are the most frequently utilized form of student
assessment at Bridgeport. Authentic forms of assessment and student writing are used on
occasion.
Edna Maguire Elementary School Profile (Study School)
Edna Maguire Elementary School serves kindergarten through fifth grade students
from suburban Marin County. Enrollment is approximately 540 students. The school is a
recipient of the California Distinguished Schools Award.
A diversity of learning settings, including the school site and off-campus areas, is
used for instruction. In-class and out-of-class experiences are connected to meet learning
objectives, facilitate an understanding of natural and social systems, and to connect
multiple disciplines. All students at Edna Maguire use the half-acre school garden
throughout the school year. Parent volunteers help make this possible by leading small
groups of students in the garden. Their planting, harvesting, composting, and
maintenance of the garden facilitates the observation of natural cycles and systems and
enriches specific subject matter instruction.
Students explore their local surroundings, which include a creek and nearby trails.
Studying these locations helps students to learn about how humans interact with the land,
use its resources, and change the landscape. Teachers report that studying the natural and
community settings helps make learning more relevant to their students’ lives.

78
Teachers at Edna Maguire focus on connecting disciplines in a way that
simultaneously develops knowledge and skill in multiple subject areas, while exploring
the connections between them. Learning is coordinated so that students work
concurrently in several subjects on interrelated aspects of the same theme or project. For
instance, a yearlong curricular theme coordinates learning with the passing of the
seasons. The connection between humans and their place in the natural world is
emphasized. They begin the year studying the native inhabitants of the local area then
progress to an investigation of how ancient cultures explored their world. The year ends
with learning about how present civilizations interact with their environment.
In the fall students study the Miwok people of Marin. Literature is connected to
language arts and geographical investigations. Art and drama are integrated through the
study of a local artist who creates sculptures from natural materials. Student-created
plays are generated from their own legends. In spring students move forward in time to
investigate how their present community inhabits the land.
Topics of interest to the students are often the starting point for learning. Real-
world problems and issues, either selected by the teacher or identified by students, are
used to generate instruction. Teachers report that these problem-solving opportunities
allow students to apply the skills and concepts they have learned to something genuine
and relevant to them. Writing and research topics often evolve from work in the garden
and other out-of-class experiences. When students observed snail damage in their garden
they began to discuss options for managing these pests. Experiments were conducted to
identify the most effective and acceptable method of removal.

79
Authentic learning experiences allow students to identify and pursue the study of
problems and issues within their community. They are able to perform action projects
and communicate what they have learned through reports and presentations. For
example, when faced with the problem of trash in their garden, students took action.
They conducted research and developed a solution. Students priced garbage cans and
selected their placement throughout the school grounds. They worked closely with the
school custodian to successfully implement their plan.
Teacher collaboration is encouraged and supported by the administration at Edna
Maguire Elementary. The school’s schedule ensures common daily planning time for
grade-level teams. Additional planning time is made available through an early release
day once a week.
The teachers share instructional responsibilities. Team teaching is a common
instructional strategy. The fifth-grade team develops a six-week coordinated studies
program each year. All disciplines are integrated into the program using a theme or issue
as the context. Each teacher takes responsibility for teaching their subject area specialty.
This gives the teachers an opportunity to concentrate on an area of interest and to
contribute their individual talents.
Community members and parents contribute to the curriculum planning and
instruction. Experts from the community enhance units of study by sharing their
knowledge and experiences with students. Local amateur astronomers visit classrooms
regularly to contribute to astronomy lessons. The astronomers also helped fifth-grade
students plan a star party for a hands-on experience tied to what they had been learning in

80
the classroom. Community businesses also adopt Edna Maguire classrooms. In one
instance, the Marin Bank helped a group of students with an economics unit tied to their
math curriculum.
Students work in cooperative teams as well as independently. All group
interaction is influenced by the school’s involvement in the Tribes program. This school-
wide policy emphasizes being kind, safe, responsible, and respectful. The school also
encourages celebrating differences.
The teachers are trained in complex instruction, a philosophy that pertains to
group work. Teachers use complex tasks to develop students’ interpersonal skills and
raise the academic status of all students. The tasks involve the use of multiple intellectual
abilities and learning styles, challenging all students.
Teachers assess students’ mastery of skills and knowledge using multiple
strategies. Observation, portfolios, journals, self-assessment, traditional tests, and rubrics
are used to evaluate students’ academic achievement. Student understanding of
interdisciplinary connections is evaluated through interdisciplinary projects and the use of
complex instruction. Student-driven research and action projects allow teachers to assess
each student’s ability to apply what they have learned to real-world situations.
Sir Francis Drake High School Profile (Study and Comparison Programs)
Sir Francis Drake High School (Drake) is located in Marin County at the center of
a quiet residential community. It has a small student enrollment, approximately 1000, of
ninth through twelfth-grade students. In 1992 the school was awarded a three-year, Next
Century School Grant from RJR Nabisco Foundation. This grant helped fund program

81
consultants, additional planning time for teachers and the purchase of technological
equipment and instructional supplies. This funding also made it possible for the staff at
Drake to create its nationally renowned Drake Integrated Studies Curricula Program
(DISC). This program is leading the way in instructional innovation to provide higher
levels of student interest in school and success. The DISC program runs alongside a
traditionally formatted educational program within Drake High School. For the current
study a student population from the DISC program was compared to a population of
students enrolled in the traditional program.
Drake Integrated Studies Curricula (Study Program)
DISC was created to help students develop a sense of responsibility and
productivity in an increasingly complex and technological world. Students are expected
to be self-motivated learners who can seek knowledge in a more independently structured
learning environment. Instruction in the DISC Program is arranged around thematic,
project-based learning focused on the topic rather than individual academic disciplines.
Students explore topics, gather data, and develop working theories then test and modify
them, in order to define and solve problems.
DISC is the umbrella program that contains the 9th/10th grade Revolution of Core
Knowledge Program (ROCK) and four upper division academies; Communications
Academy, Survey of Engineering, Studies of the Environment Academy (SEA-DISC),
and Academy X. For the purposes of this study the researcher focused on ROCK, SEA-
DISC and Academy X as they were the most representative of an EIC program.

82
Each of the DISC programs is a two-year, multi-age experience taught by teams
of teachers representing multiple academic disciplines. All programs are taught in blocks
of three or four class periods. More than 95% of the incoming students stay for their
second year in the program. Forty-five percent of the school's junior and senior
population is enrolled in one of the four academies and the number is growing. The
students participating in DISC programs are representative of the school population as a
whole.
ROCK brings together 100 ninth and tenth grade students and four teachers into a
program that focuses on academic knowledge, work place skills and community service.
During their two years in the program students earn credit in English, integrated science,
world history, geography, drama, fine arts, social issues and community service. As a
requirement of the program students in ROCK complete 70 hours of community service
outside of the classroom. ROCK was honored as a recipient of the California State
Golden Bell Award for exemplary instruction in 1997.
The SEA-DISC Academy is designed for eleventh and twelfth-grade students
with an interest in the environment and careers involved in its preservation and
management. Students in the academy investigate our world's complex environmental
problems and issues through projects, field studies, laboratory experiments and
mentorships. Students spend three periods a day in SEA-DISC earning credit in
environmental studies, second year algebra, chemistry, economics, government,
trigonometry and statistics. As seniors in SEA-DISC students spend an additional period

83
a day outside of school working on an internship. There are four teachers that work in
this academy.
Academy X is also for upper division students. This academy is focused on
preparing students to be leaders in their community, business and government
organizations. Academy X also has a strong service component requiring students to
participate in two community action projects each year. Three teachers present the core
curriculum of Academy X for three periods a day. The students earn credit in
government, economics, essay/exposition writing, workplace learning, oral
communication, US History and American literature.
All three DISC programs are solidly based in the school's surrounding
community. Each takes advantage of the myriad of learning opportunity the community
has to offer. The community is used as a real-world setting in which students focus on
authentic projects and an authentic audience. Interdisciplinary projects require students
to utilize community resources to conduct interviews, pursue internships within their area
of interest and complete field work. Workplace internships throughout the community
help students practice and build confidence in their interpersonal communication and
technology skills. The various learning settings also provide a context for integrated-
interdisciplinary programs within DISC. For instance, students in Academy X conduct
field research on trips to San Francisco, Angel Island and other historic sites to enhance
and broaden their historical studies.
Student projects, internships and community service experiences provide the
focus of study for the programs. All projects address real-world problems or situations

84
drawn from the community context. The Marin at the Millennium project presented a
study of local history through a web site. Projects are designed to incorporate active
learning, rigorous academic study, adult connections, an authentic audience and
assessment. Much of the work done by students throughout the year is presented publicly
to an audience of community members. One year a mosaic created by students depicting
immigrant and migrant groups in California was exhibited at the Marin Civic Center.
All teachers within the DISC programs plan and teach in teams with common
planning time throughout the week. In addition, the teams have further paid planning
time in the summer. Within their teams teachers share responsibilities by rotating as
chair for interdisciplinary projects, breaking up students into mentor groups and playing
to each other’s strengths. Consistency within the team is achieved by using the same
language and standards for student assessment.
The organization of the DISC programs and their strong community connection
facilitate an integrated, interdisciplinary curriculum. The teachers design and coordinate
their programs to intentionally make connections between various academic disciplines
and learning experiences. The integrated, project-based programs are centered around
the theme or essential question of a particular academy. For instance, the essential
question for Academy X in the 1998-99 school year was What do we need to know to
affect positive change in our community, our school and ourselves? This driving
question helped to focus the academy's inquiry and study throughout the entire year.
Student projects integrate the discipline areas within their program and focus on learning

85
skills within them. The teachers then work to integrate their field of expertise into the
projects and communicate skills particular to that field.
Teachers design their curriculum according to the developmental needs,
experiences, learning styles and interests of their students. Curriculum needs, determined
by district and state standards, are balanced with student interests. Students are given a
framework by their program of study from which they design their projects. For instance,
if they are looking at local issues the students will select an issue of interest to them and
then they will strategize about research and developing a solution. Projects also allow for
student success by using a variety of learning outcomes and providing a multitude of
ways to meet them. The internship program within Academy X also allows students to
explore an area of interest within a real-world context.
Students in the DISC programs participate in a great deal of collaborative work.
Depending on the project or assignment groups may be assigned by the teachers, formed
by the students, or joined based on student expertise or comfort level. For example, to
work on a community action project students used their expertise to join various groups
such as the writing group, the web page design group and the logistics group.
Teachers focus on enhancing student’s understanding of group dynamics and
team work skills. Students in ROCK, for instance, spend their first two weeks of each
year working through a mini-project as training in systems, group dynamics and habits of
mind. These teachers use deBono’s Six Thinking Hats and Costa’s Habits of Mind as a
framework for student group behavior. Students’ understanding of group dynamics is
evaluated in a culminating Professional Skills Portfolio.

86
Students are assessed based on their reflection, mastery of knowledge and
exhibition of skills. This is accomplished using content quizzes and tests, problem
solving activities, writing, self-reflection, peer review and interdisciplinary projects.
Students’ work on projects and other community-based experiences accounts for the
greatest percentage of their grade. Project design requires application of transferable
skills, higher-level thinking and understanding of interdisciplinary connections for
successful completion. In addition, most major projects culminate with a public
exhibition. Students are expected to articulate content knowledge, make connections and
assess their own learning.
Drake Traditional Program (Comparison Program)
Sir Francis Drake High School offers a more traditional education program for
those students not enrolled in a DISC program. These students, grades nine through
twelve, comprise the majority of the school population. Students in the traditional
program move from one course to another throughout the day, each course focusing on a
given subject area.
The classroom is the primary learning setting used by teachers in the traditional
program at Drake. In addition to the classroom, teachers use computer labs and the
library on campus. Outdoor experiences are limited. Math students occasionally use
outdoor settings to gather data for graphing exercises, use trigonometry to estimate the
height of outdoor objects or conduct human graphing activities. Students in the
leadership class plan school activities and are involved in several community activities.
Their participation requires students to venture into the community to seek out resources.
87
Teachers in the traditional program at Drake plan and instruct primarily alone.
Some teachers work within their specific discipline as pairs or teams to plan lessons for
class. Integrated teams such as the American Studies and Personalization teams meet
regularly to plan lessons and large events or projects. In some cases, parents and
community members are invited to observe and participate in the classrooms.
The curriculum used in the traditional program at Drake is designed based on the
developmental needs, experiences and learning styles of its students. Many teachers also
give their students a role in directing instruction based on their personal needs and
interests. Students are given the opportunity to choose the focus of their projects and set
up inquiries based on their own questions. They are also encouraged to incorporate
information of interest to them into the lesson and explain how it connects.
Teachers in the traditional program generate their study topics from textbooks and
activities that provide simulated problems and issues. Many teachers also incorporate
current events and other real-world issues into their classes. Math units often incorporate
a real-world problem for students to solve mathematically, communicating their
reasoning in writing. Literature lessons are structured to relate both the art of the writer
and the application of literary events and issues to real-world problems and issues. For
instance, students reading The Grapes of Wrath explored the relationship between the
events of the book and current global issues. Some teachers also focus on student-
identified problems and issues, allowing them to pursue projects related to their issue.
Drake’s traditional program is organized in a manner in which students participate
in classes that focus on one subject area. Likewise, teachers instruct solely in their area

88
of expertise. Within their specialty, teachers make an effort to use skills and knowledge
from one discipline to support the learning of that which they are teaching. For instance,
one literature teacher uses Cubism as a comparison to the plot structure of
Slaughterhouse-five. At, Drake US history and American literature are taught parallel
each other to facilitate cross-discipline projects.
Students work individually, with partners or as part of a learning team depending
on the objective of the lesson or project. At times students choose their own groups and
at other times group organization is determined by the teacher. Students often assume
roles within the team such as recorder and timekeeper.
The assessment methods used to evaluate student learning vary among the
teachers. Some rely heavily on tests and quizzes. All use a variety of strategies including
conventional examinations and more authentic measures of learning. Students are asked
to demonstrate their knowledge and understanding through the development of projects,
their writing, group participation and seminar discussions.
Red Bluff High School Profile (Study and Comparison Programs)
Red Bluff High School (RBHS) serves approximately 2000 ninth through twelfth
grade students from a large rural attendance area. The school is staffed with five
administrators and 88 full-time teachers. The staff of Red Bluff High School prides itself
on the many special programs and activities that make their school unique. Red Bluff
offers its students access to community college courses on their campus, a certified
nurse’s assistant program, and the nation’s fifth largest Future Farmers of America
program. In addition, the school offers students an opportunity to participate in an

89
integrated studies internship program at the Sacramento River Discovery Center. This
internship serves a small population of students at the high school. The majority of the
student body participates in the traditional education program at RBHS. For the current
study the student population participating in the Sacramento River Discovery Center
Internship program was compared to a population of students enrolled in the traditional
program at RBHS.
Sacramento River Discovery Center Internship Program (Study Program)
Located on 488 acres of Mendocino National Forest land, the Sacramento River
Discovery Center (SRDC) is a community supported venture designed to provide its
users with opportunities for learning about the Sacramento River Watershed. The
Executive Director, two educators and many volunteers staff the center. A group of Red
Bluff High School (RBHS) juniors and seniors spend two class periods a day as interns at
the center earning high school credit in a variety of subject areas. Interns conduct
research projects based on local community problems and issues. In addition, the
students are responsible for running the center’s interpretive program.
During the 1998-99 school year, the program’s fourth year in operation, there
were 36 students participating as interns. This diverse group of students combines a
variety of ability levels, cultural backgrounds, and socio-economic levels to create what
RBHS administration feels is a representative sample of the high school’s population.
Students self-select to become interns in the program and complete an application and
training process before their internship begins.

90
Early in the history of the SRDC internship program students were only required
to participate for one semester. During the 1997 school year the majority of the interns
chose to participate for only one semester. Starting with the 1998 school year, students
enrolled in the internship program are required to commit for the entire school year.
According to the Executive Director of the SRDC, the internship program has
improved over time and continues to do so as changes are made. The increased
requirements regarding student time commitment, development of a strong training
component and the recruitment of quality educators have created a stronger, more
valuable program. In addition, the internship program has produced more involved and
interested interns while gaining recognition from Red Bluff Union High School students.
Interns, SRDC staff, and RBHS guidance counselors collaborate to develop
individual student learning contracts. In these contracts students specify the subject area
focus of their internship. Participation in the internship program allows students to earn
general graduation credits in any subject area. Over the past three years students have
elected to earn credit in science, English, math, history, and world problems.
The chosen subject area focus guides the direction and content of the student’s
research project. The Executive Director at the SRDC is primarily responsible for
evaluating student academic performance and their fulfillment of specific subject area
requirements. The SRDC education staff, the RBHS teacher and community and
resource agency mentors contribute to the interns’ assessment.
SRDC staff interacts on a daily basis. They are constantly evaluating and revising
their interpretive programs to ensure they are effective and engaging for students.

91
Community members, visiting teachers, agency specialists, and interns are also involved
in this process.
The SRDC interns use the center’s acreage as a daily learning site for hands-on
study of real-world problems. Interns utilize SRDC’s diverse outdoor habitats, resource
building, and native plant garden. The labs and offices of SRDC’s many partners are also
made available to the interns. Partnerships involve forty-eight education, government,
and private groups including The Nature Conservancy, Crane Walnuts, Mendocino
National Forest, and Hewlett Packard. The partners are regularly involved in the planning
and evaluation of the center’s educational programs.
The “focus project” allows interns to become experts in a specialized area of
interest. Projects must also benefit the community and contribute to the interpretive
curriculum at the SRDC. All projects investigate problems and issues related to the
community. Every aspect of the problem, historical, social, scientific, are integrated into
the investigation.
Students work with community members and agency specialists to identify issues
and problems relevant to their community. Throughout the course of the year students
work closely with these community experts and mentors to design their studies and
develop appropriate solutions. For example, a small group of students, with an interest in
water quality issues, met with personnel from the Department of Water Resources to
brainstorm local topics for further examination. Students then worked throughout the
year on research, investigation, and interpretation, integrating all aspects of a chosen
92
issue into their project. They were guided in this process by SRDC staff and mentors
from the community.
An ongoing investigation, with help from the Audubon Society, allows students to
study the effects of the introduced European starling on native bird species. The interns
analyze data to determine whether the starling is displacing native cavity nesting birds.
The results of their studies are communicated as management recommendations to the
responsible agencies.
Project results are reported to the community in diverse ways. Some research
groups have created musical or dramatic presentations. Others have developed
interpretive displays for the SRDC resource building based on their research findings.
One group of students proposed creating an interactive display on resource conservation.
They received funding from the Bureau of Reclamation to design and build “The
Conservation Corner.” This interactive display focuses on the issue of residential water
conservation. Conservation corner includes a student-made video, hands-on
experimental demonstrations and various other exhibits educating visitors about
conserving water at home.
One of the interns’ responsibilities is to act as interpretive guides to the SRDC’s
many visitors. All interns receive instruction from the center’s staff and resource agency
scientists to equip them with the knowledge needed to run SRDC’s interpretive programs.
Interns are also trained in personal effectiveness, self-management, self-organization, and
communication skills. They apply these skills to their role as docents for the SRDC and
their “focus project” investigation.

93
The interns are provided with opportunities to work individually and in small
focus groups. Students form their focus groups with classmates interested in
investigating facets of the same issue. To enhance group productivity, SRDC staff
members actively model collaboration and deliver instruction in group dynamics, task
delineation, and team building.
The students’ academic growth and attitudes are assessed throughout the year.
Interns meet as a group with SRDC staff at regular intervals to discuss project, individual,
and group accomplishments. Individualized self-assessments are conducted during
regular conferences and in written evaluations at the end of each year. Authentic
assessment of student performance involves evaluating: individual daily journal entries;
participation in interpretive programs; instruction of younger students; and, interaction
with community members and agency specialists. Interns are also assessed based on their
project planning and final products such as displays, reports, and books.
Red Bluff High School Traditional Program (Comparison Program)
Students at RBHS utilize their classrooms as their primary learning setting.
Indoor labs, school-site research, Internet use, demonstrations, and lectures all take place
in the classroom.
RBHS follows a traditional schedule, with students moving from one classroom to
another throughout the day. Each teacher specializes in a given subject area. The
teachers report that they use multiple disciplines to reinforce instruction. For instance,
they relate historical facts to literature, math is used in solving science problems, and
writing skills are reinforced through history projects.

94
Teachers at the high school primarily instruct alone. There was only one reported
case of team teaching within the same discipline. Collaboration occurs mainly within a
given subject area. Teachers meet occasionally to update curriculum, articulate across
grade levels, and ensure students are challenged uniformly. Cross-curricular teaming is
not an emphasis at RBHS. However, teachers report using their colleagues as resources.
The RBHS curriculum is developed by the discipline-based departments as
defined by the district’s learning objectives. A combination of simulated and real-world
problems and issues are used to shape units of study and link classroom discussions to
current events. Lectures, demonstrations, labs, and other activities are selected by the
teachers and are presented in a manner that takes into account students’ individual
learning styles. Students are given the opportunity in some courses to investigate an area
of interest to them through individual research projects.
RBHS teachers offer students opportunities to work individually and in groups.
The use of groups by teachers varies within the school. Group work is typically assigned
and organized by the teacher. Groups are most often assigned randomly but at times are
organized with students’ abilities and learning styles in mind. Teachers provide
instruction in basic group skills.
Student assessment methods vary among the teachers at RBHS. A combination
of standardized, performance-based, and written tests are used to assess students’ mastery
of skills, knowledge, and conceptual understanding.

95
Lincoln High School Profile (Study and Comparison Programs)
Lincoln High School is a large suburban high school located in the city of
Stockton, California. The school serves a ninth through twelfth grade population of
about 2,500 students. In 1990 a Plan to Plan grant was won by Lincoln for the purpose of
restructuring some of the instruction at the school. The school and community worked
together to develop a plan of action. This group believed education should be centered
on the student, meaningful for the learners and connected to real life. From these initial
efforts the Integrated Studies in Systems Program (ISIS) was born. The ISIS program
runs alongside a traditional education program at Lincoln High School. For the current
study the student population participating in the ISIS program was compared to the
student population participating in the traditional program at Lincoln High School.
Integrated Studies in Systems Program (Study Program)
The Integrated Studies in Systems (ISIS) program is a ninth and tenth grade
program of choice within the high school. All interested eighth grade students can apply
to participate in the program although there is more interest than space. Students are then
randomly placed within ISIS to ensure the group is a representative sample of the Lincoln
High School student population. There are 90 students participating in ISIS each year.
ISIS is a multi-age, science research-based approach to education. Students enter
ISIS as freshmen and continue in the program through the end of their sophomore year.
The program meets daily for three consecutive periods. Three teachers representing
science, history and English/communications form the ISIS instructional team. The focus

96
of ISIS is to develop environmental literacy using the principal of systems as a learning
metaphor.
A major component of ISIS is the student inquiry project. This project requires
that students identify an essential question of interest to them. Through the process of
scientific research students examine the environmental (social, cultural, scientific,
technological and natural) impacts related to their topic. Students must also examine the
interconnectedness of these aspects of their environment. It is also important for them to
determine the importance of local and global impacts now and in the future.
The inquiry project integrates social science perspectives, scientific connections
and literary experience. Students are required to tap into their community resources and
perform a community action piece as part of their projects. All inquiry projects are
presented to peers, parents, community members and teachers at a year-end event.
The ISIS program uses a diversity of learning settings outside of the classroom
environment. This diversity provides for a variety of experiences and an enriched
curriculum. On campus, ISIS students utilize the environmental learning center for
assignments and projects. The center depicts different ecosystems of the local bioregion.
Students in the ISIS program use their community as a learning resource and as a setting
for learning. Off-campus sites such as farms and hospitals are visited with small groups
of ISIS students for specific lessons. Foundations of concepts and skills are laid in the
classroom and reinforced through direct experiences using these sites. In addition, ISIS
students engage in learning opportunities in diverse settings as they seek out to answer
97
the essential question that drives their inquiry. These learning experiences can be
through investigation and interviews or may involve community service.
The three ISIS teachers work as a cohesive team to coordinate an integrated
curriculum. They meet daily during a group planning period. This is essential as they are
constantly evaluating the program and work to develop and ensure ways to incorporate
their core curriculum through the disciplines. As a team they insure that planning and
instructional responsibilities are shared among all members. Regular communication
throughout the day is also required as the teachers manage their time block according to
student tasks and projects.
The ISIS program was developed to ensure an interdisciplinary approach to
education. All units and topics are taught in a manner that crosses traditional disciplinary
boundaries to develop an understanding of systems. The natural environment and
principles of ecoliteracy are reinforced as systems through student directed research and
essential academic content. For example, while reading Romeo and Juliet students were
engaged in an examination of genetics and related issues as well as discussions around
the issues of war and conflict. Students’ inquiry projects are based on using information
from many different disciplines to answer an essential question. In all of their work
students are reminded to look beyond their personal interests and be aware of
environmental impacts and connections related to their inquiry.
The focus of study in the ISIS program is grounded in the principles of
environmental literacy and natural systems. Teachers take advantage of textbooks and
other resources, and current real-world problems and issues to provide focal points for
98
teaching. The history and subsequent development of many events are examined to help
students see how they may be able to apply this information to the future. The inquiry
project brings student-identified issues, many of which are community-based, to the
foreground. These projects provide an opportunity for students to apply their skills and
knowledge while offering a chance for service learning.
For the most part ISIS students work within a curriculum designed by their
teachers. Students’ needs, learning styles, experiences and interests help guide the
direction of the curriculum. In addition, the inquiry project allows students to undertake
a year-long investigation on a topic of their choosing.
Students conduct their inquiry projects individually, however they have many
other opportunities to work collaboratively. Throughout the year students meet in small
groups to network on their projects while offering support and peer review. ISIS runs on
the philosophy that a diversity of intellects, philosophies and talents insures the
sustainability of a learning community.
ISIS teachers employ the inquiry as their main assessment tool. This allows the
teachers to evaluate how well students are able to synthesize social science, English,
science and ecology into a presentable product. The inquiry includes a variety of
assignments, from scientific research to community investigations, in order to provide a
wide-based approach to obtaining environmental literacy. Teachers and students look at
quality, complexity and quantity in relation to personal growth. Students also write self-
evaluations that become a permanent part of their school portfolio. Quizzes, tests,
journals, reports and portfolios are utilized for student assessment as well.

99
Lincoln Traditional Program (Comparison Program)
The traditional program offered at Lincoln High School serves the majority of the
school’s student population. Ninth- and tenth-grade students not enrolled in ISIS
participate in courses focused on a specific academic discipline. All students at Lincoln
are part of the traditional program in eleventh-and twelfth-grade.
The majority of instruction in the traditional program at Lincoln takes place in the
classroom. Teachers use various resources on campus such as the library, special
resource rooms and the school’s environmental center for projects and special events
related to classroom instruction. For example, biology students use the environmental
center for a field activity associated with a three and a half-week unit on environmental
science/ecology. Anthropology and English students are encouraged to take advantage of
local and regional theatre and cultural events outside of class to enhance classroom-
experiences.
Teachers of the traditional program engage students in a curriculum that requires
they use skills from various subjects to support a primary discipline. Principles of
ecology are learned using skills from math, writing, speech and related subject areas.
Literary analysis requires that students find connections between history, art and literary
works. The principles of anthropology are reinforced using sociology, archaeology, and
science. This teacher makes an effort to help students understand the interdisciplinary
connection between the disciplines.
Instructional practice in Lincoln’s traditional program relies on traditional
textbooks and literature to develop study topics. Real-world problems and issues,

100
identified by the teacher, are also integrated as focal points for teaching. Activities such
as science labs, inquiry projects and simulations engage students in the curriculum. For
instance, anthropology students use their knowledge of archaeological techniques to
participate in a simulated dig.
The curriculum taught in Lincoln’s traditional program is directed by state and
district standards adapted to fit students’ needs, experiences and learning styles.
Students’ prior knowledge is identified and used by some teachers to build upon.
Students are allowed some opportunity to initiate and direct a course of study within the
framework provided by teachers. For example, “I Search” papers give English students
the opportunity to work on self-selected research. In another case, student concern about
eating disorders resulted in guest speakers, counseling opportunities and other resources
to become available outside the classroom. One teacher reports that student feedback on
year-end course evaluations is solicited for suggestions on course and activity
improvement and modifications.
Teachers in the traditional program do the majority of their planning and teaching
on an individual basis. Teachers seldom work together in teams to share instructional
responsibilities. Within the science department teams of teachers have taught together on
an occasional basis. Teachers meet within their discipline area regularly to discuss, plan
and coordinate curricular decisions. Community members, parents and students are
rarely, if ever, involved in curriculum planning or instruction.
Teachers in the traditional program at Lincoln vary widely in their use of
independent and cooperative learning environments. One teacher has students working

101
individually 75-80% of the time. When they do work in groups this teacher requires that
students complete both individual and group projects for assessment. The biology team
has students work in pairs on all laboratory studies. They also implement open-ended
group activities requiring the students to work collaboratively to complete tasks. These
projects are assessed using student self-evaluations, peer assessment and teacher
evaluations. Yet another teacher uses collaborative work groups more extensively.
Students are grouped to make performances, produce videos, conduct debates, complete
research and to lead group discussions. In this case, the teacher and the students
themselves organize the learning groups.
The students in Lincoln’s traditional program are assessed in a variety of ways.
Conventional tests using multiple choice, short answer and essay questions are used in
many cases. In addition, students are asked to demonstrate laboratory skills, develop
portfolios of their work, make classroom presentations and conduct research projects.
Student attendance and participation in class discussions and activities is taken into
account in their evaluation as well.
School Program Evaluation
Teachers at each study and comparison school were asked to complete a teacher
survey which was scored on a scale of 1 to 4 based on the EIC Program Evaluation
Rubric discussed earlier. A score of 4 was given to a program epitomizing all of the best
practices of the EIC framework whereas a score of 1 was given to a program rarely or
never utilizing the seven components of EIC. Ideally the study schools would score a 3
or higher on all components of the rubric, giving the school an overall score of equal to or

102
greater than 3 and to make the strongest comparative match the comparative schools
would score a 2 or less on each component, giving them an overall score of 2 or less.
Therefore, I was looking for the comparison pairs (a study school and their comparison
school) to have a difference between their overall scores of at least 1 point on the
Program Evaluation rubric.
Table 14 shows the overall school scores for each comparison pair. The overall
school score was determined by averaging the seven component scores. The table shows
that the strength of the comparisons was not as strong as hoped. Overall seven of nine
study schools scored a 2.8 or higher while seven of the nine comparison schools scored a
two or less. Only three of the school comparison pairs fit into the ideal comparison
scenario with the study school scoring more than one point higher on the School Program
Evaluation: Sir Francis Drake High School Integrated and Traditional programs; Red
Bluff High School SRDC and Traditional programs; and Pinecrest and Bridgeport
schools.
In two other cases, Edna Maguire Elementary and Lincoln High School, the study
schools and their comparison school scored close to the ideal with the difference being
0.9. In the case of the Open Charter School and Laytonville School comparisons, the
difference between the study school and comparison school was not great enough to
deem one stronger EIC-based program than the other. The results of the survey also
show that Brookside and Neil Cummins, and Wade Thomas and Bel Aire schools are
virtually the same in their use of the EIC components.
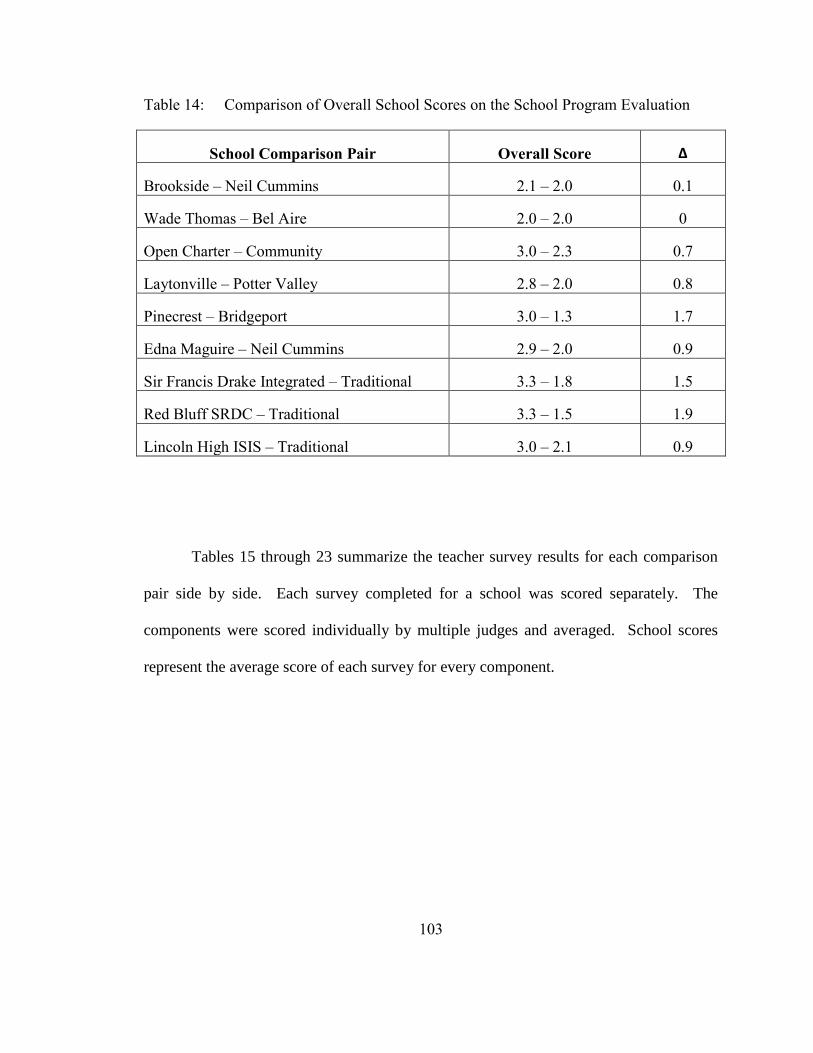
103
Table 14: Comparison of Overall School Scores on the School Program Evaluation
School Comparison Pair Overall Score ∆
Brookside – Neil Cummins 2.1 – 2.0 0.1
Wade Thomas – Bel Aire 2.0 – 2.0 0
Open Charter – Community 3.0 – 2.3 0.7
Laytonville – Potter Valley 2.8 – 2.0 0.8
Pinecrest – Bridgeport 3.0 – 1.3 1.7
Edna Maguire – Neil Cummins 2.9 – 2.0 0.9
Sir Francis Drake Integrated – Traditional 3.3 – 1.8 1.5
Red Bluff SRDC – Traditional 3.3 – 1.5 1.9
Lincoln High ISIS – Traditional 3.0 – 2.1 0.9
Tables 15 through 23 summarize the teacher survey results for each comparison
pair side by side. Each survey completed for a school was scored separately. The
components were scored individually by multiple judges and averaged. School scores
represent the average score of each survey for every component.

104
Table 15: Teacher Survey Results on Components of EIC for Brookside and Neil
Cummins Schools
Table 16: Teacher Survey Results on Components of EIC for Wade Thomas and Bel
Aire Elementary Schools
Wade Thomas
n=4
Bel Aire
n=4
Local Environment as a Context for Learning 1.8 1.5 0.3
Integrated, Interdisciplinary Instruction 2.0 2.2 -0.2
Problem-, Issue-based Instruction 2.0 1.4 0.6
Collaborative Instruction 1.9 1.9 0.0
Learner-centered, Constructivist Methods 1.8 1.4 0.4
Independent and Cooperative Learning 2.5 3.3 -0.8
Authentic Assessment of Learning 2.1 2.2 -0.1
Overall 2.0 2.0 0.0
Table 17: Teacher Survey Results on Components of EIC for Open Charter and
Community Elementary Schools
Open Charter
n=7
Community
n=6
Local Environment as a Context for Learning 2.5 2.2 0.3
Integrated, Interdisciplinary Instruction 3.1 1.8 1.3
Problem-, Issue-based Instruction 2.6 1.6 1.0
Collaborative Instruction 3.2 3.3 -0.1
Learner-centered, Constructivist Methods 2.7 1.9 0.8
Independent and Cooperative Learning 3.5 2.8 0.7
Authentic Assessment of Learning 3.3 2.5 0.8
Overall 3.0 2.3 0.7
Brookside
n=8
Neil Cummins
n=3
Local Environment as a Context for Learning 2.6 3.3 -.07
Integrated, Interdisciplinary Instruction 2.2 2.2 0.0
Problem-, Issue-based Instruction 1.6 1.3 0.3
Collaborative Instruction 1.8 1.7 0.1
Learner-centered, Constructivist Methods 1.7 1.0 0.7
Independent and Cooperative Learning 2.3 2.0 0.3
Authentic Assessment of Learning 2.2 2.5 -0.3
Overall 2.1 2.0 0.1

105
Table 18: Teacher Survey Results on Components of EIC Laytonville and Potter
Valley Schools
Laytonville
n=4
Potter Valley
n=4
Local Environment as a Context for Learning 2.8 1.8 1.0
Integrated, Interdisciplinary Instruction 2.5 1.9 0.6
Problem-, Issue-based Instruction 3.1 1.8 1.3
Collaborative Instruction 2.3 2.0 0.3
Learner-centered, Constructivist Methods 2.5 1.7 0.8
Independent and Cooperative Learning 3.3 2.5 0.8
Authentic Assessment of Learning 2.8 2.1 0.7
Overall 2.8 2.0 0.8
Table 19: Teacher Survey Results on Components of EIC for Pinecrest and Bridgeport
Schools
Pinecrest
n=1
Bridgeport
n=2
Local Environment as a Context for Learning 3.3 1.5 1.8
Integrated, Interdisciplinary Instruction 3.0 1.3 1.7
Problem-, Issue-based Instruction 3.3 1.0 2.3
Collaborative Instruction 4.0 1.0 3.0
Learner-centered, Constructivist Methods 2.0 1.0 1.0
Independent and Cooperative Learning 3.8 2.1 1.7
Authentic Assessment of Learning 1.8 1.1 0.7
Overall 3.0 1.3 1.7
Table 20: Teacher Survey Results on Components of EIC for Edna Maguire and Neil
Cummins Elementary Schools
Edna Maguire
n=7
Neil Cummins
n=3
Local Environment as a Context for Learning 2.7 3.3 -0.6
Integrated, Interdisciplinary Instruction 2.8 2.2 0.6
Problem-, Issue-based Instruction 2.9 1.3 1.6
Collaborative Instruction 2.1 1.7 0.4
Learner-centered, Constructivist Methods 3.2 1.0 2.2
Independent and Cooperative Learning 3.5 2.0 1.5
Authentic Assessment of Learning 3.0 2.5 1.5
Overall 2.9 2.0 0.9

106
Table 21: Teacher Survey Results on Components of EIC for Sir Francis Drake
Integrated and Traditional Programs
Drake Integrated
n=5
Drake Traditional
n=5
Local Environment as a Context for Learning 3.5 1.9 1.6
Integrated, Interdisciplinary Instruction 3.4 1.0 2.4
Problem-, Issue-based Instruction 3.5 1.6 1.9
Collaborative Instruction 3.5 1.6 1.9
Learner-centered, Constructivist Methods 2.5 2.2 0.3
Independent and Cooperative Learning 3.3 2.1 1.2
Authentic Assessment of Learning 3.4 2.3 1.1
Overall 3.3 1.8 1.5
Table 22: Teacher Survey Results on Components of EIC for Red Bluff SRDC and Traditional
Programs
Red Bluff Union
SRDC
n=4
Red Bluff Union
High School
n=4
Local Environment as a Context for Learning
3.8 1.3 2.4
Integrated, Interdisciplinary Instruction
2.2 1.4 0.8
Problem-, Issue-based Instruction 3.6 1.0 2.6
Collaborative Instruction 3.3 1.3 2.0
Learner-centered, Constructivist Methods 3.3 1.4 1.4
Independent and Cooperative Learning 3.4 2.0 1.4
Authentic Assessment of Learning 3.8 1.7 2.1
Overall 3.3 1.5 1.9
Table 23: Teacher Survey Results on Components of EIC for Lincoln ISIS and Traditional
Programs
Lincoln - ISIS
n=3
Lincoln Traditional
n=3
Local Environment as a Context for Learning 2.9 2.0 0.9
Integrated, Interdisciplinary Instruction 3.2 1.8 1.4
Problem-, Issue-based Instruction 3.0 1.8 1.2
Collaborative Instruction 3.2 1.8 1.4
Learner-centered, Constructivist Methods 2.1 2.2 -0.1
Independent and Cooperative Learning 2.9 2.2 0.7
Authentic Assessment of Learning 3.6 2.8 0.8
Overall 3.0 2.1 0.9

107
When the School Program Evaluation results are compared by component rather
than using overall school scores it is easier to note the differences in instructional
strategies between study and comparison schools (Table 24). The strongest difference
between study and comparison schools is their integration of problem- and issue-based
instruction. Study schools averaged a score of 2.8 compared to the comparison school’s
average of 1.4. One point differences in favor of the study schools occurred for
components of integration of local environment into curricula, integrated,
interdisciplinary instruction, and collaborative instruction.
Table 24: Average Scores on Program Evaluation by Component
EIC Component Study
Schools
Average
Comparison
Schools
Average
∆
Integration of local
environment 2.9 1.9 1
Integrated, Interdisciplinary
Instruction 2.7 1.7 1
Problem- and Issue-based
Instruction 2.8 1.4 1.4
Collaborative Instruction 2.8 1.8 1
Learner-Centered,
Constructivist Approach 2.4 1.6 .8
Cooperative Learning 3.2 2.4 .8
Authentic Assessment 2.9 2.2 .7
STANDARDIZED ACHIEVEMENT TESTS
Standardized test data from the nine comparison pairs were analyzed for three
school years. When looking at the data as a whole no clear patterns emerge. For five of
the comparison pairs the study school generally outperformed their counterpart in all
subject areas and for all three years. But the other four comparison pairs exhibited
108
different results. Two of the comparison pairs had the study school perform lower than
the comparison school in almost all subject areas and years included. The data from the
last two comparison pairs had an inconsistent pattern where the study school scored
higher in some subjects and years and the comparison school scored higher at other
times. Figures 2-11 present the standardized test data for each of the comparison pairs
included in the present study.

109
Brookside Elementary – Neil Cummins Elementary
Figure 2: Comparison of the average student rank, reported as National Percentile
Rank, on CTBS (1997) and SAT9 (1998 and 1999) in reading, math, and
language for Brookside (Study School) and Neil Cummins (Comparison
School)
Brookside (study school) students consistently ranked higher than Neil Cummins
students for all subject areas tested and across all three years tested. The gap in
performance ranged from three to six percentile points.
84 81 83
78 79 79
50
60
70
80
90
100
1997 1998 1999
Brookside
NeilCummins
Math
82 84 84 81 80 79
50
60
70
80
90
100
1997 1998 1999
Brookside
NeilCummins
Reading
82 85 84
79 79 81
50
60
70
80
90
100
1997 1998 1999
Brookside
NeilCummins
Language Arts
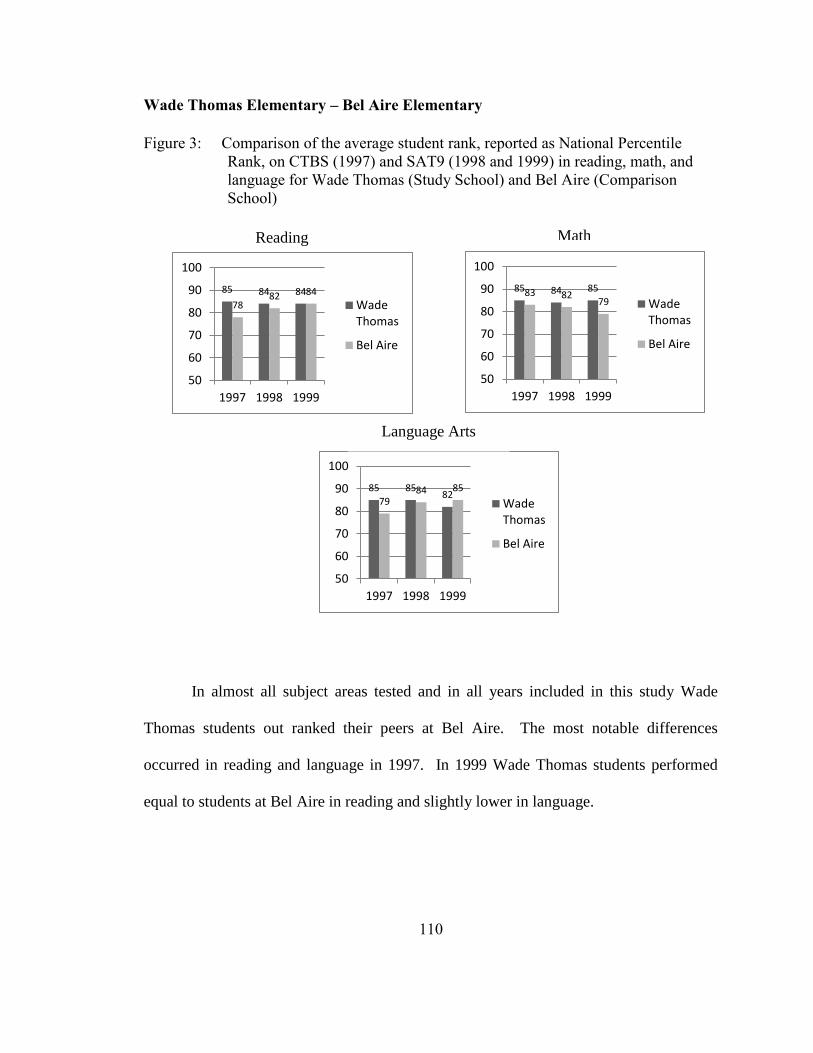
110
Wade Thomas Elementary – Bel Aire Elementary
Figure 3: Comparison of the average student rank, reported as National Percentile
Rank, on CTBS (1997) and SAT9 (1998 and 1999) in reading, math, and
language for Wade Thomas (Study School) and Bel Aire (Comparison
School)
In almost all subject areas tested and in all years included in this study Wade
Thomas students out ranked their peers at Bel Aire. The most notable differences
occurred in reading and language in 1997. In 1999 Wade Thomas students performed
equal to students at Bel Aire in reading and slightly lower in language.
85 84 85 83 82 79
50
60
70
80
90
100
1997 1998 1999
WadeThomas
Bel Aire
Math
85 84 84
78 82 84
50
60
70
80
90
100
1997 1998 1999
WadeThomas
Bel Aire
Reading
85 85 82
79 84 85
50
60
70
80
90
100
1997 1998 1999
WadeThomas
Bel Aire
Language Arts
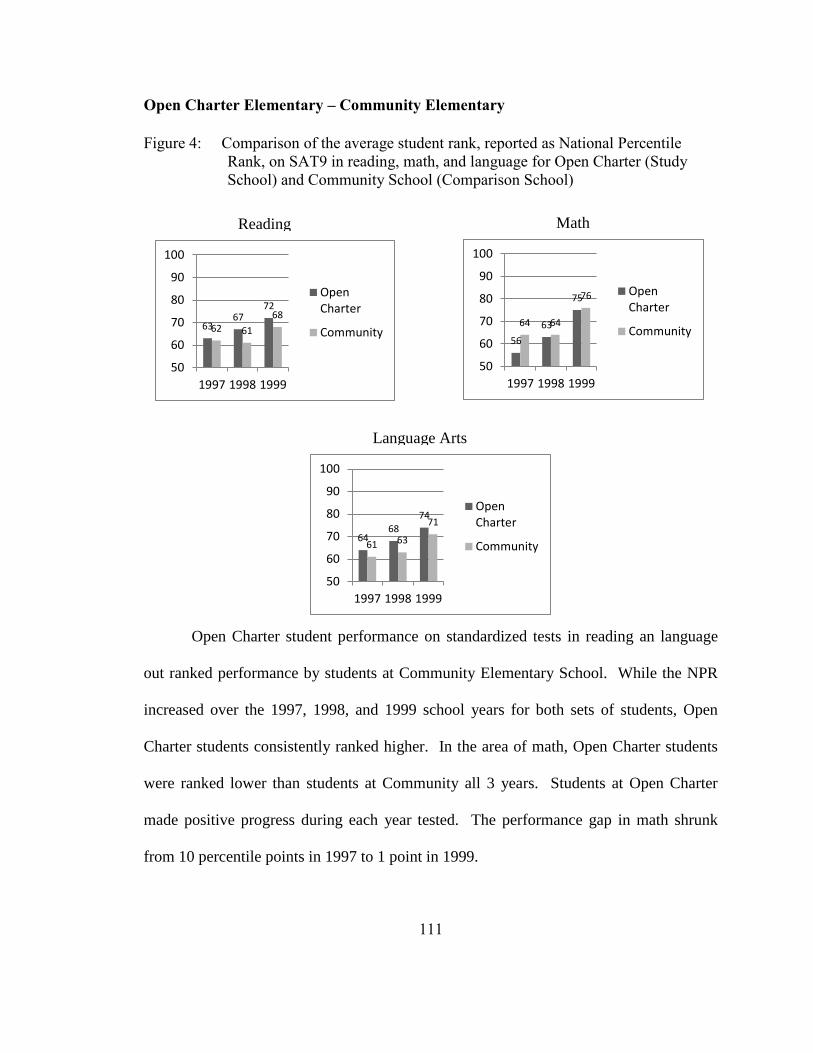
111
Open Charter Elementary – Community Elementary
Figure 4: Comparison of the average student rank, reported as National Percentile
Rank, on SAT9 in reading, math, and language for Open Charter (Study
School) and Community School (Comparison School)
Open Charter student performance on standardized tests in reading an language
out ranked performance by students at Community Elementary School. While the NPR
increased over the 1997, 1998, and 1999 school years for both sets of students, Open
Charter students consistently ranked higher. In the area of math, Open Charter students
were ranked lower than students at Community all 3 years. Students at Open Charter
made positive progress during each year tested. The performance gap in math shrunk
from 10 percentile points in 1997 to 1 point in 1999.
56
63
75
64 64
76
50
60
70
80
90
100
1997 1998 1999
OpenCharter
Community
Math
63 67
72
62 61
68
50
60
70
80
90
100
1997 1998 1999
OpenCharter
Community
Reading
64 68
74
61 63
71
50
60
70
80
90
100
1997 1998 1999
OpenCharter
Community
Language Arts

112
Laytonville Elementary/Middle – Potter Valley Elementary/Middle
Figure 5: Comparison of the average student rank, reported as National Percentile
Rank, on SAT9 in reading, math, and language for Laytonville (Study
School) and Potter Valley (Comparison School)
The students at Laytonville (study school) scored lower than students at their
comparison school, Potter Valley. They were outperformed in reading, math, and
language on SAT 9 tests in 1998 and 1999. The gap in performance ranged between five
and twelve percentile points.
35 35
47 55
20
40
60
80
100
1998 1999
Laytonville
PotterValley
Math
43 41 48
52
20
40
60
80
100
1998 1999
Laytonville
PotterValley
Reading
45 41
47 51
20
40
60
80
100
1998 1999
Laytonville
PotterValley
Language Arts
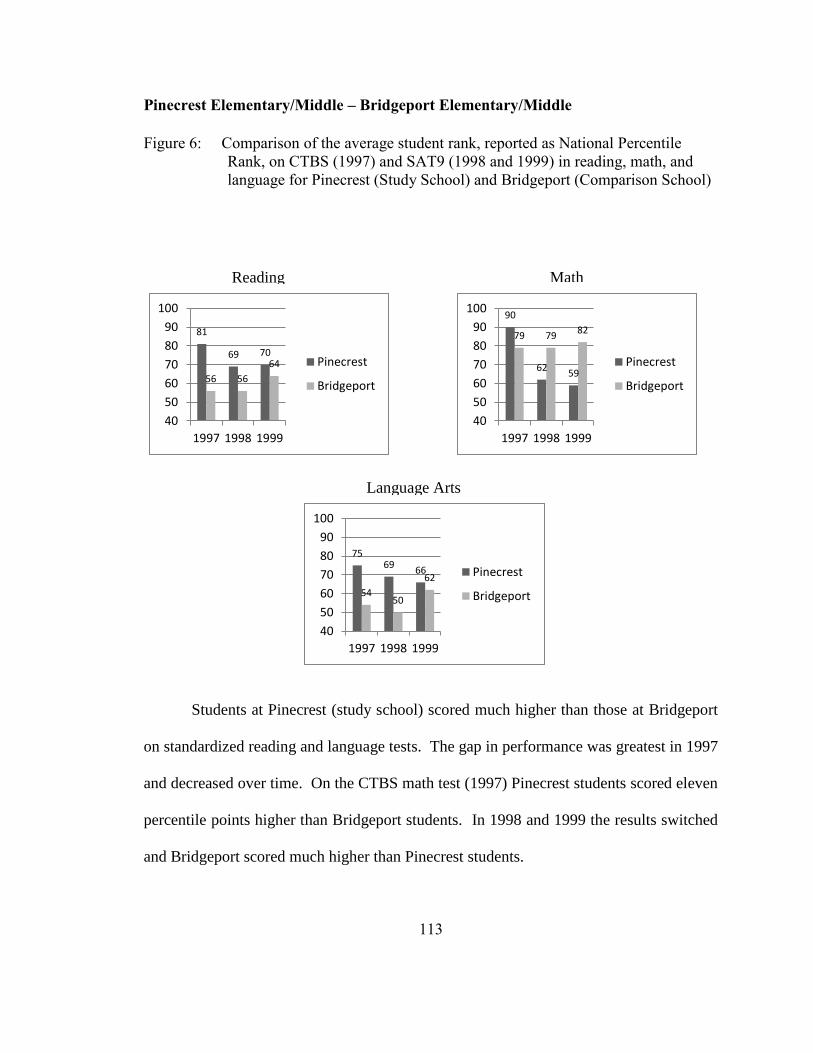
113
Pinecrest Elementary/Middle – Bridgeport Elementary/Middle
Figure 6: Comparison of the average student rank, reported as National Percentile
Rank, on CTBS (1997) and SAT9 (1998 and 1999) in reading, math, and
language for Pinecrest (Study School) and Bridgeport (Comparison School)
Students at Pinecrest (study school) scored much higher than those at Bridgeport
on standardized reading and language tests. The gap in performance was greatest in 1997
and decreased over time. On the CTBS math test (1997) Pinecrest students scored eleven
percentile points higher than Bridgeport students. In 1998 and 1999 the results switched
and Bridgeport scored much higher than Pinecrest students.
90
62 59
79 79 82
40
50
60
70
80
90
100
1997 1998 1999
Pinecrest
Bridgeport
Math
81
69 70
56 56
64
40
50
60
70
80
90
100
1997 1998 1999
Pinecrest
Bridgeport
Reading
75 69
66
54 50
62
40
50
60
70
80
90
100
1997 1998 1999
Pinecrest
Bridgeport
Language Arts

114
Edna Maguire Elementary – Neil Cummins Elementary
Figure 7: Comparison of the average student rank, reported as National Percentile
Rank, on CTBS (1997) and SAT9 (1998 and 1999) in reading, math, and
language for Edna Maguire (Study School) and Neil Cummins (Comparison
School)
Student performance on standardized tests follows a general pattern for Edna
Maguire students compared to Neil Cummins students. In all subjects tested Edna
Maguire students out performed students at Neil Cummins in 1997 and 1999. In 1998
they performed equal to or slightly below students at Neil Cummins. The largest
differences in NPR occurred for all subjects in 1999.
85 80
86
79 80 78
50
60
70
80
90
100
1997 1998 1999
EdnaMaguire
NeilCummins
Math
85
77
84 83 81 79
50
60
70
80
90
100
1997 1998 1999
EdnaMaguire
NeilCummins
Reading
82 78
85 83 79 79
50
60
70
80
90
100
1997 1998 1999
EdnaMaguire
NeilCummins
Language Arts

115
Sir Francis Drake Integrated and Traditional Programs
Figure 8: Comparison of the average student rank, reported as National Percentile
Rank, on SAT9 in reading, math, language, science and social studies for
Drake Integrated (Study School) and Drake Traditional (Comparison
School)
76 73 71 72
40
50
60
70
80
90
100
1998 1999
Integrated
Traditional
Math
67 64
58 57
40
50
60
70
80
90
100
1998 1999
Integrated
Traditional
Reading
72 75
62 68
40
50
60
70
80
90
100
1998 1999
Integrated
Traditional
Language Arts
73 67 67
58
40
50
60
70
80
90
100
1998 1999
Integrated
Traditional
Science
76 74 68
63
40
50
60
70
80
90
100
1998 1999
Integrated
Traditional
Social Studies

116
Students in the Sir Francis Drake Integrated program ranked higher than their
counterparts in the traditional program (Figure 8). They performed higher in reading,
math, language, science, and social studies in both 1998 and 1999. The gap in
performance was greatest in language and social studies. Integrated Studies students
outperformed their counterparts in these subjects by seven to eleven percentile points.
The Integrated and Traditional students were the most similar in performance on
standardized math tests. Differences in rank were between one and five percentile points
in favor of Drake’s Integrated program.
Red Bluff Sacramento River Discover Center & Traditional Program
Figure 9 summarizes the performance on standardized test of the students at Red
Bluff High School. The students participating in the SRDC internship program at Red
Bluff High School scored between seven and eighteen percentile points lower than
students in the traditional program on all SAT9 tests in 1998. In 1999 the opposite
occurred, SRDC students outranked their counterparts in all subject areas. This switch in
performance is due in part by substantially improved performance by SRDC interns and
also a decrease in scores by students in the traditional program at Red Bluff High. The
largest gains in rank for SRDC students were in reading and social studies. The average
NPR in these subjects increased by 23 percentile points.

117
Figure 9: Comparison of the average student rank, reported as National Percentile
Rank, on SAT9 in reading, math, language, science and social studies for
Red Bluff SRDC (Study School) and Red Bluff Traditional (Comparison
School)
36
53 48
44
20
40
60
80
100
1998 1999
SRDC
Traditional
Math
30
53
42 36
20
40
60
80
100
1998 1999
SRDC
Traditional
Reading
34
54
41 38
20
40
60
80
100
1998 1999
SRDC
Traditional
Language Arts
34
45 48 41
20
40
60
80
100
1998 1999
SRDC
Traditional
Science
37
61 55
45
20
40
60
80
100
1998 1999
SRDC
Traditional
Social Studies
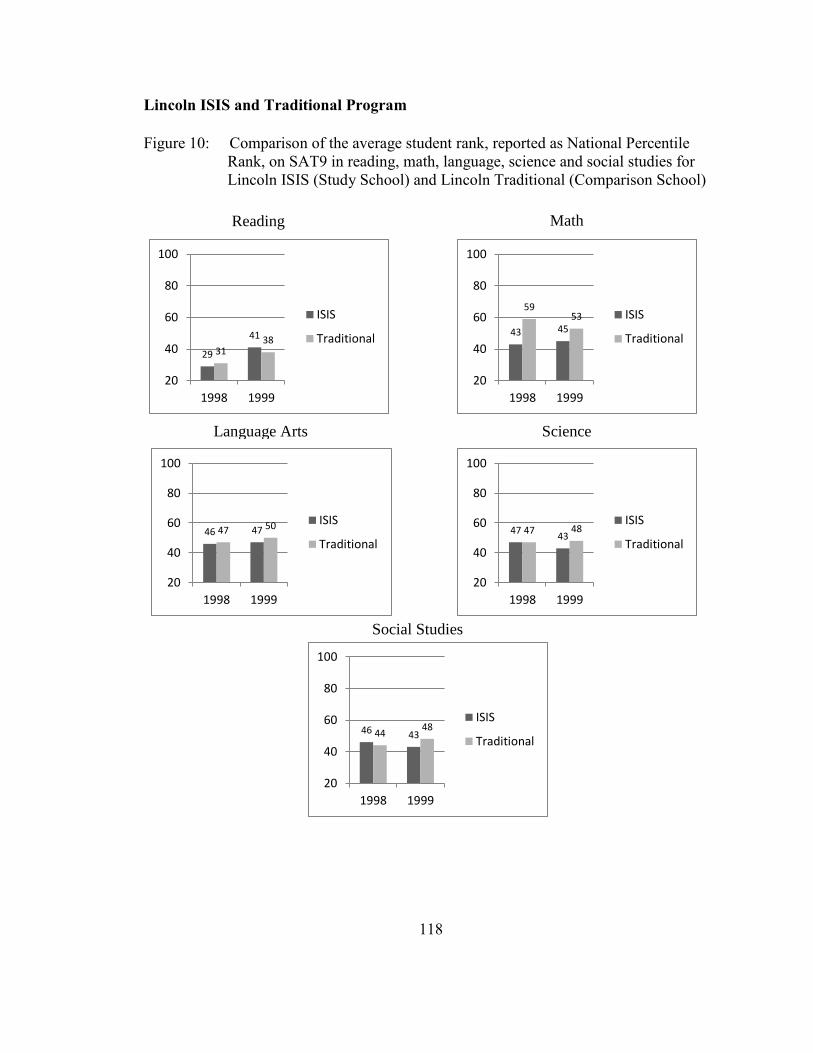
118
Lincoln ISIS and Traditional Program
Figure 10: Comparison of the average student rank, reported as National Percentile
Rank, on SAT9 in reading, math, language, science and social studies for
Lincoln ISIS (Study School) and Lincoln Traditional (Comparison School)
43 45
59 53
20
40
60
80
100
1998 1999
ISIS
Traditional
Math
29
41
31 38
20
40
60
80
100
1998 1999
ISIS
Traditional
Reading
46 47 47 50
20
40
60
80
100
1998 1999
ISIS
Traditional
Language Arts
47 43
47 48
20
40
60
80
100
1998 1999
ISIS
Traditional
Science
46 43 44 48
20
40
60
80
100
1998 1999
ISIS
Traditional
Social Studies
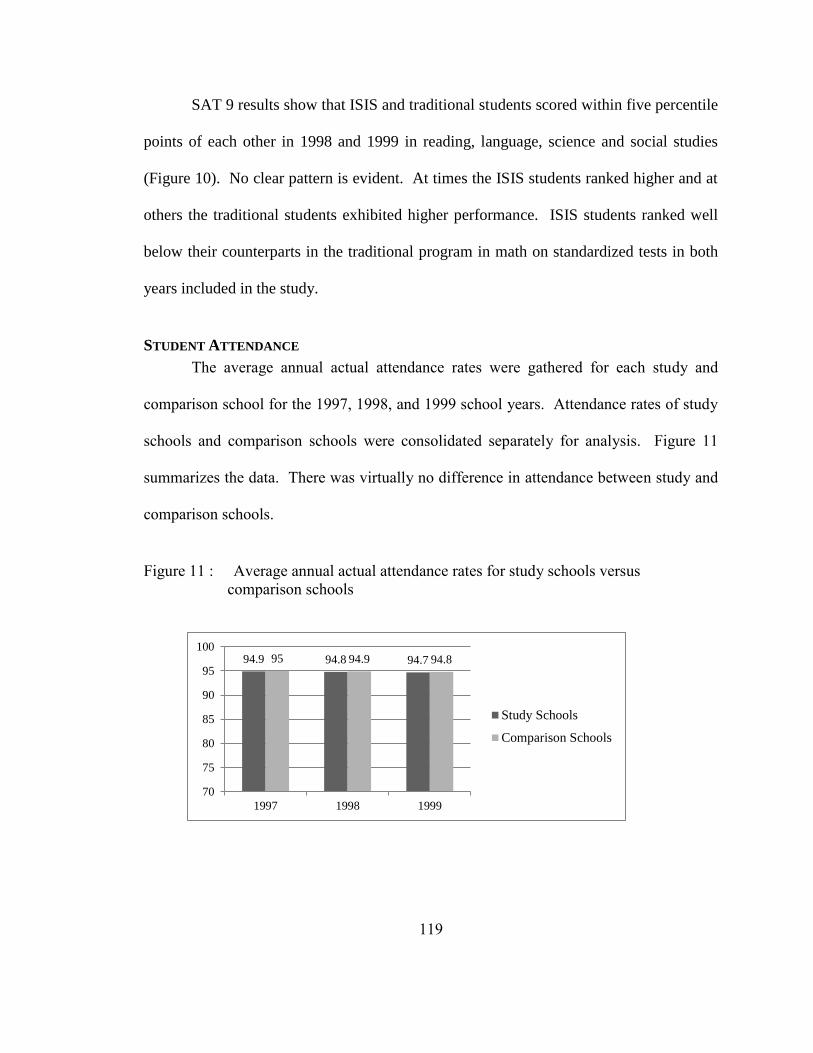
119
SAT 9 results show that ISIS and traditional students scored within five percentile
points of each other in 1998 and 1999 in reading, language, science and social studies
(Figure 10). No clear pattern is evident. At times the ISIS students ranked higher and at
others the traditional students exhibited higher performance. ISIS students ranked well
below their counterparts in the traditional program in math on standardized tests in both
years included in the study.
STUDENT ATTENDANCE
The average annual actual attendance rates were gathered for each study and
comparison school for the 1997, 1998, and 1999 school years. Attendance rates of study
schools and comparison schools were consolidated separately for analysis. Figure 11
summarizes the data. There was virtually no difference in attendance between study and
comparison schools.
Figure 11 : Average annual actual attendance rates for study schools versus
comparison schools
94.9 94.8 94.7 95 94.9 94.8
70
75
80
85
90
95
100
1997 1998 1999
Study Schools
Comparison Schools
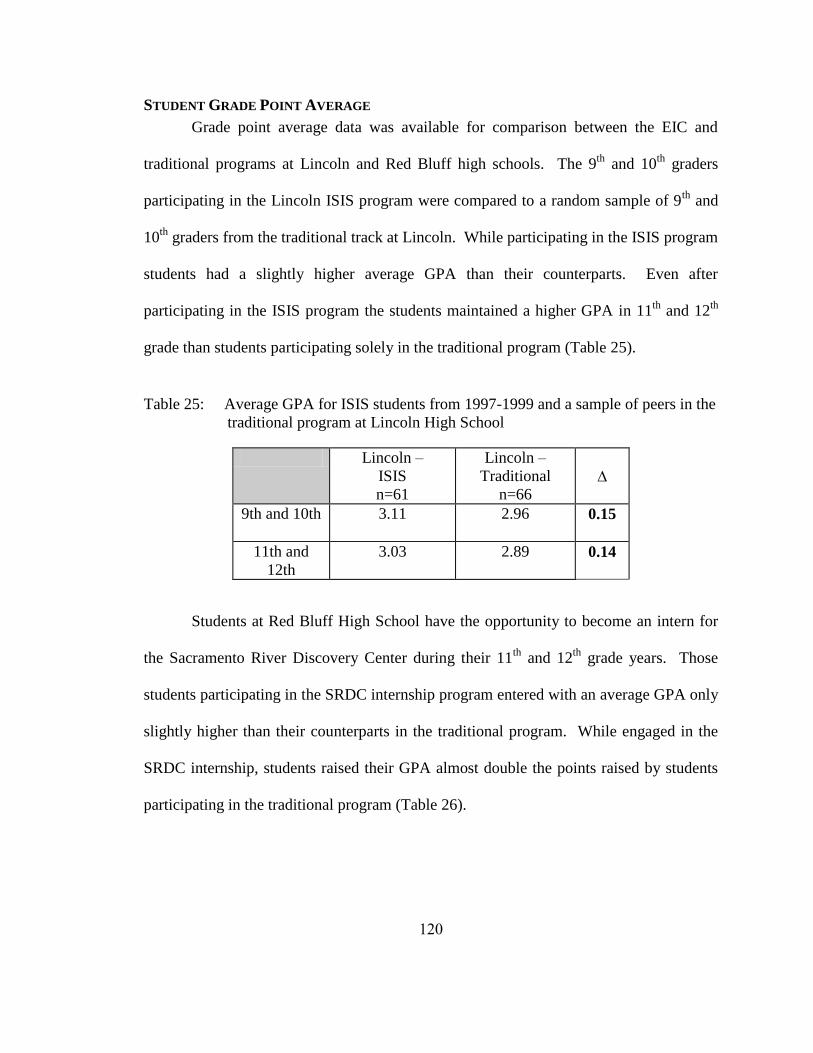
120
STUDENT GRADE POINT AVERAGE
Grade point average data was available for comparison between the EIC and
traditional programs at Lincoln and Red Bluff high schools. The 9th
and 10th
graders
participating in the Lincoln ISIS program were compared to a random sample of 9th
and
10th
graders from the traditional track at Lincoln. While participating in the ISIS program
students had a slightly higher average GPA than their counterparts. Even after
participating in the ISIS program the students maintained a higher GPA in 11th
and 12th
grade than students participating solely in the traditional program (Table 25).
Table 25: Average GPA for ISIS students from 1997-1999 and a sample of peers in the
traditional program at Lincoln High School
Lincoln –
ISIS
n=61
Lincoln –
Traditional
n=66
∆
9th and 10th 3.11
2.96 0.15
11th and
12th
3.03
2.89 0.14
Students at Red Bluff High School have the opportunity to become an intern for
the Sacramento River Discovery Center during their 11th
and 12th
grade years. Those
students participating in the SRDC internship program entered with an average GPA only
slightly higher than their counterparts in the traditional program. While engaged in the
SRDC internship, students raised their GPA almost double the points raised by students
participating in the traditional program (Table 26).
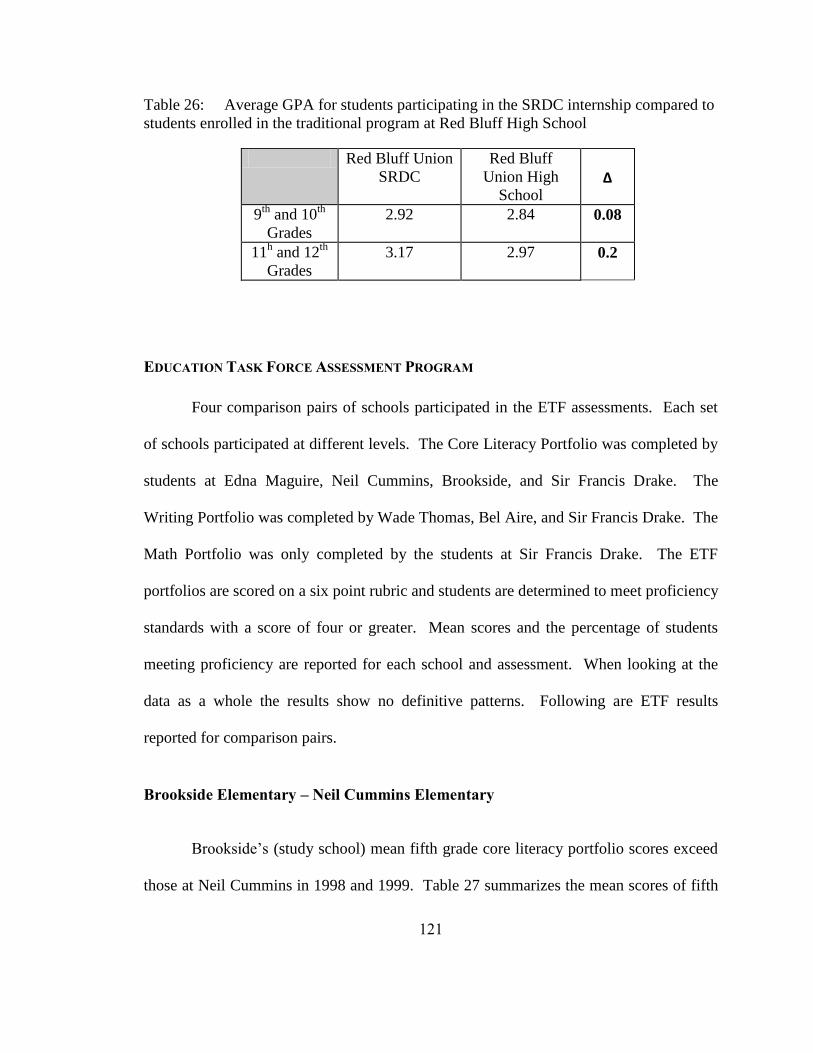
121
Table 26: Average GPA for students participating in the SRDC internship compared to
students enrolled in the traditional program at Red Bluff High School
Red Bluff Union
SRDC
Red Bluff
Union High
School
∆
9th
and 10th
Grades
2.92
2.84 0.08
11h and 12
th
Grades
3.17
2.97 0.2
EDUCATION TASK FORCE ASSESSMENT PROGRAM
Four comparison pairs of schools participated in the ETF assessments. Each set
of schools participated at different levels. The Core Literacy Portfolio was completed by
students at Edna Maguire, Neil Cummins, Brookside, and Sir Francis Drake. The
Writing Portfolio was completed by Wade Thomas, Bel Aire, and Sir Francis Drake. The
Math Portfolio was only completed by the students at Sir Francis Drake. The ETF
portfolios are scored on a six point rubric and students are determined to meet proficiency
standards with a score of four or greater. Mean scores and the percentage of students
meeting proficiency are reported for each school and assessment. When looking at the
data as a whole the results show no definitive patterns. Following are ETF results
reported for comparison pairs.
Brookside Elementary – Neil Cummins Elementary
Brookside’s (study school) mean fifth grade core literacy portfolio scores exceed
those at Neil Cummins in 1998 and 1999. Table 27 summarizes the mean scores of fifth
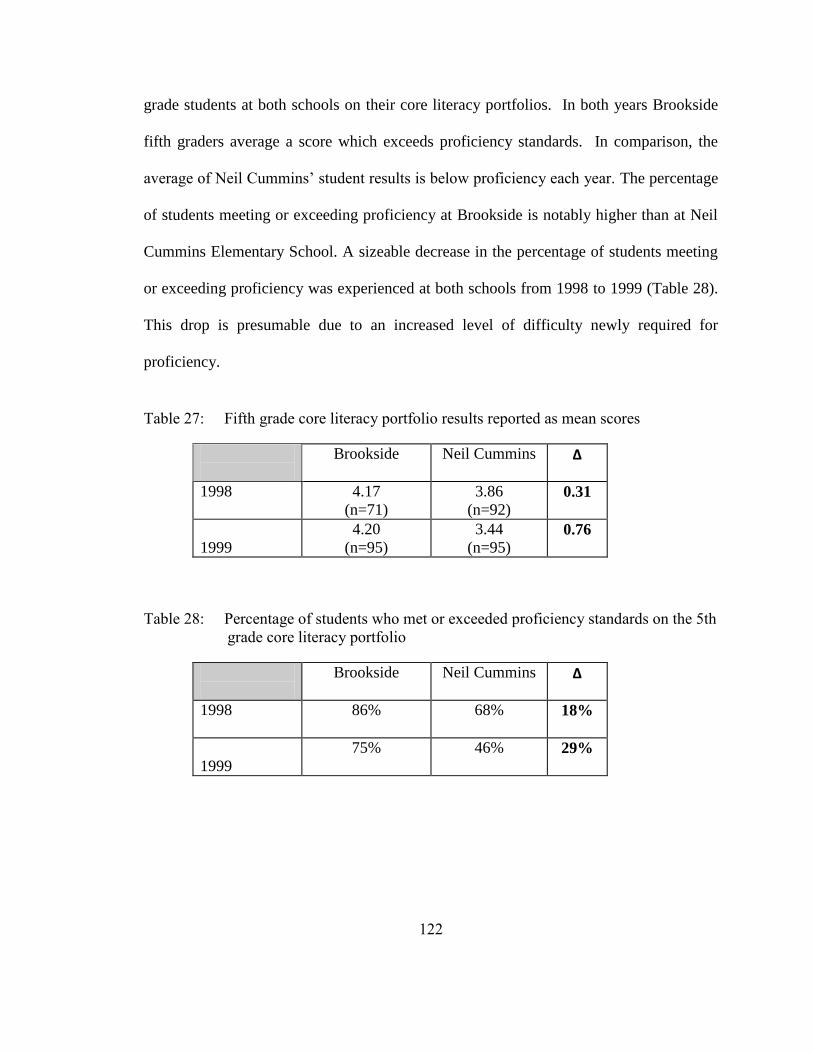
122
grade students at both schools on their core literacy portfolios. In both years Brookside
fifth graders average a score which exceeds proficiency standards. In comparison, the
average of Neil Cummins’ student results is below proficiency each year. The percentage
of students meeting or exceeding proficiency at Brookside is notably higher than at Neil
Cummins Elementary School. A sizeable decrease in the percentage of students meeting
or exceeding proficiency was experienced at both schools from 1998 to 1999 (Table 28).
This drop is presumable due to an increased level of difficulty newly required for
proficiency.
Table 27: Fifth grade core literacy portfolio results reported as mean scores
Brookside Neil Cummins ∆
1998
4.17
(n=71)
3.86
(n=92) 0.31
1999
4.20
(n=95)
3.44
(n=95) 0.76
Table 28: Percentage of students who met or exceeded proficiency standards on the 5th
grade core literacy portfolio
Brookside Neil Cummins ∆
1998
86% 68% 18%
1999
75% 46% 29%
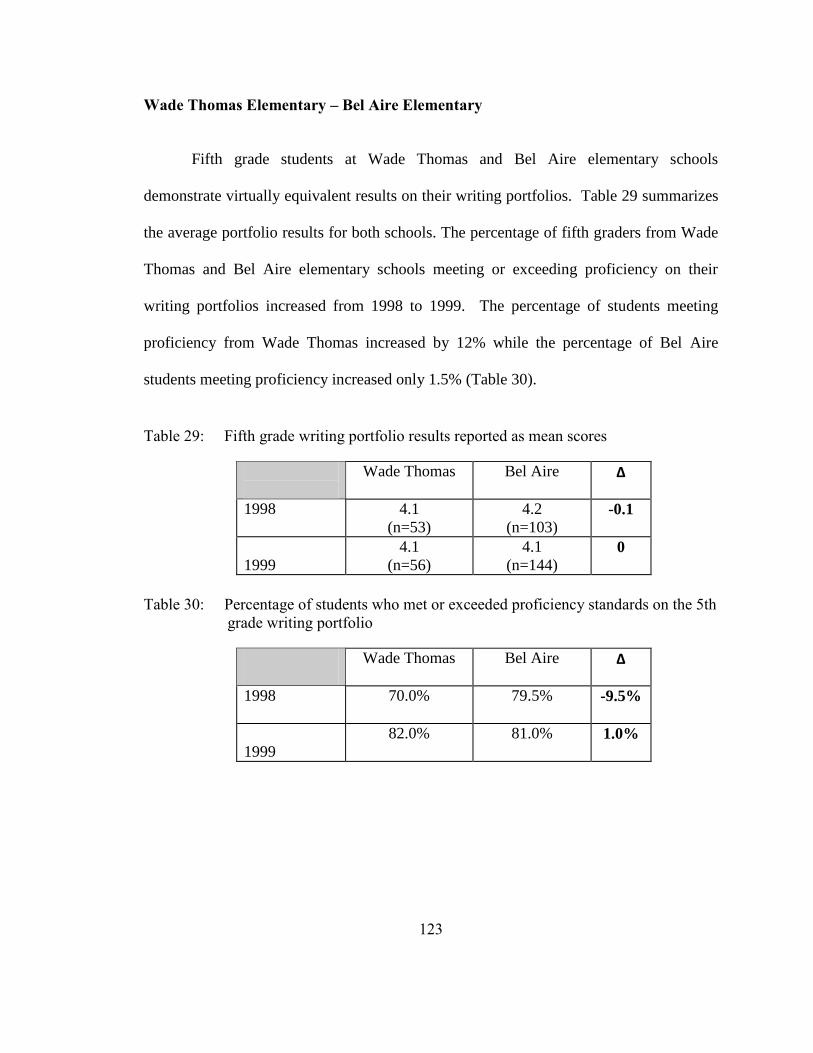
123
Wade Thomas Elementary – Bel Aire Elementary
Fifth grade students at Wade Thomas and Bel Aire elementary schools
demonstrate virtually equivalent results on their writing portfolios. Table 29 summarizes
the average portfolio results for both schools. The percentage of fifth graders from Wade
Thomas and Bel Aire elementary schools meeting or exceeding proficiency on their
writing portfolios increased from 1998 to 1999. The percentage of students meeting
proficiency from Wade Thomas increased by 12% while the percentage of Bel Aire
students meeting proficiency increased only 1.5% (Table 30).
Table 29: Fifth grade writing portfolio results reported as mean scores
Wade Thomas Bel Aire ∆
1998
4.1
(n=53)
4.2
(n=103) -0.1
1999
4.1
(n=56)
4.1
(n=144) 0
Table 30: Percentage of students who met or exceeded proficiency standards on the 5th
grade writing portfolio
Wade Thomas Bel Aire ∆
1998
70.0% 79.5% -9.5%
1999
82.0% 81.0% 1.0%
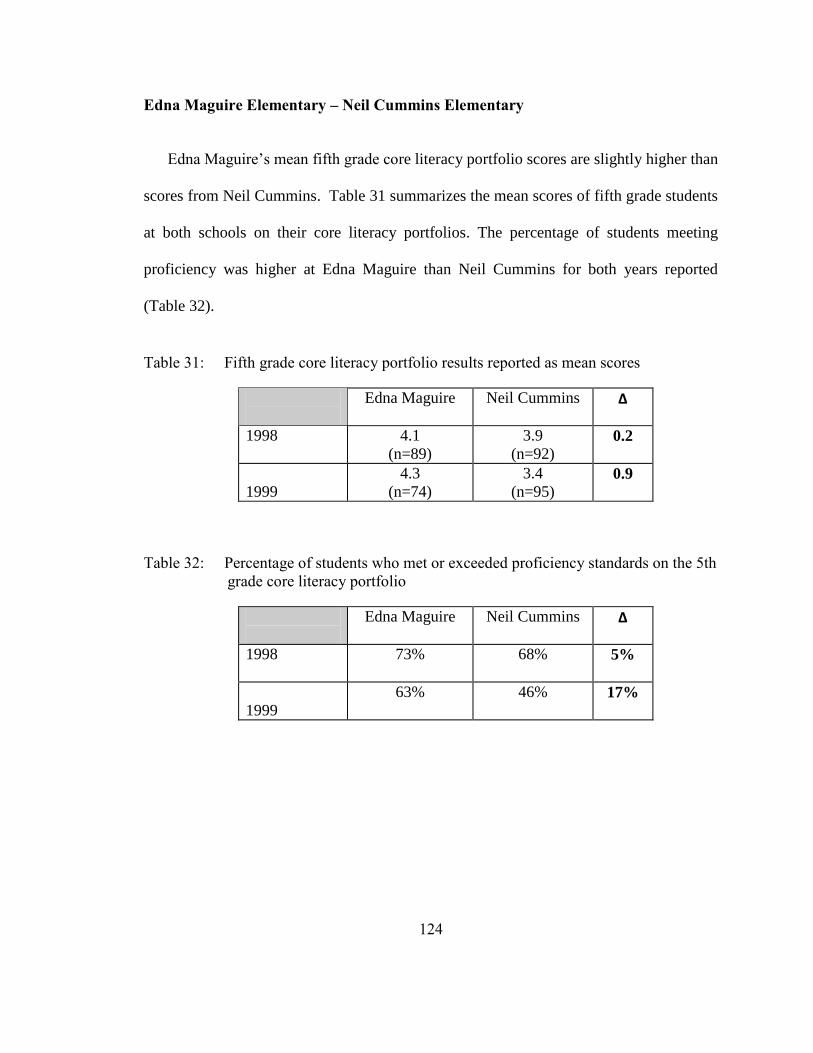
124
Edna Maguire Elementary – Neil Cummins Elementary
Edna Maguire’s mean fifth grade core literacy portfolio scores are slightly higher than
scores from Neil Cummins. Table 31 summarizes the mean scores of fifth grade students
at both schools on their core literacy portfolios. The percentage of students meeting
proficiency was higher at Edna Maguire than Neil Cummins for both years reported
(Table 32).
Table 31: Fifth grade core literacy portfolio results reported as mean scores
Edna Maguire Neil Cummins ∆
1998
4.1
(n=89)
3.9
(n=92) 0.2
1999
4.3
(n=74)
3.4
(n=95) 0.9
Table 32: Percentage of students who met or exceeded proficiency standards on the 5th
grade core literacy portfolio
Edna Maguire Neil Cummins ∆
1998
73% 68% 5%
1999
63% 46% 17%
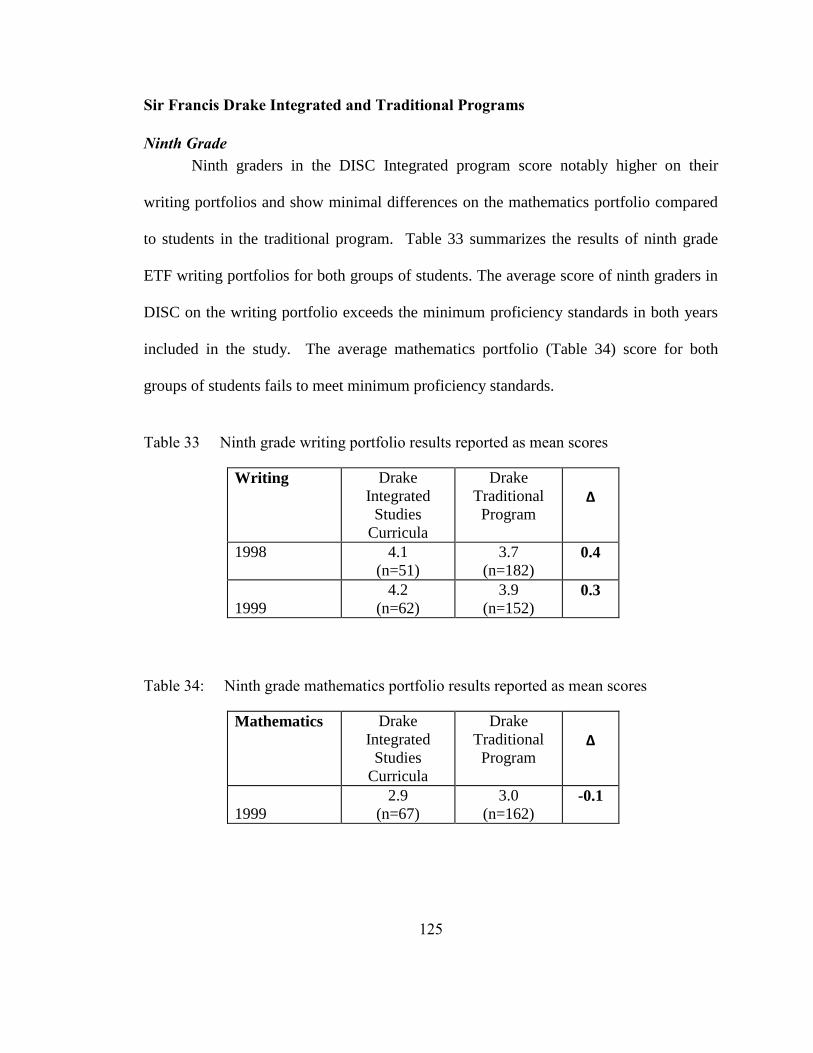
125
Sir Francis Drake Integrated and Traditional Programs
Ninth Grade
Ninth graders in the DISC Integrated program score notably higher on their
writing portfolios and show minimal differences on the mathematics portfolio compared
to students in the traditional program. Table 33 summarizes the results of ninth grade
ETF writing portfolios for both groups of students. The average score of ninth graders in
DISC on the writing portfolio exceeds the minimum proficiency standards in both years
included in the study. The average mathematics portfolio (Table 34) score for both
groups of students fails to meet minimum proficiency standards.
Table 33 Ninth grade writing portfolio results reported as mean scores
Writing
Drake
Integrated
Studies
Curricula
Drake
Traditional
Program
∆
1998
4.1
(n=51)
3.7
(n=182) 0.4
1999
4.2
(n=62)
3.9
(n=152) 0.3
Table 34: Ninth grade mathematics portfolio results reported as mean scores
Mathematics
Drake
Integrated
Studies
Curricula
Drake
Traditional
Program
∆
1999
2.9
(n=67)
3.0
(n=162) -0.1
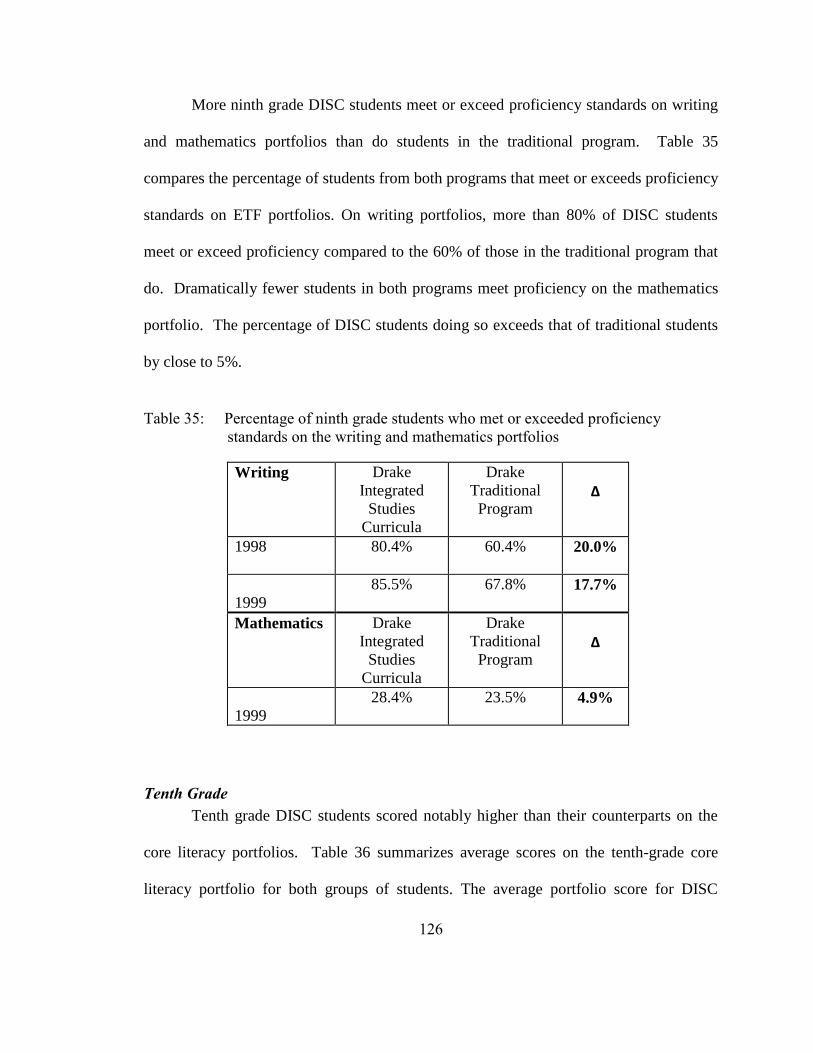
126
More ninth grade DISC students meet or exceed proficiency standards on writing
and mathematics portfolios than do students in the traditional program. Table 35
compares the percentage of students from both programs that meet or exceeds proficiency
standards on ETF portfolios. On writing portfolios, more than 80% of DISC students
meet or exceed proficiency compared to the 60% of those in the traditional program that
do. Dramatically fewer students in both programs meet proficiency on the mathematics
portfolio. The percentage of DISC students doing so exceeds that of traditional students
by close to 5%.
Table 35: Percentage of ninth grade students who met or exceeded proficiency
standards on the writing and mathematics portfolios
Writing
Drake
Integrated
Studies
Curricula
Drake
Traditional
Program
∆
1998
80.4% 60.4% 20.0%
1999
85.5% 67.8% 17.7%
Mathematics
Drake
Integrated
Studies
Curricula
Drake
Traditional
Program
∆
1999
28.4% 23.5% 4.9%
Tenth Grade
Tenth grade DISC students scored notably higher than their counterparts on the
core literacy portfolios. Table 36 summarizes average scores on the tenth-grade core
literacy portfolio for both groups of students. The average portfolio score for DISC

127
students exceeds the minimum proficiency standard in both 1998 and 1999. In contrast,
the average score for students in the traditional program falls short of meeting proficiency
in both years.
Table 36: Tenth grade core literacy portfolio results reported as mean scores
Core
Literacy
Drake
Integrated
Studies
Curricula
Drake
Traditional
Program
∆
1998
4.2
(n=30)
3.9
(n=157) 0.3
1999
4.5
(n=47)
3.9
(n=176) 0.7
The percentage of DISC students meeting or exceeding proficiency standards on
the tenth grade core literacy portfolio greatly exceeds that for students in the traditional
program. Table 37 reports the percentage of students from both programs which meet or
exceed proficiency standards on the tenth grade core literacy portfolio. 90% or more of
the tenth graders in the DISC program meet or exceed the proficiency standards on the
core literacy portfolio. In contrast, less than 70% of students in the traditional program,
on average, meet or exceed proficiency standards.
Table 37: Percentage of tenth grade students who met or exceeded proficiency
standards on the core literacy portfolio
Core
Literacy
Drake
Integrated
Studies
Curricula
Drake
Traditional
Program
∆
1998 90.0% 73.3% 16.7%
1999 93.6% 65.9% 27.7%

128
Twelfth Grade
In 1999, DISC students scored higher on average than their counterparts on the
12th
grade writing and reading portfolios. Table 38 compares portfolio results for both
sets of students. The percentage of DISC students that meet or exceed proficiency
standards on their 1999 twelfth-grade portfolios is far greater than that for students in the
traditional program. Table 39 compares the percentage of twelfth graders in both
programs that meet or exceeds proficiency standards on writing and reading portfolios.
Table 38: Twelfth grade writing and reading portfolio results reported as mean scores
Writing
Drake
Integrated
Studies
Curricula
Drake
Traditional
Program
∆
1998
3.6
(n=24)
3.7
(n=102) -0.1
1999
4.2
(n=42)
3.7
(n=141) 0.5
Reading
Drake
Integrated
Studies
Curricula
Drake
Traditional
Program
∆
1998
4.0
(n=26)
4.2
(n=115) -0.2
1999
3.8
(n=42)
3.7
(n=139) 0.1
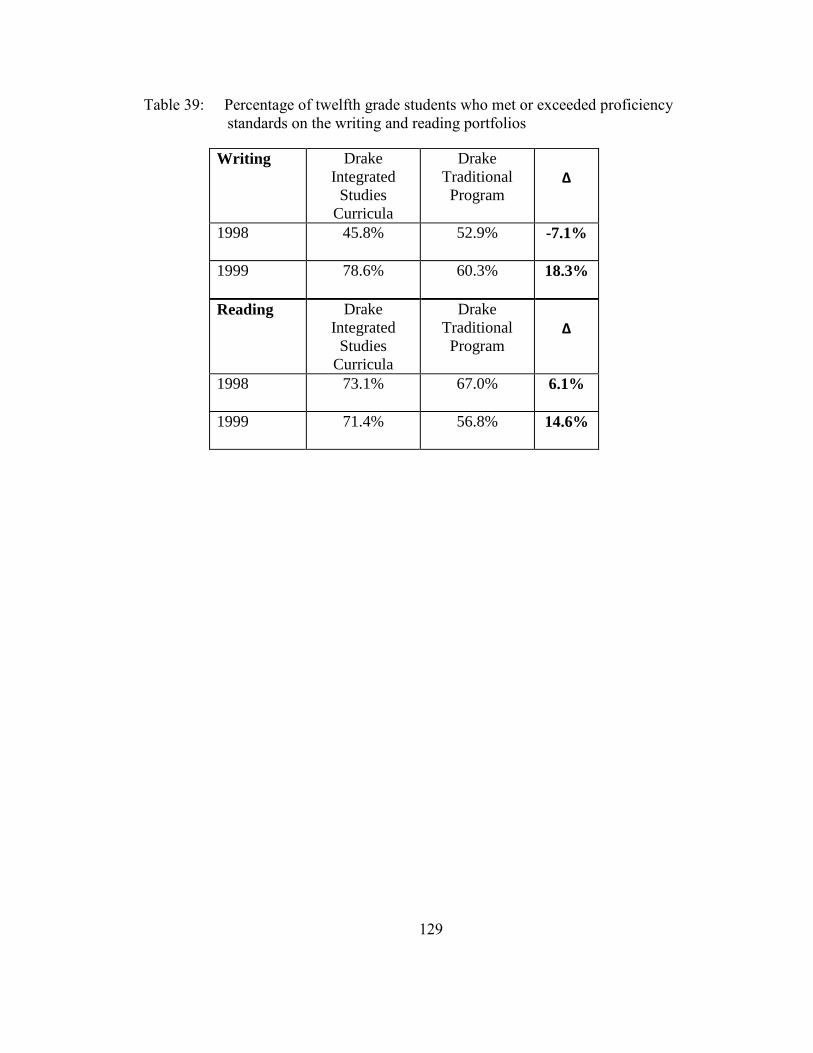
129
Table 39: Percentage of twelfth grade students who met or exceeded proficiency
standards on the writing and reading portfolios
Writing
Drake
Integrated
Studies
Curricula
Drake
Traditional
Program
∆
1998
45.8% 52.9% -7.1%
1999
78.6% 60.3% 18.3%
Reading
Drake
Integrated
Studies
Curricula
Drake
Traditional
Program
∆
1998
73.1% 67.0% 6.1%
1999
71.4% 56.8% 14.6%
130
CHAPTER 4
Discussion
PART A
When discussing the findings of the present study I believe it is important to look
closely at the program evaluation of each of the schools and then at the academic
outcomes in order to really understand the implications. An attempt was made in the
present study to evaluate the level of implementation of each component of the EIC
framework by all study and comparison schools. The purpose of this step was to better
define the instructional similarities and differences between the types of programs.
Looking at the study schools as a whole compared to the comparison schools it is
easy to see that a concerted effort is being made by the environment-based programs to
utilize the components of the EIC framework. Study schools score higher on every single
component. Scores of 2.4-3.2 were awarded to the study schools while comparison
schools scored 1.4-2.4. From these findings I conclude that the seven instructional
practices that make up the EIC framework really operate as a package. When combined,
the strength of each component may help to magnify the strength of the others. Perhaps
an EBE program is only as strong as its’ weakest component and in order to create the
most effective program an effort needs to be put forth on each component equally.
The parameters laid out for comparison pairs participating in this study required
study schools to score ≥ 3 overall on the Program Evaluation Rubric and for a
comparison school to score ≤ 2, creating a difference of ≥ 1. Only three comparison pairs
meet the requirements of the study parameters: Pinecrest and Bridgeport schools; Sir
Francis Drake High School’s Integrated and Traditional programs; and Red Bluff High

131
School’s Sacramento River Discovery Center’s (SRDC) Internship and Traditional
programs.
A focused look at Pinecrest, Sir Francis Drake, and Red Bluff will reveal that
their EBE programs are fairly consistent in their use of the seven EIC components. Each
school scored greater than 3 on almost every component. The components scoring the
highest marks vary amongst the programs. This was also obvious when looking at the
entire group of study schools. There was a great deal of variation in the way the
programs are put together and delivered. The strength of each program is unique. This
variability suggests that an important step in evaluating the success of an EBE program
compared to a traditional program should involve an accurate evaluation of its
instructional components. As Astin suggests, a true understanding of the similarities and
differences in the educational environments will better allow us to understand the
outcomes of the programs.
Again, we can focus on the three schools meeting the study parameters to discuss
the academic outcomes. Achievement, as indicated by standardized test scores and
portfolio results (Sir Francis Drake only), is higher for students in the study
schools/programs in almost all cases compared to those in traditional schools/programs.
The integrated programs at Sir Francis Drake High School are well-established
with eight years (at time of study) of history. The school has established multiple
integrated programs that attract teachers, students and community members. The
students participating in integrated programs score higher in reading, math, language arts,
science and social studies on standardized tests. Performance gaps range from one to
132
eleven National Percentile Rank points. The largest gaps in performance occur in
language arts and social studies. Sir Francis Drake was the only one of the three
comparison pairs to participate in the ETF portfolios. Much higher percentages of
students participating in the integrated programs met or exceeded proficiency standards
for all subjects (writing, math, core literacy, reading) and in all years, except 12th
grade
writing in 1998.
Pinecrest Elementary/Middle School has been utilizing an EBE approach at the
sixth through eighth grade level for more than five years (at time of study). The
community is invested in the program and it is led by a dedicated teacher. These students
score higher on standardized reading and language arts tests compared to Bridgeport
students. Math scores for Pinecrest students are higher than their counterparts in 1997
but lower in 1998 and 1999.
The SRDC internship program has been active for four years (at time of study) at
Red Bluff High School. Over the years the program and its’ expectations and
participants has evolved. For instance, in 1998, the third year of the program, students
were only required to be in the internship program for one semester. That year SRDC
interns scored lower in all subjects on standardized tests than students in the traditional
program. The following year, 1999, SRDC interns were required to participate for the
entire school year and had much more stringent participation requirements. Students in
the SRDC program out performed students in the traditional program in all subjects on
standardized tests that year.

133
Looking at all of the academic outcomes I conclude that students’ academic
performance is correlated to the strength of the program they participate in. Well-
established programs such as the ones at Sir Francis Drake and Pinecrest have had years
to work through their challenges and iron out any wrinkles in the program in order to give
their students a rich learning experience. It takes time for a staff to learn to utilize each
of the instructional practices included in the EIC framework effectively and with ease.
Likewise, time is an essential part of building a program’s reputation within the school, to
recruit dedicated teachers and students; and amongst the community, to gather resources
and support. A program like the SRDC internship program is in the thick of the
development phase and is gaining strength over the years, as evidenced by the academic
outcomes.
Again, this evidence suggests that by understanding the intricacies of the learning
environment we will be better able to discuss and explain the educational outcomes.
PART B
The present research represents one of the first attempts to use a mixed-methods
research design to compare the academic achievement of students participating in EBE
versus those in a traditional program. This project has limitations in its methodology
design. One major area of weakness was the selection and evaluation process used to
locate study schools. The quality of comparison between study and comparison schools
was not at the desired level. Most of the comparison schools scored in the ideal range on
the Program Evaluation Rubric but the study schools scored much lower than expected.

134
I believe our selection and evaluation processes produced weak comparisons for
two reasons. First, the initial survey used to identify the most promising potential study
schools and the subsequent phone interviews were not goo indicators of how a school
would score on the Program Evaluation Rubric. Second, the Program Evaluation Rubric
was not a good tool for determining the level to which a school/program utilizes the EBE
strategies.
The initial Program Survey asked the respondent to self-report on a school’s use
of the seven components of EIC-based education. In the majority of the cases the
respondent was an administrator of the school, reporting on the instructional practices of
his/her teaching staff. Likewise, the phone interview generally took place between a
member of the study team and an administrator. These two measures, the Program
Survey and phone interview, were the sole means for selecting study schools. In contrast,
the evaluation of the study schools was based on their teacher surveys and the Program
Evaluation Rubric. The surveys were completed by teachers, not administrators,
reflecting independently on their personal instructional practices.
Each of the nine study schools/programs was selected, based on the survey and
interview, because it was determined to be a strong example of EIC-based education.
However, a schools’ performance during the selection process was not a good indicator
of how well it would perform when evaluated with the rubrics. The discrepancy between
the information gathered during school selection and school evaluation may be due to the
source of the information. It seems administrators have a different perspective on the

135
instructional practices in their school that the teachers do. Which is more accurate is not
for me to determine.
My recommendation for future studies of this nature would be to strengthen the
study school selection process. One possibility would be to administer teacher surveys to
all of the most promising schools and evaluate them as part of the final selection process.
Another option would be to include teachers in the initial Program Survey and interview
steps. In both scenarios a potential school would be represented by a range of people
from the school rather than one individual. This would paint a more comprehensive
picture of the school culture and give a better basis for determining participation as a stud
school. The drawback for both of the options I recommended is the great deal of time
and effort this would add to the selection process. It is possible these steps would be
prohibitive.
The second reason I believe the selection and evaluation process produced weak
comparisons is the tool used for evaluating the school’s level of EIC implementation.
The teacher surveys were scored against the Program Evaluation Rubrics for this
purpose. The survey, which was never tested, demanded a great deal of time and energy
from the respondent and the statements respondents chose from often overlapped and
were confusing. In addition, it was obvious by the language in the survey which
statements were valued the most.
The teacher survey required a great deal of effort from a respondent in order to
complete it effectively. The survey consisted of eight pages on which respondents were
asked to read a series of statements centered around the EIC framework. First,

136
respondents were to select and check all of the statements the applied to their personal
instructional practices. Then they were given space and asked to describe how they used
these choices in their instructional practices. It was very obvious from looking at the
completed surveys that not all respondents put equal amounts of time and energy into
their responses. While some teachers wrote full page written descriptions, others wrote
nothing at all. I found that this became quite a problem when scoring the responses
because the narrative part of the survey was the most valuable for evaluating a response,
yet it was an optional item.
The written portion of the survey could either raise or lower the score given to a
response. In some cases, the teacher selected the statements associated with a strong EIC
program but their narrative explanation demonstrated a very shallow understanding of the
instructional practice. Therefore, the score was lower. On the other hand, when a
response didn’t select the higher-level statements but demonstrated through their written
description that they did incorporate these into their instructional practices the score was
raised. When no written response was given the evaluation team was forced to evaluate
based on the selections alone.
The statements given on the survey often overlapped each other and included
confusing language. In many cases it was difficult to draw a distinction between the
statements on the survey. For example on the “Curricular Direction” section of the
survey the following two statements were given as choices regarding a teacher’s
instructional practice:

137
“provide opportunities (for students) to work on authentic problems,
issues and projects that students identify and are interested in undertaking”
“assure sufficient independent study time for students to pursue their own
authentic problems, issues and projects”
Both statements address student selection of authentic problems, issues and projects. The
difference between the two selections is unclear and could be quite confusing. In many
cases the difference between selections is very minimal. This made it difficult and time
consuming to score.
In my opinion it was obvious from the language used in the survey which
selections were valued most by the study team. Statements were organized in a
continuum graduating from the most traditional instructional approach to the best practice
in the EIC framework. My concern is that some teachers may have felt pressure to
misrepresent their true instructional practices because they were devalued by the
language of the survey.
Finally, the teacher survey was never tested as a tool for evaluating the level of
EIC implementation in a school prior to use in this study. Because the survey had never
been administered to schools/programs known to be strong examples of the EIC
framework, there was no basis for comparison. Therefore, the “ideal” score of a three or
higher for a study school and two or less for a traditional school are ambiguous. It could
be that those expectations were not realistic. My recommendation is that time and energy
be put into testing the validity of the teacher survey as a tool for evaluating a school.

138
Another option would be to utilize one or more of the tools mentioned in the
distinguished studies by Bartosh and Sterbinsky.
PART C
My experience conducting the present research and accompanying literature have
led me to a few recommendations for future studies. The major shortcomings of my
study revolve around the study methodology. Here too are where my recommendations
lie.
First, I believe it is important to refer back to Astin’s I-E-O model. His model
reinforces the importance of examining the inputs and the environment in order to better
understand the outcomes. Few studies incorporate a rigorous examination of the students
(inputs) and learning environment (environment) into the methodology. This is an
omission that I hope is filled in future research. Using a mixed-methods approach,
researchers could examine the similarities and differences in study populations to better
inform discussion of the study outcomes. For instance, student background and teacher
motivation and experience could have a big impact on student performance and would
not be considered if the inputs and environment are not addressed in the research design.
Next, it is critical for future studies examining the benefits of EE to include
rigorous statistical analyses of data. The current climate in education requires that
educators and administrators utilize only those instructional practices backed by scientific
research based evidence. We must take this into consideration when designing future
studies if the goal is to provide support for EE in our schools.

139
Finally, longitudinal studies of EBE programs are preferred to those examining
the immediate outcome of EE programs. As the present study illustrated, it takes year for
an EBE program to become established within a school and community. Teachers need
time to adjust to the use of new instructional practices, students need time to become
attracted to a program and the community needs time to invest their time and resources in
a program. Studying EBE schools and programs over several years would provide an
enlightening look into this process. It is important to note that all educational programs
go through this building process. Therefore, when comparing study populations it would
be critical to understand where a school/program lies in their development process.

140
CHAPTER 5
Conclusion
This study compared the academic achievement of students in California
participating in EIC-based education against students in traditional educational programs.
A sample of schools/programs utilizing the EIC framework for at least three years was
identified. An appropriate comparison school/program was then located for each study
school. The goal was to identify the schools/programs in California that were the
strongest, most complete examples of the EIC framework developed by SEER and
compare them to schools/programs most closely resembling them, but engaged in a
traditional educational model.
Data was collected from study and comparison schools to build a profile of each,
highlighting the schools’ instructional practices. School’s instructional data was
compared and analyzed using the EIC evaluation rubrics. Results indicated that there is a
large variability in the instructional practices within EIC programs and also between EIC
and traditional programs. Some study pairs did not meet the criteria set out by the study
to ensure strong comparisons.
Achievement outcome data was also collected and analyzed for each comparison
pair. Student attendance rates, grade point averages, standardized test results, and
portfolio scores were compared. The three strong comparison pairs show that there is a
correlation between EBE and increased student academic performance. The students
from the EBE schools/programs outperformed their counterparts in traditional
schools/programs in almost all subjects and years included in the study.

141
While the present study had some methodological shortcomings, it is valuable to
the field of EE in that it highlights important steps for future studies. Based on my
research and review of current studies I believe more attention needs to be focused on the
research design of studies comparing EBE to traditional education. Specifically, future
studies should consider developing stronger tools for evaluating the similarities and
differences in the instructional approaches of the programs to be compared.

142
REFERENCES
Abdulkadiroglu, A., Angrist, J., Cohodes, S., Dynarski, S., Fullerton, J., Kane, T., &
Pathak, P. (2009). Informing the debate comparing Boston's charter, pilot and
traditional schools. Boston: The Boston Foundation.
Adams, T. L. (1998). Alternative assessment in elementary school mathematics.
Childhood education, Summer(4), 220-224.
Arhar, J. M., Johnston, J. H., & Markle, G. C. (1989). The effects of teaming on students.
Middle school journal, 20(3), 24-27.
Astin, A. W. (1991). Assessment for excellence. New York: American Council on
Education, Macmillan Publishing Company.
Athman, J., & Monroe, M. (2004b). The effects of environment-based education on
students' achievement motivation. Journal of interpretation research, 9(1), 9-25.
Bartosh, O. (2003). Environmental education: Improving student achievement.
(Unpublished master's thesis, The Evergreen State College).
Bartosh, O. (2009). Learning through environmental education: Exploring the influences
of environmental education programs on student learning and achievement.
(Unpublished doctoral dissertation, The University of British Columbia,
Vancouver, Canada).
Bartosh, O. (2012). Personal communication.
Coyle, K. (2010). How outdoor education and outdoor school time create high
performance students. National Wildlife Federation. DOI: www.nwf.org
Damico, S., Bell-Nathaniel, A., & Green, C. (1981). Effects of school organizational
structure on interracial friendships in middle schools. Journal of educational
research, 74, 388-393.

143
Danforth, P. (2005). An evaluation of the National Wildlife Federation's Schooyard
Habitat Program in the Houston Independent school district. (Unpublished
master's thesis, Texas State University).
Dickinson, V. L., & Young, T. A. (1998). Elementary science and language arts: Should
we blur the boundaries?. School science and mathematics, 98(6), 334-339.
Donahue, T. P., Lewis, L. B., Price, L. F., & Schmidt, D. C. (1998). Bringing science to
life through community-based watershed education. Journal of science education
and technology, 7(1), 15-23.
Duffin, M., Powers, A., & Tremblay, G. (2004, October 06). Place-based education
evaluation collaborative report on cross-program research. Retrieved from
www.peecworks.org
Emekauwa, E. (2004). The case for place-based they remember what they touch: The
impact of place-based learning in East Feliciana Parish. Washington, DC: Rural
School and Community Trust.
Erb, T. O., & Stevenson, C. (1999). From faith to facts: Turning points in action-what
difference does teaming make?. Middle school journal, 30(3), 47-50.
Falco, E. South Carolina Department of Education, (2004). Environment-based
education: Improving attitudes and academics for adolescents.
Fushell, M. Newfoundland Department of Education, Division of Evaluation, Research,
and Planning. (1994). What is performance-based assessment?
Gruenwald, D. (2003). The best of both worlds: A critical pedagogy of place.
Educational researcher, 32(4), 3-12.
Gruenwald, D. (2004). A Foucauldian analysis of environmental education: Toward the
socio-ecological challenge of the Earth Charter. Curriculum inquiry, 34(1), 71-
107.

144
Hart, R., & Chawla, L. (1981). The development of children's concern for the
environment. Abhandlungen, 2(81), 271-294.
Hoody, L. (1995). The educational efficacy of environmental education: An interim
report. California: State Education and Environment Roundtable.
Hungerford, H., & Volk, T. (1990). Changing learner behavior through environmental
education. Journal of environmental education, 21(3), 8-21.
Kain, D. (1993). Cabbages and kings: Research directions in integrated/interdisciplinary
curriculum. The journal of educational thought, 27(3), 312-328.
Kearney, A.R. (1999). Teacher perspectives on environmental education and school
improvement (Final Report). Seattle: Research on People on Their Environments.
Leeming, F., Dwyer, W., Porter, B., & Cobern, M. (1993). Outcome research in
education: a critical review. Journal of environmental education, 24(4), 8-21.
Lieberman, G. (1995). Pieces of a puzzle: An overview of the status of environmental
education in the United States. Poway: Science Wizards.
Lieberman, G., & Hoody, L. (1998). Closing the achievement gap: Using the
environment as an integrating context for learning. Poway: Science Wizards.
Lieberman, G. (2005). California student assessment project phase two: The effects of
environment-based education on student achievement. San Diego: State
Education and Environment Roundtable.
Merrick, C. Environmental Education and Training Partnership, (2009). Standard
practice: Aligning ee resources to national and state curriculum standards
The National Environmental Education & Training Foundation. (2000). Environment-
based education: Creating high performance schools and students. Washington,
DC: NEETF.
No Child Left Behind (NCLB) Act of 2001, 20 U.S.C.A. § 6301 et seq. (West 2003)
145
The North American Association for Environmental Education. (1999). Excellence in
environmental education: Guidelines for learning (K-12). Rock Spring: NAAEE.
The North American Association for Environmental Education, & The National
Environmental Education & Training Foundation. (2001). Using environment-
based education to advance learning skills and character development.
Washington, DC: NAAEE & NEETF.
Newman, F., & Wehlage, G. (1993). Five standards of authentic instruction. Educational
leadership, April, 8-12.
Norman, N., Jennings, A., & Wahl, L. (2006). The impact of environmentally-related
education on academic achievement. Retrieved from Community Resources for
Science website: www.crscience.org
Schack, G. (1993). Involving students in authentic research. Educational leadership,
50(7), 29-31.
Stepien, W., & Gallagher, S. (1993). Problem-based learning: As authentic as it gets.
Educational leadership, 50(7), 25-28.
Sterbinsky, A. (2002). Rocky Mountain School of Expeditionary Learning evaluation
report. Center for Research in Educational Policy, The University of Memphis.
Tudor, M. (2012). Personal communication.
Vars, G. (1991). Integrated curriculum in historical perspective. Educational leadership,
49(2), 14-16.
Venville, G., & Wallace, J. (1998). The integration of science, mathematics, and
technology in a discipline-based culture. School science and mathematics, 98(6),
294-302.
Watson, A. (1995). The light which experience gives. Pathways: the Ontario journal of
outdoor education, 7(6), 9-15.

146
Webb, N. (1992). Assessment of students' knowledge of mathematics: Steps toward a
theory. In D. Grouws (Ed.), Handbook of research on mathematics teaching and
learning (pp. 661-683). New York: Macmillan.
Wheeler, G., & Thumlert, C. Washington State Office of the Superintendent of Public
Instruction, (2007). Environmental education report. Olympia:OSPI.
Wolfe, P. (1998). Revisiting effective teaching. Educational leadership, 56(3), 61-64.

147
APPENDIX A
Program Survey
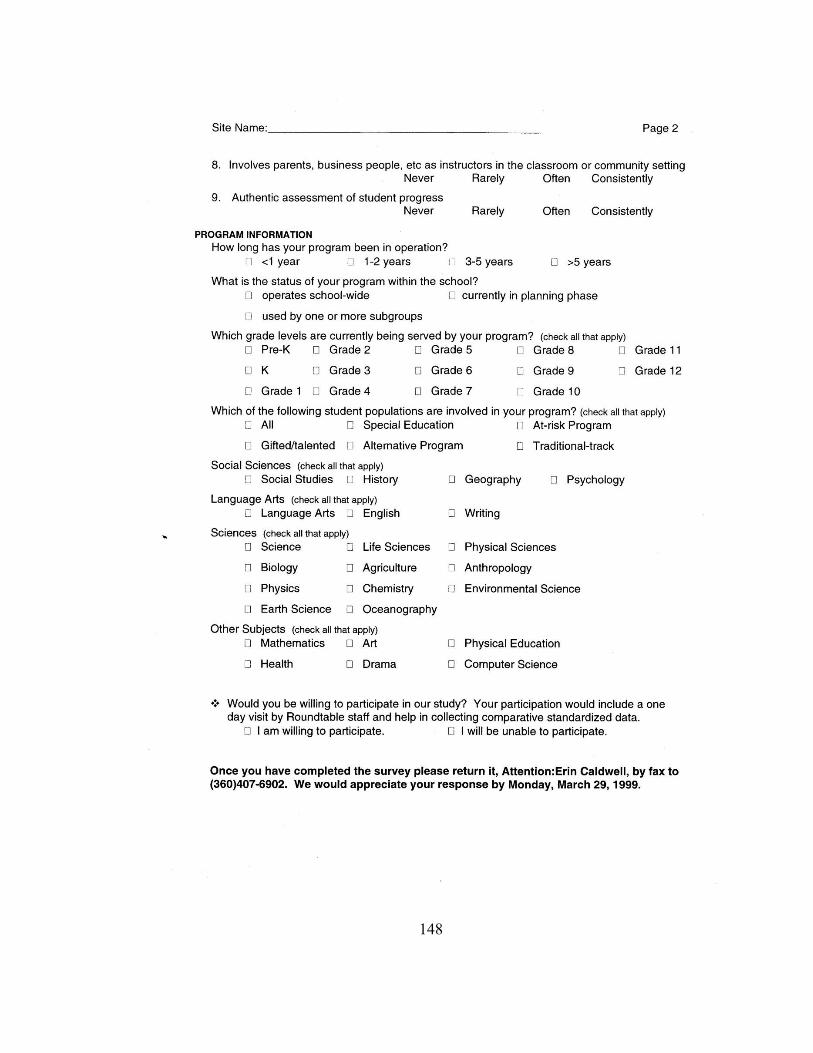
148

149
APPENDIX B
Teacher Survey
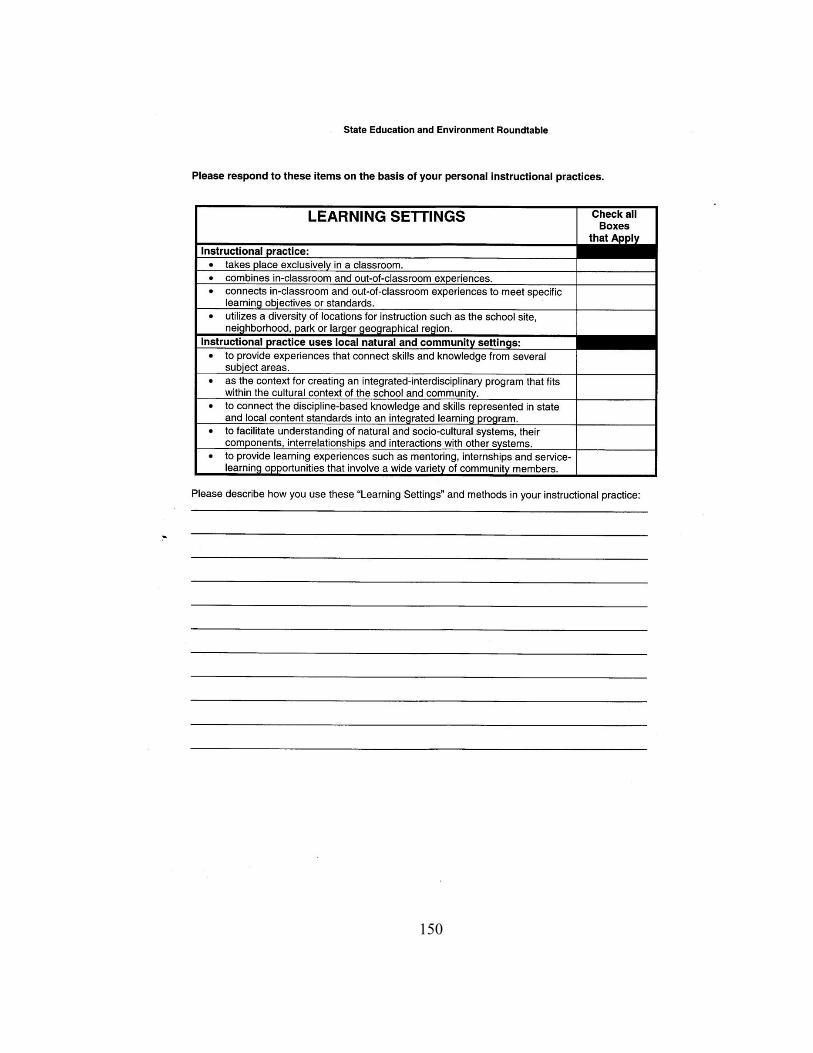
150

151

152
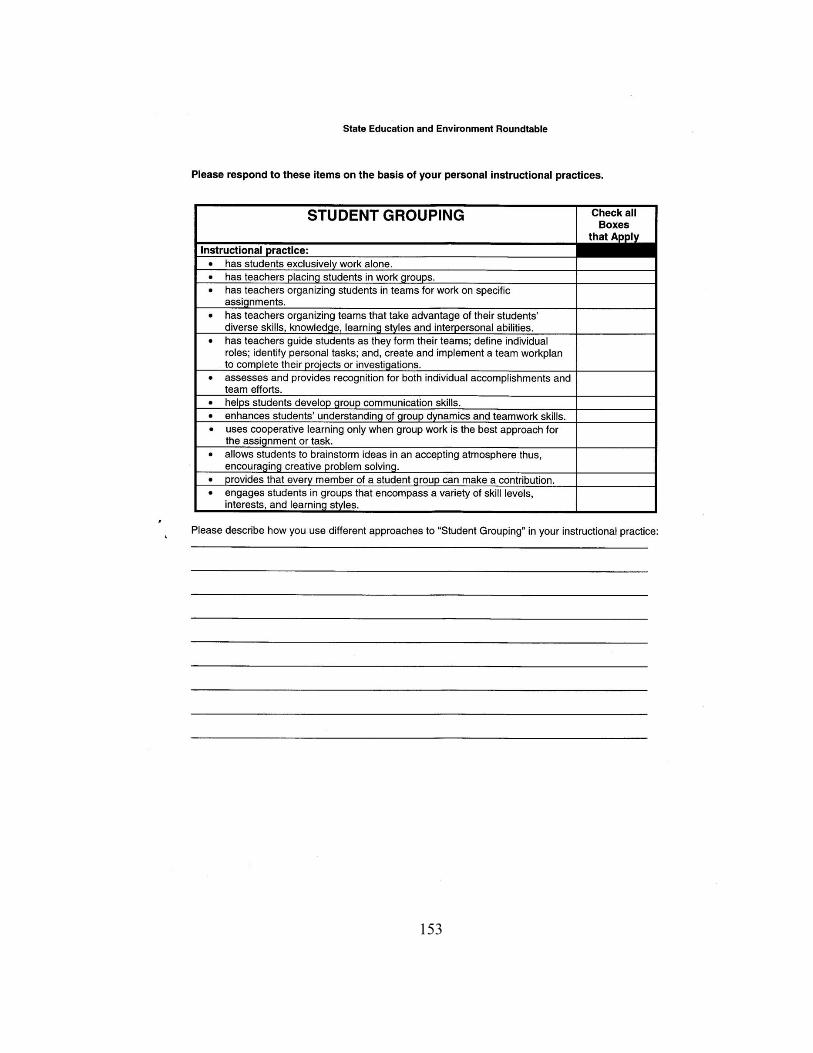
153

154
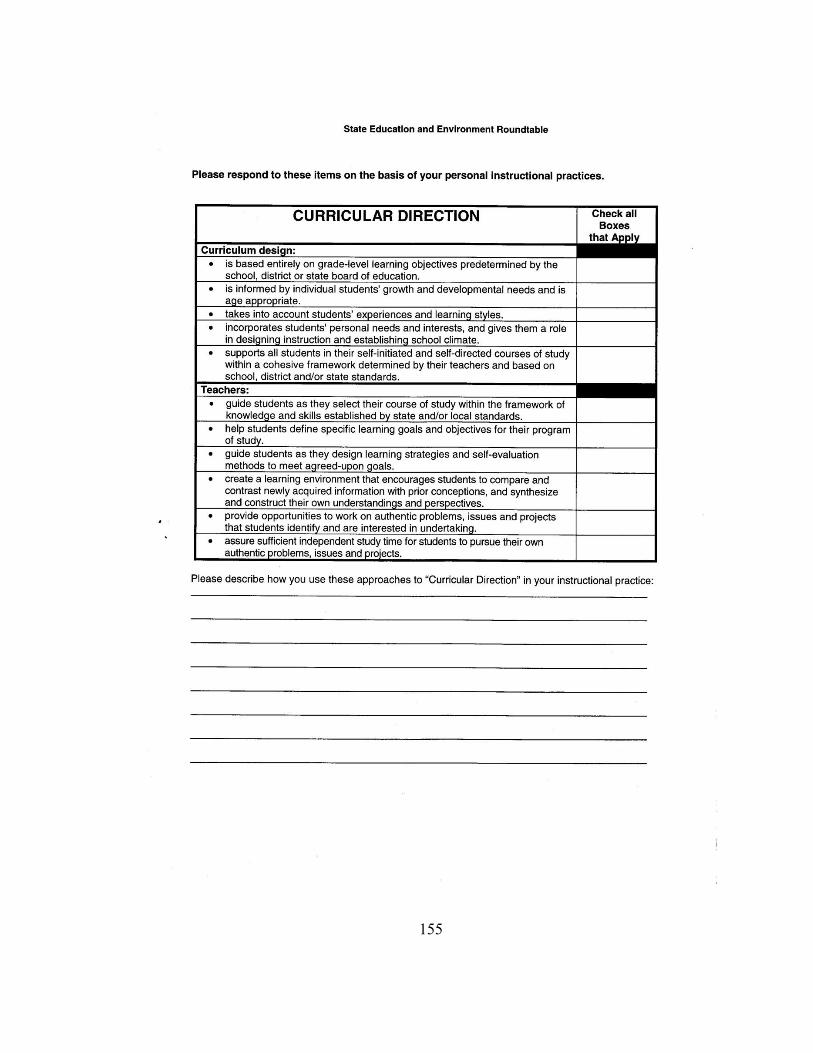
155
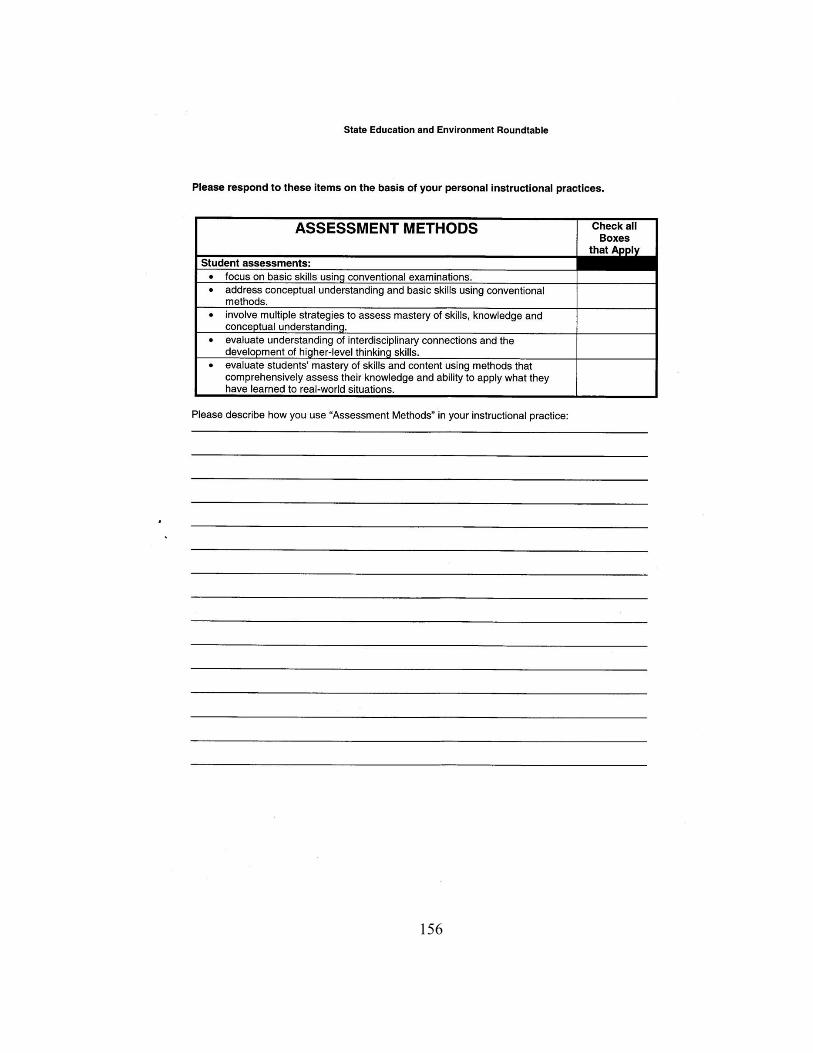
156

157
APPENDIX C
Program Evaluation Rubrics
I. Using Natural and Community Settings, the Local Environment, as a Context for Learning EIC programs use their natural and community surroundings as a comprehensive focus and framework for learning. Since local communities vary dramatically, the term "environment" means different things at every school. In creating an EIC curriculum, educators have the opportunity to define the local environment broadly, to encompass the natural ecosystems and the socio-cultural systems of their community. An EIC program:
A. Uses local natural and community settings as a context for standards-based instruction.
4 Consistently uses the local environment as the context for standards-based instruction.
3 Often uses the local environment as the context for standards-based instruction.
2 Occasionally uses the local environment as the context for instruction.
1 Rarely uses the local environment as the context for instruction.
B. Develops understanding of natural and socio-cultural systems.
4 Consistently uses the local environment to develop understanding of natural and socio-cultural systems, their components, interrelationships and interactions among systems.
3 Often uses the local environment to develop understanding of natural and socio-cultural systems, their components, interrelationships and interactions among systems.
2 Occasionally uses the local environment to develop understanding of the components of natural and socio-cultural systems.
1 Rarely uses the local environment to develop understanding of the components of natural and socio-cultural systems.
C. Incorporates the community’s cultural characteristics.
4 Consistently uses instruction in local surroundings to strengthen understanding of cultural characteristics, economic structures and decision-making processes and to provide a venue within which students can apply their skills and knowledge.
3 Often uses instruction in local surroundings to strengthen understanding of cultural characteristics, economic structures and decision-making processes within their community.
2 Occasionally uses instruction in local surroundings to foster understanding of cultural characteristics, economic structures and decision-making processes.
1 Rarely uses instruction in local surroundings to develop understanding of culture, economics or decision-making.
D. Offers opportunities to apply skills and knowledge in local settings.
4 Consistently uses local surroundings to provide opportunities for applying skills and knowledge to real-world projects, problems or issues.
3 Often uses local surroundings to provide opportunities for applying skills and knowledge to real-world projects, problems or issues.
2 Occasionally offers opportunities to apply skills and knowledge in local surroundings.
1 Rarely offers opportunities to apply skills and knowledge in local surroundings.
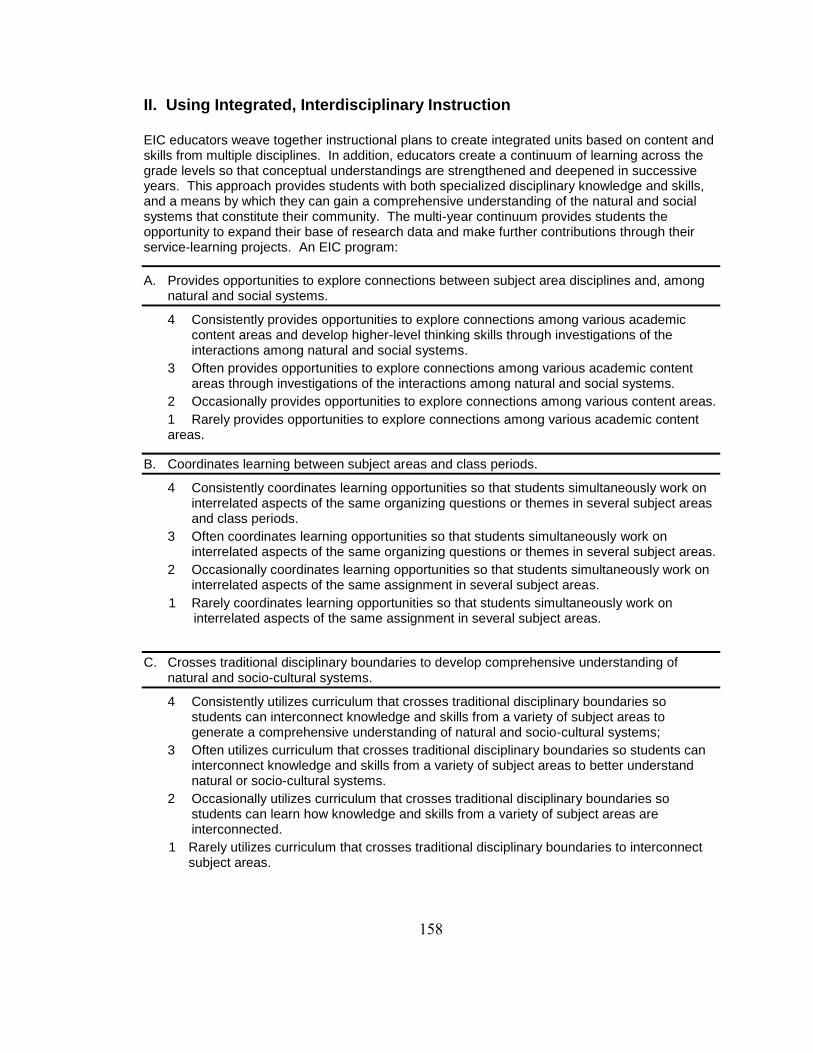
158
II. Using Integrated, Interdisciplinary Instruction EIC educators weave together instructional plans to create integrated units based on content and skills from multiple disciplines. In addition, educators create a continuum of learning across the grade levels so that conceptual understandings are strengthened and deepened in successive years. This approach provides students with both specialized disciplinary knowledge and skills, and a means by which they can gain a comprehensive understanding of the natural and social systems that constitute their community. The multi-year continuum provides students the opportunity to expand their base of research data and make further contributions through their service-learning projects. An EIC program:
A. Provides opportunities to explore connections between subject area disciplines and, among natural and social systems.
4 Consistently provides opportunities to explore connections among various academic content areas and develop higher-level thinking skills through investigations of the interactions among natural and social systems.
3 Often provides opportunities to explore connections among various academic content areas through investigations of the interactions among natural and social systems.
2 Occasionally provides opportunities to explore connections among various content areas.
1 Rarely provides opportunities to explore connections among various academic content areas.
B. Coordinates learning between subject areas and class periods.
4 Consistently coordinates learning opportunities so that students simultaneously work on interrelated aspects of the same organizing questions or themes in several subject areas and class periods.
3 Often coordinates learning opportunities so that students simultaneously work on interrelated aspects of the same organizing questions or themes in several subject areas.
2 Occasionally coordinates learning opportunities so that students simultaneously work on interrelated aspects of the same assignment in several subject areas.
1 Rarely coordinates learning opportunities so that students simultaneously work on interrelated aspects of the same assignment in several subject areas.
C. Crosses traditional disciplinary boundaries to develop comprehensive understanding of natural and socio-cultural systems.
4 Consistently utilizes curriculum that crosses traditional disciplinary boundaries so students can interconnect knowledge and skills from a variety of subject areas to generate a comprehensive understanding of natural and socio-cultural systems;
3 Often utilizes curriculum that crosses traditional disciplinary boundaries so students can interconnect knowledge and skills from a variety of subject areas to better understand natural or socio-cultural systems.
2 Occasionally utilizes curriculum that crosses traditional disciplinary boundaries so students can learn how knowledge and skills from a variety of subject areas are interconnected.
1 Rarely utilizes curriculum that crosses traditional disciplinary boundaries to interconnect subject areas.

159
D. Creates a continuum of learning that crosses grade levels and allows students to conduct multi-year research and service-learning projects that contribute to their community.
4 Consistently connects conceptual understandings through a continuum of learning that crosses grade levels and allows students to conduct multi-year research and service-learning projects.
3 Often connects conceptual understandings across grade levels and allows students to conduct multi-year projects.
2 Occasionally connects conceptual understandings and projects across grade levels.
1 Rarely connects conceptual understandings across grade levels.

160
III. Problem-, Issue-based Instruction
The focus of problem-, issue-based instruction is challenging students to solve real-world problems and investigate actual issues affecting their community and the needs of their watershed. In contrast to traditional approaches of assigning an application problem at the end of a conceptual unit, problem-based learning uses authentic issues, problems and projects to motivate, focus and initiate student learning. An EIC program:
A. Provides students with opportunities to investigate real-world community problems and issues.
4 Consistently provides authentic learning experiences that allow students to identify, compare, select, and investigate local, real-world problems, issues and projects with community support.
3 Often provides authentic learning experiences that allow students to select and investigate local, real-world problems, issues and projects with community support.
2 Occasionally provides authentic learning experiences that allow students to investigate real-world problems, issues and projects in their community.
1 Rarely provides authentic learning experiences that allow students to investigate their community.
B. Encourages use of higher-level thinking and creative problem-solving skills to achieve comprehensive understanding of the complexity of real-world problems and issues.
4 Consistently encourages use of higher-level thinking and creative problem-solving skills to achieve multi-dimensional, comprehensive understanding of real-world community problems and issues.
3 Often encourages use of higher-level thinking and creative problem-solving skills to achieve multi-dimensional, comprehensive understanding of real-world community problems and issues.
2 Occasionally encourages use of higher-level thinking skills to achieve comprehensive understanding of real-world problems and issues.
1 Rarely encourages use of higher-level thinking skills to achieve understanding of real-world issues.
C. Supports students as they undertake and monitor service-learning activities.
4 Consistently supports students as they design, undertake and monitor service-learning activities that help them achieve academic goals while resolving local problems, encouraging their sense of stewardship and making meaningful contributions to their community.
3 Often undertakes and monitors service-learning activities that help them achieve academic goals while resolving local problems and encouraging the students’ sense of stewardship.
2 Occasionally undertakes and monitors service-learning activities that help them achieve their academic goals while resolving local problems.
1 Rarely undertakes activities to resolve local problems that are connected to the curriculum.
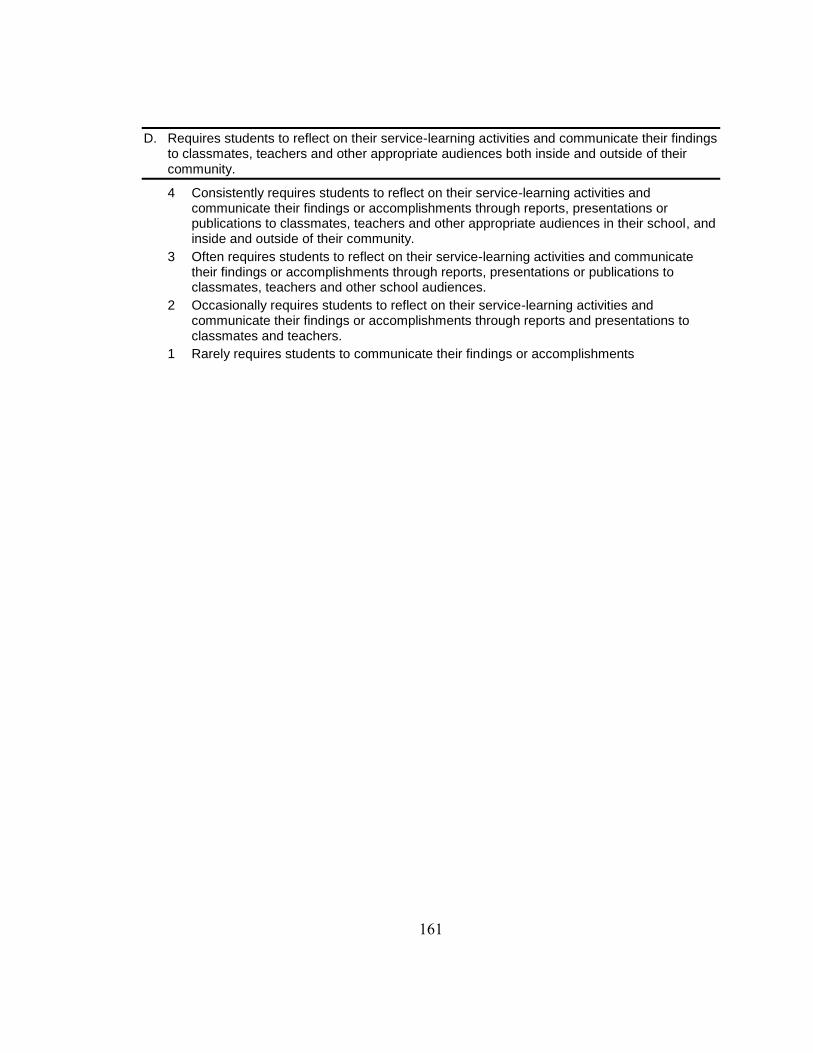
161
D. Requires students to reflect on their service-learning activities and communicate their findings to classmates, teachers and other appropriate audiences both inside and outside of their community.
4 Consistently requires students to reflect on their service-learning activities and communicate their findings or accomplishments through reports, presentations or publications to classmates, teachers and other appropriate audiences in their school, and inside and outside of their community.
3 Often requires students to reflect on their service-learning activities and communicate their findings or accomplishments through reports, presentations or publications to classmates, teachers and other school audiences.
2 Occasionally requires students to reflect on their service-learning activities and communicate their findings or accomplishments through reports and presentations to classmates and teachers.
1 Rarely requires students to communicate their findings or accomplishments

162
IV. Collaborative Instruction
Collaborative teaching teams in EIC programs are comprised of many instructional partners from the school and local community. As part of the instructional team, the term "community members" is broadened to include parents, senior citizens, specialists from local businesses, personnel from government agencies, colleges and universities, zoos and nature centers. All of these individuals work with teachers to create a learning atmosphere where students are exposed to a network of people representing a variety of viewpoints, specialized skills and knowledge.
An EIC program:
A. Involves students and community members in planning and instructional delivery.
4 Consistently involves the entire instructional team (teachers, administrators, students and community members) in creating a shared vision, planning curriculum and delivering instruction.
3 Often involves the entire instructional team in planning curriculum and delivering instruction.
2 Occasionally involves community members and students in the delivery of instruction.
1 Rarely involves community members and students in the delivery of instruction.
B. Provides opportunities for teachers to model positive team relationships.
4 Consistently encourages teachers to model, for other teachers, sharing the workload; assigning team responsibilities; providing specialized skills in support of others; and challenging each others' ideas through constructive dialogue.
3 Often encourages teachers to model, for other teachers, sharing the workload; assigning team responsibilities; and providing specialized skills in support of others.
2 Occasionally encourages teachers to model sharing the workload and assigning team responsibilities.
1 Rarely encourages teachers to model sharing the workload and assigning team responsibilities.
C. Allows teachers to have regularly scheduled team meetings.
4 Consistently allows teachers to meet, at least weekly, to evaluate students’ progress, resolve logistical issues, make team decisions and adjust team plans accordingly.
3 Often allows teachers to meet, at least weekly, to resolve logistical issues, make team decisions and adjust team plans accordingly.
2 Occasionally allows teachers to meet to resolve logistical issues and make team decisions.
1 Rarely allows teachers to meet to resolve logistical issues and make team decisions.

163
V. Learner-centered, Constructivist Methods Learner-centered, constructivist approaches are based on the theory that learners need to build their own understanding of new ideas. It is learning that takes into account both prior experience and first-hand knowledge gained from new explorations. While carrying out investigations, learners find pieces of information that don’t “fit.” Thus, they begin to break down old ideas and reconstruct them. The clarity students gain in understanding a concept gives them the ability to apply this understanding to new problems, in new situations. Teachers promoting constructivist approaches structure a learning environment that promotes opportunities for students to build personalized understanding of new information. An EIC program:
A. Assists students as they initiate self-directed courses of study.
4 Consistently supports all students in their self-initiated and self-directed courses of study, aligned to a standards-based framework determined by their teachers.
3 Often supports students in their self-directed courses of study within a standards-based framework determined by their teachers.
2 Occasionally supports students in their self-directed courses of study.
1 Rarely supports students in their self-directed courses of study.
B. Allows students to construct their own understandings.
4 Consistently supports students as they compare and contrast newly acquired information with prior knowledge to synthesize and construct their own understandings and perspectives.
3 Often supports students as they compare and contrast newly acquired information with prior knowledge to synthesize their understandings.
2 Occasionally supports students as they compare and contrast newly acquired information with prior knowledge.
1 Rarely supports students as they compare newly acquired information with prior knowledge.
C. Provides students with opportunities to pursue authentic issues of personal interest to them.
4 Consistently offers students opportunities to work on authentic problems, issues and projects that they identify and are interested in undertaking.
3 Often offers students opportunities to work on authentic problems, issues and projects that they identify and are interested in undertaking.
2 Occasionally offers students opportunities to work on projects they identify and that interest them.
1. Rarely offers students opportunities to work on projects that interest them.
D. Supports students as they define specific learning goals and objectives.
4 Consistently supports students as they define specific learning goals and objectives for their program of study; develop individualized learning strategies; and, design self-evaluation methods to meet agreed-upon goals.
3 Often supports students as they define specific learning goals and objectives for their program of study, and develop individualized learning strategies.
2 Occasionally supports students as they define specific learning goals and objectives for their program of study.
1 Rarely supports students as they define specific learning goals for their program of study.

164
VI. Independent and Cooperative Learning The diversity of knowledge and skills that students need to succeed, when working in the context of the environment, encourages the use of cooperative learning. The variety of components in their EIC studies makes it possible for students to contribute to the team effort at the same time as they are developing their individual skills and abilities. Student teams can take a variety of forms that may include different age groups, classes or schools.
An EIC program:
A. Facilitates students as they form teams to work on projects and investigations.
4 Consistently facilitates students as they form teams; define individual roles within the group; identify personal tasks; and, create and implement a team workplan to complete their projects or investigations.
3 Often guides students as they work in teams, identify personal tasks and implement a team work plan to complete their projects or investigations.
2 Occasionally allows students to work in teams as they implement a team workplan to complete their projects or investigations.
1 Rarely allows students to work in teams to complete their projects or investigations.
B. Assures that student teams include a wide range of learning styles and ability levels.
4 Consistently assures that teams take advantage of students’ diverse interests, skill levels, knowledge, learning styles and interpersonal abilities.
3 Often assures that teams take advantage of students’ diverse interests, skill levels and learning styles.
2 Occasionally organizes teams to take advantage of students’ diverse skill levels and learning styles.
1 Rarely organizes teams to take advantage of students’ diverse skill levels and learning styles.
C. Helps students develop group membership skills.
4 Consistently provides students with the opportunity to develop understanding of group dynamics and enhance their teamwork skills.
3 Often provides students with the opportunity to develop understanding of group dynamics and enhance their teamwork skills.
2 Occasionally provides students with the opportunity to develop their teamwork skills.
1 Rarely provides students with the opportunity to develop their teamwork skills.

165
VII. Authentic Assessment of Learning Authentic or performance-based assessment is a form of testing that requires teachers to make judgments about students' demonstration of their knowledge, skills and affective characteristics. In performance-based assessments, students are required to perform a task rather than select an answer from a ready-made list. It involves the assessment of students in the context of real-world tasks and requires students to actively accomplish complex and significant activities, based on prior knowledge, recent learning and relevant skills to solve realistic or authentic problems. Authentic assessment allows students to move beyond routine and discrete tasks so they can use higher-level thinking and problem solving. Teachers judge the performance of the students' work based on pre-established criteria. Potential types of authentic or performance assessment include essays, portfolios, interviews, observations, work samples and group projects. An EIC program:
A. Uses authentic assessment methods to measure students’ comprehensive understanding and, standards-based knowledge and skills.
4 Consistently uses authentic assessment methods to measure students’ comprehensive understanding of natural and socio-cultural systems in addition to standards-based disciplinary knowledge and skills.
3 Often uses authentic assessment methods to measure students’ comprehensive understanding of natural and socio-cultural systems in addition to standards-based disciplinary knowledge and skills.
2 Occasionally uses authentic assessment methods to measure students’ understanding of standards-based disciplinary knowledge and skills.
1 Rarely uses authentic assessment methods to measure students’ understanding of standards-based disciplinary knowledge and skills.
B. Utilizes authentic assessment methods to measure students’ ability to apply of knowledge and skills in real-world situations.
4 Consistently uses authentic assessment methods to measure students’ ability to apply subject area knowledge and higher-level thinking skills in real-world situations.
3 Often uses authentic assessment methods to measure students’ ability to apply subject area knowledge and higher-level thinking skills in real-world situations.
2 Occasionally uses authentic assessment methods to measure students’ ability to apply subject area knowledge in real-world situations.
1 Rarely uses authentic assessment methods to measure students’ ability to apply subject area knowledge in real-world situations.
C. Assesses students’ mastery of skills, knowledge and conceptual understanding using multiple measures that account for learning styles and “multiple intelligences.”
4 Consistently assesses mastery of skills, knowledge and conceptual understanding of students using multiple measures that take into account diverse learning styles and “multiple intelligences.”
3 Often assesses mastery of skills, knowledge and conceptual understanding of students using multiple measures that take into account diverse learning styles and “multiple intelligences.”
2 Occasionally assesses mastery of skills, knowledge and conceptual understanding of students using multiple measures that take into account diverse learning styles.
1 Rarely assesses mastery of skills, knowledge and conceptual understanding of students using multiple measures that take into account diverse learning styles.

166
APPENDIX D
Conversion Chart from National Percentile Ranks to Normal Curve Equivalent Range