Embed Size (px)
Citation preview
This article was downloaded by: [University of Haifa Library]On: 22 October 2013, At: 15:13Publisher: Taylor & FrancisInforma Ltd Registered in England and Wales Registered Number: 1072954 Registeredoffice: Mortimer House, 37-41 Mortimer Street, London W1T 3JH, UK
Bioacoustics: The International Journalof Animal Sound and its RecordingPublication details, including instructions for authors andsubscription information:http://www.tandfonline.com/loi/tbio20
Entropy rate as a measure of animalvocal complexityArik Kershenbauma
a National Institute for Mathematical and Biological Synthesis,University of Tennessee, Knoxville, TN, USAPublished online: 18 Oct 2013.
To cite this article: Arik Kershenbaum , Bioacoustics (2013): Entropy rate as a measure of animalvocal complexity, Bioacoustics: The International Journal of Animal Sound and its Recording, DOI:10.1080/09524622.2013.850040
To link to this article: http://dx.doi.org/10.1080/09524622.2013.850040
PLEASE SCROLL DOWN FOR ARTICLE
Taylor & Francis makes every effort to ensure the accuracy of all the information (the“Content”) contained in the publications on our platform. However, Taylor & Francis,our agents, and our licensors make no representations or warranties whatsoever as tothe accuracy, completeness, or suitability for any purpose of the Content. Any opinionsand views expressed in this publication are the opinions and views of the authors,and are not the views of or endorsed by Taylor & Francis. The accuracy of the Contentshould not be relied upon and should be independently verified with primary sourcesof information. Taylor and Francis shall not be liable for any losses, actions, claims,proceedings, demands, costs, expenses, damages, and other liabilities whatsoeveror howsoever caused arising directly or indirectly in connection with, in relation to orarising out of the use of the Content.
This article may be used for research, teaching, and private study purposes. Anysubstantial or systematic reproduction, redistribution, reselling, loan, sub-licensing,systematic supply, or distribution in any form to anyone is expressly forbidden. Terms &Conditions of access and use can be found at http://www.tandfonline.com/page/terms-and-conditions

Entropy rate as a measure of animal vocal complexity
Arik Kershenbaum*
National Institute for Mathematical and Biological Synthesis, University of Tennessee, Knoxville,TN, USA
(Received 3 May 2013; accepted 23 September 2013)
Vocal complexity is an important concept for investigating the role and evolution ofanimal communication and sociality. However, no one definition of ‘complexity’appears to be appropriate for all uses. Repertoire size has been used to quantifycomplexity in many bird and some mammalian studies, but is impractical in caseswhere vocalizations are highly diverse, and repertoire size is essentially non-limited atrealistic sample sizes. Some researchers have used information-theoretic measuressuch as Shannon entropy, to describe vocal complexity, but these techniques aredescriptive only, as they do not address hypotheses of the cognitive mechanisms behindvocal signal generation. In addition, it can be shown that simple measures of entropy, inparticular, do not capture syntactic structure. In this work, I demonstrate the use of analternative information-theoretic measure, the Markov entropy rate, which quantifiesthe diversity of transitions in a vocal sequence, and thus is capable of distinguishingsequences with syntactic structure from those generated by random, statisticallyindependent processes. I use artificial sequences generated from different stochasticmechanisms, as well as real data from the vocalizations of the rock hyrax Procaviacapensis, to show how different complexity metrics scale differently with sample size. Ishow that entropy rate provides a good measure of complexity for Markov processesand converges faster than repertoire size estimates, such as the Lempel–Ziv metric.The commonly used Shannon entropy performs poorly in quantifying complexity.
Keywords: complexity; entropy rate; Lempel–Ziv; Markov process; renewal process;Shannon entropy; syntax
Introduction
Animal vocal sequences have been particularly well studied in the context of birdsong
research (Catchpole and Slater 2003). However, many recent studies have also shown the
presence of non-random (i.e. statistically non-independent) sequences in a number of
mammalian taxa, such as cetaceans (Shapiro et al. 2010; Green et al. 2011; Cholewiak
et al. 2012), bats (Bohn et al. 2009), hyraxes (Kershenbaum et al. 2012) and primates
(Clarke et al. 2006). While we presume that these non-random vocal structures have
signalling significance (Ruxton and Schaefer 2011), in most cases we know neither what
the content of these signals are nor the method used for encoding information in them.
Analysis of birdsong has indicated a link between vocal complexity and social complexity
(Freeberg et al. 2012), and a similar relationship has been found in some mammalian taxa
(Pollard and Blumstein 2012). While it is not clear whether vocal complexity drives the
evolution of social complexity, or vice versa (Ord et al. 2012), it does seem that for those
species with the potential for complex vocalizations, quantifying this complexity should
be an important goal for researchers. Unfortunately, while complexity in animal
q 2013 Taylor & Francis
*Email: [email protected]
Bioacoustics, 2013
http://dx.doi.org/10.1080/09524622.2013.850040
Dow
nloa
ded
by [
Uni
vers
ity o
f H
aifa
Lib
rary
] at
15:
13 2
2 O
ctob
er 2
013
vocalizations may be an important concept, it is poorly posed. There does not appear to be
a single definition of complexity that can be appropriately applied to all species (Edmonds
1999). Traditionally, complexity in birdsong has been measured as repertoire size
(Catchpole and Slater 2003), i.e. the number of discrete different vocal sequences used by
an individual. Such a measure is the ‘gold standard’ for birdsong research, but is
problematic in the investigation of mammalian vocalizations. Whereas most bird species
have a few songs in their repertoire, up to a few tens, or possibly 100 songs (Catchpole and
Slater 2003), many mammals produce more complex vocal sequences, which are rarely
the same on repetition. For example, in a study of the vocalizations of the rock hyrax
Procavia capensis (Kershenbaum et al. 2012), out of 264 vocalizations of six or more
elements, or ‘syllables’, recorded from 39 different animals, only 15 calls were ever
repeated. Similarly, free-tailed bats combine just three syllable types into sequences that
vary greatly between individuals, and within an individual’s rendition (Bohn et al. 2009).
In these cases, repertoire size is almost impossible to assess with a finite sample size, and
so cannot be an effective measure of complexity.
Another approach to quantifying complexity is to use measures of information theory.
Shannon entropy (Shannon et al. 1949) has been widely used in assessing animal
communication behaviour (Da Silva et al. 2000; Suzuki et al. 2006; Doyle et al. 2008;
Freeberg and Lucas 2012). However, the use of entropy to quantify complexity is
problematic. Shannon entropy measures the ‘unpredictability’ of a sequence without
regard to the order in which the different elements, or ‘characters’, occur, and therefore
does not represent information contained in the order, or syntax, of those characters. Most
previous work on information-theoretic analysis of animal vocal sequences has sufficed
with measures of Shannon, or ‘zero-order’ entropy. Syntax can be captured by higher-
order entropy measurements, such as conditional entropy, which take into account joint
probability and the combination of characters as longer substrings (McCowan et al. 1999).
Unfortunately, estimating higher-order entropies requires very long sample sequences,
and may be impractical for sequences with many different types of characters (Briefer
et al. 2010), or those for which limited empirical data are available. Data gathered in the
field are often of limited length and consist of fragments of varying length. For example, in
the hyrax study cited above, half of the recordings are four characters or less long, whereas
only 10% have a length greater than 15 characters. Hyraxes make use of five different
character types, or ‘syllables’, so even those four character sequences can take any of
54 ¼ 625 combinations; almost the size of the entire corpus. Estimating any information-
theoretic measure based on the transition probabilities between characters in short
sequences is likely to be highly inaccurate (Cover and Thomas 1991; Hausser and
Strimmer 2009).
Despite this, some measure of syntax is required to capture the complexity of animal
vocal sequences. Consider the following ‘word’, or string of characters: 4 4 1 4 3 1 2 3 4 4,
which has a Shannon entropy of 0.881. The same word when sorted into ascending order:
1 1 2 3 3 4 4 4 4 4, has exactly the same Shannon entropy value. Which sequence is more
‘complex’? In general, effective communication appears to require a trade-off between
information capacity and syntactic structure (Ferrer-i-Cancho 2006), as high entropy
increases information capacity, but reduces signal fidelity and increases the cognitive cost
of signal processing (Ferrer-i-Cancho and Sole 2003).
The question of defining animal communication complexity is often poorly posed
because of the absence of knowledge of the production processes generating the data
sequence in question. As different communication scenarios – let alone different species –
might generate sequences based on different statistical and behavioural processes, a
2 A. Kershenbaum
Dow
nloa
ded
by [
Uni
vers
ity o
f H
aifa
Lib
rary
] at
15:
13 2
2 O
ctob
er 2
013
single measure of complexity is unlikely to be successful for addressing all research
hypotheses.
A number of different probabilistic processes have been used to describe animal vocal
sequence production. The null model is usually that of random character selection,
independent of preceding characters, either with a uniform prior probability for each
character, or with a stationary but non-uniform distribution (more realistic where some
vocal characters are more common than others). Deviation from such a distribution is
considered evidence for non-random sequence generation (Bohn et al. 2009; Sayigh et al.
2012). The simplest non-null model of sequence production is the first-order Markov
process (FOMP; Grinstead and Snell 1997), in which the probability of a particular
character appearing is solely determined by the value of the preceding character. Markov
processes have been used to model vocal sequence production in primates (Robinson
1979), dolphins (McCowan et al. 1999), bats (Bohn et al. 2009) and birds (Gentner and
Hulse 1998; Leonardo and Konishi 1999; Gil and Slater 2000). Higher-order Markov
processes have been used to describe vocal sequences in birds (Briefer et al. 2010), and
even longer-range correlations between characters have been shown in dolphin
vocalizations (Ferrer-i-Cancho and McCowan 2012). However, the more parsimonious
hidden Markov model (HMM) representation (Cappe et al. 2005), in which not all possible
sequences need to be enumerated, has been more successful in birdsong research. Jin and
Kozhevnikov (2011) and Katahira et al. (2011) used HMMs to model the production
process of Bengalese finches, and discussed the possible neural mechanism behind such a
model (Jin 2009).
Despite this, behavioural processes in general may not correspond to simple Markov
processes either of first order, or of any higher order. It has been suggested that
behavioural decisions can be better modelled by a Markov renewal, or semi-Markovian
process (Cane 1959), in which each behaviour continues for a certain duration, determined
by a specific probability distribution, before transitioning to the subsequent behaviour. In
the case of vocal sequences, ‘continuing behaviour’ would correspond to repeating the
same character for a certain number of times, until another character is chosen (Pruscha
and Maurus 1979). The Markov renewal process (MRP) may be a more suitable model for
song generation in those species in which multiple repeated characters are common, and in
which character choice is driven by simple behavioural rules, rather than by grammar (as it
is in human language). The sequences generated by a MRP do not necessarily show
Markovian statistics (Nelson 1995), and such deviation may be used to identify the nature
of the underlying generation process.
In this study, I will examine the use of the statistical property known as the Markov
entropy rate (Cover and Thomas 1991) as a complexity metric. Entropy rate has been
suggested from time to time as a potential metric of sequence complexity in the field of
animal vocal communication, most notably by Chomsky (2002) as a measure of
‘information content’ in finite-state grammars. However, no concerted effort has been
made to assess the relevance of entropy rate to non-human animal communication
research. This measure can in principle be applied usefully to a range of animal
communication examples and has advantages over existing approaches in certain
circumstances, and with certain assumptions. By comparing the results of this metric with
sequences generated by different stochastic production processes, I will examine its
properties and discuss when it is most appropriate to use this measure in place of other,
more established techniques. To simulate an accurate assessment, I use real-world word
length distributions from the hyrax study of Kershenbaum et al. (2012) and investigate
how the accuracy of the complexity estimate scales with data-set size.
Bioacoustics 3
Dow
nloa
ded
by [
Uni
vers
ity o
f H
aifa
Lib
rary
] at
15:
13 2
2 O
ctob
er 2
013

I address four questions addressing how appropriate entropy rate is as a metric of
animal communication complexity: (1) To what extent is it a reliable (precise) measure of
entropy rate in realistic situations? That is, how well does the metric agree with the
expected or theoretical value of the metric, for a particular stochastic production process?
(2) To what extent is it possible to estimate entropy rate with realistic sampling effort?
Convergence of any metric with increased sampling effort is an important property for a
reliable estimate. (3) To what extent does entropy rate measure the behavioural property of
interest (complexity)? This question is harder to answer, as we lack a globally relevant
definition of complexity. However, it is instructive to choose a property such as
Kolmogorov complexity, which quantifies the computational effort necessary to specify a
sequence (Denker and Woyczynski 1998, Section 4.3), and observe how the entropy rate
and other metrics of complexity correlate to such a benchmark. (4) What can entropy rate
tell us about putative stochastic production processes of vocal sequences in real data-sets?
Do any of the proposed complexity measures provide a consistent comparison between
stochastic production models?
Methods
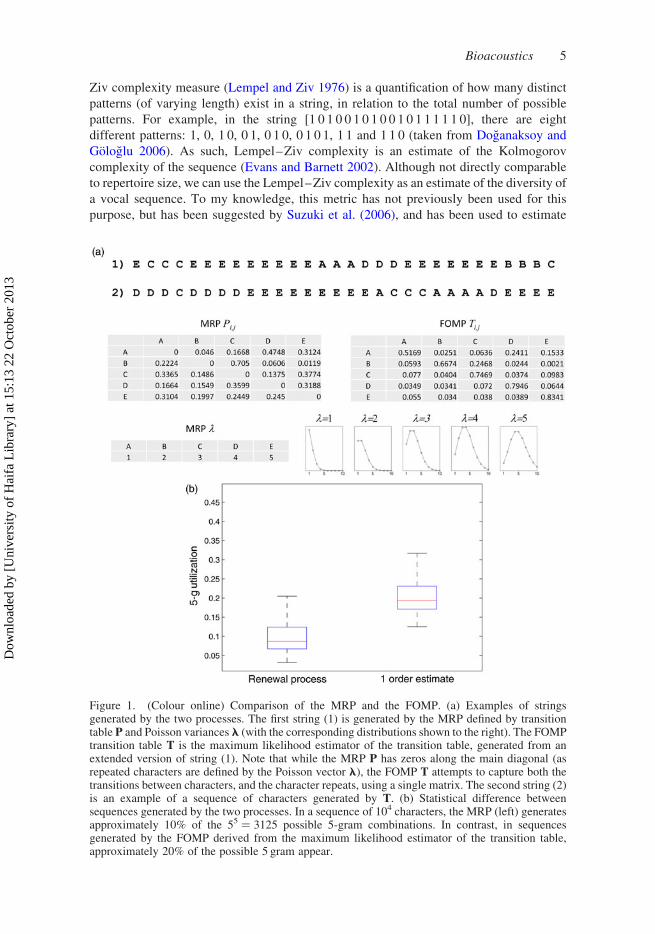
I define here three separate putative sequence-generation processes: (a) a zero-order
Markov process (ZOMP), (b) a FOMP and (c) a MRP. Consider a ‘word’, or string of
characters, taken from an ‘alphabet’ A consisting of C characters, A ¼ [1 . . .C ], that occur
with limiting and stationary probabilities pi; i [ A. The ZOMP is a process of random
selection of characters according to the fixed prior distribution vector, p. The FOMP is a
process where the probability of choosing a particular character depends only on the
preceding character, and the C £ C first-order transition (conditional probability) matrix
T, such that the probability of character j occurring after character i is fixed by Ti,j. Note
that a ZOMP is a special case of the FOMP, where the columns of T are constant, Ti,j ¼ kj.
The MRP is similar to the FOMP, except that each character is repeated n times, where n is
taken from a Poisson distribution with variance li; i [ A, defined separately for each
character i. The MRP is therefore defined both by a transition matrix P (known as the
‘embedded’ transition matrix) that defines the conditional probability of transitions
between characters (with zero along the diagonal) and by a vector of Poisson distribution
parameters l. The MRP produces sequences that appear similar to those that would be
generated by a FOMP with large probabilities along the major diagonal of T (i.e. Ti,i), and
near-zero off-diagonal (Figure 1). However, this similarity is illusive. Sequences
generated by an MRP are only Markovian if the number of repeats is distributed
exponentially (Nelson 1995); if the repeats are drawn from a Poisson distribution, the
MRP sequence cannot be adequately described by a single transition matrix T.
I examine three candidate complexity measures: (a) unconditional Shannon entropy,
(b) the Lempel–Ziv complexity as a surrogate for repertoire size and (c) the Markov
entropy rate. First, the Shannon entropy is defined simply in terms of the stationary
probability distribution p of the alphabet A, so that
SE ¼ 2X
i[A
pi logpi: ð1Þ
As mentioned previously, song repertoire is a candidate for a complexity measure, but
is difficult to calculate in the case of rarely repeated sequences. Fortunately, a
computational equivalent exists. Arising from the field of data compression, the Lempel–
4 A. Kershenbaum
Dow
nloa
ded
by [
Uni
vers
ity o
f H
aifa
Lib
rary
] at
15:
13 2
2 O
ctob
er 2
013
Ziv complexity measure (Lempel and Ziv 1976) is a quantification of how many distinct
patterns (of varying length) exist in a string, in relation to the total number of possible
patterns. For example, in the string [1 0 1 0 0 1 0 1 0 0 1 0 1 1 1 1 1 0], there are eight
different patterns: 1, 0, 1 0, 0 1, 0 1 0, 0 1 0 1, 1 1 and 1 1 0 (taken from Doganaksoy and
Gologlu 2006). As such, Lempel–Ziv complexity is an estimate of the Kolmogorov
complexity of the sequence (Evans and Barnett 2002). Although not directly comparable
to repertoire size, we can use the Lempel–Ziv complexity as an estimate of the diversity of
a vocal sequence. To my knowledge, this metric has not previously been used for this
purpose, but has been suggested by Suzuki et al. (2006), and has been used to estimate
Figure 1. (Colour online) Comparison of the MRP and the FOMP. (a) Examples of stringsgenerated by the two processes. The first string (1) is generated by the MRP defined by transitiontable P and Poisson variances l (with the corresponding distributions shown to the right). The FOMPtransition table T is the maximum likelihood estimator of the transition table, generated from anextended version of string (1). Note that while the MRP P has zeros along the main diagonal (asrepeated characters are defined by the Poisson vector l), the FOMP T attempts to capture both thetransitions between characters, and the character repeats, using a single matrix. The second string (2)is an example of a sequence of characters generated by T. (b) Statistical difference betweensequences generated by the two processes. In a sequence of 104 characters, the MRP (left) generatesapproximately 10% of the 55 ¼ 3125 possible 5-gram combinations. In contrast, in sequencesgenerated by the FOMP derived from the maximum likelihood estimator of the transition table,approximately 20% of the possible 5 gram appear.
Bioacoustics 5
Dow
nloa
ded
by [
Uni
vers
ity o
f H
aifa
Lib
rary
] at
15:
13 2
2 O
ctob
er 2
013

complexity in other applications such as the analysis of DNA sequences (Orlov and
Potapov 2004) and network security (Evans and Barnett 2002).
The entropy rate of a stationary Markov process (Cover and Thomas 1991) can be
calculated as follows. Given the C £ C transition matrix T, and the stationary distribution
p, entropy rate is then defined as:
ER ¼ 2X
i[A
pi
X
j[A
Ti;j log Ti;j: ð2Þ
Even if the conditions for the formal definition of entropy rate (e.g. stationary, first-
order process) are not met, Equation (2) conditional entropy given the preceding character
still provides a potentially useful measure of the entropy rate. Notice that the entropy rate
in a sense measures the ‘entropy’, or ‘unevenness’ of the transition matrix itself; that is,
2Pj
Ti;j log Ti;j is high when all the elements of T have similar values, but low when T is
‘uneven’, i.e. some transitions are likely, while others are less likely. This feature of
unevenness in transition likelihood appears to be a promising candidate for predicting
complexity, as the sequences with low entropy rate will be less random and more
stereotyped.
To simulate the constraints of data collection in animal field studies, I generated
artificial sequences according to the word length distribution found in a real data-set. For
this, I used data from Kershenbaum et al. (2012) on the vocalizations of the rock hyrax in
northern Israel. This data-set consists of 967 coded sequences of hyrax song, with
sequence length varying between 1 and 48 characters long (mean length ¼ 4.4). The hyrax
songs were coded into five distinct characters, i.e. C ¼ 5; for details see Kershenbaum
et al. (2012).
I performed a Monte Carlo analysis in which I repeatedly generated full data-sets of
967 random words (sequences) according to the word length distribution of the hyrax data-
set. I generated data-sets using each of the three models: ZOMP, FOMP and MRP, each
time selecting random values for the parameters: p, T, P and l, so that each data-set was
generated by a different set of random parameter values. I selected random values from a
uniform distribution: for the parameters p, T and P in the range [0–1], and l in the range
[0–2C ]. Having selected random parameters, I normalized the probabilities to sum to
unity (e.g.Pi
pi ¼ 1;Pj
Ti;j ¼ 1). I then calculated the three complexity measures:
Shannon entropy, Lempel–Ziv complexity and Markov entropy rate, for a set of N
randomly selected words from each data-set, varying the number N of words selected,
between 5 and 965. I simulated a total of 1000 Monte Carlo replicates for each model, with
different random parameter values for each replicate.
For each replicate, I compared the three complexity measures with the expected
complexity. The expected Shannon entropy SE* and Markov entropy rate ER* can be
derived deterministically given the transition matrices for the ZOMP and FOMP (with
their replicate-specific parameter values) as follows. Shannon entropy is given by
Equation (1), because for the ZOMP, p is simply the prior probability parameter
vector. For the FOMP, the stationary distribution p of T can be found by solving
pT ¼ p. Shannon entropy and Markov entropy rate cannot be calculated directly from
the parameters of the MRP model, nor can the expected Lempel–Ziv complexity LZ*be derived from the parameters of any of the three models. To approximate the true
values of the complexity measures for each data-set, without being constrained by the
sample size of the hyrax data-set, I generated a very long sequence (106 characters)
6 A. Kershenbaum
Dow
nloa
ded
by [
Uni
vers
ity o
f H
aifa
Lib
rary
] at
15:
13 2
2 O
ctob
er 2
013
using the same process parameters and calculated the complexity empirically from
this. Having determined the expected complexity metrics, SE*, ER* and LZ*, I
compared these with the complexity measures se, er and lz, calculated on the artificial
sequences for varying sample size N and for each production model m ¼ {ZOMP,
FOMP, MRP}.
To compare the metrics in a real data-set, I also calculated the absolute values of
the complexity estimates on the original hyrax data-set. I then compared these with the
complexity metrics on additional artificial ZOMP, FOMP and MRP data-sets,
generated from the three models, using maximum likelihood estimators of p, T and P,
l, respectively, as calculated from the hyrax data. I bootstrapped these sets by
excluding a random 20% of the 967 sequences on each of 1000 iterations, to generate
the equivalent of the previous Monte Carlo simulation. As well as testing the
complexity metrics on the hyrax data-set as a whole, I repeated this test separately for
the vocalizations of the three-most prolifically vocal individual hyraxes, taken from
three geographically separate sites (Table 1), to ensure that the conclusions drawn can
be applied both to individual vocal behaviour and to the vocal characteristics of the
regional population.
All calculations were performed in Matlab 7.14, with the use of the Applied Nonlinear
Time Series Analysis library (Small 2005) to calculate the Lempel–Ziv complexity.
Results
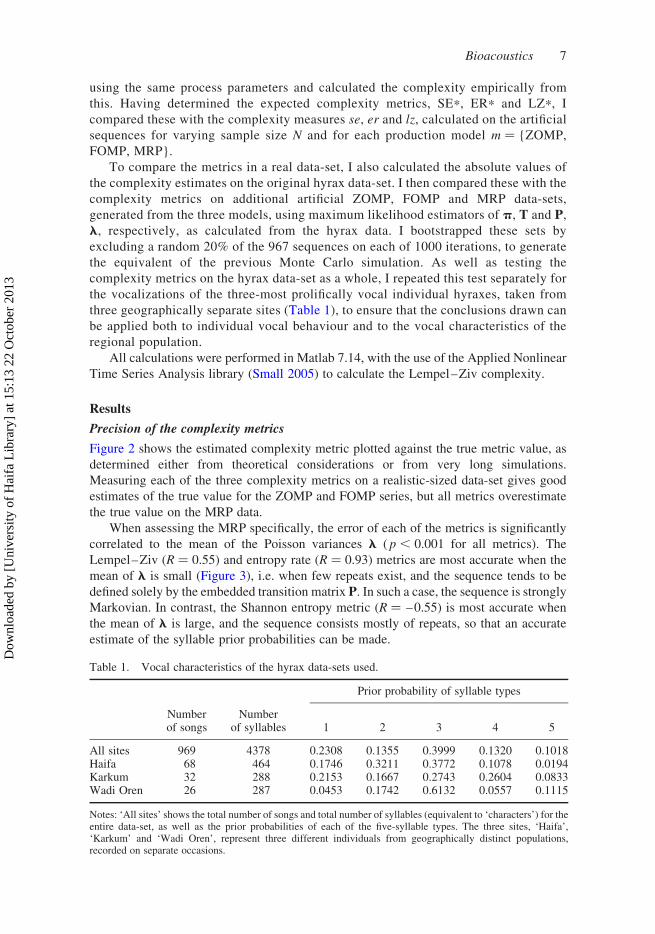
Precision of the complexity metrics
Figure 2 shows the estimated complexity metric plotted against the true metric value, as
determined either from theoretical considerations or from very long simulations.
Measuring each of the three complexity metrics on a realistic-sized data-set gives good
estimates of the true value for the ZOMP and FOMP series, but all metrics overestimate
the true value on the MRP data.
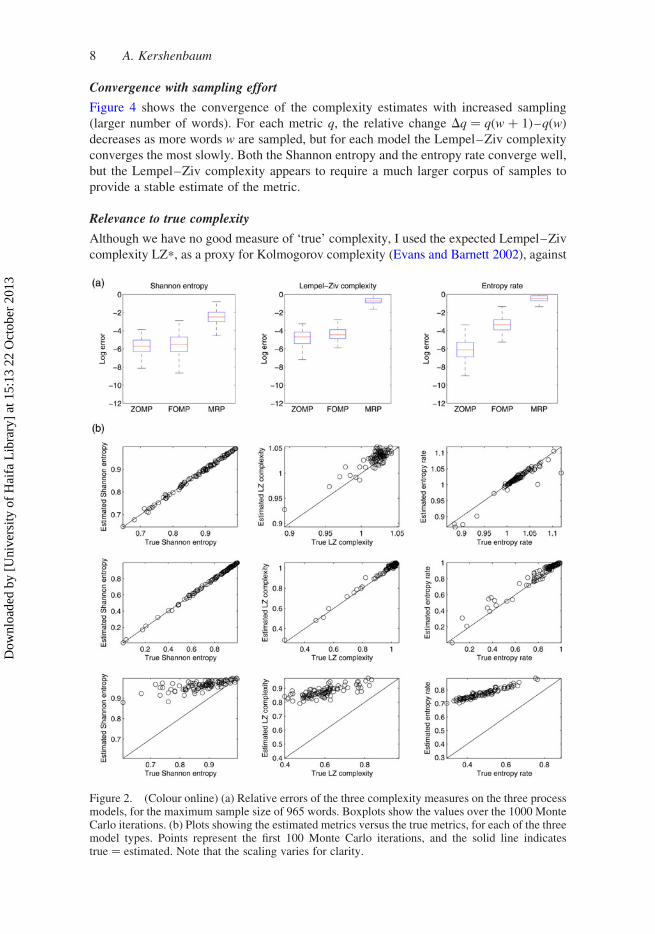
When assessing the MRP specifically, the error of each of the metrics is significantly
correlated to the mean of the Poisson variances l ( p , 0.001 for all metrics). The
Lempel–Ziv (R ¼ 0.55) and entropy rate (R ¼ 0.93) metrics are most accurate when the
mean of l is small (Figure 3), i.e. when few repeats exist, and the sequence tends to be
defined solely by the embedded transition matrix P. In such a case, the sequence is stronglyMarkovian. In contrast, the Shannon entropy metric (R ¼ –0.55) is most accurate when
the mean of l is large, and the sequence consists mostly of repeats, so that an accurate
estimate of the syllable prior probabilities can be made.
Table 1. Vocal characteristics of the hyrax data-sets used.
Prior probability of syllable types
Numberof songs
Numberof syllables 1 2 3 4 5
All sites 969 4378 0.2308 0.1355 0.3999 0.1320 0.1018Haifa 68 464 0.1746 0.3211 0.3772 0.1078 0.0194Karkum 32 288 0.2153 0.1667 0.2743 0.2604 0.0833Wadi Oren 26 287 0.0453 0.1742 0.6132 0.0557 0.1115
Notes: ‘All sites’ shows the total number of songs and total number of syllables (equivalent to ‘characters’) for theentire data-set, as well as the prior probabilities of each of the five-syllable types. The three sites, ‘Haifa’,‘Karkum’ and ‘Wadi Oren’, represent three different individuals from geographically distinct populations,recorded on separate occasions.
Bioacoustics 7
Dow
nloa
ded
by [
Uni
vers
ity o
f H
aifa
Lib
rary
] at
15:
13 2
2 O
ctob
er 2
013
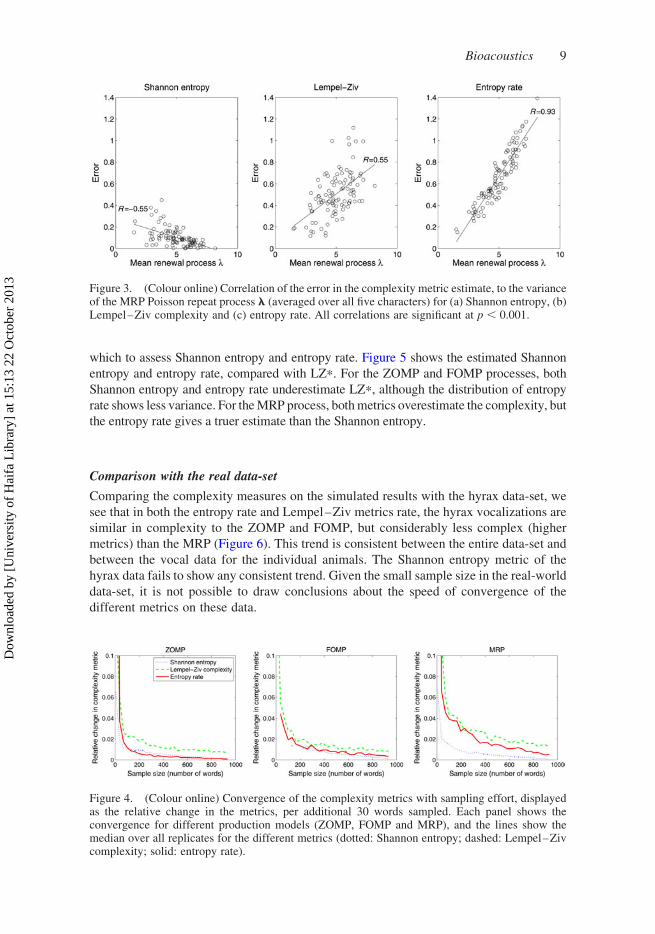
Convergence with sampling effort
Figure 4 shows the convergence of the complexity estimates with increased sampling
(larger number of words). For each metric q, the relative change Dq ¼ q(w þ 1)–q(w)
decreases as more words w are sampled, but for each model the Lempel–Ziv complexity
converges the most slowly. Both the Shannon entropy and the entropy rate converge well,
but the Lempel–Ziv complexity appears to require a much larger corpus of samples to
provide a stable estimate of the metric.
Relevance to true complexity
Although we have no good measure of ‘true’ complexity, I used the expected Lempel–Ziv
complexity LZ*, as a proxy for Kolmogorov complexity (Evans and Barnett 2002), against
Figure 2. (Colour online) (a) Relative errors of the three complexity measures on the three processmodels, for the maximum sample size of 965 words. Boxplots show the values over the 1000 MonteCarlo iterations. (b) Plots showing the estimated metrics versus the true metrics, for each of the threemodel types. Points represent the first 100 Monte Carlo iterations, and the solid line indicatestrue ¼ estimated. Note that the scaling varies for clarity.
8 A. Kershenbaum
Dow
nloa
ded
by [
Uni
vers
ity o
f H
aifa
Lib
rary
] at
15:
13 2
2 O
ctob
er 2
013
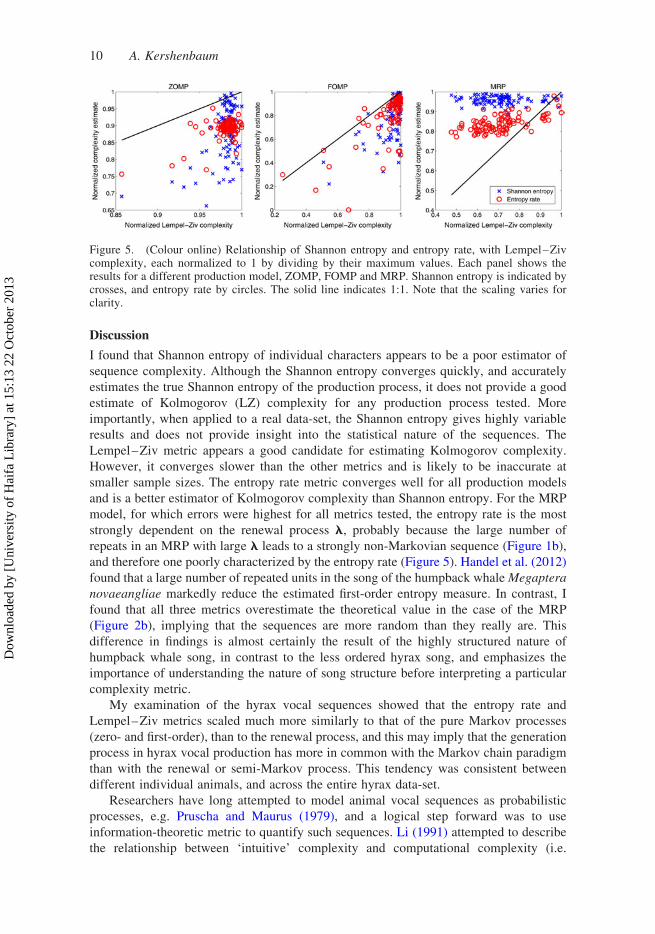
which to assess Shannon entropy and entropy rate. Figure 5 shows the estimated Shannon
entropy and entropy rate, compared with LZ*. For the ZOMP and FOMP processes, both
Shannon entropy and entropy rate underestimate LZ*, although the distribution of entropy
rate shows less variance. For theMRP process, bothmetrics overestimate the complexity, but
the entropy rate gives a truer estimate than the Shannon entropy.
Comparison with the real data-set
Comparing the complexity measures on the simulated results with the hyrax data-set, we
see that in both the entropy rate and Lempel–Ziv metrics rate, the hyrax vocalizations are
similar in complexity to the ZOMP and FOMP, but considerably less complex (higher
metrics) than the MRP (Figure 6). This trend is consistent between the entire data-set and
between the vocal data for the individual animals. The Shannon entropy metric of the
hyrax data fails to show any consistent trend. Given the small sample size in the real-world
data-set, it is not possible to draw conclusions about the speed of convergence of the
different metrics on these data.
Figure 3. (Colour online) Correlation of the error in the complexity metric estimate, to the varianceof the MRP Poisson repeat process l (averaged over all five characters) for (a) Shannon entropy, (b)Lempel–Ziv complexity and (c) entropy rate. All correlations are significant at p , 0.001.
Figure 4. (Colour online) Convergence of the complexity metrics with sampling effort, displayedas the relative change in the metrics, per additional 30 words sampled. Each panel shows theconvergence for different production models (ZOMP, FOMP and MRP), and the lines show themedian over all replicates for the different metrics (dotted: Shannon entropy; dashed: Lempel–Zivcomplexity; solid: entropy rate).
Bioacoustics 9
Dow
nloa
ded
by [
Uni
vers
ity o
f H
aifa
Lib
rary
] at
15:
13 2
2 O
ctob
er 2
013
Discussion
I found that Shannon entropy of individual characters appears to be a poor estimator of
sequence complexity. Although the Shannon entropy converges quickly, and accurately
estimates the true Shannon entropy of the production process, it does not provide a good
estimate of Kolmogorov (LZ) complexity for any production process tested. More
importantly, when applied to a real data-set, the Shannon entropy gives highly variable
results and does not provide insight into the statistical nature of the sequences. The
Lempel–Ziv metric appears a good candidate for estimating Kolmogorov complexity.
However, it converges slower than the other metrics and is likely to be inaccurate at
smaller sample sizes. The entropy rate metric converges well for all production models
and is a better estimator of Kolmogorov complexity than Shannon entropy. For the MRP
model, for which errors were highest for all metrics tested, the entropy rate is the most
strongly dependent on the renewal process l, probably because the large number of
repeats in an MRP with large l leads to a strongly non-Markovian sequence (Figure 1b),
and therefore one poorly characterized by the entropy rate (Figure 5). Handel et al. (2012)
found that a large number of repeated units in the song of the humpback whaleMegaptera
novaeangliae markedly reduce the estimated first-order entropy measure. In contrast, I
found that all three metrics overestimate the theoretical value in the case of the MRP
(Figure 2b), implying that the sequences are more random than they really are. This
difference in findings is almost certainly the result of the highly structured nature of
humpback whale song, in contrast to the less ordered hyrax song, and emphasizes the
importance of understanding the nature of song structure before interpreting a particular
complexity metric.
My examination of the hyrax vocal sequences showed that the entropy rate and
Lempel–Ziv metrics scaled much more similarly to that of the pure Markov processes
(zero- and first-order), than to the renewal process, and this may imply that the generation
process in hyrax vocal production has more in common with the Markov chain paradigm
than with the renewal or semi-Markov process. This tendency was consistent between
different individual animals, and across the entire hyrax data-set.
Researchers have long attempted to model animal vocal sequences as probabilistic
processes, e.g. Pruscha and Maurus (1979), and a logical step forward was to use
information-theoretic metric to quantify such sequences. Li (1991) attempted to describe
the relationship between ‘intuitive’ complexity and computational complexity (i.e.
Figure 5. (Colour online) Relationship of Shannon entropy and entropy rate, with Lempel–Zivcomplexity, each normalized to 1 by dividing by their maximum values. Each panel shows theresults for a different production model, ZOMP, FOMP and MRP. Shannon entropy is indicated bycrosses, and entropy rate by circles. The solid line indicates 1:1. Note that the scaling varies forclarity.
10 A. Kershenbaum
Dow
nloa
ded
by [
Uni
vers
ity o
f H
aifa
Lib
rary
] at
15:
13 2
2 O
ctob
er 2
013

entropy), for both Markov chains and regular languages, but observed that the relationship
is not one-to-one and that the deviations from a simple complexity–entropy relationship
depend on the details of the short-range correlations in a sequence. Several studies have
used entropy and other information-theoretic measures to describe animal communication
complexity (e.g. Da Silva et al. 2000; Ferrer-i-Cancho and McCowan 2009; Freeberg and
Lucas 2012), and the approach has even been proposed as a technique for searching for
extra-terrestrial intelligence (Doyle et al. 2011). However, the relevance of the whole
paradigm of an information-theoretic analysis of animal communication has been hotly
debated (Owren et al. 2010; Ruxton and Schaefer 2011). The use of some information
theory metrics such as Zipf’s law has not gained acceptance as a means of representing
information content (McCowan et al. 1999; McCowan et al. 2005; Suzuki et al. 2005).
Figure 6. (Colour online) Complexity metric measures for the three simulated data-sets, ZOMP(dotted line), FOMP (dashed line) MRP (dot-dash line), and for the real hyrax data-set (solid line), asthe sample size is varied. The first column shows the Shannon entropy, the middle column shows theLempel–Ziv complexity and the right column shows the entropy rate. The top row shows the resultsfor the entire hyrax data-set, while the three lower rows show examples from the vocalizations ofthree individual animals. Note that the scaling varies for clarity.
Bioacoustics 11
Dow
nloa
ded
by [
Uni
vers
ity o
f H
aifa
Lib
rary
] at
15:
13 2
2 O
ctob
er 2
013

Much of the controversy arises from misunderstandings of the role of information theory
metrics in describing proximal behaviour. The field of information theory was first
developed to quantify signalling efficiency over a noisy channel (Shannon et al. 1949),
rather than to assess behavioural complexity. When measures of entropy are used to
explain animal vocal complexity as a mechanism for communication reliability (e.g.
Doyle et al. 2008), little controversy exists. However, Shannon entropy seems a poor
metric for explaining behavioural complexity (Suzuki et al. 2005). Repertoire size has
been a standard and accepted measure of birdsong complexity (Berwick et al. 2011),
which is probably less appropriate for more diverse vocal sequences.
Conclusion
I have shown how different information-theoretic metrics behave quite differently when
used to describe artificial data-sets arising from different stochastic processes. As the
mechanism of generation of animal vocalizations invariably is unknown a priori, it
follows that selection of a comparative complexity metric is highly problematic. The best
advice is, if possible, to choose a complexity metric based on the behavioural hypothesis
being investigated. For example, if we want a measure of communication diversity, then
the Lempel–Ziv metric may be appropriate, although care must be taken to ensure a
sufficient sample size to allow for convergence. However, if we are interested in the
diversity of transitions in a sequence – as in many cases when investigating syntactic
diversity – entropy rate appears to be a good choice, as it captures the unevenness of the
transition matrix, and converges at small sample sizes.
Acknowledgements
Arik Kershenbaum is a Postdoctoral Fellow at the National Institute for Mathematical and BiologicalSynthesis, an Institute sponsored by the National Science Foundation, the U.S. Department ofHomeland Security and the U.S. Department of Agriculture through NSF Award #EF-0832858, withadditional support from The University of Tennessee, Knoxville. Part of this work was conductedwhile Arik Kershenbaum was provided with a doctoral scholarship by the University of Haifa.
References
Berwick RC, Okanoya K, Beckers GJL, Bolhuis JJ. 2011. Songs to syntax: the linguistics ofbirdsong. Trends Cogn Sci (Regul Ed) 15:113–121.
Bohn KM, Schmidt-French B, Schwartz C, Smotherman M, Pollak GD. 2009. Versatility andstereotypy of free-tailed bat songs. PLoS ONE 4:e6746.
Briefer E, Osiejuk TS, Rybak F, Aubin T. 2010. Are bird song complexity and song sharing shapedby habitat structure? An information theory and statistical approach. J Theor Biol 262:151–164.
Cane VR. 1959. Behaviour sequences as semi-Markov chains. J R Stat Soc Ser B Stat Methodol21:36–58.
Cappe O, Moulines E, Ryden T. 2005. Inference in hidden Markov models. New York: SpringerScience Business Media.
Catchpole CK, Slater PJB. 2003. Bird song: biological themes and variations. Cambridge:Cambridge University Press.
Cholewiak DM, Sousa-Lima RS, Cerchio S. 2012. Humpback whale song hierarchical structure:historical context and discussion of current classification issues. Mar Mamm Sci 29:E312–E332.
Chomsky N. 2002. Syntactic structures. 9th ed. The Hague: de Gruyter Mouton.Clarke E, Reichard UH, Zuberbuhler K. 2006. The syntax and meaning of wild gibbon songs. PLoS
ONE 1:e73.Cover TM, Thomas JA. 1991. Elements of information theory. New York (NY): Wiley.
12 A. Kershenbaum
Dow
nloa
ded
by [
Uni
vers
ity o
f H
aifa
Lib
rary
] at
15:
13 2
2 O
ctob
er 2
013

Da Silva ML, Piqueira JRC, Vielliard JME. 2000. Using Shannon entropy on measuring theindividual variability in the rufous-bellied thrush Turdus rufiventris vocal communication.J Theor Biol 207:57–64.
Denker M, Woyczynski WA. 1998. Introductory statistics and random phenomena: uncertainty,complexity and chaotic behaviour in engineering and science. Boston: Springer.
Doganaksoy A, Gologlu F, et al. 2006. On Lempel–Ziv complexity of sequences. In: Gong G,Helleseth T, Song H, editors. Sequences and their applications – SETA 2006. Berlin: Springer.p. 180–189.
Doyle LR, McCowan B, Hanser SF, Chyba C, Bucci T, Blue JE. 2008. Applicability of informationtheory to the quantification of responses to anthropogenic noise by southeast Alaskan humpbackwhales. Entropy 10:33–46.
Doyle LR, McCowan B, Johnston S, Hanser SF. 2011. Information theory, animal communication,and the search for extraterrestrial intelligence. Acta Astronaut 68:406–417.
Edmonds B. 1999. What is complexity? The philosophy of complexity per se with application tosome examples in evolution. In: Heylighen F, Aerts D, editors. The evolution of complexity.Dordrecht: Kluwer. p. 1–16.
Evans SC, Barnett B. 2002. Network security through conservation of complexity. IEEEProceedings MILCOM 2002:1133–1138.
Ferrer-i-Cancho R. 2006. When language breaks into pieces: a conflict between communicationthrough isolated signals and language. BioSystems 84:242–253.
Ferrer-i-Cancho R, McCowan B. 2009. A law of word meaning in dolphin whistle types. Entropy11:688–701.
Ferrer-i-Cancho R, McCowan B. 2012. The span of correlations in dolphin whistle sequences. J StatMech 2012:P06002.
Ferrer-i-Cancho R, Sole RV. 2003. Least effort and the origins of scaling in human language. ProcNatl Acad Sci USA 100(3):788–791.
Freeberg TM, Dunbar RIM, Ord TJ, Freeberg TM, Dunbar RIM, Ord TJ. 2012. Social complexity asa proximate and ultimate factor in communicative complexity. Philos Trans R Soc Lond B BiolSci 367:1785–1801.
Freeberg TM, Lucas JR. 2012. Information theoretical approaches to chick-a-dee calls of Carolinachickadees (Poecile carolinensis). J Comp Psychol 126:68–81.
Gentner TQ, Hulse SH. 1998. Perceptual mechanisms for individual vocal recognition in Europeanstarlings, Sturnus vulgaris. Anim Behav 56:579–594.
Gil D, Slater PJ. 2000. Song organisation and singing patterns of the willow warbler, Phylloscopustrochilus. Behaviour 137:759–782.
Green SR, Mercado P, III E, ack AA, Herman LM. 2011. Recurring patterns in the songs ofhumpback whales (Megaptera novaeangliae). Behav Processes 86:284–294.
Grinstead CM, Snell JL. 1997. Chapter 11 Markov chains. In: Grinstead CM, Snell JL, editors.Introduction to probability. 2nd ed. Providence (RI): American Mathematical Society. p. 405–470.
Handel S, Todd SK, Zoidis AM. 2012. Hierarchical and rhythmic organization in the songs ofhumpback whales (Megaptera novaeangliae). Bioacoustics 21:141–156.
Hausser J, Strimmer K. 2009. Entropy inference and the James–Stein estimator, with application tononlinear gene association networks. J Mach Learn Res 10:1469–1484.
Jin DZ. 2009. Generating variable birdsong syllable sequences with branching chain networks inavian premotor nucleus HVC. Phys Rev E 80:051902.
Jin DZ, Kozhevnikov AA. 2011. A compact statistical model of the song syntax in Bengalese finch.PLoS Comput Biol 7:e1001108.
Katahira K, Suzuki K, Okanoya K, Okada M. 2011. Complex sequencing rules of birdsong can beexplained by simple hidden Markov processes. PLoS ONE 6:e24516.
Kershenbaum A, Ilany A, Blaustein L, Geffen E. 2012. Syntactic structure and geographical dialectsin the songs of male rock hyraxes. Proc R Soc Lond B Biol Sci 279:2974–2981.
Lempel A, Ziv J. 1976. On the complexity of finite sequences. IEEE Trans Inform Theory 22:75–81.Leonardo A, Konishi M. 1999. Decrystallization of adult birdsong by perturbation of auditory
feedback. Nature 399:466–470.Li W. 1991. On the relationship between complexity and entropy for Markov chains and regular
languages. Complex Syst 5:381–399.
Bioacoustics 13
Dow
nloa
ded
by [
Uni
vers
ity o
f H
aifa
Lib
rary
] at
15:
13 2
2 O
ctob
er 2
013
McCowan B, Doyle L, Jenkins J, Hanser S. 2005. The appropriate use of Zipf’s law in animalcommunication studies. Anim Behav 69:1–7.
McCowan B, Hanser SF, Doyle LR. 1999. Quantitative tools for comparing animal communicationsystems: information theory applied to bottlenose dolphin whistle repertoires. Anim Behav57:409–419.
Nelson R. 1995. Probability, stochastic processes, and queueing theory: the mathematics ofcomputer performance modeling. New York: Springer Verlag.
Ord TJ, Garcia-Porta J, Ord TJ, Garcia-Porta J. 2012. Is sociality required for the evolution ofcommunicative complexity? Evidence weighed against alternative hypotheses in diversetaxonomic groups. Philos Trans R Soc Lond B Biol Sci 367:1811–1828.
Orlov YL, Potapov V. 2004. Complexity: an internet resource for analysis of DNA sequencecomplexity. Nucleic Acids Res 32(Suppl 2):W628–W633.
Owren MJ, Rendall D, Ryan MJ. 2010. Redefining animal signaling: influence versus information incommunication. Biol Philos 25:755–780.
Pollard KA, Blumstein DT. 2012. Evolving communicative complexity: insights from rodents andbeyond. Philos Trans R Soc Lond B Biol Sci 367:1869–1878.
Pruscha H, Maurus M. 1979. Analysis of the temporal structure of primate communication.Behaviour 69:118–134.
Robinson JG. 1979. An analysis of the organization of vocal communication in the titi monkeyCallicebus moloch. Z Tierpsychol 49:381–405.
Ruxton GD, Schaefer HM. 2011. Resolving current disagreements and ambiguities in theterminology of animal communication. J Evol Biol 24:2574–2585.
Sayigh L, Quick N, Hastie G, Tyack P. 2012. Repeated call types in short-finned pilot whales,Globicephala macrorhynchus. Mar Mamm Sci 29:312–324.
Shannon CE, Weaver W, Blahut RE, Hajek B. 1949. The mathematical theory of communication.Urbana: University of Illinois Press.
Shapiro AD, Tyack PL, Seneff S. 2010. Comparing call-based versus subunit-based methods forcategorizing Norwegian killer whale, Orcinus orca, vocalizations. Anim Behav 81:377–386.
Small M. 2005. Applied nonlinear time series analysis: applications in physics, physiology andfinance. Singapore: World Scientific Publishing Company Incorporated.
Suzuki R, Buck JR, Tyack PL. 2005. The use of Zipf’s law in animal communication analysis. AnimBehav 69:9–17.
Suzuki R, Buck JR, Tyack PL. 2006. Information entropy of humpback whale songs. J Acoust SocAm 119:1849–1866.
14 A. Kershenbaum
Dow
nloa
ded
by [
Uni
vers
ity o
f H
aifa
Lib
rary
] at
15:
13 2
2 O
ctob
er 2
013


![Real Arnold complexity versus real topological entropy for ...perso.neel.cnrs.fr/jean-christian.angles-dauriac/54-realarnold.pdf · The Arnold complexity [5], which corresponds (at](https://img.dokumen.tips/doc/110x75/5e6af0aabd322b687125c935/real-arnold-complexity-versus-real-topological-entropy-for-personeelcnrsfrjean-.jpg)