Embed Size (px)
Citation preview

Entrepreneurial Saving Practices and Business Investment:Theory and Evidence from Tanzanian MSEs∗
Thorsten Beck †
Cass Business School, LondonTilburg University
CEPR
Haki Pamuk ‡
Tilburg UniversityBurak R. Uras §
Tilburg University
February 11, 2014
Abstract
What is the relationship between entrepreneurs’ saving practices and their investment decisions?We present a simply stylized model that shows that entrepreneur’s business investment decisiondepends on the efficiency of her saving practice, in addition to the productivity, liquidity needs,and the borrowing capacity of the entrepreneurial firm. Utilizing a novel micro & small enterprisesurvey from Tanzania we test the empirical implications of this stylized model. We find that (1)saving for business purposes and entrepreneurial earnings reinvestment are positively related, and(2) the practice of saving in a deposit account of a formal financial institution is more likely tofoster reinvestment compared to the practice of keeping savings within the household. We alsoshow that the negative impact of saving within-household on investment is more pronouncedfor life-style entrepreneurs; and also for family members with inherently low intra-householdbargaining power - such as females and non-head household members. Our work contributes tothe recent debate on the implications of saving instruments in developing countries, and suggestswithin-household saving practice as a bottleneck to microenterprise performance.
Preliminary Draft
Keywords: Micro- and small enterprises; savings; reinvestment; Tanzania.
JEL Classification: D14; G21; O12; O16.
∗We wish to express our gratitude to the Financial Sector Deepening Trust (FSDT), Tanzania for kindly providingus with the main data set used in the study. We would like to thank Matreesh Ghatak, Michele Tertilt, BenediktGoderis, Daan van Soest, Gonzague Vannorenberghe, Christian Mpalanzi and FSD Tanzania, and seminar participantsat Tilburg Economics Workshop for valuable comments and suggestions. Haki Pamuk also would like to thank N.W.O.for financial support (N.W.O. grant number 453-10-001).This research was funded with support from the Departmentfor International Development (DFID) in the framework of the research project ‘Co-ordinated Country Case Studies:Innovation and Growth, Raising Productivity in Developing Countries’. All remaining errors are ours.†E-mail: [email protected]‡E-mail: [email protected]§E-mail: [email protected]
1

1 Introduction
In developing countries, intermediation costs and enforcement frictions constrain access to external
finance by micro and small enterprises (MSEs) - leaving entrepreneurs’ earning retention as a key
element for small business growth. But, what explains entrepreneurial decisions to reinvest in their
own businesses? Given the limited access to formal financial services, many entrepreneurs use infor-
mal mechanisms for saving, borrowing, and liquidity management. In this paper, we utilize a novel
dataset from Tanzania to explore whether entrepreneurial saving practices can explain variation in
entrepreneurs’ reinvestment decisions. Specifically, we gauge whether the decision to save with formal
financial institutions, individually (under the mattress), within the household or within informal ar-
rangements, such as ROSCAs, co-varies with the decision to reinvest. We motivate our empirical work
with a simple theoretical model that shows that an entrepreneur’s investment decisions depend on the
entrepreneur’s saving practice, in addition to productivity, liquidity needs and borrowing capacity of
the entrepreneurial firm.
Saving for business purposes should foster entrepreneurial reinvestment. However, the savings
mechanism might be critical for the ability to reinvest. On the one hand, for formal savers the
opportunity cost of consuming savings instead of reinvesting them is not only the loss of financial
reserves but also the foregone interest income. On the other hand, “within-household savers” might
be less likely to reinvest, because they suffer from the redistributive pressure on savings within the
household. If the remaining household members are aware of the existence of saving funds, it would
be hard to prevent the funds from being exploited for the general consumption needs of the household.
In between these two extremes are “individual savers” and “informal savers”, for whom we assume the
redistributive pressure to be less than for “within-household savers” but more than for formal savers as
there are fewer formal constraints for withdrawing their savings. Comparing “individual savers” with
“informal savers”, we note that although the interest income from informal finance network should have
an impact on the opportunity cost of consumption, the inflexibility to withdraw savings at informal
financial institutions might offset this income effect and reduce the implications on earnings retention.1
We present a simple theoretical model to show the relationship between entrepreneurial invest-
ment decision and savings practices. We show that entrepreneurs are more likely to invest in their
business if they save in a form with easy access to their savings, such as formal savings accounts or
personal savings forms. .
To test the empirical relationship between savings patterns and reinvestment decisions, we
1The rate of return to savings in social saving clubs is typically lower compared to formal financial institutions. Forrelated discussion see Vonderlack and Schreiner (2002) for a discussion. Entrepreneurs saving via informal channels aremore likely to have limited access to their savings. For instance, members of ROSCAs cannot access to their saving untiltheir turn comes (see Besley et al. (1993) for a theoretical discussion of ROSCAs), unless there is a relevant secondarymarket (Calorimis and Rajamaran, 1998). Similarly, moneylenders may postpone repaying the savings or it might behard to reach them.
2
use an MSE survey for over 6,000 entrepreneurs undertaken in 2010 in Tanzania. The sample of
entrepreneurs surveyed covers a large variety of enterprises in different locations, of different gender,
educational profile and sectors. We document that entrepreneurs’ saving practices do indeed co-
vary with the likelihood of earnings retention at MSEs. The survey design allows us to differentiate
between different savings vehicles, including within household savings, saving under the pillow, informal
savings club, and formal deposit accounts. Our results reveal that the probability of reinvestment
is significantly higher for savers and that when compared against formal deposit account holders,
entrepreneurs who give their savings to other household members to keep them safe are significantly
less likely to reinvest. Specifically, we find that when we compare the practice of keeping savings within
the household against the practice of having a deposit account at a formal financial institution, the
latter is more likely to stimulate earnings retention relative to the former.
We conduct a series of robustness checks to ensure the consistency of our results to the in-
clusion of additional control variables and alternative model specifications. Furthermore, to address
the potential reverse causation of high reinvestment on saving practices we utilize the distance to
the nearest bank and entrepreneur’s age as instruments in recursive bivariate probit regressions. We
use these two instruments, because accessibility to a bank and entrepreneur’s age are expected to
determine whether the savings will be kept in a bank account or shared with the rest of the house-
hold. The coefficient estimates remain stable and significant across all specifications. Finally, we
explore the differential effects of saving patterns on reinvestment decision across groups with different
intra-household bargaining power and different entrepreneurial motivations. We find that the neg-
ative relationship between savings within the household and reinvestment decisions is stronger for
entrepreneurs with lower intra-household bargaining power, such as females and non-household heads,
and for entrepreneurs who run their own business out of lack of alternatives.
Tanzania is a perfect setting to test the relationship between different saving practices and
entrepreneurial investment decisions. Tanzania is a low-income country in East Africa, whose private
sector is dominated by micro- and small enterprises. While the financial sector was liberalized in the
1990s and there is a large number of formal financial institutions, access to formal financial services is
very low, with only 17% of adults having a formal bank account (World Bank, 2012). Tanzania shares
many characteristics with other low-income countries in Africa, including a very disperse population
and a high degree of informality.
This paper relates to several distinct literatures. First of all, our study investigates the role of
saving practices on business investments in addition to previous studies investigating the determinants
of business investment. Past research on finance and entrepreneurial investment has shown that
entrepreneurs invest more if they expect high private returns from their investment activity (e.g.
Demirguc-Kunt and Maksimovic, 1998; Johnson, McMillan and Woodruff, 1998). Moreover, there are
several studies investigating the impact of access to external finance on investment for microenterprises
(Karlan and Zinman, 2010a; Karlan and Zinman, 2010b; Kaboski and Townsend, 2011; Attanasio et
3

al., 2012 and Banerjee et al., 2013). We add to this literature by focusing on saving patterns as
additional factor explaining variation in reinvestment decisions across micro- and small entrepreneurs.
Our most important contribution is to the growing literature concerning the implications of
access to different saving instruments in developing countries. There are increasing number of studies
exploring the impact of access to formal banking services and how it affects the level of savings
(Burgess and Panda, 2005; Kaboski and Townsed, 2005; Dupas and Robinson, 2013a). A recent
experimental study by Dupas and Robinson (2013a) shows that savers in formal bank accounts save
and invest more to their businesses than the entrepreneurs who do not save in formal banks. In a
companion study (Dupas and Robinson, 2013b), they compare the health investment performance of
the women saving via various informal saving instruments and find that some of them boost investment
in health. Similarly Brune et al. (2013) evaluate the effect of commitment savings accounts on several
outcomes for Malawian cash crop farmers. We contribute to this literature by comparing the investment
likelihood of formal savers with different types of informal savers such as individual savers, savers via
other household members, ROSCA, informal savings club members and moneylenders.
Our paper also relates to literature on barriers to savings in developing countries (see Karlan,
Ratan and Zinman, 2013, for an overview). In addition to geographic, monetary and regulatory
barriers, there are significant social constraints on savings behavior, partly related to the position of
the entrepreneur within the household. Previous research has linked participation in informal savings
services, such as ROSCAs to intra-household bargaining problems (e.g., Besley et al. 1993; Anderson
and Baland, 2002). Social constraints can also explain why entrepreneurs save and borrow at the same
time. Critically, the literature has shown that the relative position within the household is important
for savings and investment decisions. For instance, de Mel et al (2008) show that as the decision
making power of women in the household increases returns to capital and investment for women
increase as well. Ashraf (2009) in a lab experiment in Philippines documents that subjects are more
likely to save the randomly allocated money in their private deposit accounts when their spouse is not
aware of the money, while they prefer to consume when the spouse knows about it. Evidence from an
experimental study with 142 married couples in Kenya showed that husbands spend privately more
when they receive an income shock. But when their wives receive the shock they do not increase their
consumption (Robinson 2011). Likewise Schaner (2013) find that well matched Kenyan couples are
more likely to use joint accounts instead of costly individual ones. Our study supports these findings
by showing that members of the household who have potentially less power in decision making are less
likely to turn their household savings into investments.
Unlike many other papers in this literature that discuss randomized control trials (RCTs), our
paper relies on cross-sectional survey data and thus faces the usual endogeneity biases. We address
these concerns by using instrumental variables and by exploring the differential relationship between
savings patterns and reinvestment decision across different entrepreneurial groups. Beyond these
methodological differences, however, our analysis also allows a broader exploration of reinvestment
4

decisions across different savings patterns. In addition, we realize that such savings patterns are the
outcome of repeated interactions and persistent habits and are thus harder if not impossible to control
under a randomized control trial.
The rest of the paper is organized as follows. Section 2 presents a simple model to show how
saving practice can influence entrepreneurial investment decisions. Section 3 discusses the regression
set-up and the set of control variables. Section 4 presents the data we use for our analysis. Section 5
discusses our main findings, while section 6 discusses the determinants saving choice, test for reverse
causality and heterogeneity in the estimates. Section 7 concludes.
2 A 2-Period Model
We develop a partial equilibrium heterogeneous firms model to study the interactions between en-
trepreneurial savings and profit reinvestment. In our model entrepreneurial heterogeneity has four
dimensions: productivity, liquidity needs, borrowing capacity, and saving practice. In the benchmark
model all of these four dimensions are exogenous. We also extend the benchmark model in section
2.5, where we endogenize the saving practice as an entrepreneurial decision. In the following, we first
present the economic environment, and then entrepreneur’s maximization problem, before deriving
the optimal investment behavior. This allows us to derive several testable hypotheses.
2.1 Environment
There are two time periods, 1 and 2 ; a continuum of entrepreneurs indexed by i; and a good - call
it cash - that can be invested, saved or consumed. Entrepreneurs have linear preferences over the
life-time consumption such that
Ui = c1,i + βc2,i, (1)
where U is the life-time utility and c1 and c2 are consumption levels in period 1 and in period 2
respectively. Letting the rate of return from postponing consumption from period 1 to period 2 be
denoted with ρi, the optimal consumption plans implied by (1) are described as:
c1,i > 0, c2,i = 0 if ρi <1
β,
c1,i = 0, c2,i > 0 if ρi >1
β. (2)
Entrepreneurs are entitled to operate a technology that could generate Aik1,i units of cash-flow at the
end of period 2 for each unit of k1,i invested in period 1 - where Ai > 1 captures the productivity
heterogeneity across entrepreneurs. A high Ai can be associated with better training, education or some
5

sort of intrinsic ability to manage a firm. The realization of the investment cash-flow is conditional on a
liquidity injection that needs to be incurred at the beginning of period 2. Specifically, entrepreneur i’s
technology yields Aik1,i plus an additional `2,ik1,i if and only if the entrepreneur is capable of injecting
a firm-specific L2,i = `2,ik1,i units of cash into his business at the beginning of period 2, with `2,i < 1.
If the entrepreneur fails to inject the working capital, the technology does not yield any return. To
summarize, the entrepreneurial technology has the following specification:
y2,i = Aik1,i + `2,ik1,i if L2,i = `2,ik1,i,
= 0 otherwise. (3)
We assume that `2,i is deterministic and is publicly known at the beginning of period 12. In this
production function formulation, `2,i captures the expected liquidity needs - for instance working
finance requirements of the business - whose size does not affect the return on investment projects
as long as it can be financed at the beginning of period 2. We assume that both A and ` are drawn
independently and identically from a cumulative distribution at the beginning of the period 1.
The capital investment in period 1 is financed by the entrepreneur’s endowment ω - which we
assume to be homogeneously distributed among all entrepreneurs in the economy. We do not allow
for borrowing at the period 1 capital investment stage because our aim is to understand the dynamics
behind the probability of earnings retention - reinvestment - at entrepreneurial firms.
The liquidity need L2,i can be financed via two sources:
1. The entrepreneur can borrow, denote it with b2,i, up to a θi fraction of L2,i in the financial market
at a real interest rate 1, where θi is an entrepreneur specific parameter capturing the ability to
raise liquidity - working capital - finance externally. The borrowing capacity θ is drawn from a
cumulative distribution function at the beginning of the period 1.
2. The entrepreneur can save cash from period 1 to period 2, which we will call saving for business
purposes denoted by s1,i, at a rate ζi with ζi ≤ 1. In this formulation, ζi captures saving practice
(in)efficiency of the entrepreneur. We assume that there are two general saving practice types:
Formal (ζF ) and informal (ζI) - to be endogenized in section 2.5. We suppose that ζF = 1 for
those who save formally, whereas ζI is heterogeneous among entrepreneurs with ζI < 1 for all
I individuals who save informally. The heterogeneity in informal saving (in)efficiency can be
motivated, for instance, by the cross-sectional variation in within-household bargaining power,
as we will discuss below.
To summarize, the timing of events in both periods is specified as the following:
2The qualitative features of the model would remain identical if we assumed stochastic liquidity shocks which mate-rialize at the beginning period 2.
6

I. Period 1
1. Entrepreneurial (4-dimensional) types are realized.
2. Capital investment into the production technology.
3. Saving for business purposes.
4. Period 1 consumption.
I. Period 2
1. Borrowing to finance liquidity needs.
2. Liquidity injection: Using borrowed funds and savings from period-1.
3. Cash-flow realization from the production technology.
4. Period 2 consumption.
We would like to note that in this model the exact timing of k investment is not too essential.
All we need is that k is invested before the liquidity injection is made. This means allowing parts
of the savings for business purposes s to finance k, which can be reached by changing the timing of
events (2) and (3) in period-1 timeline, will not alter the qualitative properties of the model that we
highlight in section 2.4.
2.2 Feasibility Constraints
The endogenous variables in this model are c1,i, c2,i, k1,i, and s1,i. Entrepreneurs maximize life-time
preferences delineated at (1) - with respect to the endogenous variables - subject to the following
constraints:
c1,i + k1,i + s1,i ≤ ωi, (4)
c2,i ≤ Aik1,i + s1,iζi, (5)
where (4) and (5) are the budget constraints for period 1 and period 2 respectively.
An immediate implication of this set-up is that if and only if ki > 0, the entrepreneur forecasts
that there will be sufficient capacity to finance future liquidity needs. Therefore, iff ki > 0 we have
7

two additional constraints that need to hold:
L(k1,i) ≤ s1,iζi + b2,i, (6)
θiL(k1,i) ≥ b2,i. (7)
The inequality (6) is the constraint that ensures that there is sufficient liquidity at the beginning of
the period 2 - financed by saving for business purposes (siζi) and borrowing (bi). The inequality (7)
is the borrowing constraint associated with the working capital finance.
2.3 Optimizing Behavior
The qualitative properties of this model are as follows. Entrepreneurs who choose a k1,i > 0, exhaust
their borrowing limit θi. This is implied by the assumption that saving is inefficient (ζi < ζF = 1) in
this economy for informal type of saving practices. Therefore,
b2,i = θiL(k1,i), (8)
as long as ζi < 1.
Then using (6) with equality we get:
s1,i =
(1− θiζi
)L(k1,i). (9)
Equation (9) implies that the lower ζ the higher is the amount saving for business purposes - for those
entrepreneurs who choose to invest. But, as we show below a low ζ implies a low likelihood of earnings
retention and as a result a low likelihood of saving for business purposes.
Using (9) in budget constraints (4) and (5) yield:
c1 = ωi − k1,i −(
1− θiζi
)L(k1,i), (10)
c2 = Aik1,i + (1− θi)L(k1,i). (11)
Finally, using (10), (11) and the optimal consumption plans from (2) we can show that the
entrepreneur chooses to invest (ki > 0) in period 1 if and only if:
ρi =Ai + (1− θi)`i1 + `i
(1−θiζi
) >1
βi(12)
8
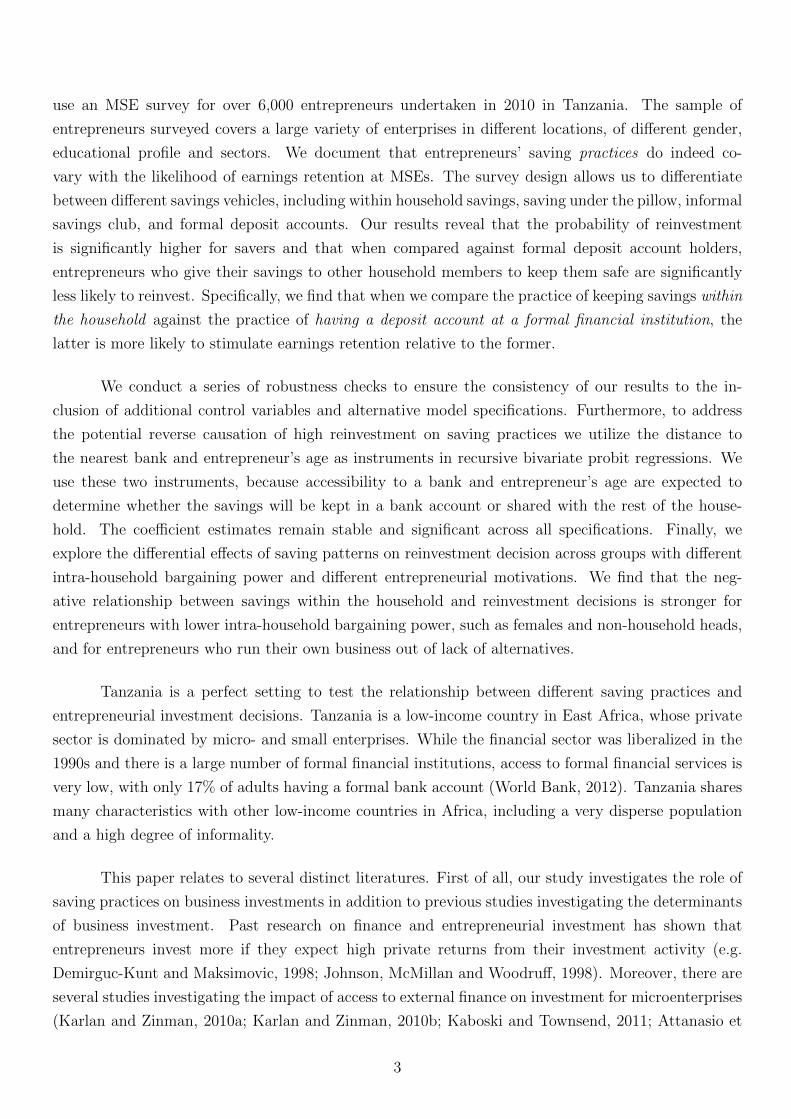
2.4 Empirically testable implications of the model
Applying comparative statics at (12) we derive the key empirically testable implication of the model
in the following proposition:
Proposition 2.1 Entrepreneurs with an efficient saving practice (high ζi) are more likely to invest.
Proof Taking the first-partial derivative of ρ with respect to ζ we can see that:
∂ρ
∂ζ=
(1
ζ2
)`(1− θ)(A+ (1− θ)`)[1 + `
(1−θζ
)]2 > 0.
That the (in)efficiency of an entrepreneur’s saving practice raises the likelihood of earnings
reinvestment will be the key hypothesis of our empirical analysis. However, in order to deepen the
empirical validity of our theoretical model, we also provide the following set of propositions.
Proposition 2.2 Entrepreneurs with a high borrowing capacity (high θi) are more likely to invest.
Proof Taking the first-partial derivative of ρ with respect to θ:
∂ρ
∂θ=
`(Az− 1)[
1 + `(
1−θζ
)]2 > 0.
where z = 1−θζ2
.
Proposition 2.3 Productive entrepreneurs (high Ai) are more likely to invest.
Proof Taking the first-partial derivative of ρ with respect to A:
∂ρ
∂A=
1
1 + `(
1−θζ
) > 0.
Proposition 2.4 Entrepreneurs with a low liquidity need expectation (low `i) are more likely to invest.
9

Proof Taking the first-partial derivative of ρ with respect to ` we can see that:
∂ρ
∂`= −(1− θ)
Aζ− 1[
1 + `(
1−θζ
)]2 < 0.
In our regression equations we will control for a vector of variables to test the empirical fit our
model to the data based on the theoretical results we obtained in propositions 2.2 through 2.4.
2.5 Endogenizing the Saving Practice
Our theoretical model implies that if an entrepreneur’s saving practice is inefficient, then she is induced
to save a lot which makes postponing consumption from period 1 to period 2 inefficient. Therefore,
saving practice of an entrepreneur is likely to be an endogenous variable, where the decision to save
formally might be a costly action.
Suppose, there are two saving options available for an entrepreneur as spelled out previously
- formal and informal. In order to be able to save formally the entrepreneur needs to sacrifice a
utility loss worth of ψi units of consumption for each unit of fund deposited formally. The utility loss
might be due to social costs (e.g. hiding savings from family members at a bank account) or physical
costs (e.g. transportation costs) as well as idiosyncratic factors. The efficiency of the formal saving
practice is denoted with ζF and the efficiency of the informal saving practice is denoted with ζI , where
ζF = 1 > ζI for all I individuals who save informally.
Using equation (12), an entrepreneur i is willing to save formally if and only if
ρF − ρI = (Ai + (1− θi)`i)
1
1 + `i
(1−θiζF
) − 1
1 + `i
(1−θiζI
) > ψi, (13)
which would hold if (a) the entrepreneur has a low cost of accessing a formal financial institutions
and/or (b) a high enough productivity, high liquidity needs and limited access to borrowing.
2.6 Impact Heterogeneity
The entrepreneurial (in)efficiency associated with informal saving practice is expected to be a function
of accessibility to savings. Such accessibility constraints could be related to the repayment structure
for the case of informal saving networks (e.g. Rotating-Saving-and-Credit-Associations) and within
household bargaining power for the case of in-household savings. This implies, for instance, that
10

entrepreneurs with low household bargaining power would have a lower ζI . The bargaining power of
an individual could vary according to the position of the individual in the household in developing
country contexts. Because of social norms and pressure, for instance female household members,
children, and siblings are naturally at a more disadvantageous position than males and household
heads in terms of claiming from the common resources of the household. They are less likely to
claim money from the common savings pot of the household to finance their liquidity needs thereby
reinvesting less likely. We will utilize this intuition in our sample-split empirical analysis in section 6.
3 The Empirical Methodology
We test the hypotheses derived from the theoretical model with a dataset on Tanzanian MSEs. To test
whether saving practices affect the decision to reinvest, we use the binary outcome variable reinvest,
which equals 1 if the entrepreneur invests some of the profits back into business, and estimate the
following probit model:
Reinvesti = α + β′Si + γ′Controlsi + εi, (14)
where i denotes the entrepreneur, S is a vector of saving practices comprised of dummy vari-
able(s) which takes the value of 1 if the entrepreneur has the corresponding saving practice (see below
for details) and ε is the error term. The vector of control variables included in the benchmark regres-
sion is composed of an array of entrepreneurial and enterprise characteristics that we discuss in the
following.
First, in line with our theoretical model, we control for firms’ past borrowing history. Specifi-
cally, Borrowed is a dummy variable which takes the value of 1 if the entrepreneur has ever borrowed
to cover business needs. Businesses that do have access to external finance are expected to reinvest
more frequently even in the absence of regular entrepreneurial savings. Second, we conjecture that
entrepreneurs with a higher household income can save more and as a result reinvest more often. To
control for the income effects, we use self reported monthly personal income levels.3
Third, in line with our theoretical model, we control for liquidity needs of the business. We
expect businesses with high liquidity needs to be less likely to re-invest as they should put aside more
resources to finance their operational needs. We use the share of variable expenses (in August, 2010) in
the sales of business at a normal month as a proxy for the need of liquidity.4 Fourth, entrepreneurs with
3Each respondent is asked which income range (e.g. TSHS 35 001 - TSHS 40 000 per month) describes their incomelevel best. We use median of that range (e.g. TSHS 37500.5) as the income level of the respondent.
4Variable expenses comprises of money spent for business purposes on wages for labour, transport, insurance, fi-nance/loans (repay loans), rent for premises, mobile phone costs, water, landline telephone, electricity. We trimmed the
11

a high human capital are expected to be more committed to business growth, and to have higher rates
of earnings retention. We use the highest level of formal education completed by the respondents, as
well as an indicator of entrepreneurial training, as this should matter for expected business performance
and reinvestment behavior.
Fifth, we control for gender and marital status, as both can influence investment decisions.
Specifically, we expect female entrepreneurs to face more claims on their income from spouse and
family members. Similarly, married entrepreneurs might face more claimants on the business profits
and might therefore be less likely to re-invest them. Finally, we include sectoral dummies to control
for sectoral performance that might explain reinvestment heterogeneity, as well as regional dummies
to control for geographic heterogeneity in profitability and reinvestment.
We empirically explore the relationship between specific forms of savings and the likelihood
of reinvestment. Specifically, our survey allows us to identify two types of saving practices among
Tanzanian entrepreneurs which we classify as follows:
1. Save formal : This practice includes the entrepreneurs who save their funds at formal financial
institutions such as commercial banks, microfinance institutions or saving & credit cooperatives.
2. Save informal : We consider entrepreneurs who do not save formally in this group.
This separation corresponds to the control-treatment group set-up of many randomized con-
trol trials that assess the impact of using formal saving products on household and entrepreneurial
outcomes. In addition, however, our survey allows a finer classification to exploit the considerable
heterogeneity in terms of informal saving practices. Therefore we first divide saveinformal into two
groups and distinguish individual saving practices and practices involving interaction with other people
as follows:
1. Save informal individually : A large fraction of entrepreneurs in Tanzania save their funds only in
a secret hiding place or piggy bank.5 We classify this behaviour as “informal individual saving”
practice.
2. Save informal with others : We classify the practices of saving funds via informal saving clubs,
such as ROSCAs, or moneylenders or within household savers under “saving with others”. We
do not include respondents who also save formally in this group.
data for shares in the 1% percentile because of potential wrong entry. Not to lose extra observations. We replaced themissing values with 0 and add a dummy to all regressions equals to 1 if that value was missing. Our main results aresimilar without trimming and missing variable correction.
5Piggy bank is a coin container.
12

To distinguish whether our entrepreneurs save through people living in the household or people
who are not member of a household, we decompose the practice of “Save informal with others” further
into two groups.
1. Save with household member : The group comprises of entrepreneurs who gave their funds to
other household members to keep it safe.
2. Save with people outside household : The group contains entrepreneurs who save through ROSCAs
or moneylenders.
We again conjecture that entrepreneurs in the second group have more control over their savings
than entrepreneurs in the first group, especially if they have limited intra-household bargaining power.
In our regression analysis, we will use a dummy variable for each saving practice above (see Table 1
below for the descriptions) and work with different samples to compare both savers and non-savers
but also different groups of savers in their reinvestment behaviour.
4 The Data
The dataset is based on a novel enterprise survey conducted at the MSE-level in Tanzania. The survey
data was collected by the Financial Sector Deepening Trust Tanzania in 2010 from a nationwide
representative cross-section of 6,083 micro and small enterprises. The respondents of the questionnaire
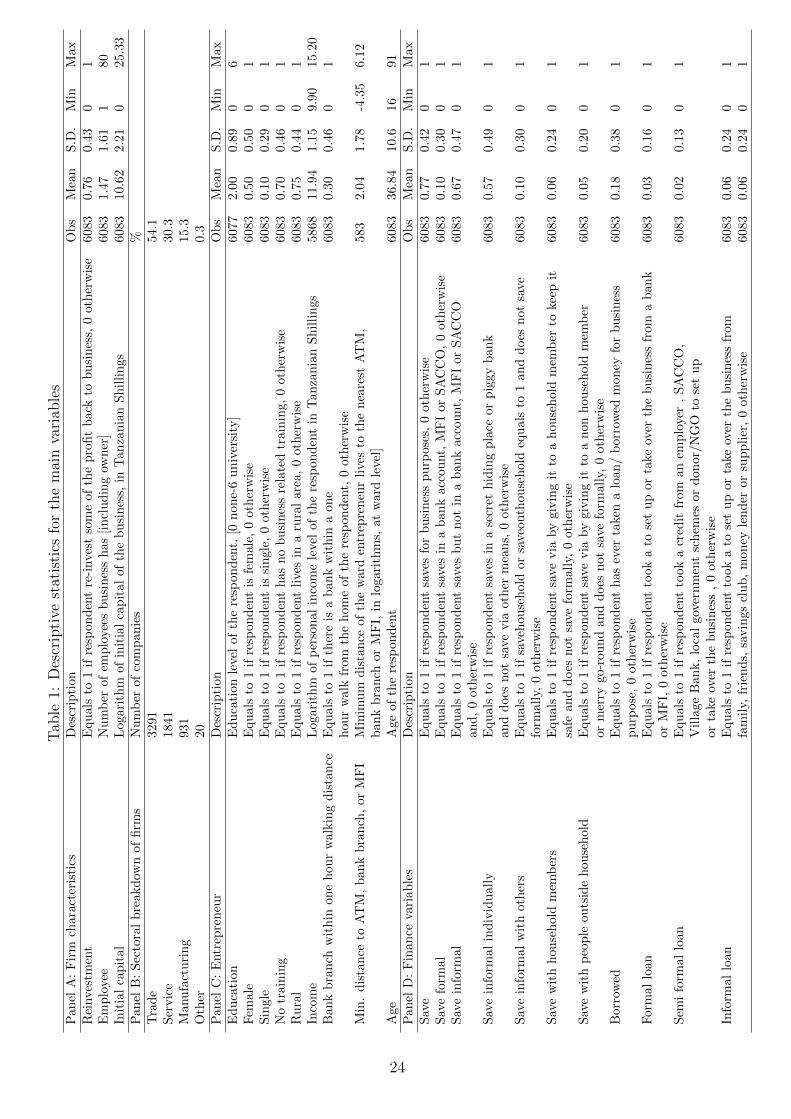
are entrepreneurs with an active business as of September, 2010. Table 1 presents both detailed
definitions of the variables and descriptive statistics of the sample.
- Table 1 about here -
The descriptive statistics in Panel A of Table 1 shows that the average number of employees
among Tanzanian MSEs is 1.5 workers, ranging from one (i.e. self-employed) to 80 employees.6 How-
ever, 97% of entrepreneurs are self-employed. The median initial capital is about 35 USD and average
monthly sales are 149 USD. The key question which we exploit to capture entrepreneurs’ earnings
retention asks whether the respondent reinvests some of the profits back into business. As we present
in Table 1, 76% of the sample entrepreneurs engage in earnings retention.
6The relationship between business owners’s saving and re-investment decisions might be weak in large businessesbecause of managerial layers. We test consistency of our main result by excluding the businesses larger than 10 fromour sample. Estimates reported in Table 3 do not change
13

The sectoral breakdown in Panel B of Table 1 exhibits substantial variation: 54% and 30% of
the businesses operate in the trade and service sectors, respectively, while 15% of enterprises operate
in manufacturing.
Panel C of Table 1 presents characteristics of entrepreneurs and enterprises. About 50% of
the entrepreneurs in the sample are female, 10% of the entrepreneurs are single. 30% of the sample
entrepreneurs received business related training, and about 87% of the entrepreneurs have less than
completed secondary education. 75% of the enterprises are located in rural areas. The median monthly
personal income of entrepreneurs is 106 USD.
Panel D of Table 1, finally, presents our variables and descriptive statistics on the financing
patterns of enterprises in our sample. Only 18% of all sample entrepreneurs ever borrowed for business
purposes; 3% of entrepreneurs in the sample from a bank of MFI, 2% from a semi-formal financial
institution, such as a SACCO or village bank and 6% from an informal source, such as money lenders,
savings club or family and friends.
Savings, on the other hand, are much more common among the entrepreneurs in our sample.
We utilize an extensive margin question asking whether the entrepreneur saves for business purposes,
and distinguish savers from the rest of the population: 77% of the entrepreneurs in the sample save for
business purposes. However there is considerable heterogeneity among saving practices of Tanzanian
entrepreneurs. Informal individual saving is the most popular practice among Tanzanian entrepreneurs.
75% of the savers save informal-individually whereas around 13% of them save formally. Likewise, 13%
of the savers do not save at a formal financial institution and instead they save their funds via people
outside the household such as members of ROSCAs and moneylenders or give them to household
members.
Table 2 presents a correlation matrix concerning the variables of interest for our analysis. The
key variables such as “being a saver” and “retaining earnings within the business” exhibit a strong
correlation. However, the sign of the relationship seems to be dependent on the saving practice of the
respondents. In particular saving via others seems to be negatively correlated with firm reinvestment
whereas formal and informal individual savers have higher reinvestment rates. We also note a high
correlation among other firm characteristics, such as borrowing and saving activity.
- Table 2 about here -
14

5 Saving Habits and Reinvestment: Baseline Results
Table 3 reports the marginal effects for the benchmark regression. We use heteroscedasticity robust
standard errors and report the standard deviations associated with coefficient estimates in parentheses.
- Table 3 about here -
The results in the first column show that the probability of reinvestment is higher for both
groups of savers compared to non-savers. Specifically, ceteris paribus, the reinvestment probability of
an average Tanzanian MSE who saves informally is around six percentage points higher than for an
entrepreneur who does not save, while the reinvestment probability of an average Tanzanian MSE who
saves formally is around nine percentage points higher. We also find that entrepreneurs with access
to formal loans are more likely to reinvest, while formal business training increases the likelihood
of reinvestment in business projects. Female and married entrepreneurs are less likely, while richer
entrepreneurs are more likely to invest. Moreover, entrepreneurs with higher liquidity needs, as proxied
by variable expenditures, have a lower likelihood of re-investment. Overall, these results are consistent
with our theoretical predictions as discussed above and the existing literature.
Our empirical analysis, so far, stresses the significance of entrepreneurial savings to foster
entrepreneurial reinvestment in business projects and we confirmed that saving related correlations
are in line with the findings in the literature. In the next step, we focus on our main research question
and we deepen our analysis by studying the implications of saving practices on reinvestment. In
order to test the predictions from our theoretical model, in this section we rank saving practices
based on their vulnerability to consumption temptations - as we discussed above - and investigate
the implications of the variations in saving methods on the probability to reinvest. Specifically, we
rank the “within household savers” as the group for whom the vulnerability to consuming savings
is the highest. On the other extreme, we expect the most committed savers to be ”formal savers”
due to the highest opportunity cost of consumption - resulting from the foregone interest income.
Finally, comparing “informal individual savers” with “informal savers with others”, we conjecture that
although the redistributive pressure problem is expected to be higher for the former, there would be
a potential inflexibility to withdrawing savings when needed associated with the latter.
To investigate the effects of individual saving practices on earnings retention we limit our sample
to savers and thus drop respondents who do not save.7 The results in column 2 show that “formal
savers” are four percent more likely to retain earnings than the “informal savers”. The results in
columns 3 show that entrepreneurs that save with others are less likely to reinvest than entrepreneurs
7Dropping respondents during the analysis from our sample do not bias our results although some regions and othersector groups drop because of perfect prediction of the regional dummies. When we estimate our model for the samesectors and regions for our 5 baseline estimations, our results are still robust.
15

that save formally.8 Also, entrepreneurs who save informally but individually are not significantly less
likely to reinvest when compared to “formal savers”.
Finally, we focus on the group of respondents who save with others. We separately study the
investment likelihood of household savers and respondents who save outside the household compared to
the investment probability of formal savers. The regression in column (4) keeps only formal savers and
household member savers in our sample, while the regression in column (5) keeps only formal savers
and outside household savers in our sample. In both cases, we gauge the difference in reinvestment
behaviour relative to formal savers. Therefore, the total numbers of observations in these two regres-
sions are 877 and 774 respectively. Confirming our conjecture, we cannot reject the null hypothesis
that “with household member savers” reinvest less frequently compared to “formal savers”, at the 5%
level. Furthermore, we also show that, although the coefficient estimate of Save with people outside
household variable in the last regression is not significant, the negative coefficient sign is consistent
with the argument that the inflexible withdrawal opportunity of “informal savings” might be a barrier
to earnings retention.
In summary, our results suggest that informal saving practices are associated with significantly
lower likelihood of profits reinvest compared to formal saving mechanisms. It is important to note that
the difference in reinvestment probability between formal and informal savers is mainly driven by the
inefficiency of within-household savers in converting savings into investment.
In Table 4, we test the robustness of our key result concerning the difference in reinvestment
likelihood between formal and within household savers (see column (4) in Table 3) with respect to the
inclusion of a vector of additional control variables. First, we add specific dummy variables for different
sources of external finance at the start-up of the enterprise: formal, semiformal and informal loans. Our
indicator for external finance may not capture the potential implications of access to different sources
of finance for reinvestment decisions. Getting loans from a formal financial institution might require
a bank account and facilitate formal entrepreneurial savings. However, none of the external financing
variables that we include have significant explanatory power for reinvestment likelihood. Second, we
control for entrepreneurial types by utilizing the answers of to the following survey question “why did
you go to business?”9 As evidenced in the previous literature (Bruhn and Zia 2011), transformational
type entrepreneurs are expected have higher rates of investment profitability and earnings retention
8Here we consider entrepreneurs who have both types of informal saving practices, “saving informal individually”and “saving informal with others” inside “save informal with others” group. When we estimate specification in column-3 by adding a separate dummy for individuals having both practices and saving only informal with others togethersaving informal individually, estimates for the first two groups including saving practices with others are negative andstatistically significant showing that our results are robust.
9Entrepreneurs selected from a list of statements to indicate why they went into business. Multiple choices wereavailable. The answers include: I was fired / lost/retrenched from a previous job; I couldn’t find a job elsewhere; Tosupport me / my family; To try out a business idea; I believe I can make more money working for myself than forsomeone else; I had nothing else to do/no other means of survival/no better option; parents / relatives were in business;I saw a good opportunity; I have always wanted my own business; I was encouraged by friends and relatives; I neededto supplement my income; Others, please specify.
16

rate compared to survival type entrepreneurs. While we do not report the individual dummy variables,
some variables enter significant at the 5% level. Third, we add dummy variables to control for the
type of the activity the business conducts. The activity of the business (e.g. buying and re-selling
it; buying, adding value and re-selling it, providing a service etc.) may change the definition of re-
investment for business owner and timing of the reinvestment. For instance, they may be different for
a restaurant owner and market vendor. To control for this factor, we include answers to the question
“what does business do?” as dummy variables.10 Fourth, we include the size of the logarithm of the
initial start-up capital, the logarithm of current sales per employee, logarithm of duration business and
logarithm of number of workers since these size gauges are expected to determine the growth potential
of a business- and hence the profitability of reinvestment. We also control for rural vs. urban location
of the enterprise, as the accessibility to infrastructure might affect expectations and derive variations
in reinvestment rates. Including all of these control variables does not affect our key empirical finding.
Finally, in column (2) we replace the region fixed effects with district fixed effects to ensure that
we are capturing geographical variations well enough that could explain the probability of reinvestment.
While our sample becomes smaller, our findings remain.11
- Table 4 about here -
6 Saving Choice, Reverse Causality and Heterogeneity
While controlling for other enterprise and entrepreneurial characteristics reduces the risk that the
relationship between savings patterns and the likelihood of reinvestment is a spurious one, we cannot
exclude the possibility that our relationship is driven by other sources of endogeneity, including reverse
causation. As we shown in our theoretical model, entrepreneurs that are more willing to reinvest might
look for savings patterns that ease up their investment efforts. In the following, we focus on the sample
of formal and within-household savers one more time since our key result from the empirical analysis
of section 5 is that “within household savers” are less likely to re-invest than “formal savers”. For this
sample, we investigate the relationship between entrepreneurial saving choices and characteristics, and
then offer a test to alleviate endogeneity concerns.
To investigate the determinants of saving choice, we replace the dependent variable reinvest with
save within household in (1) and regress it on our list of control variables as well as two additional
10We include 4 separate dummy variables for the businesses buying and selling goods; buying, adding value and sellinggoods; making and selling goods; providing service; and other activities including agricultural ones. Note that when weinclude district fixed effects the total number of observations in the regression decreases to 650 because some districtsare excluded from the regression due to perfect prediction.
11Note that when we include district fixed effects the total number of observations in the regression decreases to 650because some districts are excluded from the regression due to perfect prediction.
17
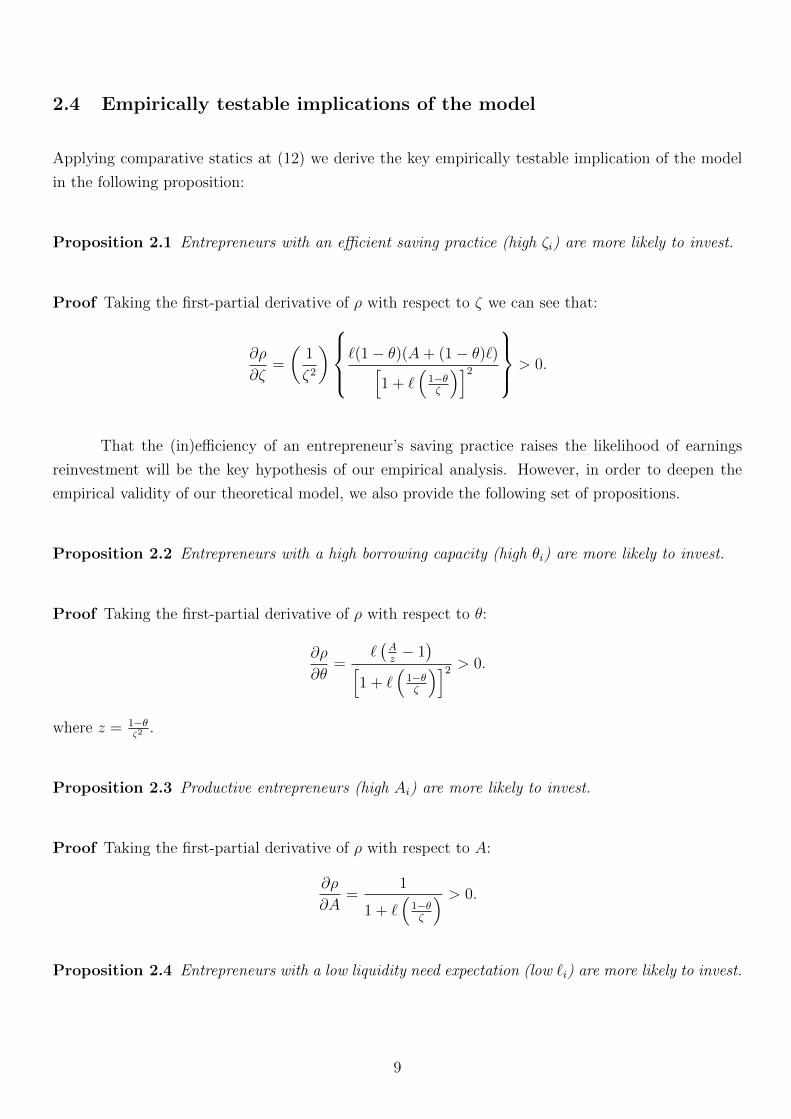
measures: Age of the entrepreneur and distance to bank. Age reduces the possibility of being forced
to share savings “within the household”; therefore older agents might be more likely to save formally.
The distance to the nearest bank is expected to increase accessibility of “formal savings services”. We
estimate two models with two different measures of distance to formal financial institutions. The first
one is a subjective distance measure constructed by using the question from the survey: Is there any
bank branch in one hour walking distance to your house? However, there might be a concern regarding
the subjective measure, as entrepreneurs who search for formal savings instruments are also those who
are more likely to know the existence of a bank in the close proximity. Therefore, the correlation
between the search intensity and some unobserved characteristics may bias our results. In this reason,
we estimate a model with an additional objective distance measure, logarithm of ward level minimum
distance to the closest bank branch, MFI or ATM in 2013 which we constructed by data from Financial
Services Maps12.
Table 5 reports the regression estimates for the saving practice choice. In columns (1) and
(2) we present the results for models including subjective and objective measures respectively. As we
conjecture, the likelihood of saving with household members is higher when entrepreneurs are closer to
banks. Moreover, as the age of the entrepreneur increases, he or she is less likely to save with household
members. The positive coefficient on the square of age indicates that there is a non-linearity in the
age saving practice relationship. As the age of the entrepreneur increases, the impact of the age on
the saving practice decreases. The rest of the estimates are also in line with the theory. Entrepreneurs
who have access to external finance and entrepreneurs with higher education, better training or high
income are more likely to save formally. Finally, female entrepreneurs seem more likely to save in
formal institutions - perhaps to escape from redistributive pressures. Also, non-married entrepreneurs
are more likely to save formally.
- Table 5 about here -
To circumvent the endogoneity concerns, we use an instrumental variable methodology which
makes use of the determinants of saving practice choice. Since our dependent and main explanatory
variables are binary, we use a system approach, and utilize the age of the entrepreneur and her distance
to the nearest bank as instruments in a nonlinear recursive bivariate probit model.13 Specifically the
model is formulated as follows:
12We used data from Financial Services Map for Tanzania. Data set give geographic coordinates of bank branches,MFIs and ATMs in 2013 at Tanzania. We match this data with the existing geographic coordinates of the wards fromwhich entrepreneurial data is collected with this data. Then we calculated distance of ward to each financial unit andpicked the minimum distance.
13We also estimate the same model by using 2SLS method. We have the same expected sign for the variable interestbut coefficient estimate is unrealistically high and estimates become imprecise as the variance increases. We believe thisis because we have both binary variable of interest and dependent variable. Chibus et al. (2012) suggests 2SLS maygive very different results and imprecise estimates if number of observations are lower than 5000 (in our case it is 877)and the treatment probability is not very close to 0.5 (in our case it is approximately 0.38).
18

Reinvesti = φ+ δSavehouseholdi + η′Controlsi + σi, (15)
Savehouseholdi = λ+ µ′Zi + π′Controlsi + ui. (16)
We assume that error terms σi and ui are distributed via bivariate normal distribution. So,
E[σi] = 0, E[ui] = 0 and cov[σi, ui] = µ. We identify the system by using the vector Z which includes
the distance to bank measure and age of the entrepreneur as well as its square. Table 6 shows the
results. Before presenting the estimates of the bivariate probit model, in columns (1) and (2), we
test in unreported regressions the exogeneity of our instruments by introducing the instruments into
the benchmark model, where we show that none of the instruments have explanatory power for the
probability to reinvest. We also test the joint significance of our exogenous variables in the bivariate
probit model: they are jointly significant at the 1 percent level (Chi2=18.30; p-value<0.004). In
columns (3) and (4) we present the recursive bivariate-probit estimates by using age in both models,
but two different distance measures as our instruments. Also Table 1 in the Appendix shows detailed
estimation results for the model.
- Table 6 about here -
The instrumental variable estimations reported in columns (3) and (4) of Table 4 confirm our
results. The coefficient estimate of save with household member remains negative and significant for
both instrument sets. Different measures of distance produce similar results thereby minimizing the
concerns regarding the validity of the distance-to-bank proxies. We also note that the estimates for
the exogenous variables have the expected signs. The probability to save in the household decreases
as the proximity to bank decreases and entrepreneur gets older.
As we discussed in section 2.6, we expect heterogeneous reinvestment responses with respect to
the within-household saving practice. Therefore, in order to deepen our analysis and strengthen our
identification, we present a set of impact heterogeneity results in Table 7. Specifically, we compare
the reinvestment behaviour of entrepreneurs that save within the household with the reinvestment
behaviour of entrepreneurs that use formal savings mechanisms across the following three sample
splits. First, we split the sample as female and male entrepreneurs. Theory and empirical evidence
suggests that social constraints on accessibility of saved funds is lower for women compared to men.
Second, we split the sample into two as entrepreneurs that are household heads and entrepreneurs that
are spouses, children or siblings. We would again expect the social constraints to be less strong for
household heads. Finally, we distinguish between transformational and life-style entrepreneurs. We
define the respondents who went into business because they were fired/lost/retrenched from a previous
job, couldn’t find a job elsewhere and nothing else to do/no other means of survival/no better option
19

as life-style or survival entrepreneurs, and we consider the rest as transformational entrepreneurs.
Transformational entrepreneurs are expected to be more likely to reinvest in their businesses.
The results in Table 7 confirm a differential relationships between household savings and rein-
vestment decisions. The results reveal that the marginal effects of Savehousehold on reinvestment are
larger - and more significant - for female, non-head family members and life-style entrepreneurs. While
the negative relationship between saving within the household and reinvestment decisions are signifi-
cant at least at the 10% level for all groups, the economic significance is large for female, non-household
heads and subsistence entrepreneurs.
- Table 7 about here -
7 Conclusion
Past research identified several factors that could be important for entrepreneurial investment. In
this study, we explored how different entrepreneurial saving practices (i.e. saving via formal financial
institutions, individually (under the mattress), within the household or within informal arrangements,
such as ROSCAs) are related with the likelihood of reinvestment. To this end, we used a novel survey
data set collected from MSEs in Tanzania and distinguished multiple saving practices of entrepreneurs
as well their earnings retention behaviour. We motivated our empirical research with a simple theo-
retical model that shows how different saving practices can influence investment decisions. We have
three main results. First, we show that saving and the probability of reinvestment are significantly
correlated. Second, we provide evidence that entrepreneurs who save by giving funds to other house-
hold members are less likely to reinvest than formal savers. Third, we document that the difference in
the likelihood of reinvestment is significantly higher for those entrepreneurs who potentially have low
bargaining power in the household and who are survival type entrepreneurs.
Our findings suggest that the entrepreneurs who need to protect their savings from consump-
tion commitments of other household members may benefit most from the introduction of formal
saving instruments in low income areas. Therefore, from a development policy perspective, targeting
entrepreneurs who have low decision power in the household as well as survival entrepreneurs and
facilitating their access to formal saving instruments could be thought as a priority. Our results have
important implications for the interactions between enterprise performance and financial access as well.
Enterprises that exploit reinvestment opportunities are expected to be more likely to sustain higher
productivity levels and survive more often. Access to efficient saving mechanisms in this respect could
be key to facilitate enterprise performance in financially developing societies.
Our research raises also some new issues regarding the implications of savings practices of
20

entrepreneurs. First, why do savers inside households not open a bank account to save? Although we
implicitly show proximity to banks as an important factor to save in a formal account, identification
of all factors is not in the scope of this study. Second, what is the exact role of pressure inside the
household that does not allow earnings retention? These important questions we leave to future work.
References
Ashraf, N. (2009). Spousal control and intra-household decision making: An experimental
study in the Philippines. The American Economic Review, 1245-1277.
Attanasio, O., Augsburg, B., De Haas, R., Fitzsimons, E., & Harmgart, H. (2011). Group
lending or individual lending? Evidence from a randomised field experiment in Mongolia. EBRD
mimeo.
Banerjee, A., Duflo, E., Glennerster, R., & Kinnan, C. (2013). The miracle of microfinance?
Evidence from a randomized evaluation. MIT mimeo.
Besley, T., Coate, S., & Loury, G. (1993). The economics of rotating savings and credit
associations. The American Economic Review, 792-810.
Bruhn, M., & Zia, B. (2011). Stimulating managerial capital in emerging markets: the impact
of business and financial literacy for young entrepreneurs. World Bank mimeo.
Brune, L., Gine, X., Goldberg, J., & Yang, D. (2011). Commitments to save: A field experiment
in rural Malawi. World Bank Policy Research Working Paper Series.
Calomiris, C. W., & Rajaraman, I. (1998). The role of ROSCAs: lumpy durables or event
insurance? Journal of Development Economics, 56(1), 207-216.
Chiburis, R. C., Das, J., & Lokshin, M. (2012). A practical comparison of the bivariate probit
and linear IV estimators. Economics Letters.
De Mel, S., McKenzie, D., & Woodruff, C. (2008). Returns to capital in microenterprises:
evidence from a field experiment. The Quarterly Journal of Economics, 123(4), 1329-1372.
Demirguc-Kunt, A., & Maksimovic, V. (1998). Law, finance, and firm growth. The Journal of
Finance, 53(6), 2107-2137.
Dupas, P, & Robinson, J., (2013a). Savings Constraints and Microenterprise Development:
21

Evidence from a Field Experiment in Kenya. American Economic Journal: Applied Economics 5 (1):
163-192. doi:10.1257/app.5.1.163.
Dupas, P, & Robinson, J., (2013b). Why Don’t the Poor Save More? Evidence from Health
Savings Experiments. The American Economic Review 103 (4): 1138-1171.
Kaboski, J. P., & Townsend, R. M. (2005). Policies and Impact: An Analysis of Village?Level
Microfinance Institutions. Journal of the European Economic Association, 3(1), 1-50.
Kaboski, J. P., & Townsend, R. M. (2011). A Structural Evaluation of a Large-Scale Quasi-
Experimental Microfinance Initiative. Econometrica, 79(5), 1357-1406.
Karlan, D., Ratan, A., & Zinman, J. (2013). Savings by and for the Poor: A Research Review
and Agenda (No. 1027).
Karlan, D. & Zinman, J., (2010a.) Expanding Credit Access: Using Randomized Supply
Decisions to Estimate the Impacts. Review of Financial Studies, 23 (1): 433-64.
Karlan, D. & Zinman, J., (2010b). Expanding Microenterprise Credit Access: Using Random-
ized Supply Decisions to Estimate the Impacts in Manila. Unpublished.
Pande, R., & Burgess, R. (2005). Do rural banks matter? Evidence from the Indian social
banking experience. American Economic Review, 95(3), 780-795.
Robinson, J. (2012). Limited insurance within the household: evidence from a field experiment
in Kenya. American Economic Journal: Applied Economics,4(4), 140-164.
Schaner, S. G. (2012). Do Opposites Detract? Intrahousehold Preference Heterogeneity and
Inefficient Strategic Savings. Unpublished manuscript, Dartmouth Coll., Hanover, NH.
Vonderlack, R. M., & Schreiner, M. (2002). Women, microfinance, and savings: Lessons and
proposals. Development in Practice, 12(5), 602-612.
22

Tables
23
Tab
le1:
Des
crip
tive
stat
isti
csfo
rth
em
ain
vari
able
sP
anel
A:
Fir
mch
arac
teri
stic
sD
escr
ipti
on
Ob
sM
ean
S.D
.M
inM
ax
Rei
nve
stm
ent
Equ
als
to1
ifre
spon
den
tre
-inve
stso
me
of
the
pro
fit
back
tob
usi
nes
s,0
oth
erw
ise
6083
0.7
60.4
30
1E
mp
loye
eN
um
ber
ofem
plo
yees
bu
sin
ess
has
[in
clu
din
gow
ner
]6083
1.4
71.6
11
80
Init
ial
cap
ital
Log
arit
hm
of
init
ial
cap
ital
of
the
bu
sin
ess,
inT
an
zan
ian
Sh
illi
ngs
6083
10.6
22.2
10
25.3
3P
anel
B:
Sec
tora
lb
reak
dow
nof
firm
sN
um
ber
ofco
mp
an
ies
%T
rad
e32
9154.1
Ser
vic
e18
4130.3
Man
ufa
ctu
rin
g93
115.3
Oth
er20
0.3
Pan
elC
:E
ntr
epre
neu
rD
escr
ipti
on
Ob
sM
ean
S.D
.M
inM
ax
Ed
uca
tion
Ed
uca
tion
level
of
the
resp
on
den
t,[0
non
e-6
univ
ersi
ty]
6077
2.0
00.8
90
6F
emal
eE
qu
als
to1
ifre
spon
den
tis
fem
ale
,0
oth
erw
ise
6083
0.5
00.5
00
1S
ingl
eE
qu
als
to1
ifre
spon
den
tis
sin
gle
,0
oth
erw
ise
6083
0.1
00.2
90
1N
otr
ain
ing
Equ
als
to1
ifre
spon
den
th
as
no
bu
sin
ess
rela
ted
trai
nin
g,
0oth
erw
ise
6083
0.7
00.4
60
1R
ura
lE
qu
als
to1
ifre
spon
den
tli
ves
ina
rura
lare
a,
0oth
erw
ise
6083
0.7
50.4
40
1In
com
eL
ogar
ith
mof
per
son
al
inco
me
leve
lof
the
resp
on
den
tin
Tan
zan
ian
Sh
illi
ngs
5868
11.9
41.1
59.9
015.2
0B
ank
bra
nch
wit
hin
one
hou
rw
alkin
gd
ista
nce
Equ
als
to1
ifth
ere
isa
ban
kw
ith
ina
on
e6083
0.3
00.4
60
1h
our
walk
from
the
hom
eof
the
resp
on
den
t,0
oth
erw
ise
Min
.d
ista
nce
toA
TM
,b
ank
bra
nch
,or
MF
IM
inim
um
dis
tan
ceof
the
ward
entr
epre
neu
rli
ves
toth
en
eare
stA
TM
,583
2.0
41.7
8-4
.35
6.1
2b
ank
bra
nch
or
MF
I,in
logari
thm
s,at
ward
leve
l]A
geA
geof
the
resp
on
den
t6083
36.8
410.6
16
91
Pan
elD
:F
inan
ceva
riab
les
Des
crip
tion
Ob
sM
ean
S.D
.M
inM
ax
Sav
eE
qu
als
to1
ifre
spon
den
tsa
ves
for
bu
sines
sp
urp
ose
s,0
oth
erw
ise
6083
0.7
70.4
20
1S
ave
form
alE
qu
als
to1
ifre
spon
den
tsa
ves
ina
ban
kacc
ou
nt,
MF
Ior
SA
CC
O,
0oth
erw
ise
6083
0.1
00.3
00
1S
ave
info
rmal
Equ
als
to1
ifre
spon
den
tsa
ves
bu
tn
ot
ina
ban
kacc
ou
nt,
MF
Ior
SA
CC
O6083
0.6
70.4
70
1an
d,
0ot
her
wis
eS
ave
info
rmal
ind
ivid
ual
lyE
qu
als
to1
ifre
spon
den
tsa
ves
ina
secr
eth
idin
gp
lace
or
pig
gy
ban
k6083
0.5
70.4
90
1an
dd
oes
not
save
via
oth
erm
ean
s,0
oth
erw
ise
Sav
ein
form
alw
ith
oth
ers
Equ
als
to1
ifsa
veh
ou
seh
old
or
save
ou
thou
seh
old
equ
als
to1
an
dd
oes
not
save
6083
0.1
00.3
00
1fo
rmal
ly,
0oth
erw
ise
Sav
ew
ith
hou
seh
old
mem
ber
sE
qu
als
to1
ifre
spon
den
tsa
vevia
by
giv
ing
itto
ah
ou
seh
old
mem
ber
toke
epit
6083
0.0
60.2
40
1sa
fean
dd
oes
not
save
form
all
y,0
oth
erw
ise
Sav
ew
ith
peo
ple
outs
ide
hou
seh
old
Equ
als
to1
ifre
spon
den
tsa
vevia
by
giv
ing
itto
an
on
house
hold
mem
ber
6083
0.0
50.2
00
1or
mer
rygo
-rou
nd
an
dd
oes
not
save
form
all
y,0
oth
erw
ise
Bor
row
edE
qu
als
to1
ifre
spon
den
th
as
ever
take
na
loan
/b
orr
owed
mon
eyfo
rbu
sin
ess
6083
0.1
80.3
80
1p
urp
ose,
0oth
erw
ise
For
mal
loan
Equ
als
to1
ifre
spon
den
tto
ok
ato
set
up
or
take
over
the
bu
sin
ess
from
ab
an
k6083
0.0
30.1
60
1or
MF
I,0
oth
erw
ise
Sem
ifo
rmal
loan
Equ
als
to1
ifre
spon
den
tto
ok
acr
edit
from
an
emp
loye
r,
SA
CC
O,
6083
0.0
20.1
30
1V
illa
geB
an
k,
loca
lgov
ern
men
tsc
hem
esor
don
or/
NG
Oto
set
up
orta
ke
over
the
bu
sin
ess
,0
oth
erw
ise
Info
rmal
loan
Equ
als
to1
ifre
spon
den
tto
ok
ato
set
up
or
take
over
the
bu
sin
ess
from
6083
0.0
60.2
40
1fa
mil
y,fr
ien
ds,
savin
gs
clu
b,
mon
eyle
nd
eror
sup
pli
er,
0oth
erw
ise
6083
0.0
60.2
40
1
24

Tab
le2:
Cor
rela
tion
Mat
rix:
Pai
rwis
eco
rrel
atio
ns
amon
gse
lect
edva
riab
les
Reinvestment
Save
Save formal
Save informal individually
Save informal with others
Save with household members
Save with people outside household
Borrowed
Education
Female
Single
No training
Income
Rei
nve
stm
ent
1Sav
e0.
09*
1Sav
efo
rmal
0.07
*0.
18*
1Sav
ein
form
alin
div
idual
ly0.
05*
0.62
*-0
.38*
1Sav
ein
form
alw
ith
other
s-0
.03*
0.18
*-0
.11*
-0.3
9*1
Sav
ew
ith
other
hou
sehol
dm
emb
ers
-0.0
4*0.
14*
-0.0
8*-0
.29*
0.74
*1
Sav
ew
ith
peo
ple
outs
ide
hou
sehol
d0.
000.
12*
-0.0
7*-0
.25*
0.64
*-0
.03*
1B
orro
wed
0.06
*0.
12*
0.30
*-0
.09*
0.03
*-0
.01
0.05
*1
Educa
tion
0.07
*0.
13*
0.24
*-0
.04*
0.02
0.02
0.01
0.17
*1
Fem
ale
-0.0
6*0.
00-0
.05*
0.03
*0.
00-0
.10*
0.11
*0.
03*
-0.1
0*1
Sin
gle
0.02
0.00
0.00
0.01
-0.0
10.
00-0
.01
-0.0
4*0.
07*
0.01
1N
otr
ainin
g-0
.02
-0.0
6*-0
.08*
0.02
-0.0
4*-0
.04*
-0.0
1-0
.10*
-0.1
2*0.
000.
001
Inco
me
0.13
*0.
12*
0.19
*-0
.02
0.01
0.02
-0.0
20.
12*
0.19
*-0
.24*
-0.0
20.
001
Note
s:*
Sig
nifi
cant
atle
ast
5p
erce
nt
leve
l
25

Table 3: Regressions for reinvestment and saving/saving practices relationship
(1) (2) (3) (4) (5)
Save formal 0.09***
(0.02)
Save informal 0.06*** -0.04*
(0.01) (0.02)
Save informal individually -0.03
(0.02)
Save informal with others -0.09***
(0.03)
Save with household member -0.12***
(0.04)
Save with people outside household -0.04
(0.03)
Borrowed 0.04** 0.05*** 0.05*** 0.05 0.04
(0.02) (0.02) (0.02) (0.03) (0.03)
Education 0.01 0.01 0.01 -0.01 -0.01
(0.01) (0.01) (0.01) (0.01) (0.01)
Female -0.03** -0.03*** -0.03*** -0.07** -0.04
(0.01) (0.01) (0.01) (0.03) (0.03)
Single 0.03* 0.02 0.02 0.06 0.03
(0.02) (0.02) (0.02) (0.04) (0.04)
No training -0.03*** -0.04*** -0.04*** -0.07** -0.06**
(0.01) (0.01) (0.01) (0.03) (0.03)
Variables expenses -0.08* -0.06 -0.06 -0.03 -0.05
(0.05) (0.05) (0.05) (0.08) (0.10)
Income 0.03*** 0.01** 0.02** 0.03** 0.05***
(0.01) (0.01) (0.01) (0.01) (0.01)
Observations 5803 4499 4499 877 774
Sample All All Savers Formal and Formal and
household others
savers savers
Base category No Formal Formal Formal Formal
saving Savers Savers Savers Savers
Notes: Reinvestment is the dependent variable in the estimations. We report estimates marginal effects at mean
values for all estimations and robust standard errors are in parentheses. We additionally control for sector and region
dummies in the estimations. p<0.1. ** p<0.05. *** p<0.01
26

Table 4: Robustness checks for reinvestment and save with household member relationship
(1) (2)
Save with household member -0.07** -0.18***
(0.03) (0.05)
Formal loan 0.02
(0.05)
Semi formal loan -0.11
(0.09)
Informal loan -0.12
(0.07)
Initial capital 0.02**
(0.01)
Sales per worker -0.02
(0.01)
Rural 0.02
(0.03)
Size 0.04
(0.03)
Duration 0.03*
(0.01)
Observations 872 650
Entrepreneurial dummies Yes No
Activity Dummy Yes No
Region FE Yes No
District FE No Yes
Notes: Reinvestment is the dependent variable in the estimations. We report estimates marginal effects at mean
values for all estimations and robust standard errors are in parentheses. We use the sample for Formal Savers and
Household Savers and formal savers as the base category. We additionally control for sector and region dummies in
the estimations. p<0.1. ** p<0.05. *** p<0.01
27

Table 5: The estimates for save with household member vs. formal saving choices
(1) (2)
Bank branch within -0.13***
one hour walking distance (0.04)
Min. distance to 0.03***
ATM, bank branch, or MFI (0.01)
Age2 -0.04*** -0.04***
(0.01) (0.01)
Age2 0.00*** 0.00**
(0.00) (0.00)
Borrowed -0.32*** -0.32***
(0.03) (0.04)
Education -0.12*** -0.12***
(0.02) (0.03)
Female -0.10** -0.11**
(0.04) (0.04)
Single -0.15** -0.14**
(0.06) (0.07)
No training 0.02 0.01
(0.04) (0.04)
Variable expenses/Sales -0.09 -0.1
(0.14) (0.15)
Income -0.11*** -0.10***
(0.02) (0.02)
Observations 877 797
Notes: Save with household member is the dependent variable in the estimations and formal saving is the base
category. We report estimates marginal effects at mean values for all estimations and robust standard errors are
in parentheses. We use the sample for Formal Savers and Household Savers. We additionally control for region
dummies in the estimations p<0.1. ** p<0.05. *** p<0.01
28
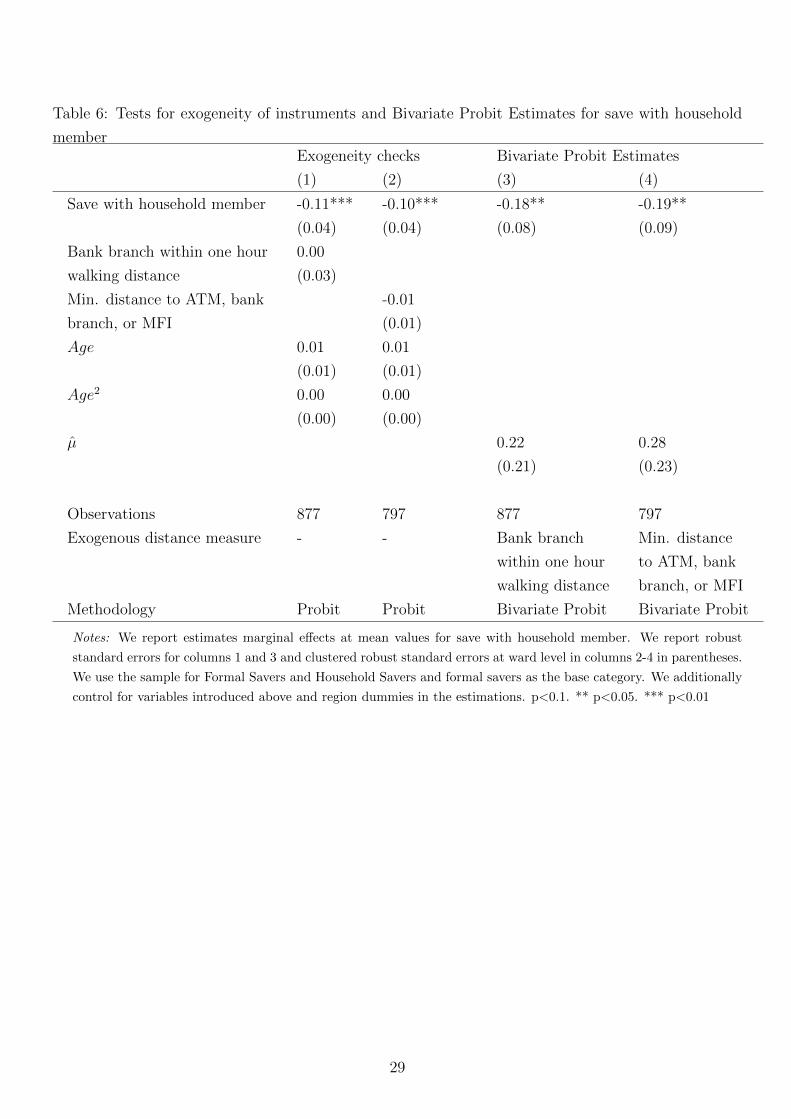
Table 6: Tests for exogeneity of instruments and Bivariate Probit Estimates for save with household
memberExogeneity checks Bivariate Probit Estimates
(1) (2) (3) (4)
Save with household member -0.11*** -0.10*** -0.18** -0.19**
(0.04) (0.04) (0.08) (0.09)
Bank branch within one hour 0.00
walking distance (0.03)
Min. distance to ATM, bank -0.01
branch, or MFI (0.01)
Age 0.01 0.01
(0.01) (0.01)
Age2 0.00 0.00
(0.00) (0.00)
µ 0.22 0.28
(0.21) (0.23)
Observations 877 797 877 797
Exogenous distance measure - - Bank branch Min. distance
within one hour to ATM, bank
walking distance branch, or MFI
Methodology Probit Probit Bivariate Probit Bivariate Probit
Notes: We report estimates marginal effects at mean values for save with household member. We report robust
standard errors for columns 1 and 3 and clustered robust standard errors at ward level in columns 2-4 in parentheses.
We use the sample for Formal Savers and Household Savers and formal savers as the base category. We additionally
control for variables introduced above and region dummies in the estimations. p<0.1. ** p<0.05. *** p<0.01
29

Table 7: Tests for exogeneity of instruments and Bivariate Probit Estimates for save with household
memberGender Position in the household Entrepreneur
Male Female Other (Child, Head Transformational Survival
spouse, sibling etc)
Save with -0.12** -0.23*** -0.25*** -0.16*** -0.13** -0.20*
household member (0.05) (0.09) (0.08) (0.06) (0.05) (0.11)
Observations 402 275 213 441 458 148
Notes: We report marginal effects at mean values for all estimations from Probit estimations and robust standard
errors are in parentheses. We additionally control for introduced above as well as sector and region dummies in
all estimations. The numbers of observations are less than original sample because some control variables perfectly
predict outcome variables. We estimate all models for comparable subsamples where there is variation in our outcome
variable with respect to control variables. We use the sample for Formal Savers and Household Savers and formal
savers as the base category. p<0.1. ** p<0.05. *** p<0.01
30

Appendix
Table A1: Bivariate Probit Estimates(1) (2) (3) (4)
Dependendent variable: Reinvestment Save with Reinvestment Save with
household member household member
Save with household member -0.81** -0.87**
(0.37) (0.40)
Bank branch within one hour -0.39***
walking distance (0.12)
Min. distance to ATM, bank 0.10***
branch, or MFI (0.04)
Age -0.12*** -0.11***
(0.03) (0.04)
Age2 0.00*** 0.00***
(0.00) (0.00)
Borrowed 0.07 -0.97*** 0.05 -0.96***
(0.16) (0.12) (0.17) (0.13)
Education -0.07 -0.33*** -0.07 -0.33***
(0.06) (0.07) (0.07) (0.07)
Female -0.24** -0.27** -0.31** -0.29**
(0.12) (0.12) (0.12) (0.13)
Single 0.25 -0.47** 0.24 -0.45*
(0.18) (0.22) (0.20) (0.24)
Notraining -0.32*** 0.05 -0.36*** 0.04
(0.12) (0.12) (0.14) (0.12)
Variable expenses -0.03 -0.25 -0.1 -0.29
(0.33) (0.38) (0.36) (0.40)
0.08 -0.29*** 0.05 -0.28***
Income (0.06) (0.05) (0.06) (0.05)
0.05 8.57*** 0.6 8.15***
Constant (1.08) (0.96) (1.23) (1.07)
Observations 877 877 797 797
Notes: We report bivariate probit estimates. We report robust standard errors for columns 1 and 3 and clustered
robust standard errors at ward level in columns 2-4 in parentheses. We use the sample for Formal Savers and House-
hold Savers and formal savers as the base category. We additionally control for region dummies in the estimations.
p<0.1. ** p<0.05. *** p<0.01
31