Embed Size (px)
Citation preview

“Entrepreneurial Management” as a Strategic Choice in Firm Behavior:
Linking it with Performance
Paper to be presented at the HTSF Conference in Twente, The Netherlands
by Birte Kuhn*, Sean Patrick Sassmannshausen* & Roxanne Zollin+
*Schumpeter School of Business and Economics, University of Wuppertal +Queensland University of Technology (QUT), Brisbane, Australia
Contact with authors: [email protected]‐wuppertal.de
Abstract
Establishing the core principals of “entrepreneurial management” within an organization describes a
certain strategic choice that affects a company in six dimensions, according to Stevenson (1983). Our
aim is to empirically measure entrepreneurial management (it’s existence and degree) and to link
this measured strategic choice (for or against) entrepreneurial management with firm performance.
Our argument here is that companies that follow core principals of entrepreneurial management
should outperform other more administrative firms in certain measures of strategic performance.
This paper builds on an empirical investigation published by Brown, Davidson & Wiklund (2001), who
have developed and tested a reliable measurement instrument for Stevenson’s definition of
“entrepreneurial management” (Stevenson 1983, Stevenson & Jarillo 1990). In the first part of our
paper we aim to replicate and to some extent improve this study. In the second part we link the
measured degree of “entrepreneurial management” with firm performance. To our knowledge, even
so Stevenson’s definition of entrepreneurial management is commonly acknowledged and Brown et
al. (2001) developed a reliable instrument to empirically capture this behavioral approach to
management, the construct of entrepreneurial management never before has been linked to firm
performance in an empirical study. Since most papers on corporate entrepreneurship and firm
performance are based on Covin & Slevin’s (1991) or Miller’s (1983) concept of entrepreneurial
orientation, we contribute to the literature on corporate entrepreneurship in a novel way, given the
fact that the entrepreneurial management dimensions measured in our study can theoretically and
empirically be clearly distinguished from the construct of entrepreneurial orientation as defined by
Covin & Selvin (1991).
1 Introduction
Entrepreneurship, traditionally concerned with the start‐up of new firms, has additionally become
accepted as a firm‐level phenomenon deserving scholarly attention. Especially under the aspect of
today’s environmental uncertainty, turbulence, and heterogeneity, organizations are facing a host of
strategic and operational challenges (Eisenhardt and Brown 1998). To deal with these challenges
successfully, one of the firms’ core competencies might be the effective use of corporate
entrepreneurship (Covin and Miles 1999). While aspects of corporate entrepreneurship are relevant

for any organization, vitality and flexibility are especially important for large firms with mainly
inflexible and highly hierarchical structure. Moreover, corporate entrepreneurship can help to
improve the corporation’s competitive position in domestic and international markets by renewing
its capabilities of acquiring and using new competence. The recent literature reveals a general
although certainly not complete consensus around the position that successful corporate
entrepreneurship is linked to improvement in firm performance (Ireland, Hitt et al. 2001; Antoncic
and Hisrich 2003; Covin, Ireland et al. 2003; Kuratko, R. Duane Ireland et al. 2004). Most research
about corporate entrepreneurship and firm’s performance is based on Covin & Slevin’s (1991)
concept of entrepreneurial orientation that consists of three dimensions or behaviours:
innovativeness, pro‐activeness and risk taking. These three dimensions have been used to
discriminate between entrepreneurial and less‐entrepreneurial firm‐behaviour (Covin & Slevin 1991).
The behavioural approach to entrepreneurship is relatively young. Howard H. Stevenson published
the likely first article on this approach in 1983 and therefore could be named the founder of the
behavioural approach (besides Gartner 1988/89). Stevenson (1983) holds that entrepreneurial
management practices can help firms remain vital and contribute to firm and societal level value
creation. He describes entrepreneurship as an “approach to management” which is characterized by
“the pursuit of opportunity without regard to resources currently controlled” (Stevenson 1983:23).
Stevenson (1983) argues that entrepreneurial value creation process can take place in any type of
organization. According to Stevenson & Jarillo (1990:25) “entrepreneurship is more than just starting
new business […] entrepreneurial management may be seen as a ‘mode of management’ different
from traditional management”. Based on Stevenson’s (1983) conceptualization Brown, Davidsson &
Wiklund (2001) developed an instrument to examine these propositions and measure
entrepreneurial behaviour within an organization. In the following years over hundred articles
reference aspects of Brown’s, Davidsson’s & Wiklund’s paper. But surprisingly their survey and their
achievement in creating a measurement for entrepreneurship as opportunity‐based firm behaviour
have been hardly mentioned. Nor has their measurement ever been linked to firm performance.
A reliable entrepreneurial measurement instrument would make it much easier for organizations to
assess their degree of entrepreneurial management. Further, it could help to develop more effective
strategies to enhance the entrepreneurial behaviour. Brown, Davidson & Wiklund’s (2001) measure
is believed to provide such a reliable measurement instrument. Therefore it is the point of departure
for this paper. For further validation of the universality of the measure it would be interesting to
know whether the results hold for other business cultures and in other languages (than Swedish).
Generally, the entrepreneurship literature is characterized by a lack of reliable, internationally
comparable data (Hisrich, Langan‐Fox et al. 2007). Therefore this paper will start to close the gap by
undertaking a follow up survey according to Brown, Davidsson & Wiklund (2001) in the Australian
business context. Furthermore some improvements of the measure may be advisable. Particularly
the Resource Orientation and the Reward Philosophy index didn’t have a very satisfactory reliability.
This might be solved by adding a few items to the scale. Including new items to an already existing
scale instead of developing an entirely new one has several advantages, as Davidsson puts it:
“Replication provides us with much better truth criteria than other tools at our disposal.
Replication therefore facilitates the building of cumulative knowledge, which is what research is
all about [...]. Also importantly, replication has a sound, humbling effect that make us less prone
to over interpret single study results regarding relative important explanatory variables;
prematurely disregard antecedents that do not turn out significant in an individual study, or show

an undue level of confidence in a result that happens to be (marginally) statistically significant in
one study.” (Davidsson 2004:188)
In fact the operationalization of this survey differs slightly from the archetype of the model as this
study focused on different firms, in a different country, with a slightly different questionnaire
(additional questions) and the intention to interview more than one person per company. This
decreases the value of the replication as a test of internal validity while it actually increases the value
as a test of external validity (Hubbard, Vetter et al. 1998). In other words, the theory test is even
tougher. If the result of the original study was positively influenced by an artefact of the specific
operationalization this influence does not carry over to the replication. Furthermore, if the
replication isn’t a simple copy, it may add value to both studies. Besides the aspect of further
validation of the earlier study the comparison of the prior and the follow‐up study might give some
explanations and allows some interpretations.
Over and above aiming to improve the scale, this study is focusing on the relationship between the
level of entrepreneurial behaviour and firm performance. Brown’s et al. instrument has proven to be
a reliable measurement instrument of entrepreneurial management. Nevertheless, most research
about corporate entrepreneurship and firms’ performance is still based on Covin & Slevin’s (1991)
concept of entrepreneurial orientation, but none research that would be known to the authors
focuses on entrepreneurial management according Stevenson (1983) and Brown et al.
If both of these concepts – entrepreneurial orientation by Covin & Slevin (1991) and entrepreneurial
management by Stevenson (1983) – are covering different but equally important aspects of corporate
entrepreneurship, it seems even more surprising that no known study about the relation between
Stevenson’s concept and firm performance exists, whereas several studies examine the relationship
between entrepreneurial orientation and companies’ performance. Therefore this study contributes
fundamentally to the corporate entrepreneurship research by abolishing this obvious lack of research
in this area.
A sample of 994 employees (from 157 Australian public companies) was selected, including company
sizes between 10 and 249 employees. The target respondents were the CEO and Top managers. The
questionnaire was designed according to Brown et al. using items of a forced choice type, with pairs
of statements representing the opposites of traditional managed companies and entrepreneurial
managed companies, according to Stevenson’s view (explained in more detail hereafter). Further,
eight new questions for the entrepreneurial dimensions “Resource Orientation” and “Reward
Philosophy” were included. Different from Brown et al. the scale was reduced from a 10‐intervall to a
6‐intervall scale. This reduction is due to the much smaller sample size. All analyses were conducted
using Excel 2007 and SPSS16‐17/PASW Statistics 18.
Even though there isn’t a consensus about the definition of corporate entrepreneurship, it is crucial
to find a suitable definition for this study. For the purpose of the current research, corporate entre‐
preneurship is defined according Stevenson as “a process by which individuals inside organizations
pursue opportunities independent of the resources they currently control” (Stevenson & Jarillo 1990:
23). The focus thereby is on entrepreneurial management. Stevenson (1983) holds that en‐
trepreneurial management, defined as a set of opportunity‐based management practices, can help
firms remain vital and contribute to firm and societal level value creation. Accordingly, corporate
entrepreneurship refers to all innovative activities and orientations, entrepreneurial strategies and
behaviour. As the current study is concerned with assessing the relationship between corporate en‐

trepreneurship and firm performance, we will use Stevenson’s conceptualisation of entrepreneurship
as opportunity‐based firm behaviour as a point of departure.
2 Stevenson’s Definition of “Entrepreneurial Management”
Stevenson’s conceptualizes entrepreneurship as opportunity‐based management behaviour. He
describes entrepreneurial behaviour and administrative behaviour as the two extreme opposites of
an entrepreneurship continuum. This continuum describes the entire spectrum of possible firm
behaviours with the promoter firms placed at the entrepreneurial end and the trustees at the
administrative end. Whereas the promoter intent to pursue and exploit new opportunities regardless
of resources controlled, the trustee strives to use his or her resource pool in the most efficient way
on given purposes.
Although Stevenson only describes six dimensions in his first model (1983), in his later work two
other key dimensions are mentioned that are important to his conceptualization of entrepreneur‐
ship. These dimensions are Growth Orientation (Stevenson and Jarrillo‐Mossi 1986) and an Entrepre‐
neurial Culture (Stevenson and Jarillo 1990). All dimensions will be discussed in more detail, since our
measurements for corporate entrepreneurship are based on these dimensions (and so had been
those by Brown et al. (2001).
Entrepreneurial focus
(promoter) Conceptual dimension
Administrative focus
(trustee)
Driven by perception of opportunity
Strategic Orientation Driven by controlled resources
Revolutionary with short duration
Commitment to opportunity Evolutionary with long duration
Many stages with minimal exposure at each stage
Commitment of resources A single stage with complete commitment out of decision
Episodic use or rent of required resources
Control of resources Ownership or employment of
required resources
Flat, with multiple informal networks
Management Structure Hierarchy
Based on Value creation Reward Philosophy
Based on responsibility and seniority
Rapid growth is top priority; risk accepted to achieve growth
Growth Orientation Safe, slow, steady
Promoting broad search for opportunities Entrepreneurial Culture
Opportunity search restricted by resources controlled; failure
punished Source: Brown et al. (2001), see Stevenson (1983).
Table 1: Stevenson's conceptual dimensions of entrepreneurial management
Strategic Orientation
Strategic Orientation describes what factors drive the formulation of strategy. It can be described as
the philosophy that effects every decision about strategy. The pure promoter’ strategy is solely
driven by the opportunities that exist and not limited by the resources that may be required to
exploit them. Because the strategy is opportunity‐driven, almost any opportunity is relevant to the
firm. Acquiring and marshalling the necessary resources represents a secondary step and only follows
after an opportunity is identified. The other extreme, the pure trustee’s strategy is to utilize the

resources of the firm most efficiently. Even though the trustee is aware that opportunities exists and
are important, only opportunities that relate to existing resources are relevant as the strategy is
resource‐driven.
Commitment to Opportunity
The second dimension is also related to strategic issues. But whereas Strategic Orientation is about
the identification and election of opportunities, the commitment to opportunity is about its pursuit.
The promoter is action‐orientated and therefore willing and able to act in a very short time frame. He
or she can therefore chase an opportunity quickly (Stevenson 1983). This means the promoter is able
to commit and decommit to actions rapidly. On the other hand, the trustee tends to be stationary.
His decision process is time‐consuming and, once made, leads to a commitment of long duration.
Accordingly the trustee’s administrative behaviour tends to be slow and inflexible as a result of
multiple decision constituents, negotiated strategies, and an eye towards risk reduction (Brown,
Davidsson et al. 1999). As a result, the promoter is more likely than is the trustee to pursue a given
opportunity. Once the trustee decides to pursue an opportunity however, it would be with a much
larger initial investment and with an intention to remain in this line of business for considerable time.
Commitment of Resources
While both, trustee and promoter need resources to pursue an opportunity, they differ in the way of
the commit to these resources. The promoter attempts to maximize value creation by minimizing the
resource set. Therefore his commitment of resources is multistage and with a minimum exposure at
each stage or decision point. This commitment of resources in a multi‐step manner allows the
promoter to stop and change direction rapidly, if and when circumstances change. This flexibility
allows the promoter to take new information about the opportunity or the environment into account
and to change his strategy accordingly very quickly. Furthermore by minimizing the resources that
the promoter must invest in order to initially pursue an opportunity, the amount of resources at risk
that could turn out to be sunk costs is also minimized. However, the accumulation of resources
creates an organizational pressure, (e.g. capital allocation system, formal planning systems, certain)
that makes it difficult to maintain this type of resources commitment.
On the other hand, the trustee’s commitment of resources is characterized by thorough analyses in
advance and large single stage investments. Instead of minimizing the resources invested at once, his
or her strategy to minimize risk is to use in‐depth analyses of all available information before
deciding to act. But once the decision to pursue an opportunity is made, the investment of resources
is not easily reversed.
Control of Resources
Related to the commitment of resources is the way those resources are owned and controlled. The
promoter tries to further reduce as much as possible the amount of used and owned resources. The
promoter is less concerned about the ownership of resources, but more concerned about having
access to others’ resources (e.g. financial capital, intellectual capital, skills, competencies). This
strategy provides more flexibility and the opportunity to participate on the latest technology,
knowledge and market development. However, as a firm grows it becomes increasingly difficult to
follow this approach to resource control, as the growth quite often leads to resource accumulation.
In contrast, the trustee focuses on the ownership or employment of resources and the accumulation
of further resources. His or her advantage in this strategy is an immediate access to owned resources

without being depended on markets. Furthermore the trustee might be able to use the resources he
or she owns more effectively as he or she is familiar with them.
Management Structure
As the differences of commitment and control of resources were discussed above, the trustee’s and
promoter’s management structure differs according to their use and control of resources. While the
management structure of the entrepreneurially managed firm (promoter) is organic with multiple
informal networks, the ‘traditional’ managed firm’s structure (trustee side) is more formalized with a
complex hierarchy. As the promoter doesn’t own all the resources being used, those resources can’t
be managed within a formal organization. This creates the need of nontraditional means of
organization. Therefore the promoter’s management structure is designed to coordinate key non‐
controlled resources as well as to be flexible and to create an environment where employees are
encouraged to create and seek opportunity.
On the other hand, the trustee’s management structure is well suited for the internal efficiencies of
allocating own resources. For this purpose there are clear roles and responsibilities, highly routinized
work, and a layer of middle management to manage the use of the firm’s resources (Hisrich, Peters
et al. 2008). In other words, the trustee’s management structure focuses more on efficiency and
good administration rather than detecting and rapidly acting on changes in the environment.
Reward Philosophy
As the promoter is focused on pursuing opportunities for new entries which represent new value for
the firm, the reward philosophy is toward compensations based on contributions towards the
discovery and exploitation of opportunities. Consequently, employees often have the freedom to
experiment with potential opportunities and are rewarded according to their value creation. A
management structure of independent action and accountability enhances this evaluation. If the
success of creating new value is related to a team, the entrepreneurial managed firm is also more
comfortable in rewarding teams.
In contrast, in a firm managed more administratively, rewards are based on responsibilities (which is
traditionally determined by the amount of resources that this employee controls), hierarchy, and on
seniority. Consequently employees are rewarded with promotion, which provides a higher level of
responsibility and therefore further scope of rewards. Furthermore, whereas the creation of new
value requires a longer term view, the trustee’s measure of performance is more related to short‐
term profit targets.
Growth Orientation
Even as all firms may desire to grow (unless environmental circumstances require systematic
shrinking) the effort putting into it and the pace of growing are different in entrepreneurial and tradi‐
tional managed firms. As the promoter has a great desire in rapid growth, the trustee prefers a
slower growth at a steady pace, because anything faster could be unsettling for the firm. For their
management structure isn’t that flexible they prefer a more manageable pace of growth, by putting
at risk the exploitation of opportunities within a given window of opportunity, but not the jobs and
the power of top management (Stevenson & Jarrillo‐Mossi 1986).
Entrepreneurial Culture
Entrepreneurial Culture describes the firm’s culture to generate and value new ideas. The entrepre‐
neurial managed firm encourages employees to generate ideas, experiment, and engage in other

tasks that might produce creative output. Because opportunity is the starting point, creative output
is highly valued as it often is the source of opportunities for new entries. Therefore a much broader
range of ideas are worth seeking and considering (Stevenson & Jarillo 1990).
In contrast, the trustee begins with an assessment of the resources under control. Using the
currently controlled resources as a starting point, only ideas that relate to these resources are
relevant. Due to this restriction, the flow of ideas judged worthy of considering automatically is much
smaller. Therefore, promoters create a work environment full of ideas, while trustees create a work
environment with just enough ideas to match the controlled resources.
3. Brown, Davidsson and Wiklund’s measurement instrument – a scale for
placement on the entrepreneurial management continuum
Brown, Davidsson & Wiklund (2001) took the challenge to create a measurement for Stevenson’s
(1983, Stevenson & Jarrillo‐Mossi 1986, Stevenson & Jarillo 1990) definition of entrepreneurial
management, hoping to develop reliable indices of the eight dimensions of Stevenson’s
conceptualization (described above), as well as combining them into an overall scale for the
placement of firms on an ‘entrepreneurial management vs. administrative management’‐continuum.
The following description provides a brief overview of Brown et al. (2001) study, as it is the basic
work to our replicatory part of our study.
The items were developed according to Stevenson’s (1983, Stevenson & Jarrillo‐Mossi 1986,
Stevenson & Jarillo 1990) detailed conceptualization. His eight dimensions of entrepreneurial
management provide guidelines for the relevant construct domain and even some specific questions.
The items were designed as a two‐sided forced choice type Likert scale with pairs of statements,
representing the opposite ends of the promoter/ trustee continuum. The respondents were asked to
mark the number of the ten‐point scale, which best represented the view of their firm. Out of 29
developed items, 20 were included in the final scales.
According to Stevenson’s description of entrepreneurship as a management approach relevant to
many different types of firms, Brown, Davidsson & Wiklund (2001) chose diverse sample with
analysable sub‐groups. The total sample consisted of 2455 Swedish firms, chosen by the sampling
criteria: industrial sector (manufacturing, professional services, wholesale/ retail and other services),
number of employees (10‐49 and 50‐249) and corporate governance. The response rate was 52,1%
which is an effective sample of 1233 firms for the main analysis. Further, in this study Brown et al.
(2001) ‘replicated themself’. In other words, they had a large and stratified sample, large enough to
test their theses on several, separate sub‐samples. As internal replication they re‐ran the factor
analysis for different strata for a total of ten sub‐sample analyses. As a results of this sub‐sample
analyses the cumulative variance explained is very similar in every analysis, the right number of
factors in extracted in all analyses but one, and also very important, the extracted factors remain the
same across sub‐samples. Therefore they had made a much stronger case for the validity of their
operationalization than if they had only examined one of the sub‐samples (see Davidsson 2004).
Using factor analysis (principal components extraction and varimax rotation) Brown et al. (2001)
were finally able to isolate six empirically distinct dimensions: Strategic Orientation, Resource
Orientation, Management Structure, Reward Philosophy, Growth Orientation and Entrepreneurial
Culture. Stevenson’s Dimension commitment to opportunity, though certainly a theoretically

important aspect of entrepreneurial management, could not be empirically isolated as an
independent dimension. The items developed for this dimension showed a clear conceptual overlap
with Strategic Orientation and/or Commitment of Resources. Furthermore, the two dimensions
Commitment of Resources and Control of Resources appeared to be overlapping as well and
therefore merged into one factor named Resource Orientation (see Figure 3.1). Brown’s et al. (2001)
interpretation is that the isolated six empirical dimensions represent Stevenson’s eight conceptual
dimensions.
In order to examine the convergent validity they compared their entrepreneurial management scale
with Covin & Slevin’s (1989) entrepreneurial orientation scale. After testing reliability and the
correlation between their six dimensions and Covin & Slevin’s three dimensions (innovation,
proactiveness and risk taking) they concluded that all nine dimensions are conceptually sound and
empirically separable. In other words, they suggested that the construct of entrepreneurial
orientation and entrepreneurial management are measuring different aspects of the broad and
complex concept of firm‐level entrepreneurship.
Figure 1: Stevenson’s conceptual dimensions and Brown’s et al. empirical dimensions
4. Research hypothesis
There is more than little empirical research focusing on the link between corporate entrepreneurship
and company performance. In fact, there is extensive evidence of strong, statistically significant
relationships between levels of entrepreneurship within a firm and a number of different indicators
Stevenson‘s conceptual dimesnions
Brown’s et al. empirical dimensions
Strategic Orientation
Commitment to Opportunity
Commitment of Resources
Control of Resources
Management Structure
Reward Philosophy
Growth Orientation
Entrepreneurial Culture
Strategic Orientation
Resource Orientation
Management Structure
Reward Philosophy
Growth Orientation
Entrepreneurial Culture

of company performance (e.g. Miller & Friesen 1982; Zahra 1991; Morris & Sexton 1996). For
example, Covin & Slevin (1986) reported a simple correlation of r = 0,39 (p < 0,001) between their
entrepreneurial posture scale and a multi‐item index of firm performance. Zahra (1991) reported a
positive association between corporate entrepreneurship activities and profitability, growth, and
risk‐related measures of company performance. It is suggest that corporate entrepreneurship is
positively associated with a company’s growth and profit (Covin & Slevin 1991; Zahra 1991). Further,
many researchers suggest that entrepreneurial orientation is positively related to a firm’s financial
performance, in particular (Miller 1983; Covin & Slevin 1989; Zahra 1993a).
Studying the research in this area so far, one comes to notice that several studies use Covin &Slevin’s
(1991) model of entrepreneurial orientation as a base for a measurement scale. Researchers have
agreed that entrepreneurial orientation is a combination of three dimensions: innovativeness, pro‐
activeness, and risk‐taking (e.g. Wiklund 1999). Innovativeness reflects a tendency to support new
ideas, novelty, experimentation, and creative processes, thereby departing from established prac‐
tices and technologies (Lumpkin & Dess 1996). Proactiveness refers to a posture of anticipating and
acting on future wants and needs in the marketplace, thereby creating a first‐mover advantage in
comparison to competitors (Drucker 1993, Lumpkin & Dess 1996). Several studies show a positive
relationship between those entrepreneurial orientation dimensions and firm performance (e.g. Zahra
& Covin 1995; Brown 1996; Wiklund 1999). Zahra & Covin (1993) found that firms with an
entrepreneurial orientation could target premium market segments, charge higher prices, and were
faster to the market. These firms tend to monitor market changes, respond quickly, and capitalize on
emerging opportunities. Innovation and pro‐activity kept them ahead of competitors, leading to
better financial results.
The sheer number of studies relying on Covin & Slevin’s scale indicates the success and validity of this
measurement instrument. Most empirical studies support the proposition that the relation between
a firm’s entrepreneurial orientation and performance is positive, i.e. that firms which adopt a more
entrepreneurial strategic orientation perform better (Zahra 1991; Wiklund 1999; Zahra, Neubaum et
al. 2000). However, the small number of studies using different measurement instruments to maybe
capture different aspects of the corporate entrepreneurship and performance relationship is
surprising. One reason, why most researchers seem to rely on entrepreneurial measurement scales
that have been tested before (i.e. Covin & Slevin’s 1993 measurement instrument of entrepreneurial
orientation) could be that finding a suitable measurement for corporate entrepreneurship and
companies’ performance can be challenging. Lyon, Lumpkin and Dess (2000), suggested the
challenges in measuring the strength of the relationship between entrepreneurship and performance
are possibly due to problems with the operationalization and measurement of entrepreneurship. In
this regard to explore new aspects of the complex and comprehensive field of corporate
entrepreneurship and firm performance it is important to test different measurement instruments.
Therefore this paper focuses in particular on the relationship between entrepreneurship as
opportunity based firm behaviour according to Stevenson (1983) and firm performance. Gagnon,
Sicotte et al. (2000) state that it is justified to believe that Stevenson’s model is adequate to identify
the behaviour of managers in terms of their actions in different processes. In their remarkable study
Brown et al. (2001) developed a measurement instrument based on Stevenson’s conceptualization,
which is the only measurement instrument known to the author that measures corporate
entrepreneurship according to Stevenson’s behavioural approach. However, to our knowledge this
instrument never has been re‐used or linked to firm performance.

However, Brown et al. (2001) discovered a substantial positive correlation between the items of the
two concepts by Covin & Slevin 1993 and by Stevenson (1983), which shows that they are both
measuring different aspects of corporate entrepreneurship. Yet, the fact that none of the
correlations was very high, suggests that the aspects of entrepreneurship discussed by Stevenson as
well as Covin & Slevin are conceptually sound and empirically separable. But if both of these
concepts are covering different equally important aspects of corporate entrepreneurship, it seems
even more surprising that several studies examine the relationship between entrepreneurial
orientation and performance using Covin & Slevin’s scale, whereas no known study about the
relation between Stevenson’s concept and firm performance exists. Therefore this study should
contribute to the corporate entrepreneurship research by abolishing this obvious lack of research in
this area. As Brown et al. (2001) instrument has proven to be a reliable measurement instrument of
entrepreneurial management and researchers generally agree on the positive relationship between
entrepreneurship within an organization and its performance, it can be assumed that entrepreneurial
behaviour according to Stevenson is positive related to firm performance.
Hypothesis:
There is a significant positive relationship between the adaption of an entrepreneurial management
style, measurable in the degree of firm level entrepreneurial behaviour, and companies’ financial
performance.
Brown’s et al. (2001) measure of Stevenson’s conceptualisation of entrepreneurship as opportunity
based firm behaviour is a reliable measurement instrument of the degree of entrepreneurship within
an existing firm. More than a hundred studies where counted that cite their work. However, no
attempt has been made so far to validate or further develop this instrument of measurement.
Therefore, using Brown’s et al. measurement scale as a basis for this paper, will not only help testing
the hypothesis. Additionally, it will lead to a further validation of Davidsson’s, Brown’s & Wiklund’s
measure by examining the scale in the context of another country (Australia).
Further, in the area of corporate entrepreneurship and firm performance, there seem to be a lack of
research with a longer time frame. Zahra, Jennings et al. (1999) were only able to find two studies
which recognized the possibility that the effect of entrepreneurship is long‐term in nature (Zahra
1991; Zahra & Covin 1995). The short time period used (1–2 years), or high attrition among
companies in the sample, meant that the long‐term effects of entrepreneurship on a company’s
performance were unclear. As there seem to be an obvious research gap in exploring the relationship
of corporate entrepreneurship and companies’ performance over a longer time frame, this paper will
further contribute to entrepreneurial research by including companies’ performance over a longer
period (3‐4 years) into the analyses.
5. Research model and methods
As Entrepreneurial behaviour is a mental construct the model of this paper is a latent variable model
(see Bartholomew & Knott 1999). The research model is displayed in figure 2. The underlying
construct of this model is entrepreneurial management. This construct consists of six aspects, the
entrepreneurial dimensions defined by Stevenson. Those dimensions are the latent variables of the
model. In other words, those dimensions are what the measurement instrument in this paper intent
to measure, even though they can’t be measured directly, as they are not directly observable.

Rather, their affect can be measured with the help of separate items (questions of the
questionnaire), which add up to a scale. With the help of those items, which are supposed to tap the
entrepreneurial dimensions, the degree of entrepreneurial behaviour for each company can be
concluded. Finally this degree of entrepreneurial management will be examined in regard to its
relationship to firm performance (hypotheses).
Figure 2: The relationship between entrepreneurial management and firm performance as research model
Before being able to test the hypothesis the measurement instrument of the degree of corporate
entrepreneurship will be developed on basis of Brown’s et al. scale. As one aspect of this paper is the
improvement and further development of the scale some additional questions for the dimensions
Resource Orientation and Reward Philosophy will be developed, hoping to achieve better reliability
(Cronbach’s alpha value) for those dimensions. In a second step the hypothesis will be tested. Daily &
Dalton (1992) note that the multidimensionality of organizational performance makes it unlikely that
any one corporate performance measure could sufficiently capture those multiple performance
dimensions. Therefore, this paper will concentrate on companies’ financial performance. To test the
hypothesis, three different financial performance measures will be tested individually regarding their
relationship to the companies’ degree of entrepreneurial management with the help of a regression
analysis. The measures of organizational performance served as the dependent variable, with
Brown’s et al empirical dimensions as independent variable. The data needed to calculate the
performance measures was extracted from a commercially available database, which regularly
publishes the annual financial data of more than 35 million public and private companies worldwide.
The financial performance over three to four years was included into the study. The values of those
years were merged into one indicator by generating the average for this time period. One indicator
for the six dimensions of entrepreneurial management was generated by adding the scores for each
question and dividing it by the number of questions. In case that all three analyses show a significant
Entrepreneurial
dimensions
Degree of Entrep
reneu
rial beh
aviour/
Entrepreneurial m
anagemen
t Firm
performance
Entrepreneurial Culture
Growth Orientation
Reward Philosophy
Management Structure
Resource Orientation
Strategic Orientation
Hypothesis
Improved replication
Entirely new research purpose

positive relationship between performance measures and the degree of entrepreneurial
management the hypothesis would be supported. In case of a negative outcome of the regression
analyses the hypothesis will be declined.
A sample of 994 employees (from 157 Australian companies) was selected in a two‐step manner
using two different commercially available databases. First of all the companies were chosen with
regard to the selecting criteria Brown et al. (2001) referred to for their research in Sweden. One of
the selecting criteria according to Brown et al. was the size of the companies. Only companies were
chosen which employed between 10 and 249 employees. Another sampling criterion was the
industrial sector, which was divided in four groups of manufacturing, professional services,
wholesale/retail and other services. Furthermore the sample was also divided according to the
corporate governance structure into independent firms, members of company groups with fewer
than 250 employees and members of company groups with 250 employees and more. Beyond we
chose publicly traded companies in Australia as performance data for those firms were easier
available. After utilising a sample of firms the next step was to generate a list of employees working
within these firms to participate in the survey. For this task a second database was used. We were
able to sent questionnaires to all key managers of each firm.
6 Scale Improvement
Browns et al developed items for each of Stevenson’s eight entrepreneurial dimensions. However,
after intensive pretesting they were only able to successfully isolate six empirically distinct factors
from Stevenson’s eight conceptual dimensions. Those six empirical dimensions were: Strategic
Orientation, Resource Orientation, Management Structure, Reward Philosophy, Growth Orientation,
and Entrepreneurial Culture. Unfortunately, they experienced three problems. Firstly, they were
unable to extract a separate factor for Stevenson’s dimension Commitment to Opportunity. As the
items intended not to tap this dimension and new items tend to overlap with Strategic Orientation or
Commitment of Resources the dimension dropped out of the analysis. Secondly, the reliability of the
factor Reward Philosophy (alpha = 0,58) wasn’t very satisfying. Finally, the two conceptual
dimensions Commitment of Resources and Control of Resources merged into one factor, which they
named Resource Orientation. Unfortunately this factor turned also out to have a less than
satisfactory reliability (alpha = 0,58). Brown, Davidson & Wiklund’s interpretation of the analysis was
that their six empirical dimensions represent Stevenson’s eight conceptual dimensions.
A closer look at Stevenson’s two dimensions Commitment of Resources and Control of Resources
shows that the boundary between those dimensions is indeed indistinct. This observation makes it
relatively easy to agree that merging those two dimensions into Resource Orientation can be done
without any loss of information on entrepreneurial behaviour. On the other hand, the case of the
dimension Commitment to Opportunity isn’t that simple. The dropping of this dimension seems
remarkable as dealing with opportunity has been discussed at one of the key aspects of entrepre‐
neurship itself (e.g. Stevenson 1983, Stevenson & Gumpert 1985, Hills & Lumpkin 1997,
Venkataraman 1997, Shane & Venkataraman 2000, Shane 2000, Gaglio & Katz 2001, Shane 2003,
Shane & Eckhardt 2003). One possible explanation is that opportunity recognition is indirectly
reflected in the remaining dimensions. However, this argument doesn’t seem very satisfying.
Another explanation would be, that Stevenson couldn’t capture the core of this dimension in his
conceptualisation what therefore made it impossible for Brown et al to tap it. Brown et al. argue

Commitment to Opportunity would overlap with Strategic Orientation and/or Commitment to
Resources and would therefore be indirectly represented in their scale. Even though this would be
another interesting point for further research, it would go far beyond this paper. Therefore we will
accept Brown’s et all explanation and will concentrate on the improvement of the reliability of the
dimensions Reward Philosophy and Resource Orientation by creating new items for the related
scales.
In developing new items, we followed the guidelines in scale development made by DeVellis (2003).
According to him the first step in developing a scale is to determine clearly what is intended to be
measured. This first step is very important, because the more vague the idea about what should be
measured is, the harder it will be to generate good items. The second step is to generate an item
pool. This item pool should contain a large number of items that are relevant to the content of
interest so it can function as a rich source from which a scale can emerge. After generating the item
pool one need to determine a response format for those items. There are many possible types of
scales and different formats of questions that might have different influence on the success of the
measurement. Therefore it is essential to choose the most suitable format carefully (step three). Step
number four should be having the initial item pool reviewed by experts. This review serves multiple
purposes in order to maximize the content validity of the scale. Reviewers can for example evaluate
the items clarity and conciseness or rate how relevant each items is to what should be measured.
After having the item pool reviewed DeVellis (2003) recommends to consider the inclusion of
validation items. It is often advisable to include some additional items in the same questionnaire that
will help detecting various response biases and determining the validity of the final scale. The sixth
step would be to administer items to a development sample. In other words it means utilizing a
representative sample to fill out the questionnaire in order to generalize the data. The further step is
the evaluation of the performance of the individual items and the factor analysis. DeVellis (2003)
describes this step as the heart of the scale development process. Finally, the eighth and last step is
to optimize the length of the scale by dropping ‘bad’ items.
Fortunately in this case, the first step is fairly simple as we can rely on Brown, Davidsson & Wiklund’s
definition of Reward Philosophy and Resource Orientation. But it ought to be mentioned that their
definitions also rely on Stevenson’s conceptualization of entrepreneurial management. By measuring
Resource Orientation we want to describe to what extend an organisation controls and commits to
resources. In other words, it should be examined whether the organisation commits small amounts
of resources in a multi‐step manner or large amounts of resources (all resources needed to
undertake a project) right at the beginning of a project and also, whether it tend to own as many
resources as possible or as little as necessary. Measuring Reward Philosophy should capture how an
organisation rewards and compensates employees. That means it should be measured whether an
organisation’s reward system is more driven by the creation of value in the longer term or is more
oriented in achieving short‐term profit targets (Stevenson 1983).
After clarifying what the objects of the measurement scale are, the next step is to generate an item
pool. This often difficult task was facilitated by the fact that Stevenson’s conceptualisation is fairly
detailed and provides a good guideline for the development of further questions (Stevenson 1983;
Stevenson & Gumpert 1985). The items’ format was an extended Likert Scale with pairs of
statements representing the opposite end of the entrepreneurial firm/traditional firm continuum
(e.g. Schnell, Hill et al. 2005:187). The advantage of using this scale in a survey is that the statements
can define and clarify one another (Bortz and Döring 2002). However, it can also be a risk as
participants might be confused if the question doesn’t clearly appear as opposite statements to

them, especially, if the content is very complex (Harms 2004). Therefore even though this implies
that each item needs two opposite statements, we started to collect statements for both sides
separately trying to stay as close to Stevenson’s definitions as possible. Only afterwards the opposite
statement to each statement was crafted. We avoided creating pairs of opposite statements by
simply changing a statement from a positive to a negative wording or vice versa. Further, for
questions the same style was adopted that Brown et al. used for their items to ensure they wouldn’t
stand out against the later in the final scale. Due to the length of the final scale the number of new
items needed to be cut down. Therefore the items were searched for redundancies and checked for
the length and the reading difficulty level. Finally we selected three new items developed for Reward
Philosophy and five new items for Resource Orientation.
To ascertain the construct validity researchers should consider the inclusion of validation items.
There are at least two types of items to consider. The first type of items serves to detect undesirable
response tendencies. Respondents might be influenced by other motivations than the researcher
assume. One type of motivation is social desirability, what means an individual is motivated to
present himself/herself in a way that society regards as positive (DeVellis 2003). Strahan and Gerbasi
(1972) developed a 10‐item scale that can be useful for detecting those motivations. Beyond there
are other sources for detecting response biases (Anastasi 1968) that could be included in the scale. In
this survey the primary interest is not about any personal information of the respondent but about
the organisation she or he is employed with. It can be argued that this will weaken the risk of social
desirability. Still it could be argued that employees could tend to present his or her firm as entrepre‐
neurial and innovative as possible. To reduce this tendency the statements for the entrepreneurial
firm appear on the right as well as on the left side of the scale, as already mentioned earlier.
The second type of items that can serve as evidence of the scale validity is the inclusion of other
measurement instruments measuring the same phenomenon. For this purpose Brown et al. chose
the Miller (1983) and the Covin & Slevin (1986; 1988; 1989) entrepreneurial orientation scale and
included it in their survey instrument. Their results reveal that both constructs, entrepreneurial
orientation (Miller 1983, Covin & Slevin 1989) and entrepreneurial management (Stevenson 1983)
are reliable (α= 0,73) and positively related (sig. correlation 0,58). In other words they generated a
valid measure of entrepreneurship as defined by Stevenson which is only partly overlapping with the
entrepreneurial orientation construct and therefore gauge different and distinct factors of
entrepreneurship. However, as Brown’s et al. (2001) items are part of the questionnaire we hereby
included a valid construct.
As a pre‐test (this refers to DeVellis fourth step in scale development, the review of the items) the
questionnaire was handed out to some entrepreneurship academics and a number of business
students. During the pre‐test we experienced some difficulties with the scale. Attempting to use the
same survey design as Brown et al. we used a 10‐items scale. This 10‐items scale represents the in
Stevenson’s conceptualization described promoter‐trustee‐continuum. Therefore, dividing the whole
range of infinite, only marginal different behaviour between the two extremes (pure entrepreneurial
management and pure administrative management) into 10 groups seems to be a clear simplification
already. Unfortunately we experienced that the participants of the pre‐test often had difficulties with
so many gradual variations to choose from, as the differences between two sequent numbers
seemed to be too small to justify a reasonable decision between them. In fact for the questionnaire
the differences between some items of the scale seem marginal. Another reason why we were
concerned to simply replicate Davisson, Brown & Wiklund’s survey was the number of participants,
for we were afraid of getting too little answers per item to get some significant results, if the scale

had too many intervals. In consequence we reduced the number of intervals to 6. Further we clearly
defined the meaning of each of those values in the introduction of the questionnaire. This
modification of the scale shouldn’t be a problem for the attempt to verify Brown’s et al. scale, as
Davidson (2004:176) argues the “real power of a theory is demonstrated through replication. If a
theory is any good, it will show its effect in several slightly different empirical samples, and also be
robust against (valid) variations in operationalization.”1
7. Data collection
A mailed questionnaire (with a pre‐addressed stamped envelope and a personalized cover letter,
addressed to the respondent) was used to collect the data (questionnaire and cover letter can be
requested from the authors). With expiration of the time limit for answering the questionnaire
provided email addresses were used to send out almost 200 reminder emails. Additionally, some
people from the mailing list were called to ask for permission to send them the questionnaire via
email. Even after the remainder only a total number of 34 responses were achieved. After allowing
for undeliverable surveys (approximately 12,3% or 122 questionnaires of the total sample, N= 994),
this describes a response rate of 3,9%.
About the reasons of the low response rate can only be speculated. First of all, it is not difficult to
imagine that CEOs and top manager generally have a busy schedule. Additionally, the general
economic situation might have influenced the result as well. As this survey unfortunately fell just
right within the economic crisis and the exact days the Australian stock markets crashed, it would
make it even harder to convince CEOs and top manager to spend time on filling out a questionnaire.
Further, one factor might be the cultural background. Only a few years ago Loane & Bell (2006)
conducted a survey about entrepreneurial firms in Australia, Ireland and Canada. They achieved a
response rate for Australian companies significantly smaller than the response rates in Ireland and
Canada. Another aspect might be that even though the recipients of the survey were personally
addressed in the cover letter, they weren’t called on the phone prior to sending out the
questionnaires. This probably diminished the chance of a higher response rate. An additional
influencing factor might be that the institution (University of Wuppertal) was likely to be generally
unknown to most of the recipients of the survey.
8. Results
8.1 Descriptive Analysis and testing of the scale
Presenting the results is divided in two parts, exploring the data file (chapter 6.1) and testing the
research hypothesis (chapter 6.2).
Item Mean Median Mode Minimum Maximum Standard Deviation
item 1 3.74 4 5 1 6 1.483
item 2 4.12 4 5 1 6 1.493
1 Further as a result of pre‐testing we had two little changes on two of the original questions from Davidsson, Brown & Wiklund. We
changed the word order of question 3, turning it into a passive sentence, for a better understanding. We also changed one word in question 17, which seemed to be likely to negatively influence the participants. However both changes didn’t have an impact of the content of the questions.
item 3 (reversed) 3.74 4 5 1 6 1.483
3.86
Table 2: Descriptive Measures of Strategic Orientation
The maximum and minimum values for the Strategic Orientation questions indicate that the
responses are spread across the full range of the 6‐item scale. The standard deviation has a value
lower than 1.5 for all three questions and is therefore equally acceptable. According to the responses
there seems to be two groups of firms, those whose Strategic Orientation is more entrepreneurially
and those whose Strategic Orientation tendencies are more towards the administrational side (U‐
shaped distribution). However, the group of firms tending towards an entrepreneurial Strategic
Orientation is significantly bigger.
Index Mean Median Mode Minimum Maximum Standard Deviation
item 4 4.09 4 5 1 6 1.334
item 5 (reversed) 3.50 3 3 1 6 1.261
item 6 (reversed) 3.06 3 3 1 6 1.301
item 7 3.68 4 4/ 5 1 6 1.319
item 8 (reversed) 3.59 4 2/ 5 1 6 1.417
item 9 2.68 3 2 1 5 1.065
item 10 (reversed) 2.53 2 2 1 5 0.929
item 11 (reversed) 3.44 3,5 4 1 6 1.284
item 12 3.41 4 4 1 6 1.158
3.33
Table 3: Descriptive Measures of Resource Orientation
For the dimension Resource Orientation we formulated 5 new questions (item 8‐12 had not been
used by Brown et al. 2001). The results for question 9 and 10 differ from the rest. Whereas the mean
for the other items varies between 3 and 4, question 9 and 10 has a significant lower value. The same
occurs for the median and the mode. Even the standard deviation which lays between 1.16 and 1.42
for the other items has a lower value for question 9 and 10. Taking a closer look at the values for
minimum and maximum one get a first idea, what the cause of these significantly lower values might
be. The responses for question 9 and 10 are not spread across the entire range of the scale, but only
across the first five items of the scale. There could be problems with the formulation of the
questions. The way the questions were formulated could be too strong on the entrepreneurial end so
that none of the participants could identify their company with this extreme. Further, question 9
contains the expressions “long term commitment” and “short period of time” which might be too
vague. Question 10 uses the formulation “even though this strategy may increase the risk of failure”
which might be misleading as obviously every firm tries to reduce the risk of failure. The new
questions 8, 11 and 12 seem to perform equally well in comparison to the adopted questions. In
total, gain we find a U‐shaped distribution with the bigger share of respondents on the
entrepreneurial side of the scale.
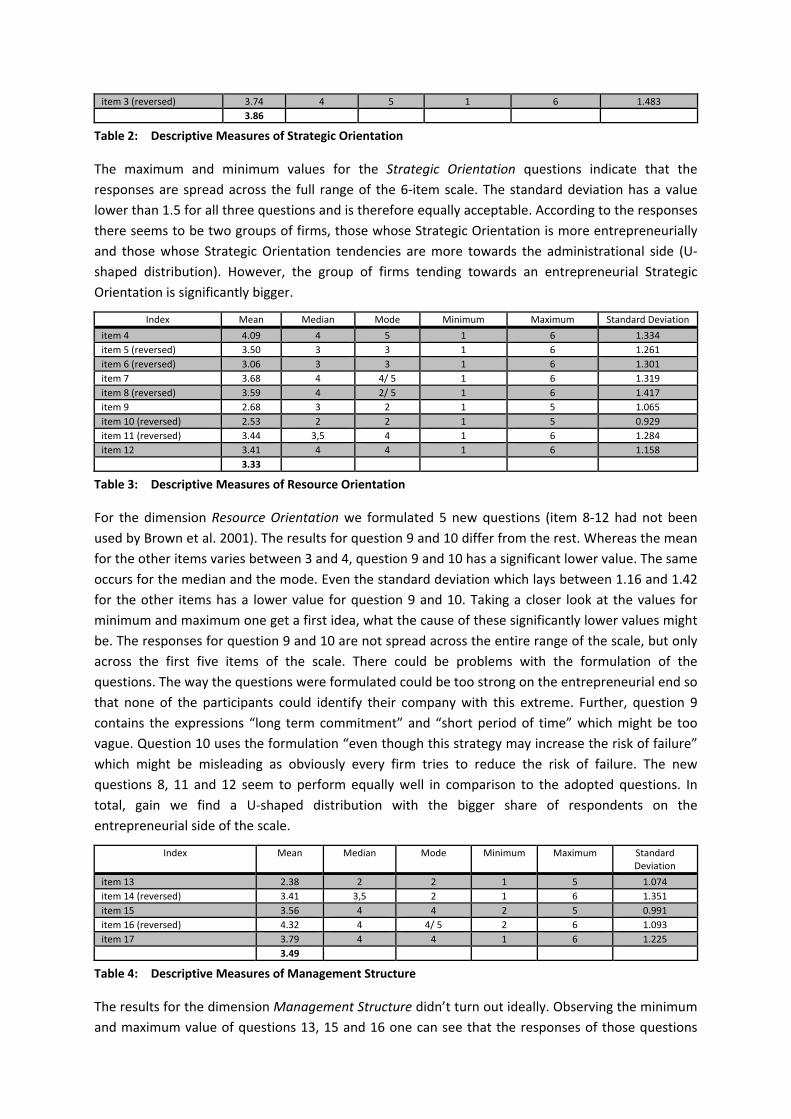
Index Mean Median Mode Minimum Maximum Standard Deviation
item 13 2.38 2 2 1 5 1.074
item 14 (reversed) 3.41 3,5 2 1 6 1.351
item 15 3.56 4 4 2 5 0.991
item 16 (reversed) 4.32 4 4/ 5 2 6 1.093
item 17 3.79 4 4 1 6 1.225
3.49
Table 4: Descriptive Measures of Management Structure
The results for the dimension Management Structure didn’t turn out ideally. Observing the minimum
and maximum value of questions 13, 15 and 16 one can see that the responses of those questions

didn’t cover the complete range of the 6‐item scale. Question 13 and 16 cover 5 values and question
15 only covers 4 values. The values for the standard deviation are accordingly low. The high values of
mean, median and mode of question 16 indicate a negatively skewed deviation. On the opposite, the
low values for question 13 suggest a positive skewed deviation. Reasons for not covering the full
range of the scale could be the formulation of the questions, which might prevent respondents to
choose an extreme answer, or the number of responses. As Brown et al. (2001) didn’t experience any
troubles with those questions in their survey the problem might be based on the second reason here.
Index Mean Median Mode Minimum Maximum Standard Deviation
item 18 4.15 4 5 1 6 1.209
item 19 3.56 3,5 3/ 5 1 6 1.260
item 20 (reversed) 4.03 4 4/ 5 2 6 1.167
item 21 4.35 5 5 2 6 0.981
item 22 3.42 4 4 2 5 1.146
item 23(reversed) 3.48 3 2 2 6 1.202
3.83
Table 5: Descriptive Measures of Reward Philosophy
For the dimension Reward Philosophy we created three new questions (question 21 to 23). Even
though the responses for question 19 cover the full range of the scale and median and mean are
exactly 3.5 and 3.56, the distribution shows that the responses are almost spread equally between 2
and 5 on the scale, so firms seem neither extremely entrepreneurial, nor administrative. This leads to
question 20 to 23, where difficulties with the range can be discovered as well. Question 20, 21 and
23 only have a range of 4, whereas question 22 even has a range of only 3 values. Question 22 and 23
are similar to the deviation of question 19. Their responses are piled up only in the middle of the
scale.
Index Mean Median Mode Minimum Maximum Standard Deviation
item 24 (reversed) 3.76 4 3/ 5 1 6 1.437
item 25 2.94 3 2/ 3 2 6 1.029
3.35
Table 6: Descriptive Measures of Reward Philosophy
Looking at the results for the dimension of Growth Orientation it can be observed that the range for
question 25 again is only 4. In consequence, the standard deviation shows a low value of 1,03. In
total, the results hint to an in two groups divided scale, like it could be found in some questions
before already, indicating a clear distinction of entrepreneurial and administrative firm behaviour.
All questions of the dimension Entrepreneurial Culture only have a range of 4. Accordingly the values
for the standard deviation are very low. The new questions 26 and 28 have a negatively skewed
deviation whereas question 27 has a slightly positively skewed deviation.
Index Mean Median Mode Minimum Maximum Standard Deviation
item 26 (reversed) 4.85 5 5 2 6 0.989
item 27 3.85 4 5 2 6 1.258
item 28 (reversed) 4.18 4 4 2 6 1.086
4.29
Table 7: Descriptive Measures of Entrepreneurial Culture
The descriptive analyses show some difficulties with the range as some questions (13 out of 28) only
reached a range of 4 or even 3 instead of 5 or 6. This could be an effect of the sample size as it was a
problem for adopted (and thereby previously empirically approved) questions and new questions

alike. The first two dimensions Strategic Orientation and Resource Orientation performed well in this
regard. Their graphs display curves with two peak points and therefore allow for discerning
entrepreneurial and administrative enterprises. The questions of the dimension Reward Philosophy
caused some problems with the range, however the results were still acceptable. The distribution
curves of questions related with Reward Philosophy are all (beside the last question) negatively
skewed, indicating a more administrative approach to management in this dimension. The results for
the dimension Management Structure seem to be very diverse what makes it hard to detect any
characteristics they have in common. The outcomes for the questions for Growth Orientation are
very diverse as well. The number of only two questions makes it even more difficult to interpret the
outcomes at this stage of analysis. For the dimension Entrepreneurial Culture more companies
ranked themself towards the entrepreneurial side.
In sum, it can be observed that most distribution curves of the single questions are negatively
skewed (for 21 out of 28 questions). In other words, the companies in this research sample tend
towards the entrepreneurial management style. This result could suggest that the answers were
partly motivated by social desirability as Wiklund (1999:80) state that currently, “entrepreneurship’ is
a very popular term and there is a tendency to regard it as something inherently good, something
firms should always pursue”. However, certain techniques were used to minimise the risk of social
desirability. Further, the assumption that this could be related to specific company characteristics
can’t be confirmed as the research sample is very diverse. The only characteristic the companies
have in common where the cultural background (Australian firms), the maximum size and the fact
that the sample only consists of public companies. The first two characteristics might have a positive
influence on the general tendency towards entrepreneurial management. However, the results are
not significant enough to draw a conclusion about a general effect connected with the Australian
culture or the maximum company size and the degree of entrepreneurial management.
Finally, it can be observed that some of the new questions should be checked for their formulation,
but generally the new questions did perform equally to the transferred questions. However, new
questions as well as adopted questions might perform better for a bigger sample size. Concluding
this could be an interesting option for further research, as according to the first impression the new
questions seem to provide the tools for further development of the scale.
8.2 Factor analysis
Factor analysis refers to a variety of statistical techniques whose common objective is to represent a
broad set of variables in terms of a smaller number of hypothetical variables. It is based on the
fundamental assumption that some underlying factors, which are smaller in number than the
number of observed variables, are responsible for the covariation among the observed variables
(Lewis‐Beck 1994, Stevens 1996 or Tabachnick & Fidell 2001). In this case we have a set of 28 items,
from which (ideally six) different dimensions as underlying latent variables should be extracted,
describing the dimensions of the construct of entrepreneurial management behaviour.
There are two different types of using factor analysis. The exploratory factor analysis is used as an
expedient way of ascertaining the minimum number of hypothetical factors that can account for the
observed covariation. It is often used for possible data reduction. The confirmatory factor analysis is
used as a means of confirming a certain hypothesis that there are a certain anticipated number of
underlying dimensions and that certain variables belong to those dimensions (Lewis‐Beck 1994). In
practice, the division between exploratory and confirmatory factor analysis is not always clear‐cut. In

the context of this study the focus will be more on the confirmatory part as it is based on the
assumption of six existing empirical dimensions as variables describing the construct of
entrepreneurial management behaviour. There is already an assumption about what items describe
which dimension, analyses will hopefully confirm this assumption.
Before starting a factor analysis there are two main issues to consider in determining whether a
particular data set is suitable for factor analysis: the sample size and the strength of the relationship
among the variables or items (Pallant 2005). In this case the sample size might be a critical issue for
the purpose of a factor analysis. The reason is that in small samples the correlation coefficients
among the variables might be less reliable. Factors obtaining from small data sets do not generalise
as well as those derived from larger samples. However there is little agreement among authors
concerning how large a sample should at last be. Tabachnick & Fidell (2001) suggest including at least
300 cases for factor analysis. However, they mention that a smaller sample size should be sufficient if
solutions have several high loading marker variables. Stevens (1996) argues that the sample size
requirements advocated by researchers have been reducing over the years as more research has
been done on this topic. Nunnally (1978) recommends a 10 to 1 ratio: that is, 10 cases for each item.
Others suggest that 5 cases for each for each item is adequate in most cases.2 Unfortunately, for this
case none of those recommended requirements can be achieved. However, we have more than five
cases for each item theoretically connected with one latent variable but Resource Orientation. Still,
there should be an awareness of difficulties with the factor analysis that might result from the
sample size. Generalisations should be derived with great care. According to Brosius (2008) there are
four steps of a factor analysis: generating correlation matrix, factor extraction, factor rotation and
finally factor scores and interpretation.
Latent variables construct
Entrepreneurial Behaviour
Strategic Orientation
Resource Orientation
Management Structure
Reward Philosophy
Growth Orientation
Entrepren Culture
Item 1 Item 4 Item 13 Item 18 Item 24 Item 26 Item 2 Item 5 Item 14 Item 19 Item 25 Item 27 Item 3 Item 6 Item 15 Item 20 Item 28 Item 7 Item 16 Item 21 Item 8 Item 17 Item 22 Item 9 Item 23 Item 10 Item 11 Item 12
Figure 3: Latent variables and the underlying construct
2 See discussion in Tabachnick and Fidell (2001)
latent variables (entrepreneurial dimesnions)
items

8.2.1 Eigenwert Analyses
Every factor analysis should start with an assessment of the data for this analysis. The ultimate
quality one seeks in an item is a high correlation with the true score of the latent variable. Conse‐
quently, it is most important for the analysis that the items which assemble a latent variable
(dimension of entrepreneurial management) are highly intercorrelated. The correlation matrix
display how intercorrelated the items are (the correlation matrix for this study can be found in the
appendix). The very first step is to look for significant correlation coefficients, recommended are
strength of correlations of 0.3 and above and p values for significances < 0.5 (Tabachnick and Fidell
2001; Pallant 2005). Due to the small sample size even p values < 0.1 seem acceptable. The
correlation matrix for this study shows several significant correlation coefficients above 0.3.
However, not all items that were expected to measure the same dimension are highly
intercorrelated. On the other hand, some items that were assumed to measure different dimensions
seem to be highly intercorrelated.
Beside the correlation matrix there are two further statistical measures, which help to assess the
factorability of the data. The first one is the Bartlett’s test of sphericity (Bartlett 1954), which should
be significant (p<0.05) for the factor analysis to be considered appropriate. For this study the
Bartlett’s test of sphericity is smaller 0.0005 and therefore significant. The second measure is the
Kaiser‐Meyer‐Olkin measure (KMO) of sampling adequacy (Kaiser 1970, 1974). The KMO index ranges
from 0 to 1, with 0,6 suggested as the minimum value for a good factor analysis (Tabachnick & Fidell
2001). Yet in the KMO index for the underlying data reaches only 0,391. However this divergence
didn’t seem enough to already reconsider the use of factor analysis but clearly indicates that
generalizations should only be stated with extreme care.
KMO and Bartlett's Test
Kaiser‐Meyer‐Olkin Measure of Sampling Adequacy .391
Bartlett's Test of Sphericity Approx. Chi‐Square 583.158
Df 378
Sig. .000
Table 8: Kaiser‐Meyer‐Olkin Measure and Bartlett’s Test for the purpose of assessing factorability
The main object of the extraction step in exploratory factor analysis is to determine the minimum
number of common factors that would satisfactorily produce the correlations among the observed
variables. Given an exact fit between the factorial model and the data, the communalities and the
number of common factors can be obtained through the estimation of the rank of the adjusted
correlation matrix (the adjustment of the correlation matrix requires inserting the communalities in
the main diagonal). However, this might work in theory, but in actually collected data samples there
will most certainly be sampling errors. As the ultimate criterion for determining the minimum
number of common factors is how well the assumed common factors can reproduce the observed
correlations, the objective of factor extraction can be explained as finding criteria by which to decide
when to stop extracting common factors. This involves determining when the discrepancy between
the reproduced correlations and the observed correlations can be attributed to the sampling
variability (Lewis‐Beck 1994).
There are a variety of approaches that can be used to identify the number of underlying factors or
dimensions. Some examples are principal components; principal factors; image factoring, maximum
likelihood factoring; alpha factoring; unweighted least squares; and generalised least squares. The

most commonly used approach is principal components analysis, which will be used in this analysis.
However, the main reason for choosing this approach for this study was a better comparability with
Brown’s et all study as they too used the principal component analysis.
Determining the number of factors, which best describes the underlying relationship among the
variables, involves balancing conflicting needs: the need to find a simple solution with as few factors
as possible, and the need to explain as much of the variance in the original data set as possible.
Tabachnick & Fidell (2001) recommend to experiment with different numbers of factors until a
satisfactory solution is found. Techniques that can be used to assist in the decision concerning the
number of factors to retain are for example the Kaiser’s criterion, the scree test and parallel analysis.
Kaiser’s criterion or Kaiser’s eigenvalue rule (e. g. Nunnally 1967) is based on retaining only factors
that explain more variance than the average amount explained by one of the original items. Using
this rule, only factors with an eigenvalue of 1 or more are retained for further investigation.
Unfortunately, this criterion often results in extracting too many factors (Zwick & Velicer 1986).
This extract of the ‘total variance explained’ (the complete table can be found in the appendix) shows
that nine factors have a total eigenvalue of more than 1. According to the recommendation to retain
only factors with an eigenvalue of 1 or more this would suggest retaining nine factors. Those nine
factors would explain 77,993% of the variance of the model which would fulfil the need to explain as
much of the variance in the original data set as possible. On the other hand, nine factors wouldn’t
serve the need for a simple solution. And it would imply to consider the existence of nine, not six,
seven or eight dimensions of entrepreneurial management. Further, this method could overestimate
the number of factors, as was mentioned earlier already. Besides, Kaiser’s criterion is not a fast
statistical rule but rather a guideline. Therefore it should be explored whether another number of
factors would be more suitable for this model.
Component
Initial Eigenvalues Extraction Sums of Squared Loadings
Total % of Variance Cumulative % Total % of Variance Cumulative %
1 5.838 20.849 20.849 5.838 20.849 20.849
2 3.277 11.702 32.551 3.277 11.702 32.551
3 2.432 8.685 41.236 2.432 8.685 41.236
4 2.364 8.443 49.679 2.364 8.443 49.679
5 2.188 7.815 57.495 2.188 7.815 57.495
6 1.883 6.723 64.218 1.883 6.723 64.218
7 1.519 5.424 69.642 1.519 5.424 69.642
8 1.256 4.487 74.129 1.256 4.487 74.129
9 1.082 3.864 77.993 1.082 3.864 77.993
10 .964 3.442 81.436
11 .897 3.203 84.638
12 .764 2.727 87.366
Extraction Method: Principal Component Analysis.
Table 9: Part of the table ‘Total Variance Explained’
From table 9 it is obvious that the first factors have a relatively high eigenvalue, whereas the
eigenvalues of the factors below are smaller and decline steadily. The assumption for this survey was
that the model could be explained sufficiently with six factors. But even seven factors would be in
accordance with theory as two of Stevenson’s (1983) theoretical dimensions were merged into the
dimension Resource Orientation. In the case of seven factors the cumulated variance explained
would be 69,642%. For six factors the cumulated variance explained would still be 64,218% (Brown et

al. reached a value of 63,6%). The results for Kaiser’s eigenvalue criteria therefore appear to be
satisfying and comparable to the study we replicate.
Carttell’s scree test (Cattell 1966) is another widely used method for factor extraction. This approach
involves plotting the amount of variance explained (based on factor’s eigenvalue) by each successive
factor. Because each factor explains less variance than the preceding factors, an imaginary line
connecting the markers for successive factors generally runs from the top left of the graph to the
bottom right. The purpose of this plot is to find the ‘elbow’ as a point below which factors explain
relatively little variance and above which they explain substantially more (DeVellis 2003). In the plot
this elbow usually appears as a point at which the shape of the curve changes direction and becomes
more horizontal. Looking at the scree plot for this survey (figure 4) there is obviously a clear break
between the third and fourth component. Components one and two, and to some extent three,
explain or capture much more of the variance than the remaining components. Certainly, extracting
only three components would be an oversimplification for this model, as only 41.236% of the
variances in the model would be explained (see table 9). Interestingly, it appears to be a little
inflexion point of the plot at component no. 7, as there is a change in gradient. This might be a hint
that the assumption of six or seven variables could find at least some support from empirical
evidence.
Figure 4: Scree plot of Eigenvalues for Carttell’s factor extraction test
Methods like Kaiser’s criterion and Carttell’s scree test are techniques to explore the minimum of
factors, which can explain the model satisfactorily. Yet, these techniques don’t provide any
information whether the relation between the extracted factors and the components of the data set
can be reasonably explained or whether the relation is random and doesn’t have any significance or
explanatory value for the model. Therefore, one needs to take a look at the component matrix before
deciding on a number of factors to retain. The component matrix shows the loadings of each of the
items on the four components. Especially for the first three factors most items load quite strongly
well above 0,4. Furthermore, for the factors 4 to 6 there are little less items with loadings above 0.4
but still several items with factors above 0,3. However very few items load on factors 7 to 9 and most
of these loadings are just above 0,3. These findings support to retain only six factors for further
investigation.
0
1
2
3
4
5
6
1 2 3 4 5 6 7 8 9 10 11 12 13 14 15 16 17 18 19 20 21 22 23 24 25 26 27 28
Eigenvalue
Component number
Scree plot

An additional check for the appropriateness of the number of factors that were extracted is to gen‐
erate the correlation matrix that would result if the extracted factors were the only factors of the
model. That matrix is called the reproduced correlation matrix. The closer the values in the repro‐
duced matrix are to the values in the original correlation matrix the better do the factors represent
the true underlying model. The reproduced correlation matrix also shows the residuals, which display
how the reproduced correlations deviate from the observed correlations. As the reproduced matrix
should be very similar to the original correlation matrix, the residuals should be close to zero. In this
case there are 184 (48.0%) nonredundant residuals with absolute values greater than 0.05 for a
model with 6 factors. This can be seen as an indicator for the fit of the overall model. More precise
information provides the single residuals. The reproduced correlation matrix can be found in the
appendix.
Component
1 2 3 4 5 6 7 8 9
Q 1 ,682 ‐,394
Q 2 ,609 ‐,334 ‐,312 ‐,383
Q 3 ,693 ‐,385
Q 4 ,636 ‐,393
Q 5 ,446 ‐,551 ,307
Q 6 ,390 ‐,438 ,622
Q 7 ,745
Q 8 ,639 ‐,372 ,316
Q 9 ,447 ‐,380 ,403 ‐,336
Q 10 ,568 ,518
Q 11 ,715 ‐,322 ,300
Q 12 ,561 ,384 ,440
Q 13 ,454 ,308 ,374 ‐,309 ,407
Q 14 ,415 ‐,455 ,454
Q 15 ,565 ,394
Q 16 ,495 ,675
Q 17 ,539 ,327 ,484 ‐,397
Q 18 ,559 ‐,491 ,320 ‐,317
Q 19 ,620 ,430 ‐,387
Q 20 ,346 ,456 ,487 ‐,426
Q 21 ,324 ,764
Q 22 ,635 ,343
Q 23 ,507 ,677
Q 24 ‐,385 ,461 ,573
Q 25 ‐,307 ,533 ,519
Q 26 ,442 ‐,514 ,335
Q 27 ,540 ,338 ‐,321 ,337 ,335
Q 28 ,417 ‐,519 ,344
Extraction Method: Principal Component Analysis. 9 components extracted; only absolute values above 0.3 are displayed
Table 10: Component matrix for 9 extracted components
8.2.2 Factor rotation
After identifying a suitable number of factors for the model, the next step is to try to interpret them.
Therefore factor rotation involves finding simpler and more easily interpretable factors through
rotation, while keeping the number of factors and communalities of each variable fixed. There are
two main approaches to rotation, resulting in either orthogonal or oblique factor solutions. Orthogo‐

nal factors are the result of keeping factors perpendicular (statistically independent) with respect to
one another in the process of rotation. When this is done, the true value of an item on any given
factor is independent of its true value of an item on any other factor that has been extracted. In
other words, knowing an item’s value on one factor tells you nothing about its value on any other
factor. Alternatively, oblique rotation can be used, which means factors are rotated so that the axis
corresponding to each successive factor is fitted optimally without the constraint of keeping them
perpendicular.
According to Tabachnick & Fidell (2001), orthogonal rotation results in solutions that are easier to
interpret and to report. However, they do require the researcher to assume that the underlying
constructs are independent. Oblique approaches allow for the factors to be correlated, but they are
more difficult to interpret describe and report. In practice the two approaches (orthogonal and
oblique) often result in very similar solutions, particularly when the pattern of correlations among
the items is clear (Tabachnick & Fidell 2001). Consequently, it might be advisable to conduct both
orthogonal and oblique rotations to choose the clearest. The ideal case of a ‘simple structure’
involves each of the variables loading strongly on only one component, and each component being
represented by a number of strongly loading variables, ideally all items connected with a single
dimension of entrepreneurial management.
Within the two broad categories of rotational approaches there are a number of different rotational
techniques (e.g. orthogonal: Varimax, Quartimax, Equamax; oblique: Direct Oblimin, Promax). The
most commonly used orthogonal approach is the Varimax rotation method, which attempts to
minimise the number of variables that have high loadings on each factor. The most commonly used
oblique technique is Direct Oblimin. The Promax rotation is particularly suitable for lager samples
and therefore not suitable in case of our sample.3 To achieve a good comparability with Brown’s et
al. study we should also take into account what methods they had used. For this and the reasons
explained before, we first use Varimax rotation.
The result of the varimax rotation for a 6 factor model is shown in table 6.10. There are only values
more than 0,3 displayed and the highest value for each item is highlighted. First of all, it shows that
every item (besides item 21 and 25) has a loading significantly higher than 0,4. The loadings of the
items 21 and 25 are only 0,336 and ‐0,361. Comparing these results with the component matrix (see
table 10) of the 9 factor model, it is obvious that exactly those two items had the highest loadings on
factor 7 and 8 which didn’t retain in this model.
Further, in an exploratory factor analysis the varimax rotation can be used to help identify the nature
of the underlying latent variable represented by each component. But in this case some assumption
about the underlying latent variables already exists. Already the questionnaire was designed with an
idea about what question should be measuring which dimension. The first three questions were
supposed to measure the dimension Strategic Orientation. Indeed all three questions have their
highest loadings (all above 0,65) on component 2. Those questions are obviously measuring the same
latent variable. But there are two other items, question 4 and question 16, which have their highest
loading on the same component, unexpectedly. Questions 4 to 12 were expected to measure the
dimension Resource Orientation. The highest loadings for these items are mainly scattered over
components 3 to 5, with only one exception for item 8, which highest loading is on component 1.
Through including all loadings with a value higher than 0,3 into the investigations we can see that
3 For a comparison of the characteristics of each of these approaches, see Tabachnick und Fidell (2001, p.615)

three third of the questions 4 to 12 are loaded on component 3. Beside questions of the dimension
Resource Orientation, question 27 is the only other question loading on this component.
Questions 13 to 17 were assumed to measure the dimension Management Structure. The highest
loadings of those questions are wide spread over components 2, 4, 5 and 6. Therefore according to
this matrix it seems like those items wouldn’t describe the same underlying latent variable.
Interestingly this was one of the two dimensions that Brown et al. (2001) had some problems with as
well. Questions number 18 to 23 were intended to measure the underlying latent variable Reward
Philosophy. The highest loadings of those items are split between component 1 and 4. Questions
number 24 and 25 should measure the dimension Growth Orientation. Both items have their highest
(and single) loading on component 6. Finally questions 26 to 28 were intended to measure
Entrepreneurial Culture. The highest loadings for those questions are on components 1, 3 and 4 and
therefore don’t support the assumption of one common underlying latent variable.
Component
1 2 3 4 5 6
Q 1 ,775
Q 2 ,756 ,411
Q 3 ,450 ,651 ,314
Q 4 ,700 ,351
Q 5 ,357 ,627 ‐,313
Q 6 ,812
Q 7 ‐,341 ,534 ,501
Q 8 ,632 ,347
Q 9 ,689
Q 10 ,387 ,634 ‐,336
Q 11 ,796
Q 12 ,735
Q 13 ,433 ,461
Q 14 ,780
Q 15 ,533
Q 16 ,383 ‐,624 ,406
Q 17 ,333 ,423 ,647
Q 18 ,725 ,351
Q 19 ,306 ,635
Q 20 ,687
Q 21 ,336
Q 22 ,766
Q 23 ,750 ,314
Q 24 ‐,617
Q 25 ‐,361
Q 26 ,692
Q 27 ,711
Q 28 ,365 ,572
Extraction Method: Principal Component Analysis. Rotation Method: Varimax with Kaiser Normalization. a. Rotation converged in 13 iterations.
Table 11: Rotated component matrix
8.2.3 Interpretation of varimax rotation
Unfortunately, the questions cannot be assigned to the expected dimension that clearly. Only the
dimensions Strategic Orientation and Growth Orientation can be clearly assigned. Strategic

Orientation has all its highest loadings on factor 2. Growth Orientation has all its highest loadings on
factor 6. Therefore, it can be argued that those two dimensions could be extracted. The questions for
the dimension Resource Orientation have their highest loadings scattered across the first five factors.
If you take the second highest loadings into consideration as well, most of those questions have high
loadings on the third factor. So it can be assumed carefully, that the factor 3 is actually measuring the
dimension Resource Orientation. The questions for the dimension Reward Philosophy load equally on
factor 1 and 4. Only from the results of the factor rotation it is impossible to decide on one of them.
The questions for the dimension Management Structure have their highest loadings scattered over
factor 2, 4, 5 and 6. The similar scenario can be observed for the dimension Entrepreneurial Culture.
The questions for this dimension are distributed over factor 1, 3 and 4. However, due to the small
sample size one should not generalize from the results. A statement that the six distinguished
dimensions of entrepreneurial management as defined by Stevenson (1983) do not exist would
clearly over burden the underlying data of this study.
8.2.4 Reliability analysis
While developing a measurement scale one need to be aware of two characteristics: reliability and
validity. Both of these factors can influence the quality of the data obtained. The validity of a scale
serves as an indicator for the adequacy of a scale as a measure of a specific variable. In other words,
it refers to the degree to which it measures what it is supposed to measure. There are three different
types of scale validity: content validity, criterion‐related validity and construct validity. Content
validity concerns item sampling adequacy – that is, the extent to which a specific set of items reflects
a content domain. In theory, a scale has content validity when its items are a randomly chosen
subset of the universe of appropriate items. Criterion‐Related Validity means an item or scale is
required only to have an empirical association with some criterion or ‘gold standard’. Thus criterion
validity per se is more an issue because it is not concerned with the understanding of a process but
merely with predicting it. In fact, criterion related validity is often referred to as predictive validity.
Construct validity is directly concerned with the theoretical relationship of a variable to other
variables. It is the extent to which a measure ‘behaves’ the way that the construct it purports to
measure should behave with regard to established measures of other constructs. Unfortunately
there is no one clear‐cut indicator of a scale’s validity. Therefore every analysis underlies the
assumption of scale validity.
Reliability refers to the extent to which a measure is free of random measurement error (Tharenou
et al. 2007). Whereas validity concerns whether the variable is the underlying cause of item
correlation, reliability concerns how much a variable influence a set of items. Even reliability has
different aspects but the most important question in regard to the reliability of a scale is internal
consistency. Internal consistency is concerned with the homogeneity of the items comprising a scale.
If the items of a scale have a strong relationship to their latent variable, they will have a strong rela‐
tionship to each other. Although we cannot directly observe the linkage between items and the
latent variable, we can certainly determine whether the items are correlated to one another. A scale
is internally consistent to the extent that its items are highly intercorrelated. High inter‐item correla‐
tions suggest that the items are all measuring the same thing. It further can be concluded that strong
correlation among items imply strong links between items and latent variable (DeVellis 2003). Inter‐
nal consistency is typically equated with Cronbach’s coefficient alpha (in short Cronbach’s alpha;
Cronbach 1951).

In general, a more reliable scale increase statistical power for a given sample size (or allow a smaller
sample size to yield equivalent power), relative to less reliable measures. However, while different
levels of reliability are required, depending on the nature and purpose of the scale, Nunnally (1978)
recommends a minimum level of 0.7. According to others the alpha value is already significant for a
value of 0,6 and above (e.g. Hair, Anderson et al. 1998). However, Cronbach’s alpha values are
dependent on the number of items in the scale. When there is a small number of items in the scale
(fewer than ten), Cronbach’s alpha values can be quite small.
Index Cronbach’s
alpha
Corrected
item‐total
correlation
Cronbach's
Alpha if
Item
Deleted
Strategic Orientation ,814
Item 1 ,626 ,783
Item 2 ,701 ,706
Item 3 ,667 ,742
Resource Orientation ,648
Item 4 ,393 ,604
Item 5 ,310 ,625
Item 6 ,396 ,604
Item 7 ‐,193 ,735
Item 8 ,419 ,597
Item 9 ,196 ,647
Item 10 ,299 ,628
Item 11 ,692 ,526
Item 12 ,552 ,570
Management Structure ,547
Item 13 ,232 ,533
Item 14 ,281 ,515
Item 15 ,382 ,456
Item 16 ,194 ,554
Item 17 ,488 ,370
Reward Philosophy ,610
Item 18 ,249 ,605
Item 19 ,471 ,508
Item 20 ,327 ,572
Item 21 ,215 ,610
Item 22 ,226 ,610
Item 23 ,582 ,458
Growth Orientation ,295
Item 24 ,182 ‐
Item 25 ,182 ‐
Entrepreneurial Culture ,261
Item 26 ,088 ,295
Item 27 ,125 ,241
Item 28 ,222 ,012
Table 12: Reliability analysis with Cronbach’s alpha for the scale
Another information of interest is the corrected item‐total correlation. As the set of items should be
highly intercorrelated, each individual item should correlate substantially with the collection of
remaining items. We can examine this property for each item by computing its item‐total correlation.
The uncorrected item‐total correlation correlates the item in question with the entire set of candi‐
date items, including itself. The corrected item‐scale correlation correlates the item being evaluated
with all the scale items, excluding itself. As every item will necessarily correlate with itself, the
corrected version makes more sense. Generally applies the higher the value the better the item.
Nunnally (1967) recommends a value of 0.4 or more for the item‐total correlation, whereas others

recommend a minimum of 0.3 (e.g. Pallant 2005). Here, due to the large number of items and the
small sample size, a minimum of 0.3 seems sufficient. Low values may indicate that the item is
measuring something different from the scale as a whole.
Table 12 shows the results for the reliability analysis for this study (all generated reliability statistics
can be found in the appendix). Looking at the Cronbach’s alpha value of 0.814 for Strategic
Orientation it shows to be higher than the recommended minimum level of 0.7. This value comes
very close to the result provided by Brown et al. (2001), who extracted an alpha value of 0.82. None
of the items could be removed from the scale without reducing Cronbach’s alpha coefficient.
The alpha coefficient for Resource Orientation is 0.648 and therefore higher than the alpha value
detected by Brown et al. (2001) with 0.58. In other words, one of the objectives of this paper, to gain
a better reliability for the dimension of Resource Orientation through including new questions, has
been achieved. Further, the new items seem to perform quite well in regard to the scale reliability.
According to Hair, Anderson et al. (1998) the alpha value above 0.6 indicates the reliability of the
scale. By removing item 7 an even higher alpha value of 0.735 could be reached. Surprisingly, item 7
is one of the adopted items, not one of our newly edited questions.
The scale of the dimension Management Structure shows a dissatisfactory result for Crobach’s alpha.
With a value of 0.547 it is significant lower than the alpha in Brown’s at al (0.78). Further, all but one
item in this scale have a lower corrected item‐total correlation than recommended. Through
exclusion of factor 16 a slightly higher Cronbach’s alpha coefficient of 0,554 could be obtained. But
even according to Hair, Anderson et al. (1998) it would still be under the minimum value of 0,6 to
achieve reliability. Therefore, Management Structure cannot be proven replicable, but however, the
small sample size does not allow any generalization based on this result.
In addition to the dimension Resource Orientation we also added new question to the dimension of
Reward Philosophy in order to achieve a better reliability for the scale. With an alpha coefficient of
0.610 (in comparison to 0.58 in Brown’s et al. study) the scale for Reward Philosophy is reliable.
Nevertheless, both items 21 and 22 show low item‐total correlations of 0.215 and 0.226. Anyhow,
their exclusion from the scale wouldn’t lead to any changes of the alpha value. Therefore, in regard
to the principle of simplicity it could be advisable to exclude them. The newly added item 23 on the
other hand produces the highest item‐total correlation for this dimension and therefore seems to
capture an additional aspect of Reward Philosophy.
The scales of the last two dimensions, Growth Orientation and Entrepreneurial Culture, perform very
poorly in the reliability analysis with values of 0.295 and 0.261. All corrected item‐total correlations
are below 0.23. By removing item 26 a slightly higher alpha coefficient of 0.295 could be reached for
Entrepreneurial Culture, but this would still be far from reliable. For the dimension Growth Orienta‐
tion the value for Cronbach’s alpha after deleting one of the items even turned out negative due to a
negative average covariance among items. As this violates reliability model assumptions they are not
displayed in the table. Surprisingly, the outcome of the factor rotation in the factor analysis seemed
promising for Growth Orientation, as both items were exclusively loaded on one dimension.
Concerning Growth Orientation, the ongoing economic crises possibly stunted the perception of
items related to growth.
In sum the scales of the dimensions Strategic Orientation, Resource Orientation and Reward Philoso‐
phy achieved alpha coefficients above 0,6, which means they are reliable (Hair, Anderson et al.
1998). The reliability of the scale of the dimension Management Structure couldn’t be verified, as the
alpha value lies just below the recommended minimum. Unfortunately, the dimensions Growth

Orientation and Entrepreneurial Culture performed really poorly. A methodological explanation for
the poorly performing items might be the small number of items in the scale. As mentioned earlier a
small number of items (less than 10) might cause lower alpha values.
The aim of including new question for the dimensions Resource Orientation and Reward Philosophy
was to try to comprise some aspects of those dimensions that seem to be missing in the scale of
Brown’s et al. study. In the case of Resource Orientation this attempt succeeded as all new questions
add to the alpha value making it significant. But even in the case of the dimension Reward Philosophy
one of the three added questions produces a significant alpha value.
9 Evaluation of the scale – results
The scale analysis of this exemplary study provides some interesting results. The analysis found some
significant characteristics of the measurement instrument. However, some problems that occurred
could be related to the small number of responses, as for some items the maximum span of values
remained under‐utilized. In this context, the reduction of the 10‐item scale from Brown’s et al. study
to a 6‐item scale turned out to be the right decision to make. Furthermore, in regard to the low
response rate this reduction of the size of the scale was beneficial, if not necessary. However, the
under‐utilized range in values of some questions could also be related to the wording of the
questions. For further research the wording of some questions should be reconsidered.
Another peculiarity was that exactly two dimensions, Strategic Orientation and Resource Orientation,
don’t show a normal distribution curve. The graphs of 6 out of 12 questions are split into two groups.
Their curves have two peak points, reassembling a U‐shaped distribution. According to those
questions it can be assumed that a classification of the companies into two groups (administrative
and entrepreneurial group) could be easily accomplished. Even though participants were forced to
position their company at either the entrepreneurial or the administrative side, due to the 6‐item
scale, the results could have still be piled up in the middle. Reasons for the U‐shaped distribution
could have something to do with the nature of those two dimensions (Strategic Orientation and
Resource Orientation) or underlying characteristics of the entrepreneurial management construct.
Possibly Strategic Orientation and Resource Orientation forces a company more than the other
dimensions to position itself clearly on one of those sides more than the other dimensions do.
Further it is obvious that the distribution curves are mostly (for 21 out of 28 questions) skewed
towards the entrepreneurial side. This could be caused by a general tendency to answer accordingly
to social expectations. Participants want to present their company in a desirable way. In this study
we minimized the risk of answers motivated more by social desirability than the actual situation in
the participant’s company by reversing some questions. On the other hands, the effect could also be
interpreted in the way that most of the participating companies implemented a more
entrepreneurial management style. This observation could be caused by cultural characteristics
(Australia, a young and pioneering, fast growing country) or by industry and firm size specific
strategies. Another reason for a tendency towards the entrepreneurial side could be the flow of time.
Stevenson’s approach, novel in 1983, has – in the meanwhile – gained strong influence in
mainstream management and on the advice given by strategic management consultants. E.g. flexible
capital structures, flat hierarchies, networks and value based compensations are more common
practice today than they used to be back when Brown et al. conducted their original survey.

In general, a high level of correlations between items indicates that they are measuring one common
underlying construct of entrepreneurial management. But by far not all correlations proved to be
significant. Yet, the factor extraction didn’t turn out like expected too. However, according to the
eigenvalue rule 9 factors could still be extracted, whereas the scree plot indicates that the
assumption of three, six or seven factors might be applicable as well. This finding is supported by the
component matrix which indicates six dimensions, totally in accordance to the underlying construct.
The low number of significant correlations could indicate that the implication of just some –
nowadays modern – principles of entrepreneurial management – e.g. outsourcing – does not suffice
to create “entrepreneurial management” in its full account throughout the organization. Likely, to be
a more entrepreneurial organization, it is not enough to score “entrepreneurial” just on some
modest items, but neglecting other dimensions. In short: The missing significance of so many
correlations could be caused by the fact that too many companies don’t head for entrepreneurial
management consequently enough, but only pick some attributes which can easily be adopted within
an organization that is still administrative at its core.
Moreover, the development of any scale always requires checking whether the measurement
instrument is in fact measuring the underlying construct or whether it might measure some secon‐
dary factors. The challenge in the case of the model of entrepreneurial management is the
complexity of the model itself. In this paper even though the extraction of the individual dimensions
turned out to be difficult, the overall result of testing the scale was still quite acceptable, especially
when taking into account the sample size. The –nothing more than moderate – results from the
factor analysis partly arise from the approach of the analysis. With an exclusively exploratory factor
analysis the results might have turned out a bit better. The minimum requirement of any
confirmatory factor analysis is that one hypothesizes beforehand the number of common factors.
However, the hypothesis must be based on an understanding of the nature of the variable under
consideration, as well as on expatiations concerning which factor is likely to load on which variables.
For this factor analysis we relied on the results of Brown’s et al. study and expected therefore to get
similar results. Therefore, to concentrate on only one possible outcome out of the almost limitless
variety of options is obviously restricting the results (Lewis‐Beck 1994), but the only way to strive for
replication effectively.
One of the objectives of this paper is to gain a better reliability for the dimension of Resource
Orientation and Reward Philosophy by including new questions. Generally, the reliability analysis
didn’t result in a satisfactory alpha value for all associated variables. The reliability of the dimensions
Growth Orientation and Entrepreneurial Culture can’t be verified (and due of the small sample size,
can’t be denied in general either, but is put in question). The alpha values for the other dimensions
are between moderate to extensive. The dimensions Resource Orientation and Reward Philosophy
could achieve a clearly better alpha value than in the study of Brown et al. Therefore the objective of
this paper in that respect has been achieved. Further, the new items seem to perform quite well in
regard to the scale reliability. Generally the new questions did perform equally to the replicated
questions. However, new questions as well as replicated questions might perform even better for a
bigger sample size. Concluding the study was partly successful and provides many interesting options
for further research, as the new questions certainly provide tools for further development of the
measurement of “entrepreneurial management”.

10 Linking Entrepreneurial Management to Firm Performance
Based on the survey results, an Entrepreneurial Management Index has been calculated for each
firm. Firms can reach an index score from zero (absolutely administrative) to five (very
entrepreneurial). We have used five performance indicators. These indicators have been selected
because they are likely to especially capture the impact of entrepreneurial performance and are of
strategic relevance, namely turnover growth, value added (enterprise value), return on total assets,
and return on shareholder funds. Scatterplots for all performance measures and EM index indicate
no empirical linkage between the index score and firm performance. Accordingly, tests for
correlations didn’t bring any significant results for both, Pearsons r and non‐parametric tests. Our
explorative study therefore failed to show any significant influence of Entrepreneurial Management
on firm performance. However, due to the small sample size and the diversity of the sample set, this
result should not be overemphasized. Further empirical research with narrower (i.e. less
heterogeneous) but bigger samples is needed for drawing conclusions. For the moment, a simple
saying that “entrepreneurial management is always the better strategic choice” does not hold in the
light of empirical results.
2,5
3
3,5
4
4,5
5
‐2 0 2 4 6 8 10 12
EM index
turnover growth average 2006‐2008
Turnover growth
2,5
3
3,5
4
4,5
5
‐20 0 20 40 60 80 100 120
EM index
Value added/ enterprise value average 2006‐2008
Value added/ enterprise value

Figure 5: Performance Measurements in Relation to Entrepreneurial Management Index
References
Anastasi, A. (1968). Psychological testing. New York, Macmillan. Antoncic, B. and R. D. Hisrich (2003). "Clarifying the intrapreneurship concept." Journal of Small Business and
Enterprise Development 10(1): 7. Antoncic, B. and R. D. Hisrich (2003a). "Privatization, Corporate Entrepreneurship, and Performance: Testing a
Normative Model." Journal of Developmental Entrepreneurship 8(3): 197. Antoncic, B. and R. D. Hisrich (2004). "Corporate entrepreneurship contingencies and organizational wealth
creation." The Journal of Management Development 23(5/6): 518. Baden‐Fuller, C. (1995). "Strategic innovation, corporate entrepreneurship and matching outside‐in to inside‐out
approaches to strategy research." British Journal of Management 6: 3 (14 pages). Barringer, B. R. and A. C. Bluedorn (1999). "The relationship between corporate entrepreneurship and strategic
management." Strategic Management Journal 20(5): 421‐444. Bartholomew, D. J. and M. Knott (1999). Latent Variable Models and Factor Analysis. London, Arnold,a member
of the Hodder Headline Group. Bellu, R. R. (1987). Towards a therory of entrerpeneurial behaviour. Ann Arbor, MI, UMI. Borch, O. J., M. Huse, et al. (1999). "Resource configuration, competitive strategies, and corporate
entrepreneurship: An empirical examination of small firms." Entrepreneurship Theory and Practice 24(1): 49 (22 pages).
Bortz, J. and N. Döring (2002). Forschungsmethoden und Evaluation: Für Human‐ und Sozialwissenschaftler. Berlin, Springer.
Brosius, F. (2008). SPSS 16. Heidelberg, mitp.
2,5
3
3,5
4
4,5
5
‐160 ‐140 ‐120 ‐100 ‐80 ‐60 ‐40 ‐20 0 20 40 60
EM index
ROTA average 2005‐2008
ROTA
2
2,5
3
3,5
4
4,5
5
‐250 ‐200 ‐150 ‐100 ‐50 0 50 100
EM index
Return on shareholder funds average 2005‐2008
Return on shareholder funds

Brown, T. E., P. Davidsson, J. Wiklund (2001). "An operationalization of Stevenson's conceptualization of entrepreneurship as opportunity‐based firm behavior." Strategic Management Journal 22(10): 953.
Busenitz, L. W. and J. B. Barney (1997). "Differences between entrepreneurs and managers in large organizations: Biases and heuristics in strategic decision‐making." Journal of Business Venturing 12(1): 9 (22 pages).
Carland, J. W., F. Hoy, et al. (1984). "Differentiating Entrepreneurs from Small Business Owners: A Conceptualization." Academy of Management. The Academy of Management Review 9(2): 354 (6 pages).
Cattell, R. B. (1966). "The scree test for number of factors." Multivariate Behavioral Research(1): 245‐276. Covin, J. G. (1991a). "Entrepreneurial Versus Conservative Firms: A Comparison of Strategies and Performance."
The Journal of Management Studies 28(5): 439. Covin, J. G., R. D. Ireland, et al. (2003). Exploring and exploitation functions of corporate venturing. Seattle, WA,
Paper presentation: Academy of Management, Annual Meeting. Covin, J. G. and M. P. Miles (1999). "Corporate entrepreneurship and the pursuit of competitive advantage."
Entrepreneurship Theory and Practice 23(3): 47 (17 pages). Covin, J. G. and D. P. Slevin (1986). "The development and testing of an organizational‐level entrepreneurship
scale." Frontiers of entrepreneurship research: 628‐639. Covin, J. G. and D. P. Slevin (1988). "The Influence of Organization Structure on the Utility of an Entrepreneurial
Top Management Style." The Journal of Management Studies 25(3): 217‐34. Covin, J. G. and D. P. Slevin (1989). "Strategic Management Of Small Firms In Hostile And Benign E." Strategic
Management Journal 10(1): 75‐87. Covin, J. G. and D. P. Slevin (1991). "A Conceptual Model of Entrepreneurship As Firm Behavior."
Entrepreneurship Theory and Practice 16(1): 7. Covin, J. G. and D. P. Slevin (1993). "A response to Zahra's 'Critique and Extension' of Entrepreneurship Model."
Entrepreneurship Theory and Practice 17(4): 23. Covin, J. G., D. P. Slevin, et al. (2000). "Pioneers and followers: Competitive tactics, environment, and firm
growth." Journal of Business Venturing 15(2): 175. Cronbach, L. J. (1951). "Coefficient alpha and the internal structure of tests." Psychometrika 16: 297‐334. Daily, C. M. and D. R. Dalton (1992). "The Relationship Between Governance Structure and Corporate
Performance in Entrepreneurial Firms." Journal of Business Venturing 7(5): 375 (12 pages). Davidsson, P. (2004). Researching entrepreneurship. Boston :, Springer. Davidsson, P. (2008). The Entrepreneurship Research Challenge. Cheltenham :, Edward Elgar Publishing Limited. Dess, G. G., G. T. Lumpkin, et al. (1999). "Linking corporate entrepreneurship to strategy, structure, and process:
Suggested research directions." Entrepreneurship Theory and Practice 23(3): 85 (18 pages). DeVellis, R. F. (2003). Scale Development ‐ Theory and Applications. Thousand Oaks, Sage Publications. Drucker, P. (1970). "Entrepreneurship in business enterprise." Journal of Business Policy 1(1): 3‐13. Drucker, P. F., Ed. (1986). Innovation and entrepreneurship : practice and principles. London, Pan Books. Eisenhardt, K. M. and S. Brown, L. (1998). "Competing on the edge: Strategy as structured chaos." Long Range
Planning 31(5): 786. Foster, J. J. (2001). Data Analysis Using SPSS for Windows. London, Sage Publications. Gaglio, Connie M. / Katz, Jerome A. (2001): The Psychological Basis of Opportunity Identification: Entrepreneurial
Alertness. In: Small Business Economics, S. 95‐111 Gagnon, Y.‐C., H. Sicotte, et al. (2000). "Impact of SME Manager's Behavior on the Adoption of Technology."
Entrepreneurship Theory and Practice: 43‐57. Gartner, W B. (1988): Who is an Entrepreneur? Is the Wrong Question. In: American Journal of Small Business,
Vol. 12, Nr. 4, S. 11‐32. Gravetter, F. J. and L. B. Wallnau (2000). Statistics for the behavioral science. Belmont, CA, Wadsworth. Hair, J. F., R. E. Anderson, et al. (1998). Multivariante Data Analysis. Upper Saddle River, N.J., Prentice Hall. Harms, R. (2004). Entrepreneurship in Wachstumsunternehmen: Unternehmerisches Management als
Erfolgsfaktor. Wiesbaden, Deutscher Universitäts‐Verlag. Hills, G. E. / Lumpkin, G. T. Et Al. (1997): Opportunity Recognition: Perceptions and Behaviors of Entrepreneurs.
In: Reynolds, P. D. et al. (Hrsg.): Frontiers of Entrepreneurship Research. Wellesley MA: Babson College. Hitt, M. A., R. D. Ireland, et al. (2001). "Guest editors' introduction to the special issue: Strategic
entrepreneurship: Entrepreneurial strategies for wealth creation." Strategic Management Journal 22(6/7): 479.
Hubbard, R., D. E. Vetter, et al. (1998). "Replication in strategic management: Scientific testing for validity, generalizability, and usefulness." Strategic Management Journal 19(3): 243 (12 pages).
Ireland, R. D., M. A. Hitt, et al. (2001). "Integrating entrepreneurship and strategic management actions to create firm wealth." The Academy of Management Executive 15(1): 49 (15 pages).

Ireland, R. D., D. F. Kuratko, et al. (2003). Antecedents, elements, and consequences of corporate entrepreneurship strategy. Seattle, WA, Best Paper Proceedings: Academy of Management, Annual Meeting.
Kuratko, D. F., R. Duane Ireland, et al. (2004). Corporate entrepreneurship behavior among managers: a review of theory, research, and practice. Corporate entrepreneurship. J. A. Katz and D. A. Shepherd. Oxford, Elsevier Ltd. 7: 7‐45.
Landau, S. and B. S. Everitt (2004). A Handbook of Statistical Analyses using SPSS. Boca Raton, Champman & Hall/ CRC.
Lewis‐Beck, M. S. (1994). Factor Analysis & Related Techniques. London, Sage Publications. Loane, S. and J. Bell (2006). "Rapid internationalisation among entrepreneurial firms in Australia, Canada, Ireland
and New Zealand." International Marketing Review 23(5): 467. Lumpkin, G. T. and G. G. Dess (1996). "Clarifying the entrepreneurial orientation construct and linking it to
performance." Academy of Management. The Academy of Management Review 21(1): 135. Lumpkin, G. T. and G. G. Dess (1997). Proactiveness versus competitive agressiveness: Teasing apart key
dimensions of an entrepreneurial orientation. Frontiers of Entrepreneurship Reserach. P. D. Reynolds. Wellesley, MA: Center for Entrepreneurial Studies: 47‐58.
Lyon, D. W., G. T. Lumpkin, et al. (2000). "Enhancing entrepreneurial orientation research: Operationalizing and measuring a key strategic decision making process." Journal of Management 26(5): 1055.
Miller, D. (1983). "THE CORRELATES OF ENTREPRENEURSHIP IN THREE TYPES OF FIRMS." Management Science (pre‐1986) 29(7): 770.
Miller, D. and P. H. Friesen (1982). "Innovation in Conservative and Entrepreneurial Firms: Two Models of Strategic Momentum." Strategic Management Journal 3(1): 1 (25 pages).
Miller, D. and P. H. Friesen (1983a). "Strategy‐Making and Environment: The Third Link." Strategic Management Journal 4(3): 221.
Morris, M. H. and D. L. Sexton (1996). "The concept of entrepreneurial intensity: Implications for company performance." Journal of Business Research 36(1): 5 (9 pages).
Nunnally, J. C. (1967). Psychometric Theory. New York, N.Y., McGraw‐Hill. Nunnally, J. C. (1978). Psychometric Theory. New York, N.Y., McGraw‐Hill. Pallant, J. (2005). SPSS survival guide. New York, Open University Press. Schnell, R., P. Esser, et al. (2005). Methoden der empirischen Sozialforschung. München, Oldenburg Verlag. Shane, S. (2000): Prior Knowledge and the Discovery of Entrepreneurial Opportunities. In: Organization Science,
Vol. 11, No. 4, pp. 448‐469. Shane, Scott (2003): A General Theory of Entrepreneurship: The Individual‐Opportunity Nexus. Cheltenham, UK:
Edward Elgar. Shane, S./ Eckhardt, J. (2003): The Individual‐Opportunity Nexus. In: Acs, Z. J. / Audretsch, D. B. (ed.): Handbook
of Entrepreneurship Research: An Interdisciplinary Survey and Introduction. Boston MA etc.: Kluwer Academic Publishers, pp. 161‐191.
Shane, S. and S. Venkataraman (2000). "The promise of entrepreneurship as a field of research." Academy of Management. The Academy of Management Review 25(1): 217 (10 pages).
Sharma, P. and J. J. Chrisman (1999). "Toward a reconciliation of the definitional issues in the field of corporate entrepreneurship." Entrepreneurship Theory and Practice 23(3): 11 (17 pages).
Shepherd, D. A. and J. A. Katz (2004). Innovation and Corporate Entrepreneurship. Corporate Entrepreneurship. D. A. Shepherd and J. A. Katz. Oxford, Elsevier Ltd. 7: 1‐6.
Shepherd, D. A. and N. F. Krueger (2002). "An intentions‐based model of entrepreneurial teams' social cognition." Entrepreneurship Theory and Practice 27(2): 167‐85.
Smart, D. T. and J. S. Conant (1994). "Entrepreneurial orientation, distinctive marketing competencies and organizational performance." Journal of Applied Business Research 10(3): 28 (11 pages).
Stevens, J. (1996). Applied multivariate statistics for the social science. Mahway, NJ, Lawrence Erlbaum. Stevenson, H. H. (1983). "A perspective on entrepreneurship." Harvard Business School Working Paper 9‐384‐
131. Stevenson, H. H. and D. E. Gumpert (1985). "The Heart of Entrepreneurship." Harvard Business Review 63(2): 85. Stevenson, H. H. and J. C. Jarillo (1990). "A Paradigm of Entrepreneurship: Entrepreneurial Management."
Strategic Management Journal 11: 17‐27. Stevenson, H. H. and J. C. Jarrillo‐Mossi (1986). "Preserving Entrepreneurship as Companies Grow." The Journal
of Business Strategy 7(1): 10‐23. Stopford, J. M. and C. W. F. Baden‐Fuller (1994). "Creating corporate entrepreneurship." Strategic Management
Journal 15(7): 521 (16 pages).

Strahan, R. and K. Gerbasi (1972). "Short, homogenous version of the Marlowe‐Crowne Social Desirability Scale." Journal of Clinical Psychology 28: 191‐193.
Tabachnick, B. G. and L. S. Fidell (2001). Using multivariate statistics. New York, HarperCollins. Tharenou, P., R. Donohue, et al. (2007). Management Research Methods. Melbourne, Cambridge University
Press. Venkataraman, S. (1997): The Destinctive Domain of Entrepreneurship Research: An Editor’s Perspective. In:
Katz, J. / Brockhaus, J. (Hrsg.): Advances in Entrepreneurship, Firm Emergence, and Growth. Greenwich, CT: JAI Press, pp. 119‐138.
Vesper, K. H. (1990). New venture strategies. Englewood Cliffs, N.J., Prentice Hall. Wiesner, R., J. McDonald, et al. (2007). "Australian small and medium sized enterprises (SMEs): A study of high
performance management practices." Journal of Management and Organization 13(3): 227‐248. Wiklund, J. (1999). "The sustainability of the entrepreneurial orientation‐‐performance relationship."
Entrepreneurship Theory and Practice 24(1): 37 (12 pages). Zahra, S. A. (1986). "A canonical analysis of corporate entrepreneurship antecedents and impact on
performance." Proceedings of the National Academy of Management 46: 71‐75. Zahra, S. A. (1991). "Predictors and Financial Outcomes of Corporate Entrepreneurship: An Exploratory Study."
Journal of Business Venturing 6(4): 259. Zahra, S. A. (1993). "Environment, corporate entrepreneurship, and financial performance: A taxonomic
approach." Journal of Business Venturing 8(4): 319 (22 pages). Zahra, S. A. (1993a). "A conceptual model of entrepreneurship as firm behavior: A critique and extension."
Entrepreneurship Theory and Practice 17(4): 5. Zahra, S. A. and J. G. Covin (1993). "Business strategy, technology policy and firm performance." Strategic
Management Journal 14(6): 451 (28 pages). Zahra, S. A. and J. G. Covin (1995). "Contextual influences on the corporate entrepreneurship‐performance
relationship: A longitudinal analysis." Journal of Business Venturing 10(1): 43 (16 pages). Zahra, S. A., D. F. Jennings, et al. (1999). "The antecedents and consequences of firm‐level entrepreneurship: The
state of the field." Entrepreneurship Theory and Practice 24(2): 45. Zahra, S. A., D. O. Neubaum, et al. (2000). "Entrepreneurship in medium‐size companies: Exploring the effects of
ownership and governance systems." Journal of Management 26(5): 947. Zwick, W. R. and W. F. Velicer (1986). "Comparison of five rules for determining the number of components to
retain." Psychological Bulletin(99): 432‐442.
Appendix: List of items
1. As we define our strategies, our
major concern is how to best utilize the resources we control.
Strategic Orientation1 2 3 4 5 6 As we define our strategies, we are driven by our
perception of opportunity. We are not constrained by the resources at (or not at) hand.
2. We limit the opportunities we pursue on the basis of our current resources.
1 2 3 4 5 6 Our fundamental task is to pursue opportunities we perceive as valuable and then to acquire the resources to exploit them.
3. Opportunities control our business strategies. 1 2 3 4 5 6 Our business strategies are significantly influenced by the resources we have.
4. Since our objective is to use our resources, we
will usually invest heavily and rapidly.
Resource Orientation1 2 3 4 5 6 Since we do not need resources to commence the
pursuit of an opportunity, our commitment of resources may be in stages.
5. All we need from resources is the ability to use them.
1 2 3 4 5 6 We prefer to totally control and own the resources we use.
6. We like to employ resources that we borrow or rent.
1 2 3 4 5 6 We prefer to only use our own resources in our ventures.
7. In exploiting opportunities, access to money is more important than just having the idea.
1 2 3 4 5 6 In exploiting opportunities, having the idea is more important than just having the money.
8. We divide a project into several stages and decide about the required resources for each stage individually, before starting it.(multiple step commitment)
1 2 3 4 5 6 Before starting a project we decide which resources are needed throughout the project and clearly commit those. (full commitment)
9. Our managers are dedicated to the same 1 2 3 4 5 6 Our managers devote their efforts to the same projects

projects with long term commitment. only for a short period of time and are then challenged by a new project.
10. To maximize our return we invest as little resources as possible even though this strategy may increase the risk of failure.
1 2 3 4 5 6 We believe that the chances of success are better the more resources we invest.
11. Borrowing, renting and contracting resources when we need them keep us up to the latest market developments and technologies.
1 2 3 4 5 6 Owning and controlling the resources we need makes us independent of market changes.
12. We prefer the stability and the rapid availability of using resources that we own and are familiar with.
1 2 3 4 5 6 We like the flexibility of borrowing or renting resources we need for a project.
13. We prefer tight control of funds and
operations by means of sophisticated control and information systems.
Management Structure1 2 3 4 5 6 We prefer loose, informal control. There is a
dependence on informal relationship.
14. We strongly emphasize getting things done even if this means disregarding formal procedure.
1 2 3 4 5 6 We strongly emphasize getting things done by following formal processes and procedures.
15. We strongly emphasize holding to tried and true management principles and industry norms.
1 2 3 4 5 6 We strongly emphasize adapting freely to changing circumstances without much concern for past practices.
16. Managers operating styles are allowed to range freely from very formal to very informal.
1 2 3 4 5 6 There is a strong insistence on a uniform management style throughout the firm.
17. There is a strong emphasis on getting line and staff personnel to adhere closely to their formal job descriptions.
1 2 3 4 5 6 There is a strong tendency to let the requirements of the situation and the personality of the individual defines proper job behaviour.
18. Our employees are evaluated and
compensated based on their responsibilities.
Reward Philosophy1 2 3 4 5 6 Our employees are evaluated and compensated based
on the value they add to the firm.
19. Our employees are usually rewarded by promotion and annual raises.
1 2 3 4 5 6 We try to compensate our employees by devising ways so they can benefit.
20. An employee’s standing is based on the value s/he adds.
1 2 3 4 5 6 An employee’s standing is based on the amount of responsibility s/he has.
21. An employee’s performance is evaluated by short‐term profit targets.
1 2 3 4 5 6 An employee’s performance is evaluated by longer‐term value creation for the firm.
22. Rewarding in our firm is based on the employee’s individual performance.
1 2 3 4 5 6 Rewarding teams for a good team performance is a common practice in our firm.
23. We reward our employees by giving them more job flexibility and access to resources they might need to develop new ideas.
1 2 3 4 5 6 Increased responsibility levels are a common method of rewarding employees.
24. It is generally known throughout the firm that
growth is our top objective.
Growth Orientation1 2 3 4 5 6 Growth is not necessarily our top objective. Long term
survival may be at least as important.
25. It is generally known throughout the firm that steady and sure growth is the best way to expand.
1 2 3 4 5 6 It is generally known throughout the firm that our intention is to grow as big and as fast as possible.
26. We have many more promising ideas than we
have time and the resources to pursue.
Entrepreneurial Culture1 2 3 4 5 6 We find it difficult to find a sufficient number of
promising ideas to utilize all of our resources.
27. Changes in the society‐at‐large seldom lead to commercially promising ideas for our firm.
1 2 3 4 5 6 Changes in the society‐at‐large often give us ideas for new products and services.
28. We never experience a lack of ideas that we can convert into profitable products/ services.
1 2 3 4 5 6 It is difficult for our firm to find ideas that can be converted into profitable products/ services.