Embed Size (px)
Citation preview

A Thesis
entitled
Numerical Modeling Methodology for the Strength Assessment of Deep Reinforced
Concrete Members
by
Anish Sharma
Submitted to the Graduate Faculty as partial fulfillment of the requirements for the
Master of Science Degree in
Civil Engineering
___________________________________________
Dr. Serhan Guner, Committee Chair
___________________________________________
Dr. Douglas Nims, Committee Member
___________________________________________
Dr. Luis Mata, Committee Member
___________________________________________
Dr. Cyndee Gruden, Dean
College of Graduate Studies
The University of Toledo
May 2020

Copyright 2020 Anish Sharma
This document is copyrighted material. Under copyright law, no parts of this document
may be reproduced without the expressed permission of the author.

iii
An Abstract of
Numerical Modeling Methodology for the Strength Assessment of Deep Reinforced
Concrete Members
by
Anish Sharma
Submitted to the Graduate Faculty as partial fulfillment of the requirements for the
Master of Science Degree in
Civil Engineering
The University of Toledo
May 2020
Deep reinforced concrete members are typically encountered when designing bridge
bents, pile-supported foundations, or transfer girders. These members should not be
analyzed using the sectional method, which would underestimate their strengths.
Additionally, the influence of the soil on the deep foundation members should be
considered. AASHTO LRFD recommends the use of either a strut-and-tie or nonlinear
finite element model for the analysis of deep members. Strut-and-tie method is iterative
and assumes a linear-elastic stress field, which is still conservative. Nonlinear finite
element analysis (NLFEA) has the capabilities to capture nonlinear strain distribution and
soil nonlinearities. However, there is currently little guidance on how to conduct a
numerical strength assessment of deep members using the NLFEA. The objective of this
study is to use the NLFEA for the strength assessment of deep members while accounting
for the deep beam action and soil influences.
For deep bridge bent beams, a strength assessment methodology is presented using the
NLFEA while considering advanced concrete behavior such as tension stiffening,

iv
compression softening, and dowel action. The proposed methodology is experimentally
verified and applied for five existing deep bridge bent beams. In addition, the effectiveness
of the proposed methodology is compared with the strut-and-tie and sectional analysis
methods.
For the deep foundation cap beams, a methodology is presented for the holistic
numerical strength assessment, including helical piles and considering the influence of soil.
Important modeling considerations, such as soil-induced nonlinearities in the stress and
strain fields, and soil-structure interactions are discussed, and experimental benchmarks
are provided to assist practitioners in accurately modeling foundation systems.
Application of these methodologies can provide a realistic strength assessment of deep
members, so that the rehabilitation funding can be directly efficiently.

v
Acknowledgments
I would like to thank my advisor Dr. Serhan Guner for the invaluable opportunities,
guidance, and encouragement provided, which were key in my academic and professional
development. I would also like to thank the Ohio Department of Transportation (ODOT)
of funding and supporting the first part of the research (Chapter 2). I am grateful to the
ODOT technical liaisons, Mr. Matthew Blythe, P.E., and Ms. Andrea Parks, P.E., for their
feedback and support, and to Ms. Michelle Lucas for managing the project and arranging
monthly teleconferences. I am also grateful to the Deep Foundation Institute (DFI) for
funding and supporting my studies as well as the second part of the research (Chapter 4).
Thank you to the thesis committee, Dr. Douglas Nims and Dr. Luis Mata, for their
valuable suggestions and feedback. I am thankful to our research team for providing
feedbacks and motivations. Special thanks to my colleague Rafael Salgado for his
continuous assistance on my projects. I also acknowledge the Department of Civil and
Environmental Engineering at The University of Toledo for providing the facilities
required to conduct this research.
Thank you to my parents, and all my family and friends for their support and
encouragement.

vi
Table of Contents
Abstract …………………………………………………………………………………..iii
Acknowledgments ………………………………………………………………………...v
Table of Contents ……………………………………………………………………vi
List of Tables ……………………………………………………………………………..ix
List of Figures ……………………………………………………………………………..x
1. Introduction ..........................................................................................................1
1.1 Scope and Objectives ........................................................................................4
1.2 Outline of the Document ...................................................................................5
2. Advanced Numerical Modeling Methodology for Strength Evaluation of Deep
Bridge Bent Caps .........................................................................................................6
2.1 Synopsis .........................................................................................................6
2.2 Introduction .......................................................................................................7
2.3 Research Significance .......................................................................................9
2.4 Numerical Modeling and Safety Assessment Methodology ...........................10
2.4.1 Finite Element Modeling ..................................................................10
2.4.2 Experimental Verification of Modeling Approach ...........................14
2.4.3 Two-Stage Safety Assessment ..........................................................16
2.5 Application of the Proposed Methodology .....................................................20
2.6 Comparisons with Sectional and Strut-and-Tie Methods ...............................26

vii
2.7 Simulation of Load Redistribution..................................................................30
2.8 Summary and Conclusions .............................................................................31
2.9 Acknowledgement ..........................................................................................33
2.10 Notations .....................................................................................................33
3. Load Rating of Existing Bridges using STM and NLFEA ............................35
3.1 Introduction .....................................................................................................36
3.2 Bridge Load Rating .........................................................................................37
3.3 Determination of Rating Factors .....................................................................37
3.3.1 Sectional Method ..............................................................................38
3.3.2 Strut-and-tie Method .........................................................................39
3.3.3 Nonlinear Finite Element Analysis ...................................................40
3.4 Comparison of Rating Factors ........................................................................41
3.5 Conclusions .....................................................................................................42
3.4 Notations .......................................................................................................43
4. System-Level Modeling Methodology for Helical Piles Foundation Systems
Subjected to Uplift and Compression Loads ..............................................................44
4.1 Abstract .......................................................................................................44
4.2 Introduction .....................................................................................................45
4.3 Proposed System-Level Modeling Methodology ...........................................49
4.4 Verification of the Behavior of Discrete Pile Cap (Foundation) Model .........51
4.4.1 Experimental Benchmarks for Discrete Pile Cap (Foundation) ......53
4.5 Verification of the Behavior of Discrete Helical Piles & Soil Model ............55
viii
4.5.1 Experimental Benchmarks for Single and Grouped Helical Pile-Soil
........................................................................................................59
4.6 System – Level Modeling ...........................................................................60
4.7 Application of the System – Level Modeling Methodology ..........................62
4.8 Comparison of Discrete Models with the System – Level Model ..................70
4.9 Influence of Soil Type on the System – Level Model ....................................72
4.10 Influence of Various Design Configurations ................................................73
4.10.1 Pile Embedment in the Concrete Pile Cap ......................................73
4.10.2 Pile Embedment in the Soil.............................................................74
4.10.3 Helices Number ..............................................................................75
4.11 Conclusions .................................................................................................76
5. Conclusions ........................................................................................................78
6. References ........................................................................................................82

ix
List of Tables
Chapter 2
Table 1: Material models included in VecTor2…………………………………………..12
Table 2: Bridge bents details ……………………………………………………………..21
Table 3: Safety assessment of deep bridge bents ………………………………………..26
Chapter 3
Table 1: Calculation of rating factor (RF) from the sectional method……………………38
Table 2: Calculation of rating factor (RF) from STM……………………………………40
Table 3: Calculation of rating factor (RF) from NLFEA…………………………………41
Chapter 4
Table 1: Experimental benchmark details for discrete foundation modeling under
compression …..………………………………………………………………………..54
Table 2: Experimental benchmark details for discrete foundation modeling under uplift
………………………………………………………………………..………………… 55
Table 3: Interface properties of different materials………………………………………58
Table 4: Soil properties for benchmark helical pile specimens .…..….….……………..60
Table 5: Concrete damage plasticity parameters for concrete under compression……….65
Table 6: Concrete damage plasticity parameters for concrete under uplift………………66

x
List of Figures
Chapter 1
Fig. 1: Deep beam action ………………………………………………………………....1
Fig. 2: Discrete modeling approaches in modeling of deep members considering (a) soil as
fixed, and (b) foundation as pinned or fixed supported …………………………………....3
Chapter 2
Fig. 1: (a) Quadrilateral element for concrete, (b) Triangular element for concrete, (c) Truss
bar element for rebar …………………………………………………………………….11
Fig. 2: (a) Concrete, (b) reinforcing steel material constitutive models, (c) tension stiffening
response ………………………………………………………………………………….12
Fig. 3: FE model developed for NLFEA…………………………………………………13
Fig. 4: FE model and cracking conditions for a) D6.A2.G40#4.S, and b)
D4.A2.G40#4.S…………………………………………………………………………..15
Fig. 5: Load-displacement response for (a) D6.A2.G40#4.S, and b) D4.A2.G40#4.S……16
Fig. 6: Proposed methodology for the two-stage safety assessment of bridge bents using
NLFEA…………………………………………………………………………………...17

xi
Fig. 7: (a) Reliability index versus service life, and (b) Reduction factor versus service
life………………………………………………………………………………………..20
Fig. 8: Bridge bent examined elevation and cross-section (Bridge 1) ……………………21
Fig. 9: FE model developed for Bridge 1…………………………………………………22
Fig. 10: Load-displacement response of Bridge 1 for (a) Stage 1 and (b) Stage 2…….…23
Fig. 11: (a) Finite element model developed, (b) Crack pattern (10 times actual deflection),
and (c) Rebar stresses at failure loading condition……………………………………….25
Fig. 12: Comparison of shear capacities from NLFEA with (a) Sectional method and (b)
STM ……………………………………………………………………………………...27
Fig. 13: Load displacement response of (a) Bridge 1, (b) Bridge 2, (c) Bridge 3, (d) Bridge
4, and e) Bridge 5…………………………………………………………………………29
Fig. 14: (a) First cracking, (b) First rebar yielding, and (c) Failure crack patterns and rebar
stresses obtained from the NLFEA for Bridge 2 ………………………………………..31
Chapter 3
Fig. 1: Comparison of rating factors obtained from the sectional method, STM, and NLFEA
………………………………………………………………………………… 42
Chapter 4
Fig. 1: Modeling approaches considering (a) discrete foundation (structural modeling), (b)
discrete helical piles & soil (geotechnical modeling), and (c) the proposed system-level
model................................................................................................................................. 47
Fig. 2: Proposed system-level modeling methodology for helical pile foundation systems.
........................................................................................................................................... 50
Fig. 3: (a) Concrete, and (b) reinforcing bar constitutive models. .................................... 51

xii
Fig. 4: Global failure modes for a discrete foundation: (a) Punching shear, (b) One-way
shear, and (c) flexural failure. ........................................................................................... 52
Fig. 5: (a) Constitutive model for the soil, failure model for helical pile-soil, (b) individual
plate bearing, and (c) cylindrical shear. ............................................................................ 57
Fig. 6: Geometrical details (dimensions in mm) of helical piles experimental benchmarks
(a) SP1, (b) SP2 , (c) SP3, (d) SP3, and (d) GP1. ............................................................. 60
Fig. 7: (a) A sample system-level FE model, (b) modeling soil-structure interface, and (c)
interaction model at the interface. ..................................................................................... 61
Fig. 8: Geometric details (dimensions in mm), material properties, and modeling setup for
the system-level modeling ................................................................................................ 63
Fig. 9: (a) Load-displacement response, (b) experimental failure mode, (c) captured
stresses distribution, and (d) cracking pattern from FE simulation under compression load.
........................................................................................................................................... 65
Fig. 10: (a) Load-displacement response, (b) cracking conditions from experiments, (c)
stress distribution and (d) cracking condition from FE simulation, for discrete foundation
under uplift ........................................................................................................................ 66
Fig. 11: (a) Discrete single helical pile & soil NLFE model, (b) load-displacement
response, (c) soil stresses distribution at failure load, and load-displacement responses for
(d) SP3, (e) SP4, and (f) GP1 ............................................................................................ 68
Fig. 12: (a) Stresses distribution, and (b) load-displacement response for the system-level
model at 20 mm displacement (i.e. 8% Dt). ...................................................................... 70

xiii
Fig. 13: Comparison between discrete and system – level models in-terms of failure modes
and load capacities. ........................................................................................................... 71
Fig. 14: Uplift capacities comparison from system – level and discrete models. ............. 72
Fig. 15: Influence of different soil types on the system-level model and discrete models for
(a) OH soil class, (b) GM-GL soil class, and (c) GW soil class as per USCS.. ................ 73
Fig. 16: (a) Geometric details (dimensions in mm) of pile shaft embedment depths, and (b)
uplift capacities response with embedment depths. …………………………………...…74
Fig 17: Influence of (a) pile embedment inside the soil, and (b) pile embedment in the pile
cap in uplift capacity prediction from the system-level holistic analysis…………………75

1
1. Introduction
Reinforced concrete deep members are widely encountered in buildings, bridges, and
foundations. They commonly take the form of shear walls, bridge bent beams, foundation
cap beams, and other configurations. Unlike shallow members, deep members exhibit a
deep beam action that creates compression and tension paths (see Fig. 1). Consequently,
plane sections do not remain plane in bending and the traditional design assumption of the
sectional method does not apply (Collins and Mitchell 1991; Schlaich and Shafer 1991;
Schlaich et al. 1987; Rogowsky and MacGregor 1986). In addition, the soil influences the
behavior of deep foundation members, which is difficult to capture and thus usually
neglected. The rapid increase in the number of deep reinforced concrete members has
motivated the search for alternative methods that can achieve an improved understanding
and accurate simulation of the behavior of these members.
Fig. 1: Deep beam action.
Compression
Tension
Load
Cracking

2
AASHTO LRFD 2017 recommends the use of either a strut-and-tie or a nonlinear finite
element method for the analysis and design of deep members. Strut-and-tie method (STM),
which assumes a linear elastic stress field, is still conservative (Kim et al. 2011; Oh and
Shin 2001; Kani 1967). Nonlinear finite element analysis (NLFEA), on the other hand, is
shown to capture the nonlinear strain distributions (i.e. plane sections do not remain plane)
and the effect of shear cracking (Pan et al. 2017; Demir et al. 2016).
Recent researches have demonstrated the advantages of the NLFEA for simulating the
nonlinear behavior of deep members, as well as nonlinearities caused by the soil influence
(George et al. 2017; Pan et al. 2017; Demir et al. 2016; Barbachyn et al. 2012; Zhou et al.
2011; Livneh et al. 2008). However, there is little guidance on how to use the NLFEA for
determining the strength and safety of existing deep members, such as bridge bents and
foundations.
In addition, discrete modeling approach is followed in the structural modeling of deep
members, which typically neglects the soil influence with either a pinned or fixed support
assumption (see Fig. 2a). On the other hand, geotechnical modeling neglects the deep
foundation deformations with either pinned or fixed foundation assumption (see Fig. 2b).
Therefore, the influence of the soil on the behavior of the deep foundation members is
typically neglected.

3
Fig. 2: Discrete modeling approaches in modeling of deep members considering (a)
soil as fixed, and (b) foundation as pinned or fixed supported.
This study presents two methodologies for the use of NLFEA for the strength
assessment of the deep bridge bents and deep foundation cap beams. For deep bridge bent
beams, the methodology considers advanced concrete behavior such as tension stiffening,
compression softening, and dowel action. The modeling approach is experimentally
verified by investigating crack patterns, load-displacement response, failure modes, and
governing critical members under near collapse conditions. The proposed methodology is
employed on five existing bridges located in Ohio; the predicted capacities are compared
with the traditional sectional and strut-and-tie method. For the deep foundation cap beams,
another methodology is proposed for the holistic numerical modeling, including helical
piles and accounting for the soil influence. The proposed modeling methodology is based
on calibrating the material and interaction properties with the experimental benchmarks to
capture the holistic response. These experimental benchmarks are discussed and presented
to assist researchers in performing such calibrations. The discrete modeling approaches
Deep foundation
Pile end fixed
Pile end pinned or fixed
Helical pile
Soil
(a) (b)

4
(i.e., considering soil as fixed support and foundation cap beam as fixed) are also
investigated.
The proposed modeling methodologies aim to provide a strength assessment that is
more accurate than the current analysis practice. This will result in more accurate
assessment and ranking of overloaded deep members and save limited rehabilitation funds.
1.1 Scope and Objectives
To provide the guidance on how to use the NLFEA for strength assessment of existing
deep members the following objectives were defined:
Create and verify high-fidelity finite element models of reinforced concrete deep
members,
Develop a strength assessment methodology using NLFEA for the assessment of deep
bridge bent beams,
Verify the proposed NLFEA methodology with the experimental result of five deep
bridge bents located in Ohio.
Compare the effectiveness of the proposed NLFEA methodology with the sectional and
strut-and-tie methods.
Develop a holistic modeling methodology that allows accurate strength assessment of
deep foundation cap beams, accounting for the soil interaction.
Provide experimental benchmarks to assist practitioners in accurately creating the
holistic foundation models.

5
1.2 Outline of the Document
This thesis is organized as follows. Chapter 2 presents an advanced numerical modeling
methodology for strength evaluation of deep bridge bent caps. This chapter includes the
journal paper’s manuscript accepted in the American Concrete Institute (ACI) Special
Publication. Chapter 3 includes the rating factors calculated for existing bridges using
different analysis methods. Chapter 4 presents a holistic modeling methodology for helical
pile and cap beam systems subjected to uplift loads. This chapter includes the manuscript
submitted to the Engineering Structures journal. Chapter 5 summarizes the research results
and global conclusions. Chapter 6 contains the references cited in this study.

6
2. Advanced Numerical Modeling Methodology for
Strength Evaluation of Deep Bridge Bent Caps
This chapter includes the journal paper manuscript submitted to the American Concrete
Institute by Anish Sharma and Dr. Serhan Guner. It is expected that there will be changes
before the publication of the final paper. Please refer to the
link https://www.utoledo.edu/engineering/faculty/serhan-guner/publications.html to
download the final, published version of this paper.
2.1 Synopsis
Due to the increase in traffic and transported freight in the past decades, a significant
number of in-service bridges have been subjected to loads above their original design
capacities. Bridge structures typically incorporate deep concrete elements, such as cap
beams or bent caps, with higher shear strengths than slender elements. However, many in-
service bridges did not account for the deep beam effects in their original design due to the
lack of suitable analysis methods at that time. Nonlinear finite element analysis (NLFEA)
can provide a better assessment of the load capacity of deep bridge bent beams while
accounting for the deep beam action. However, there is little guidance on how to conduct
a numerical strength evaluation using the NLFEA. This study presents a nonlinear
modeling methodology for the strength evaluation of deep bridge bents while considering
advanced concrete behavior such as tension stiffening, compression softening, and dowel

7
action. Five existing bridge bent beams are examined using the proposed methodology.
The effectiveness and advantages of the proposed methodology are discussed by
comparing the numerical results, including the load-displacement responses, load
capacities, cracking patterns and failure modes, with the strut-and-tie and sectional analysis
methods. Important modeling considerations are also discussed to assist practitioners in
accurately evaluating deep bridge bents.
2.2 Introduction
Bridge structures typically incorporate deep reinforced concrete elements, such as bents
or cap beams. Increases in traffic and transported freight over the past decade have
increased the loading on the existing bridge bents, which requires accurate strength
evaluation methods for making repair and strengthening decisions. Reinforced beams are
typically subjected to a combination of axial, flexural and shear stresses. The commonly
used bending theory (i.e., the sectional method) is based on the Bernoulli hypothesis, which
assumes a linear distribution of strains through the section depth. However, bridge bent
beams often have their shear span-to-depth ratios (a/d) less than 2.5, which qualifies them
as deep beams. The behavior of deep beams must be treated separately because they do not
exclusively exhibit a linear strain distribution (Collins and Mitchell 1991; Schlaich and
Shafer 1991; Schlaich et al. 1987; Rogowsky and MacGregor 1986). Experimental work
conducted on deep beams demonstrated that diagonal shear cracking is their main
governing behavior (Scott et al. 2012; Kim et al. 2011; Oh and Shin 2001; Tan et al. 1997;
Kani 1967; Clark 1951). The strut-and-tie-method (STM) is shown to represent the
behavior of deep beams better than the sectional method (Baniya and Guner 2019; Kim et
al. 2011; Oh and Shin 2001; Kani 1967). Various empirical formulations and analytical

8
methods were proposed for evaluating the shear strength of deep beams based on the strut-
and-tie approach (Gandomi et al. 2013; Scott et al. 2012; Guner and Vecchio 2010;
Quintero-Febres et al. 2006; Hwang and Lee 2002; Oh and Shin 2001). However, these
methods do not take into account the nonlinear material behavior and have limitations in
predicting the post-peak softening behavior of deep beams, which is required for the
prediction of displacement ductility. The complexity and uniqueness of bridge bents
require a more advanced analysis approach such as nonlinear finite element analysis
(NLFEA).
Current advances in computational capabilities of finite element modeling have been
proven a versatile tool for studying the nonlinear pre- and post-peak behavior of structural
members (Alsaeq 2013; Özcan et al. 2009). NLFEA by its nature is a global type of
assessment, in which all structural parts interact. It has been shown to accurately model the
nonlinear strain distributions and the effects of shear cracking on the stress and strain fields
(Pan et al. 2017; Demir et al. 2016; Barbachyn et al. 2012). Recent researchers have
demonstrated the possibilities and advantages of NLFEA for accurately simulating the
nonlinear behavior of deep beams, including the effects of shear cracking and the
nonlinearity of the strain distribution (Salgado and Guner 2018a, 2018b; Pan et al. 2017;
Demir et al. 2016; Barbachyn et al. 2012; Niranjan and Patil 2012). However, there is little
guidance on how to use the results from NLFEA for determining the strength and safety of
existing bridge bents.

9
This study proposes a strength assessment methodology for bridge bent beams based
on a pushover analysis performed using NLFEA. To achieve an accurate strength
evaluation, NLFEA modeling of the deep bridge bents accounts for a number of advanced
material behaviors including concrete confinement, compression softening, tension
stiffening and softening, and reinforcement dowel action and buckling. The methodology
uses a pushover analysis and a two-stage safety assessment procedure to determine a
reserve or overload percentage for each bridge bent. The overall modeling process is
presented through a case study, involving five existing bridge bents, to assist practitioners
in accurately evaluating the strength of bridge bents. The effectiveness of the proposed
methodology, as compared to the sectional and strut-and-tie methods, is also discussed.
2.3 Research Significance
Many in-service bridge bents did not account for deep beam effects in their original
design. When analyzed using sectional methods, they are often found overloaded. NLFEA
has the capabilities to capture the deep beam characteristics to more accurately predict the
strength and ductility of deep bridge bents. However, there is a lack of methodologies on
how to use the NLFEA, including the model development and the use of analysis results
for the strength assessment of deep bridge bents. This study proposes a methodology using
NLFEA and a two-stage safety assessment procedure to better interpret the holistic
behavior and evaluate the strength of deep bridge bents.
10
2.4 Numerical Modeling and Safety Assessment Methodology
2.4.1 Finite element modeling
The proposed methodology uses a two-dimensional continuum-type finite element
(FE) modeling approach. It can be applied using any FE modeling software on the
condition that it is capable of simulating significant material behaviors including concrete
confinement, compression softening, tension stiffening and softening, and reinforcement
dowel action. The program VecTor2 (Wong et al. 2013) is used in this study, which
employs a smeared, rotating crack model based on the Modified Compression Field Theory
(MCFT) (Vecchio and Collins 1986) and the Distributed Stress Field Model (DSFM)
(Vecchio 2000). The MCFT has been adopted by the AASHTO (2017) and CSA A23.3
(2014) codes. VecTor2 has been shown to provide an accurate simulation of the
experimental behaviors in terms of strength, crack patterns, and the flow of principal
stresses (Baniya et al. 2018; Senturk and Higgins 2010a). The graphical pre-processor,
Formworks Plus (Wong et al. 2013), is used to create numerical models while the post-
processor Augustus is used to visually examine the analysis results.
The concrete is modeled using 8-degree-of-freedom quadrilateral elements in
geometrically uniform regions or 6-degree-of-freedom triangular elements in
geometrically non-uniform regions as shown in Figs 1(a) and 1(b). The shear reinforcement
is smeared into the concrete regions and the longitudinal reinforcement is discretely
modeled as trusses through two-node elements with 2-degrees-of-freedom per node as
shown in Fig. 1(c).

11
Fig. 1 – (a) Quadrilateral element for concrete, (b) triangular element for concrete, and
(c) truss bar element for rebar
The NLFEA incorporates several advanced material behaviors specific to cracked
reinforced concrete, as listed in Table 1. For deep bridge bents, four of these behaviors
were found to be significant: concrete compression and tension softening, dowel action,
and tension stiffening (Figure 2). Concrete compression softening is the reduction in the
uniaxial compressive strength and stiffness due to transverse tensile cracking. The concrete
tension softening, on the other hand, reduces the effectiveness of the concrete struts due to
significant shear cracking that occurs when low amounts of stirrup reinforcement are
present, which has been noticed in many bent beams. In addition, these low amounts of
stirrups reduce the shear capacity such that the additional shear resistance due to dowel
action becomes important. Finally, due to a lack of well-distributed layers of reinforcement
in many older bent beams, they may exhibit flexural cracking, requiring the modeling of
concrete tension stiffening effects.

12
Table 1 – Material models included in VecTor2.
Material behavior Model
Compression softening Vecchio 1992-A
Tension stiffening Modified Bentz 2003
Tension softening Linear
Rebar dowel action Tassios (Crack slip)
Rebar buckling Refined Dhakal-Maekawa
Crack width check Max crack width of Agg/5
Confinement strength Kupfer/Richart
Popovics (1973) and Modified Park-Kent (Bunni et al. 1982) models are employed for the
pre- and post-peak response of the concrete, respectively. Even though the proposed
methodology includes a static pushover analysis, the concrete model includes nonlinear
hysteresis as shown in Figure 2(a) because some parts of the bridge bents will unload and
reload, which is when the cracking of concrete and the yielding of reinforcement occurs.
The stress between the concrete and reinforcement is transferred through the perfect bond.
The steel reinforcement stress-strain response is composed of linear-elastic response, a
yield plateau, and rupture in tension as shown in Fig. 2(b). Buckling of steel reinforcing is
also taken into account (Akkaya et al. 2019).
Fig. 2 – (a) Concrete, (b) reinforcing steel material constitutive models, (c) tension
stiffening response

13
Multiple concrete regions are created to represent different smeared reinforcement
conditions; Figure 3 shows an example. The reinforcement ratio (ρt) for each concrete
region having a cross-sectional area of out-of-plane reinforcement (Ab), number of stirrups
leg (n), spacing (St), and width of the cross-section (Wc), is calculated using Eqn. 1. The
symmetry of the pier cap allows for modeling one-half of the beam, which reduces the
analysis time. Rollers are defined at the axis of symmetry and pin supports are defined at
the lowest ends of the pier (not shown in Fig. 3). Since no lateral load is considered, no
significant stresses are developed in the column region and its effect can be neglected.
Hence, the beam-column is considered monolithically jointed.
𝜌𝑡 =𝑛𝐴𝑏
𝑆𝑡 𝑊𝑐 (1)
Fig. 3 – FE model developed for NLFEA
For the load application, the dead load is applied fully and then the live load is applied
uniformly up to the failure of the beam. Maximum displacement is recorded. For bridge
bent beams with a cantilever span, maximum displacement usually occurs at the tip of the
cantilever span, whereas for bridge bent beams with no cantilever span, it occurs at the
inner mid-span. A load-displacement curve can be generated so the load causing the failure
of the bent beam can be determined.

14
2.4.2 Experimental verification of modeling approach
The accuracy of the proposed material modeling approach was verified with the results
from experiments conducted on six full-scale in-service bridge bents by Senturk and
Higgins at Oregon State University (Senturk and Higgins 2010b; Senturk 2008). These
bridge bents resemble conventionally reinforced concrete deck girder (RCDG) bridges
built in the 1950s. Five specimens had an overall height of 72 in. (1829 mm) and one
specimen had an overall height of 48 in. (1219 mm). The width of the bent caps is 16 in.
(406 mm). The support reaction and the location of the applied loads were the same for all
specimens. The experimental results from two bridge bents were used to verify the cracking
patterns and load-displacement responses determined from the proposed modeling
approach. The details of the experimental setup and material properties were discussed by
Senturk (2008). In short, the first specimen (originally referred to as D6.A2.G40#4.S) had
a height of 72 in. (1829 mm), concrete strength of 3.52 ksi (24.4 MPa), reinforcing steel of
yield strength 68.3 ksi (470 MPa), ultimate strength of 112.9 ksi (778 MPa), and #4 (13
mm) stirrups. For the second specimen (originally referred to as D4.A2.G40#4.S), the
height of the beam was 48 in. (1219 mm) while the material properties were the same as
for the first specimen.
The FE models of both specimens are shown in Fig. 4. One-half of the beam was
modeled and rollers were provided on the axis of symmetry. Top and bottom reinforcement
were modeled as truss elements and the shear reinforcement was smeared in the concrete.
Material models listed in Table 1 were used. Fig. 4 shows the cracking conditions
experimentally obtained (Senturk and Higgins 2010b; Senturk 2008) and numerically

15
generated by the FE model. The shear cracking spanned from the support to the load
application point, which indicated typical deep beam strut action. The FE model
successfully captured the experimentally observed shear compression failure response as
well as the strut action for both cases as shown in Fig. 4.
Fig. 4 – FE model and cracking conditions for a) D6.A2.G40#4.S, and b)
D4.A2.G40#4.S
Fig. 5 shows the total load and mid-span displacement (Δm) response experimentally
obtained (Senturk and Higgins 2010b; Senturk 2008) and numerically calculated by the FE
model. The peak load, peak displacement and overall stiffness response of both beams were
well captured by the FE model. The FE analysis to experimental ratios of the peak load
capacity were 10% on average for the specimens.

16
Fig. 5 – Load-displacement response for (a) D6.A2.G40#4.S, and b) D4.A2.G40#4.S; 1 in.
= 25.4 mm and 1 kip = 4.45 kN
2.4.3 Two-stage safety assessment
The safety requirements for structural design require that the resistance of the structure
exceed the demand of the total applied loads. The performance of a bridge depends on the
uncertainties in loads and material resistances. NLFEA simulates a global response of the
bridge bent beams. Thus, the NLFEA results require a safety assessment to be determined
for the strength evaluation of bent beams. Many design codes, such as AASHTO (2017),
consider the uncertainties in loads and material resistance by load and resistance factors.
These safety factors are intended for the linear-elastic sectional analysis. If used in
nonlinear analysis, they may change the stress distribution, failure mode, and overall
response. Hence, a new two-stage safety assessment procedure is proposed in this study
for nonlinear analysis as outlined in Fig. 6.

17
Fig. 6 – Proposed methodology for the two-stage safety assessment of bridge bents using
NLFEA

18
As summarized in Fig. 6, the goal of the two-stage safety assessment is to find the
required and actual capacity factors of the bridge beam. Stage 1 considers both the load
and material resistance factors in the determination of the required capacity factor. This
stage is simple to perform, requiring a single pushover analysis with characteristic (i.e.,
nominal) material properties. Stage 2 does not consider the material resistance factors when
determining the required capacity factor; these factors are taken into consideration more
precisely and probabilistically in the FE model. Compared to Stage 1, Stage 2 is more
involved and requires two pushover analyses: one with the characteristic material
properties and another with the mean material properties. Stage 2 assessment is only
required if the bridge is found overloaded in Stage 1.
In Stage 1, the proportion of the dead load (DL) and live load (LL) with respect to the
total load is determined first. Then, the load combination from the AASHTO (2017)
specifications is followed to determine the factored load proportions to be used in Eqn. 2
(shown in Fig. 6). Any other code specifications may be used depending on the location of
the structure. The factored load is divided by the shear reduction factor (ΦS) or flexural
reduction factor (Φf) to determine the required capacity factor (CFreq) for the bridge bent
beam as defined in Eqn. 2. The choice of material reduction factor depends on the mode of
failure of the structure (ACI 318-19). The bridge bent beam is modeled in an FE software
with characteristic material properties. The pushover analysis is then performed applying
the service load (LS), where total DL is applied initially and LL is applied uniformly until
failure of the beam. The resistance (Rk in Fig. 6) is determined from the load-displacement
(i.e., pushover) curve. The actual capacity factor (CF), is determined as the ratio between

19
Rk and the service load (LS). If it is higher than the required capacity factor, the bridge
bent is classified as safe. Otherwise, it is overloaded and a Stage 2 assessment should be
made.
In Stage 2, the required capacity factor is determined as the ratio between the factored
loads and LS as defined in Eqn. 3 (shown in Fig. 6). A comparison of Eqns. 2 and 3 shows
that the material resistance factors are not used while determining the required capacity
factor in Stage 2. This stage requires another NLFEA using mean material properties. For
this, the mean yield strength of steel (fym) and the mean compression strength of concrete
(fcm) are estimated from the characteristic concrete compressive strength (fc) and steel
yield strength (fy) as defined in Eqn. 4 (shown in Fig. 6) (Cervenka 2008). A second
pushover analysis is then performed to find the mean resistance (Rm) of the beam. The
coefficient of variation of the resistance (VR) is then calculated using Eqn. 5, where Rk
and Rm are the resistances of the element using its characteristic and mean properties of
materials, respectively. A reduction factor (γG) is probabilistically obtained using Eqn. 6,
which is based on the sensitivity factor for the resistance reliability (αR) and the reliability
index (β), factors that depend on the service life of the bridge as shown in Fig. 7(a). For a
service life of 50 years, recommended values for the ultimate limit states are 0.8 and 3.8,
respectively (Cervenka 2008). For a service life of 75 years, αR and β are 0.8 and 3.2,
respectively. Similarly, AASHTO (2017) recommends β of 3.5 for bridges. The sensitivity
of γG with respect to service life is shown in Fig. 7(b), which indicates differences below
5% for 50 or 75 years of structural service life. In this study, the reduction factor was
calculated considering a service life of 50 years. The design resistance (Rd) is then obtained

20
using the mean resistance (Rm) and γG as defined in Eqn. 7. The CF is determined as the
ratio between Rd and Ls. If CF is more than CFreq, the bridge bent beam is considered
safe; otherwise, it is considered overloaded.
Fig. 7 – (a) Reliability index versus service life, and (b) Reduction factor versus service
life
The reserve capacity (R%) and the overload capacity (OL%) of the bridge bent beams
can be determined in any stage using Equations 8 and 9, respectively.
𝑅% = (𝐶𝐹
𝐶𝐹𝑟𝑒𝑞− 1) ∗ 100 (8)
𝑂𝐿% = (1 −𝐶𝐹
𝐶𝐹𝑟𝑒𝑞) ∗ 100 (9)
2.5 Application of the Proposed Methodology
To demonstrate the application of the proposed methodology, five bent beams (four
with and one without cantilever spans) of existing bridges were modeled as shown in Table
2. The concrete characteristic compressive strengths for these beams ranged from 4 ksi
(27.6 MPa) to 4.5 ksi (31 MPa); the number of piers ranged from three to seven; beam
depths (d) ranged from 36 inches (915 mm) to 48 inches (1220 mm); and shear span-to-
depth ratios (a/d) ranged from 0.10 to 3.03; hence, most spans qualify as deep beams. The
21
steel reinforcement characteristic yield stress was 55 ksi (378 MPa). As an example, the
configuration and NLFEA model of Bridge 1 is shown in Figs 8 and 9, respectively.
Table 2 – Bridge bents details; 1 ft = 304.8 mm and 1 in.2 = 645.2 mm2
Bridge w (ft) d
(ft)
t
(ft)
a/d Ay (bottom)
(in.2)
Ay (top)
(in.2) Min Max
Bridge 1 44 4 3 1.40 1.89 7.00 13.95
Bridge 2 51.17 3.5 3.5 0.10 1.91 8.00 9.46
Bridge 3 64.67 3.5 3 0.19 2.80 8.00 8.00
Bridge 4 53.33 4 3 0.50 1.51 9.00 8.00
Bridge 5 87 3 3 0.14 3.03 7.90 7.90
Fig. 8 – Bridge 1 bent elevation and cross-section; 1 in. = 25.4 mm and 1 kip = 4.45 kN
The symmetry of the beams allowed for a one-half model, which significantly reduced
the modeling effort and computation time. The lowermost ends of the columns were pinned
while rollers were used on the axis of symmetry. Regions with different shear
reinforcement are represented by different colors in Fig. 9. The shear reinforcement in each
region was calculated using Eqn. 1. A convergence test was performed for mesh size
ranging from 20 to 100 mm. An FE mesh size of 50 x 50 mm satisfactorily balanced
accuracy and computing time and hence, was used in modeling. Pushover analyses were
performed with the total dead load applied initially; the live load was then increased in

22
fixed increments of 10% until failure. The load-displacement responses were generated,
and the strength evaluation was performed based on the proposed two-stage safety
assessment procedure.
Fig. 9 – FE model developed for Bridge 1
The sample beam shown in Figs 8 and 9 was originally designed using the Strength I
ultimate load combination of 1.25DL + 1.75LL and the shear reduction factor (ФS) of 0.75
(ACI 318-19). Based on the load and material resistance factors, CFreq was determined to
be 1.90 from Stage 1 assessment. An FE model was created with the characteristic material
properties. The factored dead load of 217.5 kips was fully applied and then the live load
was gradually applied until failure of the beam. From a single pushover analysis performed
with characteristic material properties, Rk was determined to be 1456 kips (6480 kN). The
CF of the bridge bent was determined to be 2.41, following the methodology discussed
above {i.e., 1456 / [(174+67) x 2.5]}. The capacity factor was found to be higher than the
required, and the reserve capacity was calculated using Eqn. 8 to be 27% as shown in Fig.
10(a). Since the bridge was found to be safe, there was no need to perform Stage 2
assessment. However, for demonstrative purposes, Stage 2 assessment was undertaken as
follows.

23
The required capacity factor in Stage 2 is determined as the ratio of the factored load
to the service load, which was found to be 1.42 for the analyzed beam. The required
capacity factor only considers uncertainties in load (i.e., load factors), while the FE model
captures the material uncertainties. An additional pushover analysis was performed with
the mean material properties as shown in Fig. 10(b). The mean resistance was determined
to be 1554 kips (6915 kN). As discussed above, the coefficient of variation and reduction
factors were determined for 50 years of service life. The design resistance of the cap beam
was then calculated to be 1665 kips (7410 kN), which corresponds to a CF of 2.53.
Consequently, the cap beam was found to be safe, as expected, with a 78% reserve capacity.
Fig. 10 – Response of Bridge 1 for (a) Stage 1 and (b) Stage 2; 1 in. = 25.4 mm and 1 kip
= 4.45 kN
The methodology was applied, in a similar manner, to the remaining four bridges. The
models for each bent beam are shown in Fig. 11(a). Shear and flexural crack patterns at the
failure conditions are presented in Fig. 11(b). Initial cracks typically occurred at the mid-
span bottom faces of interior spans as flexural cracks. With the increase in loading, more
cracks formed, and the widths of the existing cracks increased. Diagonal compression struts
24
formed in the beams, which represent the deep beam strut action (i.e., shear cracks spanned
from the point loads to the column supports). Vertical flexural cracks formed above the
column regions, with yielding of the top rebar at those locations. The conditions of the top
and bottom reinforcement of the beam are also shown in Fig. 11(c). From the cracking
pattern, it is clear that the bridge bents are shear critical at the cantilever spans and inner
spans near the columns. The yielding of the top and bottom flexural reinforcement of the
bridge bent at the beam-column interface caused crushing of the concrete, resulting in a
shear-flexural failure mode.

25
26
Fig. 11 – (a) Finite element model developed, (b) Crack pattern (10 times actual
deflection) , and (c) Rebar stresses at failure
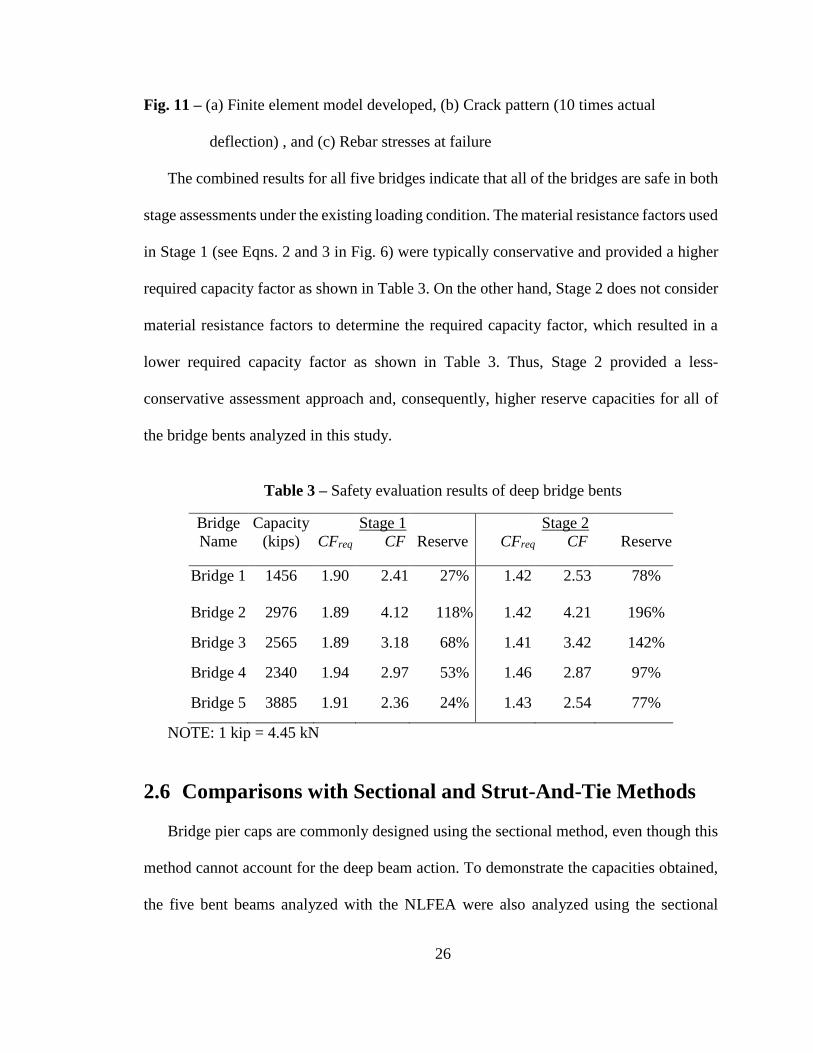
The combined results for all five bridges indicate that all of the bridges are safe in both
stage assessments under the existing loading condition. The material resistance factors used
in Stage 1 (see Eqns. 2 and 3 in Fig. 6) were typically conservative and provided a higher
required capacity factor as shown in Table 3. On the other hand, Stage 2 does not consider
material resistance factors to determine the required capacity factor, which resulted in a
lower required capacity factor as shown in Table 3. Thus, Stage 2 provided a less-
conservative assessment approach and, consequently, higher reserve capacities for all of
the bridge bents analyzed in this study.
Table 3 – Safety evaluation results of deep bridge bents
Bridge
Name
Capacity
(kips)
CFreq
Stage 1
CF
Reserve
CFreq
Stage 2
CF
Reserve
Bridge 1 1456 1.90 2.41 27% 1.42 2.53 78%
Bridge 2 2976 1.89 4.12 118% 1.42 4.21 196%
Bridge 3 2565 1.89 3.18 68% 1.41 3.42 142%
Bridge 4 2340 1.94 2.97 53% 1.46 2.87 97%
Bridge 5 3885 1.91 2.36 24% 1.43 2.54 77%
NOTE: 1 kip = 4.45 kN
2.6 Comparisons with Sectional and Strut-And-Tie Methods
Bridge pier caps are commonly designed using the sectional method, even though this
method cannot account for the deep beam action. To demonstrate the capacities obtained,
the five bent beams analyzed with the NLFEA were also analyzed using the sectional

27
method. The moment and shear capacities were determined at the critical sections based
on the AASHTO LRFD (2017) code. The sectional analysis results indicated that all beams
were significantly overloaded in shear. The proposed NLFEA methodology, on the other
hand, found significant reserve shear capacities for the same beams by predicting 2.5-times
the shear capacity, on average, compared to that obtained from the sectional method as
shown in Fig. 12(a).
The same bent beams were also analyzed using the strut-and-tie-method (STM) (Scott
et al. 2012), using the computer program STM-CAP (Baniya et al. 2018), which is a Visual
Basic Advanced (VBA)-based graphical computer program developed specifically for pier
caps. Fig. 12(b) shows the ratio between the capacities calculated by the NLFEA and the
STM. While STM provided larger capacities than the sectional method, the predicted
capacities were still much smaller than the proposed NLFEA methodology. The proposed
NLFEA methodology predicted 1.5-times the shear capacity, on average, compared to that
obtained from STM as shown in Fig. 12(b).
Fig. 12 – Comparison of shear capacities from NLFEA with (a) Sectional method and (b)
STM; 1 kip = 4.45 kN

28
Fig. 13 shows the capacities and the load-displacement responses obtained from all
three methods. For the purpose of comparison, the capacities are normalized to the
capacities obtained from the sectional method. In most cases, the pushover responses
exhibit an initial linear portion with high stiffnesses followed by nonlinear responses due
to concrete cracking and steel yielding. When comparing the calculated capacities of the
sectional and STM methods with the pushover curve and failure modes of the NLFEA,
results in Fig. 13 show that the sectional method predicts the capacities shortly after the
linear-elastic region, while the STM predictions are based on either the first yielding of
reinforcement or first local crushing of the concrete. Both methods neglect the strain
hardening behavior of reinforcement and the re-distribution of stresses due to concrete
cracking and reinforcement yielding.
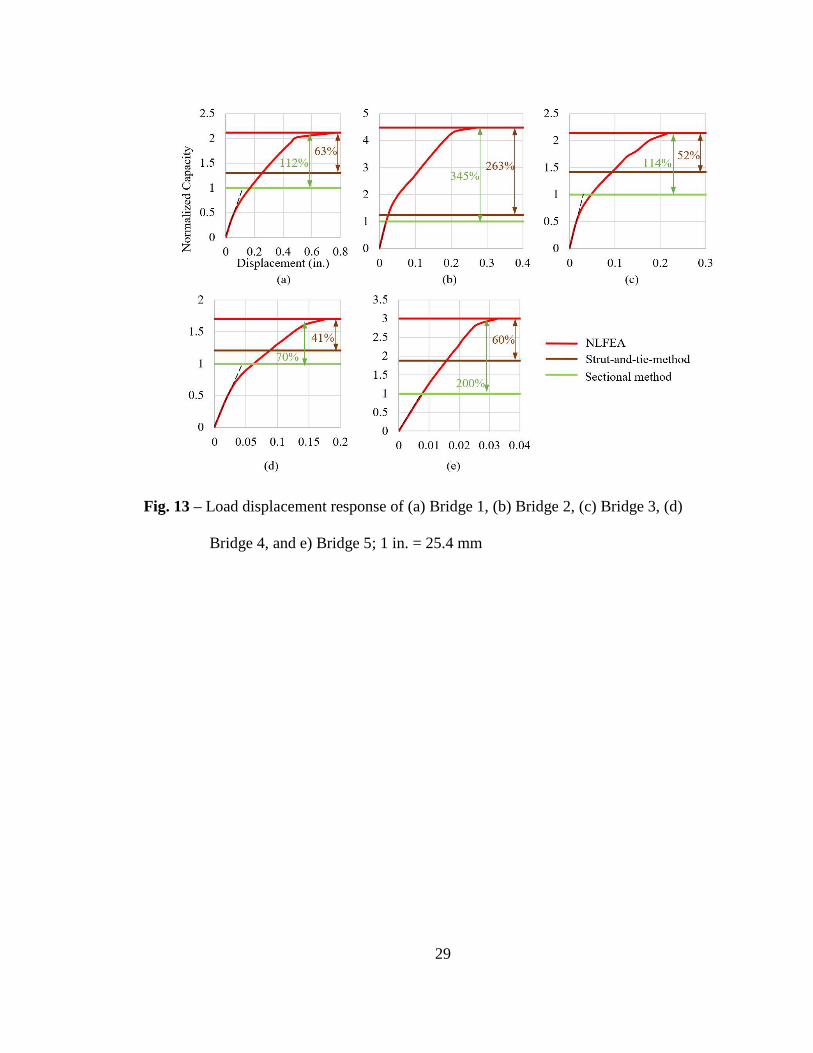
29
Fig. 13 – Load displacement response of (a) Bridge 1, (b) Bridge 2, (c) Bridge 3, (d)
Bridge 4, and e) Bridge 5; 1 in. = 25.4 mm

30
2.7 Simulation of Load Redistribution
In all of the beams examined, it was found that the failure did not occur at the first yield
of reinforcement or first crushing of concrete. There was a significant redistribution of the
stresses, which subsequently provided higher load capacities. Bridge 2, for example,
showed significant load re-distribution, which resulted in higher differences in the load
capacity as compared to the sectional method and STM, as seen in Fig. 13(b). The crack
patterns and the rebar stresses in the top and bottom reinforcement bars are shown in Fig.
14 for the initial, first major damage and failure conditions. Cracks initially formed at mid-
span as shown in Fig. 14(a). Diagonal cracks did not form during the elastic part of the
response. The sectional method considered the failure at the critical sections during this
stage, which was overly conservative. However, in the NLFEA, the stresses in the main
longitudinal reinforcement kept increasing and penetrating further into the beam, which
prevented any localized failure. As a result, widespread cracks were formed. The capacity
indicated by the strut-and-tie-method corresponds to Fig. 14(b), where the first rebar
yielded. After the top reinforcing bar yielded, 2-times higher load could be supported by
the beam until the shearing of the concrete as shown in Fig. 14(c). The failure occurred
from yielding of the reinforcement and shearing of the concrete along the beam length.
Consequently, the proposed NLFEA methodology was useful when investigating the load
redistribution and the sequence of nonlinear occurrences.

31
Fig. 14 – (a) First cracking, (b) First rebar yielding, and (c) Failure crack patterns and
rebar stresses obtained from the NLFEA for Bridge 2; 1 ksi = 6.9 MPa
2.8 Summary and Conclusions
A nonlinear finite element analysis (NLFEA) methodology is proposed for the strength
evaluation of deep bridge bents. The assessment employs a two-stage safety assessment
procedure and considers advanced concrete behaviors such as tension stiffening,
compression softening, and dowel action. The application of the proposed methodology is
presented by examining five existing bridge bents. The effectiveness of the proposed
methodology is discussed and a comparison with sectional and strut-and-tie methods is
made. The results of this study support the following conclusions.
1. Most bridge bents are deep beams with nonlinear strain distributions. Analysis
methods capable of representing the deep beam action are required to obtain
accurate results.
2. The proposed NLFEA methodology was shown to simulate the nonlinear
stress/strain distributions, the sequence of nonlinear occurrences and redistribution
32
of forces after concrete cracking and rebar yielding, and the governing failure
mechanisms.
3. The proposed two-stage safety assessment procedure simplified the strength
assessment process by employing the concept of a capacity factor based on the load
and material resistance factors. If the bridge is found overloaded in Stage 1, a more
in-depth probabilistic assessment of Stage 2 is required. Stage 2 assessment was
shown to predict higher reserve shear capacities than Stage 1 assessment; on
average, the difference in capacity was 2-times for the bridges examined in this
study.
4. The conventional sectional methods cannot capture the nonlinear strain distribution
and thus are not suitable for the analysis of deep beams. The proposed NLFEA
methodology predicted 2.5-times the shear capacities, on average, compared to the
sectional analyses (performed for demonstrative purposes).
5. The strut-and-tie method was found to provide a strength prediction corresponding
to the first yielding of the reinforcement or first crushing on the concrete, without
accounting for any force redistribution. The proposed NLFEA methodology
predicted 1.5-times the shear capacities, on average, compared to the strut-and-tie
analyses.
6. The proposed NLFEA methodology was useful when investigating the load
redistribution and the sequence of nonlinear occurrences. Redistribution of the
stresses with the subsequent development of nonlinear occurrences was found to
provide 2-times the load capacity for one of the bridge bents investigated.

33
7. There is limited public funding for the rehabilitation and strengthening of the
existing bridges. NLFEA that considers the required material models offers the
potential to correctly identify and rank overloaded bridges so that available funds
can be directed to the most critical bridges.
2.9 Acknowledgment
The authors would like to thank the Ohio Department of Transportation for providing
the structural design drawings and PhD candidate Rafael A. Salgado and MS candidates
Pappu Baniya, Sálvio A. Almeida Jr., and Sundar Chiluwal, at the University of Toledo,
for their feedback and support in this study.
2.10 Notations
a/d Shear span-to-depth ratio
αR Sensitivity factor for the resistance reliability
Ab Cross-sectional area of out-of-plane reinforcement
Ay Cross-sectional area of main reinforcement
β Reliability index
CF Capacity factor
CFreq Required capacity factor
Δm Mid-span displacement in the beam
d Depth of beam
fc Concrete characteristic uniaxial compressive strength
fcm Concrete mean uniaxial compressive strength
fs Reinforcement rupture strength

34
fy Reinforcement characteristic yield strength
fym Reinforcement mean yield strength
Ld Factored loads
LS Unfactored (service) loads
Фf Flexural-behavior reduction factor
ФS Shear-behavior reduction factor
ρt Reinforcement ratio
Rd Design resistance
Rk Resistance obtained using characteristic material properties
Rm Resistance obtained using mean material properties
γG Reduction factor
St Spacing of stirrups
VR Coefficient of variation of resistance
w Width of beam (average)
Wc Width of beam cross-section

35
3. Load rating of existing bridges using STM and
NLFEA.
The increase in traffic and transport freight over the past decade has significantly
increased the live loads on existing bridge structures. The funds for maintaining and
strengthening these bridges are limited; hence, accurate analysis methods are required for
their load rating. It is generally observed that the capacities of bridges are evaluated using
the sectional method and rated as per the AASHTO bridge evaluation manual in terms of
rating factor (RF). However, deep concrete members in bridges possess additional shear
strengths due to the formation of the strut action, which cannot be captured by the
conventional sectional method. To overcome this limitation, a methodology was proposed
in Chapter 2, which provides a well-defined framework using nonlinear finite element
analysis for the strength evaluation of deep bridge bent beams. The proposed methodology
quantifies the strength limits for bridge bent beams in terms of their capacity factor (CF).
The existing bridge load rating procedure in AASHTO LRFD standard employs RF for the
load rating of bridges. This chapter presents an additional method to determine RF for the
bridges using more accurate analysis methods recommended by AASHTO (i.e. strut-and-
tie method and nonlinear finite element analysis). Five existing bridge bent beams are
evaluated and compared in terms of RF, which reveals 2.5 times higher RF from STM and

36
4 times higher RF from NLFEA, reducing the number of overloaded bridges for
strengthening.
3.1 Introduction
Most bent beams in existing bridges were designed using older standards and lighter
loads. The increase in the live load due to heavier traffic, additional lanes, and transported
freight has now centered the emphasis of bridge engineering on maintenance and
strengthening of the existing bridges. The funds for maintaining and strengthening these
bridges are limited; hence, accurate analysis methods capable of representing the deep
beam action is required to correctly identify and rank the overloaded bridge bent beams
while performing a load rating.
In civil engineering practice, the sectional method is the most popular method and is
dominantly used for analyzing and load rating existing bridges. Although it only applies to
slender beams, it is commonly used for deep beams with the end result of providing overly
conservative results. AASHTO LFRD (2017) requires the use of either a strut-and-tie or a
nonlinear finite element analysis for deep beams. The strut-and-tie-method (STM) is shown
to represent the behavior of deep beams more accurately than the sectional method (Baniya
and Guner 2019; Kani 1967). In addition, recent research has demonstrated the possibility
and advantages of nonlinear finite element analysis (NLFEA) for accurately simulating the
behavior of deep beams, including the effects of shear cracking and the nonlinear strain
distributions (Sharma and Guner 2019; Demir et al. 2016).
This chapter presents a method for using the STM and NLFEA for load rating of
existing bridge bents and obtaining their safe live load carrying capacity in terms of rating

37
factors (RFs). The method is presented for five existing bridges located in Ohio. Predicted
RFs are compared with the RF obtained from the conventional sectional capacity.
3.2 Bridge load rating
Bridge load rating is a procedure to evaluate the safe live load carrying capacity of an
existing bridge. For load rating of a bridge, the rating factor (RF) is used as a scaling factor.
The RF provides an estimate of the relationship between the reserve live load carrying
capacity of a bridge and the live load demand. An RF value greater than 1.0 indicates a
reserved live load carrying capacity while a value less than 1.0 indicates an overload. The
RF used within the current AASHTO manual for bridge evaluation is based on a load and
resistance factor rating method, given as follows:
𝑅𝐹 =Ф𝐶−ϒ𝐷𝐶𝐷𝐶−ϒ𝐷𝑊𝐷𝑊±ϒ𝑝𝑃
ϒ𝐿𝐿𝐿𝐿(1+𝐼𝑀) (1)
Since the behavior of deep beam bridge bents is typically governed by shear failures,
this study will focus on the shear capacity calculations. The same procedure can be applied
to the flexural capacities as well. The shear capacity (C) is determined from three different
methods in this study; namely, the sectional method, STM, and NLFEA, which will be
discussed below.
3.3 Determination of rating factors
In this section, rating factors are determined for five existing bridges using the capacity
determined from the sectional method, STM, and NLFEA. The details of the geometric
and material properties for these bridges are discussed elsewhere (Baniya et al. 2018).

38
3.3.1 Sectional method
The sectional method requires checking the shear (or moment) capacities at critical
sections based on the “plane-sections-remain-plane” hypothesis, which is not valid for deep
beams. Although the sectional method should not be used for deep beams, it is used in this
study for comparison purposes. Since most deep beams fail in shear, the most critical
section is determined from the shear force diagram of the bridge. The sectional shear
capacity (C) is determined using the applicable concrete design code, AASHTO LRFD in
this case. The dead load (DL) and live load (LL) acting on the critical section are considered
with an impact factor (IM) of 33% applied to the live load to predict the rating factor (RF),
as shown in Equation 2.
𝑅𝐹 =Ф𝐶−ϒ𝐷𝐿𝐷𝐿
ϒ𝐿𝐿𝐿𝐿∗(1+𝐼𝑀) (2)
The strength I limit state is considered where the dead load factor ϒDL is 1.25 and the
live load factor ϒLL is 1.75. The detailed calculation results obtained from Equation 2 are
shown in Table 1.
Table 1: Calculation of rating factor (RF) from the sectional method.
C (kips) DL (kips) LL (kips) RF
Bridge 1 545 172 66 1.26
Bridge 2 550 120 43 2.66
Bridge 3 470 151 53 1.32
Bridge 4 425 121 60 1.20
Bridge 5 550 114 46 2.54
Average: 1.80
The rating factors predicted are all larger than 1.0; hence, all bridges are structurally
safe under the applied live loads, with bridges 1, 3, and 4 exhibiting the least potential of

39
carrying extra live load. It should be noted that these bridge bents are deep and possess
additional shear capacity due to the formation of the strut action, which is not considered
in the sectional method.
3.3.2 Strut-and-tie method
The strut-and-tie method (STM) uses a truss model where the stress field in the
structural concrete is equivalent to a hypothetical simple uniaxial truss structure which
defines the load paths. STM is conceptually a simple design methodology suitable for deep
beams. However, its implementation is complicated, requiring a graphical solution
procedure. In this study, the computer program STM-CAP (Baniya et al. 2018) is used.
STM-CAP determines the failure load (Pf) of the weakest member using an
automatically generated STM model. RF is determined based on the live load, which causes
the shear failure of a member in STM. The factored dead load (1.25DL) is subtracted from
Pf, which yields the total live load carrying capacity of the model. The ratio of this total
live load carrying capacity to the applied live load (factored by IM) gives the RF for the
STM model, as shown in Equation 3. Using this equation and the failure load Pf from the
STM model, the RFs are calculated for each bridge bent as shown in Table 2.
𝑅𝐹 =𝑃𝑓−1.25𝐷𝐿
𝐿𝐿∗(1+𝐼𝑀) (3)

40
Table 2: Calculation of rating factor (RF) from STM.
1.25DL (kips) LL (kips) Pf (kips) RF
Bridge 1 215 66 475 2.95
Bridge 2 150 43 520 6.55
Bridge 3 189 53 515 4.61
Bridge 4 151 60 460 3.87
Bridge 5 142 46 465 5.27
Average: 4.65
3.3.3 Nonlinear finite element analysis
Nonlinear finite element analysis (NLFEA) is an advanced numerical analysis method
that can be used to predict the capacities of deep bridge bents. When applied considering
advanced material models, such as tension stiffening, compression softening, and dowel
action, it offers significant potential for accurate simulation of the behavior of deep bridge
bents.
NLFEA predicts the system-level response and the use of material resistance factors in
the material models can artificially influence the response and failure mode of the bridge
bent beam. Thus, NLFEA models without material resistance factors are analyzed to obtain
the system level failure loads (Pf), which are then multiplied by the governing resistance
factor (Ф) – shear in this case – to obtain the capacity of the entire beam. The RFs are
determined by employing the total factored dead load (DLt), the total live load (LLt) and
the impact factor (IM), as per Equation 4. The detailed calculation results are shown in
Table 4.
𝑅𝐹 =Ф𝑃𝑓−1.25𝐷𝐿
𝐿𝐿∗(1+𝐼𝑀) (4)

41
Table 3: Calculation of rating factor (RF) from NLFEA.
1.25DLt
(kips)
LLt
(kips)
Pf
(kips)
ФPf
(kips) RF
Bridge 1 538 166 1456 1092 3.34
Bridge 2 523 149 2976 2232 11.47
Bridge 3 661 186 2565 1924 6.79
Bridge 4 529 210 2340 1755 5.84
Bridge 5 710 230 3885 2914 9.58
Average 7.40
3.4 Comparison of rating factors
The RFs from the STM are significantly higher than the sectional method, as expected,
since the STM model captures the deep beam action. The results from the STM suggest
that the total live load can be increased up to four times higher load, on average.
The RFs from the NLFEA are significantly higher than the STM, since the NLFEA
considers many advanced material behaviors where concrete carries tension, and
significant redistribution of the stresses, which provides extra capacity for the bridge bent
beams. The STM, on the other hand, is a lower-bound method and terminates the analysis
at the first yielding of rebar or first reaching the peak strain of concrete at any localized
point. Based on the NLFEA result, these existing bridges can withstand, on average, seven
times higher live loads combination.
The sectional method is not recommended for load rating of deep bridge bent beams,
since it consistently provides overly conservative (i.e., lower capacity) results.

42
Fig. 1: Comparison of rating factors obtained from the sectional method, STM, and
NLFEA.
3.5 Conclusions
Based on the rating factors (RF) determined from the sectional method, STM, and
NLFEA for five existing bridges in Ohio, the following conclusions were made:
1. Analyses methods capable of representing the deep beam action can provide a better
representation of the rating factor (RF).
2. The STM and NLFEA predict higher RFs for the deep bridge bents since they can
capture deep beam strut action in bridges.
3. Using NLFEA for evaluating existing bridge bent beams will result in higher RFs
and may reduce or eliminate the need for rehabilitation, significantly saving the
owner cost.

43
3.6 Notations
C Capacity of member
DC Dead loads due to structural components
DL Dead load from one girder
DLt Total dead load acting on the beam
DW Dead loads due to wearing surface
IM Impact load due to live load
LL Live load from one girder
LLt Total live load acting on the beam
Ф Strength reduction factor
P Applied permanent loads other than dead loads
Pf Failure load
RF Rating factor

44
4. System-Level Modeling Methodology for Helical Piles
Foundation Systems Subjected to Uplift and
Compression Loads.
This chapter includes the manuscript submitted to Engineering Structures journal by
Anish Sharma and Serhan Guner. It is expected that there will be changes before the
publication of the final paper. Please refer to the
link https://www.utoledo.edu/engineering/faculty/serhan-guner/publications.html to
download the final, published version of this paper.
4.1 Abstract
In tall and light structures, such as transmission towers, wind turbine, and light steel
structures, there is an increasing application of helical pile foundation system to resist the
uplift loading due to the wind. The uplift behavior of this foundation system depends on
the interaction between structural components (i.e. helical piles and pile cap), and the soil.
However, discrete modeling approaches are used by structural and geotechnical engineers
to analyze them, which provide simplified idealization for the soil or a simplified
idealization for the pile cap, respectively. As the interaction effects are neglected, the
reliability of discrete modeling approaches in terms of uplift resistance of these foundation

45
systems is uncertain. To overcome this uncertainty, system-level experiments are highly
desired, but they are expensive and difficult to perform, requiring an alternate method. This
study proposes a system-level modeling methodology for the holistic analysis of helical
pile foundation systems, accounting the effect of interactions as well as stress and strain
nonlinearities inherent to the concrete and the soil. Important modeling considerations are
discussed, and experimental benchmarks are provided to assist researchers in accurately
performing holistic analyses. The effectiveness of the holistic analysis is discussed by
comparing its results, including the load-displacement responses, load capacities, and
failure modes with the discrete modeling approaches. Results demonstrated that discrete
modeling approaches significantly underestimate the capacity up to 50%, and not
accurately predict the failure modes, requiring a holistic analysis for these foundation
systems.
4.2 Introduction
Helical Structures such as transmission towers and wind turbines are subjected to
strong wind load, which creates uplift loading on their foundations. To resist this uplift
loading, helical piles are commonly used due to their easy installation process, high tensile
capacities, minimal noise, and vibration during installation, removability, reusability, cost-
effectiveness, and suitability for areas with limited access (Perko 2009; Mohajerani et al.
2016). Helical piles are commonly made of high strength steel solid or hollow shaft, with
helices fixed to the shaft at a specific spacing. These piles are installed in groups in the pile
cap foundation system to obtain larger uplift load resistance, which depends on the linear
and nonlinear behavior of the concrete and soil, and the interactions between the structural

46
components (i.e. helical piles and pile cap), and the soil (Kwon et al. 2019; Guner and
Carriere 2016; Young 2012; Fahmy and Naggar 2017; Sakr 2011; Haldar and Basu 2013;
Mendoza et al. 2015). The structural analysis of helical pile foundation system usually uses
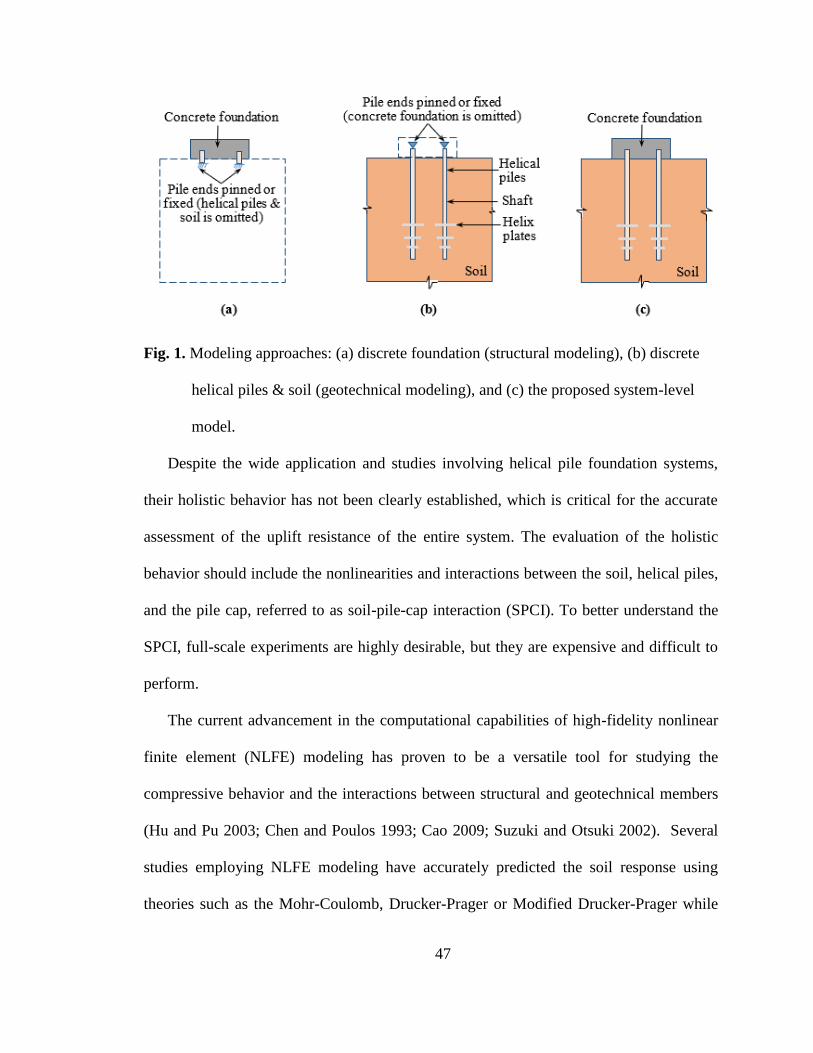
a discrete modeling approach, in which there is limited consideration of the soil – pile –
foundation interaction as the focus is on the capacity of the pile cap only. In this discrete
approach, the piles are considered either as pinned or fixed supported and the soil mass is
not considered (see Fig. 1a). On the other hand, the geotechnical analysis of this foundation
system uses another discrete modeling approach where the soil and the helical piles are
explicitly considered, but the interface of the piles – soil system with the pile cap is
neglected and considered as pinned or fixed (see Fig. 1b). Both of these discrete modeling
approaches oversimplify the actual behavior of the system, neglecting the effects of the
interaction between the pile cap and the helical piles-soil system. Hence, a system – level
modeling methodology considering all these components (see Fig. 1c) as well as the
interaction between them is required for a more realistic simulation of the holistic behavior
of the foundation system (Melendez et al. 2016; Uffe et al. 2012).
47
Fig. 1. Modeling approaches: (a) discrete foundation (structural modeling), (b) discrete
helical piles & soil (geotechnical modeling), and (c) the proposed system-level
model.
Despite the wide application and studies involving helical pile foundation systems,
their holistic behavior has not been clearly established, which is critical for the accurate
assessment of the uplift resistance of the entire system. The evaluation of the holistic
behavior should include the nonlinearities and interactions between the soil, helical piles,
and the pile cap, referred to as soil-pile-cap interaction (SPCI). To better understand the
SPCI, full-scale experiments are highly desirable, but they are expensive and difficult to
perform.
The current advancement in the computational capabilities of high-fidelity nonlinear
finite element (NLFE) modeling has proven to be a versatile tool for studying the
compressive behavior and the interactions between structural and geotechnical members
(Hu and Pu 2003; Chen and Poulos 1993; Cao 2009; Suzuki and Otsuki 2002). Several
studies employing NLFE modeling have accurately predicted the soil response using
theories such as the Mohr-Coulomb, Drucker-Prager or Modified Drucker-Prager while
48
employing contact elements with interactions defined by friction factors between the
concrete (or steel) and soil (Suzuki et al. 2000; Elsherbiny and Naggar 2013; Labuz and
Zang 2012; Alejano and Bobet 2012; Krenk 2000; Rawat and Gupta 2017; Salhi et al.
2013; Tan et al. 2008). Much fewer studies investigated the uplift behavior of helical piles
and soil (Hu and Pu 2003; Salhi et al. 2013; Tan et al. 2008; Dib et al. 2019). Some of these
studies employed two-dimensional (2D) finite element models (Labuz and Zang 2012;
Alejano and Bobet 2012) while more recent ones presented three-dimensional (3D) finite
element models to provide a more realistic simulation of the uplift behavior (Rawat and
Gupta 2017; Salhi et al. 2013; Tan et al. 2008). These studies, however, present models
applicable to certain conditions using certain computational modeling software.
This paper presents a 3D system-level modeling methodology for helical pile
foundation systems, which can be applied to many soil and foundation conditions, while
accounting for both soil and concrete nonlinearities as well as the soil-pile-foundation
interactions. The proposed methodology does not require the use of any particular
computer software because it calibrates the material and interaction properties with
experimental benchmarks studies from the literature, which are also presented to assist
researchers and practitioners in employing the proposed methodology. The methodology
uses an experimentally-verified failure mechanism of the helical pile foundation system
based on the relative displacement of the helical piles. The traditional, discrete modeling
approaches (discussed above) are also employed to demonstrate how the response
predictions compare with the proposed system-level modeling methodology in terms of the
load-displacement responses, load capacities, and failure modes. In addition, numerical
studies are performed to demonstrate the influences of critical parameters such as the soil
49
conditions, number of helix plates, embedment depth of the helical piles inside the concrete
foundation and the soil. While a special emphasis is places on load conditions creating net
uplift loads (to bridge the current knowledge gaps), the applicability of the methodology
to more traditional compression cases are also presented.
4.3 Proposed system-level modeling methodology
The proposed methodology uses three main stages as summarized in Fig. 2. These
stages include: 1) verification of the behavior of the discrete pile cap (foundation) model,
2) verification of the behavior of the discrete helical piles & soil model, and 3) system –
level modeling. The goal is to obtain the experimentally calibrated material and interaction
models in Stages 1 and 2 using the experimental benchmarks to be presented below, such
that an experimentally-verified system-level model could be created in Stage 3.

50
Fig. 2. Proposed system-level modeling methodology for helical pile foundation systems.

51
4.4 Verification of the behavior of discrete pile cap (foundation)
model
The first stage of the proposed methodology requires the creation of a NLFE model for
the discrete pile cap (discrete foundation). Symmetrical models are usually preferred
because they tend to be more efficient. Any NLFE modeling software can be used, on the
condition that it can simulate the nonlinear behaviors of materials and interaction properties
through the calibration studies presented below.
The concrete damage plasticity (CDP) model, which is based on scalar plastic damage
models proposed by Lee and Fenves (George et al. 2015), and Lubliner (Zhou et al. 2011)
can be used as a constitutive model to simulate the inelastic compressive and tensile
response of concrete (see Fig. 3a). The CDP model can also simulate the effects of the
interactions between the concrete and reinforcing bars. Reinforcing bars are modeled as an
elastic-plastic material, with the stress-strain response shown in Fig. 3b and are considered
perfectly bonded to the concrete foundation.
Fig. 3. (a) Concrete and (b) reinforcing bar constitutive models.
These material models have the capabilities to simulate the significant failure modes in
a discrete foundation (Livneh and Naggar 2008; Cerato and Victor 2009), including

52
punching shear (see Fig. 4a), one-way shear (see Fig. 4b), and flexural failures (see Fig.
4c).
Fig. 4. Global failure modes for a discrete foundation: (a) Punching shear, (b) One-way
shear, and (c) flexural failure.
After the material behaviors are defined, boundary conditions are applied at the support
ends of the foundation, to prevent them from moving in any direction. If a symmetrical
model is created, rollers should also be provided along the axis of symmetry. A pushover
analysis is performed up to the failure of the foundation using a displacement-controlled
loading protocol which permits the analysis to continue into the post-peak stages of the
response, thereby showing the ductility and softening behavior of the foundation. At the
end, the load-displacement response is obtained.
To verify the NLFE load-displacement response, experimental benchmark studies are
conducted to assess the accuracy in terms of the initial stiffnesses, ultimate load capacities
and the failure modes. In the case of a discrepancy (e.g., larger than + 10%), the input

53
material model properties should be adjusted, and the process is repeated until an adequate
accuracy is obtained.
4.4.1 Experimental benchmarks for discrete pile cap (foundation) model
A number of suitable experimental benchmark specimens are selected from the
literature, which can be used for the calibration of the NLFE material model while
employing the proposed methodology. The specimens selected to exhibit predominantly
shear and shear-compression types of failures because they are more challenging to capture
(as compared to reinforcing-steel-governed flexural failures), and most foundations are
deep concrete elements and pre-dominantly exhibit these types of failures. Both the
compression and uplift load conditions are considered.
For the compression loading, the NLFE response can be verified with the experimental
specimens tested by Vecchio and Shim 2004. This benchmark set includes twelve simply-
supported beam strips of height 552 mm subjected to monotonic compression loads. Test
results including load-displacement responses, load capacities, and failure modes are
reported in detail (Vecchio and Shim 2004). The cross-sectional details, material
properties, failure loads (Pu), and failure displacements (δu) are presented in Table 1.
54
Table 1 Experimental benchmark set details for discrete foundation modeling under
compression (Vecchio and Shim 2004)
If there is a load case involving net uplift loading, the NLFE response can be calibrated
with the experimental specimens tested by Diab (2015). This benchmark set includes seven
discrete pile cap strips of dimensions 500 x 500 x 1600 mm subjected to uplift loading.
Test results including load-displacement responses, load capacities, and failure modes are
reported in detail (Diab 2015). Uplift loading is applied by pulling the specimens with two
embedded steel piles of varying depths (de). The material properties, failure load (Pu), and
failure displacement (δu) are shown in Table 2.

55
Table 2 Experimental benchmark details for discrete foundation modeling under uplift
(Diab 2015)
The calibrated material model inputs that yield acceptable response simulations with
the experimental benchmark sets are recorded for use in Stage 3 when creating a system-
level model.
4.5 Verification of the behavior of discrete helical piles & soil
model
The second stage of the proposed methodology requires the creation of a NLFE model
for the discrete helical piles & soil model through a two-step process: first for a single
helical pile, and then for a grouped helical pile.
The single helical pile, made up of steel material, is modeled with an elastic-plastic
constitutive model as shown in Fig. 3b. The soil is modeled with an elastic-plastic
constitutive model with a failure mode governed by the Mohr-Coulomb criteria (Sun et al.
2006). If the shear stress (τ) is greater than c + σ tan Φ, where c is the cohesion, Φ is the
friction angle of soil, and σ is the normal stress, the soil fails as shown in Fig. 5a. This
failure criterion is used for its simplicity and extensive applicability for complex soil-
structure interaction analysis as demonstrated elsewhere (Sun et al. 2006). Two

56
independent material parameters (Young’s modulus, E, and Poisson’s ratio, v) define the
state of the isotropic linear-elastic properties of the soil. The model allows the
representation of nonlinear behavior of the soil based on the prescribed variations of the
Mohr-Coulomb model properties, namely: cohesion, friction, dilation. Furthermore, this
material model is capable of simulating two primary failure modes: individual plate uplift
where the failure occurs above all of the helical plates (see Fig. 5b), and cylindrical shear
where a more global failure occurs through the plate and the soil act together as a cylinder
(see Fig. 5c).

57
Fig. 5. (a) Constitutive model for the soil, failure model for helical pile-soil (b) individual
plate bearing, and (c) cylindrical shear.
The main objective of Stage 2 is to obtain the experimentally calibrated interaction
model to simulate interface between soil and the piles. The typical soil deformations that
occur in soil-pile interactions include plastic flow, expansion (dilation) that can occur with
shear deformation, soil compaction, and soil distortion. These interactions in the interface
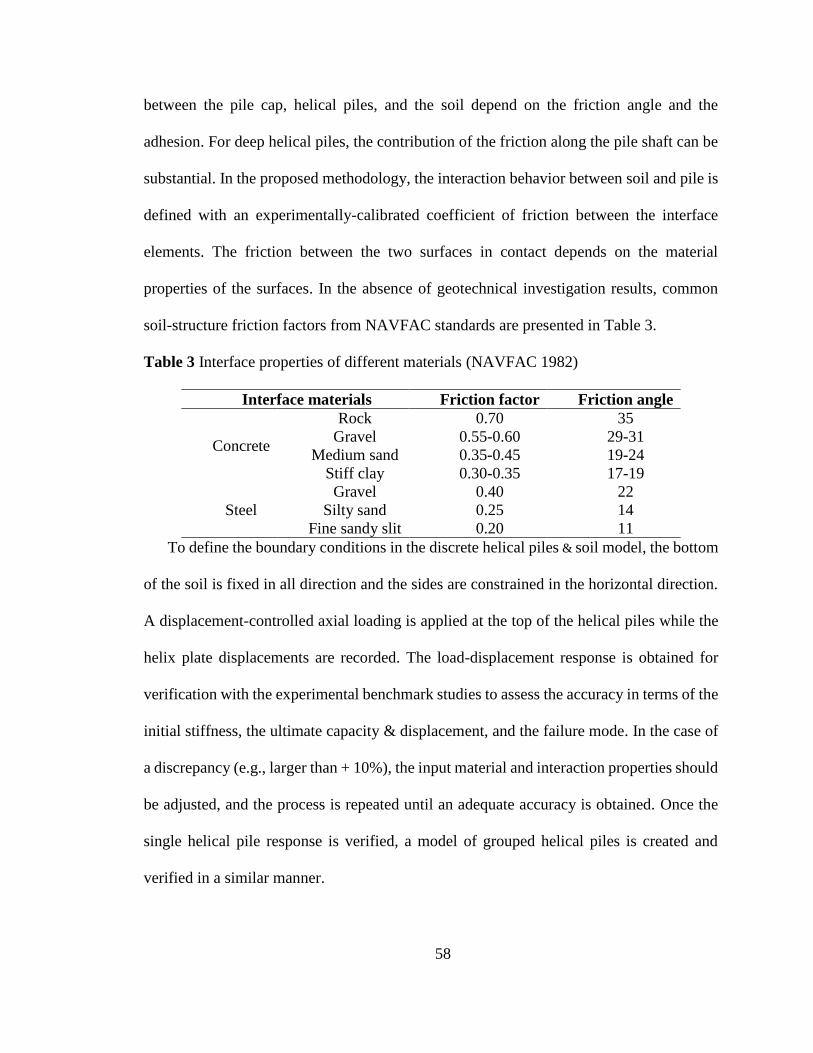
58
between the pile cap, helical piles, and the soil depend on the friction angle and the
adhesion. For deep helical piles, the contribution of the friction along the pile shaft can be
substantial. In the proposed methodology, the interaction behavior between soil and pile is
defined with an experimentally-calibrated coefficient of friction between the interface
elements. The friction between the two surfaces in contact depends on the material
properties of the surfaces. In the absence of geotechnical investigation results, common
soil-structure friction factors from NAVFAC standards are presented in Table 3.
Table 3 Interface properties of different materials (NAVFAC 1982)
Interface materials Friction factor Friction angle
Concrete
Rock 0.70 35
Gravel 0.55-0.60 29-31
Medium sand 0.35-0.45 19-24
Stiff clay 0.30-0.35 17-19
Steel
Gravel 0.40 22
Silty sand 0.25 14
Fine sandy slit 0.20 11
To define the boundary conditions in the discrete helical piles & soil model, the bottom
of the soil is fixed in all direction and the sides are constrained in the horizontal direction.
A displacement-controlled axial loading is applied at the top of the helical piles while the
helix plate displacements are recorded. The load-displacement response is obtained for
verification with the experimental benchmark studies to assess the accuracy in terms of the
initial stiffness, the ultimate capacity & displacement, and the failure mode. In the case of
a discrepancy (e.g., larger than + 10%), the input material and interaction properties should
be adjusted, and the process is repeated until an adequate accuracy is obtained. Once the
single helical pile response is verified, a model of grouped helical piles is created and
verified in a similar manner.

59
4.5.1 Experimental benchmarks for single and grouped helical pile – soil
model
A number of suitable experimental benchmark specimens are selected from the
literature, which can be used for the calibration of the NLFE model while employing the
proposed methodology. The geometric details and the soil properties are presented in Fig.
6 and Table 4, respectively. For the single pile model, the NLFE response can be verified
with four experimental specimens (SP1, SP2, SP3, and SP4) tested by Gavin et al. 2014,
Sakr 2013, and Livneh and Naggar 2008. For the group helical piles model, the NLFE
response can be verified with the experimental specimens (GP1) tested by Lanyi and Deng
2018. These selected specimens exhibit predominantly cylindrical shear failure that
follows the tapered profile of the inter-helices soil in the direction of loading, and most
helical pile foundations exhibit these types of failure. Test results including load-
displacement responses, load capacities, and failure modes are reported in detail (Gavin et
al. 2014; Sakr 2013; Livneh and Naggar 2008; Lanyi and Deng 2018). The properties of
the soil are provided and classified using the soil class defined by the united soil
classification system (USCS) standards (Howard 1984). The available data is sufficient to
model the soil using Mohr-Coulomb’s criteria, as discussed in the proposed methodology.

60
Fig. 6. Geometrical details (dimensions in mm) of helical piles experimental benchmarks
(a) SP1, (b) SP2, (c) SP3, (d) SP3, and (e) GP1.
Table 4 Soil properties for benchmark helical pile specimens
Specimens E (MPa) Φ (o) ѱ (o) c (kPa) Soil Type
(USCS )
SP1 23 56 33 0 GW
SP2 54 28 0 10 OL
SP3 48 35 5 1 GM-GL
SP4 48 35 5 1 GM-GL
GP1 50 22* 0 25 CH *Estimated based on USCS soil class (Howard 1984)
4.6 System – level modeling
The system – level model of helical pile foundation systems is created based on the
experimentally-calibrated material and interaction models obtained from Stages 1 and 2
discussed above. When creating a system – level model (e.g., Fig. 7a), the main
consideration should be given to how soil – structure interface are defined between the soil
and concrete foundation (denoted with subscript sc), and soil and helical piles (denoted

61
with subscript sp). In this study, these interactions are defined with pair of contact elements
as shown in Fig. 7b. This interaction model is based on the Coulomb law of friction and
depends on the coefficient of friction (µsc or µsp) between two surfaces in contact (see Fig.
7c).
Fig. 7. (a) A sample system-level FE model, (b) modeling soil-structure interface, and (c)
interaction model at the interface.
When defining the boundary conditions, a special attention should be paid to ensure
that that the variations in the strain profile is contained within the modelled soil area which
shows that the model of the soil mass is sufficiently large. A displacement-controlled
loading is desired, as opposed to a force-controlled one, at the top of the concrete
foundation (see Fig. 7a), in a monotonically increasing manner until the failure.
Displacement control will allow the analysis to continue in the post-peak region allowing
the quantification of the deformation capacity of the system and identification of the failure
mode. The Mohr’s Coulomb failure criterion with an 8% displacement cut-off (i.e., 8% of

62
the topmost helix plate diameter, Dt) is found to successfully capture the experimental
responses considered in this study. Similar failure criteria ranging from 5% to 10% of lead
helix (top helix) diameter are also found suitable in other studies (e.g., Elsherbiny and
Naggar 2013; Livneh and Naggar 2008). At the end of the analysis, a system – level load-
displacement response is obtained from which the stiffness, peak load capacity, and the
displacement ductility can be obtained. The failure mode of the system should be
determined using the deformed shape, stress and strain contours and the post – peak stages
of the load displacement response.
4.7 Application of the system – level modeling methodology
In this section, numerical studies are presented to illustrate the application of the
proposed methodology for performing system – level modeling of two helical piles group
foundation system embedded in silty sand (i.e. 50% of the coarse fraction passes 4.75 mm
sieve). The geometric and material details of discrete components (i.e. concrete foundation,
steel helical pile, and the soil) of the sample system to be modelled is shown in Fig. 8.

63
Fig. 8. Geometric details (dimensions in mm), material properties, and modeling setup
for the system-level modeling.
The proposed methodology requires that a discrete concrete foundation model is
created and experimentally verified first. While the Abaqus v6.14 program is used in this
study, any other NLFE modeling program can be used, on the condition that it can capture
the responses of the experimental benchmark specimens. In Stage 1, the material
properties, interaction properties, and boundary conditions for concrete foundation model
is defined as discussed in Section 2, and the model will be calibrated for both compression
and uplift loads for demonstration purposes. The compression load verification is
conducted using the experimental benchmarks (VS-OA1, VS-OA2, and VS-A3) subjected
to mid-span displacements. The complete load-deflection responses (see Fig. 9a) and the

64
failure modes (see Figs. 9b, 9c, and 9d) are obtained and compared with the experimental
results. Von mises stresses indicate if the material will yield or fracture. It is not appropriate
for brittle materials like concrete but illustrated in this study to visualize how stresses are
distributed in the discrete foundations. Strains would be relatively good representation of
damage pattern; hence plastic strain distributions of the concrete model are compared with
the experimental cracking patterns to validate the failure mode. The discrepancy between
the FE simulation and experimental values of the peak load capacities are found on be less
than 10%, indicating the successful calibration of the material model parameters, as shown
in Table 5, where fbo/fco is the ratio of initial biaxial compressive yield stress to the initial
uniaxial compressive yield stress, and K is the ratio of the second stress invariant on the
tensile meridian to that on the compressive meridian (ABAQUS 2014). It should be
emphasized that the benchmark specimens should be carefully selected to incorporate the
expected behaviors. The specimens VS-OA1 and VS-OA2 used in this study contained no
shear stirrups, similar to the foundation modelled, and failed in diagonal tension and shear
dominated failure modes.

65
Fig. 9. (a) Load-displacement response, (b) experimental failure mode, (c) captured
stresses distribution, and (d) cracking pattern from FE simulation under
compression load.
Table 5 Concrete damage plasticity input parameters for Stage 1 concrete under
compression
Parameter Value
Dilation angle (ѱ) 35
Eccentricity (ϵ) 0.1
fbo/ fco 1.16
K 0.667
Viscosity (µ) 0.0001
A similar process is employed for the uplift loads using the benchmark Specimen FT1
(see Table 2). The results of the experimental verification study are presented in Fig. 10 in

66
terms of load-displacement response and failure modes. The calibrated material model
input is presented in Table 6.
Fig. 10. (a) Load-displacement response, (b) cracking conditions from experiments, (c)
stress distribution and (d) cracking condition from FE simulation, for discrete
foundation under uplift.
Table 6 Concrete damage plasticity inputs for concrete under uplift
Parameter Value
Dilation angle (ѱ) 37
Eccentricity (ϵ) 0.1
fbo/ fco 1.16
K 0.667
Viscosity (µ) 0.0001
In Stage 2, a discrete helical pile & soil model is created (see Fig.11a) through a two-
step process. The first step is to model and experimentally verify a single helical pile model
while the second step involves modeling and verifying the grouped helical pile system
67
(incorporating the calibrated single pile models) to obtain the calibrated material and
interaction properties. For the first step, the material properties and boundary conditions
are defined as discussed in Section 2. To simulate the interaction between soil and helical
pile, the master-and-slave surface approach with hard contact is adopted, which is defined
with the coefficient of friction obtained from Table 3. Pushover analyses are performed to
obtain the load-displacement responses for comparison with the experimental results. For
the second step, the grouped helical pile system (GP1) is created and the material models
are calibrated, following a similar procedure. The captured load-displacement responses
and failure mode for the experimental benchmarks (SP1, SP3, SP4, and GP1) matches and
are illustrated in Fig. 11. Von mises stresses distribution of the helical pile & soil model is
used for predicting the load transfer and failure mechanisms (Kwon et al. 2019), assuming
the soil under plastic yielding. The discrepancy between the FE simulation and
experimental values of the peak load capacities are found on be less than 10%, indicating
the successful calibration of the soil model using Mohr’ coulomb model and interaction
model parameters.

68
Fig. 11. (a) Discrete single helical pile & soil NLFE model, (b) load-displacement
response, (c) soil stresses distribution at failure load, and load-displacement
responses for (d) SP3, (e) SP4, and (f) GP1.
In Stage 3, a system-level model is created, as shown Fig. 7a, using the eight-nodded,
first-order, and reduced-integration continuum solid elements (C3D8R). The
experimentally calibrated material models for the concrete, and the soil obtained from
Stage 1 and Stage 2 are employed. The interaction between soil and piles were considered
as hard contact, as it minimize the penetration of soil surface into the pile and does not
allow the transfer of tensile stress across the interface, with a coefficient of friction (μsp) of
0.2, and also the interaction between soil and pile cap as hard contact with a coefficient of
friction (μsc) of 0.35, following Table 4. The appropriate support conditions are applied and
a displacement-controlled pushover analyses is performed for both the compression and
uplift load cases.

69
The load-displacement response of the system, shown in Fig. 11b, exhibits three
distinct regions: initial linear-elastic region with a high stiffness, non-linear hardening
region, and plastic yielding and failure region shown in Fig. 12b. The first region represents
the shaft friction while the second one represents the stress distribution to the soil around
the pile shaft and helices. The failure corresponding to 8% of topmost helix diameter of
250 mm occurs between at the transition from the second to third regions with and an uplift
capacity of 610 kN. The stress distribution shown in Fig. 12a demonstrates that the soil
failure occurred above the topmost helix through the formation of a soil cone. In this cone,
the shear stress exceeds the shear strength of the soil, causing the soil element to fail above
the topmost helix. The interface element between the concrete foundation and the soil
contributes to the redistribution of the stresses, causing a reduction in the resisting forces
at ends of the helical piles, ultimately increasing the load and displacement capacities. The
concrete foundation showed local cracking but did not fail, as the stresses gets distributed
uniformly on the interface between the foundation and the soil.

70
Fig. 12. (a) Stresses distribution, and (b) load-displacement response for the system-level
model at 20 mm displacement (i.e. 8% Dt).
4.8 Comparison of discrete models with the system – level model
To demonstrate how the traditional discrete modeling results, compare with those from
the proposed system-level modeling methodology, the discrete pile cap and the discrete
helical piles & soil model are created, as shown in Fig 13. The results are examined in
terms of the load capacities and the failure modes.

71
Fig. 13. Comparison between discrete and system – level models in-terms of failure modes
and load capacities.
In the discrete pile cap model (see Figs. 13a and 13b), diagonal shear cracking occurred
in the pile cap which eventually led the failure to form around the pile cap termination
bracket. Hence, the uplift capacity of the discrete model was found to be 450 kN. In the
discrete helical piles & soil model (see Fig. 13c), the failure mode was in the soil above
the topmost helix as shown in Fig. 13d, similar to system-level model, with a capacity of
450 kN. Note that both system components are intentionally designed for the same load
capacity to allow for a consistent comparison with the system-level models. The capacities
obtained from all three models are presented in the load-displacement response shown in
Fig. 14 which shows that the discrete models underestimate the load capacity by 26%. The
load sharing and interaction between the system components permits the re-distribution of
stresses, allowing for larger load and displacement capacities to be achieved.
(a)
Diagonal cracking
Connection
failure
(c) (d)
Soil failure above top helix Von Mises compressive stresses (MPa)
V
on
Mises
stresses
(MPa)
Pile ends pinned or
fixed

72
Fig. 14. Uplift capacities comparison from system – level and discrete models.
4.9 Influence of soil type on the system – level model
To demonstrate the significance of the soil type, two more system-level models are
created using organic clay (OL) and well-graded gravel soil (GW) as shown in Table 7.
Soil types are selected to represent from soft to stiff conditions following USCS soil
classification.
Table 7 Soil parameters as per USCS soil class
USCS Soil-class Description c
(kPa) Φ (o) Remarks
GW Well-graded gravel 0 40 stiffer
GM-GL Silty gravel 0 35
OH Organic clay, organic silt 10 22 soft
The simulated load-displacement responses are presented in Fig. 15, along with the
capacity lines obtained from the discrete models. The results indicate that stiffer soil
significantly increases the capacity of the system-level models. The discrete models
underestimated the system capacity in all cases. An important conclusion is that as the soil
gets stiffer, the discrete modeling assumption of pile cap becomes more realistic and the
result converges.

73
Fig. 15. Influence of different soil types on the system-level model and discrete models for
(a) OH soil class, (b) GM-GL soil class, and (c) GW soil class as per USCS.
4.10 Influence of various design configurations
To investigate the influence or various design configurations and draw conclusions on
which of design parameter are significant in the holistic system design for uplift loads,
additional numerical studies are performed as discussed below.
4.10.1 Pile embedment in the concrete pile cap
A holistic analysis is performed to estimate the ultimate capacities with different
embedment depths of the helical pile termination brackets inside the pile cap. The
simulations are performed in three embedment depth conditions: top (T): 550 mm, middle
(M): 300 mm and bottom (B): 50 mm – all measured from the bottom of the pile cap (see
Fig. 16a). The system-level uplift capacities obtained are plotted in Fig. 16b. The increase
in the embedded distance inside the pile cap from bottom to middle increases the uplift
capacity by 25%. This conclusion is in agreement with the findings published elsewhere
(Guner and Chiluwal 2019; Chiluwal and Guner 2019). By further increasing the
embedment depth from middle to the top, the uplift capacity only increases by 8%. The use

74
of bottom embedment depth resulted in pre-mature cracking of concrete around the
connection; the failure occurred in these zones by the detachment of the helical piles from
the pile cap. Hence middle embedment depth inside the pile cap is recommended for helical
pile system.
Fig. 16. (a) Geometric details (dimensions in mm) of pile shaft embedment depths, and (b)
uplift capacities response with embedment depths.
4.10.2 Pile embedment in the soil
Embedment depth is defined as the distance from the top helix plate to the ground
surface. System-level model with three helices helical piles are analyzed with varying soil
embedment depths from 4000 mm to 5000 mm. The embedment in the concrete pile cap is

75
fixed for 300 mm (termed as the middle embedment). The uplift capacities obtained are
shown in Fig. 17a. The uplift capacity increases by 18% if the pile embedment in the soil
is increased from 4000 mm to 4500 mm. On further increasing the embedment depth by
500 mm, the capacity gain is similarly found to be 16%. With the increase in the pile
embedment in the soil, the initial linear segment of the load-displacement curve becomes
stiffer, which contributes to the increase in the capacity of the system-level model.
4.10.3 Helices number
The number of helices attached to the helical pile shaft is varied between single, double
and triple. The load-displacement curves are shown in Fig. 17b. The uplift capacity of
helical pile is found to increase by 36% as the number of plates increases from single to
double, where the soil between two helix plates act as a solid mass and provide extra
capacity. By increasing helix plate number from double to triple, the increase in the load
capacity is found to be a smaller value of 18%.
Fig. 17. Influence of (a) pile embedment inside the soil, and (b) pile embedment in the pile
cap in uplift capacity prediction from the system-level holistic analysis.

76
4.11 Conclusions
A methodology is proposed for the system – level analysis of helical pile foundation
systems accounting for both soil and concrete nonlinearities as well as the soil-pile-
foundation interactions using the experimentally-verified failure mechanism based on
relative displacement of the helical pile. The effectiveness of the methodology is
demonstrated by comparing its results with discrete modeling approaches. In addition, the
influence of soil type and various design configurations of helical piles on holistic behavior
prediction under uplift loading was investigated. From this study, the following inferences
are made.
- The traditional discrete modeling approaches has significant shortcoming in capturing
the failure modes and the load capacities of the helical pile foundation systems. The
influence of soil is neglected during the structural pile cap modeling while the influence
of the concrete pile cap is neglected during the helical pile and soil modeling.
- As compared to the system-level model including all system components, the discrete
modeling approach underestimated the load capacities by up to 33% under uplift. These
large discrepancies between the discrete and system-level modeling approaches are
obtained in softer soils.
- The load capacity predictions from the discrete and system-level modeling approaches
converges as the soil becomes stiffer because the discrete modeling assumption of fixed
boundary conditions become more realistic in stiffer soils.
- The system-level models demonstrate that the location of the helical pile termination
bracket inside the concrete pile cap has a significant influence on the uplift capacity of

77
the entire system. The bottom embedment depths resulted in premature concrete
cracking at connection zone – a concern for long-term durability due. The systems
incorporating bottom embedment depths failed at load capacities 25% less than those
obtained from middle embedment depths. This type of failure is not considered in the
traditional discrete modeling approaches.
- A well-defined 3D modeling methodology is proposed to better understand the holistic
behavior of the helical pile foundation systems and more accurately quantify their load
and displacement capacities, and visualize the system-level failure modes, including
the premature and undesirable ones.
- The proposed methodology uses experimentally calibrated material models without
requiring the use of any specific computer programs on the condition that it can capture
the significant failure mechanisms demonstrated in this study. Experimental
benchmark sets and how the calibration process is conducted is also defined in this
study.
- The methodology uses a failure criterion based on the relative displacement of helices
in the helical pile. Experimental failure reported in literatures occurred mostly when
the load-displacement curve reaches a displacement equivalent to 8% of topmost helix
plate diameter.
- With the increase in helical plate numbers, the pile embedment depths inside the soil
and the pile cap, higher resistance is developed from shaft friction in the system-level
model, ultimately increasing the uplift resistance up to 36% in the case studied.

78
5. Conclusions
In this study, two methodologies on numerical modeling of the deep concrete members
are presented. Based on the research results obtained, the following conclusions are drawn.
For deep bridge bent beams,
Most bridge bents are deep beams with nonlinear strain distributions. Analysis methods
capable of representing the deep beam action are required to obtain accurate results.
The proposed NLFEA methodology is shown to simulate the nonlinear stress/strain
distributions, the sequence of nonlinear occurrences and redistribution of forces after
concrete cracking and rebar yielding, and the governing failure mechanisms.
The proposed two-stage safety assessment procedure simplifies the strength assessment
process by employing the concept of factor of safety based on the load and material
resistance factors. If the bridge is found overloaded in Stage 1, a more in-depth
probabilistic assessment of Stage-2 is required. Stage-2 assessment is shown to predict
higher reserve shear capacities than Stage-1 assessment – on average, 2.0 times for the
bridges examined in this study.
The conventional sectional methods cannot capture the nonlinear strain distribution and
thus are not suitable for the analysis of deep beams. The proposed NLFEA
methodology predicted 2.5 times the shear capacities on average than the sectional
analyses (performed for demonstrative purposes).

79
The strut-and-tie method is found to provide a strength prediction corresponding to the
first yielding of the reinforcement or first crushing on the concrete, without accounting
for any force redistribution. The proposed NLFEA methodology predicted 1.5 times
the shear capacities on average than the strut-and-tie analyses.
The proposed NLFEA methodology is useful when investigating the load redistribution
and the sequence of nonlinear occurrences. Redistribution of the stresses with the
subsequent development of nonlinear occurrences is found to be significant for the
bridge bents investigated in this study.
There is limited public funding for the rehabilitation and strengthening of the existing
bridges. When applied considering required material models, NLFEA offers significant
potential to correctly identify, and rank, overloaded bridges so that available funds can
be directed to the most critical bridges.
For deep foundation cap beams with helical piles,
The traditional discrete modeling approaches has significant shortcoming in
capturing the failure modes and the load capacities of the helical pile foundation
systems. The influence of soil is neglected during the structural pile cap modeling
while the influence of the concrete pile cap is neglected during the helical pile and
soil modeling.
As compared to the system-level model including all system components, the
discrete modeling approach underestimated the load capacities by up to 33% under
uplift. These large discrepancies between the discrete and system-level modeling
approaches are obtained in softer soils.

80
The load capacity predictions from the discrete and system-level modeling
approaches converges as the soil becomes stiffer because the discrete modeling
assumption of fixed boundary conditions become more realistic in stiffer soils.
The system-level models demonstrate that the location of the helical pile
termination bracket inside the concrete pile cap has a significant influence on the
uplift capacity of the entire system. The bottom embedment depths resulted in
premature concrete cracking at connection zone – a concern for long-term
durability due. The systems incorporating bottom embedment depths failed at load
capacities 25% less than those obtained from middle embedment depths. This type
of failure is not considered in the traditional discrete modeling approaches.
A well-defined 3D modeling methodology is proposed to better understand the
holistic behavior of the helical pile foundation systems and more accurately
quantify their load and displacement capacities, and visualize the system-level
failure modes, including the premature and undesirable ones.
The proposed methodology uses experimentally calibrated material models without
requiring the use of any specific computer programs on the condition that it can
capture the significant failure mechanisms demonstrated in this study.
Experimental benchmark sets and how the calibration process is conducted is also
defined in this study.
The methodology uses a failure criterion based on the relative displacement of
helices in the helical pile. Experimental failure reported in literatures occurred
mostly when the load-displacement curve reaches a displacement equivalent to 8%
of topmost helix plate diameter.

81
With the increase in helical plate numbers, the pile embedment depths inside the
soil and the pile cap, higher resistance is developed from shaft friction in the
system-level model, ultimately increasing the uplift resistance up to 36% in the case
studied.

82
6. References
The following references includes all the references used in this thesis.
AASHTO (2017) “LRFD bridge design specifications” Customary US units, 4th Edition.
American Association of State Highway and Transportation Officials, Washington,
DC, 566 pp.
AASHTO, 2018. “The manual for bridge evaluation”, 3rd Edition. American Association
of State Highway and Transportation Officials, Washington, DC, xx pp.
ABAQUS 6.14 (2014) “Analysis user’s guide” Vol. IV, Dassault Systems, Providence,
Rhode Island, 1098 pp. http://130.149.89.49:2080/v6.14/index.html
ACI Committee 318 (2019) “Building code requirements for structural concrete (ACI 318-
19) and Commentary” American Concrete Institute, Farmington Hills, MI, 623 pp.
Alsaeq, H.M. (2013) “Effects of opening shape and location on the structural strength of
RC deep beams with openings” In Proceedings of World Academy of Science,
Engineering and Technology, 7(6): 494-499.
Akkaya, Y., Guner, S., and Vecchio, F.J. (2019) “Constitutive model for the inelastic
buckling behavior of reinforcing bars” ACI Structural Journal, 116(3): 195-204.
Retrieved from https://www.utoledo.edu/engineering/faculty/serhan-
guner/docs/JP11_Akkaya_et_al_2019.pdf

83
Banerjee, P.K., and Davies, T.G. (1978) “The behavior of axially and laterally loaded
single piles embedded in nonhomogeneous soils” Geotechnique, 28(3): 309–326.
https://doi.org/10.1680/geot.1978.28.3.309
Barbachyn, S.M., Kurama, Y.C., and Novak, L.C. (2012) “Analytical evaluation of
diagonally reinforced concrete coupling beams under lateral loads” ACI Structural
Journal, 109(4): 497.
Baniya, P., Sharma, A., and Guner, S. (2018) “Evaluation of reserve shear capacities of
bridge pier caps using the deep beam theory” Final Project Report, Ohio
Department of Transportation, Columbus, 120 pp. Retrieved from
https://www.utoledo.edu/engineering/faculty/serhan-
guner/docs/R1_ODOT_STMCAP.pdf
Bunni, N.G., Scott, B., Park, R., and Priestley, M. (1982) “Stress-strain behavior of
concrete confined by overlapping hoops at low and high strain rates” Journal of
American Concrete Institute, 79(6): 496-498.
CSA (2014) “Design of concrete structures (CSA A23.3-14)” 6th Edition. Canadian
Standards Association, Mississauga, Ontario, Canada, 290 pp.
Cervenka, V. (2008) “Global safety format for nonlinear calculation of reinforced
concrete” Beton‐und Stahlbetonbau, 103-S1: 37-42.
Chen, L., and Poulos, H. G. (1993) “Analysis of pile-soil interaction under lateral loading
using infinite and finite elements” Computers and Geotechnics, 15(4): 189–220.
https://doi.org/10.1016/0266-352X(93)90001-N
Chiluwal, S. and Guner, S. (2019) “Design recommendations for helical pile anchorages
subjected to cyclic load reversals” Final Project Report, Deep Foundation Institute,

84
Hawthorne NJ, USA, 173 pp.
http://www.utoledo.edu/engineering/faculty/serhanguner/docs/R2_DFI_Helical_P
ile_Anchorages.pdf
Clark, A.P. (1951) “Diagonal tension in reinforced concrete beams” Journal Proceedings,
48(10): 145-156.
Collins, M.P., and Mitchell, D. (1991) “Prestressed concrete structures” Response
Publications, reprinted in 1997, Canada, 766 pp.
Das, B. M. (2017) “Shallow foundations: bearing capacity and foundation” CRC press,
400pp. https://doi.org/10.1201/9781315163871
Demir, A., Ozturk, H., and Dok, G. (2016) “3D numerical modeling of RC deep beam
behavior by nonlinear finite element analysis” Disaster Science and Engineering,
2(1): 13-18.
Diab, M. A. M. (2015) “Behavior of helical pile connectors for new foundations” Ph.D.
Thesis, School of Civil and Environment Engineering, University of Western
Ontario, London, Ontario, Canada, 638 pp. Retrieved from
https://ir.lib.uwo.ca/cgi/viewcontent.cgi?article=4736&context=etd Accessed
13/05/2019.
Dib, M., Kouloughli, S., and Hecini, M. (2019) “Numerical analysis of high capacity
helical piles subjected to ground movement in weathered unstable clayey
slope” Computers and Geotechnics, 110: 319–325.
https://doi.org/10.1016/j.compgeo.2019.01.024
85
Fahmy, A., El Naggar, M. H. (2017) “Axial performance of helical tapered piles in
sand” Geotechnical and Geological Engineering, 35(4): 1549–1576.
https://doi.org/10.1007/s10706-017-0192-1
Gandomi, A.H., Alavi, A.H., Shadmehri, D.M., and Sahab, M.G. (2013) “An empirical
model for shear capacity of RC deep beams using genetic-simulated
annealing” Archives of Civil and Mechanical Engineering, 13(3): 354-369.
Gavin, K., Doherty, P., and Tolooiyan, A. (2014) “Field investigation of the axial resistance
of helical piles in dense sand” Canadian Geotechnical Journal, 51(11): 1343–1354.
https://doi.org/10.1139/cgj-2012-0463
George, B. E., Banerjee, S., and Gandhi, S. R. (2017) “Numerical analysis of helical piles
in cohesionless soil. International” Journal of Geotechnical Engineering, 1–15.
https://doi.org/10.1080/19386362.2017.1419912
Guner, S., and Carrière, J. (2016) “Analysis and strengthening of caisson foundations for
tension loads” Canadian Journal of Civil Engineering, 43(5): 411–19. Retrieved
from http://www.utoledo.edu/engineering/faculty/serhan-
guner/docs/JP6_Guner_Carriere_2016.pdf Accessed 13/05/2019.
Guner, S., and Chiluwal, S. (2019) “Cyclic load behavior of helical pile-to-pile cap
connections subjected to uplift forces” Engineering Structures (submitted)
http://www.utoledo.edu/engineering/faculty/serhan-
guner/docs/Guner_Chiluwal_Helical_Pile_Connections_Submitted.pdf
Guner, S., and Vecchio, F.J. (2010) “Pushover analysis of shear-critical frames:
formulation” ACI Structural Journal, 107(01): 63-71. Retrieved from

86
https://www.utoledo.edu/engineering/faculty/serhan-
guner/docs/JP1_Guner_Vecchio_2010a.pdf
Howard, A.K. (1984) “The revised ASTM standard on the unified classification system”
Geotechnical Testing Journal, 7(4): 216-222. 10.1520/GTJ10505J
Hu, L., and Pu, J. L. (2003) “Application of damage model for soil–structure
interface” Computers and Geotechnics, 30(2): 165–183.
https://doi.org/10.1016/S0266-352X(02)00059-9
Hwang, S.J., and Lee, H.J. (2002) “Strength prediction for discontinuity regions by
softened strut-and-tie model” Journal of Structural Engineering, 128(12): 1519-
1526.
Kani, G. (1967) “How safe are our large reinforced concrete beams?” Journal Proceedings,
64(3): 128-141.
Kim, H.S., Lee, M.S., and Shin, Y.S. (2011) “Structural behaviors of deep RC beams under
combined axial and bending force” Procedia Engineering, 14: 2212-18.
Kwon, O., Lee, J., Kim, G., Kim, I., and Lee, J. (2019) “Investigation of pullout load
capacity for helical anchors subjected to inclined loading conditions using coupled
Eulerian-Lagrangian analyses” Computers and Geotechnics, 111: 66–75.
https://doi.org/10.1016/j.compgeo.2019.03.007
Lanyi-Bennett, S. A., and Deng, L. (2018) “Axial load testing of helical pile groups in a
glaciolacustrine clay” Canadian Geotechnical Journal, 56(2): 187–197.
https://www.nrcresearchpress.com/doi/pdfplus/10.1139/cgj-2017-0425

87
Lee, J., and Fenves, G. L. (1998) “Plastic-damage model for cyclic loading of concrete
structures” Journal of Engineering Mechanics, 124(8): 892–900.
https://doi.org/10.1061/(ASCE)0733-9399(1998)124:8(892)
Livneh, B., El Naggar, M. H. (2008) “Axial testing and numerical modeling of square shaft
helical piles under compressive and tensile loading” Canadian Geotechnical
Journal, 45(8): 1142–1155. https://doi.org/10.1139/T08-044
Lubliner, J., Oliver, J., Oller, S., and Oñate, E. (1989) “A plastic-damage model for
concrete” International Journal of Solids and Structures, 25(3): 299–326.
https://doi.org/10.1016/0020-7683(89)90050-4
Lutenegger, A. J. (2015) “Quick design guide for screw-piles and helical anchors in
soils” International Society for Helical Foundations, 13 pp.
Mohajerani, A., Bosnjak, D., and Bromwich, D. (2016) “Analysis and design methods of
screw piles: a review” Soils and Foundations, 56(1): 115–128.
https://doi.org/10.1016/j.sandf.2016.01.009
NAVFAC. (2019) “Table of Ultimate Friction Factors for Dissimilar Materials” Retrieved
May 13, 2019, from <https://www.scribd.com/document/386017978/Table-of-
Ultimate-Friction-Factors-for-Dissimilar-Materials>
Niranjan, B.R., and Patil, S.S. (2012) “Analysis of R.C deep beam by finite element
method” International Journal of Modern Engineering Research (IJMER), 2(6):
4664-4667.
Oh, J.K., and Shin, S.W. (2001) “Shear strength of reinforced high-strength concrete deep
beams” Structural Journal, 98(2): 164-173.
88
Özcan, D.M., Bayraktar, A., Şahin, A., Haktanir, T., and Türker, T. (2009) “Experimental
and finite element analysis on the steel fiber-reinforced concrete (SFRC) beams
ultimate behavior” Construction and Building Materials, 23(2): 1064-1077.
Pan, Z., Guner, S., and Vecchio, F.J. (2017) “Modeling of interior beam-column joints for
nonlinear analysis of reinforced concrete frames” Engineering Structures, 142: 182-
191.
Popovics, S. (1973) “A numerical approach to the complete stress-strain curve of concrete”
Cement and Concrete Research, 3(5): 583-599.
Perko, H. A. (2009) “Helical piles: A practical guide to design and installation” New
Jersey: John Wiley & Sons, Inc, 512 pp.
https://doi.org/10.1002/9780470549063.ch12
Quintero-Febres, C.G., Parra-Montesinos, G., and Wight, J.K. (2006) “Strength of struts in
deep concrete members designed using strut-and-tie method” ACI Structural
Journal, 103(4): 577.
Randolph, M. F. (1977) “A theoretical study of the performance of the piles” Ph.D. Thesis,
Department of Engineering, University of Cambridge, 260 pp. Retrieved from
https://www.repository.cam.ac.uk/handle/1810/250739 Accessed 13/05/2019.
Rawat, S. and Gupta, A. K. (2017) “Numerical modelling of pullout of helical soil
nail” Journal of Rock Mechanics and Geotechnical Engineering, 9(4): 648–658.
https://doi.org/10.1016/j.jrmge.2017.01.007
Rogowsky, D.M., and MacGregor, J.G. (1986) “Design of reinforced concrete deep
beams” Concrete International, 8(8): 49-58.

89
Sakr, M. (2013) “Comparison between high strain dynamic and static load tests of helical
piles in cohesive soils” Soil Dynamics and Earthquake Engineering, 54: 20–30.
https://doi.org/10.1016/j.soildyn.2013.07.010
Sakr, M. (2011) “Installation and performance characteristics of high capacity helical piles
in cohesionless soils” DFI Journal-The Journal of the Deep Foundations Institute,
5(1): 39–57. https://doi.org/10.1179/dfi.2011.004
Salgado, R.A., and Guner, S. (2018a) “A comparative study on nonlinear models for
performance-based earthquake engineering” Engineering Structures, 172: 382-391.
Retrieved from https://www.utoledo.edu/engineering/faculty/serhan-
guner/docs/JP10_Salgado_Guner_2018.pdf
Salgado, R.A., and Guner, S. (2018b) “Numerical analysis methodology for deep cap
beams retrofitted with fiber reinforced polymers” Advances in Concrete Bridges;
Design, construction, evaluation, and rehabilitation, American Concrete Institute,
SP 331-1: 1-10. Retrieved from
https://www.utoledo.edu/engineering/faculty/serhan-
guner/docs/JP14_Salgado_Guner_2019.pdf
Salhi, L., Nait-Rabah, O., Deyrat, C., and Roos, C. (2013) “Numerical modeling of single
helical pile behavior under compressive loading in sand” EJGE, 18: 4319–4338.
http://www.ejge.com/2013/Ppr2013.395mlr.pdf
Schlaich, J., Shafer, K., and Jennewein, M. (1987) “Toward a consistent design of
structural concrete” PCI Journal, 32(3): 171-179.
Schlaich, J., and Shafer, K. (1991) “Design and detailing of structural concrete using strut-
and-tie models” Structural Engineer, 69(6): 113-125.

90
Scott, R.M., Mander, J.B., and Bracci, J.M. (2012) “Compatibility strut-and-tie modeling:
Part I-Formulation” ACI Structural Journal, 109(5): 635.
Senturk, A.E., and Higgins, C. (2010a) “Evaluation of RCDG bridge bent caps with 1950’s
Vintage Details - Analytical Methods” ACI Structural Journal, 107(5): 544-553.
Senturk, A.E., and Higgins, C. (2010b) “Evaluation of RCDG bridge bent caps with 1950’s
Vintage Details – Laboratory Tests” ACI Structural Journal, 107(5): 534-543.
Senturk, A.E. (2008) “Experimental and analytical evaluation of conventionally reinforced
deck-girder bridge bent caps with vintage details” PhD Dissertation, Oregon State
University, 351 pp.
Sun, D. A., Yao, Y. P., and Matsuoka, H. (2006) “Modification of critical state models by
Mohr–Coulomb criterion” Mechanics Research Communications, 33(2): 217–232.
https://doi.org/10.1016/j.mechrescom.2005.05.006
Tan, K.H., Kong, F.K., Teng, S., and Weng, L.W. (1997) “Effect of web reinforcement on
high-strength concrete deep beams” Structural Journal, 94(5): 572-582.
Tan, S. A., Ooi, P. H., Park, T. S., and Cheang, W. L. (2008) “Rapid pullout test of soil
nail” Journal of Geotechnical and Environmental Engineering, 134(9): 1327–1338.
https://doi.org/10.1061/(ASCE)1090-0241(2008)134:9(1327)
Vecchio, F. J., and Shim, W. (2004) “ Experimental and analytical reexamination of classic
concrete beam tests” Journal of Structural Engineering, 130(3): 460–469.
https://doi.org/10.1061/(ASCE)0733-9445(2004)130:3(460);
Vecchio, F.J., and Collins, M.P. (1986) “The modified compression-field theory for
reinforced concrete elements subjected to shear” ACI Journal, 83(2): 219-231.

91
Vecchio, F.J. (2000) “Disturbed stress field model for reinforced concrete: formulation”
Journal of Structural Engineering, 126(9): 1070-1077.
Wong, P.S., Vecchio, F.J., and Trommels, H. (2013) “VecTor2 and FormWorks user’s
manual” Technical Report, Department of Civil Engineering, University of
Toronto, 347 pp. Retrieved from
http://www.vectoranalysisgroup.com/user_manuals/manual1.pdf
Young, J.J.M. (2012) “Uplift capacity and displacement of helical anchors in cohesive soil”
MS Thesis, School of Civil and Construction Engineering, Oregon State
University, 156 pp. Retrieved from
https://ir.library.oregonstate.edu/downloads/j6731765j Accessed 13/05/2019.
Zhou, W. H., Yin, J. H., and Hong, C. Y. (2011) “Finite element modelling of pullout
testing on a soil nail in a pullout box under different overburden and grouting
pressures” Canadian Geotechnical Journal, 48(4): 557–567.
https://doi.org/10.1139/t10-086.