Embed Size (px)
Citation preview
9-109-001
R E V : J A N U A R Y 1 8 , 2 0 1 2
________________________________________________________________________________________________________________
Post-Doctoral Fellow Anette Mikes prepared this case. HBS cases are developed solely as the basis for class discussion. Cases are not intended to serve as endorsements, sources of primary data, or illustrations of effective or ineffective management. Copyright © 2008, 2012 President and Fellows of Harvard College. To order copies or request permission to reproduce materials, call 1-800-545-7685, write Harvard Business School Publishing, Boston, MA 02163, or go to www.hbsp.harvard.edu/educators. This publication may not be digitized, photocopied, or otherwise reproduced, posted, or transmitted, without the permission of Harvard Business School.
A N E T T E M I K E S
Enterprise Risk Management at Hydro One (A)
The Toronto skyline glittered in the early gloom of winter as chief executive Laura Formusa returned to her glass-walled office. She knew that the winter season presented Hydro One with its most severe challenges. It had to deliver electricity safely and reliably to 92 municipal utilities, 113 large industrial customers and 1.3 million households in the Province of Ontario while snow, freezing rains and severe winds gusting up to 100 km/hr continually threatened its aging transmission and distribution system. Just last weekend Hydro One’s award-winning restoration crews had worked around the clock to restore power to 90,000 customers affected by a winter storm.
Formusa glanced at her watch. She had ten minutes to review a headline news update, sent by chief risk officer John Fraser, in advance of the 30 minute semi-annual review with him of Hydro One’s risk profile. Formusa, a 30-year veteran of Hydro One and the company’s former general counsel, had been appointed chief executive officer only a few days ago, on 8 December 2006. The company’s strategy (posing objectives such as 90% customer satisfaction across the board) had not changed substantially in the last five years. However, she felt that the risks threatening the achievement of the strategic plan had been shifting, to the extent that she had to ask herself – was the strategy tenable?
Company History, Operations and Strategy
Founded in 1906, Hydro One’s predecessor, Ontario Hydro generated electric power at Niagara
Falls for distribution to municipal utilities.1 Over time the company had built five coal-fired, 68 hydro-electric and five nuclear power stations, and increased its power generation and transmission capacity to 30,000 megawatts, making Ontario an exporter of electricity to other provinces and the United States. However, by the end of the century it became clear that Ontario’s aging electricity system needed a major transformation.
In 1998, the Ontario government deregulated the province’s electric power industry. It restructured Ontario Hydro into two separate organizations: a power generation utility and a combined transmission/delivery “poles-and-wires” business to be called Hydro One. Headquartered in Toronto, Hydro One consisted of three businesses—transmission, distribution, and telecommunications, with the first two accounting for 99% of revenue.
1 Aabo, T., Fraser, J., Simkins, B. (2005), ‘The Rise and Evolution of the Chief Risk Officer: Enterprise Risk Management at Hydro One’ Journal of Applied Corporate Finance, Volume 17, Number 3, pp. 62-74.
For the exclusive use of K. Wade, 2020.
This document is authorized for use only by Kizzie Wade in Hydro One - AC554 ENTERPRISE RISK taught by David Adu-Boateng, Purdue University Global from Sep 2020 to Mar 2021.

109-001 Enterprise Risk Management at Hydro One (A)
2
Sir Graham Day, a renowned Canadian-born businessman who played an instrumental role in privatizing Britain’s utility sector under Margaret Thatcher’s government, chaired the Hydro One board. The board had a mandate to prepare Hydro One to become a public company through an IPO that would raise an estimated C$5.5 billion for upgrading Ontario’s transmission infrastructure and for paying down the C$4.5 billion debt due to the government. The board appointed the senior management team, headed by chief executive Eleanor Clitheroe, a high-profile Canadian businesswoman. In preparation for the IPO, Hydro One’s management team embraced new business practices and a cultural change featuring a new consumer-focused service ethos, cost cutting,2 enterprise risk management, performance management, and strategic planning. In April 2002, Hydro One prepared an IPO prospectus and began a series of investor presentations. The transformation of Hydro One, however, had raised media and political controversy. Publicity about the private-sector-level salaries of the management team led to a fall-out between the government and the board. The board resigned and ultimately, the replacement board ousted the chief executive.3 A trade union went to court and obtained a ruling that created a legal barrier to the privatization. The government did not appeal, and Hydro One canceled the IPO two weeks before the planned date.
Once the public controversy died down, the new board appointed Australian energy executive Tom Parkinson as CEO. Under his leadership, Hydro One continued to follow Clitheroe’s value creation strategy including the implementation of enterprise risk management, a risk-based investment planning system, and a balanced scorecard that featured a strong emphasis on customer service.
Hydro One’s rates had to be approved periodically by the Ontario Energy Board, established under legislation. In 2002, unusually hot weather conditions in spring and summer increased energy cost pressures on customers. The Ontario Energy Board mandated lower distribution rates for Hydro One, effectively capping the distribution revenues at about C$4 billion for the next five years. (See summary financial statements in Exhibit 1.) To allow continuing investment in the maintenance and upgrade of its transmission system in this constrained environment, Hydro One launched an efficiency and cost-cutting initiative that led to the departure of 140 staff and a hiring freeze. Rating agencies Standard and Poor’s, Moody’s and Dominion recognized the improvements in Hydro One’s financial profile, and upgraded the company’s long term debt to A, A2 and A (high), respectively. But in 2005, 800 professional employees went on an 18-week strike to protest a proposed decrease of benefits to new employees in their union, arising from the cost cutting measures.
The government of Ontario favored conservation initiatives, and was rigorously phasing out coal-fired power stations throughout the province. The ruling party’s re-election campaign in the forthcoming election year featured energy savings and environmental conservation. Should the party be re-elected, and pursue initiatives to reduce electricity consumption in Ontario, Hydro One would be expected to lead these initiatives despite their adverse impact on the company’s revenues and earnings. Formusa wondered whether Hydro One could deliver on the government’s conservation goals without compromising its commercial viability. Hydro One had to manage a complex web of conflicting interests—the multiple agendas of government ministers, regulators, consumers, environmental groups, and capital market debt holders who had recently subscribed to the company’s C$1billion bond issue (not guaranteed by the Province).
2 An early retirement scheme in 2000 led to the departure of 1,300 long-serving employees, 20% of the company’s staff. The company rebalanced its workforce by the addition of just 126 people and spending C$4.4-million per annum in outsourcing costs.
3 “An apology for Eleanor Clitheroe”. Canadian Business, 9-22 October 2006, pp. 80-89.
For the exclusive use of K. Wade, 2020.
This document is authorized for use only by Kizzie Wade in Hydro One - AC554 ENTERPRISE RISK taught by David Adu-Boateng, Purdue University Global from Sep 2020 to Mar 2021.

Enterprise Risk Management at Hydro One (A) 109-001
3
Hydro One’s power transmission capacity, however, remained stretched. Summer heat waves led to record levels of power demand from the company’s aging assets. Hydro One had plans to invest more than C$600 million into the maintenance and growth of its asset base, the largest expansion in 20 years. Yet soaring demand for transmission and distribution systems from China, which was opening new coal-fired power stations at a rate of one per week, had reduced the company’s bargaining power with suppliers who were now quoting longer and longer lead times for crucial equipment.
Despite the government’s advocacy of conservation, cheap electricity encouraged Canadian consumers to increase their purchases of plasma TVs, air conditioners and other energy-intensive consumer devices. (See trends in Ontario’s electricity generation and usage in Exhibit 2.) To cope with the increased demand on its aging assets, Hydro One launched an active conservation and demand management program. In one initiative, it became the first electricity company in the world to provide customers with free PowerCost Monitors,TM which gave consumers a quick and easy way of seeing their real-time spending on electricity. The 2006 pilot study of five hundred Ontario homeowners showed that real time electricity monitors helped them reduce their consumption of electricity by up to 8%.
Hydro One’s customer-focused strategy contributed to increases of customer satisfaction ratings of large transmission and local distribution company customers from 42% in 2002, to 86% in 2006. Residential customer satisfaction remained consistently strong around 82%. The company’s maintenance team regularly received industry awards for rapid restoration of damaged transmission infrastructure during extreme winter weather emergencies.
Upon her appointment4, Laura Formusa took stock of the company’s status quo:
Turning the company's attention outward to the customer had been a huge change for us. We always knew about our customers’ needs, and we always thought we knew the best thing for them. But with the change in our focus in addressing their needs, customer satisfaction has, in some areas, doubled.
Our operating costs, however, remain high, and with the work force reductions under the previous CEOs and the 18-week strike, we lost some of the heart and soul of our employees. We now have a workforce that's not entirely engaged. We also have some reputational risk arising from the departures of the previous CEOs.
Formusa endorsed the vision in a Strategic Plan to make Hydro One the best transmission and distribution business in North America. It would achieve this vision by having the best safety record in the world, top quartile transmission and distribution reliability, 90% customer satisfaction across all segments, top quartile employee productivity, operating efficiency, and an “A” credit rating.5 Formusa also intended to reach out and negotiate a long-term deal with the unions.
4 The previous chief executive left under a cloud of media furor, after he had been accused by Ontario’s auditor general for putting $45,000 in business expenses on his secretary’s corporate credit card, and then approving her claim himself. (Source: Toronto Star, 9 December 2006.)
5 “Five Year Vision”, company document.
For the exclusive use of K. Wade, 2020.
This document is authorized for use only by Kizzie Wade in Hydro One - AC554 ENTERPRISE RISK taught by David Adu-Boateng, Purdue University Global from Sep 2020 to Mar 2021.

109-001 Enterprise Risk Management at Hydro One (A)
4
Enterprise Risk Management
The Toronto Stock Exchange was one of the first exchanges that required listed companies to implement high-level, strategic risk management. Pioneering Canadian companies, such as the Royal Bank of Canada, Sun Life and Hydro One developed enterprise risk management in response to this corporate governance requirement.6 New policies were changing the energy industry, bringing to the fore new threats and opportunities: climate change and carbon legislation; the deregulation of electricity markets, and the greater adoption of renewable technologies. Chief risk officer John Fraser advocated: “if a company does not have risk management, it would be like driving a car without brakes.”7
Hydro One had introduced a three-phase enterprise risk management program. In Phase One, employees participated in a series of workshops to develop a collective understanding of the company’s key strategic objectives and the risks that threaten their achievement. In Phase Two the chief risk officer conducted a series of one-to-one interviews twice a year with senior managers to review the corporate risk profile. In Phase Three, conducted during the annual planning process, Hydro One allocated resources to prioritized investment project proposals based on the risks identified.
Phase 1: Risk Workshops and the Delphi Method
Fraser believed that enterprise risk management started with top management agreeing about strategic objectives, then developing a shared understanding of the principal risks faced by the organization. Fraser acknowledged that his role was to raise questions during interactive risk workshops:
Enterprise risk management is a contact sport. Success comes from making contact with people. Magic occurs in risk workshops. People enjoy them. Some say, “I have always worried about this topic, and now I am less worried, because I see that someone else is dealing with it, or I have learned it is a low probability event.” Other people said, “I could put forward my point and get people to agree that it is something we should be spending more time on, because it is a high risk.”
Prior to a risk workshop, the risk team informally polled managers and drew up a generic list of 60–70 potential risks or threats to the business or the project being discussed. They e-mailed the list to the participating management team asking them to choose the ten most critical risks facing their business or project. Based on these choices, and, if needed, some additional interviews and focus groups, the risk management team narrowed the list to 8–10 risks. A risk officer then started the half-day risk assessment workshop with the presentation of the shortlisted risks, and asked participants to confirm whether these were in fact the most important risks or whether any others should be discussed in detail instead. Then participants talked over the risks, one at a time, and voted on their relative significance.
6 According to one widespread definition, embraced by many Canadian boards, enterprise risk management is “the discipline by which an entity assesses, controls, measures and monitors risk from all sources for the purpose of increasing the entity’s short- and long-term value to its stakeholders. (Source: “Risky business”, CA magazine, May 2005.)
7 Source: “Risky business”, CA magazine, May 2005.
For the exclusive use of K. Wade, 2020.
This document is authorized for use only by Kizzie Wade in Hydro One - AC554 ENTERPRISE RISK taught by David Adu-Boateng, Purdue University Global from Sep 2020 to Mar 2021.

Enterprise Risk Management at Hydro One (A) 109-001
5
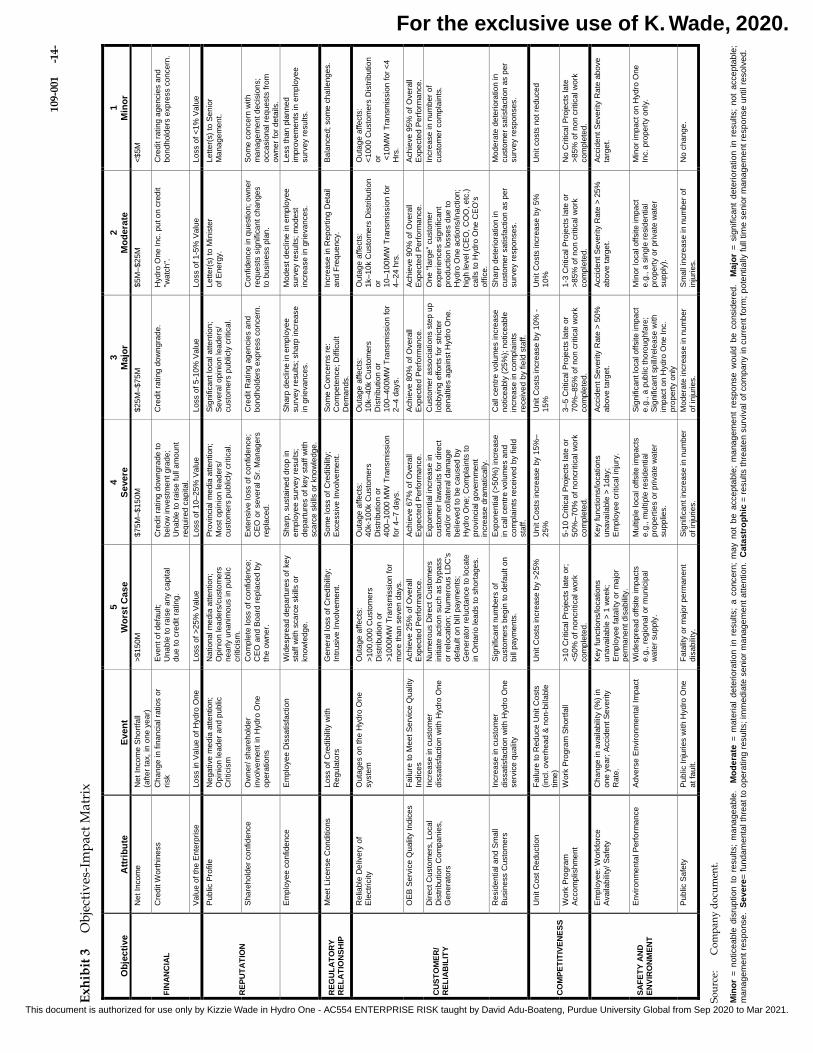
The meetings used the Delphi-method for voting, which involved a combination of facilitated discussions and iterative anonymous voting technology. The management team assessed each risk by asking, “Which of our stated business objectives are most threatened by that risk and to what degree?” It measured impact for each strategic objective on a five-point scale: Minor (1), Moderate (2), Major (3), Severe (4), and Worst Case (5). For example, an oil spill could be assessed as threatening several objectives—financial, environmental and reputational (see Exhibit 3). Fraser explained:
Let’s assume we had an environmental spill of 10,000 liters of oil. We ask people to vote on a scale of one to five as to the consequences if our controls didn’t work. A financial person could use the financial scale by stating, “the last time we had an oil spill, it cost $10 million to clean up; I call it a 4.” The environmental specialist could assess its impact by saying, “this could cause a significant local off-site impact, I am going to vote a 3.” The head of public relations says “if it gets reported in the local press, the Toronto Star, I would call it a 3. If the spill gets into the waterways, it would get covered by the national press, and then I’m going to vote a 4.” Each person in the room identifies a different impact, based on his or her area of
expertise. It brings a lot of clarity.8
The first vote on the perceived impact of the risk under consideration often showed wide dispersion. The team continued to discuss the causes and consequences of the particular risk. The length of the discussion typically depended on the dispersion of votes in the first voting session. At some point, the team voted again. Usually they needed no more than three voting rounds to agree on the assessment of a particular risk, or in the absence of alignment, a clearly documented cause of disagreement.
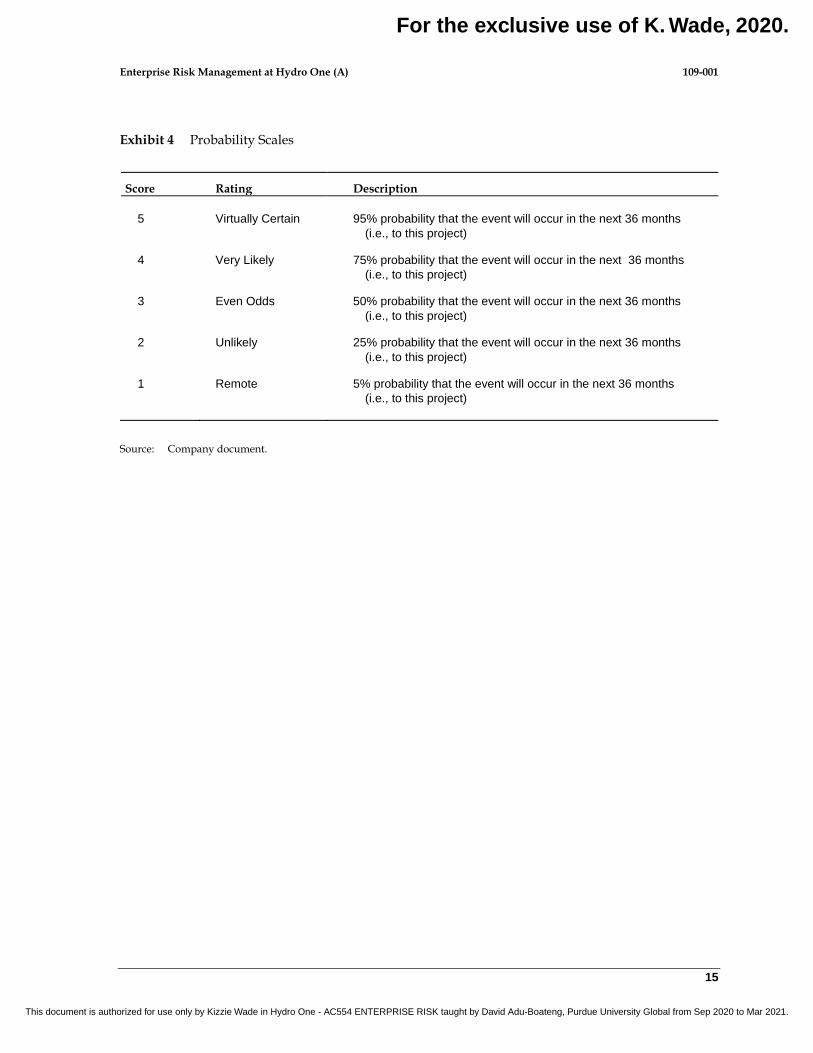
For all risks deemed to be Major (3), Severe (4), or Worst Case (5), managers identified the worst credible outcome that could occur within a 2-3 year time frame if certain key controls failed.9 In this way, the group assessed the magnitude of a given risk, its probability of occurrence over the next 2-3 years, and the strength of existing controls. (Exhibits 4 and 5 show the scales used for the assessment of probabilities and control strength.) The group then discussed preliminary action plans and assigned a manager to be the “risk-owner,” typically the project manager or the business’ CEO, with
responsibility to develop concrete action plans to mitigate the risk.10 While the ERM policy was that “risk management is everyone’s responsibility, from the Board of Directors to individual employees,” the risk owner had primary responsibility for deciding whether to accept and live with the risk or to
take specific steps to deal with it within a formal risk mitigating process.11
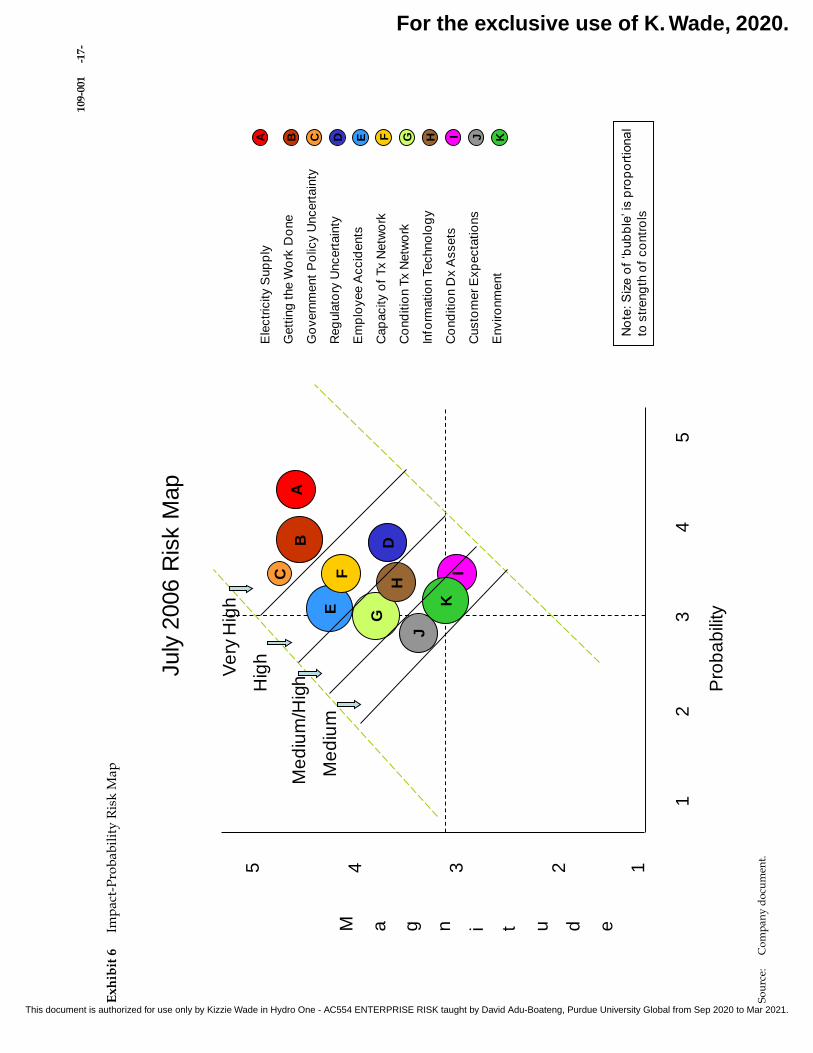
Once the management team had assessed risks and controls, the risk officers prepared a risk map—a two-dimensional rank-ordered chart of “residual risks.” (Exhibit 6 shows an example of an impact-probability risk map.) Fraser acknowledged that the risk assessment process was subjective, not “scientific.” He liked to quote the physicist Niels Bohr, “prediction is very difficult, especially about the future.” Fraser used the risk meetings to collect and synthesize expert opinions from all areas of the business.
8 Interview with John Fraser, May 7, 2008.
9 As defined, worst credible outcomes differed both from “inherent magnitudes”, which assumed that all controls failed or were absent, and “residual magnitudes”, which assumed that all key controls were in place and functioning.
10 Aabo et al., 2005, p. 65.
11 Ibid., p. 67.
For the exclusive use of K. Wade, 2020.
This document is authorized for use only by Kizzie Wade in Hydro One - AC554 ENTERPRISE RISK taught by David Adu-Boateng, Purdue University Global from Sep 2020 to Mar 2021.

109-001 Enterprise Risk Management at Hydro One (A)
6
One risk officer described the prevalence of the risk assessment meetings:
Our original ambitious plan was to do twelve risk assessments a year. The senior executive team embraced the approach so enthusiastically that one year we did 60 different risk assessment workshops. My role was to help executives tell their bosses about the risks they faced and how they were mitigating those risks. We helped them make judgments about the
adequacy of the mitigating actions proposed and taken.12
Fraser was also head of internal audit. He maintained a strict distinction between auditing and risk management activities, treating the latter as a “separate product line”: “Risk management staff do not attend internal audit meetings and the information from a risk management meeting is not available to internal audit staff without written authorization from a vice president. I want a complete separation between risk management and internal audit so that people can speak extremely
candidly at the risk management workshops.”13
Phase 2. Reviewing the Corporate Risk Profile
Twice a year, in January and July, Fraser and his team prepared a Corporate Risk Profile report for the executive team. He also presented the report in person to the Audit Committee. The Corporate Risk Profile summarized the principal risks facing the organization. Fraser did a series of interviews with the top 30 to 40 executives and consulted other sources, such as annual business plans and risk workshops. The profile reflected the managerial assessments of previously identified risks and emerging risks that had been identified in workshops, media scans, or other sources since the last
report.14 An extract from the July 2006 Corporate Risk Profile is shown in Figure A. (For a history of the risk profile trends refer to Exhibit 7.)
12 Interview with Rob Quail, May 7, 2008.
13 “Q&A with Hydro One’s Chief Risk Officer.” Compliance Week, January 25, 2005.
14 Aabo et al. (2005), p.69.
For the exclusive use of K. Wade, 2020.
This document is authorized for use only by Kizzie Wade in Hydro One - AC554 ENTERPRISE RISK taught by David Adu-Boateng, Purdue University Global from Sep 2020 to Mar 2021.

Enterprise Risk Management at Hydro One (A) 109-001
7
Figure A Corporate Risk Profile, July 2006
Risk Source
Risk Rating
January 2005
Risk Rating
January 2006
Risk Rating
July 2006
Trend from
July 2006
Adequate Electricity Supply High Very High Very High
Performance, Productivity and People
(“Getting the Work Done”) Medium- High Very High Very High
Government Policy Uncertainty High High Very High
Regulatory Uncertainty Very High Very High High
Employee Accidents Very High High High
Capacity of Transmission Network Medium Medium-
High High
Condition of Transmission Network Medium Medium-
High Medium- High
Condition of Distribution Assets High Medium- High Medium
Customer Expectations High Medium- High Medium
Environment Medium Medium Medium
Information Technology Low Medium Medium
Source: Adapted from company document.
Prior to the interviews Fraser sent each manager a two-page list of headline news from the past six months, and the summary of the previous corporate risk profile. (Exhibit 8 presents the media update used for the December 2006 interview series.) Fraser described the risk review meetings as follows:
I take the one-page strategic objectives, the news update and the summary of the previous risk assessments to all interviews, so the context is clearly set. Then I pull out the empty risk profile template and ask what had changed, what is new. The risk assessments could change because of the mitigation steps taken, or because of external changes in the environment. Some people grab the template and start filling it out on the spot. Others will literally shut their eyes, put their feet up on the desk and tell me what is worrying them.15
The ERM process stressed the importance of the half-yearly monitoring and review of risks, because risks did not remain static. In order to make sure that the objectives-impacts matrix remained relevant, senior managers, who had accountability for the particular objectives, reviewed and approved the scales annually. The CFO reviewed the financial scale, the chief regulatory officer reviewed the regulatory scale, and so on.
15 Interview with John Fraser, 7 May 2008
For the exclusive use of K. Wade, 2020.
This document is authorized for use only by Kizzie Wade in Hydro One - AC554 ENTERPRISE RISK taught by David Adu-Boateng, Purdue University Global from Sep 2020 to Mar 2021.

109-001 Enterprise Risk Management at Hydro One (A)
8
Phase 3. Risk-based Investment Appraisal and Planning
In the final phase of the ERM process senior management set priorities for the maintenance and building programs based on the risks identified. Hydro One managed a portfolio of fixed assets with lifetimes of 30-70 years. It spent about C$ 1bn per annum on new physical capital. The investment planning department and the risk management team jointly developed a risk-based approach for allocating resources. They evaluated each investment proposal in terms of cost and the severity of the risk that the program aimed to mitigate. They calculated a “bang for the buck” index to show the risk reduction per dollar spent, and ranked the investment programs accordingly. Where the cumulative expenditures reached the level of available resources, they determined the planned work for the year.
Engineers made the initial risk assessments, making use of the tools of risk assessment they received from the investment planning department: the program-specific objective-impact matrix and the probability scale. An additional risk map template assigned an overall risk score to each combination of impact and probability assessment. The investment planning department also acted as an independent mezzanine evaluator, relentlessly challenging and querying the risk and cost assessments, as the engineers prepared the investment proposals for presentation to senior management.
Fraser argued that looking at the investment proposals from a risk management viewpoint gave high visibility and scrutiny to capital expenditure planning, and reassured top management that in a resource-constrained environment Hydro One was making the right investment decisions:
You cannot just make up a “mitigated risk score”. Every year we hold a two-day planning meeting with the senior management team. They review and challenge the investment proposals ranked by the “bang for the buck” index. The engineers have to defend each project proposal in front of senior managers and their peers who challenge them on their mitigated risk score and how much money they plan to spend. This allows management to identify activities that could be stopped, deferred or changed, and to release valuable resources for higher priorities. The process ensures that projects addressing the highest risks have the highest priority.
The Meeting
Laura Formusa closed the headline news update and looked up from her desk as John Fraser entered. After the initial pleasantries Fraser handed over the corporate risk profile template and a brief summary of the risk updates he has collected from interviewing other managers. (See interview summaries in Exhibit 9.)
Formusa quickly leafed through the interview summaries. Then she glanced at the corporate risk profile template in front of her and began:
Let me see what I can add from where I sit. Like most industries, we have not been hiring but down-sizing for many, many years. The work load has now exploded, and more than 20% of our employees will be eligible for retirement in two years’ time. “Getting the work done” is more difficult. I am reaching out to the union that was out on strike to begin a new relationship. I want to enter into a five-year deal with them. It would be unprecedented, but I need the union to work with us to address the challenges we are facing. The demographics are against us. In Canada we do not have enough of a workforce waiting for us. Where is it going
For the exclusive use of K. Wade, 2020.
This document is authorized for use only by Kizzie Wade in Hydro One - AC554 ENTERPRISE RISK taught by David Adu-Boateng, Purdue University Global from Sep 2020 to Mar 2021.

Enterprise Risk Management at Hydro One (A) 109-001
9
to come from? It has to come from tapping new resources, both inside and outside the country.
Safety is our number one objective. I make it part of every management team meeting: whenever we talk about safety, we feel it's our highest risk. It is not enough to make sure we have the tools and the equipment. We have to make people think safety every minute of every day. We also have to deal with the spending controls issue. In order to meet the expectations of the Provincial Auditor General, we must put in place more formalized procedures.
The risks related to the “Capacity of Transmission Network” should be “very high” rather than “high,” as the situation is getting more risky. This year’s record demand for power shows a strong need for more capacity. As for the condition of the transmission network, I think risks are increasing due to some premature equipment failures we have experienced, despite plans in place to upgrade key transmission stations. However, the condition of distribution assets is stable, due to our good storm restoration plans and the monies we have spent on refurbishments.
Going forward, I expect growing Government uncertainty due to the impending election in October 2007, and some continued confusion over the roles of the several government electricity agencies.
Residential customers are still a challenge, we need to improve satisfaction. The media is always a concern because of reputation risk—we have been in the media too much for the wrong reasons.
The environment is getting to be a bigger issue for the industry as a whole. Time-of-use rates might be the next step in the energy conservation agenda: the smart meter going hand in hand with smart pricing. The question is: are people going to modify their behavior? Are they going to do their dishes at 11:00 at night when the rate goes down? Are they going to use less power? The danger is they are going to choose not to. And all of a sudden a person who had a $100 per month bill is going to see $200. When those rates go in, people are going to be screaming dissatisfaction to the government.
Finally, now that we also started to implement SAP, I feel that I.T. risks are increasing, and this should be rated Medium/High rather than Medium.
Later that day Formusa read through the interview summaries received from Fraser, and reflected on her notes from her meeting with him. She wondered whether her own risk assessment and the concerns expressed by the senior management team members fully captured the risk profile of Hydro One. She had to decide if she should revise the strategy of the company in the light of these risks.
* * * *
For the exclusive use of K. Wade, 2020.
This document is authorized for use only by Kizzie Wade in Hydro One - AC554 ENTERPRISE RISK taught by David Adu-Boateng, Purdue University Global from Sep 2020 to Mar 2021.
109-001 Enterprise Risk Management at Hydro One (A)
10
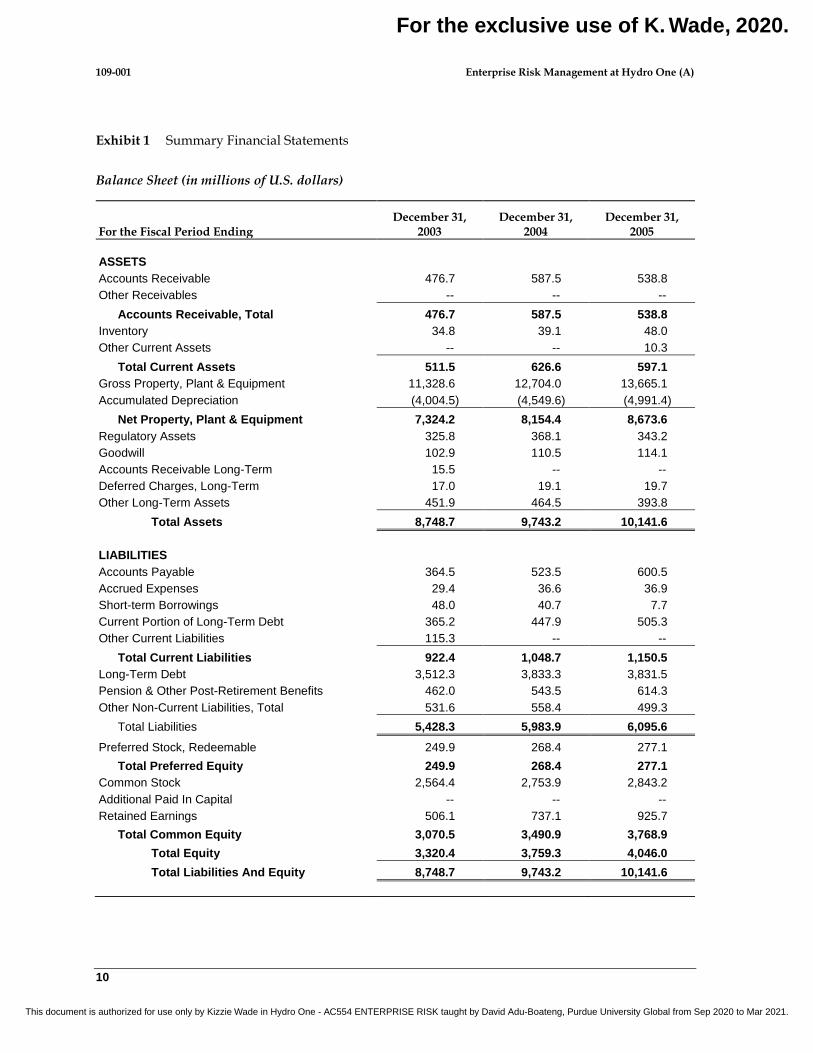
Exhibit 1 Summary Financial Statements
Balance Sheet (in millions of U.S. dollars)
For the Fiscal Period Ending December 31,
2003 December 31,
2004 December 31,
2005
ASSETS
Accounts Receivable 476.7 587.5 538.8
Other Receivables -- -- --
Accounts Receivable, Total 476.7 587.5 538.8
Inventory 34.8 39.1 48.0
Other Current Assets -- -- 10.3
Total Current Assets 511.5 626.6 597.1
Gross Property, Plant & Equipment 11,328.6 12,704.0 13,665.1
Accumulated Depreciation (4,004.5) (4,549.6) (4,991.4)
Net Property, Plant & Equipment 7,324.2 8,154.4 8,673.6
Regulatory Assets 325.8 368.1 343.2
Goodwill 102.9 110.5 114.1
Accounts Receivable Long-Term 15.5 -- --
Deferred Charges, Long-Term 17.0 19.1 19.7
Other Long-Term Assets 451.9 464.5 393.8
Total Assets 8,748.7 9,743.2 10,141.6
LIABILITIES
Accounts Payable 364.5 523.5 600.5
Accrued Expenses 29.4 36.6 36.9
Short-term Borrowings 48.0 40.7 7.7
Current Portion of Long-Term Debt 365.2 447.9 505.3
Other Current Liabilities 115.3 -- --
Total Current Liabilities 922.4 1,048.7 1,150.5
Long-Term Debt 3,512.3 3,833.3 3,831.5
Pension & Other Post-Retirement Benefits 462.0 543.5 614.3
Other Non-Current Liabilities, Total 531.6 558.4 499.3
Total Liabilities 5,428.3 5,983.9 6,095.6
Preferred Stock, Redeemable 249.9 268.4 277.1
Total Preferred Equity 249.9 268.4 277.1
Common Stock 2,564.4 2,753.9 2,843.2
Additional Paid In Capital -- -- --
Retained Earnings 506.1 737.1 925.7
Total Common Equity 3,070.5 3,490.9 3,768.9
Total Equity 3,320.4 3,759.3 4,046.0
Total Liabilities And Equity 8,748.7 9,743.2 10,141.6
For the exclusive use of K. Wade, 2020.
This document is authorized for use only by Kizzie Wade in Hydro One - AC554 ENTERPRISE RISK taught by David Adu-Boateng, Purdue University Global from Sep 2020 to Mar 2021.
Enterprise Risk Management at Hydro One (A) 109-001
11
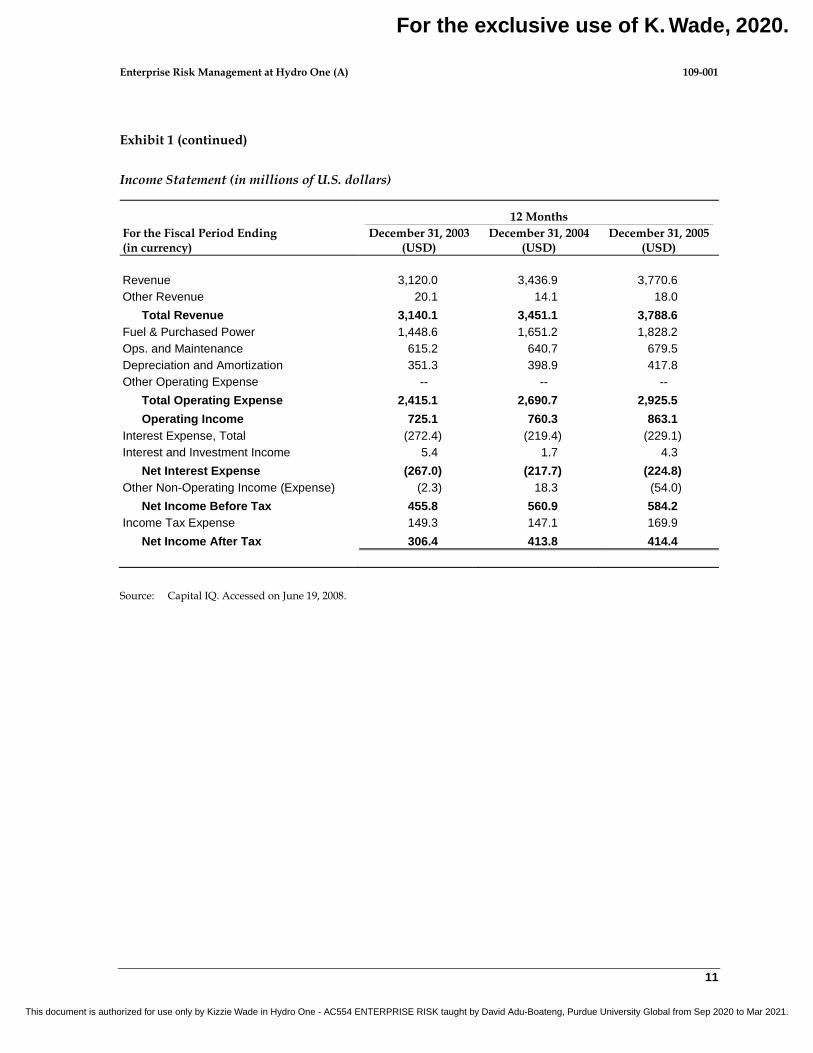
Exhibit 1 (continued)
Income Statement (in millions of U.S. dollars)
12 Months
For the Fiscal Period Ending (in currency)
December 31, 2003 (USD)
December 31, 2004 (USD)
December 31, 2005 (USD)
Revenue 3,120.0 3,436.9 3,770.6
Other Revenue 20.1 14.1 18.0
Total Revenue 3,140.1 3,451.1 3,788.6
Fuel & Purchased Power 1,448.6 1,651.2 1,828.2
Ops. and Maintenance 615.2 640.7 679.5
Depreciation and Amortization 351.3 398.9 417.8
Other Operating Expense -- -- --
Total Operating Expense 2,415.1 2,690.7 2,925.5
Operating Income 725.1 760.3 863.1
Interest Expense, Total (272.4) (219.4) (229.1)
Interest and Investment Income 5.4 1.7 4.3
Net Interest Expense (267.0) (217.7) (224.8)
Other Non-Operating Income (Expense) (2.3) 18.3 (54.0)
Net Income Before Tax 455.8 560.9 584.2
Income Tax Expense 149.3 147.1 169.9
Net Income After Tax 306.4 413.8 414.4
Source: Capital IQ. Accessed on June 19, 2008.
For the exclusive use of K. Wade, 2020.
This document is authorized for use only by Kizzie Wade in Hydro One - AC554 ENTERPRISE RISK taught by David Adu-Boateng, Purdue University Global from Sep 2020 to Mar 2021.

109-001 Enterprise Risk Management at Hydro One (A)
12
Exhibit 2 Ontario Electricity Generation and Usage Trends
Exhibit 2A: Existing Installed Generation Capacity, Ontario, 2006
Capacity
(MW) No. of
Stations % of Total Capacity
Nuclear 11,419 5 36.6
Hydroelectric 7,768 68 24.9
Coal 6,434 4 20.6
Oil/Gas 5,103 22 16.4
Wind 395 4 1.3
Biomass/Landfill Gas 70 4 0.2
TOTAL 31,189 107 100.0
Source: Adapted from Independent Electricity System Operator, “18 Month Outlook: An Assessment of the Reliability of the Ontario Electricity System, January 2007 to June 2008,” December 21, 2006, accessed June 27, 2008, http://www.ieso.ca/imoweb/pubs/marketReports/ 18MonthOutlook_2006dec.pdf.
Exhibit 2B: Comparative Trends in Electricity Consumption (Canada, Ontario, Sweden, United States, California and the European Union)
Source: “Electricity, Conservation and the Conservation Bureau.” Presentation by Peter Love, Chief Energy Conservation Officer, Conservation Bureau, to the Ontario Energy Association on February 10, 2006, accessed June 24, 2008, http://www.powerauthority.on.ca/Storage/20/1608_OEA_PL_Feb_10_06.pdf.
For the exclusive use of K. Wade, 2020.
This document is authorized for use only by Kizzie Wade in Hydro One - AC554 ENTERPRISE RISK taught by David Adu-Boateng, Purdue University Global from Sep 2020 to Mar 2021.
Enterprise Risk Management at Hydro One (A) 109-001
13
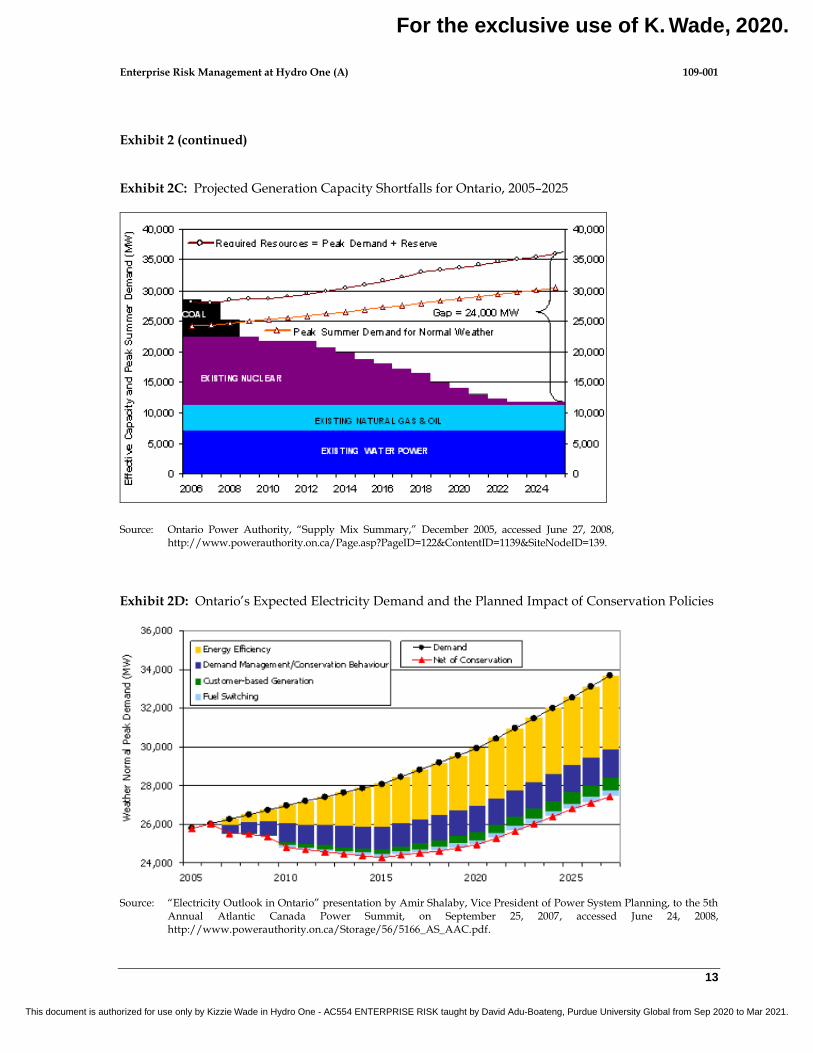
Exhibit 2 (continued)
Exhibit 2C: Projected Generation Capacity Shortfalls for Ontario, 2005–2025
Source: Ontario Power Authority, “Supply Mix Summary,” December 2005, accessed June 27, 2008, http://www.powerauthority.on.ca/Page.asp?PageID=122&ContentID=1139&SiteNodeID=139.
Exhibit 2D: Ontario’s Expected Electricity Demand and the Planned Impact of Conservation Policies
Source: “Electricity Outlook in Ontario” presentation by Amir Shalaby, Vice President of Power System Planning, to the 5th Annual Atlantic Canada Power Summit, on September 25, 2007, accessed June 24, 2008, http://www.powerauthority.on.ca/Storage/56/5166_AS_AAC.pdf.
For the exclusive use of K. Wade, 2020.
This document is authorized for use only by Kizzie Wade in Hydro One - AC554 ENTERPRISE RISK taught by David Adu-Boateng, Purdue University Global from Sep 2020 to Mar 2021.
109
-001
-14
-
Ex
hib
it 3
Ob
ject
ives
-Im
pa
ct M
atr
ix
Ob
jec
tive
A
ttri
bu
te
Even
t 5
Wo
rst
Cas
e
4
Se
vere
3
Majo
r 2
Mo
dera
te
1
Min
or
FIN
AN
CIA
L
Net
Inco
me
N
et
Inco
me
Sh
ort
fall
(aft
er
tax,
in o
ne
ye
ar)
>
$1
50
M
$7
5M
–$
15
0M
$
25
M–
$7
5M
$
5M
–$
25
M
<$
5M
Cre
dit W
ort
hin
ess
Cha
ng
e in
fin
an
cia
l ra
tios o
r ri
sk
Eve
nt
of
de
fau
lt;
Una
ble
to
ra
ise
an
y c
apital
du
e t
o c
redit r
atin
g.
Cre
dit r
ating
do
wn
gra
de t
o
be
low
in
ve
stm
en
t g
rad
e;
Una
ble
to
rais
e f
ull
am
ou
nt
req
uir
ed
ca
pital.
Cre
dit r
ating
do
wn
gra
de
.
Hydro
On
e In
c.
pu
t o
n c
redit
"wa
tch
".
Cre
dit r
ating
ag
en
cie
s a
nd
b
on
dh
old
ers
exp
ress c
on
cern
.
Va
lue
of
the
En
terp
rise
L
oss in
Va
lue
of
Hydro
One
L
oss o
f >
25
% V
alu
e
Lo
ss o
f 1
0–2
5%
Va
lue
Lo
ss o
f 5
-10
% V
alu
e
Lo
ss o
f 1
-5%
Va
lue
L
oss o
f <
1%
Va
lue
RE
PU
TA
TIO
N
Pu
blic
Pro
file
N
eg
ative
me
dia
att
entio
n;
O
pin
ion
le
ad
er
an
d p
ublic
C
riticis
m
Natio
nal m
ed
ia a
tte
ntion
;
Op
inio
n le
ad
ers
/cu
sto
me
rs
ne
arl
y u
nanim
ou
s in
pu
blic
cri
ticis
m.
Pro
vin
cia
l m
ed
ia a
tte
ntion
;
Mo
st
op
inio
n le
ad
ers
/ cu
sto
me
rs p
ub
licly
cri
tical.
Sig
nific
an
t lo
cal a
tte
ntio
n;
Se
ve
ral o
pin
ion
lea
de
rs/
cu
sto
me
rs p
ub
licly
cri
tical.
Le
tte
r(s)
to M
inis
ter
o
f E
ne
rgy.
Le
tte
r(s)
to S
enio
r M
an
ag
em
en
t.
Sh
are
hold
er
co
nfid
en
ce
O
wn
er/
sh
are
hold
er
involv
em
en
t in
Hyd
ro O
ne
o
pe
ratio
ns
Co
mp
lete
lo
ss o
f co
nfid
en
ce
;
CE
O a
nd
Bo
ard
re
pla
ce
d b
y
the
ow
ne
r.
Exte
nsiv
e lo
ss o
f co
nfide
nce
;
CE
O o
r se
ve
ral S
r. M
an
ag
ers
re
pla
ce
d.
Cre
dit R
atin
g a
ge
ncie
s a
nd
b
on
dh
old
ers
exp
ress c
on
cern
.
Con
fide
nce
in
qu
estio
n; o
wn
er
req
ue
sts
sig
nific
an
t ch
an
ge
s
to b
usin
ess p
lan
.
So
me
co
nce
rn w
ith
m
an
ag
em
en
t d
ecis
ion
s;
occa
sio
nal re
qu
ests
fro
m
ow
ne
r fo
r d
eta
ils.
Em
plo
ye
e c
on
fide
nce
E
mp
loye
e D
issa
tisfa
ctio
n
Wid
espre
ad
de
pa
rtu
res o
f ke
y
sta
ff w
ith
sca
rce
skill
s o
r kn
ow
led
ge
.
Sh
arp
, su
sta
ine
d d
rop
in
e
mp
loye
e s
urv
ey r
esults;
de
pa
rture
s o
f ke
y s
taff
with
sca
rce
skill
s o
r kno
wle
dg
e.
Sh
arp
de
clin
e in e
mp
loye
e
su
rve
y r
esu
lts;
sh
arp
in
cre
ase
in
gri
eva
nce
s.
Mo
de
st
de
clin
e in
em
plo
ye
e
su
rve
y r
esu
lts;
mo
de
st
incre
ase
in
gri
eva
nce
s.
Le
ss t
ha
n p
lan
ne
d
imp
rove
me
nts
in
em
plo
ye
e
su
rve
y r
esu
lts.
RE
GU
LA
TO
RY
R
EL
AT
ION
SH
IP
Me
et
Lic
en
se
Co
nditio
ns
Lo
ss o
f C
red
ibili
ty w
ith
R
eg
ula
tors
G
en
era
l lo
ss o
f C
redib
ility
; In
tru
siv
e I
nvolv
em
en
t.
So
me
lo
ss o
f C
redib
ility
; E
xce
ssiv
e I
nvo
lve
me
nt.
S
om
e C
on
ce
rns r
e:
Co
mp
ete
nce
; D
ifficult
De
ma
nd
s.
Incre
ase
in R
ep
ort
ing
De
tail
an
d F
req
ue
ncy.
Ba
lan
ce
d;
so
me
ch
alle
ng
es.
CU
ST
OM
ER
/ R
EL
IAB
ILIT
Y
Relia
ble
De
livery
of
Ele
ctr
icity
Ou
tag
es o
n t
he
Hydro
On
e
syste
m
Ou
tag
e a
ffe
cts
:
>1
00
,00
0 C
usto
me
rs
Dis
trib
utio
n o
r
>1
00
0M
W T
ran
sm
issio
n f
or
mo
re t
ha
n s
eve
n d
ays.
Ou
tag
e a
ffe
cts
:
40
k-1
00
k C
usto
me
rs
Dis
trib
utio
n o
r
40
0–
10
00
MW
Tra
nsm
issio
n
for
4–
7 d
ays.
Ou
tag
e a
ffe
cts
:
10
k–
40
k C
usto
me
rs
Dis
trib
utio
n o
r
10
0–
40
0M
W T
ran
sm
issio
n fo
r 2
–4
da
ys.
Ou
tag
e a
ffe
cts
:
1k–
10
k C
usto
me
rs D
istr
ibu
tio
n
or
1
0–
10
0M
W T
ran
sm
issio
n f
or
4–
24
hrs
.
Ou
tag
e a
ffe
cts
:
<1
00
0 C
usto
me
rs D
istr
ibu
tio
n
or
<1
0M
W T
ran
sm
issio
n fo
r <
4
Hrs
.
OE
B S
erv
ice
Qu
alit
y In
dic
es
Failu
re to
Me
et
Se
rvic
e Q
ualit
y
Ind
ice
s
Ach
ieve
25
% o
f O
ve
rall
Exp
ecte
d P
erf
orm
an
ce
. A
ch
ieve
67
% o
f O
ve
rall
Exp
ecte
d P
erf
orm
an
ce
. A
ch
ieve
80
% o
f O
ve
rall
Exp
ecte
d P
erf
orm
an
ce
. A
ch
ieve
90
% o
f O
ve
rall
Exp
ecte
d P
erf
orm
an
ce
.
Ach
ieve
95
% o
f O
ve
rall
Exp
ecte
d P
erf
orm
an
ce
.
Dir
ect C
usto
me
rs,
Lo
ca
l D
istr
ibu
tio
n C
om
pa
nie
s,
Ge
ne
rato
rs
Incre
ase
in c
usto
me
r d
issa
tisfa
ctio
n w
ith
Hydro
On
e
Nu
me
rou
s D
ire
ct
Custo
me
rs
initia
te a
ctio
n s
uch
as b
ypa
ss
or
relo
catio
n;
Num
ero
us L
DC
's
de
fault o
n b
ill p
aym
en
ts;
Ge
ne
rato
r re
lucta
nce
to
lo
ca
te
in O
nta
rio
lea
ds t
o s
ho
rtag
es.
Exp
on
en
tial in
cre
ase
in
cu
sto
me
r la
wsu
its f
or
dir
ect
an
d/o
r co
llate
ral d
am
ag
e
be
lieve
d t
o b
e c
au
sed
by
Hydro
On
e;
Co
mp
lain
ts to
p
rovin
cia
l g
ove
rnm
en
t in
cre
ase
dra
ma
tically.
Custo
me
r a
sso
cia
tio
ns s
tep
up
lo
bb
yin
g e
ffort
s f
or
str
icte
r p
en
altie
s a
ga
inst
Hyd
ro O
ne
.
On
e "
larg
e"
cu
sto
me
r e
xp
eri
en
ce
s s
ignific
an
t p
rod
uctio
n lo
sse
s d
ue
to
H
ydro
On
e a
ctio
ns/in
action
; h
igh le
vel (C
EO
, C
OO
, e
tc.)
ca
lls t
o H
yd
ro O
ne
CE
O's
o
ffic
e.
Incre
ase
in n
um
be
r o
f cu
sto
me
r co
mp
lain
ts.
Resid
en
tial a
nd
Sm
all
Bu
sin
ess C
usto
me
rs
Incre
ase
in c
usto
me
r d
issa
tisfa
ctio
n w
ith
Hydro
On
e
se
rvic
e q
ualit
y
Sig
nific
an
t n
um
be
rs o
f cu
sto
me
rs b
eg
in to
de
fau
lt o
n
bill
pa
ym
en
ts.
Exp
on
en
tial (>
50
%)
incre
ase
in c
all
cen
tre
volu
me
s a
nd
co
mp
lain
ts r
eceiv
ed
by fie
ld
sta
ff.
Call
ce
ntr
e v
olu
me
s in
cre
ase
n
otice
ably
(25
%);
no
ticea
ble
in
cre
ase
in
co
mp
lain
ts
receiv
ed
by fie
ld s
taff
.
Sh
arp
de
teri
ora
tion
in
cu
sto
me
r sa
tisfa
ctio
n a
s p
er
su
rve
y r
esp
on
se
s.
Mo
de
rate
de
teri
ora
tio
n in
cu
sto
me
r sa
tisfa
ctio
n a
s p
er
su
rve
y r
esp
on
se
s.
CO
MP
ET
ITIV
EN
ES
S
Unit C
ost
Re
du
ctio
n
Failu
re to
Re
du
ce
Un
it C
osts
(i
ncl. o
ve
rhe
ad
& n
on
-bill
able
tim
e)
Unit C
osts
incre
ase b
y >
25
%
Unit C
osts
incre
ase
by 1
5%
–2
5%
U
nit C
osts
in
cre
ase b
y 1
0%
-
15
%
Unit C
osts
incre
ase b
y 5
%
10
%
Unit c
osts
no
t re
du
ce
d
Work
Pro
gra
m
Acco
mp
lish
me
nt
W
ork
Pro
gra
m S
ho
rtfa
ll
>1
0 C
ritica
l P
roje
cts
la
te o
r;
<5
0%
of
no
ncri
tical w
ork
co
mp
lete
d.
5-1
0 C
ritical P
roje
cts
la
te o
r 5
0%
–7
0%
of
no
ncri
tical w
ork
co
mp
lete
d.
3–
5 C
ritical P
roje
cts
late
or
70
%–
85
% o
f n
on
cri
tical w
ork
co
mp
lete
d.
1-3
Cri
tical P
roje
cts
la
te o
r >
85
% o
f n
on
cri
tical w
ork
co
mp
lete
d.
No C
ritica
l P
roje
cts
la
te
>8
5%
of
no
n c
ritical w
ork
co
mp
lete
d.
SA
FE
TY
AN
D
EN
VIR
ON
ME
NT
Em
plo
ye
e: W
ork
forc
e
Ava
ilabili
ty/
Sa
fety
C
ha
ng
e in
ava
ilabili
ty (
%)
in
on
e y
ea
r; A
ccid
en
t S
eve
rity
R
ate
.
Ke
y f
un
ctio
ns/lo
ca
tion
s
un
availa
ble
> 1
we
ek;
Em
plo
ye
e f
ata
lity o
r m
ajo
r p
erm
an
en
t d
isab
ility
.
Ke
y f
un
ctio
ns/lo
ca
tion
s
un
availa
ble
> 1
da
y;
Em
plo
ye
e c
ritical in
jury
.
Accid
en
t S
everi
ty R
ate
> 5
0%
a
bo
ve
targ
et.
A
ccid
en
t S
everi
ty R
ate
> 2
5%
a
bo
ve
targ
et.
A
ccid
en
t S
everi
ty R
ate
ab
ove
ta
rge
t.
En
vir
on
me
nta
l P
erf
orm
an
ce
A
dve
rse
En
vir
on
me
nta
l Im
pa
ct
W
ide
spre
ad
off
site
im
pa
cts
e
.g.,
reg
ion
al or
mu
nic
ipa
l w
ate
r su
pp
ly.
Mu
ltip
le lo
cal o
ffsite
im
pa
cts
e
.g.,
mu
ltip
le r
esid
en
tial
pro
pe
rtie
s o
r p
riva
te w
ate
r su
pp
lies.
Sig
nific
an
t lo
cal o
ffsite
im
pa
ct
e.g
., a
public t
ho
rou
gh
fare
; S
ignific
an
t sp
ill/r
ele
ase
with
im
pa
ct
on
Hyd
ro O
ne
In
c.
pro
pe
rty o
nly
Min
or
local o
ffsite
im
pa
ct
e
.g.,
a s
ingle
re
sid
en
tial
pro
pe
rty o
r p
riva
te w
ate
r su
pp
ly).
Min
or
imp
act
on
Hyd
ro O
ne
In
c.
pro
pe
rty o
nly
.
Pu
blic
Sa
fety
P
ub
lic I
nju
rie
s w
ith
Hyd
ro O
ne
a
t fa
ult.
Fa
talit
y o
r m
ajo
r p
erm
an
en
t d
isa
bili
ty.
Sig
nific
an
t in
cre
ase in
nu
mb
er
of
inju
rie
s.
Mo
de
rate
in
cre
ase
in
nu
mb
er
of
inju
rie
s.
Sm
all in
cre
ase
in
nu
mb
er
of
inju
ries.
No c
ha
ng
e.
So
urc
e:
Co
mp
an
y d
ocu
men
t.
Min
or
= n
oticeable
dis
ruption t
o r
esults;
mana
geable
. M
od
era
te =
mate
rial
dete
riora
tion i
n r
esults;
a c
oncern
; m
ay n
ot
be a
ccepta
ble
; m
anagem
ent
respo
nse
wo
uld
be c
onsid
ere
d.
M
ajo
r =
sig
nific
ant
dete
riora
tion i
n r
esults;
not
accepta
ble
; m
ana
gem
ent re
spo
nse. S
evere
= f
undam
enta
l th
reat to
opera
ting r
esults; im
media
te s
enio
r m
anage
me
nt atte
ntio
n. C
ata
str
op
hic
= r
esults t
hre
ate
n s
urv
ival of com
pany in c
urr
ent fo
rm;
pote
ntially
full tim
e s
enio
r m
anagem
ent re
spo
nse u
ntil re
solv
ed.
For the exclusive use of K. Wade, 2020.
This document is authorized for use only by Kizzie Wade in Hydro One - AC554 ENTERPRISE RISK taught by David Adu-Boateng, Purdue University Global from Sep 2020 to Mar 2021.
Enterprise Risk Management at Hydro One (A) 109-001
15
Exhibit 4 Probability Scales
Score Rating Description
5 Virtually Certain 95% probability that the event will occur in the next 36 months
(i.e., to this project)
4 Very Likely 75% probability that the event will occur in the next 36 months
(i.e., to this project)
3 Even Odds 50% probability that the event will occur in the next 36 months
(i.e., to this project)
2 Unlikely 25% probability that the event will occur in the next 36 months
(i.e., to this project)
1 Remote 5% probability that the event will occur in the next 36 months
(i.e., to this project)
Source: Company document.
For the exclusive use of K. Wade, 2020.
This document is authorized for use only by Kizzie Wade in Hydro One - AC554 ENTERPRISE RISK taught by David Adu-Boateng, Purdue University Global from Sep 2020 to Mar 2021.

109-001 Enterprise Risk Management at Hydro One (A)
16
Exhibit 5 Control Strength Assessment
5 Full Controls; Highly Prescriptive; CEO Oversight
Full controls established (see “Full Controls” below), PLUS: Objectives, policies, plans and measures all formally established with the direct personal
involvement of CEO, and clearly documented Authorities, responsibilities and accountabilities very tightly defined. Formal coordination of decisions of different parts of the organization through senior management
“steering committees” or other mechanisms. Highly prescriptive/detailed procedures exist Continuous monitoring of performance; results are reported frequently to CEO and required
improvements are personally followed-up by senior management Overall controls are subject to formal, independent review
4 Full Controls;
Prescriptive; Senior Mgmt Oversight
Full controls established (see “Full Controls” below), PLUS: Objectives, policies, plans and measures all formally approved by senior management and clearly
documented Authorities, responsibilities and accountabilities tightly defined Formal coordination of decisions of different parts of the organization through “steering committees”
or other mechanisms. Prescriptive procedures exist Close, frequent monitoring of performance; results are reported regularly to senior management and
required improvements are closely followed-up Overall controls are subject to formal review
3 Full Controls The following controls exist:
Business objectives communicated to all levels Policies established & communicated so that people understand expectations Plans have been established and communicated Measurable performance targets set Authorities, responsibilities and accountabilities established People have the necessary knowledge and skills People have the necessary resources and tools, including appropriate computer systems Adequate, timely communication/coordination to allow people to perform their responsibilities Control activities such as procedures in place and appropriately scaled to risk Performance is monitored against targets; Assumptions are challenged periodically Follow-up to ensure effective change Overall control is periodically assessed Residual risks accepted on a cost-benefit basis
2 Partial
Controls Significant gaps in: Business objectives; Risk assessment; Policies Performance targets and measures; plans Authorities, responsibilities and accountabilities Knowledge and skills; Resources and tools, including appropriate computer and information
systems Communication to allow people to perform their responsibilities Coordination of decisions of different parts of the organization Control activities such as procedures Performance monitoring against targets; Follow-up to ensure effective change Overall control assessment Business objectives largely undefined. Policies, practices and procedures not established or not used No performance targets; no monitoring of performance Business values not articulated; distrust at many levels Accountabilities and responsibilities not clearly established Many staff untrained; without necessary knowledge or tools Constant reliance on knowledge of one person; no depth in control system No realistic plans for improvement Controls reactive; no “preventative” or “anticipatory” mechanisms
1 Few Controls Business objectives largely undefined.
Policies, practices and procedures not established or not used No performance targets; no monitoring of performance Business values not articulated; distrust at many levels Accountabilities and responsibilities not clearly established Many staff untrained; without necessary knowledge or tools Constant reliance on knowledge of one person; no depth in control system No realistic plans for improvement Controls reactive; no “preventative” or “anticipatory” mechanisms
Source: Company document.
For the exclusive use of K. Wade, 2020.
This document is authorized for use only by Kizzie Wade in Hydro One - AC554 ENTERPRISE RISK taught by David Adu-Boateng, Purdue University Global from Sep 2020 to Mar 2021.
109
-001
-17
-
Ex
hib
it 6
Imp
act
-Pro
bab
ilit
y R
isk
Ma
p
5 4 3 2 1
M a g n i t u d e
Pro
ba
bili
ty
1
2
3
4
5
July
2006 R
isk M
ap
AB D
Ele
ctr
icity S
up
ply
Gett
ing
the W
ork
Do
ne
Go
vern
ment
Po
licy U
ncert
ain
ty
Reg
ula
tory
Uncert
ain
ty
Em
plo
yee A
ccid
ents
Cap
acity o
f Tx N
etw
ork
Co
nd
itio
n T
x N
etw
ork
Info
rmatio
n T
echno
log
y
Co
nd
itio
n D
x A
ssets
Custo
mer E
xp
ecta
tio
ns
Enviro
nm
ent
A B C D E F G H I J
C
K
EF
G
H
I
J
K
No
te: S
ize o
f ‘b
ub
ble
’ is p
rop
ort
iona
l
to s
treng
th o
f co
ntr
ols
Me
diu
m
Hig
h
Me
diu
m/H
igh
Ve
ry H
igh
So
urc
e:
Co
mp
an
y d
ocu
men
t.
For the exclusive use of K. Wade, 2020.
This document is authorized for use only by Kizzie Wade in Hydro One - AC554 ENTERPRISE RISK taught by David Adu-Boateng, Purdue University Global from Sep 2020 to Mar 2021.

109
-001
-18
-
Ex
hib
it 7
Co
rpo
rate
Ris
k P
rofi
le T
ren
ds
1
999
Q
4
20
00
Q2
2
000
Q
4
20
01
Q4
2
002
Q
4
20
03
Q2
2
003
Q
4
20
04
Q2
2
005
Q
4
20
06
Q2
RE
GU
LA
TO
RY
/MA
RK
ET
Regula
tory
Uncert
ain
ty
5
5
5
5
4
4
4
5
5
4
Econom
y/F
inancia
l M
ark
ets
3
3
Ele
ctr
icity S
upply
/Mark
etp
lace
3
3
4
3
4
4
5
5
Custo
mer
Expecta
tions/R
ela
tion
ship
s
4
4
4
4
4
4
4
4
Com
modity P
rice V
ola
tilit
y
3
ST
RA
TE
GIC
Gro
wth
5
5
3
Govern
ment
Polic
y U
ncert
ain
ty
5
5
5
5
4
5
4
5
Investo
r E
xpecta
tions
4
3
Fir
st N
ations
3
3
Outs
ourc
ing
Netw
ork
Serv
ices L
aunch
4
OP
ER
AT
ION
AL
Org
aniz
atio
nal R
ea
din
ess
(Com
pete
nce a
nd C
apabili
ty)
4
4
Cata
str
ophic
Events
4
4
Asset
Conditio
n
4
4
4
4
4
Asset
Conditio
n—
Tra
nsm
issio
n
3
3
4
4
Asset
Capacity—
Tra
nsm
issio
n
3
3
Asset
Conditio
n—
Dis
trib
ution
4
4
4
4
3
Envir
onm
enta
l C
onta
min
ation
4
4
4
3
3
3
3
3
3
Safe
ty
3
3
3
3
5
5
5
5
4
4
HR
3
3
4
4
Cost
Reduction
5
5
3
3
Info
Manag
em
ent
3
3
3
"Gett
ing t
he w
ork
done"
3
3
5
5
So
urc
e:
Co
mp
an
y d
ocu
men
t.
For the exclusive use of K. Wade, 2020.
This document is authorized for use only by Kizzie Wade in Hydro One - AC554 ENTERPRISE RISK taught by David Adu-Boateng, Purdue University Global from Sep 2020 to Mar 2021.

Enterprise Risk Management at Hydro One (A) 109-001
19
Exhibit 8 Changes/Events Since Last Risk Profile (July to December 2006)
Provincial Government
Minister proposes lifting moratorium on purchase and sale of distribution assets by Hydro One.
Ontario government could pay millions of dollars in penalties if, come 2009, it does not have enough transmission from recently opened nuclear power station owned by U.K. firm Bruce Power.
Deputy Minister of Energy, James Gillis, joins Desjardins Securities.
Premier Dalton McGuinty warns executives at Hydro One that lavish perks and abusing expense accounts will no longer be tolerated.
Public musings by government about viability of coal plant reduction.
Electricity Supply
Former Pikangihum chief said increasing energy demands has made it impossible for this first nation community to turn on Christmas lights.
Hydro One announced a new incentive program for medium-sized interval metered customers for actions they take to reduce peak energy usage.
Ontario Power Authority calls for upgrades to Bruce - Milton/ Toronto line.
Ontario Power Authority has approved 7 projects that will contribute 414 MW.
Hydro One reconnects circuit to US in Sarnia area (damaged April 2003).
Hydro One project in Caledonia is in limbo preventing improved power transmission. A first nation community occupied the construction site, and claim that their right to access was violated.
Heat drives Ontario power use to record at 27,005 MW.
Regulatory
Ontario Energy Board lowers cost of electricity for consumers (c5.8 to c5.5 & c6.7 to c6.4).
Ontario Power Generation, the province-owned electricity giant, today started the federal approvals process for a license for new nuclear units at its Darlington Nuclear site.
Hydro One’s Transmission Rate Application filed with Ontario Energy Board in September 2006.
Hydro One cited for excellence in the audit report delivered by the North American Electric Reliability Council, assessing Hydro One’s physical security procedures as ‘industry-leading’.
Vendors
Midpoint in Inergi outsourcing agreement with Hydro One will be March 2007.
Vertex parent, United Utilities, decides to put the outsourcer up for sale.
Capital Markets
Dominion Bond Rating Service upgrades Hydro One to “A (high)” from “A”.
Governance Ontario government threatens salary caps for senior executives of crown corporations.
Safety
Break-in and theft from Hydro One compounds of copper wire.
Electrical Safety Authority changes fines for non-compliance to $1 million.
For the exclusive use of K. Wade, 2020.
This document is authorized for use only by Kizzie Wade in Hydro One - AC554 ENTERPRISE RISK taught by David Adu-Boateng, Purdue University Global from Sep 2020 to Mar 2021.

109-001 Enterprise Risk Management at Hydro One (A)
20
Environment
Canada listed as one of the biggest energy hogs in the world.
Ontario to be continent’s solar hot-bed.
Vandalism caused oil spill in Welland—spill not “catastrophic”.
Fire at Pinard of 750 KVA transformer.
Federal legislation gazette requires virtually all PCBsa to be eliminated by 2025.
Human Resources
Skilled worker shortages continue to make news; 66% of Canadian employers report difficulty filling positions.
Mandatory retirement ends Dec. 12, 2006.
Media
Auditor General issues report.
Energy minister Duncan is unhappy: says that the culture in Hydro One is unacceptable.
Hydro One board accepts Tom Parkinson’s resignation effective Dec. 8, 2006.
Article sympathetic to Eleanor Clitheroe circumstances in the October 2006 issue of Canadian Business magazine.
Among numerous storms, Hydro One works to restore power to 150,000 customers in communities most affected.
Media coverage on Smart Meters mainly positive, some skeptical.
Front page coverage on increased costs of multiple regulatory electricity agencies.
Outside of Ontario
The Alberta Electric System Operator announced that the province’s grid could not safely accommodate more than 900 megawatts of wind-power generation, a target that will be met late next year.
Brookfield Power Corp. (the North American energy giant) is now harnessing the wind, with its massive Prince Wind Energy Project set in motion with 66 football-field-sized wind towers with capacity to deliver 99 MW of energy to the grid.
Rotating blackouts hit Alberta: High summer temperatures cause record power consumption levels.
Consolidated Edison in week-old struggle to restore power in borough of Queens NYC – underground cables had burned out in those areas.
British Columbia windstorms, Denver snowstorms among events that point to increasing climate change and increasing likelihood of more unplanned outages.
Source: Company document.
aPCBs are persistent organic compounds, containing chlorine, used in electric transformers and capacitors because of their insulating capacity and fire resistance.
For the exclusive use of K. Wade, 2020.
This document is authorized for use only by Kizzie Wade in Hydro One - AC554 ENTERPRISE RISK taught by David Adu-Boateng, Purdue University Global from Sep 2020 to Mar 2021.

Enterprise Risk Management at Hydro One (A) 109-001
21
Exhibit 9 Risk Assessment Interview Summaries (December 2006)
Interview with Beth Summers, Chief Financial Officer
‘Beth’s key concern is our huge infrastructure building program and how we shall finance it. We are committing over C$ 600 million to build a new 182-km 500-kilovolt line beside the two existing ones to bring electricity down from the Bruce nuclear plant on Lake Huron to Milton and the Greater Toronto Area. In the Bruce area, apart from the nuclear station, there’s a lot of wind electricity generation that’s being developed today. The two lines we have are insufficient. To finance the project, we have to raise debt. We need good financial results to keep bondholders happy.
“Government policy uncertainty”—We are impacted and therefore have to worry about the policy decisions around renewable energy. The government has decided to shut down coal-fired power stations, but renewable energy has its own challenges too. Wind power is a special challenge on transmission because of uncertainty about when wind will be blowing; also, there is no effective existing method for storing wind-generated, or any type of electricity.
“Transmission and distribution capacity”—With the roll-out of smart meters we need a new electricity commodity pricing structure, to reinforce conservation and demand management. The real-time monitors will modify customer behavior, as was the case in our pilot project. If households start buying solar panels to generate electricity, they may want to sell power back into the system. Our distribution system was designed to deliver electricity, not to accept electricity potentially at every household; we are not sure how to deal with this.’
Interview with Peter Gregg, Vice-President, Corporate & Regulatory Affairs
‘Peter sees a growing disconnect between our desire and obligation to act as a commercial corporation, and the social policy initiatives that our shareholder, the government has. The Minister of Finance wants dividends, but the Minister of Energy desires requirements that don’t mesh with net income maximization.
A new and growing issue is aboriginal consultation. The Bruce-Milton/Toronto project requires us to acquire land and consult with aboriginal groups. First nations people have unique rights that are protected by the Canadian constitution and the law has established that where proponents may infringe on aboriginal rights, the Crown (government) has a duty to consult. But the government does not have a policy on how to enable this. In many ways we will be the test case. There is a huge amount of political risk and commercial risk, if we end up in a protracted disagreement with first nations.’
Interview with Susan Frank, Chief Regulatory Officer
‘It is the first time in 20 years that we had asked the Ontario Energy Board for a huge project leave to construct, in relation to the Bruce-Milton line project. It is not something we do every year, so there is a very high risk involved in the approval process. Our only similar experience in living memory is with large transmission stations. Those typically took 10 years to build, considering the time needed to get the environmental approval, the leave to construct approval, and then to order our materials and build.
For the exclusive use of K. Wade, 2020.
This document is authorized for use only by Kizzie Wade in Hydro One - AC554 ENTERPRISE RISK taught by David Adu-Boateng, Purdue University Global from Sep 2020 to Mar 2021.

109-001 Enterprise Risk Management at Hydro One (A)
22
There will also be a lot of landowner issues with extensive negotiations to reach appropriate compensation. Since history would have seen first nations communities living in these parts, they still have rights to hunt and fish and access land, so we shall have to provide economic consideration to them if we want to build. The prime example of how the risk can go bad is the Niagara line that got built all except for about six towers in Caledonia. We thought we talked to and had agreements with all the right people. And then in the Caledonia area, a community of first nations people became concerned about a housing development that happened to be right beside our line. They put up a physical blockade, blocked the roads preventing access to our site and the completion of our transmission line. The housing developer walked away. This is now a problem far beyond the company. It is a provincial government issue and a federal government issue. Meanwhile, a C$200 million investment is sitting there not used because we cannot finish that last little piece.
As for employee safety, we have good controls in place, so the risk is decreasing, given all the mitigation we’ve taken.’
Source: Company information collected by casewriter.
For the exclusive use of K. Wade, 2020.
This document is authorized for use only by Kizzie Wade in Hydro One - AC554 ENTERPRISE RISK taught by David Adu-Boateng, Purdue University Global from Sep 2020 to Mar 2021.