Embed Size (px)
Citation preview

Enterprise Risk Management and Accounting Quality
Abstract
In this study we examine the role of enterprise risk management (ERM) in financial
reporting quality. ERM expands internal control to form a solid conceptualization focusing more
on risk. Using information regarding ERM from financial report and related disclosure, we find
positive associations between ERM adoption and accounting quality. Firms employing ERM
framework tend to have lower magnitude of discretionary accruals, lower probability to avoid
loss, and lower probability to beat or meet analysts’ earnings forecast. These associations are
more significant in insurance companies than those in other financial industries. In addition, we
find effects of ERM on analyst behavior. ERM adoption is associated with more accurate, less
optimistic and lower dispersion of analysts’ earnings forecast.

1
Enterprise Risk Management and Accounting Quality
1. Introduction
The concept and framework of enterprise risk management (ERM) developed during
the period marked by a series of high-profile business scandals and failures from Enron to
WorldCom. As a result, the US Government passed the Sarbanes-Oxley Act of 2002, also
known as the “Public Company Accounting Reform and Investor Protection Act” and
“Corporate and Auditing Accountability and Responsibility Act”, that calls for enhanced
improved accuracy of corporate disclosures. Overshadowed by the requirement of stronger
risk management, reliable financial statements, and enhanced corporate governance from
regulatory body and investors, the need for an enterprise-wide, top-down framework that can
provide firms a clear direction and guidance with key principles and concepts communicated
in a common language became even more compelling.
By definition, ERM is a process that is “effected by an entity’s board of directors,
management and other personnel, applied in strategy setting and across the enterprise,
designed to identify potential events that may affect the entity, and manage risk to be within
its risk appetite, to provide reasonable assurance regarding the achievement of entity
objectives” (COSO 2004). Unlike the traditional “silo” based approach risk management that
does not address the interrelationship of risk, ERM takes risk management up to an
enterprise-level, to assess, quantify, finance, and manage risk with a holistic, integrated
approach. Although ERM is not required for most firms, it facilitates compliance with the
reporting and disclosure requirement of various regulatory frameworks. For example,
Sarbanes-Oxley (2002) requires a certification of internal controls; NYSE listing requirement
(2004) expects audit committees to provide input on risk-related activities; SEC (2009)
stipulates that companies discuss in the proxy statements the board’s role in the oversight of
risk; Dodd–Frank Wall Street Reform and Consumer Protection Act (2010) requires large
publicly traded financial firms to have a separate board risk committee composed of
independent directors; and Basel (2003) expands risk management requirements to include
oversight of operational risks in addition to credit and market risks as part of financial
institutions capital adequacy determinations. Adams et al. (2011) suggested ERM will play a
more significant role regarding reporting and disclosure requirement in the future. Frequently
used ERM frameworks include COSO (2004) Enterprise Risk Management-Integrated

2
Framework, RIMS (2006) Risk Maturity Model, ISO 31000:2009 Risk Management –
Principles and guidelines, and CAS (2003) Enterprise Risk Management framework.
Although there is no universal framework, existing ERM model all emphasize (1)
comprehensive risk management; (2) stronger internal control; and (3) higher transparency
and accountability that lead to better informed strategic decision-making and higher firm
value. A strong system of internal control supports the achievement of the organization’s
business objectives and therefore good internal control is a way of managing risk. However,
ERM is much broader than internal control. It serves as a link between value, risk, strategy,
objective setting, performance measurement, risk response and control processes. Compared
to the COSO – The Internal Control – Integrated Framework, ERM is a broader and more
robust conceptualization framework that incorporates the internal control framework within it.
In addition to supporting management’s efforts to achieve business objectives, ERM operates
at a strategic level that is higher than internal control. At the strategic level, it aligns firm’s
operation and risk management with strategy setting fully aware that risk appetite and risk
tolerance are unique for each entity. Specifically, the reporting in the internal control
framework emphasizes the reliability of published financial statement whereas ERM calls for
better communication channel and is significantly expanded to cover all reports developed by
an entity, disseminated both internally and externally. Beyond financial information, ERM
also covers non-financial information. In addition, ERM calls for greater board independence.
For the purpose of internal control, normally there needs to be at least two independent
directors. For ERM, at least a majority of independent outside directors is required.
Previous research approaches ERM in three different ways. One spectrum discusses
the contribution of ERM on firm performance. Some of them found no evidence that ERM
increase firm value (Pagach and Warr 2010, Beasley et al. 2008, McShane et al. 2011)
whereas others found ERM contributes to better firm performance (Hoyt and Liebenberg
2011, Baxter et al. 2013, Farrell and Gallagher 2015, etc.). The second spectrum studies firm
characteristics that influence ERM adoption or outcome (Beasley et al. 2005, Liebenberg and
Hoyt 2003, Pagach and Warr 2011, etc.). The third spectrum explores the specific function
areas that benefit from ERM adoption, such as better strategic and capital structure decision
making (Chapman 2006, Rosenburg and Schuermann 2006, Nocco and Stulz 2006, etc.).
ERM, as an extension of internal control incorporating the goal of producing reliable
financial statements, expands and elaborates internal control to form a more robust
conceptulization focusing more fully on risk (COSO 2004). We therefore expect that the

3
adoption of ERM should influence financial reporting and accounting quality.
Prior accounting literature develops various proxies to measure accounting quality
and links it to different areas. Typical meaasures of accounting quality include discretionary
accruals and specific events, such as loss avoidance, meet or beat analyst forecast, or small
changes in earnings, etc. Driven by the incentive of earnings management (Rangan 1998,
Teoh et al. 1998, Francis et al. 2008), discretionary accruals is used to measure accounting
quality (Healy 1985, DeAngelo 1986, Jones 1991). Later studies modified the models of
discretionary accruals (Dechow et al. 1995, Dechow and Dichev 2002, Hribar and Collins
2002, and Kothari et al. 2005, etc.) using various firm-level characteristics. Other studies use
alternate proxies, such as auditor’s going concern opinion (Lim and Tan 2008), restatement
(Dechow et al. 2010), loss avoidance (Matsumoto 2002), and small earnings surprise and
changes (Frankel et al. 2002, Nelson et al. 2002, Ahmed et al. 2013, etc.) to measure financial
reporting quality. In this work we therefore utilize alternate measures of accounting quality to
examine their association with ERM adoption.
Previous literature explore the effects of ERM over financial reporting and related
issues. Some researches investigate the associations between auditing process or quality and
ERM process. They found that generally auditing process and financial reporting process
both benefit from the adoption of ERM through the information effect (Bell et al. 1997,
Kochetova-Kozloski and Messier 2011) and the internal control effect (Bell et al. 2002, Bell
et al. 1997). A semi-structure interview conducted by Cohen et al. (2014) shed some light on
the relationship between ERM and accounting quality. Their survey suggests that the
adoption of ERM allows CFOs and auditors to more effectively assess the appropriateness of
estimates, which leads to the improvement of the quality of the financial reporting process
and the strength of internal control.
Motivated by these works, we conduct an empirical research with long sample period
to examine the effect of ERM framework adoption on firm’s accounting quality. Prior
studies document that weak internal control is associated with poor accruals quality (Doyle et
al. 2007). ERM, expanding internal control to form a solid conceptualization focusing more
on risk (COSO 2004), may affect firms’ operations as well as reporting incentives.
Researchers have found the relations between ERM quality and firm value as well as firm
performance (Hoyt and Liebenberg 2011, Baxter et al. 2013) to address the effects of ERM
on firm operations. However, the role of ERM on reporting incentives or financial reporting
quality is not specifically addressed. Our study investigates the roles of ERM as an extension

4
of internal control on accounting quality fills in this research gap. If adopting ERM can
further improve internal control and accountability, we should observe its relation with higher
accounting quality. In addition, since firms in financial industry are subject to more stringent
internal control regulation and encouraged to adopt ERM, we should find stronger
associations among these firms. Therefore, we first hypothesize that in general, there should
be positive relations between ERM adoption and accounting quality measured by
discretionary accruals, small positive earnings (loss avoidance), and meeting or beating
analyst forecast (earnings surprise). Secondly, we focus on financial firms to develop our
next hypothesis and expect stronger association between the adoption of ERM and
accounting quality. In addition, since insurance companies, on average, are more specialized
and have more experience in risk management, the frequency or quality of ERM adoption in
these companies may be different from other financial firms. We also expect the relation
between ERM and accounting quality in insurance firms to be more significant than other
firms in the following hypothesis.
With a set of long-term panel data covering the period between 2002 and 2014, we
contribute to research in this area by expanding the analysis from financial firms to firms in
other industries and examine the long-term effects of ERM to produce generalized findings
summarized as follows. ERM adoption is negatively related to the magnitude of discretionary
accruals and income-increasing (positive) discretionary accruals. At the same time, ERM
adoption is negatively associated with the likelihood to report small positive earnings and to
meet or beat analyst forecast. However, we do not find significant relations between ERM
adoption and income-decreasing (negative) discretionary accruals. When focusing on firms in
financial services, we find that ERM adopted by these firms has weaker incremental effects
on lowering the magnitude of discretionary accruals, income-increasing discretionary
accruals, and the probability to avoid losses. However, by separating financial firms to
insurance companies and other financial firms, we find that ERM adoption in insurance
companies is more significantly and negatively related to the magnitude of discretionary
accruals, the income-increasing and income-decreasing discretionary accruals, and the
probability to avoid losses than in other financial or non-financial firms. In addition, we
examine whether accounting information, through the effects of ERM, is more useful or
relevant to the market or financial reporting users by using analysts’ forecast error, analysts’
forecast dispersion, and constructed Tobin’s Q as alternative dependent variables. We find
that ERM adoption is related to more accurate analyst forecast (lower forecast error), less

5
forecast optimism, less forecast dispersion, and higher Tobin’s Q. These results support our
hypothesis that when a firm adopts ERM, its financial reporting is improved and become
more useful for analysts to improve earnings forecast accuracy and form forecast consensus.
Overall, we find ERM adoption is positively related to accounting quality as well as the
usefulness of accounting information.
This paper should be of interest to financial reporting users, developers of ERM
framework, designers of internal control mechanism, and related legislators. Financial
reporting users benefit from ERM with high-quality accounting information so that they are
able to make better forecast of firm performance in the future accordingly. The supportive
findings in this study can also foster developers of ERM and internal control to evaluate and
improve the synergy of these mechanisms. In addition to current requirements of internal
control from Section 404 of Sarbanes-Oxley Act of 2002, the benefits of ERM found in this
work can remind legislator or authoritative bodies to consider whether ERM, which is not
mandatory currently, should be introduced and required similar to internal control mechanism.
The remainder of this paper includes following sections. In Section 2 we incorporate
literature both in ERM and accounting quality to develop our main two hypotheses. Section 3
presents the main research design, sample construction and descriptive statistics. Section 4
reports empirical results, including main analyses and further discussions in related
perspectives. The main conclusions and contributions are summarized in Section 5.
2. Literature Review and Hypotheses Development
Prior ERM Literature
Prior ERM literature falls in three spectrums. The first spectrum discusses the
contribution of ERM on firm performance. Mixed result has been found in this area. For
example, Pagach and Warr (2010) and Beasley et al. (2008) found no significant evidence
that overall average market will act positively once a firm adopts ERM. Beasley et al. (2011)
survey of 450 companies shows ERM oversight is not considered as a formal responsibility by
respondents. McShane et al. (2011) used Standard and Poor’s (S&P) risk management rating
and showed that higher ERM rating does not contribute to the increase of firm value.
However, others find that ERM contributes to better firm performance in terms of market
value (Baxter et al. 2013) through cost saving (Hoyt and Liebenberg, 2011). In addition, more

6
mature ERM relates to higher firm value (Farrell and Gallagher, 2015), which will then result
into improved ratings from credit rating agencies (Samanta and Martinez, 2004).
The second spectrum of previous literature studies firm characteristics that influence
ERM adoption or outcome. For example, Mikes and Kaplan (2012) used survey data of 250
interviews to differentiate “ERM mix” adopted by various organizations. They find the success of
ERM depends on the organization’s particular context. In particular, other research find that
ERM is likely to be adopted by larger firms (Beasley et al., 2005) that are more-leveraged
(Liebenberg and Hoyt, 2003), or has higher earnings volatility, poorer stock performance, or
a CEO whose compensation increases with stock volatility (Pagach and Warr, 2011). In terms
of firm performance, previous literature indicated that firms are more likely to benefit from
ERM when they adopt ERM in post-crisis period, have matching firm-specific factors
including size, industry, cash flow, volatility, and economic capital model. For example,
Baxter et al. (2013) find that market reacts positively with initial ERM quality rating or
revision and this impact is stronger among firms with earnings surprises and higher ERM
quality. However, they point out that this relation does not exist in the pre-crisis period and
during the crisis period, although firms with superior ERM programs rebounded faster after
crisis. Gordon et al. (2009) find that the impact of ERM depends on how well ERM
implementation matches firm-specific factors. ERM has higher perceived value for
shareholders of larger, non-financial firms with little financial slack and low volatility
(Beasley, Pagach and Warr 2008). Evidence also shows simple economic capital model
together with a dedicated risk manager and reporting requirement is the combination of ERM
initiatives that contributes the most to firm value (Grace et al. 2015).
The third spectrum of previous literature explores the specific function areas within a
firm that benefit from ERM adoption, such as better strategic and capital structure decision
making (Chapman 2006), improved board’s and senior management’s ability (Beasley et al.
2005), alignment and integration of risk management (Rosenburg and Schuermann, 2006),
reduction in the probability of large detrimental cash flow shortfalls (Nocco and Stulz, 2006),
and more transparent information in terms of informing regulators and investors (Hoyt and
Liebenberg, 2011).
Prior Accounting Quality Literature
While accounting quality is not specifically defined and unanimously agreed, the
concept that accounting quality measure should reflect faithful representation of the

7
underlying economics is broadly accepted by standard-setters, regulators, practitioners and
academics (SEC 2000, Schipper and Vincent 2003, Ball 2006, FASB 2008, Dechow et al.
2010). Prior literature develops various proxies for accounting quality and associates this
measure with factors in different perspectives for the most important question of how to
improve accounting quality and make high-quality accounting standards.
Earnings management is an important incentive to affect accounting quality and
drives the variation of earnings quality (Rangan 1998, Teoh et al. 1998, Francis et al. 2008).
Prior studies base on this incentive to measure accounting quality by discretionary accruals
(Healy 1985, DeAngelo 1986, Jones 1991). Other research modifies the model (Dechow et al.
1995), estimate accrual errors from working capital and cash flows (Dechow and Dichev
2002, Hribar and Collins 2002), adjusts the accruals measure by performance (Kothari et al.
2005) and documents the relations among accruals, earnings quality and firm characteristics.
These firm-level characteristics, including length of operating cycle, loss incidence, standard
deviation of sales, cash flows, firm size, book-to-market ratio, industry affiliation and
accounting choices are widely used as controls in later studies in this stream (Healy and
Palepu 2001, Dechow and Dichev 2002, Dechow and Schrand 2004, Francis et al. 2005,
Dechow et al. 2010, etc.).
Discretionary accruals as a measure of accounting quality are also linked to other
events, which are employed as signals or alternative proxies for accounting quality. For
example, Becker et al. (1998) and DeFond and Subramanyam (1998) find that auditor type
and auditor change are both associated with accruals quality. Frankel et al. (2002) document
that non-audit fees are positively related to the magnitude of discretionary accruals. Doyle et
al. (2007) find relations between internal control weakness and lower accruals quality.
Financial reporting users also react to accounting quality. Francis et al. (1999) show the
relations between auditor type and the credibility of accruals reporting. Francis et al. (2005)
find positive associations between accrual quality and cost of equity.
Prior literature also uses measures other than discretionary accruals to examine
accounting quality. Specific events are often used as a signal of fail to maintain financial
reporting quality ex ante, such as issuance of auditor’s going concern opinion (Lim and Tan
2008), restatement (Dechow et al. 2010), loss avoidance (Matsumoto 2002), small earnings
surprise and changes (Frankel et al. 2002, Nelson et al. 2002, Ahmed et al. 2013, etc.). These
measures are employed and regressed on issues in various settings, such as firm
characteristics, managerial incentives, or auditing environment in different institutions.

8
Prior Literature on ERM and Financial Reporting
The implementation and effectiveness of ERM has raised research interest in the
accounting research community recently. IIA’s definition of internal auditing specifically
mentioned that “risk management, control, and governance processes” are important elements
of internal auditor’s responsibilities. In light of this definition, extensive research has been
performed on the relation between the auditing process or quality and the ERM process.
Previous literature indicates that auditing process and financial reporting process generally
benefit from the adoption of ERM through the information effect and the internal control
effect. On one hand, the ERM process promotes better communication since it has the
opportunity to provide insight of business and strategic risk and generate more accurate
information of the internal control and inherent risk assessment across the board of the firm.
Taking advantage of the information gathered in the ERM process, auditors would have
better opportunity to establish an appropriate audit strategy (Bell et al. 1997), which then
improves auditor’s judgment accuracy, the nature and extent of audit testing, and auditor’s
evaluation of disclosure (Kochetova-Kozloski and Messier, 2011). On the other hand, ERM’s
emphasis on strategic risk management improves the monitoring and controls of risks, which
affects auditor risk assessment and program planning (Bell et al. 2002), and increases the
effectiveness of an auditor through the examination of client’s business strategic risks (Bell et
al. 1997).
While previous literature indicates ERM benefits firms in their overall firm value,
little is found about the link between ERM and firm’s accounting quality. Cohen et al. (2014)
conducted semi-structured interviews to capture the experiences of 32 experienced
individuals from 11 public companies. Using the COSO ERM framework, their survey
suggested that the adoption of ERM allows CFOs and auditors to more effectively assess the
appropriateness of estimates such as obsolescence in inventory, which leads to the
improvement of the quality of the financial reporting process and the strength of internal
control. Therefore, we predict that the adoption of ERM improves the accounting quality:
H1: The adoption of enterprise risk management program is associated with higher
accounting quality.
Many prior studies in ERM focus on insurance companies and find strong evidence
that ERM increases firm value (Hoyt and Liebenburg, 2011, Grace et at. 2012, etc.). However,

9
Beasley et al. (2006) showed no significant market response on ERM adoption from
univariate analysis. Although their multivariate analysis provides empirical evidence that
market responses positively with ERM, such result holds only for non-financial firms.
Apparently prior literature shows a mixed finding of the impact of ERM on firm value among
financial firms. Therefore, we predict that there is a different impact of ERM among financial
firms or insurance industry:
H2(a): The adoption of enterprise risk management program in financial firms is
more positively associated with higher accounting quality than in other firms.
H2(b): The adoption of enterprise risk management program in insurance companies
is more positively associated with higher accounting quality than in other firms.
3. Data and Methodology
Research Method
Drawing upon prior studies in accounting quality, we use the following model to
examine the association between ERM and accounting quality:
OA TB OSS
(1)
where:
AQ = Measure of accounting quality, including magnitude of discretionary accruals (ADACC), signed discretionary accruals (DACC_P and DACC_N), small positive income (SMALL), and earnings surprise (SURPRISE).
ERM = An indicator equal to 1 if the firm-year adopts enterprise risk management and 0 otherwise.
SIZE = The logarithm of market capitalization at the beginning of the year. LEV = Leverage calculated as total debts deflated by averaged total assets. ROA = Return on total assets. MTB = Market-to-book ratio. LOSS = An indicator equals to 1 if the firm has net loss in previous year and 0 otherwise.VOL_E = The standard deviation of earnings before extraordinary items in the past three
years deflated by averaged total assets. VOL_S = The standard deviation of sales in the past three years deflated by averaged total
assets. VOL_C = The standard deviation of net cash flows from operation in the past three years
deflated by averaged total assets.

10
ΔSALES = The percentage change in sales from the previous year. CYCLE = The logarithm of the average of [(Net Sales/360)/Average Accounts Receivable]
+ [(Cost of Goods Sold/360)/Average Inventory], calculated from 2002 to 2014.REST = Restructuring charge scaled by the beginning total assets. AGE = The logarithm of the number of years the firm has CRSP data as of 2014. HHI = Herfindahl index measured as the sum of squared market shares (i.e., percentage
of total industry sales for all firms available in Compustat North America based on the firm’s primary two-digit SIC code.
We use multiple measures as proxies of accounting quality. Our first measure,
ADACC, is the magnitude of discretionary accruals representing a company’s reporting
aggressiveness. We follow prior literature (Sloan and Sweeney 1995, Ahmed et al. 2013) to
compute accruals scaled by average total assets (ACC) as below:
ACC= (ΔCurrent Assets- ΔCash- ΔCurrent Liabilities+ ΔShort-term debt in current
liabilities+ ΔTaxes Payable- Depreciation) / Average Total Assets (2)
where Δ represents the change of the value in a year. We then use modified Jones model to
estimate discretionary accruals by two-digit SIC code following prior literature (Becker et al.
1998, Kothari et al. 2005, Doyle et al. 2007, etc.):
∆ (3)
where PPE is property, plant and equipment and ΔRevenue is the change of net sales. Both
measures are scaled by average total assets. We require at least 30 observations in each two-
digit SIC group, explain the firm-year residuals estimated from above model as discretionary
accruals, and use its absolute value as ADACC. In addition, we partition the sample to
examine income-increasing (DACC_P) and income-decreasing (DACC_N) discretionary
accruals. In the test DACC_N is presented as positive number.
We employ two indicators (SMALL and SURPRISE) as alternative measures of
accounting quality and revise model (1) accordingly. SMALL is an indicator for small positive
earnings equals to one if net income scaled by average total assets is between 0.00 and 0.01
and zero otherwise. SURPRISE equals one if actual annual earnings per share (EPS) is greater
or equal to the last consensus (median) of analyst annual EPS forecast prior to the
announcement date. Our main interest variable is an indicator of ERM, which equals one for
firm-year implementing enterprise risk management through development of risk
management strategy, setting specific chief risk officer (CRO) position, including risk
committee in board of director, etc., and equals zero otherwise. Other control variables are

11
defined above. We include year and industry fixed effects in the model and cluster sample at
firm level.
Sample Construction and Descriptive Statistics
Since there is neither universal definition nor regulatory requirement of ERM, the
qualification of firm’s ERM adoption could be difficult. Previous research used three
approaches to capture firm’s ERM adoption. Altuntas, Berry-Stölzle and Hoyt (2011) and
Grace et al. (2015) use survey data whereas other studies, including McShane et al. (2011),
Baxter et al. (2013), and Ai et al. (2014), have used S&P’s ERM ratings to measure the
quality of ERM. Survey data is a good source of information. However, it is not available to
the public since it needs to be obtained either directly from firms or consulting firm that
conducts the survey. S&P ERM rating provides an independent and in-depth rating that also
evaluates the quality of ERM. However, it only shows ERM adoption status at the rating year,
making panel data analysis difficult. Other research (Hoyt and Liebenberg 2011, Pagach and
Warr 2011, Eckles et al. 2014, Berry-Stölzle and Xu 2014) suggested keyword search from
newswire and financial reports.
Our sample covers the period of 2002 through 2014. As ERM is employed to oversee
enterprise-wide risks and manage activities from strategic to operational levels, we expect the
establishment of ERM is time consuming and should bring widespread and long-term effects
in various perspectives. Accordingly, we start from firms with available data in each sample
year in Compustat North America to retrieve necessary long-term financial information and
combine them with CRSP database for stock price and market capitalization. We then
combine the dataset with I/B/E/S database for analyst forecast in annual EPS. After further
elimination of missing data in control variables, we obtain an initial sample with 1,055 firms
and 11,761 firm-year observations between 2002 and 2014. We base on this sample to gather
information about ERM. Most prior literature use survey data (Altuntas et al. 2011, Grace et
al. 2015) to collect ERM information. Some studies use S&P ERM ratings to measure the
quality of ERM (McShane et al. 2011, Baxter et al. 2013, Ai et al. 2014) while this measure
is only available for firms in financial industry. Other research (Hoyt and Liebenberg 2011,
Eckles et al. 2014, Berry-Stölzle and Xu 2014, etc.) suggest keyword and text search from
newswire and financial reports. We retrieve information regarding whether a firm discloses
its holistic approach, techniques or strategies for risk management, whether a firm
specifically set chief risk officer (CRO) in top management team, whether there is an

12
independent risk committee in board of directors to oversee a firm’s risk management
policies and framework, or other related disclosure from SEC 10-K filing and related
reporting. However, there are no specific format or context requirements about this
information and the quality of ERM cannot be measured directly. Therefore we use an
indicator ERM to identify firms using any of these strategies, policies, or approaches as those
implementing ERM and do not assume intensity or effectiveness of specific or multiple ERM
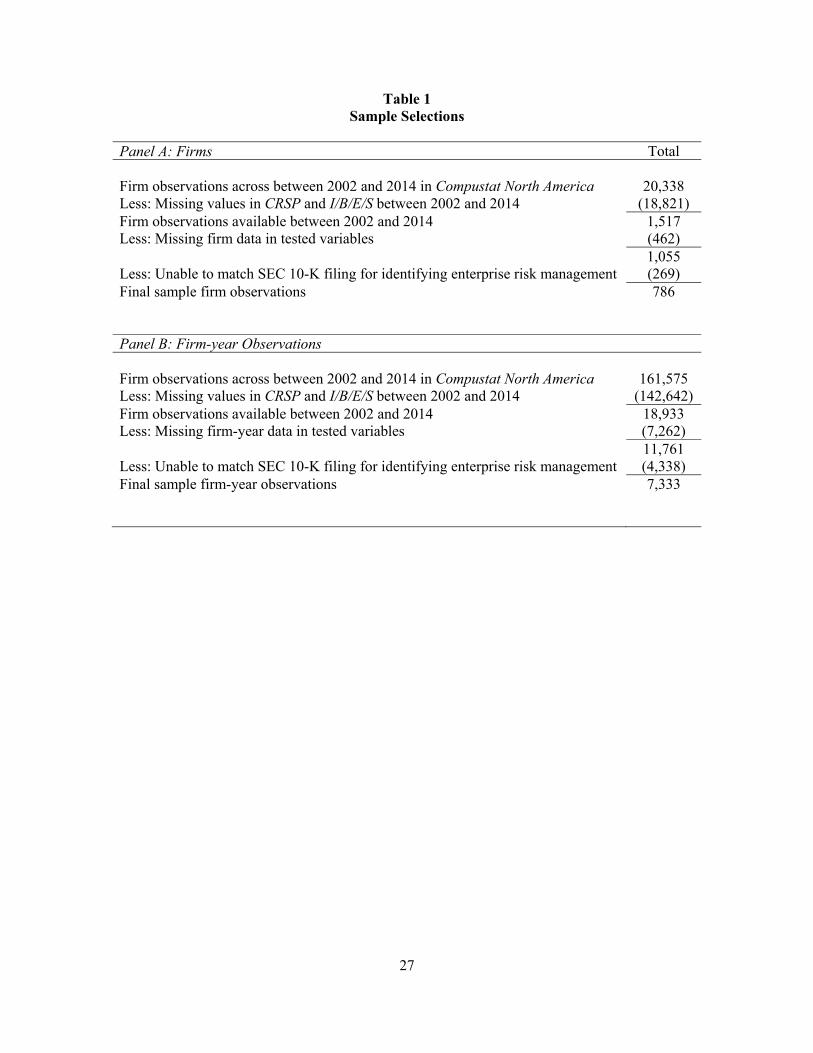
techniques. In the end we construct our final sample with 786 firms and 7,333 firm-year
observations. The sample selection procedure in detail is presented in Table 1.
Panel A of Table 3 presents the descriptive statistics and breakdown by ERM. There
are more firm-year observations (69.5%) adopting ERM in our sample. We first note that
firms adopting ERM have generally weaker discretionary accruals (ADACC), especially in
income-increasing discretion (DACC_P), implying better quality in financial reporting
compared with firms without ERM. The probabilities to report small positive income
(SMALL) and to meet or beat earnings forecast (SURPRISE) are also lower for ERM firms. In
addition, firms with ERM, on average, have higher firm value (Q and MTB), larger size
(SIZE), lower variation in past performance (VOL_E, VOL_S and VOL_C), and longer
operating cycle (CYCLE) and history (AGE). Most features are consistent with the findings in
prior literature (Hoyt and Liebenberg 2011, Baxter et al. 2013, etc.) while these studies
mainly focus on financial firms. Table 3, Panel B, reports Pearson correlation among main
variables. ERM is significantly correlated with most control variables, especially SIZE and
AGE. This result suggests that firms with larger size and longer history have more resources
and are more willing to invest in ERM.
4. Results and discussions
Main Empirical Results
Our main test investigates the association between the adoption of ERM as an
indicator and alternative measures of accounting quality as the dependent variable. The first
column of Table 4 contains the regression results of the magnitude of discretionary accruals
(ADACC) on ERM adoption (ERM) and controls for firm characteristics related to accruals
quality and determinants of ERM. The coefficient estimate on ERM is -0.005 with a t-value
of -3.23 when all other control variables and fix effects are included. The negative relation
between ERM and ADACC supports our first hypothesis that adoption of ERM is associated

13
with better accounting quality (lower discretionary accruals). The coefficients on most
control variables are significant and their directions are consistent with our prediction and
prior literature in accruals quality (Doyle et al. 2007). Firms with larger size, net loss, higher
volatility in performance measures, higher sales growth, and longer operating cycle, are more
positively associated with greater discretionary accruals. When a firm has better operating
performance (ROA) and longer history (AGE), the incentives to increase income or
manipulate earnings through discretionary accruals should be weaker. The second and third
column presents the regression results with alternative dependent variables. We separate
discretionary accruals to income-increasing (DACC_P) and income-decreasing discretionary
accruals (DACC_N) and test their relations with ERM to examine specific reporting behavior.
The results show that ERM adoption is negatively associated with both variables, but the
relation is only significant for income-increasing discretionary accruals. The estimated
coefficient of ERM is -0.003 with t-value of -2.04 in this regression. Coefficients of all
control variables are significant except CYCLE while its direction is consistent with our
predictions. HHI representing Herfindahl index in this test is negatively and significantly
related to DACC_P. As Herfindahl index is a proxy for competition intensity in an industry,
higher HHI implies more market share is taken by few companies. Hence, the results here
suggest firms facing more competitors in the market and pressure from investors tend to
increase income through discretionary accruals.
In addition to accruals quality, we use two indicators of earnings benchmark, SMALL
and SURPRISE, as alternate proxies of accounting quality and examine their relations with
ERM adoption. SMALL is an indicator for small positive income. Prior studies (Burgstahler
and Dichev 1997, Roychowdhury 2006, Gunny 2010) find that firms have incentives to use
different techniques of earnings management, such as overproduction, reducing discretionary
expenses, or other real activities manipulation to avoid net loss or negative earnings changes
in annual reporting. Although the firms’ performance in subsequent years is not necessarily
deteriorating, the reporting quality in current year has decreased. Following prior literature
we also use an indicator, SURPRISE, to identify firm-year meeting or beating analyst
earnings forecast based on the premise that earnings management is more likely to occur in
firms just meet or beat the benchmark than in firms just miss the benchmark (Frankel et al.
2002). Prior literature has confirmed managers’ incentives to continuously meet or beat
analysts’ forecast of EPS as analyst forecast is another benchmark of market expectation to a
firm’s performance. These incentives include higher assignment of firm valuation (Kasznik

14
and McNichols 2002), higher equity return premium (Bartov 2002, Brown and Caylor 2005),
increasing bond ratings (Jiang 2008), and lower cost of capital (Duarte et al. 2008, Brown et
al. 2009). Prior studies also document that managers tend to employ three main methods to
meet or exceed analysts’ forecast, including accrual manipulation (Dechow et al. 2003),
expectation management (Kasznik and Lev 1995), and real activities manipulation
(Roychowdhury 2006) and accounting quality is therefore affected. Table 5 presents related
results of logistic regression. The estimated coefficient of ERM is -0.106 with t-value of -2.90
in the first column, suggesting firms adopting ERM are less likely to report small positive
income. In the second column, strong evidence shows that ERM is also negatively associated
with SURPRISE (coefficient= -0.136, t-value= -12.86), indicating the probability of meeting
or beating analyst annual EPS forecast is lower with the emphasis of ERM. We control
factors that affect incentives to avoid loss or meet/beat earnings forecast with different sign
predictions. Most controls are significant and consistent with our expectation.
Firms in Financial Industries
Many prior studies in ERM focus on insurance companies and found strong evidence
that ERM increases firm value. Therefore we use three additional binary variables to identify
firms in financial industry (FIN, SIC code 6000-6999), insurance companies (INS, SIC code
6311-6499), and other financial firms (OTHER, SIC code 6000-6299 and 6500-6999)
separately based on SIC classification code. We then investigate incremental effects of ERM
in these firms on all dependent variables used in main tests discussed above. The results are
presented in Table 6. For parsimony, we report only coefficients with respect to ERM and
related interaction terms while all control variables and fixed effects are included. Panel A of
Table 6 presents OLS regression results regarding accrual quality. We do not include
standalone variable for financial industries (FIN, INS and OTHER) since the related effects
have been controlled through industry fixed effects. Consistent with the main results, ERM is
negatively associated with the magnitude (ADACC) and income-increasing part (DACC_P) of
discretionary accruals no matter financial firms or insurance companies are identified. For
these two dependent variables, we note that ERM, on average, has negative but weak
incremental effects. The coefficients for (ERM*FIN) for both models are one-sided
significant at 10% level. This finding echoes with Beasley et al. (2006) that ERM contributes
to firm value only for non-financial firms, but not for financial institution. However, when we
further disaggregate financial firms to insurance companies and other financial firms, we find

15
that ERM adoption has a stronger impact among insurance companies with its value more
negatively related to ADACC and DACC_P. This could be due to two reasons: first of all,
insurance companies provide enterprise risk management solutions to their clients so they
have expertise advantage; second, insurance companies are also subject to regulations such as
Own Risk and Solvency Assessment (ORSA) that require the adoption of ERM. Our results
support this argument and imply that ERM is more effective for insurance companies than
other firms, at least from the perspective of improving financial reporting quality. The
incremental effects of ERM and financial firms other than insurance companies are
consistently insignificant. For DACC_N, the relations between ERM and income-decreasing
discretionary accruals are consistently insignificant, including main and incremental effects
for most industries. However, the interaction between ERM and INS is weakly and negatively
associated with DACC_N. Overall, the results reflect two implications. First, the adoption of
ERM is related to higher accounting quality in financial industry. Second, this effect is more
significant in insurance companies than other financial or non-financial firms.
Table 6, Panel B, reports results of logistic regression adding financial firm indicators
with regard to SMALL and SURPRISE. The coefficients of ERM adoption is consistently
negative no matter what model combination is used. For financial firms, ERM has
incremental effects on reducing the probability to report small positive earnings (avoid loss),
but not on lowering the probability to meet or beat analyst earnings forecast. When further
identifying insurance companies. We find the coefficient of ERM*INS is significantly
negative to SMALL (coefficient= -0.521, t-value= 0.24), implying an important effects of
ERM on insurance companies to improve accounting quality. However, the coefficient of
ERM*INS is weakly positive to SURPRISE, which is not consistent with our prediction.
While ERM can lower the probability for a firm to meet or beat analyst forecast, its effect is
not particularly strong form insurance firms. The interaction terms related to other financial
firms (ERM*OTHER) are consistently insignificant, suggesting the effects of ERM on
financial reporting quality are not specifically different between these firms and others in
general industries.
Additional Analyses: ERM and Analysts’ Forecast
In addition to utilizing direct measures or proxies of accounting quality, we also address
this issue from financial reporting users’ perspective. Prior research documents that earnings
attributes, such as accrual quality, persistence, and predictability, are important to users of

16
accounting information (Francis et al. 2004) When earnings quality is high, information
asymmetry decreases (Bhattacharya et al. 2003, Francis et al. 2004) and analyst forecast is
improved (Salerno 2013). Since ERM provides comprehensive risk management that
addresses all aspects of risk in a firm and communicates the information in a more
transparent fashion, one shall expect a reduction of performance variability among the firms
that adopted ERM. Therefore, we investigate additionally whether ERM, through its effects
on improved accounting quality, is associated with analysts’ forecast behavior. We employ
two related measures, forecast error (FE) and forecast dispersion (DISP), as alternate
dependent variables to examine how ERM can affect the uncertainty of accounting
information environment and analysts’ consensus. Modified from Duru and Reeb (2002) we
construct analyst forecast error as the absolute value of the difference between actual EPS
and the median of final analyst forecasted EPS prior to the earnings announcement deflated
by stock price at the forecast date. Hence, lower FE represents better forecast accuracy. We
use forecast dispersion as a proxy for uncertainty among analysts about future events or
credibility of accounting information and measure it as the standard deviation of final analyst
forecasted EPS prior to the earnings announcement scaled by stock price at the forecast date.
Higher DISP suggests analysts have fewer consensuses about a firm’s future. This
uncertainty may come from economic circumstances, a firm’s operations, or accounting
information quality provided analysts rely on financial report to make forecasts. ERM as a
framework to control or reduce different types of risks may make a firm’s operating activities
more predictable and financial performance more persistent over a period of time.
The first two columns of Table 7 provide results of regressing ERM on FE and DISP.
After controlling factors related to firm performance and uncertainty, we find that ERM is
negatively related to analysts’ forecast error and dispersion with coefficients of -0.101 (t-
value= -3.12) and -0.004 (t-value= -2.61) respectively. Based on these results, adopting ERM
can improve analysts’ forecast accuracy as well as lower analysts’ differences in their
forecasts. We also follow Duru and Reeb (2002) to construct another alternate measure,
forecast bias, as the proxy of optimism. Forecast bias is measured as the difference between
analysts’ forecasted EPS and actual EPS. Higher forecast bias suggests that analysts are more
optimistic about a firm’s future performance. The untabulated results show that ERM is
negatively and significantly associated with forecast bias and further confirm the important
effects of ERM on analysts’ forecast behavior.

17
Additional Analyses: ERM and Firm Value
Prior literature addresses the relations between ERM and firm value or firm performance.
Hoyt and Liebenburg (2011) find positive associations between ERM and constructed
Tobin’s Q proxied for firm value. Baxter et al. (2013) document ERM quality is positively
associated with improved accounting performance, including market valuation and return on
assets. ERM quality is also positively related to earnings response coefficients although the
explanatory power is mainly from sample period after financial crisis in 2008. However, due
to certain data limitations, these studies mainly focus on insurance companies and financial
services firms. With a sample across different industries, we follow Hoyt and Liebenburg
(2011) to examine the relations between ERM and firm value to understand whether the
findings from financial industries can be generalized. The alternate dependent variable Q is
constructed as the sum of market value of equity and book value of liabilities scaled by book
value of total assets and used as a proxy of firm value. The third column of Table 7 reports
the related regression results. The estimated coefficient of ERM in this model is 0.023 with
the t-value of 4.10, indicating that ERM adoption is positively associated with firm value (Q).
The adjusted R-square and F-value of the model is higher than other model combinations,
suggesting strong relations between ERM and firm performance.
Another important measure of accounting quality employed by prior studies is timely loss
recognition developed by Basu (1997), which captures whether bad news (loss) is recognized
in a timely manner than good news (positive earnings). We utilize Basu model to examine
whether ERM adoption provides incremental effects and fail to find significant results in
general.
Additional Analyses: Robustness Checks
In our main tests we include known determinants of setting ERM as control variables,
such as firm size or uncertainty from operations, and focus on ERM’s effect on accounting
quality. However, it is possible that a firm can choose its financial reporting quality and
decide whether it should utilize ERM. Firms may employ certain ERM techniques at
operational level but do not adequately report them since the related disclosure is not
mandatory in general. These issues may create self-selection problems and we therefore
employ Heckman two-stage test (1979) to control it following Baxter et al. (2013). In the
first-stage model we use a logistic model to identify the probability for a firm to adopt ERM
by regressing ERM on firm size, leverage, return on assets, uncertainty of earnings, operating

18
cycle, leverage, firm age and industry effects following Pagach and Warr (2011) to generate
an inverse Mills ratio. We include this ratio in the second-stage OLS and logistic regressions
and examine the effects of ERM similar to those reported in Table 4, 5 and 7. The first two
columns of Table 8 present the results of first-stage logistic model and the second-stage OLS
regression regarding ADCC. The (untabulated) results in general confirm positive
associations between ERM adoption and the quality and usefulness of accounting
information1.
We also use propensity score matched (PSM) sample to control endogeneity problem
and rerun our tests. Based on firm size, leverage, return on assets, and two-digit SIC code we
estimate propensity score for each firm-year observation and identify firm-year which does
not adopt ERM with the closest probability to make control group. After matching procedure
we have a sample with 2,144 firm-year observations adopting ERM matched with 1,072
observations without ERM to construct a matched sample with 1,072 observations in total.
We verify the main analyses based on matched sample and provide the test results of the
relation between ERM adoption and ADACC in the third column of Table 8. The estimated
coefficient is -0.006 with the t-value of -1.69, confirming our findings in Table 4. For
parsimony we do not present tests with other dependent variables, but the results (untabulated)
are consistent with our previous findings and support our main conclusion that ERM adoption
is positively related to accounting quality.
Internal control is encompassed within and an integral part of ERM (if a firm adopts
ERM) (COSO 2004). Prior literature (Doyle et al. 2007) also finds negative relations between
internal control weakness and accruals quality. We therefore consider whether our findings
are driven by the effectiveness of internal control and match our dataset with the indicator
whether the firm-year has effective internal control from AuditAnalytics. As this information
is not required or available for our whole sample period, we exclude observations without
this information and decrease the pooled sample to 6,428 observations. In this dataset, only
firm-year with ineffective internal control takes only 2.46% (158 observations). By adding
the indicator for effective internal control, we still find consistent results as those in main
tests, suggesting significant effects of ERM other than internal control on accounting quality.
We also exclude firm-year without effective internal control to rerun our analyses and the
results are not changed.
1 After controlling inverse Mills ratio we use dependent variables tested above to rerun the second-stage OLS
and logistic regressions depends on their properties. The results are similar to those reported in main tests except DACC_P, which is only one-sided significant at 10% level.

19
We include additional controls as further tests. We include an indicator for big four
accounting firms to control the effects of external auditor on accruals quality2. The related
coefficients are consistently significant and our main results are held. We further include an
index for corporate governance, which is provided from Institutional Shareholder Services
(ISS) and based on Gompers et al. (2003), as an additional variable in the main models to
control sample firms’ internal control mechanism. As ERM could be treated as an extension
or alternative of internal control or corporate governance, we check variance inflation factors
(VIF) of related tested variables and do not find multicollinearity problems. We employ
number of segments, the ratio of foreign assets to total assets, and the ratio of foreign sales to
total sales as proxies of firm complexity in addition to firm size. These tests decrease the
sample size to 6,001 observations and do not change our main results and our conclusions.
Finally we try different thresholds of data trimming and clustering as robustness checks. We
trim and winsorize the pooled sample by top and down 1% for all continuous variables to
have stronger results. We also cluster the sample by firm and year to have lower t-values.
Both checks confirm our main findings and conclusions.
5. Conclusions
In this study we examine the role of ERM in financial reporting quality. ERM, as an
extension of internal control incorporating the goal of producing reliable financial statements,
expands and elaborates internal control to form a more robust conceptulization focusing more
fully on risk (COSO 2004), and therefore should have integrated and broader effects on the
whole company, including firms’ operational deicisions and reporting incentives. While prior
studies have documented the associations between ERM quality and firm value as well as
firm performance (Hoyt and Liebenberg 2011, Baxter et al. 2013), they focus mainly on the
effects of ERM on firm operations, rely on shorter sample period, and only base on firms in
financial industry. The roles of ERM on reporting incentives or financial reporting quality are
not fully addressed. Therefore our study fills in this gap and investigates the associations
between ERM adoption and alternate measures of accounting quality.
If adopting ERM can further improve internal control and accountability, we should
observe its relation with higher accounting quality. This relation should be strengthened in
financial firms since these firms are subject to more stringent internal control regulation and
2 In our pooled sample, firm-year observations with big four accounting firm take 96.75%, so we do not include
related indicator in main tests as most sample firms are treated as having similar and high level of external monitor.

20
encouraged to adopt ERM. With a set of long-term panel data covering the period between
2002 and 2014, we examine these associations with alternate proxies of accounting quality,
including the magnitude of discretionary accruals, income-increasing (positive) and income-
decreasing (negative) discretionary accruals, small positive earnings (loss avoidance), and
meeting or beating analyst forecast (earnings surprise). We find that ERM adoption is
negatively related to the magnitude of discretionary accruals, the income-increasing (positive)
discretionary accruals, the likelihood to report small positive earnings and the likelihood to
meet or beat analyst forecast. These associations, except the likelihood to meet or beat analyst
forecast, are slightly strengthened in financial firms, but significantly improved in insurance
companies. We explain this finding in a way that insurance companies should be more
specialized in risk management, introduce ERM and utilize ERM’s functions better than
firms in other industries.
We also test whether accounting information under ERM framework is more useful
and relevant to the market and financial reporting users. By using analysts’ forecast error,
analysts’ forecast dispersion, and constructed Tobin’s Q as alternative dependent variables
we confirm the benefits of ERM adoption. We find ERM adoption is related to more accurate
analyst forecast (lower forecast error), less forecast optimism, less forecast dispersion, and
higher Tobin’s Q. These results indicate that when a firm adopts ERM, its financial reporting
becomes more high-quality and useful for analysts to improve earnings forecast accuracy and
form forecast consensus. The positive and significant relation between ERM adoption and
Tobin’s Q also confirm the value of ERM in different industries and extend the findings in
prior studies (Hoyt and Liebenberg 2011). In summary, we document that ERM adoption is
positively related to accounting quality as well as the usefulness of accounting information.
We utilize a series of methods to confirm our findings. As a firm can choose its
financial reporting quality and the method or timing to adopt ERM, it is possible that a firm
employs certain ERM techniques but do not disclose them properly. This may raise self-
selection problems and we therefore perform Heckman two-stage test (1979) following
Baxter et al. (2013) to mitigate this concern. After generating inverse Mills ratio from the
first-stage logistic model by regressing ERM on firm size, leverage, return on assets,
uncertainty of earnings, operating cycle, leverage, firm age and industry effects following
Pagach and Warr (2011), we include this ratio in the second stage regressions and find the
results are consistent with our main analyses. In addition, as ERM adoption is not mandatory,
firms may have different concerns to decide whether they should or should not introduce

21
ERM. We therefore employ propensity score matching (PSM) procedure to create treatment
and control subsamples regarding ERM adoption to address potential endogenous problems.
Based on firm size, leverage, return on assets, and two-digit SIC code, we estimate propensity
score for each firm-year observation, obtain a sample with 1,072 firm-year adopting ERM to
match 1,072 observations without ERM, and find consistent results to confirm our main
conclusions.
We include additional control variables to examine the main research question with
smaller subsamples. As internal control could be a factor other than ERM to drive accounting
quality, we include a binary variable indicating whether the firm-year has effective internal
control from AuditAnalytics. As external monitor could be an effective way to affect
accounting quality, we include an indicator for big four (or five, depends on sample years)
accounting firms while 96.75% of our sample observations are big accounting firms’ clients.
We also employ the index of corporate governance developed by Gompers et al. (2003) as
additional controls. Prior studies use variables in addition to firm size to control firm
complexity or internationalization for ERM and internal control issues. We utilize numbers of
segment, the ratio of foreign assets to total assets, and the ratio of foreign sales to total sales
as further control variables. Overall, we do not find significant change to our results and the
main conclusions are held. Finally we use different thresholds of data trimming and
clustering to examine the robustness of our results. We trim and winsorize the pooled sample
by top and down 1% for all continuous variables and obtain stronger results. We also try two-
way clustering by firm and year to have lower t-values. These checks confirm our solid
findings and conclusions.
While the results and findings are informative, there are couples of caveats. First, we
cannot provide direct evidence on how ERM framework, after adoption, affects a company in
each aspect to have better accounting quality and improve the usefulness of accounting
information. First, managers’ operational decisions may be more risk averse after ERM
adoption to naturally lower the uncertainty of reported amounts. Analysts therefore can easily
rely on them to form earnings forecasts. Second, ERM adoption may mitigate managers’
reporting incentives, such as earnings management or manipulation, and improve accounting
quality. Both forces and their interactions, if any, will lead us to observe the associations
between ERM adoption and measures of accounting quality. Furthermore, although we use
multiple thresholds to determine whether a firm adopts ERM or not, we cannot measure the
magnitude or specific quality of this adoption. Prior studies use data from S&P risk

22
management rating to measure ERM quality (Baxter et al. 2013), but this information is only
available in financial industry.

23
Reference Adams, A., S. Fries, and R. Simnett. 2011. The journey towards integrative reporting.
Accountant’s Digest 558: 1-41 Ahmed. A. S., M. Neel, and D. Wang. 2013. Does mandatory adoption of IFRS improve
accounting quality? Preliminary evidence. Contemporary Accounting Research 30 (4): 1344-1372.
Akin Gump Strauss Hauer & Feld LLP. 2010. Corporate Alert: The Board’s Role in Risk Oversight: A Survey of Recent Proxy Statement Disclosures. Available at: http://cdn.akingump.com/images/content/6/5/v4/6507/100406-The-Boards-Role-in-Risk-Oversight.pdf .
Altuntas, M., T.R. Berry-Stölzle, and R.E. Hoyt. 2011. Implementation of enterprise risk management: Evidence from the German property-liability insurance industry. The Geneva Papers on Risk and Insurance-Issues and Practice 36(3): 414-439.
Arena, M., and K. K. Jeppesen. 2010. The Jurisdiction of Internal Auditing and the Quest for Professionalization: The Danish Case. International Journal of Auditing 14(2): 111-129.
Ball, R. 2006. International financial reporting standards (IFRS): Pros and cons for investors. Accounting and Business Research 36 (773): 5–27.
Bartov, E., D. Givoly, and C. Hayn. 2002. The rewards to meeting or beating earnings expectations. Journal of Accounting and Economics 33 (2): 173–204.
Basu, S. 1997. The conservative principle and the asymmetric timeliness of earnings. Journal of Accounting and Economics 24 (1): 3–37.
Baxter, R. J. C. Bedard, R. Hoitash, and A. Yezegel. 2013. Enterprise risk management program quality: Determinants, value relevance, and the financial crisis. Contemporary Accounting Research 30 (4): 1264-1295.
Beasley, M. R., R. C. Clune, and D. R. Hermanson. 2005. ERM: a status report; A study funded by The IIA Research Foundation reveals how far organizations have come in developing enterprise risk management and internal auditing's role in the process. Internal Auditor 62(1): 67-73.
Beasley, M. S., R. Clune, and D. R. Hermanson. 2005. Enterprise Risk Management: An Empirical Analysis of Factors Associated With the Extent of Implementation. Journal of Accounting and Public Policy 24(6): 521-531.
Beasley, M., B. Branson, and B. Hancock. 2011. Report on the current state of enterprise risk oversight: 3rd edition . AICPA.
Beasley, M., D. Pagach, and R. Warr. 2008. Information Conveyed in Hiring Announcements of Senior Executives Overseeing Enterprise-Wide Risk Management Processes. Journal of Accounting, Auditing & Finance 23(3): 311-332.
Becker, C. L., M. L. DeFond, J. Jiambalvo, and K. R. Subramanyam. 1998. The effect of audit quality on earnings management. Contemporary Accounting Research 15 (1): 1–24.
Bell, T. B., M. Peecher, and I. Solomon. 2002. Cases in Strategic-Systems Auditing. KPMG. Bell, T., F. Marrs, I. Solomon, and H. Thomas. 1997. Auditing Organizations Through a
Strategic-Systems Lens. KPMG Peat Marwick LLP. New York. Berry-Stölzle , T. R., and J. Xu. 2014. Enterprise Risk Management and the Cost of Capital.
Working Paper. Bhattacharya, U., H. Daouk, and M. Welker. 2003. The world price of earnings opacity. The
Accounting Review 78 (3): 641-678. Brown, L., and M. Caylor. 2005. A temporal analysis of quarterly earnings thresholds:
Propensities and valuation consequences. The Accounting Review 80 (2): 423–440.

24
Burgstahler, D., and I. Dichev. 1997. Earnings management to avoid earnings increases and losses. Journal of Accounting and Economics 24 (1): 99–126.
Casualty Actuarial Society Enterprise Risk Management Committee. 2003. Overview of Enterprise Risk Management. CAS.
Chapman, R. J. Simple Tools and Techniques for Enterprise Risk Management Electronic Resource. Hoboken, NJ: John Wiley & Sons, 2006.
Cohen, J., G. Krishnamoorthy, and A. Wright. May 30, 2014. Enterprise Risk Management and the Financial Reporting Process: The Experiences of Audit Committee Members. CFOs, and External Auditors. Available at: http://papers.ssrn.com/sol3/papers.cfm?abstract_id=2444397.
COSO. 2014. Enterprise Risk Management — Integrated Framework: Executive Summary. Committee of Sponsoring Organizations of the Treadway Commission.
DeAngelo, L. 1986. Accounting numbers as market valuation substitutes: A study of management buyouts of public stockholders. The Accounting Review 61 (3): 400-420.
Dechow, P., R. Sloan, and A. Sweeney. 1995. Detecting earnings management. The Accounting Review 70 (2): 193-225.
________, and I. Dichev. 2002. The quality of accruals and earnings: The role of accrual estimation errors. The Accounting Review 77 (Supplement), 35 - 59.
________, S. Richardson, and I. Tuna. 2003. Why are earnings kinky? An examination of the earnings management explanation. Review of Accounting Studies 8 (2-3): 355–384.
________, and C. Schrand. 2004. Earnings Quality. Charlottesville, VA: The Research Foundation of CFA Institute.
________, P., W. Ge, and C. Schrand. 2010. Understanding earnings quality: A review of the proxies, their determinants and their consequences. Journal of Accounting and Economics 50 (2-3): 344–401.
DeFond, M. and K. R. Subramanyam. 1998. Auditor changes and discretionary accruals. Journal of Accounting and Economics 25 (1): 35–67.
Doyle, J. T., W. Ge, and S. McVay. 2007. Accruals quality and internal control over financial reporting. The Accounting Review 82 (5): 1141-1170.
Duarte, J., X. Han, J. Harford, and L. Young. 2008. Information asymmetry, information dissemination and the effect of regulation FD on the cost of capital. Journal of Financial Economics 87 (1): 24-44.
Duru, A., and D. M. Reeb. 2002. International diversification and analysts’ forecast accuracy and bias. The Accounting Review 77 (2): 415-433.
Eckles, D. L., R. E. Hoyt, and S. M. Miller. 2014. The Impact of Enterprise Risk Management on the Marginal Cost of Reducing Risk. Journal of Banking & Finance 43: 247-261.
Farrell, Mark, and Ronan Gallagher. 2015. The Valuation Implications Of Enterprise Risk Management Maturity. The Journal of Risk and Insurance 82(3): 625-657.
Financial Accounting Standards Board (FASB). 2008. Conceptual framework for financial reporting: The objective of financial reporting and qualitative characteristics and constraints of decision-useful financial reporting information. Stamford, CT: FASB.
Frankel, R., M. Johnson, and K. Nelson. 2002. The relation between auditors’ fees for nonaudit services and earnings management. The Accounting Review 77 (Supplement): 71-105.
Francis, J., E. L. Maydew, and H. C. Sparks. 1999. The role of Big 6 auditors in the credible reporting of accruals. Auditing: A Journal of Practice & Theory 18 (1): 17–34.
________, R. LaFond, P. M. Olsson, and K. Schipper. 2004. Costs of equity and earnings attributes. The Accounting Review 79 (4): 967-1010.

25
________, J., R. LaFond, P. Olsson, and K. Schipper. 2005. The market pricing of accruals quality. Journal of Accounting and Economics 39 (2): 295–327.
________, A. Huang, S. Rajgopal, and A. Zang. 2008. CEO Reputation and Earnings Quality. Contemporary Accounting Research 25 (1): 109-47.
Gompers, P., J. Ishii, and A. Metrick. 2003. Corporate governance and equity prices. Quarterly Journal of Economics 118 (1): 107-155.
Gordon, L. A., M. P. Loeb, and C. Y. Tseng. 2009. Enterprise risk management and firm performance: a contingency perspective. Journal of Accounting and Public Policy 28(4): 301-327.
Grace, M.F., J. T. Leverty, R. D. Phillips, and P Shimpi. 2015. The Value of Investing in Enterprise Risk Management. Journal of Risk and Insurance 82(2): 289-316.
Graham, J., and D. Rogers. 2002. Do Firms Hedge in Response to Tax Incentives? Journal of Finance 57(2): 815-839.
Gunny, K.A., 2010. The Relation Between Earnings Management Using Real Activities Manipulation and Future Performance: Evidence from Meeting Earnings Benchmarks, Contemporary Accounting Research 27 (3): 855-888.
Healy, P. M. 1985. The effect of bonus schemes on accounting decisions, Journal of Accounting and Economics 7 (1-3): 85-107.
________, and K. G. Palepu. Information asymmetry, corporate disclosure, and the capital markets: A review of the empirical disclosure literature. Journal of Accounting and Economics 31 (1): 405-440.
Hoyt, R. E., and A. P. Liebenberg. 2011. The value of enterprise risk management. Journal of Risk and Insurance 78(4): 795-822.
Hribar, P., and D. Collins. 2002. Errors in estimating accruals: Implications for empirical research. Journal of Accounting Research 40 (1): 105–134.
Jiang, J. 2008. Beating earnings benchmarks and cost of debt. The Accounting Review 83 (2): 377-416.
Jones, J. 1991. Earnings management during import relief investigations. Journal of Accounting Research 29 (2): 193–228.
Kasznik R., and B. Lev. 1995. To warn or not to warn: Management disclosures in the face of an earnings surprise. The Accounting Review 70 (1): 113-134.
Kasznik, R., and M. McNichols. 2002. Does meeting earnings expectations matter? Evidence from analyst forecast revisions and share prices. Journal of Accounting Research 40 (3): 727–759.
Kochetova-Kozloski , N., and W. F. Messier. 2011. Strategic analysis and auditor risk judgments. Auditing: A Journal of Practice and Theory 30(4): 149-171.
Kothari, S.P, Andrew Leone, and Charles Wasley, 2005, Performance matched discretionary accrual measures, Journal of Accounting and Economics 39 (1): 163-197.
Liebenberg, A. P., and R. E. Hoyt. 2003. The determinants of enterprise risk management: evidence from the appointment of chief risk officers. Risk Management and Insurance Review 6(1): 37-52.
Lim, C. and H. Tan. 2008. Non-audit service fees and audit quality: The impact of auditor specialization. Journal of Accounting Research 46 (1): 199-246.
McShane, Michael K., Anil Nair, and Elzotbek Rustambekov. 2011. Does Enterprise Risk Management Increase Firm Value? Journal of Accounting Auditing & Finance 26(4): 641-658.
Matsumoto, D. 2002. Management’s incentives to avoid negative earnings surprises. The Accounting Review 77 (3): 483-514.

26
Nelson, M. W., J. A. Elliott, and R. L. Tarpley. 2002. Evidence from auditors about managers’ and auditors’ earnings management decisions. The Accounting Review 77 (Supplement): 175-202.
Nocco, B. W., and R. M. Stulz. 2006. Enterprise Risk Management: Theory and Practice. Journal of Applied Corporate Finance 18(4): 8-20.
Pagach, D. P., and R. S. Warr. 2010. The Effects of Enterprise Risk Management on Firm Performance. http://papers.ssrn.com/sol3/papers.cfm?abstract_id=1155218.
Pagach, D., and R. Warr. 2011. The characteristics of firms that hire chief risk officers. Journal of Risk and Insurance 78(1): 185-211.
Rangan, S. 1998. Earnings management and the performance of seasoned equity offerings. Journal of Financial Economics 50 (1): 101–122.
RIMS. 2006. RIMS Risk Maturity Model (RMM) for Enterprise Risk Management. Executive Summary, RIMS.
Rosenburg, J., and T. Schuermann. 2006. A General Approach to Integrated Risk Management With Skewed, Fat-Tailed Risks. Journal of Financial Economics 79(3): 569-614.
Roychowdhury, S. 2006. Earnings management through real activities manipulation. Journal of Accounting and Economics 42 (3): 335–370.
Salerno, D. 2014. The role of earnings quality in financial analyst forecast accuracy. The Journal of Applied Business Research 30 (1): 255-276.
Samanta, P. T., and J. Martinez. 2004. The PIM Approach to Assessing the TRM Practices of Financial Institutions. New York, NY: Standard & Poor’s/McGraw-Hill.
Schipper, K., and L. Vincent. 2003. Earnings quality. Accounting Horizons 17 (Supplement): 97–110.
Securities and Exchange Commission (SEC). 2000. Concept Release: International Accounting Standards. Release 33-7801, 34-42430, Washington, DC: SEC.
Teoh, S., I. Welch, and T. Wong. 1998. Earnings management and the underperformance of seasoned equity offerings. Journal of Financial Economics 50 (1): 63–99.
27
Table 1 Sample Selections
Panel A: Firms Total
Firm observations across between 2002 and 2014 in Compustat North America 20,338 Less: Missing values in CRSP and I/B/E/S between 2002 and 2014 (18,821) Firm observations available between 2002 and 2014 1,517 Less: Missing firm data in tested variables (462)
1,055 Less: Unable to match SEC 10-K filing for identifying enterprise risk management (269) Final sample firm observations 786
Panel B: Firm-year Observations
Firm observations across between 2002 and 2014 in Compustat North America 161,575 Less: Missing values in CRSP and I/B/E/S between 2002 and 2014 (142,642)Firm observations available between 2002 and 2014 18,933 Less: Missing firm-year data in tested variables (7,262)
11,761 Less: Unable to match SEC 10-K filing for identifying enterprise risk management (4,338) Final sample firm-year observations 7,333

28
Table 2 Variable Definition
Variables Definitions
ADACC = Absolute value of abnormal accruals estimated based on modified Jones model by two-digit SIC code and year.
DACC_P = Income-increasing discretionary accruals, which equals to abnormal accruals estimated based on modified Jones model by two-digit SIC code and year if the value is positiveand zero otherwise.
DACC_N = Income-decreasing discretionary accruals, which equals to (-1) times abnormal accrualsestimated based on modified Jones model by two-digit SIC code and year if the value is negative and zero otherwise.
FE = Forecast error, which is equal to the absolute value of the difference between actual earnings per share (EPS) and the median of final analyst forecasted EPS from I/B/E/Sprior to the earnings announcement scaled by stock price at the forecast date.
DISP = Forecast dispersion; the standard deviation of final analyst forecasted EPS from I/B/E/Sprior to the earnings announcement scaled by stock price at the forecast date.
Q = Q is used as a proxy for firm value and is measured as the sum of market value of equity and book value of liabilities deflated by book value of total assets.
SMALL = An indicator for small positive income, which is equal to one if net income deflated by average total assets is between 0.0 and 0.01 and equal to zero otherwise.
SURPRISE = An indicator for meet or beat analyst forecasts, which is equal to one if actual EPS is greater or equal to the median of final analyst forecasts from I/B/E/S prior to the earnings announcement and zero otherwise.
ERM = An indicator equal to one if the firm-year adopts enterprise risk management, and zero otherwise.
SIZE = The logarithm of market capitalization at the beginning of the year. LEV = Leverage calculated as total debts deflated by averaged total assets. ROA = Return on total assets. MTB = Market-to-book ratio. LOSS = An indicator equal to one if the firm has net loss in previous year and zero otherwise. VOL_E = The standard deviation of earnings before extraordinary items in past three years
deflated by averaged total assets. VOL_S = The standard deviation of sales in past three years deflated by averaged total assets. VOL_C = The standard deviation of net cash flows from operation in past three years deflated by
averaged total assets. ΔSALES = The percentage change in sales from the previous year. CYCLE = The logarithm of the average of [(Net Sales/360)/Average Accounts Receivable]+[(Cost
of Goods Sold/360)/Average Inventory], calculated from 2002 to 2014. REST = Restructuring charge scaled by the beginning total assets. AGE = The logarithm of the number of years the firm has CRSP data as of 2014. HHI = Herfindahl index measured as the sum of squared market shares (i.e., percentage of total
industry sales for all firms available in Compustat North America based on the firm’s primary two-digit SIC code.
FS = An indicator for financial firms (SIC codes between 6000 and 6999). INS = An indicator for insurance companies (SIC codes between 6311 and 6499). OTHER = An indicator for financial firms other than insurance companies (SIC codes between
6000 and 6299 and between 6500 and 6999).

29
Table 3 Descriptive Statistics
Panel A: Variables Distributions
Pooled Sample ERM=1 ERM=0 Variable N Mean SD N Mean SD N Mean SD DifferenceADACC 7,333 0.047 0.070 5,107 0.046 0.068 2,226 0.051 0.074 -0.005 ***DACC_P 7,333 0.021 0.048 5,107 0.020 0.045 2,226 0.025 0.053 -0.005 ***DACC_N 7,333 0.024 0.059 5,107 0.024 0.058 2,226 0.024 0.061 0.000 SMALL 6,927 0.691 0.312 4,701 0.890 0.313 2,226 0.893 0.310 -0.003 SURPRISE 6,927 0.677 0.468 4,701 0.666 0.472 2,226 0.703 0.457 -0.037 ***FE 7,188 0.061 0.964 5,027 0.037 0.222 2,161 0.117 1.725 -0.080 ***DISP 7,086 0.018 0.050 4,956 0.015 0.047 2,130 0.024 0.058 -0.009 ***Q 7,330 0.587 0.223 5,107 0.599 0.215 2,223 0.561 0.238 0.038 ***ERM 7,333 0.694 0.460 5,107 1.000 0.000 2,226 0.000 0.000 1.000 SIZE 7,333 8.913 1.594 5,107 9.273 1.517 2,226 8.809 1.455 0.464 ***LEV 7,333 0.243 0.181 5,107 0.241 0.169 2,226 0.246 0.206 -0.005 ROA 7,333 0.138 0.094 5,107 0.134 0.088 2,226 0.149 0.105 -0.015 MTB 7,333 1.824 7.151 5,107 1.889 7.983 2,226 1.677 4.716 0.212 ***LOSS 7,333 0.109 0.312 5,107 0.110 0.313 2,226 0.107 0.310 0.003 VOL_E 7,333 0.324 0.597 5,107 0.311 0.560 2,226 0.352 0.673 -0.041 ***VOL_S 7,333 1.098 1.338 5,107 0.982 1.274 2,226 1.365 1.439 -0.383 ***VOL_C 7,333 0.304 0.326 5,107 0.281 0.294 2,226 0.357 0.385 -0.076 ***ΔSALES 7,333 -0.005 0.023 5,107 -0.004 0.022 2,226 -0.010 0.024 0.006 ***CYCLE 7,333 3.782 1.154 5,107 3.858 1.170 2,226 3.609 1.099 0.249 ***REST 7,333 0.003 0.010 5,107 0.003 0.009 2,226 0.003 0.012 0.000 ** AGE 7,333 3.232 0.737 5,107 3.352 0.666 2,226 2.959 0.814 0.393 ***HHI 7,333 0.091 0.011 5,107 0.089 0.010 2,226 0.094 0.011 -0.005 *

30
Tab
le 3
(con
tinue
d)
Des
crip
tive
Stat
istic
s
Pane
l B: P
ears
on C
orre
latio
n M
atri
xV
aria
bles
AD
ACC
ER
M
SIZE
LE
VRO
A M
TBLO
SSVO
L_E
VOL_
S VO
L_C
ΔSA
LES
CYC
LERE
STAG
EH
HI
ADAC
C
1.00
0
ER
M
-0.0
38
1.00
0
SIZE
-0
.130
0.
342
1.00
0
LEV
-0.1
40
-0.0
13
0.12
3 1.
000
RO
A -0
.102
-0
.074
-0
.280
-0
.065
1.00
0
MTB
0.
199
0.01
37
-0.0
51
-0.1
30-0
.022
1.00
0
LOSS
0.
127
0.00
4 -0
.064
0.
099
-0.3
670.
077
1.00
0
VOL_
E 0.
131
-0.0
31
-0.2
31
-0.0
09-0
.222
20.
022
0.26
01.
000
VO
L_S
0.08
4 -0
.132
-0
.274
-0
.091
0.23
2 0.
007
0.00
00.
205
1.00
0
VOL_
C
0.16
8 -0
.106
-0
.306
-0
.080
0.21
3 0.
046
0.08
20.
397
0.40
4 1.
000
Δ
SALE
S 0.
021
0.12
2 0.
141
0.04
7-0
.206
-0.0
020.
159
-0.0
56-0
.193
-0
.128
1.00
0
CYC
LE
0.15
1 0.
099
0.22
5 -0
.068
-0.2
620.
118
0.03
1-0
.034
-0.1
95
-0.1
010.
034
1.00
0
REST
0.
023
0.02
4 -0
.076
0.
022
-0.0
43-0
.022
0.21
30.
085
-0.0
02
0.01
8 0.
134
0.01
2 1.
000
AG
E -0
.145
0.
245
0.36
7 0.
070
-0.0
45-0
.044
-0.0
58-0
.133
-0.1
62
-0.1
880.
093
0.08
9 0.
048
1.00
0
HH
I -0
.030
-0
.022
0.
011
0.04
70.
058
0.00
20.
008
-0.0
170.
073
0.00
4 0.
018
-0.1
51-0
.054
-0.0
741.
000
Num
bers
repo
rted
in b
old
and
italic
s rep
rese
nt st
rong
(p<0
.01)
or w
eak
(p<0
.05
or p
<0.1
) lev
els o
f sig
nific
ance
resp
ectiv
ely.

31
Table 4 Accruals Quality and Enterprise Risk Management
Expected Measures of Discretionary Accruals
Variables Sign ADACC DACC_P DACC_N ERM - -0.005*** -0.003** -0.001 (-3.23) (-2.04) (-0.79) SIZE - -0.087* -0.025* 0.003 (-1.66) (-1.77) (0.32) ROA - -0.030*** -0.015** -0.030*** (-3.09) (-2.26) (-3.53) MTB ? 0.001*** -0.001* 0.001*** (8.75) (-1.64) (9.18) LOSS + 0.014*** -0.004** 0.021*** (4.70) (-2.18) (8.22) VOL_E + 0.014*** 0.005*** 0.004 (3.74) (4.95) (0.33) VOL_S + 0.003*** 0.003*** 0.006 (4.42) (6.74) (0.01) VOL_C + 0.027*** 0.016*** 0.011*** (10.15) (8.42) (4.73)ΔSALES + 0.106*** 0.117*** -0.072** (1.59) (4.81) (-2.38) CYCLE + 0.019*** 0.001 0.005*** (7.86) (1.11) (6.71)LEV ? -0.035*** 0.007** -0.037*** (-7.28) (2.25) (-9.89) REST ? 0.163** 0.140** -0.111 (1.87) (2.34) (-1.52) AGE ? -0.011*** -0.006*** -0.004*** (-9.55) (-8.40) (-4.03) HHI ? -1.134 -0.969** -0.132 (-1.60) (-1.98) (-0.21) Fixed Effects Industry Industry Industry Year Year Year Obs 7,333 7,333 7,333 F value 45.88 19.19 35.76 Adjusted R2 0.123 0.064 0.127 All variables are defined in Table 2. ***, **, and * indicate two-sided statistical significance at the 1, 5 and 10% levels, respectively. Robust t-statistics based on standard errors clustered at firm level are reported in parentheses.

32
Table 5 Logistic Regressions of Small Positive Earnings and Earnings Surprise
on Enterprise Risk Management
Exp. Small Earnings Exp. Meet or Beat ForecastVariables Sign SMALL Sign SURPRISE ERM - -0.106* - -0.136*** [-2.90] [-12.86] SIZE ? -0.136*** ? 0.074*** [-37.80] [29.59] ROA - -12.609*** + 2.032*** [-56.12] [107.26] MTB - -0.015*** + 0.007* [-14.12] [3.70] VOL_E ? -0.385*** ? -0.046 [-61.21] [-2.63] VOL_S ? -0.007 ? 0.019 [-0.15] [1.96] VOL_C ? -0.144 ? -0.105* [-2.52] [-3.36] ΔSALES - -8.672*** + 1.335* [-48.97] [3.45] CYCLE + 0.097*** ? -0.035** [21.61] [-5.48] LEV - -1.292*** - -0.245*** [-85.95] [-7.51]REST - -35.58*** - 0.692 [-115.85] [0.14] AGE ? 0.045 ? -0.046* [1.41] [-3.80] HHI - -47.97** + -24.24 [-4.15] [-2.67] Fixed Effects Country Country Industry Industry Obs 6,927 6,927 Max-rescaled R2 0.480 0.048 All variables are defined in Table 2. ***, **, and * indicate two-sided statistical significance at the 1, 5 and 10% levels, respectively. Wald Chi-square values are reported in the brackets.

33
Table 6 Accruals Quality and Enterprise Risk Management in Financial Industry
Panel A:Accruals Quality and ERM in Financial Industry Exp. Measures of Discretionary Accruals Variables Sign ADACC ADACC DACC_P DACC_P DACC_N DACC_N ERM - -0.004** -0.004** -0.002*** -0.002* -0.001 -0.001 (-2.02) (-2.03) (-4.39) (-1.67) (-0.68) (-0.69) ERM*FIN - -0.007# -0.011# -0.003 (-1.32) (-1.46) (-0.70) ERM*INS - -0.024* -0.011*** -0.016# (-1.78) (-4.35) (-1.43) ERM*OTHER - -0.004 -0.007 -0.001 (-0.67) (-0.88) (-0.15) Controls Included Included Included Included Included IncludedFixed Effects Industry Industry Industry Industry Industry Industry Year Year Year Year Year Year Obs 7,333 7,333 7,333 7,333 7,333 7,333 F value 44.36 42.85 19.34 18.65 34.45 33.28Adjusted R2 0.159 0.159 0.067 0.067 0.127 0.127 Panel B: ERM in financial industry Exp. Small Earnings Meet or Beat Forecast Variables Sign SMALL SMALL SURPRISE SURPRISE ERM - -0.152** -0.155** -0.141*** -0.141*** [-6.19] [-6.35] [-15.05] [-15.11] ERM*FIN - -0.211# 0.059 [-2.17] [0.54] ERM*INS - -0.521** 0.136#
[-6.46] [1.77] ERM*OTHER - 0.093 -0.01 [0.24] [0.00] Controls Included Included Included Included Fixed Effects Industry Industry Industry Industry Year Year Year Year Obs 6,927 6,927 6,927 6,927 Max-rescaled R2 0.525 0.526 0.081 0.081 All variables are defined in Table 2. ***, **, and * indicate two-sided statistical significance at the 1, 5 and 10% levels, respectively. # represents one-sided statistical significance at 10% level. Robust t-statistics based on standard errors clustered at firm level are reported in parentheses. Wald Chi-square values are reported in the brackets.

34
Table 7 Regressions of Analysts’ Forecast Error, Forecast Dispersion, and Firm Value
on Enterprise Risk Management
Exp. Forecast Error Forecast Dispersion Exp. Firm Value Variables Sign FE DISP Sign Q ERM - -0.101*** -0.004*** + 0.023*** (-3.12) (-2.61) (4.10) SIZE ? -0.035*** -0.007*** + 0.006*** (-3.91) (-15.27) (3.39) ROA ? -0.332** -0.023*** + 0.564*** (-2.25) (-3.20) (23.04) MTB ? -0.001 0.012 + 0.001*** (-0.93) (1.60) (3.15) LOSS + -0.018 0.008*** - -0.023*** (-0.43) (3.85) (-3.11) VOL_E + 0.003 0.004*** ? -0.020*** (0.13) (4.14) (-5.61) VOL_S + 0.015 0.003*** ? 0.005*** (1.57) (5.38) (2.90) VOL_C + 0.041 0.021*** ? -0.028*** (0.99) (10.04) (-3.93)ΔSALES ? 0.294 0.027 + 0.139 (0.55) (1.04) (1.53) CYCLE + 0.020* 0.004*** + 0.008*** (1.81) (6.80) (4.56)LEV ? -0.032 -0.007*** ? -0.731*** (-0.48) (-2.35) (-6.25) REST ? -1.340 -0.132** ? -0.015 (-1.11) (-2.07) (-0.07) AGE ? 0.002 0.002 ? 0.031*** (0.14) (0.19) (10.40) HHI ? -5.602 -0.470 + 7.221*** (-0.52) (-0.90) (3.96) Fixed Effects Industry Industry Industry Year Year Year Obs 7,188 7,086 7,330 F value 2.40 38.20 241.02 Adjusted R2 0.015 0.125 0.474 All variables are defined in Table 2. ***, **, and * indicate two-sided statistical significance at the 1, 5 and 10% levels, respectively. Robust t-statistics based on standard errors clustered at firm level are reported in parentheses.

35
Table 8 Robustness Checks for the Magnitude of Discretionary Accruals
Heckman Test Propensity-Score Exp. First-Stage Est. Second-Stage Est.3 Matched Sample
Variables Sign Pr(ERM=1) ADACC ADACC ERM - -0.004* -0.006* (-1.83) (-1.69) SIZE ? 0.924*** -0.039* 0.058 [57.94] (-1.82) (0.75) ROA ? -2.148*** -0.031*** -0.036** [20.23] (-3.17) (-2.16)MTB ? 0.001*** 0.002*** (8.78) (7.33) LOSS + 0.013*** 0.018*** (4.63) (3.43) VOL_E + 0.128** 0.005*** 0.006** [4.73] (3.81) (2.01)VOL_S + 0.003*** 0.002* (4.31) (1.77) VOL_C + 0.027*** 0.034*** (10.07) (6.67) ΔSALES ? 0.057 0.156*** (1.63) (2.58) CYCLE + 0.088*** 0.006*** 0.005*** [4.33] (7.91) (3.27) LEV ? -0.642*** -0.031*** -0.022*** [8.49] (-7.32) (-3.29) REST ? -0.011 0.137 (-0.13) (0.72) AGE ? 0.258*** -0.010*** -0.009*** [17.87] (-7.62) (-4.51)HHI ? -1.102 0.135 (-1.55) (1.51) Inverse Mills Ratio 0.002* (1.72) Fixed Effects Industry Industry Industry Year Year Obs 7,333 7,333 2,144 F value - 44.41 12.06 Max-rescaled R2 /Adjusted R2 0.421 0.159 0.137 All variables are defined in Table 2. ***, **, and * indicate two-sided statistical significance at the 1, 5 and 10% levels, respectively. Robust t-statistics based on standard errors clustered at firm level are reported in parentheses. Wald Chi-square values are reported in the brackets.
3 For parsimony we report only the second-stage estimate regarding ADACC. The results with other alternate
dependent variables are similar to the main tests except DACC_P, which is not significantly related to ERM.