Embed Size (px)
Citation preview

[1] Oracle® Enterprise ManagerVirtual Infrastructure Plug-in Metric Reference Manual
13c Release 1 (13.1.0.1)
E68614-02
February 2016

Oracle Enterprise Manager Virtual Infrastructure Plug-in Metric Reference Manual, 13c Release 1 (13.1.0.1)
E68614-02
Copyright © 2011, 2016 Oracle and/or its affiliates. All rights reserved.
This software and related documentation are provided under a license agreement containing restrictions on use and disclosure and are protected by intellectual property laws. Except as expressly permitted in your license agreement or allowed by law, you may not use, copy, reproduce, translate, broadcast, modify, license, transmit, distribute, exhibit, perform, publish, or display any part, in any form, or by any means. Reverse engineering, disassembly, or decompilation of this software, unless required by law for interoperability, is prohibited.
The information contained herein is subject to change without notice and is not warranted to be error-free. If you find any errors, please report them to us in writing.
If this is software or related documentation that is delivered to the U.S. Government or anyone licensing it on behalf of the U.S. Government, then the following notice is applicable:
U.S. GOVERNMENT END USERS: Oracle programs, including any operating system, integrated software, any programs installed on the hardware, and/or documentation, delivered to U.S. Government end users are "commercial computer software" pursuant to the applicable Federal Acquisition Regulation and agency-specific supplemental regulations. As such, use, duplication, disclosure, modification, and adaptation of the programs, including any operating system, integrated software, any programs installed on the hardware, and/or documentation, shall be subject to license terms and license restrictions applicable to the programs. No other rights are granted to the U.S. Government.
This software or hardware is developed for general use in a variety of information management applications. It is not developed or intended for use in any inherently dangerous applications, including applications that may create a risk of personal injury. If you use this software or hardware in dangerous applications, then you shall be responsible to take all appropriate fail-safe, backup, redundancy, and other measures to ensure its safe use. Oracle Corporation and its affiliates disclaim any liability for any damages caused by use of this software or hardware in dangerous applications.
Oracle and Java are registered trademarks of Oracle and/or its affiliates. Other names may be trademarks of their respective owners.
Intel and Intel Xeon are trademarks or registered trademarks of Intel Corporation. All SPARC trademarks are used under license and are trademarks or registered trademarks of SPARC International, Inc. AMD, Opteron, the AMD logo, and the AMD Opteron logo are trademarks or registered trademarks of Advanced Micro Devices. UNIX is a registered trademark of The Open Group.
This software or hardware and documentation may provide access to or information about content, products, and services from third parties. Oracle Corporation and its affiliates are not responsible for and expressly disclaim all warranties of any kind with respect to third-party content, products, and services unless otherwise set forth in an applicable agreement between you and Oracle. Oracle Corporation and its affiliates will not be responsible for any loss, costs, or damages incurred due to your access to or use of third-party content, products, or services, except as set forth in an applicable agreement between you and Oracle.

Contents
Preface ................................................................................................................................................................ vii
Audience...................................................................................................................................................... viiDocumentation Accessibility .................................................................................................................... viiRelated Documents .................................................................................................................................... viiConventions ................................................................................................................................................ vii
How to Use This Manual ........................................................................................................................... ix
Structure of This Manual............................................................................................................................ ixBackground Information on Metrics, Thresholds, and Alerts .............................................................. xTroubleshooting Metrics ............................................................................................................................ xi
1 Oracle Compute Site
1.1 Load .............................................................................................................................................. 1-11.1.1 CPU Utilization (%) ............................................................................................................. 1-11.1.2 Memory Utilization (%) ...................................................................................................... 1-11.2 Oracle Compute SNMP System Log Events ........................................................................... 1-11.2.1 Event Time............................................................................................................................ 1-21.2.2 Event Details......................................................................................................................... 1-21.2.3 Event Status .......................................................................................................................... 1-21.3 Oracle Compute Orchestration Status ..................................................................................... 1-21.3.1 Name ..................................................................................................................................... 1-21.3.2 Message ................................................................................................................................. 1-31.3.3 Status ..................................................................................................................................... 1-31.4 Response....................................................................................................................................... 1-31.4.1 Status ..................................................................................................................................... 1-31.5 Oracle Compute Service Count Information .......................................................................... 1-31.5.1 Service Name........................................................................................................................ 1-31.5.2 Absolute Maximum............................................................................................................. 1-41.5.3 Absolute Minimum ............................................................................................................. 1-41.5.4 Current number of Nodes running the service ............................................................... 1-41.5.5 Is Service Count in Range................................................................................................... 1-4
2 Oracle Compute Cluster
2.1 Load .............................................................................................................................................. 2-12.1.1 CPU Utilization (%) ............................................................................................................. 2-1
iii

2.1.2 Memory Utilization (%) ...................................................................................................... 2-12.2 Oracle Compute Identifiers ....................................................................................................... 2-12.2.1 Server Name ......................................................................................................................... 2-12.2.2 Virtual Platform UUID........................................................................................................ 2-22.2.3 Virtual Platform IP Address............................................................................................... 2-22.3 Oracle Server Response.............................................................................................................. 2-22.3.1 Target Identifier ................................................................................................................... 2-22.3.2 State........................................................................................................................................ 2-22.3.3 Status ..................................................................................................................................... 2-22.4 Oracle Virtual Platform Response ............................................................................................ 2-32.4.1 Target Identifier ................................................................................................................... 2-32.4.2 State........................................................................................................................................ 2-32.4.3 Status ..................................................................................................................................... 2-32.5 Oracle Virtual Platform Load.................................................................................................... 2-32.5.1 Physical Server Memory Free (MB) .................................................................................. 2-32.5.2 Physical Server Memory used (MB).................................................................................. 2-32.5.3 Physical Server Memory utilization (%)........................................................................... 2-42.5.4 Physical Server Swap Memory used (MB)....................................................................... 2-42.5.5 Physical Server Swap utilization (%) ................................................................................ 2-42.5.6 Target Separator................................................................................................................... 2-42.6 Dom0 Load................................................................................................................................... 2-42.6.1 CPU utilization (%).............................................................................................................. 2-42.6.2 Local Disk space utilization (%)......................................................................................... 2-52.6.3 Logical memory free (MB).................................................................................................. 2-52.6.4 Memory free (MB) ............................................................................................................... 2-52.6.5 Used Logical Memory (%).................................................................................................. 2-52.6.6 Memory used (MB).............................................................................................................. 2-62.6.7 Memory utilization (%)....................................................................................................... 2-62.6.8 Number of virtual machines .............................................................................................. 2-62.6.9 Total Processes ..................................................................................................................... 2-62.6.10 Swap space used (MB) ........................................................................................................ 2-62.6.11 Swap space utilization(%) .................................................................................................. 2-72.6.12 Target Separator................................................................................................................... 2-72.7 Oracle Virtual Platform Network Activity.............................................................................. 2-72.7.1 Read throughput (MB per second).................................................................................... 2-72.7.2 Total throughput (MB per second).................................................................................... 2-72.7.3 Write throughput (MB per second)................................................................................... 2-82.7.4 Interface Name..................................................................................................................... 2-82.7.5 Target Separator (Network Activity)................................................................................ 2-82.8 Oracle Virtual Server Response ................................................................................................ 2-82.8.1 Target Identifier ................................................................................................................... 2-82.8.2 State........................................................................................................................................ 2-82.8.3 Status ..................................................................................................................................... 2-82.9 Oracle Virtual Server Load........................................................................................................ 2-92.9.1 Relative CPU utilization of the virtual machine (%) ...................................................... 2-92.9.2 Target Separator................................................................................................................... 2-9
iv

3 Oracle Compute Orchestration
3.1 Oracle Compute Orchestration State ....................................................................................... 3-13.1.1 Message ................................................................................................................................. 3-13.1.2 State........................................................................................................................................ 3-13.2 Response....................................................................................................................................... 3-23.2.1 Status ..................................................................................................................................... 3-2
4 Oracle Virtual Platform
4.1 Basic Configuration Details ...................................................................................................... 4-14.1.1 Platform Version .................................................................................................................. 4-14.1.2 Allocated CPU...................................................................................................................... 4-14.1.3 Allocated Memory (MB) ..................................................................................................... 4-14.2 Network Activity ....................................................................................................................... 4-24.2.1 Interface NAME ................................................................................................................... 4-24.2.2 Total throughput (MB per second).................................................................................... 4-24.2.3 Read throughput (MB per second).................................................................................... 4-24.2.4 Write throughput (MB per second)................................................................................... 4-24.3 Network Activity Summary...................................................................................................... 4-34.3.1 Highest Read Throughput (MB per second).................................................................... 4-34.3.2 Highest Total Throughput (MB per second) ................................................................... 4-34.3.3 Highest Write Throughput (MB per second)................................................................... 4-34.3.4 Total throughput (MB per second).................................................................................... 4-34.4 Network Configuration ............................................................................................................. 4-44.4.1 Interface Name..................................................................................................................... 4-44.4.2 MAC Address....................................................................................................................... 4-44.4.3 IP Address............................................................................................................................. 4-44.4.4 Gateway ................................................................................................................................ 4-44.4.5 Netmask ................................................................................................................................ 4-44.4.6 Bandwidth ............................................................................................................................ 4-44.5 Oracle Virtual Server ................................................................................................................. 4-54.5.1 Server Virtual Id................................................................................................................... 4-54.6 Response....................................................................................................................................... 4-54.6.1 Status ..................................................................................................................................... 4-54.7 Server Load .................................................................................................................................. 4-54.7.1 Physical Server Memory Free (MB) .................................................................................. 4-54.7.2 Physical Server Memory used (MB).................................................................................. 4-54.7.3 Physical Server Memory utilization (%)........................................................................... 4-64.7.4 Physical Server Swap Memory used (MB)....................................................................... 4-64.7.5 Physical Server Swap utilization (%) ................................................................................ 4-6
5 Oracle Virtual Server
5.1 Basic Configuration Details ...................................................................................................... 5-15.1.1 Allocated CPU...................................................................................................................... 5-15.1.2 Allocated Memory (MB) ..................................................................................................... 5-15.1.3 DNS Zone.............................................................................................................................. 5-15.1.4 Guest UUID .......................................................................................................................... 5-2
v

5.1.5 IP Address............................................................................................................................. 5-25.2 Load ............................................................................................................................................. 5-25.2.1 Relative CPU utilization of the virtual machine (%) ...................................................... 5-25.3 Response....................................................................................................................................... 5-25.3.1 Status ..................................................................................................................................... 5-2
6 Oracle Server
6.1 Hardware Configuration .......................................................................................................... 6-16.1.1 Machine Architecture.......................................................................................................... 6-16.1.2 Clock Frequency (MHz)...................................................................................................... 6-16.1.3 CPU Count............................................................................................................................ 6-16.1.4 Number of Sockets............................................................................................................... 6-16.1.5 Total CPU Cores................................................................................................................... 6-26.1.6 CPU Cores Per Socket ......................................................................................................... 6-26.1.7 CPU Threads Per Core ........................................................................................................ 6-26.1.8 Enabled CPU Cores ............................................................................................................. 6-26.1.9 Local Disk Space (GB) ......................................................................................................... 6-26.2 Network Configuration.............................................................................................................. 6-26.2.1 Interface Name..................................................................................................................... 6-26.2.2 MAC Address....................................................................................................................... 6-36.2.3 Bandwidth ............................................................................................................................ 6-36.3 Response....................................................................................................................................... 6-36.3.1 Status ..................................................................................................................................... 6-3
vi

Preface
This manual is a compilation of the Oracle Virtual Infrastructure metrics provided in Oracle Enterprise Manager.
AudienceThis document is intended for Oracle Enterprise Manager users interested in Oracle Virtual Infrastructure metrics.
Documentation AccessibilityFor information about Oracle's commitment to accessibility, visit the Oracle Accessibility Program website at http://www.oracle.com/pls/topic/lookup?ctx=acc&id=docacc.
Access to Oracle SupportOracle customers that have purchased support have access to electronic support through My Oracle Support. For information, visit http://www.oracle.com/pls/topic/lookup?ctx=acc&id=info or visit http://www.oracle.com/pls/topic/lookup?ctx=acc&id=trs if you are hearing impaired.
Related DocumentsFor more information, see the following documents in the Oracle Enterprise Manager 12c documentation set:
■ Enterprise Manager Cloud Administration Guide
■ Enterprise Manager Cloud Control Administrator's Guide
ConventionsThe following text conventions are used in this document:
Convention Meaning
boldface Boldface type indicates graphical user interface elements associated with an action, or terms defined in text or the glossary.
italic Italic type indicates book titles, emphasis, or placeholder variables for which you supply particular values.
vii

monospace Monospace type indicates commands within a paragraph, URLs, code in examples, text that appears on the screen, or text that you enter.
Convention Meaning
viii

How to Use This Manual
The Oracle Enterprise Manager Oracle Virtual Infrastructure Metric Reference Manual (hereafter referred to as the Oracle Virtual Infrastructure Metric Reference Manual) lists all the Oracle Virtual Infrastructure target metrics that Enterprise Manager monitors.
This preface describes:
■ Structure of This Manual
■ Background Information on Metrics, Thresholds, and Alerts
■ Troubleshooting Metrics
Structure of This ManualThis manual contains a chapter for each target for which there are metrics.
The metrics in each chapter are in alphabetical order according to category.
Metric InformationThe information for each metric comprises a description, summary of the metric’s "vital statistics", data source (if available), and user action. The following list provides greater detail:
■ Description
Explanation following the metric name. This text defines the metric and, when available, provides additional information pertinent to the metric.
■ Metric Summary
Explains in table format the target version, collection frequency, default warning threshold, default critical threshold, and alert text for the metric.
■ Data Source
How the metric is calculated. In some metrics, data source information is not available.
■ User Action
Suggestions of how to solve the problem causing the alert.
Examples of Metric Summary TablesThis section provides examples of Metric Summary tables you will see in this guide.
ix

When default thresholds are not defined for a metric, only the target version and collection frequency are available.
Definitions of Columns in Metric Summary TablesAs previously mentioned, the Metric Summary table is part of the overall metric information. The following table provides descriptions of columns in the Metric Summary table.
Background Information on Metrics, Thresholds, and AlertsAn event is a significant occurrence on a managed target that typically indicates something has occurred outside normal operating conditions, such as a performance threshold violation, an unapproved change in application configuration files, or job failure. An event can also be raised to signal successful operations or a job successfully completed.
Existing Enterprise Manager customers may be familiar with metric alerts and metric collection errors. For Enterprise Manager 12c, metric alerts are a type of event. A metric alert event is generated when an alert occurs for a metric on a specific target (Example: CPU utilization for a host target) or a metric on a target and object combination (Example: Space usage on a specific tablespace of a database target.)
Thresholds are boundary values against which monitored metric values are compared. For example, for each disk device associated with the Disk Utilization (%) metric, you can define a different warning and critical threshold. Some of the thresholds are predefined by Oracle, others are not.
When a threshold is reached, an alert is generated. This alert is an indicator signifying that a particular condition has been encountered and is triggered when one of the following conditions is true:
■ A threshold is reached.
■ An alert has been cleared.
Target Version Collection Frequency
All Versions Every 15 Minutes
Column Header Column Definition
Target Version Version of the target, for example, 9.0.2.x and 10.1.0.x. The x at the end of a version (for example, 9.0.2.x) represents the subsequent patchsets associated with that release.
Collection Frequency The rate at which the Management Agent collects data. The collection frequency for a metric comes from the Enterprise Manager default collection file for that target type.
Default Warning Threshold
Value that indicates whether a warning alert should be initiated. If the evaluation of the warning threshold value returns a result of TRUE for the specified number of consecutive occurrences defined for the metric, an alert triggers at the warning severity level.
Default Critical Threshold
Value that indicates whether a critical alert should be initiated. If the evaluation of the critical threshold value returns a result of TRUE for the specified number of consecutive occurrences defined for the metric, an alert triggers at the critical severity level.
Alert Text Message indicating why the alert was generated. Words that display between percent signs (%) denote variables. For example, Disk Utilization for %keyValue% is %value%% could translate to Disk Utilization for d0 is 80%.
x

■ The availability of a monitored service changes. For example, the availability of an application server changes from up to down.
■ A specific condition occurs. For example, an alert is triggered whenever an error message is written to a database alert log file.
Alerts are detected through a polling-based mechanism by checking for the monitored condition from a separate process at regular, predefined intervals.
EditingOut of the box, Enterprise Manager comes with thresholds for critical metrics. Warning and critical thresholds are used to generate an alert, letting you know of impending problems so that you can address them in a timely manner.
To better suit the monitoring needs of your organization, you can edit the thresholds provided by Enterprise Manager and define new thresholds. When defining thresholds, the key is to choose acceptable values to avoid unnecessary alerts, while still being notified of issues in a timely manner.
You can establish thresholds that will provide pertinent information in a timely manner by defining metric baselines that reflect how your system runs for a normal period of time.
The metrics listed on the Edit Thresholds page are either default metrics provided by Oracle or metrics whose thresholds you can change.
Specifying Multiple ThresholdsThe Specifying Multiple Thresholds functionality allows you to define various subsets of data that can have different thresholds. By specifying multiple thresholds, you can refine the data used to trigger alerts, which are one of the key benefits of using Enterprise Manager.
The key in specifying multiple thresholds is to determine how the comparison relates to the metric threshold as a whole. What benefit will be realized by defining a more stringent or lax threshold for that particular device, mount point, and so on?
For example, using the Average Disk I/O Service Time metric, you can define warning and critical thresholds to be applied to all disks (sd0 and sd1), or you can define different warning and critical thresholds for a specific disk (sd0). This allows you to adjust the thresholds for sd0 to be more stringent or lax for that particular disk.
Accessing Metrics Using the Cloud Control ConsoleTo access metrics in the Cloud Control Console, use the All Metrics page associated with a particular target by doing the following:
1. From the Cloud Control Console, choose the target.
2. On the target’s home page, click All Metrics in the Related Links section.
3. On the All Metrics page, choose the metric of interest.
Troubleshooting MetricsIn the unlikely situation that a metric does not report a correct value, you must determine if the problem is related to the:
See Also: See the Oracle Enterprise Manager Concepts manual and the Enterprise Manager online help for additional information about metrics, thresholds, and alerts
xi

■ Metric providing the wrong values or failing with an error, or
■ If the problem is after the Management Agent in the execution flow of the metric, that is, the metric value is correct but, for some reason, the data is not reaching the Oracle Management Service.
To aid you in this determination, Oracle provides the Metric Browser; a troubleshooting tool that can be used with Enterprise Manager to see the raw data being collected by the Management Agent.
Accessing the Metric BrowserWhen enabled, the Metric Browser can be accessed using a web browser, for example, Netscape, Firefox, and Internet Explorer, using a URL of the form:
http|https://agent_hostname:agent_port/emd/browser/main
for example
http://myServer.myDomain:3872/emd/browser/main
The Management Agent URL, listed in the output to that command, needs only to have browser placed between emd and main.
By default, the Metric Browser is disabled. When the Metric Browser is disabled, you receive the following error:
HTTP Error 403 - Forbidden if the metric browser has not been enabled.
How to Enable the Metric Browser and the Management Agent Browser for the Oracle Management AgentFollow these steps to enable the Metric Browser.
1. The Metric Browser is enabled by setting the enableMetricBrowser property in the Management Agent's emd.properties file. The location of that file depends on the type of Management Agent you are working with:
■ For the Cloud Control (central|standalone) Management Agent, the file is:
AGENT_HOME/sysman/config/emd.properties
■ For a clustered (RAC) Management Agent install, the file is:
AGENT_HOME/hostname/sysman/config/emd.properties
■ For the Database Control Management Agent, the file is:
DATABASE_HOME/hostname_SID/sysman/config/emd.properties
■ For Application Server Control Management Agent, the file is:
AS_HOME/sysman/config/emd.properties
2. Make a backup copy of the emd.properties file.
3. Edit the file and locate the line that reads:
#To enable the metric browser, uncomment the following line
Note: You can determine the protocol (http or https), the host name, and the Management Agent port that should be used from the output of the following command (run on the Management Agent host):
agent_home/bin/emctl status agent
xii

#This is a reloadable parameter##enableMetricBrowser=true
4. Uncomment the line: #enableMetricBrowser=true, so that it reads:
enableMetricBrowser=true
5. Reload the Management Agent Configuration using the command:
AGENT_HOME/bin/emctl reload agent
6. After reloading the Management Agent, the Metric Browser will be enabled and therefore accessible using a browser.
Running the Metric Collection Outside the Management AgentRunning the metric collection outside the Management Agent is specific to each metric and requires a firsthand knowledge of each specific metric. Each metric has its own method of collecting its data and some metrics cannot be run standalone because they are calculated from other metrics.
An example of running the metric collection outside the Management Agent is the command line.
xiii

xiv

1
1Oracle Compute Site[2] An Oracle Compute Site is a location running Oracle Compute Director with one or more clusters. This chapter describes the metrics defined for the Oracle Compute Site target type.
For more information about Oracle Compute Site targets, see the Oracle Enterprise Manager Cloud Administration Guide.
1.1 LoadThis metric category describes the Oracle Compute Site Load metrics.
1.1.1 CPU Utilization (%)This metric provides the average CPU utilization of all Dom0 in the site.
1.1.2 Memory Utilization (%)This metric displays the percentage of memory utilization of the Oracle Compute Site target.
1.2 Oracle Compute SNMP System Log EventsThis metric category describes the metrics associated with SNMP system log events.
Target VersionCollection Frequency
Default Warning Threshold
Default Critical Threshold Alert Text
All Versions Every 5 Minutes Not Defined Not Defined CPU Utilization is %value%%%, crossed warning (%warning_threshold%) or critical (%critical_threshold%) threshold.
Target VersionCollection Frequency
Default Warning Threshold
Default Critical Threshold Alert Text
All Versions Every 5 Minutes Not Defined Not Defined Memory Utilization is %value%%%, crossed warning (%warning_threshold%) or critical (%critical_threshold%) threshold.
Oracle Compute Site 1-1

Oracle Compute Orchestration Status
1.2.1 Event TimeThis metric displays the time when the SNMP Event was generated.
1.2.2 Event DetailsThis metric displays the message that is received as part of the SNMP Trap.
1.2.3 Event StatusThis metric displays the severity of the generated SNMP Event and this is the metric on which the thresholds are set. The following are the possible values for the Event status:
■ emergency(0)
■ alert(1)
■ critical (2)
■ error (3)
■ warning (4)
■ notice (5)
■ informational (6)
■ debug (7)
1.3 Oracle Compute Orchestration StatusThis metric category describes the metrics associated with the Oracle Compute Orchestration status.
1.3.1 NameThe metric displays the name of the Orchestration.
Target Version Collection Frequency
All Versions N/A
Target Version Collection Frequency
All Versions N/A
Target VersionCollection Frequency
Default Warning Threshold
Default Critical Threshold Alert Text
All Versions N/A Not Defined Not Defined SNMP Critical System Log Detail: %ocEventDetails% (SNMP EventTime: %ocEventTime% (epoch format)).
Target Version Collection Frequency
All Versions Every 15 Minutes
1-2 Oracle Enterprise Manager Virtual Infrastructure Plug-in Metric Reference Manual

Oracle Compute Service Count Information
1.3.2 MessageThis metric captures errors or warnings only if they are available for the Orchestration.
1.3.3 StatusThis metric captures the state of the orchestration. Possible values for the state:
■ ready
■ stopping
■ shutting_down
■ warning
■ stopped
■ shut_down
■ starting
■ restarting
■ error
■ unavailable
1.4 ResponseThis metric category provides the status of the Oracle Compute Site target, that is, whether it is up or down.
1.4.1 StatusThis metric displays the reported status of the Oracle Compute Site. The value of this metric determines if the target is up or down in Enterprise Manager.
1.5 Oracle Compute Service Count InformationThis metric category describes the metrics associated with the Oracle Compute Service count information.
1.5.1 Service NameThis metric displays the name of the service running in the Compute Site.
Target Version Collection Frequency
All Versions Every 15 Minutes
Target VersionCollection Frequency
Default Warning Threshold
Default Critical Threshold Alert Text
All Versions Every 15 Minutes Not Defined error Oracle Compute Orchestration : %keyvalue% is in error status.
Target VersionCollection Frequency
Default Warning Threshold
Default Critical Threshold Alert Text
All Versions Every 1 Minute Not Defined 0 Oracle Compute %target% is down
Oracle Compute Site 1-3

Oracle Compute Service Count Information
1.5.2 Absolute MaximumThis metric displays the maximum number of nodes on which the service can be hosted.
1.5.3 Absolute MinimumThis metric displays the minimum number of nodes on which the service can be hosted.
1.5.4 Current number of Nodes running the serviceThis metric displays the current number of nodes on which the service is being hosted.
1.5.5 Is Service Count in RangeThis is a computed metric having possible values as Yes or No.
Target Version Collection Frequency
All Versions Every 5 Minutes
Target Version Collection Frequency
All Versions Every 5 Minutes
Target Version Collection Frequency
All Versions Every 5 Minutes
Target VersionCollection Frequency
Default Warning Threshold
Default Critical Threshold Alert Text
All Versions Every 5 Minutes Not Defined Not Defined Oracle Compute Service:%keyvalue% is running on %current_service_count% nodes, fallen below warning (%warning_threshold%) or critical (%critical_threshold%) threshold.
Target VersionCollection Frequency
Default Warning Threshold
Default Critical Threshold Alert Text
All Versions Every 5 Minutes Not Defined No Oracle Compute Service:%keyvalue% is running on %current_service_count% nodes and has either fallen below minimum value %abs_min% or risen above maximum value %abs_max%
1-4 Oracle Enterprise Manager Virtual Infrastructure Plug-in Metric Reference Manual

2
2Oracle Compute Cluster[3] An Oracle Compute cluster is a group of at least three physical nodes running Oracle Compute software on the same Ethernet domain. This chapter describes the metrics defined for the Oracle Compute cluster target type.
For more information about Oracle Compute Cluster targets, see the Oracle Enterprise Manager Cloud Administration Guide.
2.1 LoadThis metric category describes the Oracle Compute Cluster Load metrics.
2.1.1 CPU Utilization (%)This metric displays the average CPU utilization of all Dom0 in the site.
2.1.2 Memory Utilization (%)This metric displays the average memory utilization of all Dom0 in the site.
2.2 Oracle Compute IdentifiersThis metric category describes the metrics associated with Oracle Compute Identifiers.
2.2.1 Server NameThis metric displays the name of the Oracle VM instance.
Target VersionCollection Frequency
Default Warning Threshold
Default Critical Threshold Alert Text
All Versions Every 5 Minutes Not Defined Not Defined CPU Utilization is %value%%%, crossed warning (%warning_threshold%) or critical (%critical_threshold%) threshold.
Target VersionCollection Frequency
Default Warning Threshold
Default Critical Threshold Alert Text
All Versions Every 5 Minutes Not Defined Not Defined Memory Utilization is %value%%%, crossed warning (%warning_threshold%) or critical (%critical_threshold%) threshold.
Oracle Compute Cluster 2-1

Oracle Server Response
2.2.2 Virtual Platform UUIDThis metric displays the UUID of the Oracle compute node on which the VM instance is running.
2.2.3 Virtual Platform IP AddressThis metric displays the IP address of the Oracle compute node on which the VM instance is running.
2.3 Oracle Server ResponseThis metric category describes the metrics associated with the response status of the target.
2.3.1 Target IdentifierThis metric specifies the destination target instance to which the metric data will be forwarded.
2.3.2 StateThis metric displays the state of the Oracle compute node.
2.3.3 StatusThis metric provides the value for Response:Status metric for the Oracle Server target instance
Target Version Collection Frequency
All Versions Every 5 Minutes
Target Version Collection Frequency
All Versions Every 5 Minutes
Target Version Collection Frequency
All Versions Every 5 Minutes
Target Version Collection Frequency
All Versions Every 1 Minute
Target Version Collection Frequency
All Versions Every1 Minute
Target Version Collection Frequency
All Versions Every 1 Minute
2-2 Oracle Enterprise Manager Virtual Infrastructure Plug-in Metric Reference Manual

Oracle Virtual Platform Load
2.4 Oracle Virtual Platform ResponseThis metric category describes the metrics associated with the response status of the Oracle Virtual Platform target instance.
2.4.1 Target IdentifierThis metric specifies the destination target instance to which the metric data will be forwarded.
2.4.2 StateThis metric displays the state of the Oracle compute node.
2.4.3 StatusThis metric provides the value for the Response:Status metric for the Oracle Virtual Platform target instance
2.5 Oracle Virtual Platform LoadThis metric category describes the load metrics associated with the Oracle Virtual Platform.
2.5.1 Physical Server Memory Free (MB)This metric displays the free memory in MB excluding the Dom0
2.5.2 Physical Server Memory used (MB)This metric displays the used memory in MB excluding the Dom0
Target Version Collection Frequency
All Versions Every 1 Minute
Target Version Collection Frequency
All Versions Every 1 Minute
Target Version Collection Frequency
All Versions Every 1 Minute
Target VersionCollection Frequency
Default Warning Threshold
Default Critical Threshold Alert Text
All Versions Every 5 Minutes Not Defined Not Defined Oracle Virtual Platform's free memory is %value% MB, gone below warning (%warning_threshold%) or critical (%critical_threshold%) threshold.
Target Version Collection Frequency
All Versions Every 5 Minutes
Oracle Compute Cluster 2-3
Dom0 Load
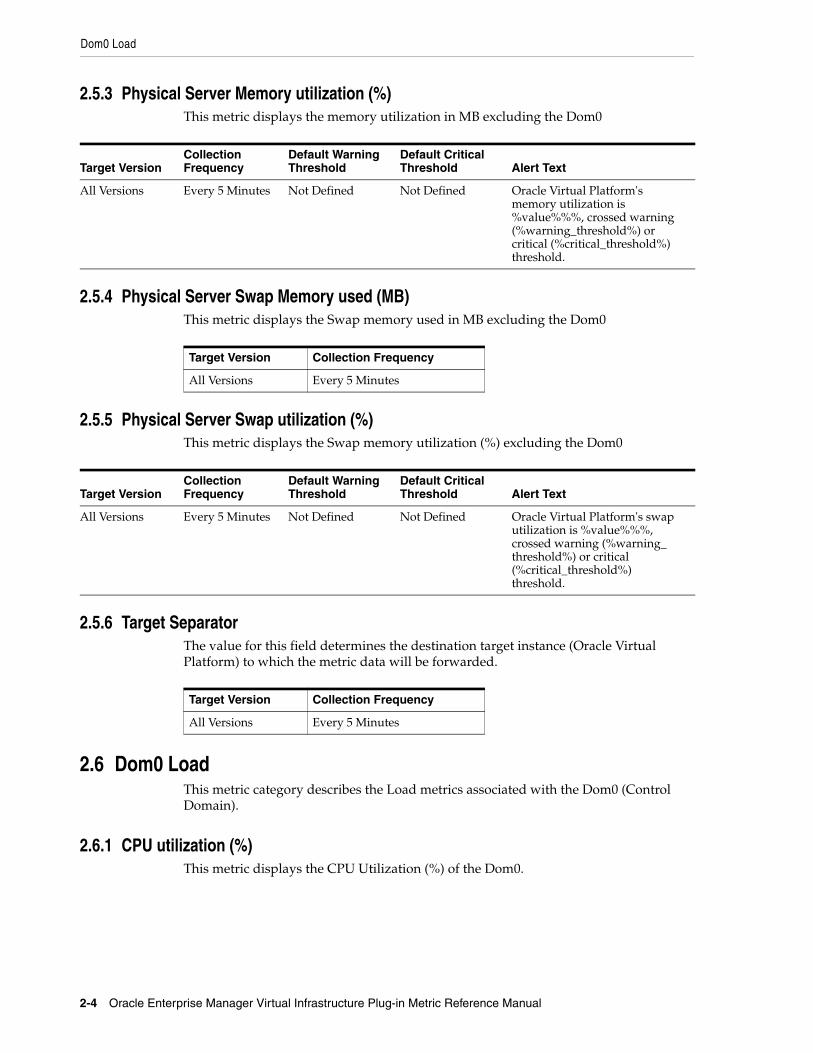
2.5.3 Physical Server Memory utilization (%)This metric displays the memory utilization in MB excluding the Dom0
2.5.4 Physical Server Swap Memory used (MB)This metric displays the Swap memory used in MB excluding the Dom0
2.5.5 Physical Server Swap utilization (%)This metric displays the Swap memory utilization (%) excluding the Dom0
2.5.6 Target SeparatorThe value for this field determines the destination target instance (Oracle Virtual Platform) to which the metric data will be forwarded.
2.6 Dom0 LoadThis metric category describes the Load metrics associated with the Dom0 (Control Domain).
2.6.1 CPU utilization (%)This metric displays the CPU Utilization (%) of the Dom0.
Target VersionCollection Frequency
Default Warning Threshold
Default Critical Threshold Alert Text
All Versions Every 5 Minutes Not Defined Not Defined Oracle Virtual Platform's memory utilization is %value%%%, crossed warning (%warning_threshold%) or critical (%critical_threshold%) threshold.
Target Version Collection Frequency
All Versions Every 5 Minutes
Target VersionCollection Frequency
Default Warning Threshold
Default Critical Threshold Alert Text
All Versions Every 5 Minutes Not Defined Not Defined Oracle Virtual Platform's swap utilization is %value%%%, crossed warning (%warning_threshold%) or critical (%critical_threshold%) threshold.
Target Version Collection Frequency
All Versions Every 5 Minutes
2-4 Oracle Enterprise Manager Virtual Infrastructure Plug-in Metric Reference Manual

Dom0 Load
2.6.2 Local Disk space utilization (%)This metric displays the Disk space Utilization (%) of the Dom0
2.6.3 Logical memory free (MB)This metric displays the Logical free memory in MB of the Dom0
2.6.4 Memory free (MB)This metric displays the free memory in MB of the Dom0
2.6.5 Used Logical Memory (%)This metric displays the logical memory utilization in (%) of the Dom0
Target VersionCollection Frequency
Default Warning Threshold
Default Critical Threshold Alert Text
All Versions Every 5 Minutes Not Defined Not Defined Oracle Virtual Platform dom0 cpu utilization is %value%%%, crossed warning (%warning_threshold%) or critical (%critical_threshold%) threshold.
Target Version Collection Frequency
All Versions Every 5 Minutes
Target VersionCollection Frequency
Default Warning Threshold
Default Critical Threshold Alert Text
All Versions Every 5 Minutes Not Defined Not Defined Oracle Virtual Platform dom0 free logical memory is %value% MB, gone below warning (%warning_threshold%) or critical (%critical_threshold%) threshold.
Target VersionCollection Frequency
Default Warning Threshold
Default Critical Threshold Alert Text
All Versions Every 5 Minutes Not Defined Not Defined Oracle Virtual Platform dom0 free memory is %value% MB, gone below warning (%warning_threshold%) or critical (%critical_threshold%) threshold.
Target VersionCollection Frequency
Default Warning Threshold
Default Critical Threshold Alert Text
All Versions Every 5 Minutes Not Defined Not Defined Oracle Virtual Platform dom0 used logical memory utilization is %value%%%, crossed warning (%warning_threshold%) or critical (%critical_threshold%) threshold.
Oracle Compute Cluster 2-5

Dom0 Load
2.6.6 Memory used (MB)This metric displays the used memory in MB of the Dom0
2.6.7 Memory utilization (%)This metric displays the memory utilization in (%) of the Dom0
2.6.8 Number of virtual machinesThis metric displays the number of virtual machines running on the virtual platform
2.6.9 Total ProcessesThis metric displays the number of process running on the Dom0
2.6.10 Swap space used (MB)This metric displays the swap space used in megabytes of the Dom0
Target Version Collection Frequency
All Versions Every 5 Minutes
Target VersionCollection Frequency
Default Warning Threshold
Default Critical Threshold Alert Text
All Versions Every 5 Minutes Not Defined Not Defined Oracle Virtual Platform dom0 memory utilization is %value%%%, crossed warning (%warning_threshold%) or critical (%critical_threshold%) threshold.
Target Version Collection Frequency
All Versions Every 5 Minutes
Target VersionCollection Frequency
Default Warning Threshold
Default Critical Threshold Alert Text
All Versions Every 5 Minutes Not Defined Not Defined Oracle Virtual Platform dom0 total processes is %value%, crossed warning (%warning_threshold%) or critical (%critical_threshold%) threshold.
Target VersionCollection Frequency
Default Warning Threshold
Default Critical Threshold Alert Text
All Versions Every 5 Minutes Not Defined Not Defined Oracle Virtual Platform used swap space (MB) is %value%, crossed warning (%warning_threshold%) or critical (%critical_threshold%) threshold.
2-6 Oracle Enterprise Manager Virtual Infrastructure Plug-in Metric Reference Manual

Oracle Virtual Platform Network Activity
2.6.11 Swap space utilization(%)This metric displays the percentage of swap utilization in the Dom0
2.6.12 Target SeparatorThis metric determines the destination target instance (Oracle Virtual Platform) to which the metric data will be forwarded.
2.7 Oracle Virtual Platform Network ActivityThis metric category describes the metrics associated with Oracle Virtual Platform network activity.
2.7.1 Read throughput (MB per second)This metric provides the read throughput of the disk in MB per second
2.7.2 Total throughput (MB per second)This metric provides the total throughput of the disk in MB per second
Target VersionCollection Frequency
Default Warning Threshold
Default Critical Threshold Alert Text
All Versions Every 5 Minutes Not Defined Not Defined Oracle Virtual Platform swap space utilization(%) is %value%%%, crossed warning (%warning_threshold%) or critical (%critical_threshold%) threshold.
Target Version Collection Frequency
All Versions Every 5 Minutes
Target VersionCollection Frequency
Default Warning Threshold
Default Critical Threshold Alert Text
All Versions Every 5 Minutes Not Defined Not Defined Oracle Virtual Platform's read throughput for %keyvalue% is %value% (KB per second), crossed warning (%warning_threshold%) or critical (%critical_threshold%) threshold.
Target VersionCollection Frequency
Default Warning Threshold
Default Critical Threshold Alert Text
All Versions Every 5 Minutes Not Defined Not Defined Oracle Virtual Platform's total throughput for %keyvalue% is %value% (KB per second), crossed warning (%warning_threshold%) or critical (%critical_threshold%) threshold.
Oracle Compute Cluster 2-7

Oracle Virtual Server Response
2.7.3 Write throughput (MB per second)This metric provides the write throughput of the disk in MB per second
2.7.4 Interface NameThis metric provides the name of the network interface
2.7.5 Target Separator (Network Activity)This metric specifies the destination target instance (Oracle Virtual Platform) to which the metric data will be forwarded.
2.8 Oracle Virtual Server ResponseThis metric category describes the metrics associated with the response status of the Oracle VM Instance target
2.8.1 Target IdentifierThis metric specifies the destination target instance (Oracle VM Instance) to which the metric data will be forwarded.
2.8.2 StateThis metric displays the state of the Oracle VM Instance.
2.8.3 StatusThis metric provides the value for Response Status metric for the Oracle VM Instance target
Target VersionCollection Frequency
Default Warning Threshold
Default Critical Threshold Alert Text
All Versions Every 5 Minutes Not Defined Not Defined Oracle Virtual Platform's write throughput for %keyvalue% is %value% (KB per second), crossed warning (%warning_threshold%) or critical (%critical_threshold%) threshold.
Target Version Collection Frequency
All Versions Every 5 Minutes
Target Version Collection Frequency
All Versions Every 5 Minutes
Target Version Collection Frequency
All Versions Every 1 Minute
Target Version Collection Frequency
All Versions Every 1 Minute
2-8 Oracle Enterprise Manager Virtual Infrastructure Plug-in Metric Reference Manual
Oracle Virtual Server Load
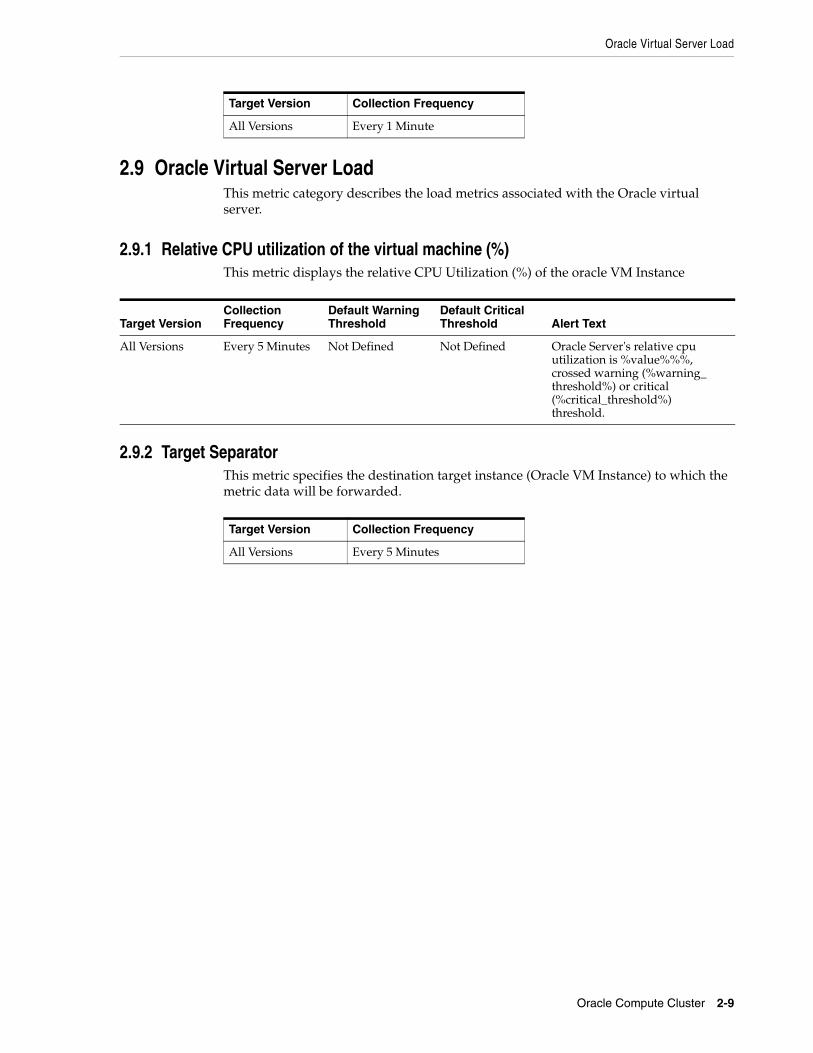
2.9 Oracle Virtual Server LoadThis metric category describes the load metrics associated with the Oracle virtual server.
2.9.1 Relative CPU utilization of the virtual machine (%)This metric displays the relative CPU Utilization (%) of the oracle VM Instance
2.9.2 Target SeparatorThis metric specifies the destination target instance (Oracle VM Instance) to which the metric data will be forwarded.
Target Version Collection Frequency
All Versions Every 1 Minute
Target VersionCollection Frequency
Default Warning Threshold
Default Critical Threshold Alert Text
All Versions Every 5 Minutes Not Defined Not Defined Oracle Server's relative cpu utilization is %value%%%, crossed warning (%warning_threshold%) or critical (%critical_threshold%) threshold.
Target Version Collection Frequency
All Versions Every 5 Minutes
Oracle Compute Cluster 2-9

Oracle Virtual Server Load
2-10 Oracle Enterprise Manager Virtual Infrastructure Plug-in Metric Reference Manual

3
3Oracle Compute Orchestration[4] Orchestration is the automated management of your system components for high availability, monitoring, and persistence. An orchestration ties together the components you create into a single, manageable collection. This chapter describes the metrics defined for the Oracle Compute Orchestration target type.
For more information about Oracle Compute Orchestration targets, see the Oracle Enterprise Manager Cloud Administration Guide.
3.1 Oracle Compute Orchestration StateThis metric category describes the metrics associated with the state of Oracle Compute Orchestration.
3.1.1 MessageThis metric captures errors or warnings only if they are available for the Orchestration.
3.1.2 StateThis metric captures the state of the orchestration. Possible values:
■ ready
■ stopping
■ shutting_down
■ warning
■ stopped
■ shut_down
■ starting
■ restarting
■ error
■ unavailable
Target Version Collection Frequency
All Versions N/A1
1 Uploads data only if there is a change in the state.
Oracle Compute Orchestration 3-1

Response
3.2 ResponseThis metric category provides information about the status of the Oracle Compute Orchestration target.
3.2.1 StatusThis metric provides the status of the Oracle Compute Orchestration target.
Target VersionCollection Frequency
Default Warning Threshold
Default Critical Threshold Alert Text
All Versions N/A1
1 Uploads data only if there is a change in the state.
Not Defined Not Defined The state of orchestration is %value% matches either warning pattern (%warning_threshold%) or critical pattern(%critical_threshold%).%Message%
Target VersionCollection Frequency
Default Warning Threshold
Default Critical Threshold Alert Text
All Versions Every 1 Minute Not Defined 0 Oracle Compute Orchestration %target% is down.
3-2 Oracle Enterprise Manager Virtual Infrastructure Plug-in Metric Reference Manual

4
4Oracle Virtual Platform[5] This chapter describes the metrics associated with the Oracle Virtual Platform target. The Oracle Virtual Platform is the host operating system that represents the hypervisor domain.
For more information about Oracle Virtual Platforms, see the Oracle Enterprise Manager Cloud Administration Guide.
4.1 Basic Configuration Details This metric category provides information about the basic configuration of an Oracle Virtual Platform target.
These are configuration metrics and cannot be viewed from the All Metrics page in the Cloud Control UI.
4.1.1 Platform VersionThis metric displays the version of the Xen platform running on the Domain 0 of the hypervisor.
4.1.2 Allocated CPUThis metric displays the number of allocated Virtual CPUs to the Domain 0.
4.1.3 Allocated Memory (MB)This metric displays the amount of memory allocated to the Domain 0 in MB.
Target Version Collection Frequency
All Versions Every 24 Hours
Target Version Collection Frequency
All Versions Every 24 Hours
Target Version Collection Frequency
All Versions Every 24 Hours
Oracle Virtual Platform 4-1

Network Activity
4.2 Network Activity This metric category provides the statistics of each network interface of the Oracle Virtual Platform target.
Multiple Thresholds
For this metric category, you can set different warning and critical threshold values for each Interface Name object.
If warning or critical threshold values are currently set for any Interface Name object, you can view those thresholds from the All Metrics page for this metric.
To specify or change warning or critical threshold values for each Interface Name object, use the Modify Thresholds page.
4.2.1 Interface NAMEThis metric provides the name of the network interface.
4.2.2 Total throughput (MB per second)This metric displays the total read and write utilization (in percentage) with respect to the bandwidth of the network interface since the last collection.
4.2.3 Read throughput (MB per second)This metric displays the total read utilization (in percentage) with respect to the bandwidth of the network interface since the last collection.
4.2.4 Write throughput (MB per second)This metric displays the total write utilization (in percentage) with respect to the bandwidth of the network interface since the last collection.
Target Version Collection Frequency
All Versions Every 15 Minutes
Target VersionCollection Frequency
Default Warning Threshold
Default Critical Threshold Alert Text
All versions Every 15 Minutes
Not Defined Not Defined Oracle Virtual Platform combined utilization is %value%%%, crossed warning (%warning_threshold%) or critical (%critical_threshold%) threshold.
Target VersionCollection Frequency
Default Warning Threshold
Default Critical Threshold Alert Text
All versions Every 15 Minutes
Not Defined Not Defined Oracle Virtual Platform network %keyValue% read utilization is %value%%%, crossed warning (%warning_threshold%) or critical (%critical_threshold%) threshold.
Target VersionCollection Frequency
Default Warning Threshold
Default Critical Threshold Alert Text
All versions Every 15 Minutes
Not Defined Not Defined Oracle Virtual Platform network %keyValue% write utilization is %value%%%, crossed warning (%warning_threshold%) or critical (%critical_threshold%) threshold.
4-2 Oracle Enterprise Manager Virtual Infrastructure Plug-in Metric Reference Manual

Network Activity Summary
4.3 Network Activity SummaryThis metric category provides the summary statistics of each network interface of the Oracle Virtual Platform target.
4.3.1 Highest Read Throughput (MB per second)This metric displays the highest read rate (in MB/s) among all of the interfaces of the Oracle Virtual Platform.
4.3.2 Highest Total Throughput (MB per second)This metric displays the highest total read and write rate (in MB/s) among all of the interfaces of the Oracle Virtual Platform.
4.3.3 Highest Write Throughput (MB per second)This metric displays the highest write rate (in MB/s) among all of the interfaces of the Oracle Virtual Platform.
4.3.4 Total throughput (MB per second)This metric displays the total throughput on the interface in MB/s.
Target VersionCollection Frequency
Default Warning Threshold
Default Critical Threshold Alert Text
All versions Every 15 Minutes
Not Defined Not Defined Oracle Virtual Platform highest read rate (MB per second) among the network interfaces is %value%, crossed warning (%warning_threshold%) or critical (%critical_threshold%) threshold.
Target VersionCollection Frequency
Default Warning Threshold
Default Critical Threshold Alert Text
All versions Every 15 Minutes
Not Defined Not Defined Oracle Virtual Platform highest total throughput (MB per second) among the network interfaces is %value%, crossed warning (%warning_threshold%) or critical (%critical_threshold%) threshold.
Target VersionCollection Frequency
Default Warning Threshold
Default Critical Threshold Alert Text
All versions Every 15 Minutes
Not Defined Not Defined Oracle Virtual Platform highest write rate (MB per second) among the network interfaces is %value%, crossed warning (%warning_threshold%) or critical (%critical_threshold%) threshold.
Target VersionCollection Frequency
Default Warning Threshold
Default Critical Threshold Alert Text
All versions Every 15 Minutes
Not Defined Not Defined Oracle Virtual Platform all network interfaces total throughput (MB per second) is %value%, crossed warning (%warning_threshold%) or critical (%critical_threshold%) threshold.
Oracle Virtual Platform 4-3

Network Configuration
4.4 Network Configuration This metric category provides information about each network interface of the Oracle Virtual Platform target.
These are configuration metrics and cannot be viewed from the All Metrics page in the Cloud Control UI.
4.4.1 Interface NameThis metric displays the name of the network interface.
4.4.2 MAC AddressThis metric displays the Media Access Control (MAC) address of the network interface.
4.4.3 IP AddressThis metric displays the IP address of the network interface.
4.4.4 GatewayThis metric displays the address of the network gateway.
4.4.5 NetmaskThis metric displays the netmask address.
4.4.6 BandwidthThis metric displays the network bandwidth of the network interface in MB/s.
Target Version Collection Frequency
All Versions Every 24 Hours
Target Version Collection Frequency
All Versions Every 24 Hours
Target Version Collection Frequency
All Versions Every 24 Hours
Target Version Collection Frequency
All Versions Every 24 Hours
Target Version Collection Frequency
All Versions Every 24 Hours
Target Version Collection Frequency
All Versions Every 24 Hours
4-4 Oracle Enterprise Manager Virtual Infrastructure Plug-in Metric Reference Manual

Server Load
4.5 Oracle Virtual Server This metric category provides the identification details of all the Guest Virtual machines (Oracle Virtual Server targets) hosted by the hypervisor.
These are configuration metrics and cannot be viewed from the All Metrics page in the Cloud Control UI
4.5.1 Server Virtual IdThis metric displays the ID of the guest virtual server hosted on the hypervisor.
4.6 ResponseThis metric category provides information about the status of the Oracle Virtual Platform target.
4.6.1 StatusThis metric provides the status of the Oracle Virtual Platform target.
4.7 Server LoadThis metric category describes the load metrics of the corresponding Oracle Server target.
4.7.1 Physical Server Memory Free (MB)This metric displays the total physical memory available in MB, by all the guest virtual machines including Domain 0.
4.7.2 Physical Server Memory used (MB)This metric displays the total physical memory utilized in MB, by all the guest virtual machines including Domain 0.
Target Version Collection Frequency
All Versions Every 24 Hours
Target VersionCollection Frequency
Default Warning Threshold
Default Critical Threshold Alert Text
All versions Every 1 Minute
Not Defined 0 Oracle Virtual Platform %target% is down
Target Version Collection Frequency
All Versions Every 5 Minutes
Target VersionCollection Frequency
Default Warning Threshold
Default Critical Threshold Alert Text
All versions Every 5 Minutes
Not Defined Not Defined Oracle Virtual Platform physical server memory used (MB) is %value%, crossed warning (%warning_threshold%) or critical (%critical_threshold%) threshold.
Oracle Virtual Platform 4-5

Server Load
4.7.3 Physical Server Memory utilization (%)This metric displays the percentage of the total physical memory being utilized.
4.7.4 Physical Server Swap Memory used (MB)This metric displays the swap memory in megabytes being used on the physical server.
4.7.5 Physical Server Swap utilization (%)This metric displays the percentage of swap memory being used on the physical server.
Target VersionCollection Frequency
Default Warning Threshold
Default Critical Threshold Alert Text
All versions Every 5 Minutes
Not Defined Not Defined Oracle Virtual Platform memory utilization is %value%%%, crossed warning (%warning_threshold%) or critical (%critical_threshold%) threshold.
Target Version Collection Frequency
All Versions Every 5 Minutes
Target Version Collection Frequency
All Versions Every 5 Minutes
4-6 Oracle Enterprise Manager Virtual Infrastructure Plug-in Metric Reference Manual

5
5Oracle Virtual Server[6] This chapter describes the metrics associated with the Oracle Virtual Server target. Oracle Virtual Servers are guest virtual machines managed by the hypervisor domain.
For more information about Oracle Virtual Servers, see the Oracle Enterprise Manager Cloud Administration Guide.
5.1 Basic Configuration Details This metric category provides information about the basic configuration of an Oracle Virtual Server target.
These are configuration metrics and cannot be viewed from the All Metrics page in the Cloud Control UI.
5.1.1 Allocated CPUThis metric displays the number of allocated virtual CPUs to the guest virtual machine.
5.1.2 Allocated Memory (MB)This metric displays the amount of memory allocated to the guest virtual machine in MB.
5.1.3 DNS ZoneThis metric displays the DNS zone.
Target Version Collection Frequency
All Versions Every 24 Hours
Target Version Collection Frequency
All Versions Every 24 Hours
Target Version Collection Frequency
All Versions Every 24 Hours
Oracle Virtual Server 5-1

Load
5.1.4 Guest UUIDThis metric displays the unique identifier (UUID) allocated to the guest virtual machine.
5.1.5 IP AddressThis metric displays the IP address of the guest virtual machine.
5.2 Load This metric category provides information about the load metrics of an Oracle Virtual Server target.
5.2.1 Relative CPU utilization of the virtual machine (%)This metric displays the total virtual CPU (VCPU) usage in percentage.
5.3 ResponseThis metric category provides information about the status of the Oracle Virtual Server target.
5.3.1 StatusThis metric provides the status of the Oracle Virtual Server target.
Target Version Collection Frequency
All Versions Every 24 Hours
Target Version Collection Frequency
All Versions Every 24 Hours
Target VersionCollection Frequency
Default Warning Threshold
Default Critical Threshold Alert Text
All versions Every 5 Minutes
Not Defined Not Defined Oracle Server's relative cpu utilization is %value%, crossed warning (%warning_threshold%) or critical (%critical_threshold%) threshold.
Target VersionCollection Frequency
Default Warning Threshold
Default Critical Threshold Alert Text
All versions Every 1 Minute
Not Defined 0 Oracle Virtual Server %target% is down
5-2 Oracle Enterprise Manager Virtual Infrastructure Plug-in Metric Reference Manual

6
6Oracle Server[7] This chapter describes the metrics associated with the Oracle Server target. The Oracle Server is the bare metal box running the hypervisor.
For more information about Oracle Server, see the Oracle Enterprise Manager Cloud Administration Guide.
6.1 Hardware Configuration This metric category provides information about the hardware configuration of the Oracle Server target.
These are configuration metrics and cannot be viewed from the All Metrics page in the Cloud Control UI.
6.1.1 Machine ArchitectureThis metric displays the architecture of the installed CPUs, such as x86 64-bit.
6.1.2 Clock Frequency (MHz)This metric displays clock frequency of the installed CPU.
6.1.3 CPU CountThis metric displays the total number of installed CPUs.
6.1.4 Number of SocketsThis metric displays the total number of CPU sockets.
Target Version Collection Frequency
All Versions Every 24 Hours
Target Version Collection Frequency
All Versions Every 24 Hours
Target Version Collection Frequency
All Versions Every 24 Hours
Oracle Server 6-1

Network Configuration
6.1.5 Total CPU CoresThis metric displays the total number of CPU cores.
6.1.6 CPU Cores Per SocketThis metric displays the CPU cores per socket.
6.1.7 CPU Threads Per CoreThis metric displays the number of CPU threads per core.
6.1.8 Enabled CPU CoresThis metric displays the total number of enabled cores across all CPUs.
6.1.9 Local Disk Space (GB)This metric displays the total disk space.
6.2 Network ConfigurationThis metric category provides information about the configuration of each network interface of the Oracle Server target.
These are configuration metrics and cannot be viewed from the All Metrics page in the Cloud Control UI.
6.2.1 Interface NameThis metric displays the name of the network interface.
Target Version Collection Frequency
All Versions Every 24 Hours
Target Version Collection Frequency
All Versions Every 24 Hours
Target Version Collection Frequency
All Versions Every 24 Hours
Target Version Collection Frequency
All Versions Every 24 Hours
Target Version Collection Frequency
All Versions Every 24 Hours
Target Version Collection Frequency
All Versions Every 24 Hours
6-2 Oracle Enterprise Manager Virtual Infrastructure Plug-in Metric Reference Manual

Response
6.2.2 MAC AddressThis metric displays the Media Access Control (MAC) address of the network interface.
6.2.3 BandwidthThis metric displays the bandwidth of the network interface in Mb/s.
6.3 ResponseThis metric category provides information about the status of the Oracle Server target.
6.3.1 StatusThis metric provides the status of the Oracle Server target.
Target Version Collection Frequency
All Versions Every 24 Hours
Target Version Collection Frequency
All Versions Every 24 Hours
Target Version Collection Frequency
All Versions Every 24 Hours
Target VersionCollection Frequency
Default Warning Threshold
Default Critical Threshold Alert Text
All versions Every 1 Minute
Not Defined 0 Oracle Server %target% is down
Oracle Server 6-3

Response
6-4 Oracle Enterprise Manager Virtual Infrastructure Plug-in Metric Reference Manual