Embed Size (px)
Citation preview

Company Overview
12.4%
13.9%
392
247
173
18.4%
490
21.9%
2004 2005 2006 2007 2008
760
20.6%
2009
12.4%
25.2%
1,080
2010
25.6%
1,233
IPO
24.1%
Leadership
Foundation
Strengthening
10.6%
1983 1986 1989 1992 1995 1996 1997 1998 1999 2000 2001 2002
9.8%
10.0%
8.4% 6.5%
110 106 98
63
35 24 17
Proprietary Technology
Microsiga Startup
Franchise System
126
2003
Market Consolidation
TOTVS Brand
DNA
Integrated Systems for SMEs
1st IT IPO in Latin America
R$ 1 Billion of Sales in 2010
2011
1,343
Gro
ss R
eve
nu
es (
R$
Mill
ion
s) a
nd
EB
ITD
A M
argi
n (
%)
¹
(1) EBITDA Margin does not include extraordinary expenses 2
History
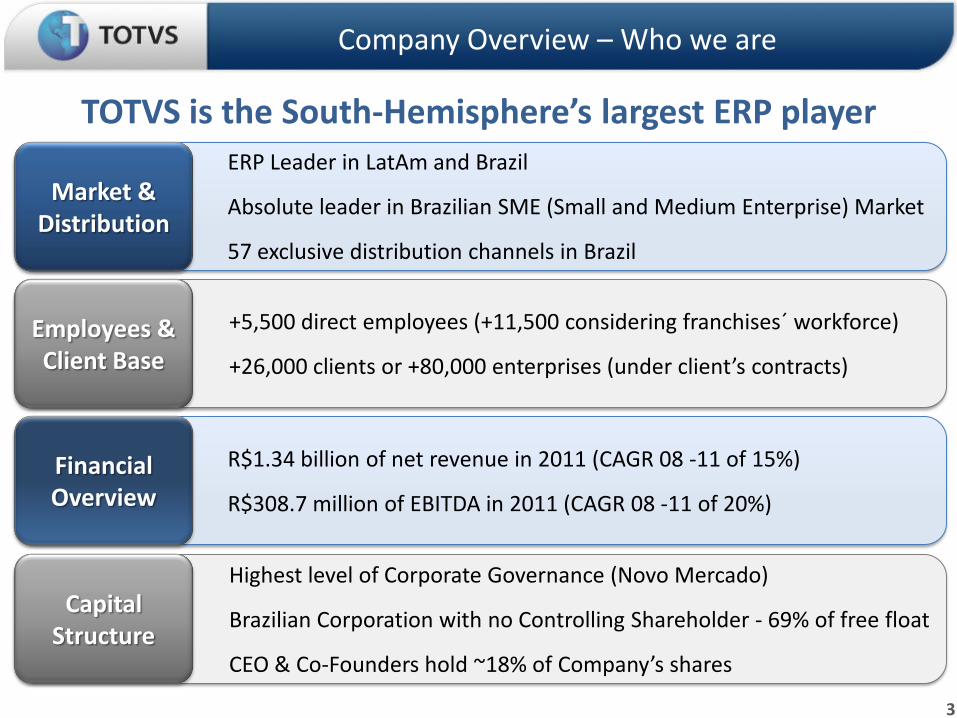
TOTVS is the South-Hemisphere’s largest ERP player
Company Overview – Who we are
Highest level of Corporate Governance (Novo Mercado)
Brazilian Corporation with no Controlling Shareholder - 69% of free float
CEO & Co-Founders hold ~18% of Company’s shares
ERP Leader in LatAm and Brazil
Absolute leader in Brazilian SME (Small and Medium Enterprise) Market
57 exclusive distribution channels in Brazil
R$1.34 billion of net revenue in 2011 (CAGR 08 -11 of 15%)
R$308.7 million of EBITDA in 2011 (CAGR 08 -11 of 20%)
+5,500 direct employees (+11,500 considering franchises´ workforce)
+26,000 clients or +80,000 enterprises (under client’s contracts)
Market & Distribution
Capital Structure
Employees & Client Base
Financial Overview
3

CEO, Co-founders and related persons and companies 17.9%
Fundação Petrobras de Seguridade Social – PETROS 10.0%
BNDES Participações S/A 3.2%
Free Float 68.9%
% of free float 2Q12 1Q12 4Q11 3Q11 2Q11
Non-Institutional Investors 6.2% 7.1% 5.9% 6.7% 6.5%
Institutional Investors 93.8% 92.9% 94.1% 93.3% 93.5%
Local Investors 12.2% 13.6% 12.4% 17.9% 14.9%
International Investors 87.8% 86.4% 87.6% 82.1% 85.1%
Company Overview – Who we are
Ownership Structure
Shareholders
4

6th worldwide in Revenue* and 1st in growth
5
Source: Gartner - ERP Software, Worldwide, 2011
*Licenses and Maintenance Revenues, in US$ million 2010 vs. 2011 Evolution
Global Ranking of ERP-Suite 2011
Company Overview – Who we are

Company Overview – Who we are
18th Most Valuable Brand in Brazil
• High value despite the brand´s young age
• Ranked ahead of major consumer brands
• Has become a synonym for Brazilian business software
Source: Brand Analytics/Millard Brown – Istoé Dinheiro ed.760 june 2012
http://www.istoedinheiro.com.br/noticias/82403_AS+MARCAS+MAIS+VALIOSAS+DO+BRASIL+EM+2012
18 TOTVS 56919 TAM 560
20 CIELO 555
21 MULTIPLUS 519
22 PORTO SEGURO 500
23 MAGAZINE LUIZA 479
24 GOL 450
25 REDECARD 439
26 NET 436
27 EXTRA 412
28 BM&FBOVESPA 386
29 BANRISUL 383
30 HERING 351
31 IGUATEMI 349
32 ODONTOPREV 342
33 PÃO DE AÇUCAR 332
34 UNIÃO 322
50 MOST VALUABLE BRAZILIAN BRANDS
Rank Brand Value (US$ MM)
1 PETROBRAS 10,560
2 BRADESCO 6,690
3 ITAÚ 6,606
4 SKOL 4,698
5 BANCO DO BRASIL 4,574
6 NATURA 3,307
7 BRAHMA 2,359
8 VALE 1,708
9 SADIA 1,496
10 ANTARTICA 851
11 VIVO 817
12 PERDIGÃO 778
13 LOJAS AMERICANAS 762
14 BOHEMIA 697
15 IPIRANGA 670
16 OI 600
17 CASAS BAHIA 589
6

Target Market
Strong Fundaments and Business Model
Company Overview – Who we are
Product & Technology Distribution Revenue model
Focus on SMB
• Low Penetration
• Leadership
• Fragmented
Competition
• Diversified Base
• Economy
Formalization
Flexibility
• Independence
• Agnostic
• Scalability
• Cloud Ready
• ERP by Industry and
by Size
• Social Network
Environment
• Mobile
Capillarity
• Franchise Model
• Regional
Entrepreneurship
• Exclusivity
• Client Ownership
• Aligned Interests
Full Control
• Growth Capturing
• Inflation Hedge
• Recurrence
• High retention rate
• Cyclic
7

Target Market – ERP in Brazil
(1)IBGE estimates about the Brazilian market. - http://www.sidra.ibge.gov.br/bda/pesquisas/cempre. Table 988. (2)”Valor 1000” Magazine, ed 2009. Companies with more than R$ 1Bi revenue. (3) Gartner “ SWOT: Totvs, Enterprise Application Software, Worldwide, 2010 ”
Employees
0 - 9
10 - 499
Revenue (R$)
Under R$1 Bi
Over R$1 Bi
4,620,905 (1)
618,486 (1)
288 (1)(2)
8,751(1)
# Companies
>= 500
Mega Large
Large
Medium
Small
Micro
ER
P M
ark
et P
en
etra
tion
8
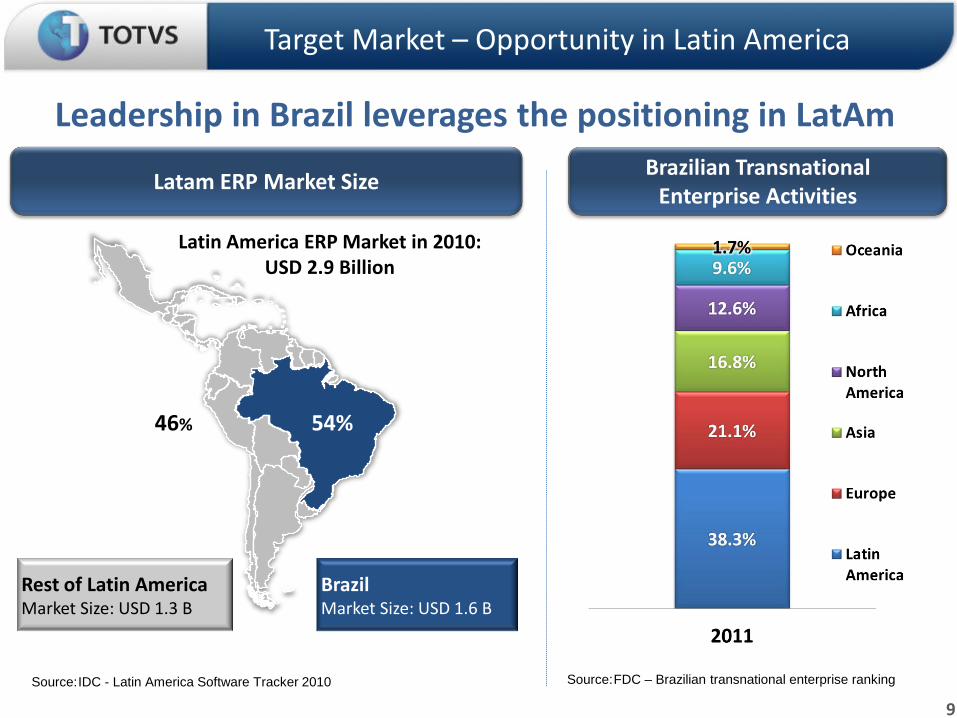
Leadership in Brazil leverages the positioning in LatAm
Source: IDC - Latin America Software Tracker 2010
Target Market – Opportunity in Latin America
Brazil Market Size: USD 1.6 B
Rest of Latin America Market Size: USD 1.3 B
54% 46%
Latin America ERP Market in 2010: USD 2.9 Billion
Latam ERP Market Size Brazilian Transnational
Enterprise Activities
Source: FDC – Brazilian transnational enterprise ranking
9
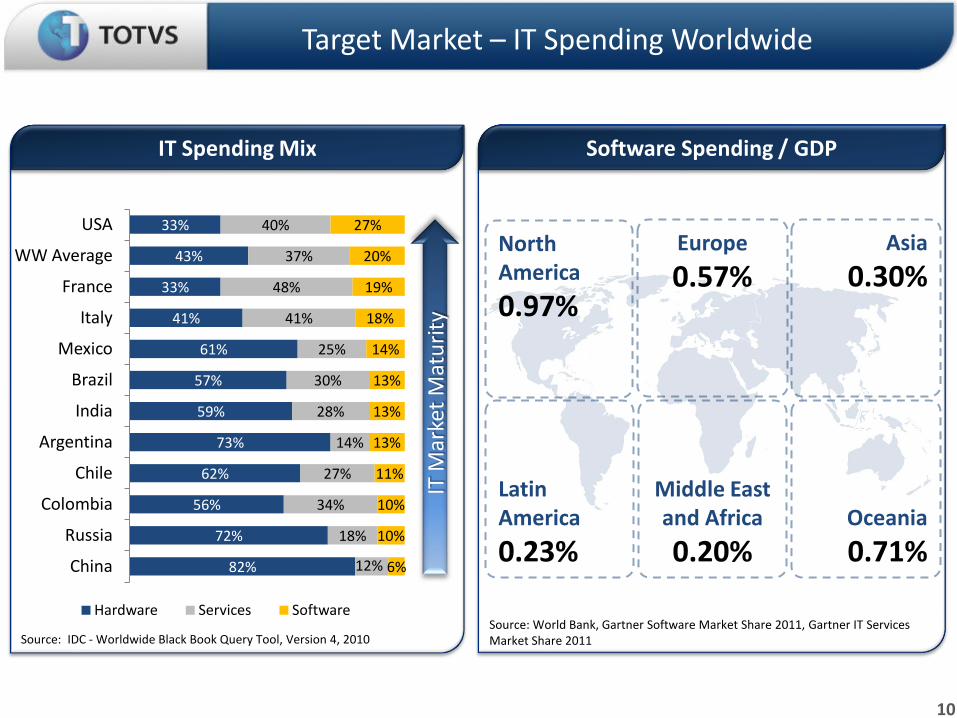
Target Market – IT Spending Worldwide
82%
72%
56%
62%
73%
59%
57%
61%
41%
33%
43%
33%
12%
18%
34%
27%
14%
28%
30%
25%
41%
48%
37%
40%
6%
10%
10%
11%
13%
13%
13%
14%
18%
19%
20%
27%
China
Russia
Colombia
Chile
Argentina
India
Brazil
Mexico
Italy
France
WW Average
USA
Hardware Services Software
Source: IDC - Worldwide Black Book Query Tool, Version 4, 2010
IT M
arke
t M
atu
rity
IT Spending Mix
Latin America
0.23%
North America
0.97%
Europe
0.57% Asia
0.30%
Oceania
0.71%
Middle East and Africa
0.20%
Software Spending / GDP
Source: World Bank, Gartner Software Market Share 2011, Gartner IT Services Market Share 2011
10

Product & Tech – Solution Overview
11
Decision Making Support • BI / DW / SGI / BSC / BA
Process, Content and Relationship
Management • Corporate Productivity
• Communication • Natural User Interface
Identity Management • Authenticated and
Certified Individuals and Companies
Enterprise Management • Back Office ERP • By Industry ERP
Human Capital Management • Enterprise Culture • Organization Development • Payroll
Consumer Management • Customized Attendant • Self-Service • Behavioral Analysis (Social CRM)
Anywhere • Smartphones / Tablets • Availability
Business Platform • Interaction, Share and
Collaboration • e-commerce (Store) • Supply Chain
TOTVS Arena

Product & Tech – Solution Overview
12
Collaboration among companies
• Single Sign-on • Information Ownership • SaaS (Software as a Service)
Available for posting on:

Product & Tech – Portfolio
Software Services
• TOTVS | Software Services Support / Implementation Technological Evolution Software Factory / SLA Training • TOTVS | Consulting Change Management / Processes Strategy Management / Performance PMO CSC • TOTVS | Outsourcing
e-Learning BPO Service Desk
• TOTVS | Marketplace
• TOTVS | Collaboration
Technology
• TOTVS | Cloud Computing
• TOTVS | Hardware
Series 1 | 3 | T
• TOTVS | Application Server
• TOTVS | DbAccess
• TOTVS | SmartClient
Standard HTML Mobile Social
• TOTVS | Developer Studio
• TOTVS | ECM
WCM BPM Content Management
• TOTVS | ESB
Corporate Management Infrastructure TOTVS | Platform
13

Product & Tech – ERP Core
ERP by Industries Functional adherence to the core business of each industry
Company Management • ERP by Industry Sector &
by Company Size
Agribusiness: Agricultural and Agribusiness Management | Cultivation, Cultural Procedures,
Harvest | Origination of Grains | Subcontracting | Fleet Maintenance | Automation in the Field
Construction and Projects: Work and Project Management | Merger Management | Viability
Analysis
Distribution & Logistics: Supply Chain | TMS | WMS | OMS | Fleet Maintenance |Shipper |
Harbor Customs Facilities
Education: Academic Management | Library | Distance Learning | Academic Portal | Selection
Process
Financial Services: Investment Management | Core Banking | Credit Management
Legal: Process Follow-up and Control | Schedule | Timesheet |Agreement, Customer and Team
Performance Management
Manufacturing: MPS | MRP | CRP | APS | Shop Floor Control | Industrial Automation | Asset
Maintenance | Environmental Management
Health: Health Plan and Affiliated Provider Management | Hospital Management | CCIH
Services: Service Agreement Management and SLA | Asset Maintenance
Retail: Store and POS | Magazine | Drugstore | OMS | Credit Management | Supply
Series 3
Series 1
Series T
14

Product & Tech – Facts by Industry
15
+1,110 extractive and processing customers, +1,000 metal and plastic, +1,400 capital goods
+900 department stores, +140 supermarkets, +280 building materials distributors
+2,300 services providers, +400 Utilities providers, +470 travel and passengers transportation
12 million lives, +9,700 beds, medical registers to 35 specialties
7 out of 10 top law firms, 10,000 lawyers
50 out of 100 Brazilian biggest companies
+20 international builders, +450 engineering and design customers
+200 sugarcane producers = 50% Brazilian harvest, +120 grain
producers, 1 million hectares
+1,600 wholesaler distributors, +600 freight companies
22k portfolios, 4k funds, 120k/day consumer credit transactions, R$1.5 trillion assets under custody, LatAm
Financial Market Top provider
+700 Brazilian institutions, +1.5 million students
Agribusiness
Construction and Projects
Distribution and Logistics
Educational
Financial Services
Legal
Health
Manufacturing
Retail
Services

Product & Tech – Software Implementation
To facilitate systems
deployment with
the highest return
Systems implementation
services according to the
size and complexity of
each TOTVS customer
16

Product & Tech – Consulting Services
To increase TOTVS
customers’ results Consulting service acts in
the core business and
administrative processes.
It promotes the
management maturity and
maximizes the investment
return.
17
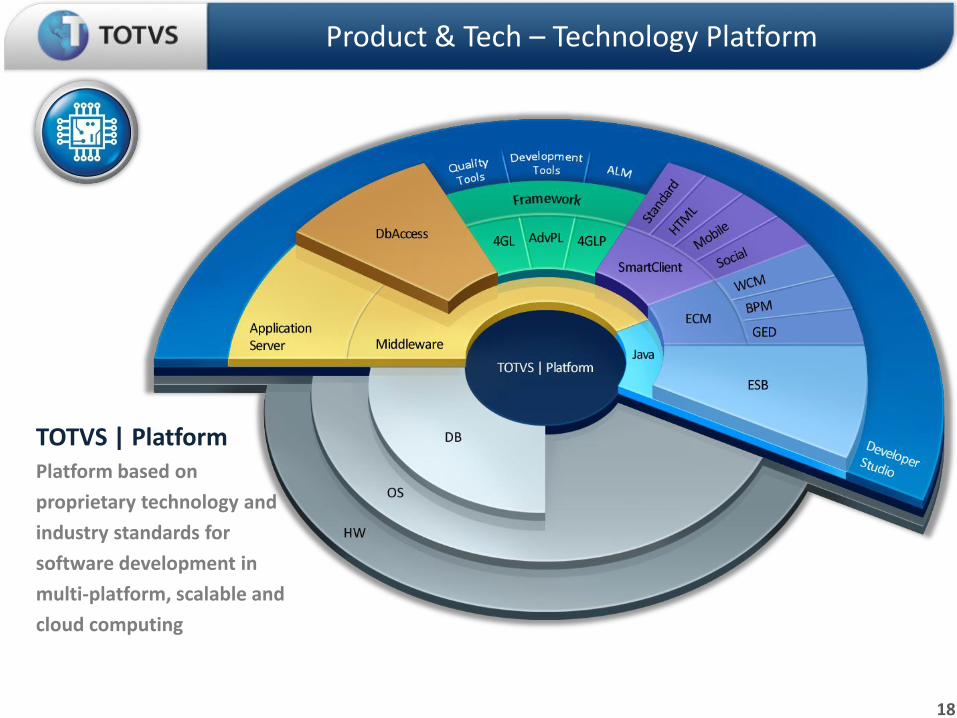
Product & Tech – Technology Platform
TOTVS | Platform Platform based on
proprietary technology and
industry standards for
software development in
multi-platform, scalable and
cloud computing
18

Native integration with TOTVS
Applications and Environment.
Advanced Cloud Computing, SOA and
BPM resources.
Integrated Development
Enjoinment, Tests and Life Cycle Manag.(*).
Technology by over 30 thousand
enterprises in the world.
TOTVS | Developer Studio: Customize, Create and Share Applications
(*) Supported Languages: Java / ADVPL++ / 4GL / 4GLP / .NET / NCL / LUA/ JavaTV / HTML5 Tools: Application Server, DbAcess e Ajax Server Interfaces: IT & TV Digital (Brazilian standard)
Product & Tech – Software Developer Kit (SDK)
TOTVS | Platform
19

Latin America
Brazil
►Distribution Channels: 5 Branches + 52 Franchisees
►~40 complementary channels working with TOTVS distribution network
►+5,200 Direct employees
Subsidiaries
Products
only
Franchises
►Products over 15 countries
►Excluding Brazil:
+300 direct employees
+13 Full TOTVS distribution channels
Distribution – Capillarity
Branch Franchise
Regional Presence and Entrepreneurship
20

Final Contact with Clients / Alignment of Interests
Franchise
Licenses
Services
Maintenance
Services
Licenses
Maintenance
Licenses Commissions
Maintenance Commissions
Proprietary Channel
Sales
Franchise Sales
Clients
Distribution – Channel Remuneration Model
21

Cyclical Model
New Customers
Base Customers
New Customers
Basic Implementation
Base Customers
New Licenses
New Modules
Consulting and
VAS+
Licenses
Services
Maintenance
New Licenses
Corporate Model Updates Upgrades
(New version) Help-desk
Y0 Y1 Y2 Y3 Y4 Y5 Y6 Y7 Y8
Traditional model
Corporate model
Recurring Fees by Metric
Entry Fee + Implementation
Y0 Y1 Y2 Y3 Y4 Y5 Y6 Y7 Y8 … …
Revenue Model
22

23
Revenue Model
Net Revenue Breakdown (R$ million) ¹
Licenses Services Maintenance
High Recurrence and Predictability
(1) Pro forma figures for the year 2008 as the numbers include Datasul.

Consistent License Fee Revenue growth…
24
Financial Performance
Net License Fee Revenue (R$ million) 1
(1) Pro forma figures for the year 2008 as the numbers include Datasul.
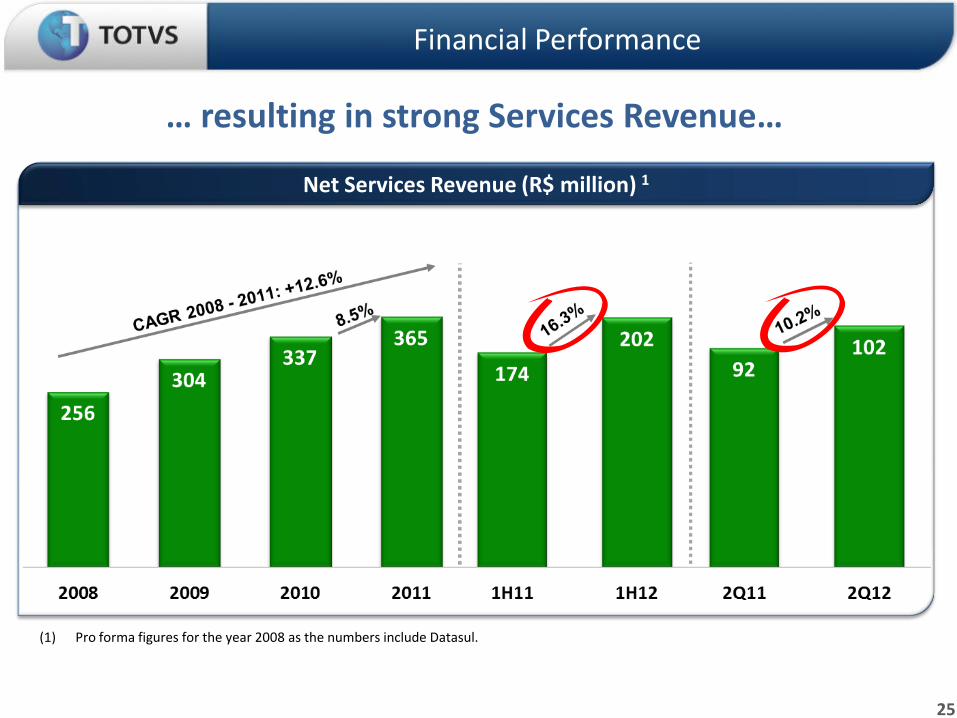
… resulting in strong Services Revenue…
25
Financial Performance
Net Services Revenue (R$ million) 1
(1) Pro forma figures for the year 2008 as the numbers include Datasul.

… and high levels of Maintenance Fee
26
Financial Performance
Net Maintenance Fee Revenue (R$ million) 1
(1) Pro forma figures for the year 2008 as the numbers include Datasul.
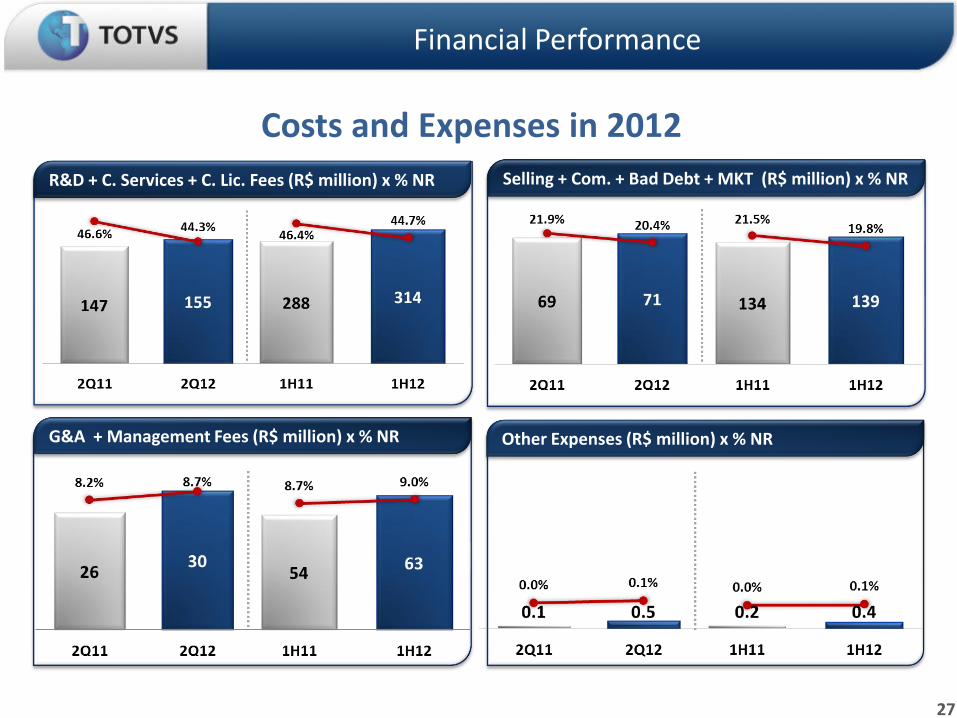
Costs and Expenses in 2012
27
Financial Performance
R&D + C. Services + C. Lic. Fees (R$ million) x % NR Selling + Com. + Bad Debt + MKT (R$ million) x % NR
G&A + Management Fees (R$ million) x % NR Other Expenses (R$ million) x % NR

EBITDA in 2012
28
2Q – Year over Year (R$ million) 1
Financial Performance
YTD – Year over Year (R$ million) 1
(1) Pro forma figures for the year 2008 as the numbers include Datasul.
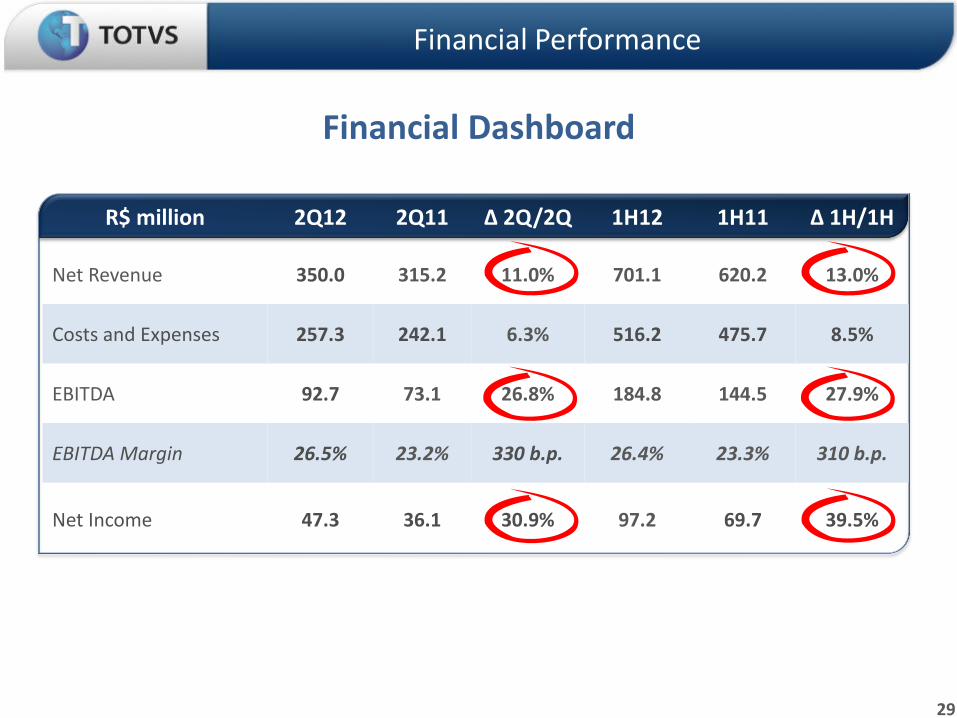
R$ million 2Q12 2Q11 Δ 2Q/2Q 1H12 1H11 Δ 1H/1H
Net Revenue 350.0 315.2 11.0% 701.1 620.2 13.0%
Costs and Expenses 257.3 242.1 6.3% 516.2 475.7 8.5%
EBITDA 92.7 73.1 26.8% 184.8 144.5 27.9%
EBITDA Margin 26.5% 23.2% 330 b.p. 26.4% 23.3% 310 b.p.
Net Income 47.3 36.1 30.9% 97.2 69.7 39.5%
Financial Dashboard
29
Financial Performance
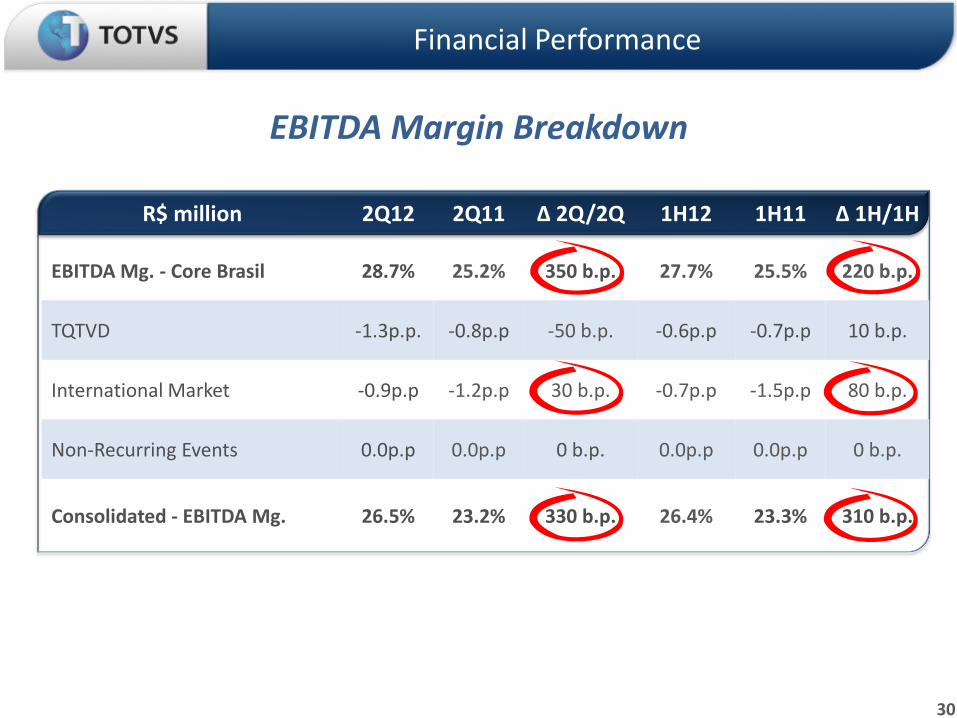
R$ million 2Q12 2Q11 Δ 2Q/2Q 1H12 1H11 Δ 1H/1H
EBITDA Mg. - Core Brasil 28.7% 25.2% 350 b.p. 27.7% 25.5% 220 b.p.
TQTVD -1.3p.p. -0.8p.p -50 b.p. -0.6p.p -0.7p.p 10 b.p.
International Market -0.9p.p -1.2p.p 30 b.p. -0.7p.p -1.5p.p 80 b.p.
Non-Recurring Events 0.0p.p 0.0p.p 0 b.p. 0.0p.p 0.0p.p 0 b.p.
Consolidated - EBITDA Mg. 26.5% 23.2% 330 b.p. 26.4% 23.3% 310 b.p.
EBITDA Margin Breakdown
30
Financial Performance
31
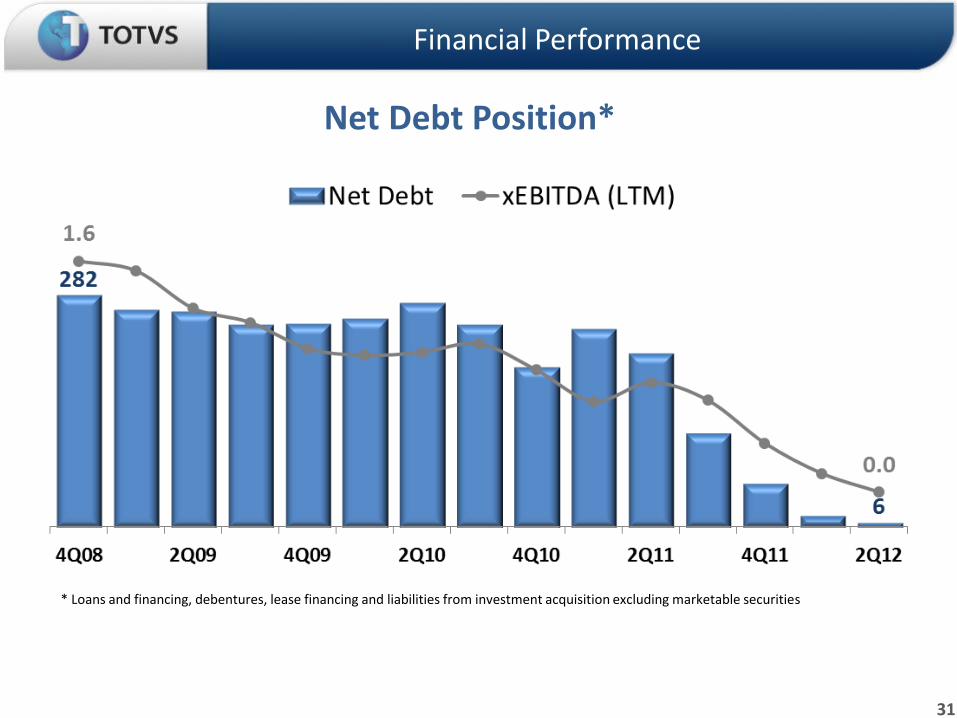
Financial Performance
Net Debt Position*
* Loans and financing, debentures, lease financing and liabilities from investment acquisition excluding marketable securities

32
Financial Performance
Cash Flow and Debt
(*) The Debt informed comprehends (i) Loans and financing, (ii) Debentures, (iii) Current obligation under capital leases , (iv) Obligation relating to acquisitions and (v) Marketable securities.

TOTVS Vision
Company transformation into a global standard • Capturing internationalization of the Brazilian economy
• Geographical selectivity
• Brazil remains the cornerstone of our strategy
5th Phase
33
• by You • Branding • ECM • Private
• Specialization by Industry and Size • SaaS (Software as a Service) • Mobile • M&A
• Componentization & SW life cycle • Efficiency gains in Services & Development • International Market
Growth
Loyalty
Margin

Contacts
Safe harbor The material that follows is a presentation of general
background information about TOTVS activities as of the date of
the presentation in July 2012.
It is information given in summary form and does not purport to
be complete. It is not intended to be relied upon as advice to
potential investors.
This presentation may contain statements that express
management’s expectations and/or forecasts about future
events.
These expectations and/or forecasts involve risks and
uncertainties that could cause actual results to differ materially
from those projected in such forward-looking statements.
Therefore, the future results of the company may differ from
current expectations and readers must not base their
expectations exclusively on the information presented herein.
No representation or warranty, express or implied, is made
concerning, and no reliance should be placed on the accuracy,
fairness, or completeness of the information presented herein.
This document does not constitute an offer, or invitation, or
solicitation of an offer, to subscribe for or purchase any
securities. Neither this document nor anything contained herein
shall form the basis of any contract or commitment whatsoever.
QUESTIONS
www.totvs.com/ir
Year 2 Year 3 Year 4 Year 1 Year n ...
One solution for each stage of your company More than serving well, a better
understanding of your business