Embed Size (px)
Citation preview

Geneva, 23th – 25th November 2015
Ensuring Sustainability in the Face of Climate Change
by
Mr. Iqbal Abdullah Harun Joint Secretary, Finance Division,
Ministry of Finance The People's Republic of Bangladesh
The views expressed are those of the author and do not necessarily reflect the views of UNCTAD

Bangladesh: Climate Change and Debt
Sustainability
Iqbal Abdullah Harun
Joint Secretary, Ministry of Finance, Bangladesh
UNCTAD 10th Debt Management Conference Palais des Nations, Geneva, Switzerland
23-25 November, 2015


Physiography mainly consists of River Flood Plan and Tidal Flood Plain

A big drainage of the world

CC Impacts: A net recipient
• Beneath the Himalayan range and in the most rainy area in the world
• Located at the bottom of the mighty GBM river system
• Southern part is mostly flood plain region
• 57 trans-boundary rivers coming down to it:India-54 Myanmar-3)
• Over 200 rivers and their tributaries/ distributaries

Lost 1.2% of GDP during 1994-2013 period

Major Cyclones Deaths
1970 300,000
1988 5704
1991 138,868
1997 550
2007 3406
2009 190
2012 14
Major Floods
1988 2373
1998 918
2004 747
2007 1071
Others
1996-Tornado 545
2007 & 2012-Landslide 248
Flood
Tropical Cyclone
Storm Surge
Tornado
River/ Coastal Bank Erosion
Water Logging
Drought
Erratic Rainfall
Arsenic
Landslide
Frequency of major climate events Increasing…
Frequency of Events increased over time
Increasing adaptability reduced number of deaths but economic loss increasing
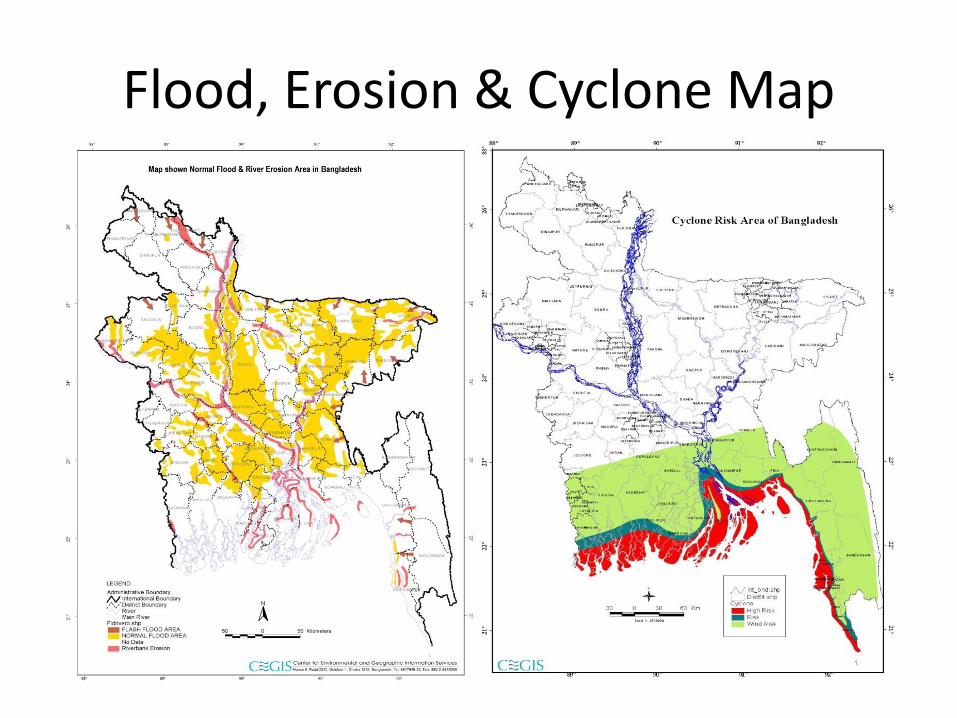
Flood, Erosion & Cyclone Map

160 m Population, Density 1100/ S.km, Growing 2 mill/ year
CC Impacts on people
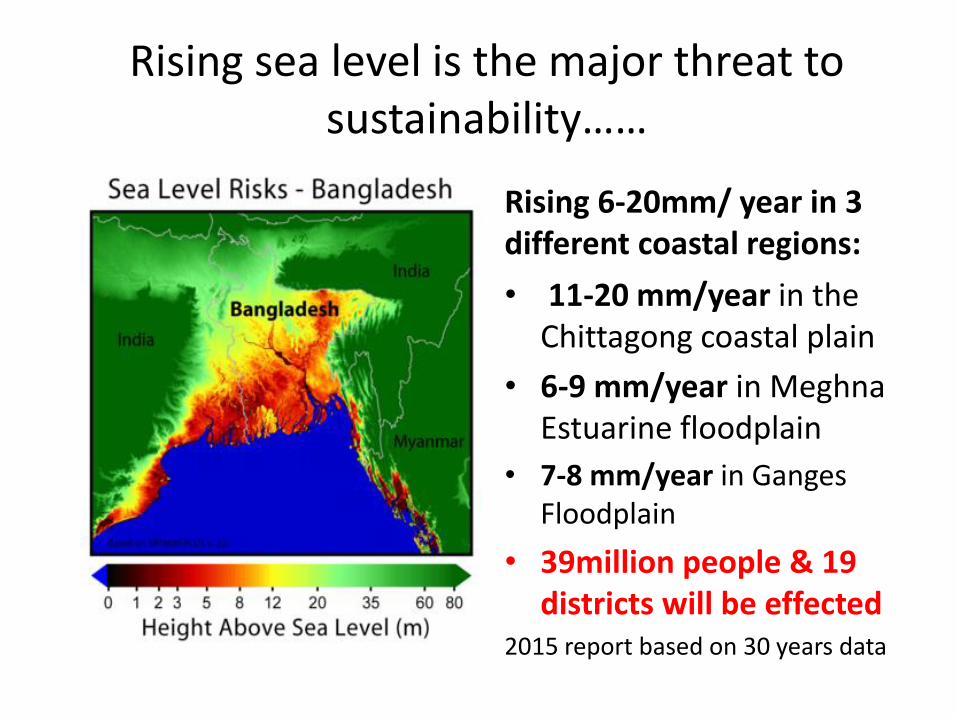
Rising sea level is the major threat to sustainability……
Rising 6-20mm/ year in 3 different coastal regions:
• 11-20 mm/year in the Chittagong coastal plain
• 6-9 mm/year in Meghna Estuarine floodplain
• 7-8 mm/year in Ganges Floodplain
• 39million people & 19 districts will be effected
2015 report based on 30 years data

Fiscal Implications of CC
Climate Change involve repair
and maintenance subsequent to
extreme weather events
Public expenditure increase
Immediate fiscal impact is due to the
immediate changes in the production
structure (hence fiscal recomposition)
and to change in the structure of public
spending
Climate change has a negative impact on
production and domestic GDP
Increasing public expenditures worsens
government deficit
Worsening of Debt/ GDP and deficit indicators
Immediate Fiscal Effects
Climate Change
Long Term Fiscal & Sustainability Effects
Adaptation involves public expense
increase focused on specific sectors
Simultaneously, reduction for elimination
in cases of total adaptation
An expense increase is created in
the period in which adaptation
expenses are concentrated
Deficit worsens
Adaptation prevents domestic GDP from being
negatively impacted by climate change
Increasing public expenditures worsens
government deficit
improvement of GDP/ Deficit and GDP/Debt
indicators since the positive effect on GDP more
than makes up for deficit worsening indicators
Immediate Fiscal Effects
Long Term Fiscal & Sustainability Effects
Adaptation to Climate Change

Steady Growth for 10+ years..
FY15 Real GDP Growth 6.51% FY15 GDP 195 billion USD

Budget deficit contained below 5%
3
3.5
4
4.5
5
5.5
6
6.5
20
00
20
01
20
02
20
03
20
04
20
05
20
06
20
07
20
08
20
09
20
10
20
11
20
12
20
13
20
14
20
15
20
16
20
17
as % of GDP
Budget deficit (excluding grants)
Budget deficit (including grants)

Debt Ratios are below thresholds (as on 30 June, 2014)
DEBT RATIOS
DEBT RATIO
PPG External Debt as % of GDP 15
Domestic Debt as % of GDP 21
Domestic Debt as % of REVENUE 190
PV of External Debt as % of EXPORT 52.9
PV of External Debt as % of REVENUE 96.4
DEBT SERVICE RATIO
Debt service as % of EXPORT 5.3
Debt Service as % of REVENUE 6.8
DEBT STOCK
External 26 Billion
USD Domestic 36 Billion
USD

Analysis of Debt Stock
External debt
44.7% Domestic
debt 55.3%
Debt stock by source
Fixed rate debt 98.2%
Variable rate debt
1.8%
Share of fixed rate debt in total public debt
Fixed rate debt 95.90%
Variable rate debt 4.1%
Share of fixed rate debt in total external public debt
Multilateral; 86%
Bilateral; 14%
. External debt stock by type of creditors

Analysis of Debt Stock
Concessional 75.8%
Multilateral semi-
concessional 2.8%
Bilateral concession
al 9.9%
Bilateral semi-
concessional 4.1%
Floating 7.4%
External MLT debt stock by instrument type
EURO; 28.67%
Yen; 15.75%
US$; 43.82%
GBP; 8.46%
Others; 3.30%
External MLT Debt Stock By Currency
T-bonds 45.5%
T-bills 17.6%
NSD instruments
29.4%
Special T-bonds 7.4%
Domestic debt stock by instruments short term;
17.64%
Medium/ long
term; 82.36%
Domestic debt stock by tenure

Analysis of Debt Stock
0
1000
2000
3000
4000
5000
6000
7000
8000
9000
20
14
20
16
20
18
20
20
20
22
20
24
20
26
20
28
20
30
20
32
20
34
20
36
20
38
20
40
20
42
20
44
20
46
20
48
20
50
20
52
Debt redemption profile (million USD)
External Domestic

Cost and Risk of Debt Portfolio is low
Risk Indicators External
debt Domestic
debt Total
debt Amount (in millions of USD) 22,586.4 27,959.0 50,545.4 Nominal debt as % GDP 16.9 20.9 37.9
PV as % of GDP 12.0 20.9 32.9 Cost of debt Weighted Av. IR (%) 1.0 9.7 5.8
Refinancing
Risk
ATM
(years) 12.9 4.5 8.3 Debt maturing in 1 year
(% of total) 4.8 26.0 16.5
Interest Rate
Risk
ATR (years) 12.7 4.5 8.1 Debt refixing in 1 year
(% of total) 8.6 26.0 18.2 Fixed rate debt
(% of total) 95.9 100.0 98.2
FX Risk
FX debt
(% of total debt) 44.7 ST FX debt
(% of reserves) 7.0
[1] MTDS template treats nominal and PV of domestic debt the same.

Sustainable Macro-fiscal Indicators
• Graduated to lower middle income country
• Debt indicators are improving and well below thresholds
• GDP per capita doubled in only 7 years
• Sustained GDP growth 2-3% (1970), 6% (FY04-14), 6.3% (FY11-16) and 6.5% in FY15
• Fiscal deficit constantly below 5% of GDP and total debt to GDP ratio has been falling
• Total 9.2 million jobs created in 5 years

Sustainability: the Social Indicators
• Attained most of the MDGs
• Poverty rare to 24.8% from 70% in 1970s
• Popn. growth decreased to 1.37% from 2.6%
• life expectancy now 70.7 yrs against 42 yrs 1970
• Under-5 mortality rate now 41 from the base- year high of 239 per 1000 live births.
• Literacy rate to 57.2% (from 24.3%); female literacy went up to 55.1% (from14.8%).
Sustaining CC Adaptation: Strategies and action plans prepared………….
• Delta Plan 2100 + Perspective Plan 2040
• Sustainable Development Strategy 2010-2021 / Climate Change Strategy Action Plan / Strategy Program for Climate Resilience
• Climate Change Unit at MoEF/ National Adaptation Program of Action
• Climate Public Expenditure & Institutional Review / Climate Fiscal Framework 2014
• Climate Change Trust Fund 2010-$385 mil/ Climate Change Resilience Fund-S189 mill

Sustaining CC Adaptation: Challenges to mainstreaming ……………
• No option but to adapt and natural adaptation skills are already high but not enough at all
• With large population are poverty stricken (24.8% of which 12% extreme poor) embedding CC into systems and processes is an additional challenge to structured adaptation
• Struggle limited to protecting marginal poor through social safety net program
• CC adaptation remains separate from systems and process
• Lack of dedicated fund makes adaptation priorities unattended

Sustaining CC Adaptation & Financing
• 6% to 7% annual budget on climate sensitive activity just over 1% of GDP
• 77% of climate sensitive financing from domestic resources (FY10 -FY12)
• Loan funding increased from 58%-82% of foreign funds (FY10 -FY12)
• Climate Fiscal Framework yet to contribute towards tracking CC related expenditure.
• Global commitment is needed for sustainability of a net recipient of CC impacts country
• 2% of GDP in the 7th FYP for Delta Plan

Successful Adaptation & Sustainability
• Submergence, drought, hail storm, salinity tolerant rice varieties
• High yielding varieties
• Photosensitive varieties
• Short and Long duration rice varieties
• Non saline tidal zone variety
• Brown Plan hopper (BPH) resistant
Successful Adaptation & Sustainability
• Government Procurement of food grains from farmers to protect from to ensure fair price
• Cash incentive for CC impact area farmers round the year
• Cropping pattern change and variety change for drought area
• Multipurpose disaster shelter
• NSS Strategy formulated to integrate operation
• Agriculture Input Assistance Card for Farmers
• Marginal, small and medium farmers get cash subsidies. 10.82 million farmers of the country will be brought under this program
• 9.8 million farmers bank account for cash transfer for seed, irrigation and other input
• Floating Garden in submerged area

Successful Adaptation & Sustainability
Sustaining CC Adaptation: Some suggestions
• Synchronize all strategies/ plans and mainstream CC
• Better tracking and analyzing climate related expenditure (GIFMIS, CFF)
• DSA should address CC related impacts on fiscal and macro economy for vulnerable countries.
• Gradual introduction of crop insurance for adaptation to CC can reduce burden on fiscal
• Spending on research and innovation for adaptation methods, financing and resilience can be strengthened

Thank you