Embed Size (px)
Citation preview

Ensuring Fair Returns in RIIO-2
Investors workshop
26 April 2018
OFFICIAL

Aims and agenda for today
2
Key areas we wish to explore with you in today’s sessions:• The range of returns that might be appropriate for regulated gas and electricity network• The need for Return Adjustment Mechanisms (RAMs) and the impact that different
options might have
The aim of today’s workshop is to get your views on the characteristics of ‘fair returns’ and understand the potential impact of our proposals from an investor’s perspective
Time Item Leading
10:00-10:15 Introduction James Veaney
10:15-11:00 Discussion on return ranges and distribution James Veaney
11:00-11:30 Description of RAMs proposals Shai Hassid
11:30-12:00 Discussion on RAMs James Veaney
• Although key to our price controls, we will not discuss methodologies to determine financial parameters in this workshop
• We encourage interested parties to respond to the relevant parts in our RIIO-2 consultation on those topics by the 2nd of May

3
We aim to align shareholder and consumer interests
• The regulatory framework should:• Incentivise companies to innovate, reduce costs and improve service• Protects consumers from paying for inefficient/unnecessary costs• And, provide a stable investment environment
• Ex ante regulation achieves this by encouraging companies to beat cost forecasts and output targets established at the time we set the price control
• But companies can gain additional benefit (or loss) if events outside of their control run in their favour (or against them), or if the original allowances and targets were too generous (or harsh)
• Our existing RIIO framework already includes protections higher than expected returns, among those:• Information revealing mechanisms – that reward companies for providing accurate/low cost plans• Uncertainty mechanisms – to adjust revenues in line with material changes • Indexation to financial parameters – where those are highly uncertain • Use of sharing factors – to ensure consumers also benefit from cost efficiencies
• In RIIO-2 we will build upon and improve the above measures
• But this does not guarantee that consumers won’t be exposed to higher than expected returns
• This is due to the uncertainties in future energy demands, complexity of the regulatory framework and the inherent information advantage networks have at the time of setting price controls

Why are we looking into RAMs?
4
• The returns being earned should reflect the level of risk companies are exposed to and their ability to drive value for consumers through their actions
• A company earning above their baseline cost of equity should be driving down costs and improving service quality. The value of that additional reward should reflect the difficulty associated with outperforming, with higher returns requiring more innovative ways of operating and developing networks.
• Where there is the prospect of additional rewards, there should also be the risk of lower returns if companies can’t step up and improve performance
• In recent price controls (other than RIIO-GT), the average return for each sector has been higher than expected and significantly higher than the baseline cost of equity
• An entire sector outperforming to this degree suggests a risk profile that is weighted towards the companies and also that their information advantage and factors outside of their control may be working in their favour
• We will draw from lessons learned from RIIO-1 but the framework is complex and next time there might be other, unforeseen, parts of the framework that lead to higher than expected returns.
CEPA found that the returns the companies earned did not reflecttheir overall risk
CEPA concludes that this was because: • The framework was ambitious
and complex, and we operated at an information disadvantage to companies
• We exposed network companies to risks that were outside of theircontrol, and some of these turned out in their favour
• Given the information advantage that network companies have over us, and the complexity of the framework, the overall balance of risks is likely to be in favour of the networks.

5
Returns to dateand the potential use of return adjustment mechanisms
Return adjustment mechanisms• For RIIO-2 we think it may be necessary to consider ‘backstop’ measures to ensure company returns are
not higher than expected.• In the RIIO-2 framework consultation, we proposed 5 options for return adjustment mechanisms. We
will discuss these in more detail shortly• To a greater or lesser degree, these help to deal with higher than expected returns. If we set the price
control effectively and identify and manage all extraneous risks, we may not need to use any of these • But as well as designing these mechanisms, we also need to consider what range of returns we expect
to see. This could help set parameters to determine when we might use a return adjustment mechanism
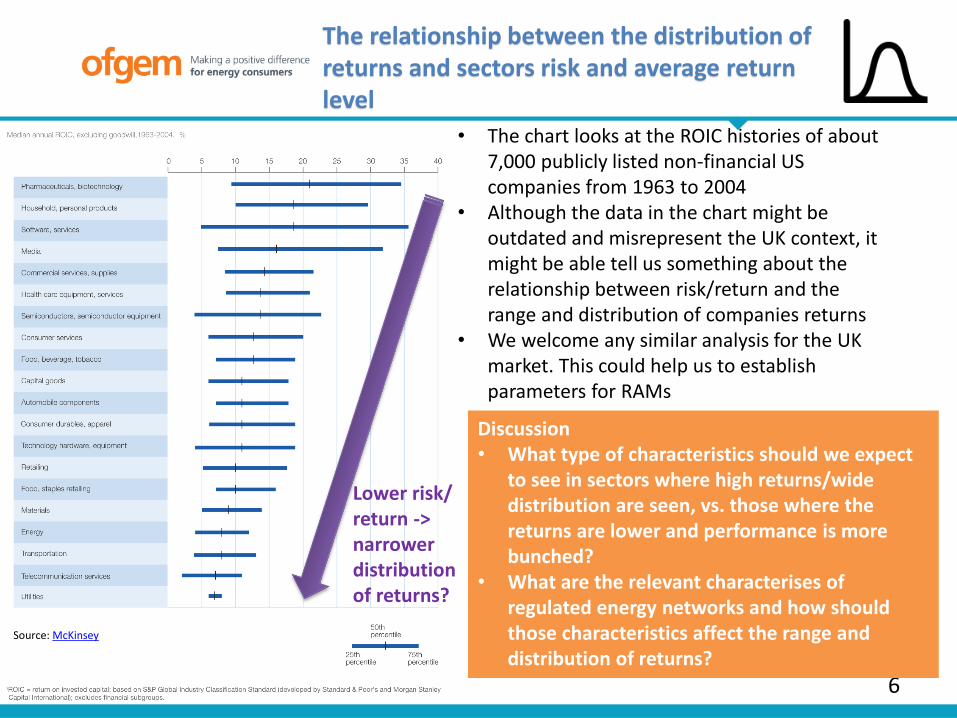
The relationship between the distribution of returns and sectors risk and average return level
6
Source: McKinsey
• The chart looks at the ROIC histories of about 7,000 publicly listed non-financial US companies from 1963 to 2004
• Although the data in the chart might be outdated and misrepresent the UK context, it might be able tell us something about the relationship between risk/return and the range and distribution of companies returns
• We welcome any similar analysis for the UK market. This could help us to establish parameters for RAMs
Lower risk/ return -> narrower distribution of returns?
Discussion• What type of characteristics should we expect
to see in sectors where high returns/wide distribution are seen, vs. those where the returns are lower and performance is more bunched?
• What are the relevant characterises of regulated energy networks and how should those characteristics affect the range and distribution of returns?

7
Return adjustment mechanisms
• Due to the asymmetry of information between Ofgem and network companies, and the asymmetric risk of decisions, it is appropriate to consider what ‘backstop’ measures might ensure company returns are not higher than expected.
• In the RIIO-2 framework consultation, we proposed 5 options for return adjustment mechanisms:
Hard cap and floor Discretionary adjustment RoRE Sharing Factor Constraining totex and output incentives Anchoring
• For this workshop we will further elaborate on the last three due to their more technical nature
• Ensuring a better understanding of how those mechanisms work would enable a more elaborate discussion on the potential effect of the mechanisms on companies levels of risk

RoRE Sharing Factor (RSF)Mechanism description
8
The mechanism adjusts individual companies’ RORE when their RORE deviates for the baseline Cost of Equity (CoE) weighted average between the CoE and a companies RORE based on a predetermined parameter – essentially applying a sharing factor on returns
Rationale Companies which achieve high returns might do so due to reasons related to their individual reporting and not necessarily because of a systematic design issue with the price controls framework. Unlike sector average anchoring, which adjusts returns based on the performance of its peers, RSF looks at individual companies’ performance only.
Properties• The sharing factor differs between over and
underspend – equally protecting consumers from upside return risk as it protects companies returns from downside risk
• Can be combined with information revealing devices – the sharing factor could be a function of the quality and ambition of the business plans submitted – the better the business plan, the higher the sharing factor (eg green vs red line)
• Includes both totex under/overspend and incentive payments – if implemented, it will remove the need for using a totex sharing factor
• Unlike ‘anchoring’, it does not provide a complete backstop to a sectoral high average
Sculpted Sharing factor: meaning that the more a company’s return exceeds base CoE, the higher the percentage of RORE a company will be required to share. The opposite applies when a company performs below the base CoE.
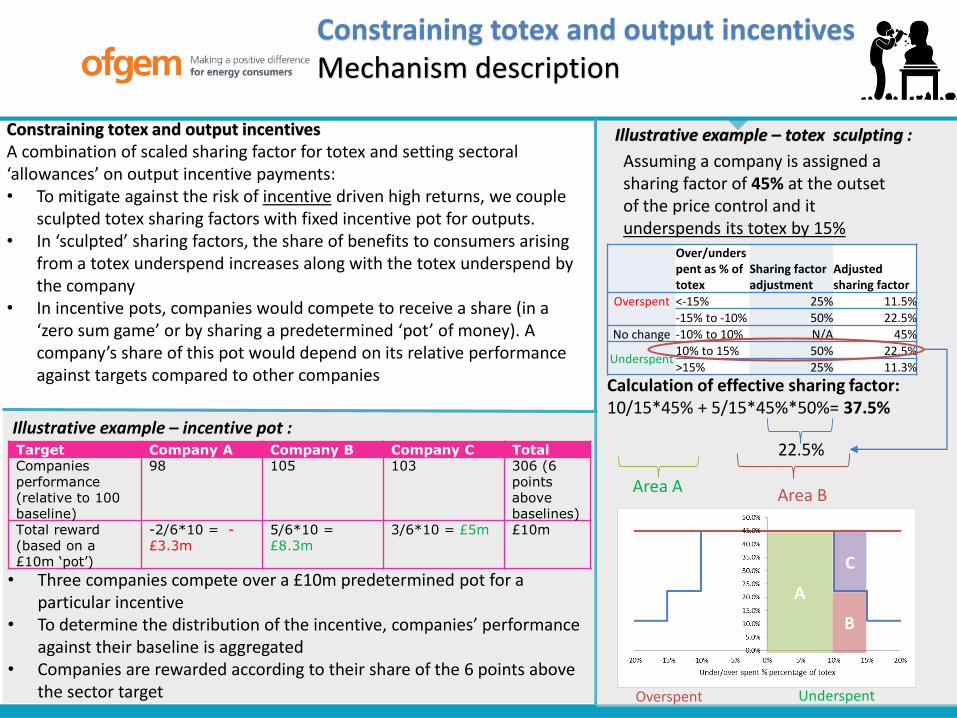
Assuming a company is assigned a sharing factor of 45% at the outset of the price control and it underspends its totex by 15%
Calculation of effective sharing factor:10/15*45% + 5/15*45%*50%= 37.5%
Illustrative example – totex sculpting :
Over/underspent as % of totex
Sharing factor adjustment
Adjusted sharing factor
Overspent <-15% 25% 11.5%-15% to -10% 50% 22.5%
No change -10% to 10% N/A 45%
Underspent10% to 15% 50% 22.5%>15% 25% 11.3%
22.5%
Area B Area A
UnderspentOverspent
A
B
C
Constraining totex and output incentivesA combination of scaled sharing factor for totex and setting sectoral ‘allowances’ on output incentive payments:• To mitigate against the risk of incentive driven high returns, we couple
sculpted totex sharing factors with fixed incentive pot for outputs. • In ‘sculpted’ sharing factors, the share of benefits to consumers arising
from a totex underspend increases along with the totex underspend by the company
• In incentive pots, companies would compete to receive a share (in a ‘zero sum game’ or by sharing a predetermined ‘pot’ of money). A company’s share of this pot would depend on its relative performance against targets compared to other companies
Illustrative example – incentive pot :Target Company A Company B Company C Total Companies performance (relative to 100 baseline)
98 105 103 306 (6 points above baselines)
Total reward (based on a £10m ‘pot’)
-2/6*10 = -£3.3m
5/6*10 = £8.3m
3/6*10 = £5m £10m
• Three companies compete over a £10m predetermined pot for a particular incentive
• To determine the distribution of the incentive, companies’ performance against their baseline is aggregated
• Companies are rewarded according to their share of the 6 points above the sector target
Constraining totex and output incentivesMechanism description

AnchoringMechanism description
10
Anchoring would adjust revenues so that the ex post equity-weighted average return for a sector is adjusted to a predetermined cap/floor when it drifts outside this range
Rationale Sector average anchoring arises from the determination that a sector as a whole should not achieve returns above a certain threshold. Hence, a sector that systematically exceeds the threshold might be a result of setting inaccurate levels of outputs and allowed revenue across the sector.
Absolute adjustment Proportional adjustment Targeted adjustment
All companies are adjusted downwards by 2 percentage points
All companies are adjusted downwards by the percentage of the sector outperformance. In this example , 2/6 –33% cut to RORE for each company
Only companies that perform above the cap are adjusted proportionally to their outperformance until the sector average aligns with the cap
Implementation options – using an illustrational example: Assuming a sector with 3 companies and a ‘collar’ of 2% around a 4% base cost of equity. The sector weighted average RORE turns out to be 8% (outperformance of 2 percentage points above the cap)
-2
-2-2
-3
-1.8 -1.3
-5.1
-0.9 0
11
Discussion on RAMs
RAMs interaction with risks • How might different applications of benchmarking (eg
anchoring or ‘pot’ incentives) affect companies risk profile? • Would making the mechanisms symmetrical (eg a collar
around COE) mitigate some of the above effects? • Would sculpted sharing factors (either RORE or totex)
change companies levels of risks?
Metrics• Which is the most suitable metric to base return
adjustments to network companies? Is it RORE? Should it also account for cost indexed measures such as cost of debt?

12
Timelines
• Publish a framework decision this summer
• Consult on sector specific methodologies by the end of this year (RAMs to be applied for each sector)
• Issue a sector specific Methodology Decision – early Q2 2019
Next steps

Concluding remarks
13