Embed Size (px)
Citation preview

Mile High Connects
July 12, 2012
Stephanie Pollack
Dukakis Center for Urban & Regional Policy Northeastern University
Ensuring Equity in
Transit-Oriented Development

Transit, Transit Oriented Development and Equity

We need to clarify what we mean when we talk about
●Equity
●Transportation (and/or Transit) Equity
●Equitable Transit-Oriented Development (TOD)
Dukakis Center for Urban & Regional Policy Northeastern University

A working definition of equity
Equity refers to an ideal state in which everyone has full and equal access to opportunities and amenities, regardless of their race or ethnicity, gender, age or wealth.
Dukakis Center for Urban & Regional Policy Northeastern University

Why should we care about equity?
● Of course we should care about equity for reasons of social equity
● In addition, failure to address equity undermines the effectiveness of transit investment and transit-oriented development
● Equity affects ●Transit ridership
●Neighborhood development patterns and neighborhood change
●TOD success
●Location efficiency

Transit and location efficiency: Travel time matters

My research
● Study on neighborhood change impacts of new transit investment
● Development of metrics for sustainable transportation for greater Boston
● Including equity metrics
● Development, working with the Center for Transit-Oriented Development, of a “rating system” for equitable TOD
● Community-driven survey/focus group research on transportation needs of low-income, particularly Latino, families in Massachusetts

Dukakis Center for Urban & Regional Policy Northeastern University
TOD that endangers equity: Gentrification and displacement
● Gentrification: a pattern of neighborhood change characterized by increasing property values and incomes
● Displacement: a pattern of neighborhood change in which current residents are involuntarily forced to move out because they cannot afford the gentrified neighborhood

Dukakis Center for Urban & Regional Policy Northeastern University
TOD that endangers equity: Inequitable patterns of neighborhood change
●Adverse consequences of gentrification
●Higher housing cost burdens for renters who stayed in the transit-rich neighborhood
●A rising number of automobile-owning households less likely to use transit for commuting

Dukakis Center for Urban & Regional Policy Northeastern University
Breaking the cycle of unintended consequences

Dukakis Center for Urban & Regional Policy Northeastern University
A Toolkit for Equitable Neighborhood Change in Transit-Rich Neighborhoods
http://www.dukakiscenter.org/TRNEquity

Metrics: A sustainable transportation system ● Allows everyone to have
equitable access to a region’s important goods, services and destinations;
● Provides users with real transportation choices that are affordable, safe and convenient; and
● Ensures long-term environmental sustainability, minimizing greenhouse gas emissions and other undesirable environmental impacts
Equity Accessibility
Affordability
Convenience Safety
Sustainability

Measuring transportation (in)equity
● How can we measure “equity” in commute times?
● Indicator should
capture both
●Differences in
modes used to
commute
●Residential segregation
patterns and “spatial
mismatch”

Constructing an “indicator” of transportation (in)equity
0
20
40
60
80
100
120
140
160
180
Black vs. whiteauto commuter
Black vs. whitebus rider
Black bus ridervs. white auto
commuter
Travel Time Penalty
Travel Time Penalty
Annual
Hours of
“Excess”
Commute
Time

Travel time penalty as a measure of transportation equity
0
20
40
60
80
100
120
140
160
180
Black vs. whiteauto commuter
Black vs. whitebus rider
Black bus ridervs. white auto
commuter
Travel Time Penalty
Travel Time Penalty
Annual
Hours of
“Excess”
Commute
Time
By way of comparison, Boston commuters experience an average “travel
time penalty” of 48 additional hours of delay annually due to traffic
congestion (making the region the 10th most congested metro in the US)

Creating a Rating System for Equitable TOD
Affordability Inclusiveness
Density Block size
Lower VMT/ Higher Ridership
Greater Equity Outcomes
Equitable Transit-
Oriented Development
Places People

Why station areas (and walkability) matter
Source: American Public Transportation Association, A Profile of Public Transportation Passenger Demographics and Travel Characteristics Reported in On-Board Surveys (May 2007)

The First Commandment: Know Thy Riders
● On-board surveys of transit riders
● Travel (diary) surveys
● American Community Survey (Census) data
● At-home (or at-work) surveys
Source: Chu, Xuehao. March 2012. An Assessment of Public Transportation Markets Using NHTS Data (National Center for Transit Research at University of South Florida)

Freeing captive riders: Focusing on core transit users
Dukakis Center for Urban & Regional Policy Northeastern University

On-board surveys: National data
● Largest ever on-board survey study about public transportation
● Compiled data from 150 on-board vehicle passenger surveys conducted by public transportation agencies from 2000 through 2005
● Summarized the results of questionnaires completed by over 496,000 public transit riders sampled by transit systems that carry 60 percent of all transit trips in the United States.

Who uses transit? National data from on-board surveys
Source: American Public Transportation Association, A Profile of Public Transportation Passenger Demographics and Travel Characteristics Reported in On-Board Surveys (May 2007)

On-board surveys: Boston data

What do we know about the income of MBTA riders?

What do we know about the race of MBTA riders?

What do we know about how transit is used?
76.2%
7.3%
2.0%
2.5% 4.5%
7.5%
Subway
Work-related
School
Shopping
Social
Personal
Other
91%
3% 0% 1%
2% 3%
Commuter Rail Work-
related School
Shopping
Social
64%
11% 4%
2%
6%
13%
Bus Work-
related School
Shopping
Social
Personal
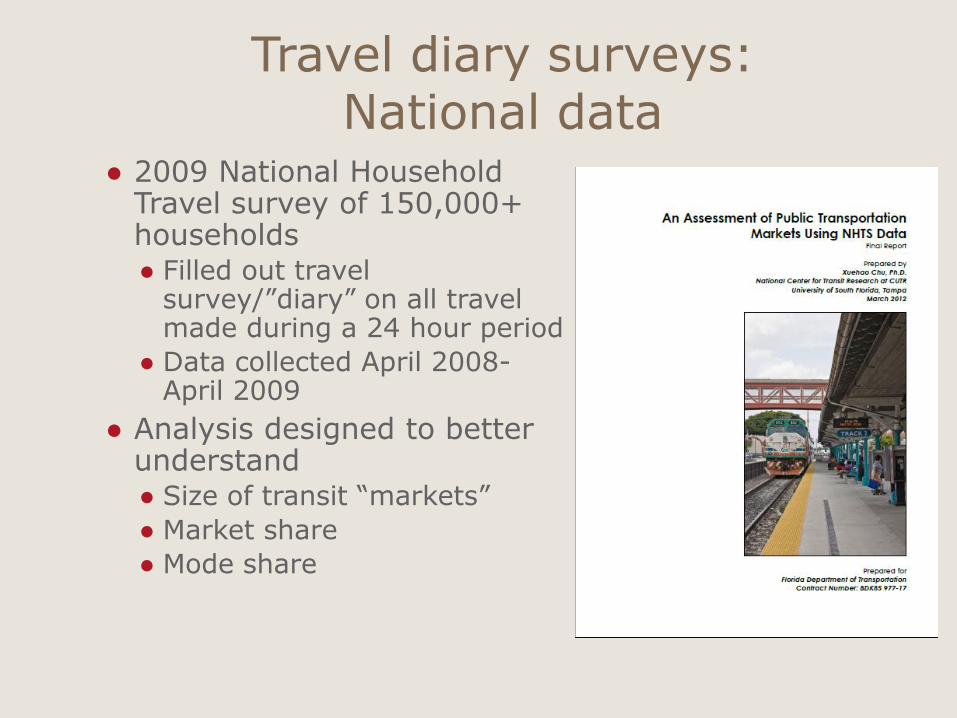
Travel diary surveys: National data
● 2009 National Household Travel survey of 150,000+ households ● Filled out travel
survey/”diary” on all travel made during a 24 hour period
● Data collected April 2008-April 2009
● Analysis designed to better understand ● Size of transit “markets”
● Market share
● Mode share

Analysis of NHTS Data: Transit “Market Segments”
Source: Chu, Xuehao. March 2012. An Assessment of Public Transportation Markets Using NHTS Data (National Center for Transit Research at University of South Florida)
01020304050607080
Imm
igra
nts
Hispa
nics
Black
s (n
on-H
ispa
nic)
White
s (n
on-H
ispa
nic)
%
% US Population
% Transit Market

Analysis of NHTS Data: Transit “Market Segments”
Source: Chu, Xuehao. March 2012. An Assessment of Public Transportation Markets Using NHTS Data (National Center for Transit Research at University of South Florida)
05
1015202530354045
Low
Incom
e
Mid
dle
Low
Incom
e
Mid
dle
Hig
h
Incom
e
Hig
h I
ncom
e
%
% US Population
% Transit Market

Analysis of NHTS Data: Transit “Market Segments”
Source: Chu, Xuehao. March 2012. An Assessment of Public Transportation Markets Using NHTS Data (National Center for Transit Research at University of South Florida)
0102030405060708090
100
Zer
o V
ehic
les
Veh
icle
s<W
orke
rs
Veh
icle
s>=W
orke
rs
%
% US Population
% Transit Market

American Community Survey S0802 data: Just remember, not not everyone works
Source: American Public Transportation Association, A Profile of Public Transportation Passenger Demographics and Travel Characteristics Reported in On-Board Surveys (May 2007)

Race
United States Denver
Dukakis Center for Urban & Regional Policy Northeastern University

Citizenship Status
United States Denver
Dukakis Center for Urban & Regional Policy Northeastern University

Poverty Level
United States Denver
Dukakis Center for Urban & Regional Policy Northeastern University

Housing Status
United States Denver
Dukakis Center for Urban & Regional Policy Northeastern University

Vehicle Ownership
United States Denver
Dukakis Center for Urban & Regional Policy Northeastern University

The relationship between equity and TOD performance

Explaining VMT: Combined Transit Score
Dukakis Center for Urban & Regional Policy Northeastern University
● R-squared = 78.4%
● VMT has a direct linear relationship with quality of transit
● As transit quality goes up, VMT goes down

Explaining VMT: Population Density
Dukakis Center for Urban & Regional Policy Northeastern University
●Higher population density is correlated with lower VMT

Explaining VMT: Median Household Income
Dukakis Center for Urban & Regional Policy Northeastern University
● In general, as median household income in a station area increases, VMT also increases
● This relationship is not as strong as combined transit score or population density

Explaining VMT: Income Less than $25,000 ● The relationship is
stronger when considering the proportion of the population with household income less than $25,000
● As the proportion of poor people rises, VMT declines
Dukakis Center for Urban & Regional Policy Northeastern University

Explaining VMT: Renters
●As the proportion of renters in a station area increases, VMT decreases
Dukakis Center for Urban & Regional Policy Northeastern University

Explaining VMT: Race and Ethnicity
Percent Non-White Percent Hispanic
Dukakis Center for Urban & Regional Policy Northeastern University

Explaining VMT: Vehicle Ownership
●As the number of available cars increases, VMT also, unsurprisingly, increases
Dukakis Center for Urban & Regional Policy Northeastern University

Explaining VMT: Vehicle Ownership (few cars)
Dukakis Center for Urban & Regional Policy Northeastern University
●The relationship between owning fewer vehicles and lower VMT is even stronger than the relationship between number of cars and VMT

Explaining VMT: Vehicle Ownership (no cars)
●The relationship between percent households with 0 cars and VMT explains most of the previous relationship
Dukakis Center for Urban & Regional Policy Northeastern University

Explanatory Power (R-squared)
VMT ABC
Vehicle Ownership 80.5% 80.5%
Population Density 54.0% 76.5%
Combined Transit Score 68.5% 72.7%
Percent Renters 65.0% 53.1%
Median Household Income 28.1% 12.7%
Dukakis Center for Urban & Regional Policy Northeastern University

Dukakis Center for Urban & Regional Policy Northeastern University
Transit Oriented Development (TOD) that enhances equity: Serving core riders
● Core riders include
●People of color
●Low and Lower Middle Income Households
● Immigrants
●Renters
●Zero Vehicle Households ● And those with “inadequate
vehicles”
● Transit stations need “transit-oriented neighbors” who will
regularly use the system

Concluding Thoughts ● Getting TOD “right” ensures
that transit investments pay off by ensuring transit-oriented neighbors who will be regular riders
● Gentrification concerns should be addressed by shaping the TOD to achieve equity objectives – which will also serve to maximize ridership and reduce driving
Dukakis Center for Urban & Regional Policy Northeastern University

Developing a best practices toolkit for equitable TOD

A framework for addressing regional equity
Dukakis Center for Urban & Regional Policy Northeastern University
“Opening up”
higher opportunity
communities
Improving lower opportunity
communities (“development
without displacement”)
Connecting “lower
opportunity
communities” to
opportunity
elsewhere in the
region through
better
transportation
connections

How do equity concerns vary for each piece of this framework?
● TOD in areas of lower opportunity/concentrated poverty
● How can we ensure that TOD respects the vibrancy of existing communities and adds value to what is already in place?
● Can we measure risk factors for gentrification/
displacement and address those in TOD planning?
● TOD in areas of higher opportunity
● How can we maximize benefits to everyone in the region, rather than just those living nearby?
● How can we maximize region-wide access to new amenities and opportunities in such TOD projects?
● Transportation connections
● How can we prioritize transportation investments that create access to opportunity?
● How can we keep transit affordable for all?
Dukakis Center for Urban & Regional Policy Northeastern University
What
other
questions
should we
be asking
ourselves?

Dukakis Center for Urban & Regional Policy Northeastern University
We need a bigger toolkit ● Planning tools
● Housing market tools
● Financing tools
● Infrastructure funding
●Funding for mixed-use, mixed-income development
● Transportation management tools
● Jobs/economic development tools
● Data tools

Planning tools
Equity Objective:
Everyone with a stake in a community’s future has the opportunity to participate in planning and the ability
to hold government officials and developers accountable for ensuring equitable development
Dukakis Center for Urban & Regional Policy Northeastern University
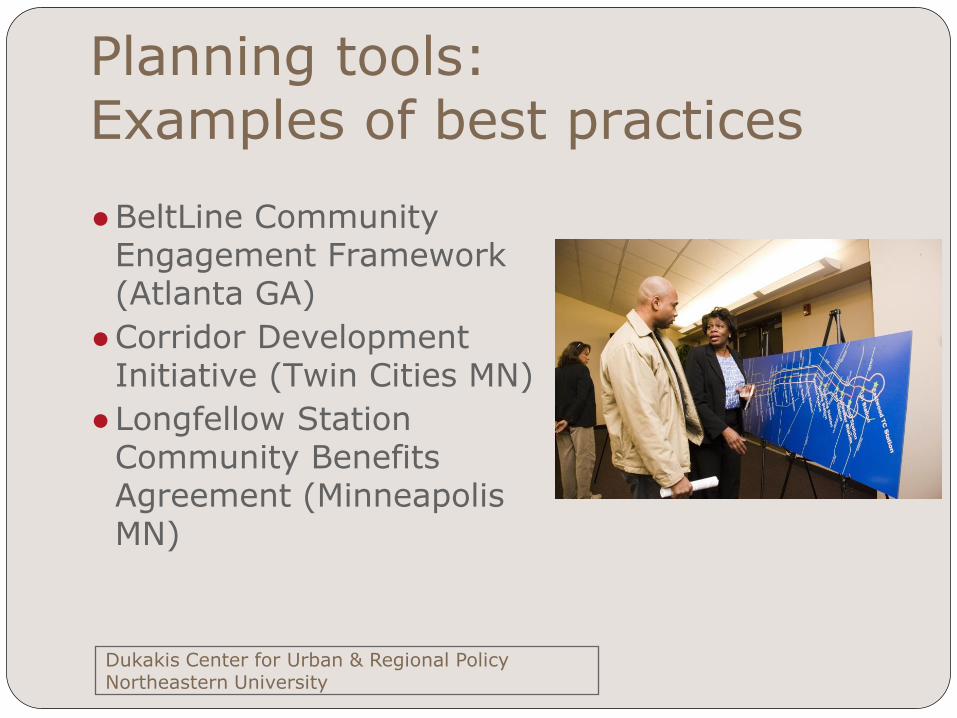
Planning tools: Examples of best practices
●BeltLine Community Engagement Framework (Atlanta GA)
●Corridor Development Initiative (Twin Cities MN)
●Longfellow Station Community Benefits Agreement (Minneapolis MN)
Dukakis Center for Urban & Regional Policy Northeastern University

Dukakis Center for Urban & Regional Policy Northeastern University
Planning tools: Fairmount Line CDC Collaborative
●4 (now 5) CDCs in low-income commuter rail corridor
●Started with “vision” document
●Now have a pipeline of over 1500 new and preserved housing units and 780,000 sf of commercial space
●Planning underway for a 9 mile greenway

Housing market tools
Equity Objective:
Lower income households have
access to homes in neighborhoods that allow them to keep
their combined housing and transportation costs affordable
Dukakis Center for Urban & Regional Policy Northeastern University

Housing market tools: Examples of best practices
● Inclusionary zoning (eg Carlsbad CA and Bridge Housing’s Poinsettia Station TOD)
● Community land trusts (Sawmill Community Land Trust,
Albuquerque NM)
● Incentive programs for housing production (Massachusetts
Chapter 40R, San Francisco Housing Incentive Program)
Dukakis Center for Urban & Regional Policy Northeastern University

Housing market tools: Tri-Met Joint Development ● Joint development policy
specifically addresses affordable housing
● Able to “write down” land acquisition cost of properties acquired for transit construction by accounting for future transit fare revenues
● Examples
●Collins Circle
●West Gresham apartments Dukakis Center for Urban & Regional Policy Northeastern University

Financing tools
Equity Objective:
Investment is provided for infrastructure
and/or transit-oriented development without
exacerbating inequitable patterns of neighborhood change
Dukakis Center for Urban & Regional Policy Northeastern University

Financing tools: Examples of best practices
● Affordable housing set-asides in Tax Increment Financing districts (BeltLine Affordable Housing Trust Fund in Atlanta GA)
● Capital grant programs (Metro TOD Program in Portland, MassWorks in MA)
● TOD acquisition funds (Denver, Bay Area)
Dukakis Center for Urban & Regional Policy Northeastern University

Financing tools: Dallas TOD Tax Increment Financing District ● TIF district along a corridor
instead of for individual stations
● Allows for revenue sharing from higher value to lower value station areas
● For example, for Mockingbird station
●40% stays in station area
●40% goes to lower value area
●20% goes to affordable housing anywhere in the corridor
Dukakis Center for Urban & Regional Policy Northeastern University

Transportation management tools
Equity Objective:
Combined housing and transportation costs are
reduced, and car ownership is discouraged, for residents
of transit-rich neighborhoods
Dukakis Center for Urban & Regional Policy Northeastern University

Transportation management tools: Examples of best practices
●Car sharing (SF City Car Share, Hoboken Corner Cars)
●Elimination of parking minimums (Seattle)
● “Unbundling” cost of parking (San Francisco)
Dukakis Center for Urban & Regional Policy Northeastern University

Dukakis Center for Urban & Regional Policy Northeastern University
Transportation management tools: Residential ECO Pass Program
● Santa Clara Valley Transportation Authority offers the program to developer/owner of a residential community
● Community buys passes for all residents at a deeply discounted price
● Affordable housing developers have used the program to reduce required parking
“An urban structured parking
space can cost from $22,000
to $40,000 per space.
Saving the cost of
construction of two parking
spaces pays for our entire
Eco Pass program.”
Jeff Oberdorfer
Executive Director
First Community Housing

Jobs/economic development tools
Equity Objective:
Workers of all incomes and
educational levels can find jobs
located near public transportation
Dukakis Center for Urban & Regional Policy Northeastern University

Jobs/economic development tools: Examples of best practices
● Geographically-targeted economic development incentives (Illinois Business Location Efficiency Act)
● Employer “Live Near Your Work” programs (Maryland Smart Keys 4 Employees)
● Community Benefit Agreements
Dukakis Center for Urban & Regional Policy Northeastern University

Jobs/economic development tools: NJ Urban Hub Tax Credit
●Rewards businesses that create specific numbers of jobs within one-half mile of a transit hub
● Initial investment of $352 million for 9 projects is credited with attracting $910 million in private capital and creating more than 1,400 new jobs
Dukakis Center for Urban & Regional Policy Northeastern University
Teachers Village TOD in Newark

Data tools
Equity Objective:
Data that can help individuals and
communities shape equitable development is widely available in user-friendly formats
that are free and available to all
Dukakis Center for Urban & Regional Policy Northeastern University

Data tools: Examples of best practices
●MetroPulse (Chicago Metropolitan Agency for Planning)
●Housing + Transportation Affordability Index
●Center for Transit Oriented Development’s TOD Data Base
Dukakis Center for Urban & Regional Policy Northeastern University
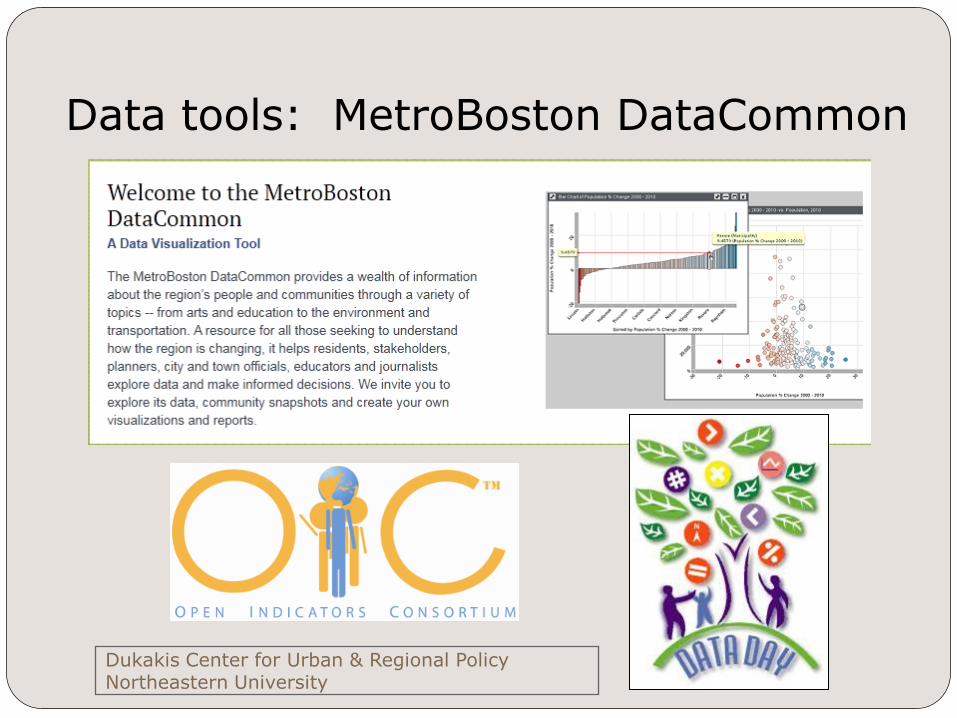
Data tools: MetroBoston DataCommon
Dukakis Center for Urban & Regional Policy Northeastern University