Embed Size (px)
Citation preview

Ensuring Better Use of School Finance Reform Dollars:
Lessons from Kentucky, New Jersey, Texas and Arkansas
Lawrence O. PicusUSC Rossier School of Education
Michelle Turner ManganCPRE UW-Madison
Lawrence O. Picus and Associates

Lawrence Picus and Michelle Turner Mangan
Session Overview
• Trends in School/District Response to Finance Reform
• Early CPRE Findings in KY, TX and NJ• Application of the Evidence Based
Model in Arkansas • Implications for future research and
policy

Lawrence Picus and Michelle Turner Mangan
Early Findings in Three States
• Kentucky • Rose v. Council for Better Education
• First “adequacy” decision
• Dramatic restructuring of KY Education
• Funding (SEEK)
• Assessment
• Outcome
• More funds
• Improved student performance
• Recent adequacy ruling in new suit

Lawrence Picus and Michelle Turner Mangan
Early Findings in Three States
• Texas• Edgewood case
• Perot reforms
• State assessment system
• Data availability
• Recent court case and Legislative actions
• Results
• More funding
• Greater Equity
• No clear improvement in performance

Lawrence Picus and Michelle Turner Mangan
Early Findings in Three States
• New Jersey • Cahill v. Robinson • Abbott Case • Changes in spending patterns
• Foundation program adequate for Success for All program
• Abbott districts’ funding equal to high spending districts
• Findings • High spending
• Student performance

Lawrence Picus and Michelle Turner Mangan
Conclusions from Studies of the 1990s
• Equity Findings • School finance equity improved in most
states
• States generally “equalized up”
• Wealthy districts shifted from low tax high spending to high tax high spending
• Poor districts went from high tax low spending to low tax low spending

Lawrence Picus and Michelle Turner Mangan
Conclusions About the Use of Education Dollars
• Steady increase in per pupil spending• Consistent pattern of expenditures over
time, location, and expenditure level • Change in composition of instruction
expenditures • Administration is not overly large • Increase in spending not matched by
increases in student achievement

Lawrence Picus and Michelle Turner Mangan
Conclusions from Early Adequacy Implementation
• Districts often did not follow model recommendations in making spending decisions
• There are many existing programs that “work” to improve student learning
• Need to think about “resources” not dollars

Lawrence Picus and Michelle Turner Mangan
Instructional Materials
Pupil Support: Parent/CommunityOutreach/Involvement
Gifted
Tutors and pupil support:1 per 100 at risk
Elem 20%
Middle20%
High School 33%
The Evidence Based Model:Students Ready for College, Work in the Global Economy, & Citizenship
K-3: 15 to 14-12: 25 to 1
State and CESAs
District Admin Site-based Leadership
TeacherCompensation
ELL1 per100
Technology

Lawrence Picus and Michelle Turner Mangan
What happened after school finance reform in Arkansas?
Changes resulting from Act 59: 2004 to 2006• Local Revenue up 14%• State Revenue up 68%
• Categorical Revenue increased from $10 per student to $400 per student
• Total Revenue up 42%• Current Expenditures up 20%• Expenditures closer to the national average

Lawrence Picus and Michelle Turner Mangan
Did Arkansas Schools Use New Funds Effectively?
• School level fiscal data were not available• Lawrence O. Picus and Associates
Contracted to study school uses of resources
• Study Goals • Identify how resources are used by educational
strategies
• Identify the strategies built into the Arkansas funding model

Lawrence Picus and Michelle Turner Mangan
Resource Use in Arkansas: A Preliminary Analysis
Random Sample of 107 schools• 55 Elementary• 17 Middle• 35 High Schools
48,132 Students• Average 53% NSL• Average 13% Special Education• Average 5% ELL
Lawrence Picus and Michelle Turner Mangan
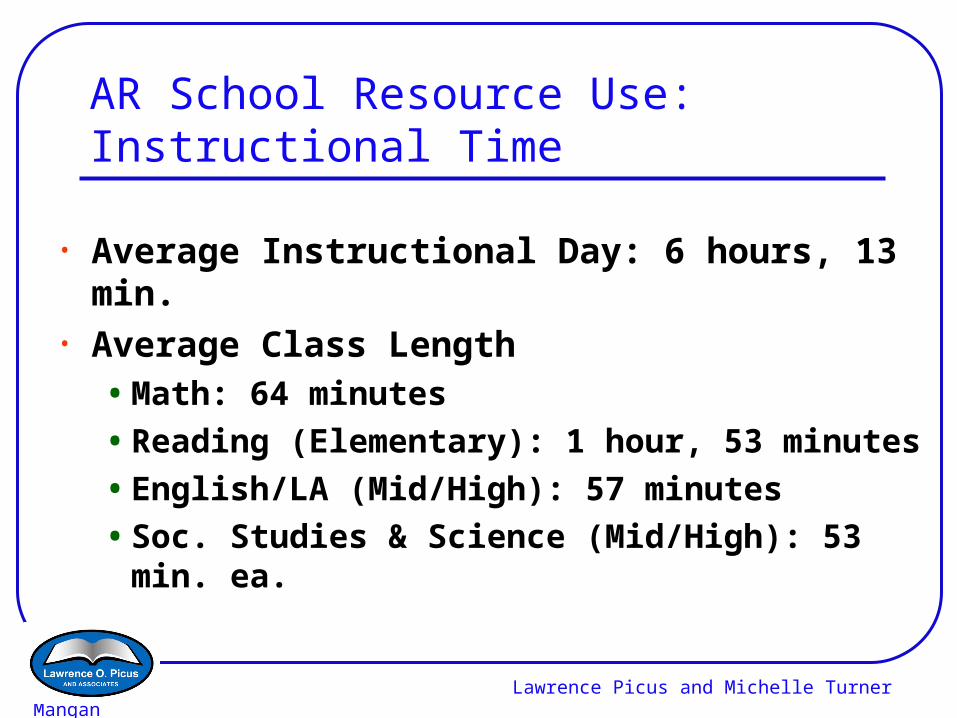
AR School Resource Use: Instructional Time
• Average Instructional Day: 6 hours, 13 min.• Average Class Length
• Math: 64 minutes
• Reading (Elementary): 1 hour, 53 minutes
• English/LA (Mid/High): 57 minutes
• Soc. Studies & Science (Mid/High): 53 min. ea.

Lawrence Picus and Michelle Turner Mangan
Resource Use in the Average School in the Total Sample
Staffing Funding Model Sample
Principal 0.90 0.97*
Instr. Facilitator 2.25 0.45
Secretary 1.80 1.51**
Core Teachers 18.66 18.55
Spec. Teachers 3.73 7.62
Tutors 2.69 0.31***
Librarian 0.63 0.93
Pupil Support 2.25 3.51

Lawrence Picus and Michelle Turner Mangan
Arkansas: Actual Resource Use in the Sample
Staffing Funding Model Actual
Principal 96 104
Asst. Principal 0 63
Instr. Facilitator 241 49
Core Teachers 1,997 1,984
Spec. Teachers 399 815
Instructional Aides 0 389
Tutors 288 34
Librarian 67 99
Pupil Support 241 376

Lawrence Picus and Michelle Turner Mangan
AR School Resource Use: Students per Core Teacher
State Funding Model
Actual
Elementary 23:1Range (13-24):1
Average 20:1
Middle 25:1Range (11-35):1
Average 25:1
High 25:1Range (10-41):1
Average 29:1
Lawrence Picus and Michelle Turner Mangan
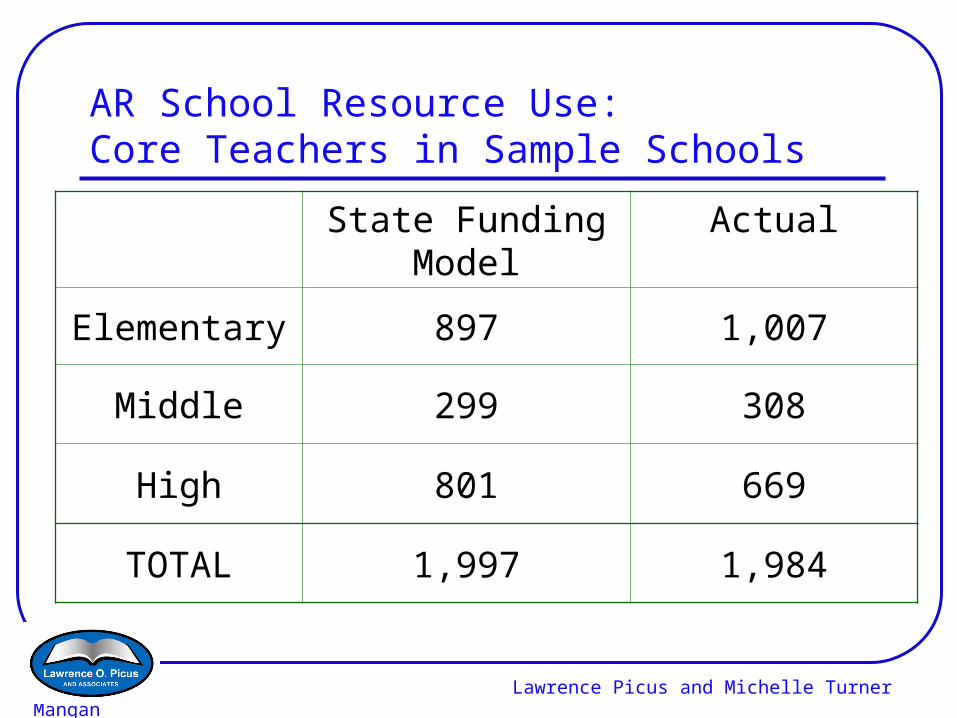
AR School Resource Use: Core Teachers in Sample Schools
State Funding Model
Actual
Elementary 897 1,007
Middle 299 308
High 801 669
TOTAL 1,997 1,984

Lawrence Picus and Michelle Turner Mangan
AR School Resource Uses: Instructional Aides
• 37 Library Aides• 49 Resource Room Aides• 20 ELL Aides• 52 Other Extra Help Aides• 61 Special Education Inclusion Aides• 57 Special Ed. Resource Room Aides• 113 Other Instructional Aides= Total of 389 Instructional Aides

Lawrence Picus and Michelle Turner Mangan
AR School Resource Uses: Tutors
NSL Concentration
State Funding Model Actual in Sample
< 70%1 Tutor for Every 100
Students = 17717
70-89%2 Tutors for Every 100
Students = 9315
≥90%3 Tutors for Every 100
Students = 182
TOTAL 288 34

Lawrence Picus and Michelle Turner Mangan
Arkansas: The High School Schedule
• Trends • Lots of electives and a 7 period day
• Football, basketball, & baseball as classes in addition to physical education
Lawrence Picus and Michelle Turner Mangan
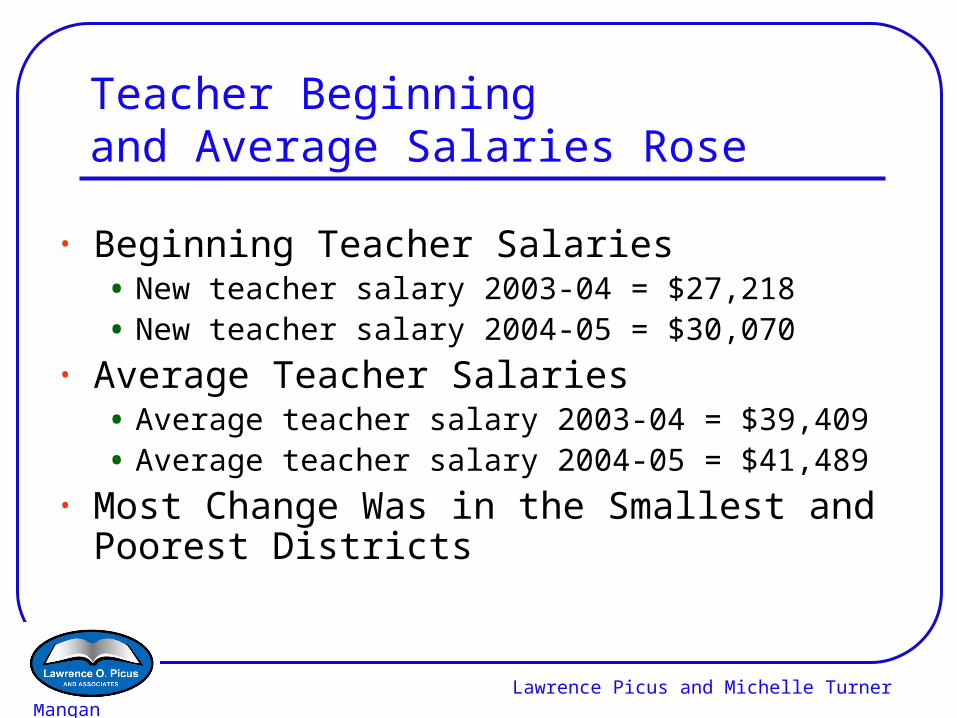
Teacher Beginning and Average Salaries Rose
• Beginning Teacher Salaries• New teacher salary 2003-04 = $27,218• New teacher salary 2004-05 = $30,070
• Average Teacher Salaries• Average teacher salary 2003-04 = $39,409• Average teacher salary 2004-05 = $41,489
• Most Change Was in the Smallest and Poorest Districts

Lawrence Picus and Michelle Turner Mangan
What Happened in Arkansas?• Increased resources based on Evidence
Based Model• Districts were not required to use resources
according to the model• Districts did not use new resources for the
evidence-based, high impact strategies

Lawrence Picus and Michelle Turner Mangan
What Happened in Arkansas?
• Class Size• Elementary class size averaged 20 with funding for 23• Middle school class size averaged 25 with funding for
25• High school class sizes averaged 29 with funding for 25
• Specialist Teachers• Sample schools had 815 specialists• Total was 40% of core teachers • Model provided 399 or 20% of core teachers

Lawrence Picus and Michelle Turner Mangan
What Happened in Arkansas?• Instructional Coaches
• Schools averaged 0.20 instructional coaches for every 200 students• The model funded 1 coach per 200 students • Instructional coaches may have been present in the districts, but
were not available at the school level • Teacher Tutors
• Schools averaged 0.15 tutors for every 100 poverty students • The model funded 1 per 100• Rather than using the resources for extra help, many local
educators wanted to use the “extra help” resources for smaller classes and higher salaries, neither of which provides extra help for struggling students.

Lawrence Picus and Michelle Turner Mangan
What Happened in Arkansas?• Teacher Salaries
• Most districts increased teacher salaries • They used the dollars provided for extra training
days in the model • But few expanded systemic professional
development.• Weak leadership at all levels (school,
district, intermediate and state) to support strategies known to double student performance

Lawrence Picus and Michelle Turner Mangan
What Should Happen Now
• Put some constraints on use of some resources:• NSL money focused on tutoring • Instructional facilitators
• Mount a statewide leadership and capacity development strategy to “double” student performance over the next ten years
Lawrence Picus and Michelle Turner Mangan
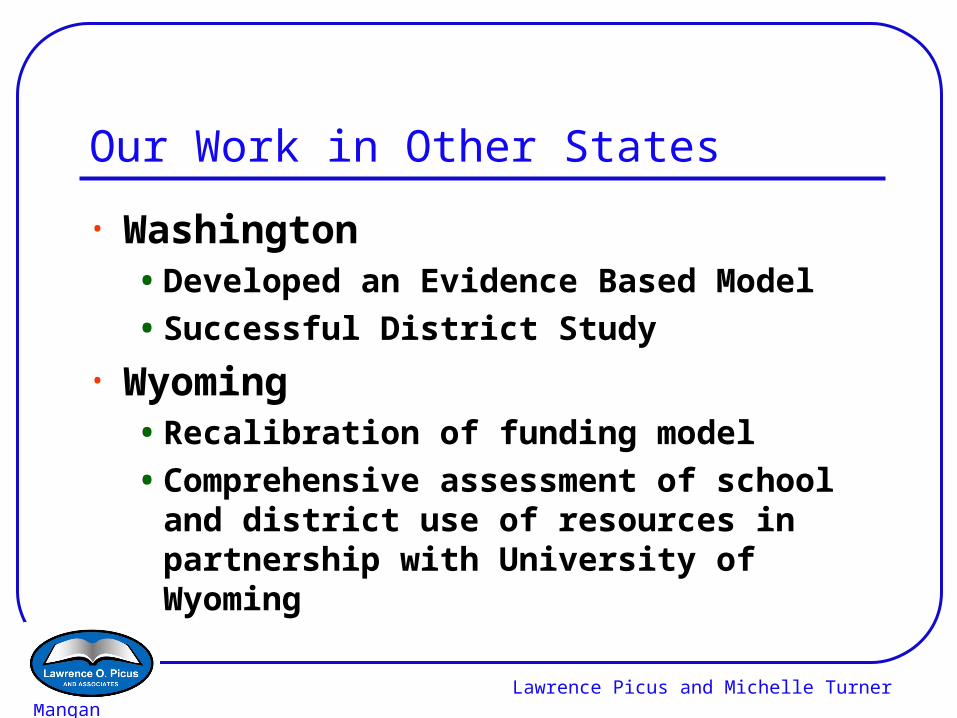
Our Work in Other States
• Washington • Developed an Evidence Based Model
• Successful District Study
• Wyoming • Recalibration of funding model
• Comprehensive assessment of school and district use of resources in partnership with University of Wyoming

Insuring Better Use of School Finance Reform Dollars:
Lessons from Kentucky, New Jersey, Texas and Arkansas
Supplemental
Graphics

Lawrence Picus and Michelle Turner Mangan
Arkansas Beginning Teacher Salary by District Size
$28,318
$24,299
$27,523
$31,704
$4,000
$8,000
$12,000
$16,000
$20,000
$24,000
$28,000
$32,000
$36,000
G1 G2 G3 G4 G5 G6 G7 G8 G9 G10
District Size Deciles (1= lowest ADM; 10 = highest ADM)
Beg
inn
ing
Teach
er
Sala
ry
.
2003-04 2004-05 2005-06 B

Lawrence Picus and Michelle Turner Mangan
Arkansas Beginning Teacher Salary by Assessed Valuation Per Pupil
$28,213
$27,465
$29,652
$30,663
$4,000
$8,000
$12,000
$16,000
$20,000
$24,000
$28,000
$32,000
$36,000
G1 G2 G3 G4 G5 G6 G7 G8 G9 G10
Property Wealth Deciles (1= lowest wealth; 10 = highest wealth)
Beg
inn
ing
Teach
er
Sala
ry
.
2003-04 2004-05 2005-06 B
Lawrence Picus and Michelle Turner Mangan
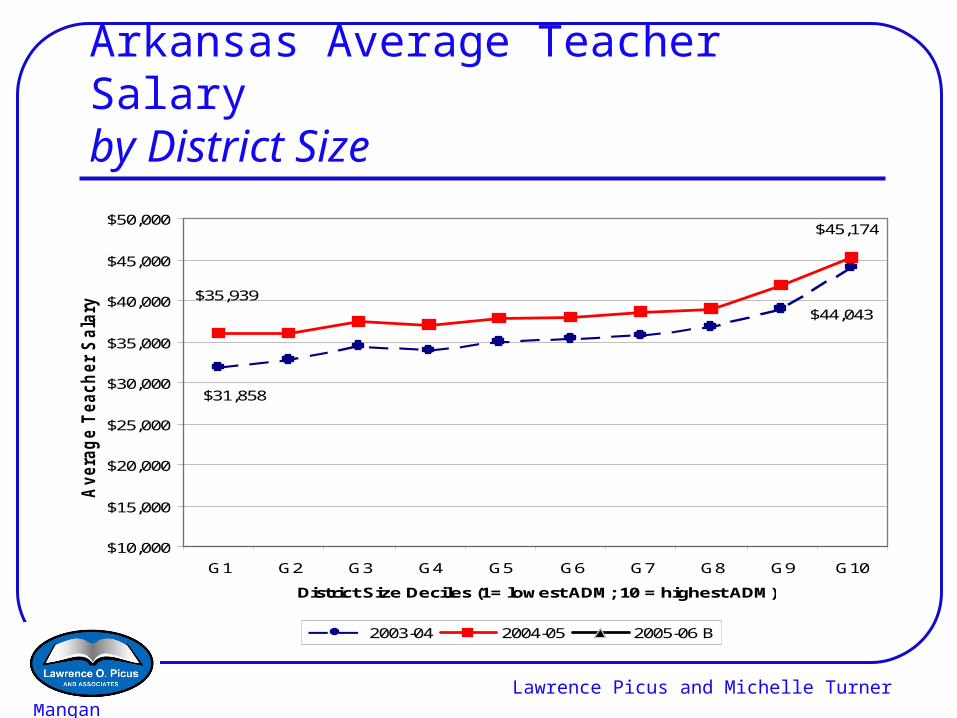
Arkansas Average Teacher Salary by District Size
$44,043
$31,858
$35,939
$45,174
$10,000
$15,000
$20,000
$25,000
$30,000
$35,000
$40,000
$45,000
$50,000
G1 G2 G3 G4 G5 G6 G7 G8 G9 G10
District Size Deciles (1= lowest ADM; 10 = highest ADM)
Avera
ge T
each
er
Sala
ry
.
2003-04 2004-05 2005-06 B
Lawrence Picus and Michelle Turner Mangan
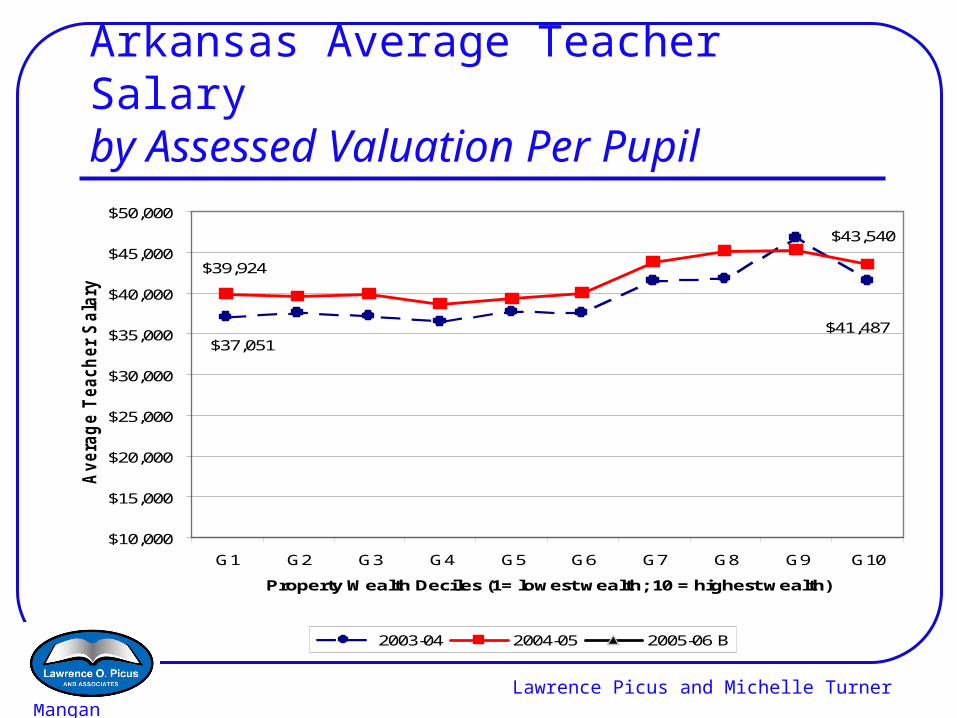
Arkansas Average Teacher Salary by Assessed Valuation Per Pupil
$41,487$37,051
$39,924
$43,540
$10,000
$15,000
$20,000
$25,000
$30,000
$35,000
$40,000
$45,000
$50,000
G1 G2 G3 G4 G5 G6 G7 G8 G9 G10
Property Wealth Deciles (1= lowest wealth; 10 = highest wealth)
Avera
ge T
each
er
Sala
ry
.
2003-04 2004-05 2005-06 B
Lawrence Picus and Michelle Turner Mangan
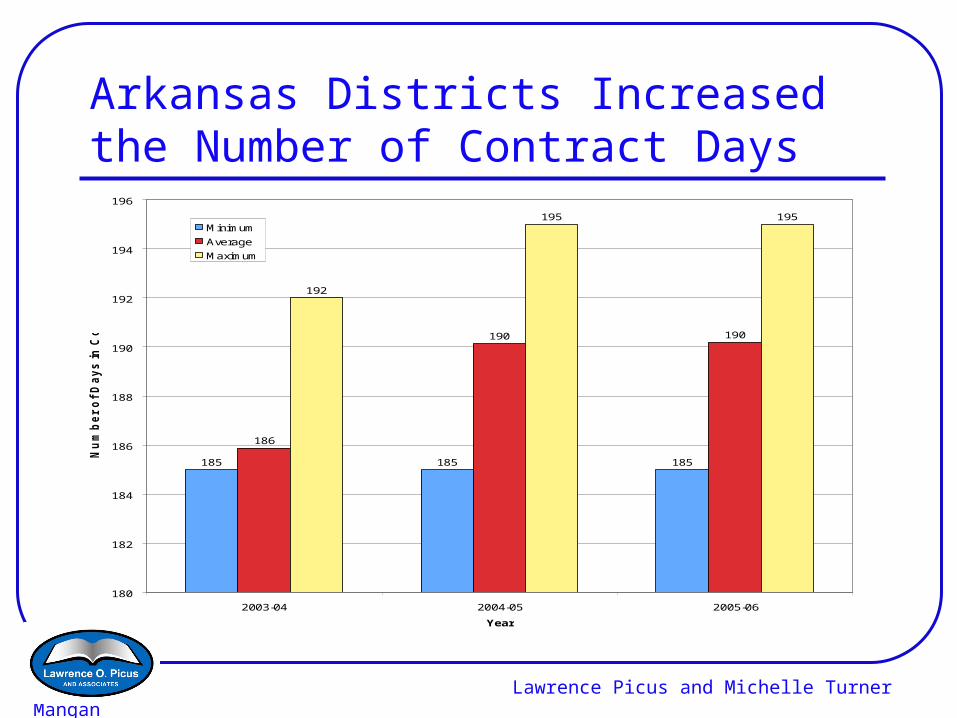
Arkansas Districts Increased the Number of Contract Days
185 185 185
186
190 190
192
195 195
180
182
184
186
188
190
192
194
196
2003-04 2004-05 2005-06
Year
Nu
mb
er
of
Da
ys
in
Co
ntr
ac
t
Minimum
Average
Maximum