Embed Size (px)
Citation preview
Enrollment, Retention,
and Graduation
Tables and Charts
October 2015
Prepared for the
Enrollment Policies Committee (EPC)
by the
Office of Institutional Research and Assessment
To: Enrollment Policies Committee (EPC) Members Chad Berry Curtis Sandberg David Tipton Luke Hodson Scott Steele Virgil Burnside
From: Clara Chapman and Judith Weckman
Date: October 7, 2015
Re: Enrollment, Retention, and Graduation Tables and Charts
We have prepared the following tables and charts for your review. Please note that there is a highlights page at the beginning of each section.
Enrollment
Fall Term Total Headcount (Full and Part-Time) and Academic Year Graduates Total (Full and Part-Time) Fall Term Degree-Seeking Enrollment, First-Year Students, Transfer Students, and Graduates Total (Full and Part-Time) Fall Term Degree-Seeking Enrollment by Classification and Academic Year Graduates Fall Term 2015 Enrollment Report 2015 First-Year Students’ Class Profile 2015 Transfer Students’ Class Profile
Retention First-to-Second Year
Entering Fall Term First-Year Students,1959 – 2014 First-Year Student Retention/Attrition (Breakdown of Withdrawal Status: Suspensions vs. Voluntary Departures) First-Year Students by Gender by Territory by Cohort Type by Cohort Type by Gender by At-Risk and Distressed Appalachian Counties versus All Other U.S. Counties by At-Risk and Distressed Appalachian Counties by Gender Men from At-Risk and Distressed Appalachian Counties versus All Other U.S. Counties White Men from At-Risk and Distressed Appalachian Counties Women from At-Risk and Distressed Appalachian Counties versus All Other U.S. Counties by Kentucky Residency by First-Generation Status by Developmental Mathematics Requirements by High School Rank in Class Categories by ACT Composite Categories by Residence Hall by Labor Departmental Categories Entering Fall Term Transfer Students, 1993 – 2014 by Gender from Kentucky Community and Technical College System (KCTCS) Institutions First-to-Second Year Retention, Six-Year Graduation Rates, and Academic Qualifications at Entry for Fall Term First-Year Students, 2000 – 2014
Fall-to-Fall Term Number and Percent of Withdrawals/Dismissals by Term for First-Year Students Monthly Retention of Fall Term 2014 Enrollees Tracked through to Fall Term 2015 (First-Year and Transfer Students) Enrollment History (Retention) of First-Year Students’ Cohorts Enrollment History (Retention) of Transfer Students’ Cohorts
Graduation
Graduation Rates for First-Year Students, Entering Fall Terms 1986 – 2012 (Lapsed time in years in table form) Graduation Rates for First-Year Students, Entering Fall Terms 2002 – 2011 (4, 5, and 6-year rates in graph form) All First-Year Students by Gender by Territory by Cohort Type African American Students by Gender Other Domestic Students by Gender F-1 International Students by Gender White Men from At-Risk and Distressed Appalachian Counties by County Designation from At-Risk and Distressed Appalachian Counties by Gender by County Designation Men Women by Kentucky Residency by First-Generation Status by High School Rank in Class Categories by ACT Composite Categories Dependent Students by Expected Family Contribution (EFC) Categories at Entry Graduation Rates for Transfer Students, Entering Fall Terms 2002 – 2012 (3, 4, 5, and 6-year rates in graph form) All Transfer Students Transfer Students by Gender Graduation Status for Fall Term 2009 First-Year Students (Terms to Graduate Details) Graduation Status for Fall Term 2010 First-Year Students (Terms to Graduate Details)
cc: Samantha Cole Rob Smith Lyle Roelofs

Enrollment
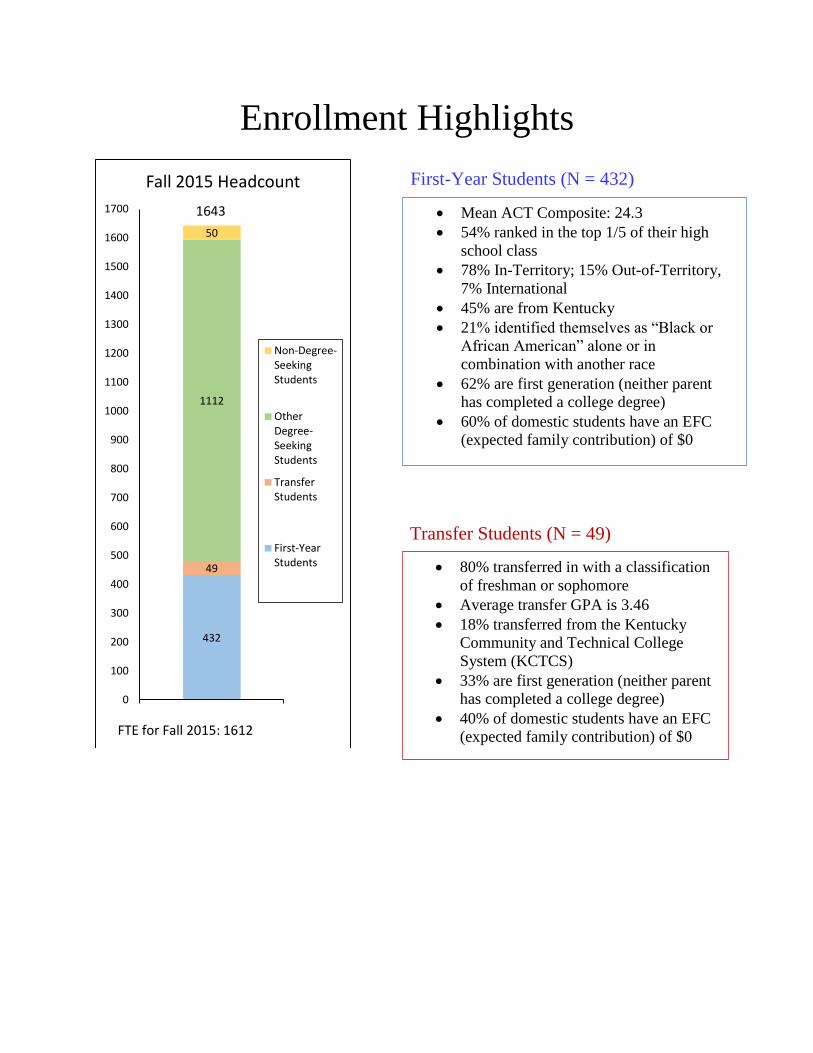
Enrollment Highlights
432
49
1112
50
0
100
200
300
400
500
600
700
800
900
1000
1100
1200
1300
1400
1500
1600
1700
Fall 2015 Headcount
Non-Degree-SeekingStudents
OtherDegree-SeekingStudents
TransferStudents
First-YearStudents
FTE for Fall 2015: 1612
1643 Mean ACT Composite: 24.3
54% ranked in the top 1/5 of their high
school class
78% In-Territory; 15% Out-of-Territory,
7% International
45% are from Kentucky
21% identified themselves as “Black or
African American” alone or in
combination with another race
62% are first generation (neither parent
has completed a college degree)
60% of domestic students have an EFC
(expected family contribution) of $0
First-Year Students (N = 432)
80% transferred in with a classification
of freshman or sophomore
Average transfer GPA is 3.46
18% transferred from the Kentucky
Community and Technical College
System (KCTCS)
33% are first generation (neither parent
has completed a college degree)
40% of domestic students have an EFC
(expected family contribution) of $0
Transfer Students (N = 49)
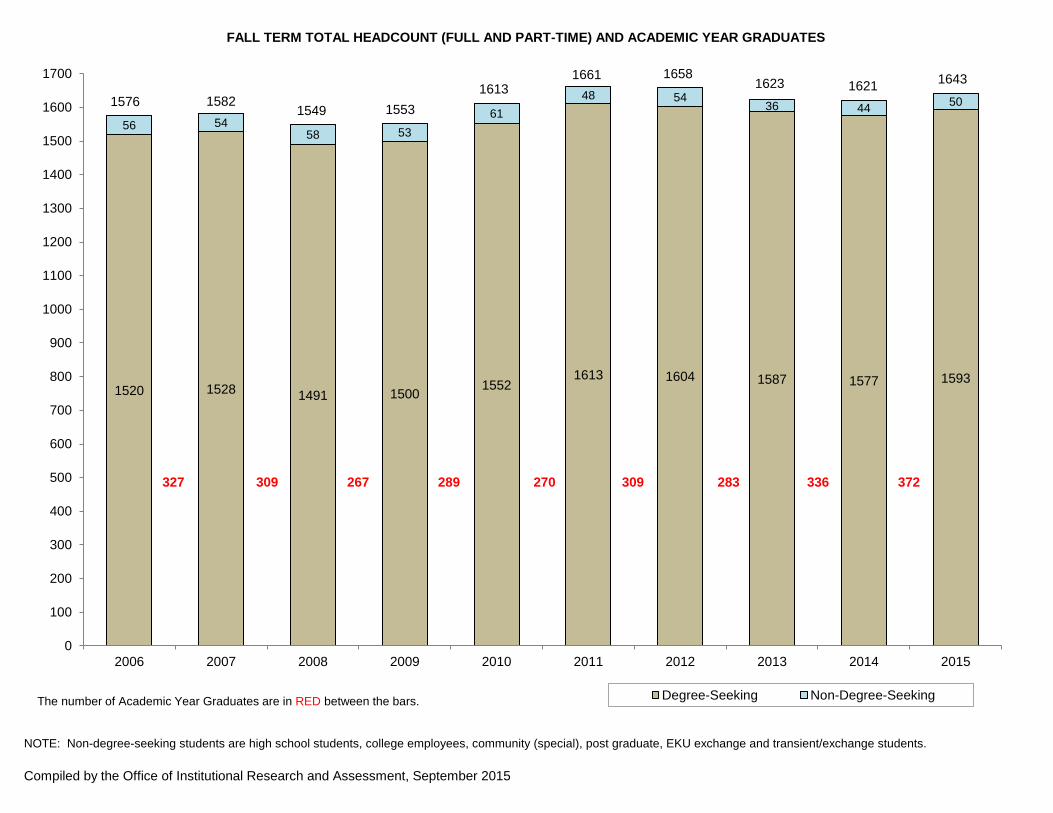
FALL TERM TOTAL HEADCOUNT (FULL AND PART-TIME) AND ACADEMIC YEAR GRADUATES
NOTE: Non-degree-seeking students are high school students, college employees, community (special), post graduate, EKU exchange and transient/exchange students.
Compiled by the Office of Institutional Research and Assessment, September 2015
1520 15281491 1500
15521613 1604 1587 1577 1593
56 5458 53
61
48 5436 44
50
0
100
200
300
400
500
600
700
800
900
1000
1100
1200
1300
1400
1500
1600
1700
2006 2007 2008 2009 2010 2011 2012 2013 2014 2015
Degree-Seeking Non-Degree-SeekingThe number of Academic Year Graduates are in RED between the bars.
1621
1576 15821549 1553
16131661 1658
1623 1643
327 309 267 289 270 309 283 336 372
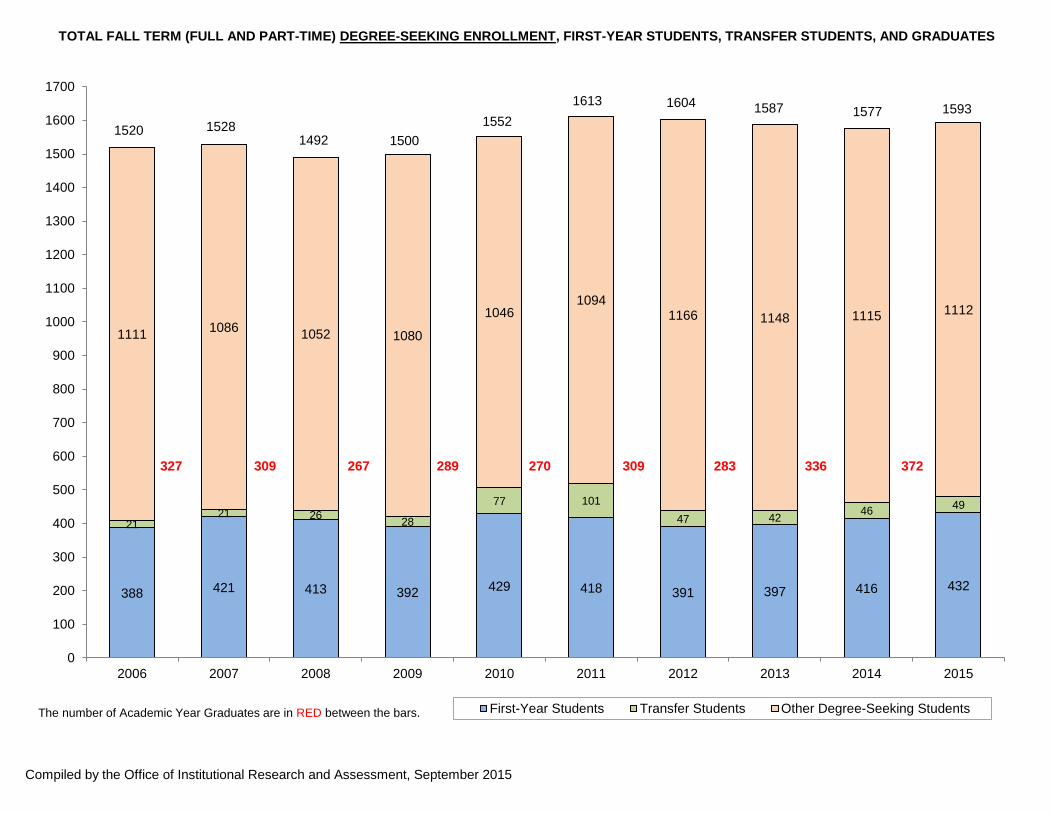
TOTAL FALL TERM (FULL AND PART-TIME) DEGREE-SEEKING ENROLLMENT, FIRST-YEAR STUDENTS, TRANSFER STUDENTS, AND GRADUATES
Compiled by the Office of Institutional Research and Assessment, September 2015
388 421 413 392429 418 391 397 416 432
2121 26
28
77 101
47 4246
49
11111086
1052 1080
10461094
1166 1148 1115 1112
0
100
200
300
400
500
600
700
800
900
1000
1100
1200
1300
1400
1500
1600
1700
2006 2007 2008 2009 2010 2011 2012 2013 2014 2015
First-Year Students Transfer Students Other Degree-Seeking Students
1577
1520 1528
The number of Academic Year Graduates are in RED between the bars.
1492 1500
1552
1613 1604 1587 1593
327 309 267 289 270 309 283 336 372
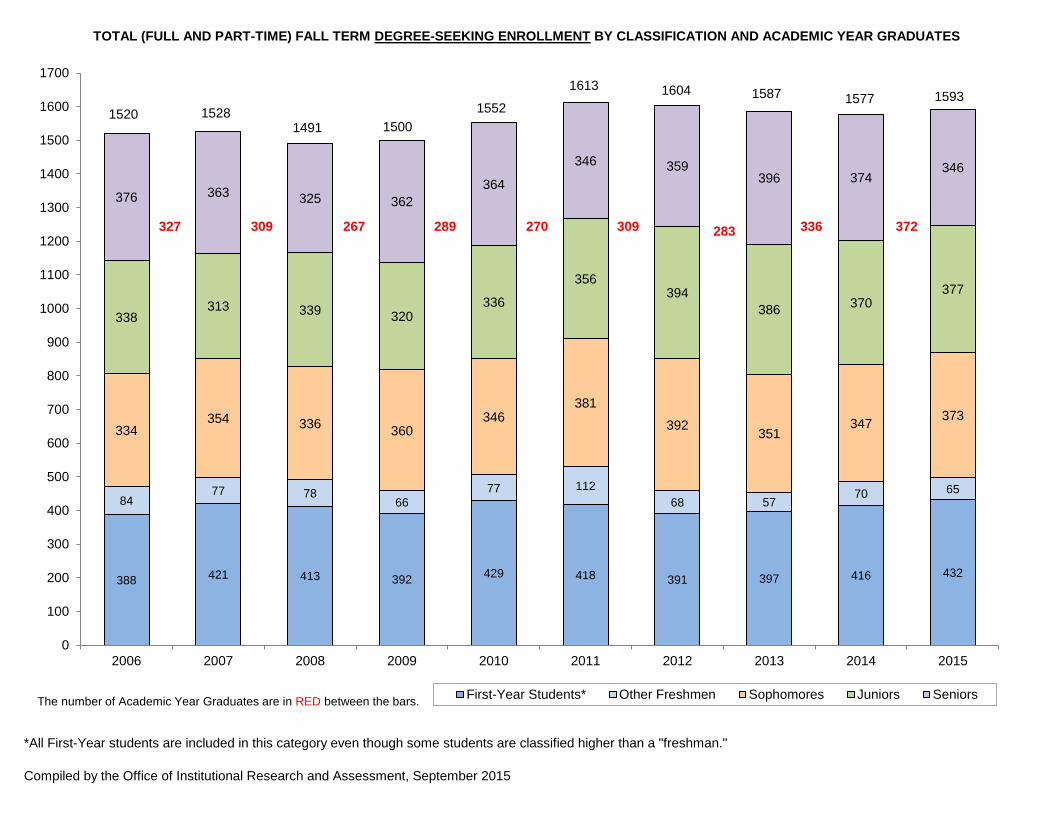
TOTAL (FULL AND PART-TIME) FALL TERM DEGREE-SEEKING ENROLLMENT BY CLASSIFICATION AND ACADEMIC YEAR GRADUATES
*All First-Year students are included in this category even though some students are classified higher than a "freshman."
Compiled by the Office of Institutional Research and Assessment, September 2015
388 421 413 392429 418 391 397 416 432
8477 78
66
77 112
68 5770 65
334354 336
360346
381
392351
347373
338313 339
320336
356394
386370
377
376 363 325 362
364
346 359396 374
346
0
100
200
300
400
500
600
700
800
900
1000
1100
1200
1300
1400
1500
1600
1700
2006 2007 2008 2009 2010 2011 2012 2013 2014 2015
First-Year Students* Other Freshmen Sophomores Juniors Seniors
1577
1520 1528
The number of Academic Year Graduates are in RED between the bars.
1491 1500
1552
1613 1604 1587 1593
327 309 267 289 270 309 283 336 372
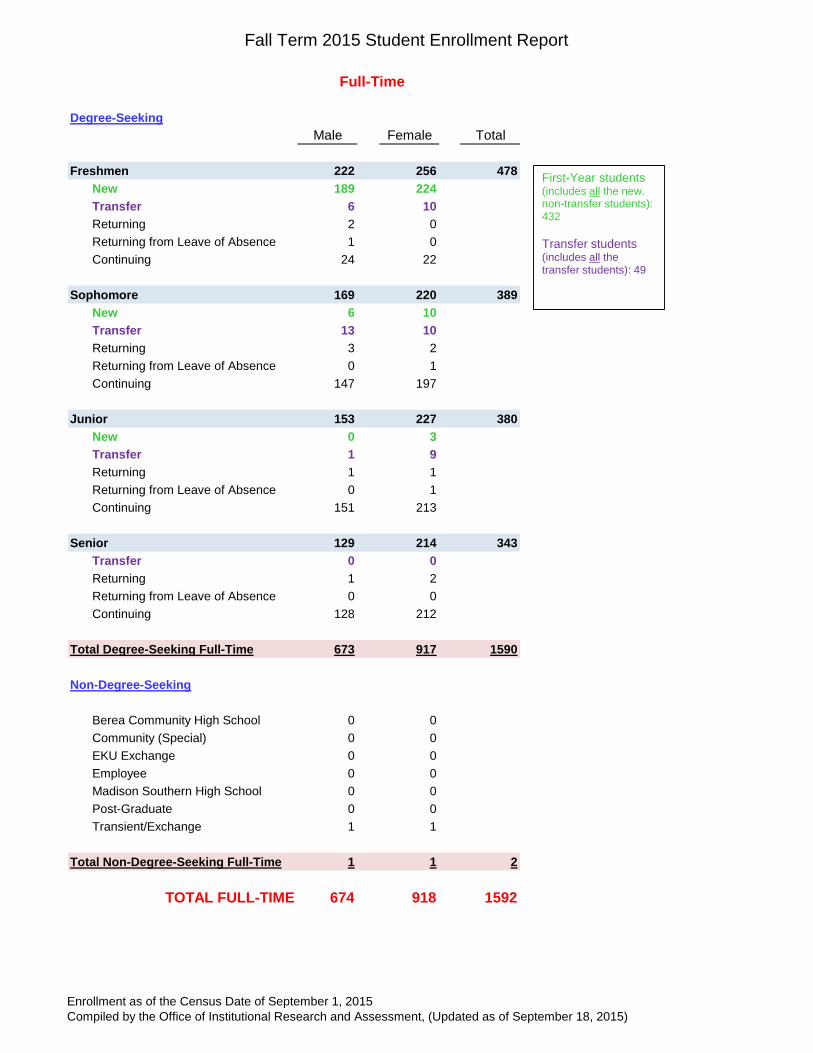
Fall Term 2015 Student Enrollment Report
Degree-Seeking
Male Female Total
Freshmen 222 256 478
New 189 224
Transfer 6 10
Returning 2 0
Returning from Leave of Absence 1 0
Continuing 24 22
Sophomore 169 220 389
New 6 10
Transfer 13 10
Returning 3 2
Returning from Leave of Absence 0 1
Continuing 147 197
Junior 153 227 380
New 0 3
Transfer 1 9
Returning 1 1
Returning from Leave of Absence 0 1
Continuing 151 213
Senior 129 214 343
Transfer 0 0
Returning 1 2
Returning from Leave of Absence 0 0
Continuing 128 212
Total Degree-Seeking Full-Time 673 917 1590
Non-Degree-Seeking
Berea Community High School 0 0
Community (Special) 0 0
EKU Exchange 0 0
Employee 0 0
Madison Southern High School 0 0
Post-Graduate 0 0
Transient/Exchange 1 1
Total Non-Degree-Seeking Full-Time 1 1 2
TOTAL FULL-TIME 674 918 1592
Full-Time
First-Year students (includes all the new. non-transfer students): 432
Transfer students (includes all the transfer students): 49
Enrollment as of the Census Date of September 1, 2015
Compiled by the Office of Institutional Research and Assessment, (Updated as of September 18, 2015)
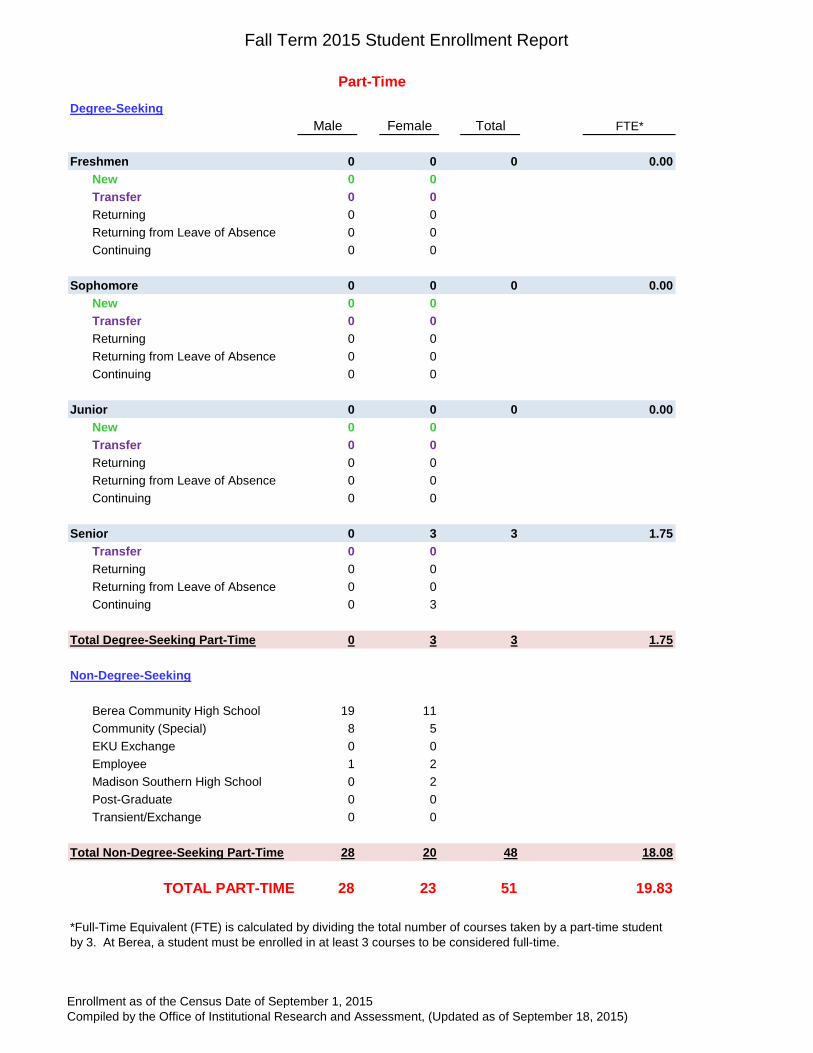
Fall Term 2015 Student Enrollment Report
Degree-Seeking
Male Female Total FTE*
Freshmen 0 0 0 0.00
New 0 0
Transfer 0 0
Returning 0 0
Returning from Leave of Absence 0 0
Continuing 0 0
Sophomore 0 0 0 0.00
New 0 0
Transfer 0 0
Returning 0 0
Returning from Leave of Absence 0 0
Continuing 0 0
Junior 0 0 0 0.00
New 0 0
Transfer 0 0
Returning 0 0
Returning from Leave of Absence 0 0
Continuing 0 0
Senior 0 3 3 1.75
Transfer 0 0
Returning 0 0
Returning from Leave of Absence 0 0
Continuing 0 3
Total Degree-Seeking Part-Time 0 3 3 1.75
Non-Degree-Seeking
Berea Community High School 19 11
Community (Special) 8 5
EKU Exchange 0 0
Employee 1 2
Madison Southern High School 0 2
Post-Graduate 0 0
Transient/Exchange 0 0
Total Non-Degree-Seeking Part-Time 28 20 48 18.08
TOTAL PART-TIME 28 23 51 19.83
Part-Time
*Full-Time Equivalent (FTE) is calculated by dividing the total number of courses taken by a part-time student
by 3. At Berea, a student must be enrolled in at least 3 courses to be considered full-time.
Enrollment as of the Census Date of September 1, 2015
Compiled by the Office of Institutional Research and Assessment, (Updated as of September 18, 2015)
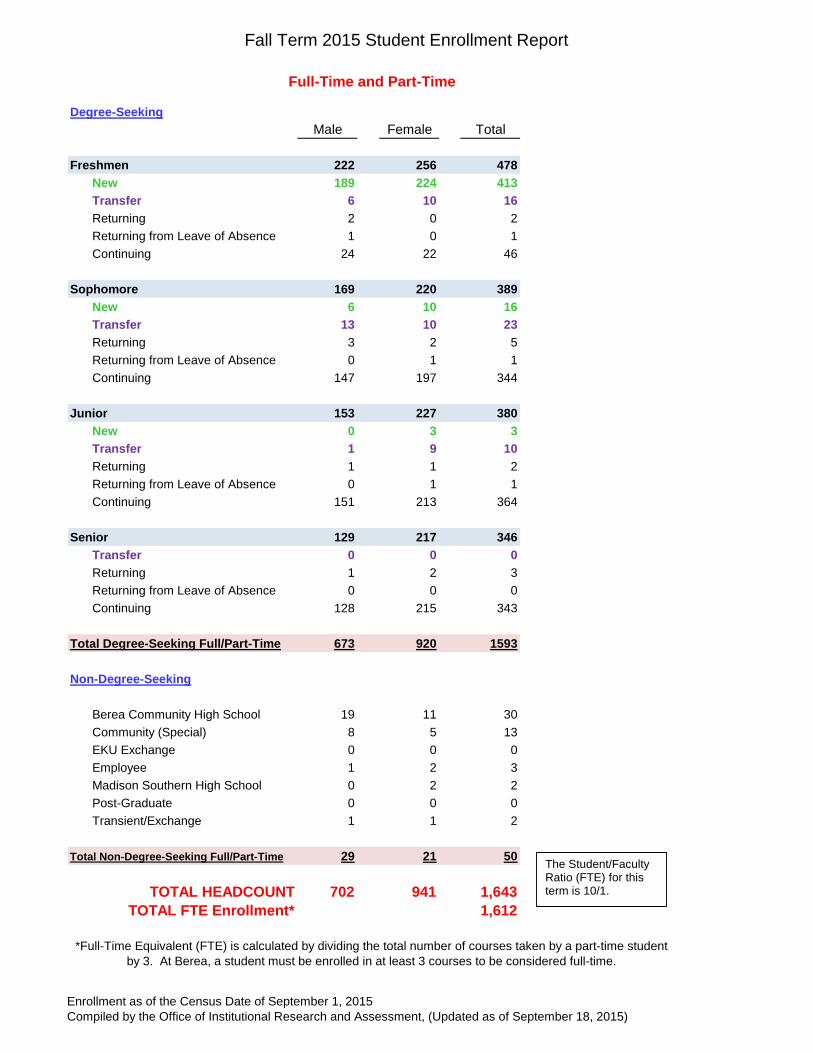
Fall Term 2015 Student Enrollment Report
Degree-Seeking
Male Female Total
Freshmen 222 256 478
New 189 224 413
Transfer 6 10 16
Returning 2 0 2
Returning from Leave of Absence 1 0 1
Continuing 24 22 46
Sophomore 169 220 389
New 6 10 16
Transfer 13 10 23
Returning 3 2 5
Returning from Leave of Absence 0 1 1
Continuing 147 197 344
Junior 153 227 380
New 0 3 3
Transfer 1 9 10
Returning 1 1 2
Returning from Leave of Absence 0 1 1
Continuing 151 213 364
Senior 129 217 346
Transfer 0 0 0
Returning 1 2 3
Returning from Leave of Absence 0 0 0
Continuing 128 215 343
Total Degree-Seeking Full/Part-Time 673 920 1593
Non-Degree-Seeking
Berea Community High School 19 11 30
Community (Special) 8 5 13
EKU Exchange 0 0 0
Employee 1 2 3
Madison Southern High School 0 2 2
Post-Graduate 0 0 0
Transient/Exchange 1 1 2
Total Non-Degree-Seeking Full/Part-Time 29 21 50
TOTAL HEADCOUNT 702 941 1,643
TOTAL FTE Enrollment* 1,612
Full-Time and Part-Time
*Full-Time Equivalent (FTE) is calculated by dividing the total number of courses taken by a part-time student
by 3. At Berea, a student must be enrolled in at least 3 courses to be considered full-time.
The Student/Faculty Ratio (FTE) for this term is 10/1.
Enrollment as of the Census Date of September 1, 2015
Compiled by the Office of Institutional Research and Assessment, (Updated as of September 18, 2015)
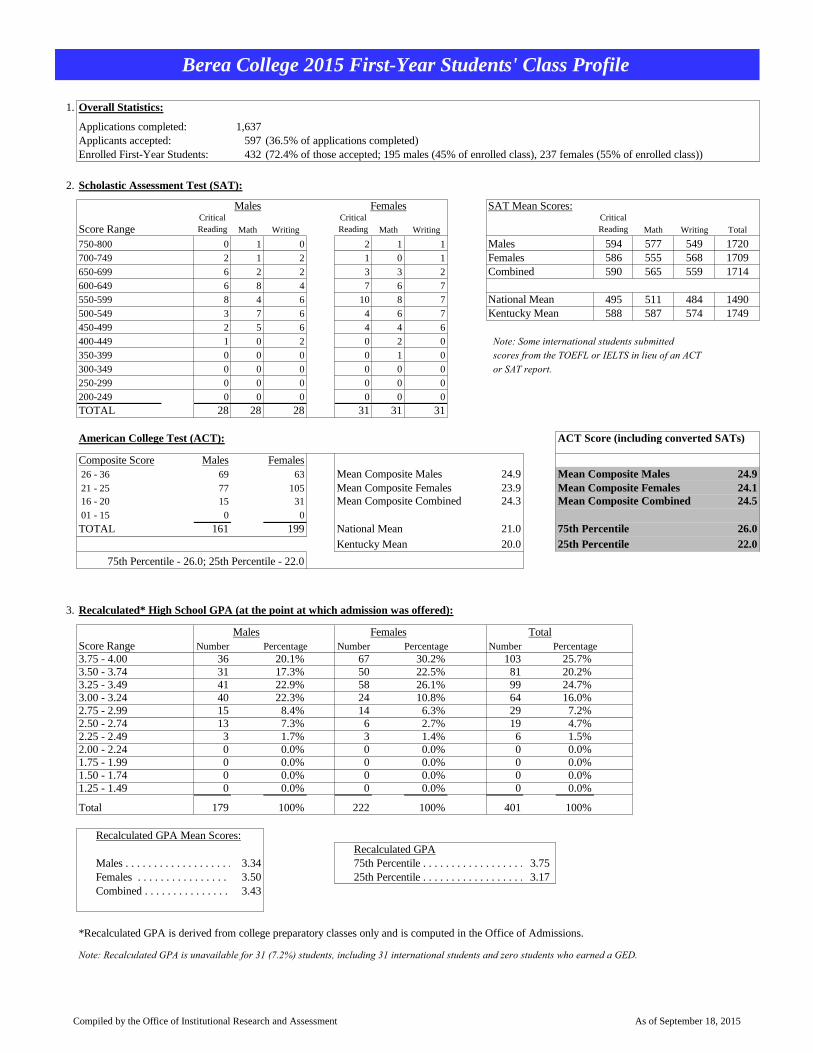
Berea College 2015 First-Year Students' Class Profile
1. Overall Statistics:
Applications completed: 1,637
Applicants accepted: 597 (36.5% of applications completed)
Enrolled First-Year Students: 432 (72.4% of those accepted; 195 males (45% of enrolled class), 237 females (55% of enrolled class))
2. Scholastic Assessment Test (SAT):
Males Females SAT Mean Scores:
Score RangeCritical
Reading Math Writing
Critical
Reading Math Writing
Critical
Reading Math Writing Total
750-800 0 1 0 2 1 1 Males 594 577 549 1720
700-749 2 1 2 1 0 1 Females 586 555 568 1709
650-699 6 2 2 3 3 2 Combined 590 565 559 1714
600-649 6 8 4 7 6 7
550-599 8 4 6 10 8 7 National Mean 495 511 484 1490
500-549 3 7 6 4 6 7 Kentucky Mean 588 587 574 1749
450-499 2 5 6 4 4 6
400-449 1 0 2 0 2 0 Note: Some international students submitted350-399 0 0 0 0 1 0 scores from the TOEFL or IELTS in lieu of an ACT300-349 0 0 0 0 0 0 or SAT report.250-299 0 0 0 0 0 0
200-249 0 0 0 0 0 0
TOTAL 28 28 28 31 31 31
American College Test (ACT): ACT Score (including converted SATs)
Composite Score Males Females
26 - 36 69 63 Mean Composite Males 24.9 Mean Composite Males 24.9
21 - 25 77 105 Mean Composite Females 23.9 Mean Composite Females 24.1
16 - 20 15 31 Mean Composite Combined 24.3 Mean Composite Combined 24.5
01 - 15 0 0
TOTAL 161 199 National Mean 21.0 75th Percentile 26.0
Kentucky Mean 20.0 25th Percentile 22.0
3. Recalculated* High School GPA (at the point at which admission was offered):
Males Females Total
Score Range Number Percentage Number Percentage Number Percentage
3.75 - 4.00 36 20.1% 67 30.2% 103 25.7%
3.50 - 3.74 31 17.3% 50 22.5% 81 20.2%
3.25 - 3.49 41 22.9% 58 26.1% 99 24.7%
3.00 - 3.24 40 22.3% 24 10.8% 64 16.0%
2.75 - 2.99 15 8.4% 14 6.3% 29 7.2%
2.50 - 2.74 13 7.3% 6 2.7% 19 4.7%
2.25 - 2.49 3 1.7% 3 1.4% 6 1.5%
2.00 - 2.24 0 0.0% 0 0.0% 0 0.0%
1.75 - 1.99 0 0.0% 0 0.0% 0 0.0%
1.50 - 1.74 0 0.0% 0 0.0% 0 0.0%
1.25 - 1.49 0 0.0% 0 0.0% 0 0.0%
Total 179 100% 222 100% 401 100%
Recalculated GPA Mean Scores:
Recalculated GPA
Males . . . . . . . . . . . . . . . . . . . . .3.34 75th Percentile . . . . . . . . . . . . . . . . . . . . . . . . . . . .3.75
Females . . . . . . . . . . . . . . . . . . 3.50 25th Percentile . . . . . . . . . . . . . . . . . . . . . . . . . . . . .3.17
Combined . . . . . . . . . . . . . . . . . 3.43
*Recalculated GPA is derived from college preparatory classes only and is computed in the Office of Admissions.
Note: Recalculated GPA is unavailable for 31 (7.2%) students, including 31 international students and zero students who earned a GED.
75th Percentile - 26.0; 25th Percentile - 22.0
Compiled by the Office of Institutional Research and Assessment As of September 18, 2015
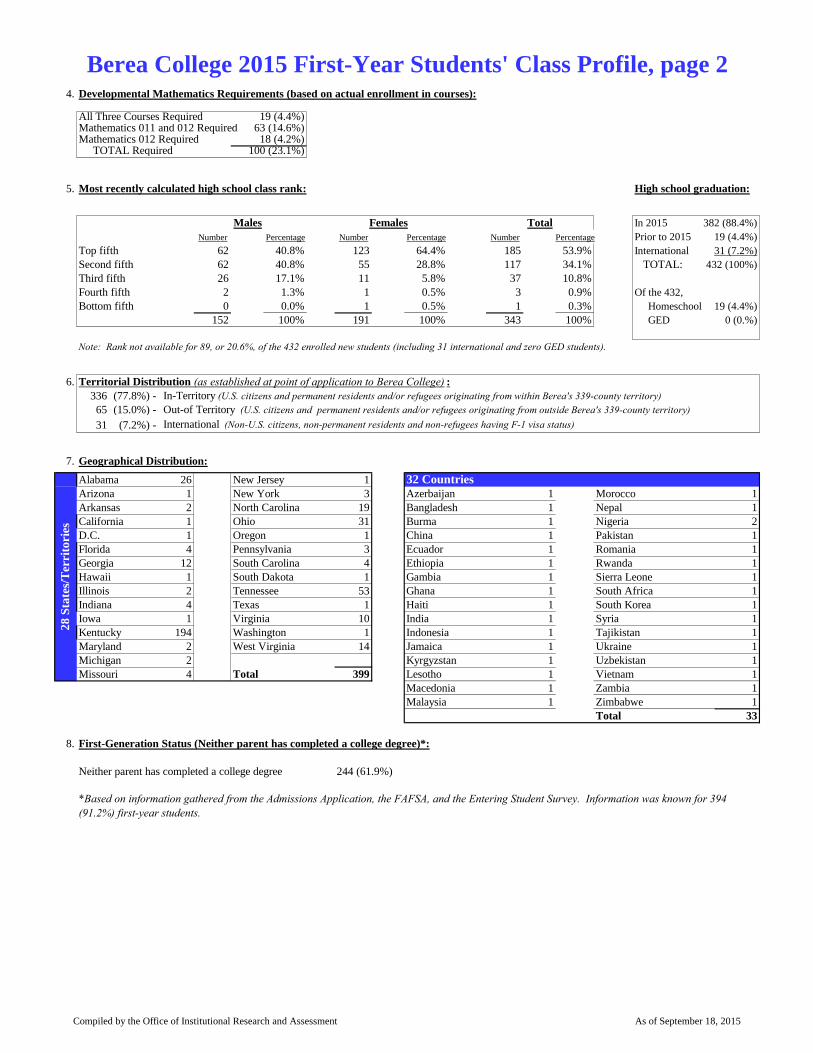
Berea College 2015 First-Year Students' Class Profile, page 24. Developmental Mathematics Requirements (based on actual enrollment in courses):
All Three Courses Required 19 (4.4%)Mathematics 011 and 012 Required 63 (14.6%)Mathematics 012 Required 18 (4.2%) TOTAL Required 100 (23.1%)
5. Most recently calculated high school class rank: High school graduation:
Males Females Total In 2015 382 (88.4%)
Number Percentage Number Percentage Number Percentage Prior to 2015 19 (4.4%)
Top fifth 62 40.8% 123 64.4% 185 53.9% International 31 (7.2%)
Second fifth 62 40.8% 55 28.8% 117 34.1% TOTAL: 432 (100%)
Third fifth 26 17.1% 11 5.8% 37 10.8%
Fourth fifth 2 1.3% 1 0.5% 3 0.9% Of the 432,
Bottom fifth 0 0.0% 1 0.5% 1 0.3% Homeschool 19 (4.4%)
152 100% 191 100% 343 100% GED 0 (0.%)
Note: Rank not available for 89, or 20.6%, of the 432 enrolled new students (including 31 international and zero GED students).
6. Territorial Distribution (as established at point of application to Berea College) :
336 (77.8%) -
65 (15.0%) -
31 (7.2%) - International (Non-U.S. citizens, non-permanent residents and non-refugees having F-1 visa status)
7. Geographical Distribution:
Alabama 26 New Jersey 1 32 Countries
Arizona 1 New York 3 Azerbaijan 1 Morocco 1
Arkansas 2 North Carolina 19 Bangladesh 1 Nepal 1
California 1 Ohio 31 Burma 1 Nigeria 2
D.C. 1 Oregon 1 China 1 Pakistan 1
Florida 4 Pennsylvania 3 Ecuador 1 Romania 1
Georgia 12 South Carolina 4 Ethiopia 1 Rwanda 1
Hawaii 1 South Dakota 1 Gambia 1 Sierra Leone 1
Illinois 2 Tennessee 53 Ghana 1 South Africa 1
Indiana 4 Texas 1 Haiti 1 South Korea 1
Iowa 1 Virginia 10 India 1 Syria 1
Kentucky 194 Washington 1 Indonesia 1 Tajikistan 1
Maryland 2 West Virginia 14 Jamaica 1 Ukraine 1
Michigan 2 Kyrgyzstan 1 Uzbekistan 1
Missouri 4 Total 399 Lesotho 1 Vietnam 1
Macedonia 1 Zambia 1
Malaysia 1 Zimbabwe 1
Total 33
8. First-Generation Status (Neither parent has completed a college degree)*:
Neither parent has completed a college degree 244 (61.9%)
28
Sta
tes/
Ter
rito
ries
*Based on information gathered from the Admissions Application, the FAFSA, and the Entering Student Survey. Information was known for 394 (91.2%) first-year students.
In-Territory (U.S. citizens and permanent residents and/or refugees originating from within Berea's 339-county territory) Out-of Territory (U.S. citizens and permanent residents and/or refugees originating from outside Berea's 339-county territory)
Compiled by the Office of Institutional Research and Assessment As of September 18, 2015
Berea College 2015 First-Year Students' Class Profile, page 3
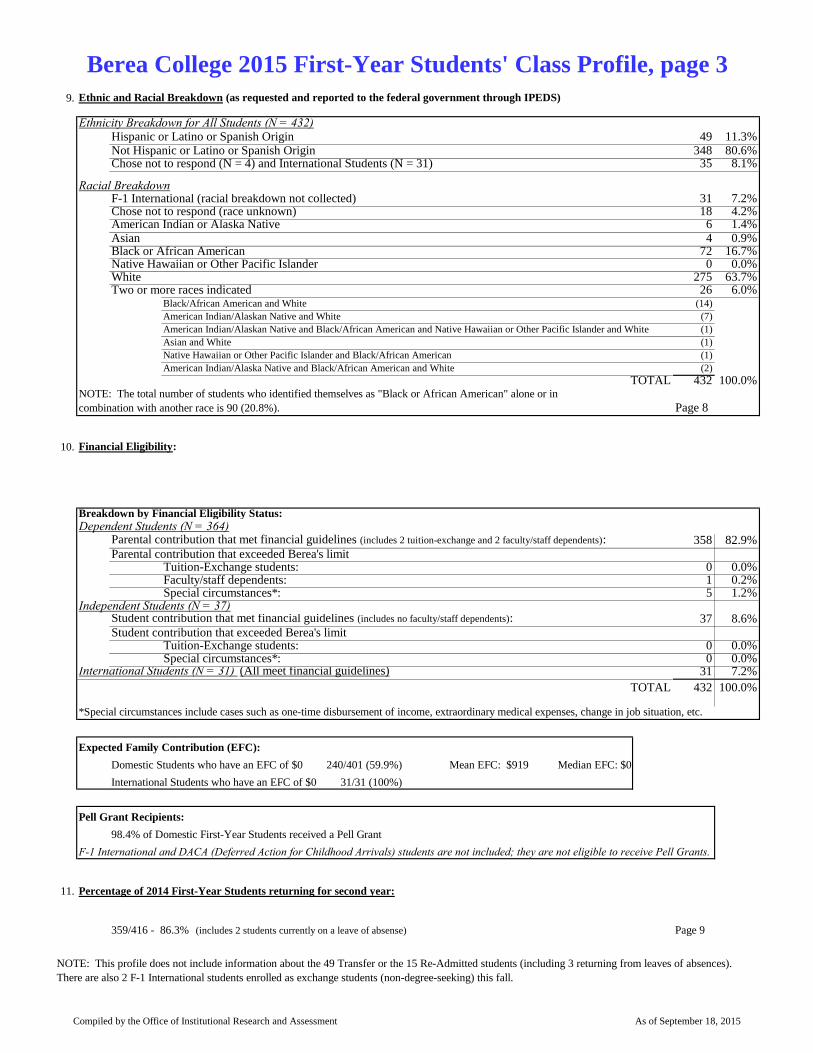
9. Ethnic and Racial Breakdown (as requested and reported to the federal government through IPEDS)
Ethnicity Breakdown for All Students (N = 432)Hispanic or Latino or Spanish Origin 49 11.3%Not Hispanic or Latino or Spanish Origin 348 80.6%Chose not to respond (N = 4) and International Students (N = 31) 35 8.1%
Racial BreakdownF-1 International (racial breakdown not collected) 31 7.2%Chose not to respond (race unknown) 18 4.2%American Indian or Alaska Native 6 1.4%Asian 4 0.9%Black or African American 72 16.7%Native Hawaiian or Other Pacific Islander 0 0.0%White 275 63.7%Two or more races indicated 26 6.0%
Black/African American and White (14)
American Indian/Alaskan Native and White (7)
American Indian/Alaskan Native and Black/African American and Native Hawaiian or Other Pacific Islander and White (1)
Asian and White (1)
Native Hawaiian or Other Pacific Islander and Black/African American (1)
American Indian/Alaska Native and Black/African American and White (2)
TOTAL 432 100.0%
Page 8
10. Financial Eligibility:
Breakdown by Financial Eligibility Status:
Dependent Students (N = 364)Parental contribution that met financial guidelines (includes 2 tuition-exchange and 2 faculty/staff dependents): 358 82.9%Parental contribution that exceeded Berea's limit
Tuition-Exchange students: 0 0.0%Faculty/staff dependents: 1 0.2%Special circumstances*: 5 1.2%
Independent Students (N = 37)Student contribution that met financial guidelines (includes no faculty/staff dependents): 37 8.6%Student contribution that exceeded Berea's limit
Tuition-Exchange students: 0 0.0%Special circumstances*: 0 0.0%
International Students (N = 31) (All meet financial guidelines) 31 7.2%
TOTAL 432 100.0%
*Special circumstances include cases such as one-time disbursement of income, extraordinary medical expenses, change in job situation, etc.
Expected Family Contribution (EFC):
Domestic Students who have an EFC of $0 240/401 (59.9%) Mean EFC: $919 Median EFC: $0
International Students who have an EFC of $0 31/31 (100%)
Pell Grant Recipients:
98.4% of Domestic First-Year Students received a Pell Grant
F-1 International and DACA (Deferred Action for Childhood Arrivals) students are not included; they are not eligible to receive Pell Grants.
11. Percentage of 2014 First-Year Students returning for second year:
359/416 - 86.3% (includes 2 students currently on a leave of absense) Page 9
NOTE: This profile does not include information about the 49 Transfer or the 15 Re-Admitted students (including 3 returning from leaves of absences).
There are also 2 F-1 International students enrolled as exchange students (non-degree-seeking) this fall.
NOTE: The total number of students who identified themselves as "Black or African American" alone or in
combination with another race is 90 (20.8%).
Compiled by the Office of Institutional Research and Assessment As of September 18, 2015
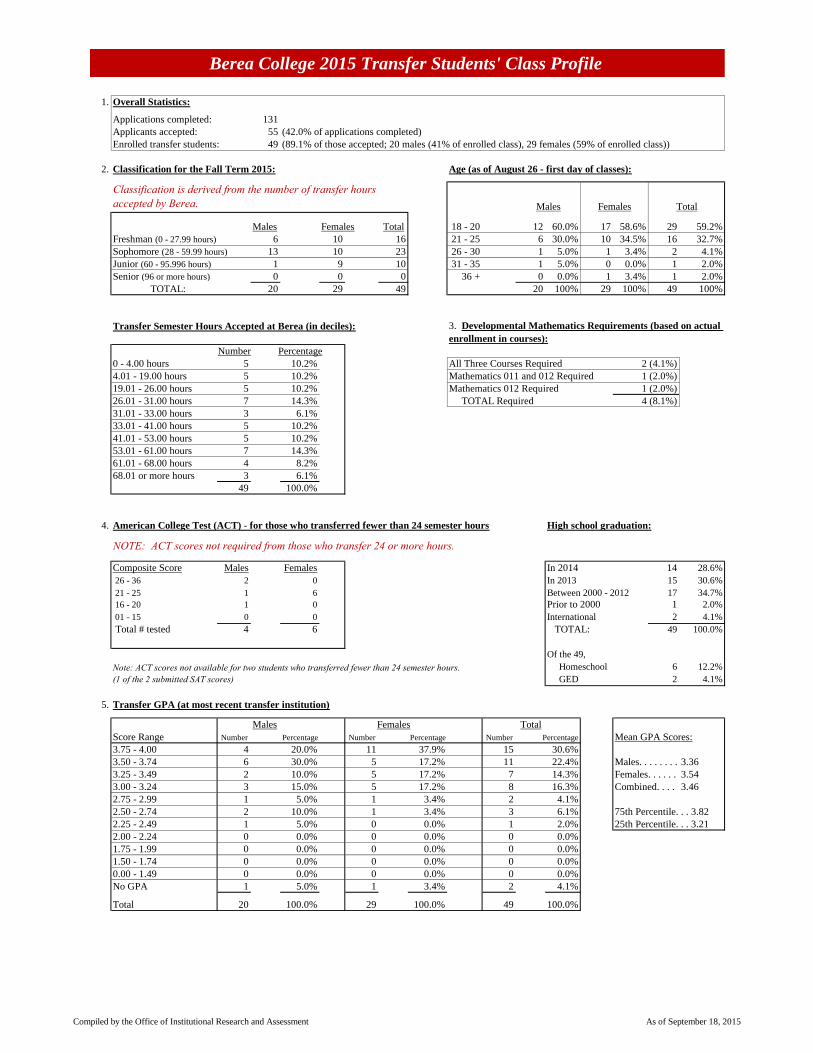
Berea College 2015 Transfer Students' Class Profile
1. Overall Statistics:
Applications completed: 131
Applicants accepted: 55 (42.0% of applications completed)
Enrolled transfer students: 49 (89.1% of those accepted; 20 males (41% of enrolled class), 29 females (59% of enrolled class))
2. Classification for the Fall Term 2015: Age (as of August 26 - first day of classes):
Males Females Total 18 - 20 12 60.0% 17 58.6% 29 59.2%
Freshman (0 - 27.99 hours) 6 10 16 21 - 25 6 30.0% 10 34.5% 16 32.7%
Sophomore (28 - 59.99 hours) 13 10 23 26 - 30 1 5.0% 1 3.4% 2 4.1%
Junior (60 - 95.996 hours) 1 9 10 31 - 35 1 5.0% 0 0.0% 1 2.0%
Senior (96 or more hours) 0 0 0 36 + 0 0.0% 1 3.4% 1 2.0%
TOTAL: 20 29 49 20 100% 29 100% 49 100%
Transfer Semester Hours Accepted at Berea (in deciles):
Number Percentage
0 - 4.00 hours 5 10.2% All Three Courses Required 2 (4.1%)
4.01 - 19.00 hours 5 10.2% Mathematics 011 and 012 Required 1 (2.0%)
19.01 - 26.00 hours 5 10.2% Mathematics 012 Required 1 (2.0%)
26.01 - 31.00 hours 7 14.3% TOTAL Required 4 (8.1%)
31.01 - 33.00 hours 3 6.1%
33.01 - 41.00 hours 5 10.2%
41.01 - 53.00 hours 5 10.2%
53.01 - 61.00 hours 7 14.3%
61.01 - 68.00 hours 4 8.2%
68.01 or more hours 3 6.1%
49 100.0%
4. American College Test (ACT) - for those who transferred fewer than 24 semester hours High school graduation:
NOTE: ACT scores not required from those who transfer 24 or more hours.
Composite Score Males Females In 2014 14 28.6%
26 - 36 2 0 In 2013 15 30.6%
21 - 25 1 6 Between 2000 - 2012 17 34.7%
16 - 20 1 0 Prior to 2000 1 2.0%
01 - 15 0 0 International 2 4.1%
Total # tested 4 6 TOTAL: 49 100.0%
Of the 49,
Homeschool 6 12.2%
GED 2 4.1%
5. Transfer GPA (at most recent transfer institution)
Males Females Total
Score Range Number Percentage Number Percentage Number Percentage Mean GPA Scores:
3.75 - 4.00 4 20.0% 11 37.9% 15 30.6%
3.50 - 3.74 6 30.0% 5 17.2% 11 22.4% Males. . . . . . . . . . . . 3.36
3.25 - 3.49 2 10.0% 5 17.2% 7 14.3% Females. . . . . . . . 3.54
3.00 - 3.24 3 15.0% 5 17.2% 8 16.3% Combined. . . . . . . . .3.46
2.75 - 2.99 1 5.0% 1 3.4% 2 4.1%
2.50 - 2.74 2 10.0% 1 3.4% 3 6.1% 75th Percentile. . . 3.82
2.25 - 2.49 1 5.0% 0 0.0% 1 2.0% 25th Percentile. . . 3.21
2.00 - 2.24 0 0.0% 0 0.0% 0 0.0%
1.75 - 1.99 0 0.0% 0 0.0% 0 0.0%
1.50 - 1.74 0 0.0% 0 0.0% 0 0.0%
0.00 - 1.49 0 0.0% 0 0.0% 0 0.0%
No GPA 1 5.0% 1 3.4% 2 4.1%
Total 20 100.0% 29 100.0% 49 100.0%
Classification is derived from the number of transfer hours accepted by Berea. Males Females Total
Note: ACT scores not available for two students who transferred fewer than 24 semester hours.(1 of the 2 submitted SAT scores)
3. Developmental Mathematics Requirements (based on actual
enrollment in courses):
Compiled by the Office of Institutional Research and Assessment As of September 18, 2015
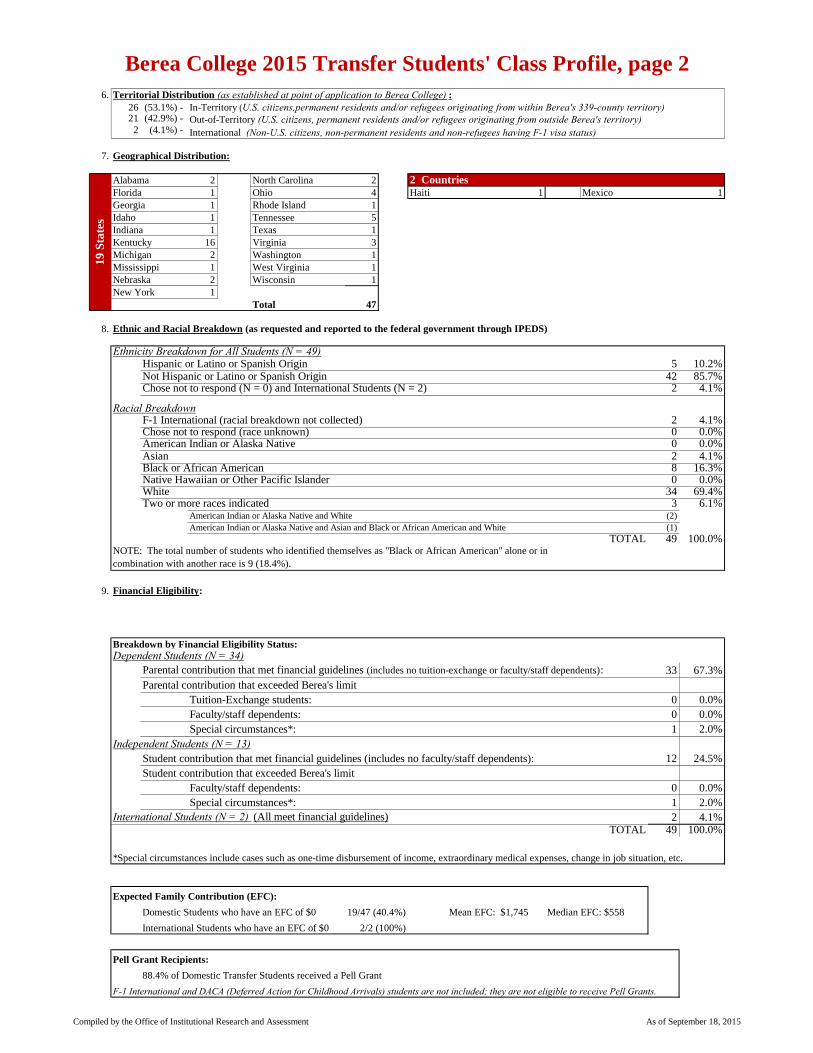
Berea College 2015 Transfer Students' Class Profile, page 2
6. Territorial Distribution (as established at point of application to Berea College) :
26 (53.1%) - 21 (42.9%) -
2 (4.1%) - International (Non-U.S. citizens, non-permanent residents and non-refugees having F-1 visa status)
7. Geographical Distribution:
Alabama 2 North Carolina 2 2 Countries
Florida 1 Ohio 4 Haiti 1 Mexico 1
Georgia 1 Rhode Island 1
Idaho 1 Tennessee 5
Indiana 1 Texas 1
Kentucky 16 Virginia 3
Michigan 2 Washington 1
Mississippi 1 West Virginia 1
Nebraska 2 Wisconsin 1
New York 1
Total 47
8. Ethnic and Racial Breakdown (as requested and reported to the federal government through IPEDS)
Ethnicity Breakdown for All Students (N = 49)Hispanic or Latino or Spanish Origin 5 10.2%Not Hispanic or Latino or Spanish Origin 42 85.7%Chose not to respond (N = 0) and International Students (N = 2) 2 4.1%
Racial BreakdownF-1 International (racial breakdown not collected) 2 4.1%Chose not to respond (race unknown) 0 0.0%American Indian or Alaska Native 0 0.0%Asian 2 4.1%Black or African American 8 16.3%Native Hawaiian or Other Pacific Islander 0 0.0%White 34 69.4%Two or more races indicated 3 6.1%
American Indian or Alaska Native and White (2)
American Indian or Alaska Native and Asian and Black or African American and White (1)
TOTAL 49 100.0%
9. Financial Eligibility:
Breakdown by Financial Eligibility Status:
Dependent Students (N = 34)Parental contribution that met financial guidelines (includes no tuition-exchange or faculty/staff dependents): 33 67.3%
Parental contribution that exceeded Berea's limit
Tuition-Exchange students: 0 0.0%
Faculty/staff dependents: 0 0.0%
Special circumstances*: 1 2.0%
Independent Students (N = 13)Student contribution that met financial guidelines (includes no faculty/staff dependents): 12 24.5%
Student contribution that exceeded Berea's limit
Faculty/staff dependents: 0 0.0%
Special circumstances*: 1 2.0%
International Students (N = 2) (All meet financial guidelines) 2 4.1%TOTAL 49 100.0%
*Special circumstances include cases such as one-time disbursement of income, extraordinary medical expenses, change in job situation, etc.
Expected Family Contribution (EFC):
Domestic Students who have an EFC of $0 19/47 (40.4%) Mean EFC: $1,745 Median EFC: $558
International Students who have an EFC of $0 2/2 (100%)
Pell Grant Recipients:
88.4% of Domestic Transfer Students received a Pell Grant
F-1 International and DACA (Deferred Action for Childhood Arrivals) students are not included; they are not eligible to receive Pell Grants.
19 S
tate
s
NOTE: The total number of students who identified themselves as "Black or African American" alone or in
combination with another race is 9 (18.4%).
In-Territory (U.S. citizens,permanent residents and/or refugees originating from within Berea's 339-county territory) Out-of-Territory (U.S. citizens, permanent residents and/or refugees originating from outside Berea's territory)
Compiled by the Office of Institutional Research and Assessment As of September 18, 2015
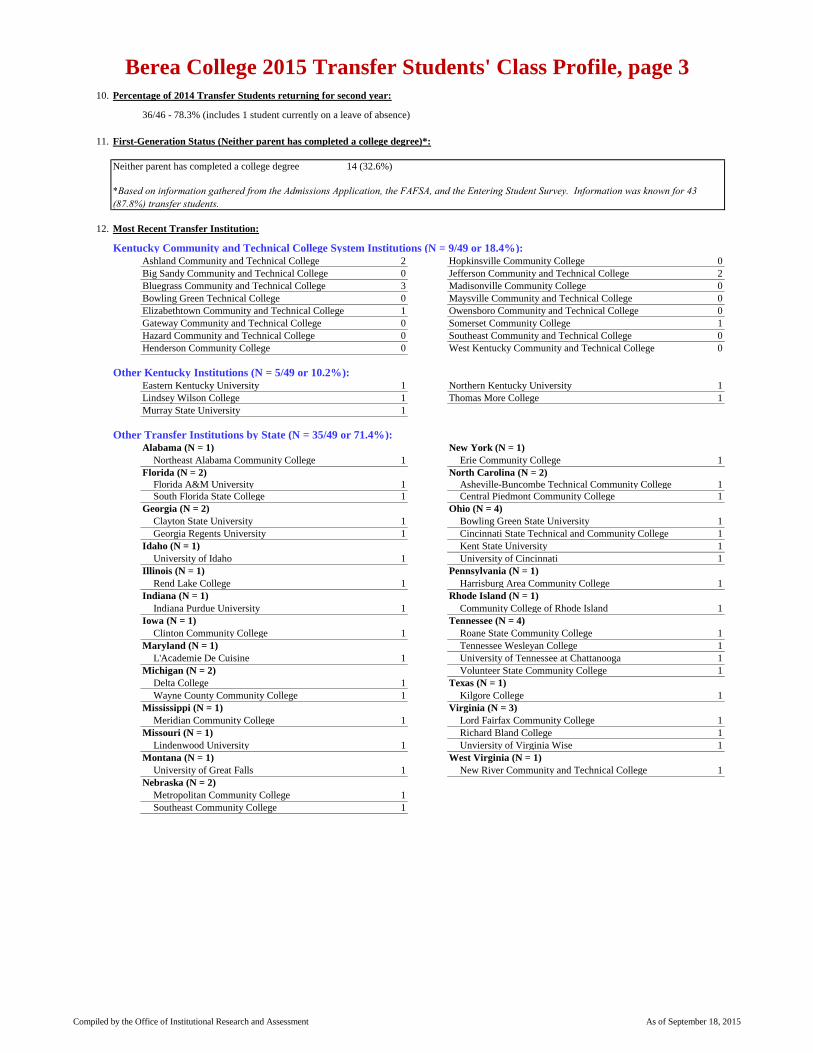
Berea College 2015 Transfer Students' Class Profile, page 310. Percentage of 2014 Transfer Students returning for second year:
36/46 - 78.3% (includes 1 student currently on a leave of absence)
11. First-Generation Status (Neither parent has completed a college degree)*:
Neither parent has completed a college degree 14 (32.6%)
12. Most Recent Transfer Institution:
Kentucky Community and Technical College System Institutions (N = 9/49 or 18.4%):Ashland Community and Technical College 2 Hopkinsville Community College 0
Big Sandy Community and Technical College 0 Jefferson Community and Technical College 2
Bluegrass Community and Technical College 3 Madisonville Community College 0
Bowling Green Technical College 0 Maysville Community and Technical College 0
Elizabethtown Community and Technical College 1 Owensboro Community and Technical College 0
Gateway Community and Technical College 0 Somerset Community College 1
Hazard Community and Technical College 0 Southeast Community and Technical College 0
Henderson Community College 0 West Kentucky Community and Technical College 0
Other Kentucky Institutions (N = 5/49 or 10.2%):Eastern Kentucky University 1 Northern Kentucky University 1
Lindsey Wilson College 1 Thomas More College 1
Murray State University 1
Other Transfer Institutions by State (N = 35/49 or 71.4%):Alabama (N = 1) New York (N = 1)
Northeast Alabama Community College 1 Erie Community College 1
Florida (N = 2) North Carolina (N = 2)
Florida A&M University 1 Asheville-Buncombe Technical Community College 1
South Florida State College 1 Central Piedmont Community College 1
Georgia (N = 2) Ohio (N = 4)
Clayton State University 1 Bowling Green State University 1
Georgia Regents University 1 Cincinnati State Technical and Community College 1
Idaho (N = 1) Kent State University 1
University of Idaho 1 University of Cincinnati 1
Illinois (N = 1) Pennsylvania (N = 1)
Rend Lake College 1 Harrisburg Area Community College 1
Indiana (N = 1) Rhode Island (N = 1)
Indiana Purdue University 1 Community College of Rhode Island 1
Iowa (N = 1) Tennessee (N = 4)
Clinton Community College 1 Roane State Community College 1
Maryland (N = 1) Tennessee Wesleyan College 1
L'Academie De Cuisine 1 University of Tennessee at Chattanooga 1
Michigan (N = 2) Volunteer State Community College 1
Delta College 1 Texas (N = 1)
Wayne County Community College 1 Kilgore College 1
Mississippi (N = 1) Virginia (N = 3)
Meridian Community College 1 Lord Fairfax Community College 1
Missouri (N = 1) Richard Bland College 1
Lindenwood University 1 Unviersity of Virginia Wise 1
Montana (N = 1) West Virginia (N = 1)
University of Great Falls 1 New River Community and Technical College 1
Nebraska (N = 2)
Metropolitan Community College 1
Southeast Community College 1
*Based on information gathered from the Admissions Application, the FAFSA, and the Entering Student Survey. Information was known for 43 (87.8%) transfer students.
Compiled by the Office of Institutional Research and Assessment As of September 18, 2015

Retention
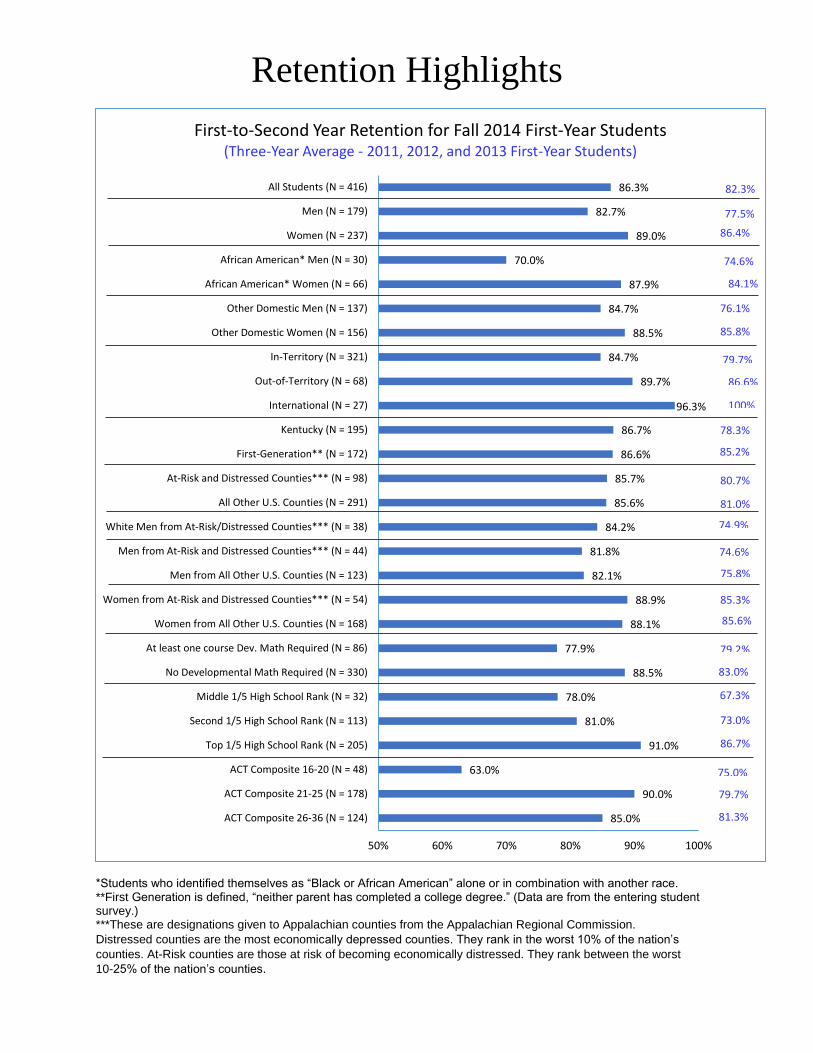
Retention Highlights
*Students who identified themselves as “Black or African American” alone or in combination with another race. **First Generation is defined, “neither parent has completed a college degree.” (Data are from the entering student survey.) ***These are designations given to Appalachian counties from the Appalachian Regional Commission.
Distressed counties are the most economically depressed counties. They rank in the worst 10% of the nation’s
counties. At-Risk counties are those at risk of becoming economically distressed. They rank between the worst
10-25% of the nation’s counties.
85.0%
90.0%
63.0%
91.0%
81.0%
78.0%
88.5%
77.9%
88.1%
88.9%
82.1%
81.8%
84.2%
85.6%
85.7%
86.6%
86.7%
96.3%
89.7%
84.7%
88.5%
84.7%
87.9%
70.0%
89.0%
82.7%
86.3%
50% 60% 70% 80% 90% 100%
ACT Composite 26-36 (N = 124)
ACT Composite 21-25 (N = 178)
ACT Composite 16-20 (N = 48)
Top 1/5 High School Rank (N = 205)
Second 1/5 High School Rank (N = 113)
Middle 1/5 High School Rank (N = 32)
No Developmental Math Required (N = 330)
At least one course Dev. Math Required (N = 86)
Women from All Other U.S. Counties (N = 168)
Women from At-Risk and Distressed Counties*** (N = 54)
Men from All Other U.S. Counties (N = 123)
Men from At-Risk and Distressed Counties*** (N = 44)
White Men from At-Risk/Distressed Counties*** (N = 38)
All Other U.S. Counties (N = 291)
At-Risk and Distressed Counties*** (N = 98)
First-Generation** (N = 172)
Kentucky (N = 195)
International (N = 27)
Out-of-Territory (N = 68)
In-Territory (N = 321)
Other Domestic Women (N = 156)
Other Domestic Men (N = 137)
African American* Women (N = 66)
African American* Men (N = 30)
Women (N = 237)
Men (N = 179)
All Students (N = 416)
First-to-Second Year Retention for Fall 2014 First-Year Students(Three-Year Average - 2011, 2012, and 2013 First-Year Students)
82.3%
86.4%
76.1%
78.3%
85.2%
83.0%
67.3%
77.5%
74.6%
84.1%
85.8%
79.7%
86.6%
100%
80.7%
81.0%
74.9%
74.6%
75.8%
85.3%
85.6%
79.2%
73.0%
86.7%
75.0%
79.7%
81.3%
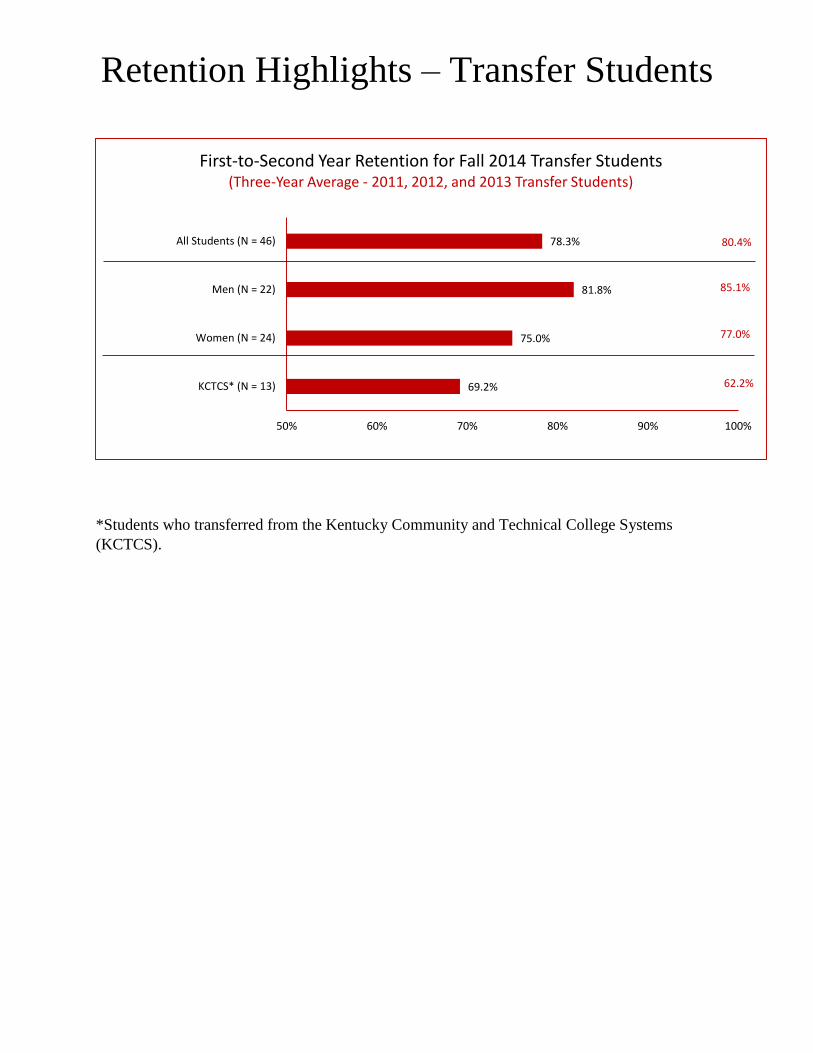
Retention Highlights – Transfer Students
*Students who transferred from the Kentucky Community and Technical College Systems
(KCTCS).
69.2%
75.0%
81.8%
78.3%
50% 60% 70% 80% 90% 100%
KCTCS* (N = 13)
Women (N = 24)
Men (N = 22)
All Students (N = 46)
First-to-Second Year Retention for Fall 2014 Transfer Students(Three-Year Average - 2011, 2012, and 2013 Transfer Students)
80.4%
85.1%
77.0%
62.2%
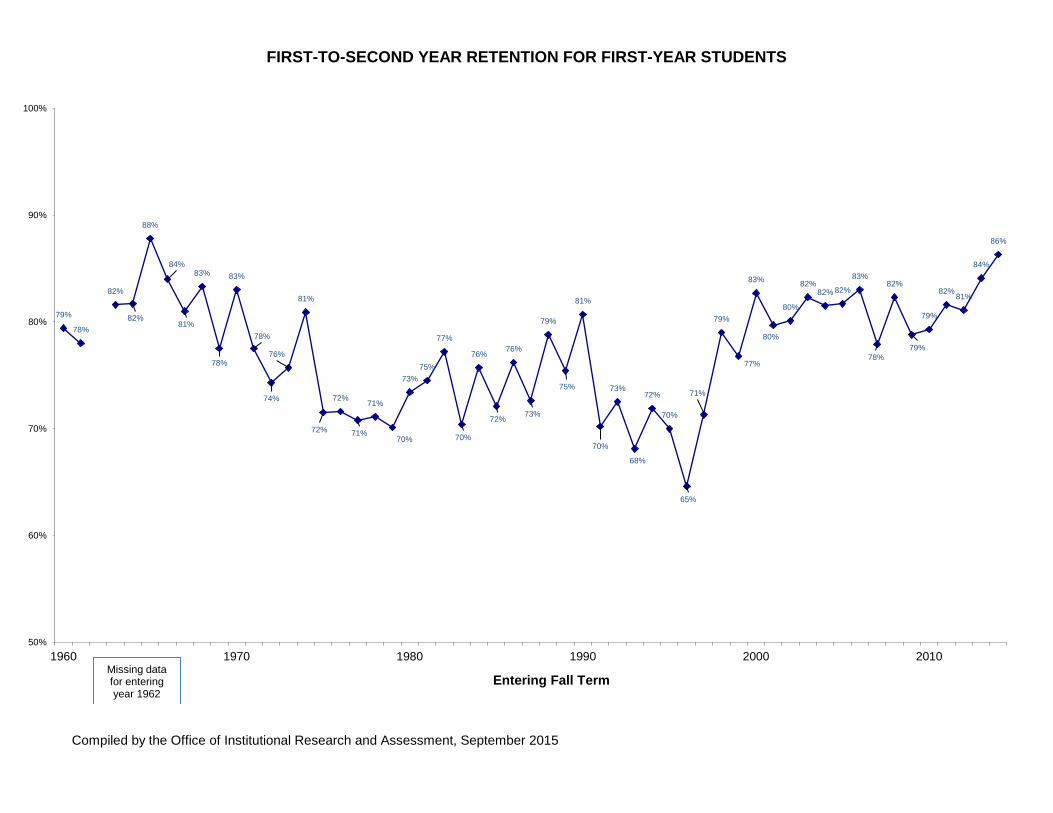
FIRST-TO-SECOND YEAR RETENTION FOR FIRST-YEAR STUDENTS
Compiled by the Office of Institutional Research and Assessment, September 2015
79%
78%
82%
82%
88%
84%
81%
83%
78%
83%
78%
74%
76%
81%
72%
72%
71%
71%
70%
73%
75%
77%
70%
76%
72%
76%
73%
79%
75%
81%
70%
73%
68%
72%
70%
65%
71%
79%
77%
83%
80%
80%
82%82% 82%
83%
78%
82%
79%
79%
82%81%
84%
86%
50%
60%
70%
80%
90%
100%
1960 1970 1980 1990 2000 2010
Entering Fall TermMissing data for entering year 1962

FIRST-YEAR STUDENT RETENTION/ATTRITION FALL TERMS 2005 - 2014
Breakdown of Withdrawals Percent Total Number Returned for Number Academic Other Voluntary Year Enrolled Second Year Withdrawn Suspensions Suspensions** Departures
2005 378 81.7 % 69 26 4 39 2006 388 83.0 66 14 2 50 2007 420* 77.9 93 25 4 64 2008 413 81.8 75 26 3 46 2009 392 78.8 83 18 9 56 2010 429 79.3 89 31 9 49 2011 417* 81.6 77 28 9 40 2012 391 81.1 74 22 8 44 2013 397 84.1 63 11 10 42 2014 416 86.3 57 13 11 33 NOTE: For all years reported above, the percent retained represents both students who re-enrolled the second year as well as those students granted a "leave of absence." Students who do not return from official leaves are not counted as withdrawn until they fail to re-enroll after their leaves.
PERCENTAGE OF TOTAL WITHDRAWALS ATTRIBUTED TO: ACADEMIC SUSPENSIONS, OTHER SUSPENSIONS**,
AND VOLUNTARY DEPARTURES
*Denotes cohort numbers that have been adjusted due to the death of a student. In each case, the number
in the cohort has been reduced by one. **Includes expulsion, disciplinary, labor, convocation, and administrative dismissals.
Source: Office of Institutional Research and Assessment, October 2015
0%
10%
20%
30%
40%
50%
60%
70%
80%
90%
100%
2005 2006 2007 2008 2009 2010 2011 2012 2013 2014
Voluntary Departures Academic Suspensions Other Suspensions
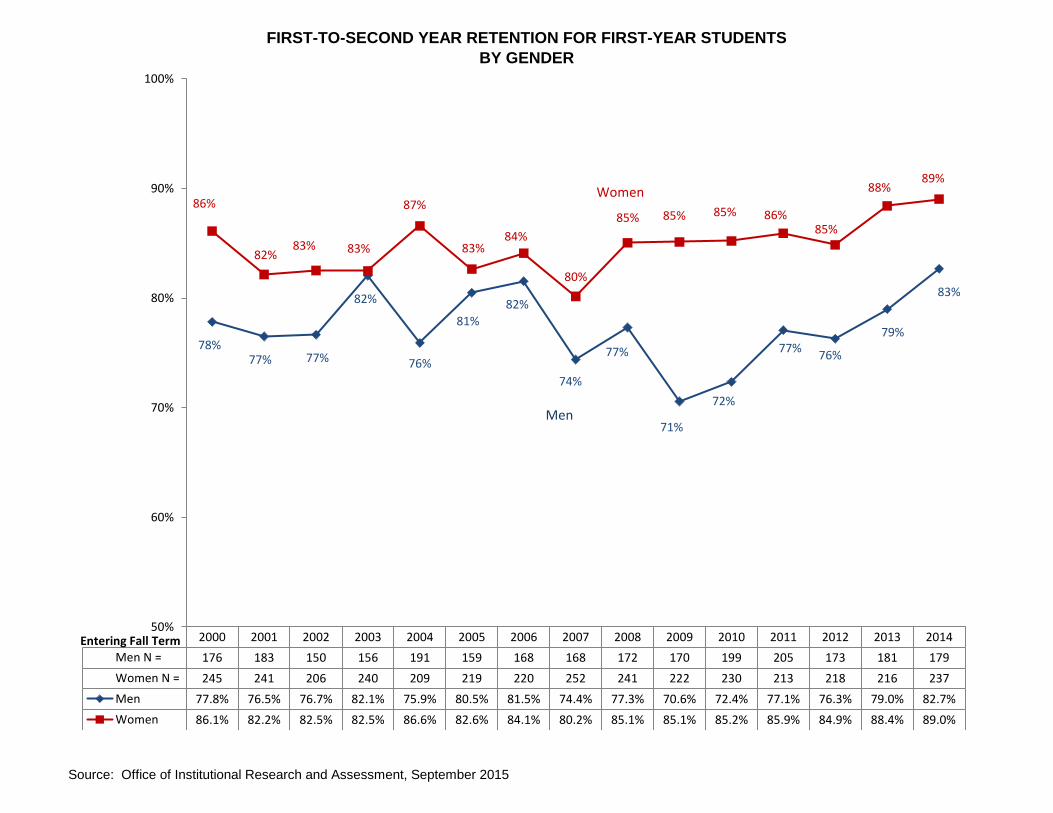
FIRST-TO-SECOND YEAR RETENTION FOR FIRST-YEAR STUDENTS
BY GENDER
Source: Office of Institutional Research and Assessment, September 2015
2000 2001 2002 2003 2004 2005 2006 2007 2008 2009 2010 2011 2012 2013 2014
Men N = 176 183 150 156 191 159 168 168 172 170 199 205 173 181 179
Women N = 245 241 206 240 209 219 220 252 241 222 230 213 218 216 237
Men 77.8% 76.5% 76.7% 82.1% 75.9% 80.5% 81.5% 74.4% 77.3% 70.6% 72.4% 77.1% 76.3% 79.0% 82.7%
Women 86.1% 82.2% 82.5% 82.5% 86.6% 82.6% 84.1% 80.2% 85.1% 85.1% 85.2% 85.9% 84.9% 88.4% 89.0%
78%77% 77%
82%
76%
81%
82%
74%
77%
71%
72%
77%76%
79%
83%
86%
82%83% 83%
87%
83%84%
80%
85% 85% 85% 86%85%
88%89%
50%
60%
70%
80%
90%
100%
Entering Fall Term
Women
Men
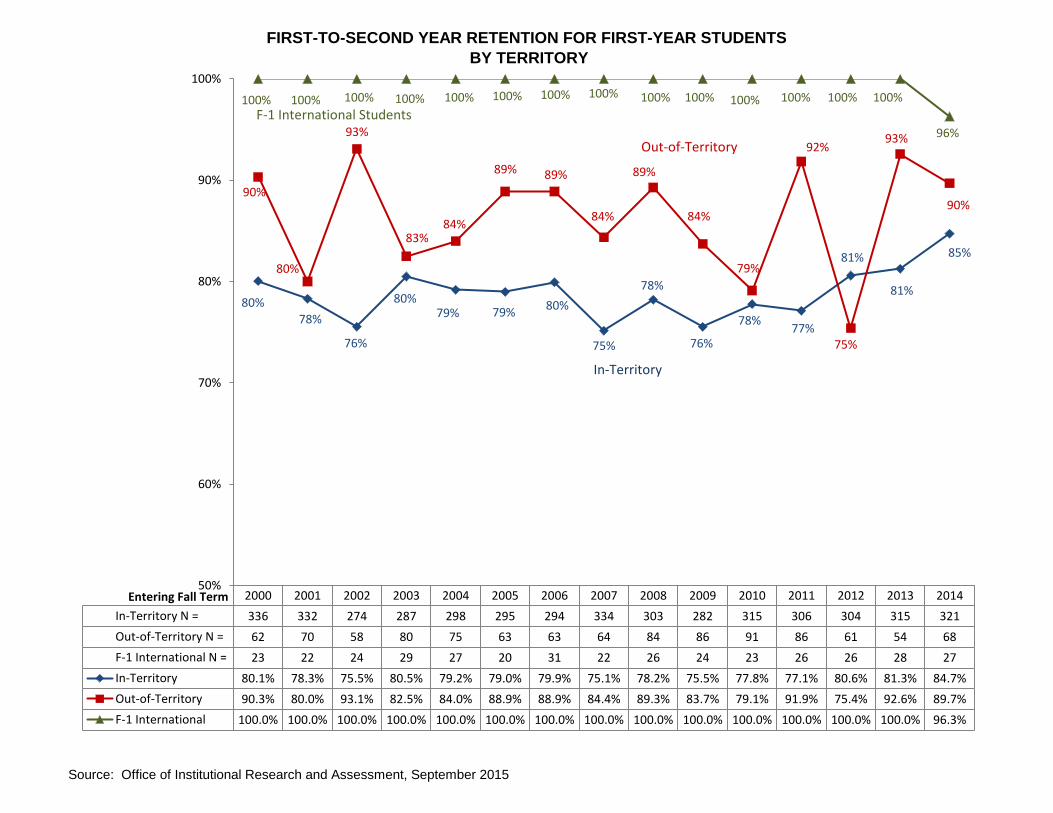
FIRST-TO-SECOND YEAR RETENTION FOR FIRST-YEAR STUDENTS
BY TERRITORY
Source: Office of Institutional Research and Assessment, September 2015
2000 2001 2002 2003 2004 2005 2006 2007 2008 2009 2010 2011 2012 2013 2014
In-Territory N = 336 332 274 287 298 295 294 334 303 282 315 306 304 315 321
Out-of-Territory N = 62 70 58 80 75 63 63 64 84 86 91 86 61 54 68
F-1 International N = 23 22 24 29 27 20 31 22 26 24 23 26 26 28 27
In-Territory 80.1% 78.3% 75.5% 80.5% 79.2% 79.0% 79.9% 75.1% 78.2% 75.5% 77.8% 77.1% 80.6% 81.3% 84.7%
Out-of-Territory 90.3% 80.0% 93.1% 82.5% 84.0% 88.9% 88.9% 84.4% 89.3% 83.7% 79.1% 91.9% 75.4% 92.6% 89.7%
F-1 International 100.0% 100.0% 100.0% 100.0% 100.0% 100.0% 100.0% 100.0% 100.0% 100.0% 100.0% 100.0% 100.0% 100.0% 96.3%
80%
78%
76%
80%79% 79%
80%
75%
78%
76%
78%77%
81%
81%
85%
90%
80%
93%
83%84%
89%89%
84%
89%
84%
79%
92%
75%
93%
90%
100% 100% 100% 100% 100% 100% 100% 100% 100% 100% 100% 100% 100% 100%
96%
50%
60%
70%
80%
90%
100%
Entering Fall Term
Out-of-Territory
In-Territory
F-1 International Students
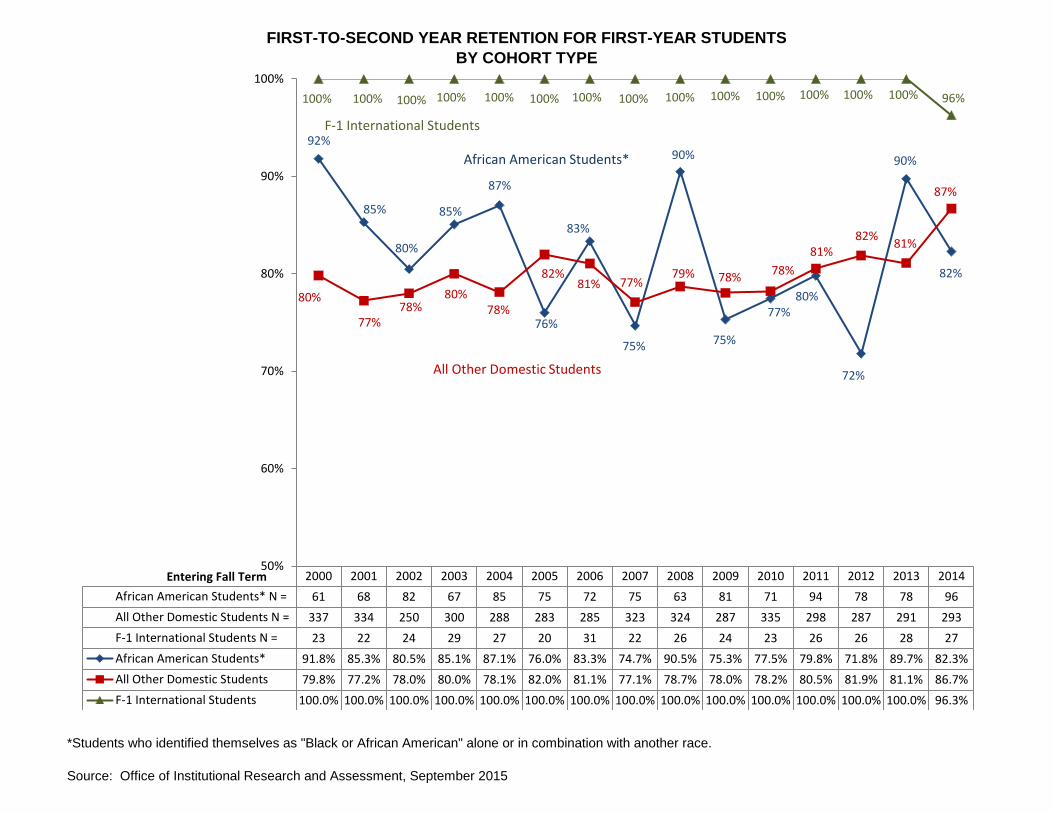
FIRST-TO-SECOND YEAR RETENTION FOR FIRST-YEAR STUDENTS
BY COHORT TYPE
*Students who identified themselves as "Black or African American" alone or in combination with another race.
Source: Office of Institutional Research and Assessment, September 2015
2000 2001 2002 2003 2004 2005 2006 2007 2008 2009 2010 2011 2012 2013 2014
African American Students* N = 61 68 82 67 85 75 72 75 63 81 71 94 78 78 96
All Other Domestic Students N = 337 334 250 300 288 283 285 323 324 287 335 298 287 291 293
F-1 International Students N = 23 22 24 29 27 20 31 22 26 24 23 26 26 28 27
African American Students* 91.8% 85.3% 80.5% 85.1% 87.1% 76.0% 83.3% 74.7% 90.5% 75.3% 77.5% 79.8% 71.8% 89.7% 82.3%
All Other Domestic Students 79.8% 77.2% 78.0% 80.0% 78.1% 82.0% 81.1% 77.1% 78.7% 78.0% 78.2% 80.5% 81.9% 81.1% 86.7%
F-1 International Students 100.0% 100.0% 100.0% 100.0% 100.0% 100.0% 100.0% 100.0% 100.0% 100.0% 100.0% 100.0% 100.0% 100.0% 96.3%
92%
85%
80%
85%
87%
76%
83%
75%
90%
75%
77%80%
72%
90%
82%
80%
77%78%
80%78%
82%81% 77%
79% 78%78%
81%82%
81%
87%
100% 100% 100% 100% 100% 100% 100% 100% 100% 100% 100% 100% 100% 100% 96%
50%
60%
70%
80%
90%
100%
Entering Fall Term
All Other Domestic Students
African American Students*
F-1 International Students
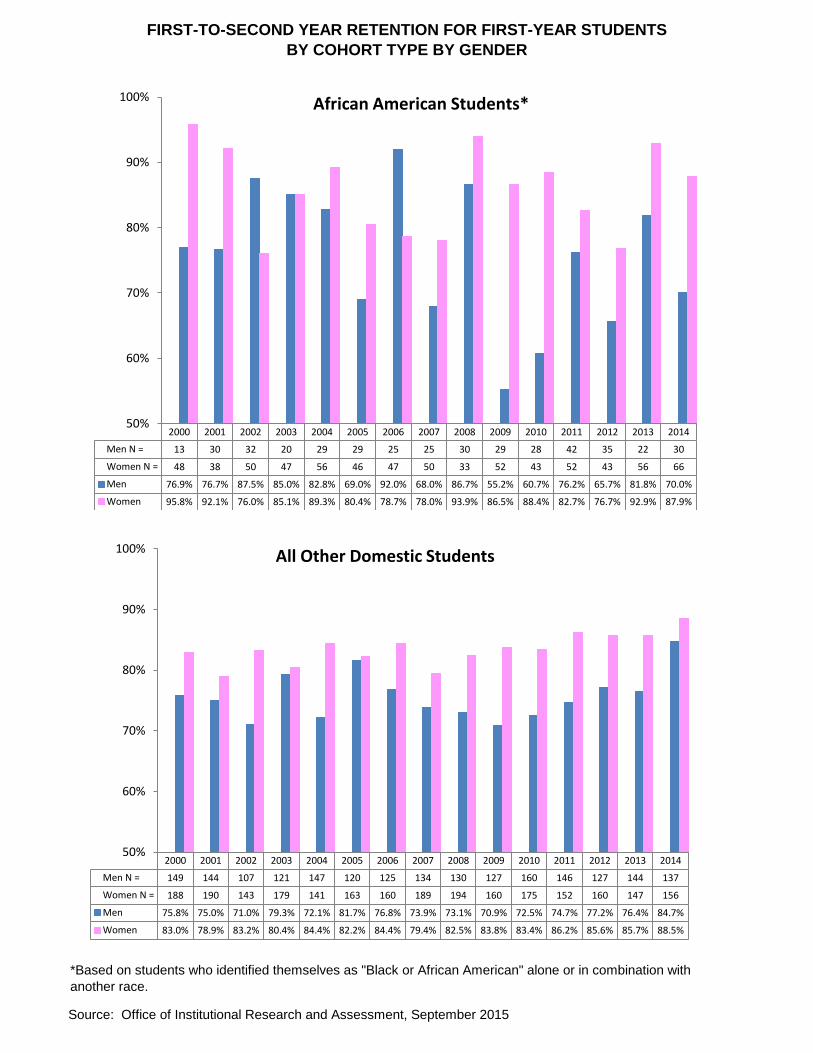
FIRST-TO-SECOND YEAR RETENTION FOR FIRST-YEAR STUDENTS
BY COHORT TYPE BY GENDER
*Based on students who identified themselves as "Black or African American" alone or in combination with
another race.
2000 2001 2002 2003 2004 2005 2006 2007 2008 2009 2010 2011 2012 2013 2014
Men N = 13 30 32 20 29 29 25 25 30 29 28 42 35 22 30
Women N = 48 38 50 47 56 46 47 50 33 52 43 52 43 56 66
Men 76.9% 76.7% 87.5% 85.0% 82.8% 69.0% 92.0% 68.0% 86.7% 55.2% 60.7% 76.2% 65.7% 81.8% 70.0%
Women 95.8% 92.1% 76.0% 85.1% 89.3% 80.4% 78.7% 78.0% 93.9% 86.5% 88.4% 82.7% 76.7% 92.9% 87.9%
50%
60%
70%
80%
90%
100% African American Students*
2000 2001 2002 2003 2004 2005 2006 2007 2008 2009 2010 2011 2012 2013 2014
Men N = 149 144 107 121 147 120 125 134 130 127 160 146 127 144 137
Women N = 188 190 143 179 141 163 160 189 194 160 175 152 160 147 156
Men 75.8% 75.0% 71.0% 79.3% 72.1% 81.7% 76.8% 73.9% 73.1% 70.9% 72.5% 74.7% 77.2% 76.4% 84.7%
Women 83.0% 78.9% 83.2% 80.4% 84.4% 82.2% 84.4% 79.4% 82.5% 83.8% 83.4% 86.2% 85.6% 85.7% 88.5%
50%
60%
70%
80%
90%
100% All Other Domestic Students
Source: Office of Institutional Research and Assessment, September 2015
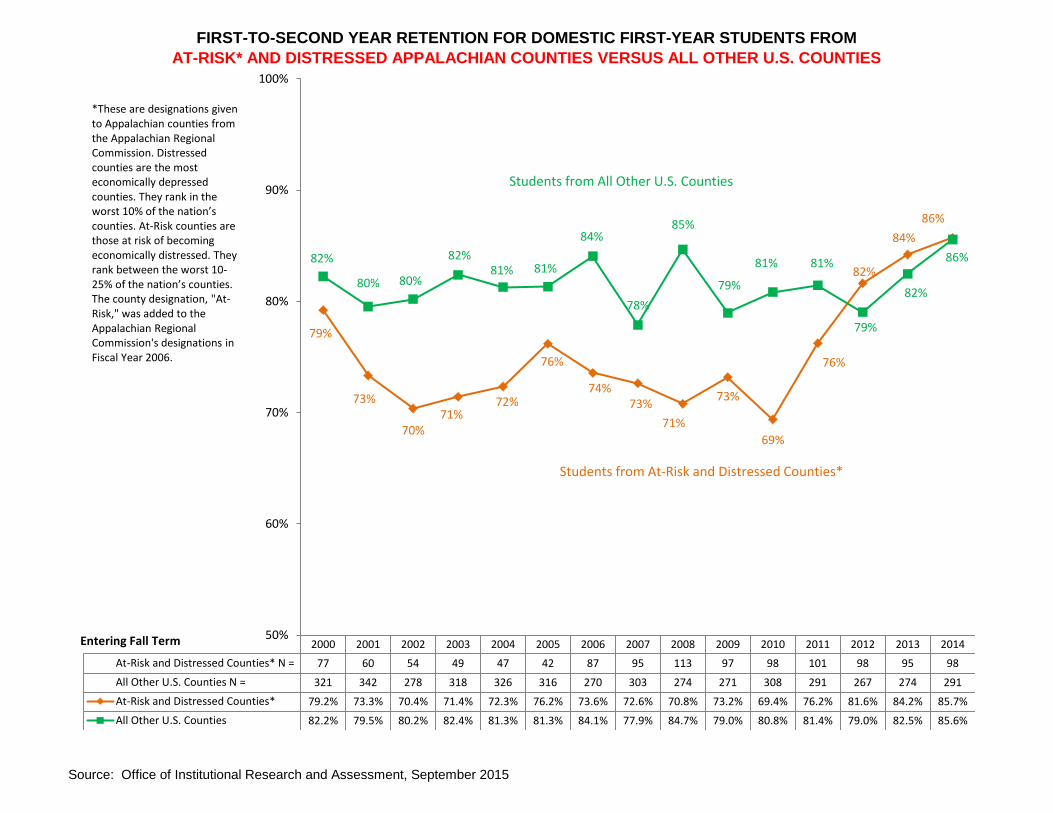
FIRST-TO-SECOND YEAR RETENTION FOR DOMESTIC FIRST-YEAR STUDENTS FROM
AT-RISK* AND DISTRESSED APPALACHIAN COUNTIES VERSUS ALL OTHER U.S. COUNTIES
Source: Office of Institutional Research and Assessment, September 2015
2000 2001 2002 2003 2004 2005 2006 2007 2008 2009 2010 2011 2012 2013 2014
At-Risk and Distressed Counties* N = 77 60 54 49 47 42 87 95 113 97 98 101 98 95 98
All Other U.S. Counties N = 321 342 278 318 326 316 270 303 274 271 308 291 267 274 291
At-Risk and Distressed Counties* 79.2% 73.3% 70.4% 71.4% 72.3% 76.2% 73.6% 72.6% 70.8% 73.2% 69.4% 76.2% 81.6% 84.2% 85.7%
All Other U.S. Counties 82.2% 79.5% 80.2% 82.4% 81.3% 81.3% 84.1% 77.9% 84.7% 79.0% 80.8% 81.4% 79.0% 82.5% 85.6%
79%
73%
70%71%
72%
76%
74%73%
71%
73%
69%
76%
82%
84%
86%
82%
80% 80%
82%81% 81%
84%
78%
85%
79%
81% 81%
79%
82%
86%
50%
60%
70%
80%
90%
100%
Entering Fall Term
Students from All Other U.S. Counties
Students from At-Risk and Distressed Counties*
*These are designations given to Appalachian counties from the Appalachian Regional Commission. Distressed counties are the most economically depressed counties. They rank in the worst 10% of the nation’s counties. At-Risk counties are those at risk of becoming economically distressed. They rank between the worst 10-25% of the nation’s counties. The county designation, "At-Risk," was added to the Appalachian Regional Commission's designations in Fiscal Year 2006.
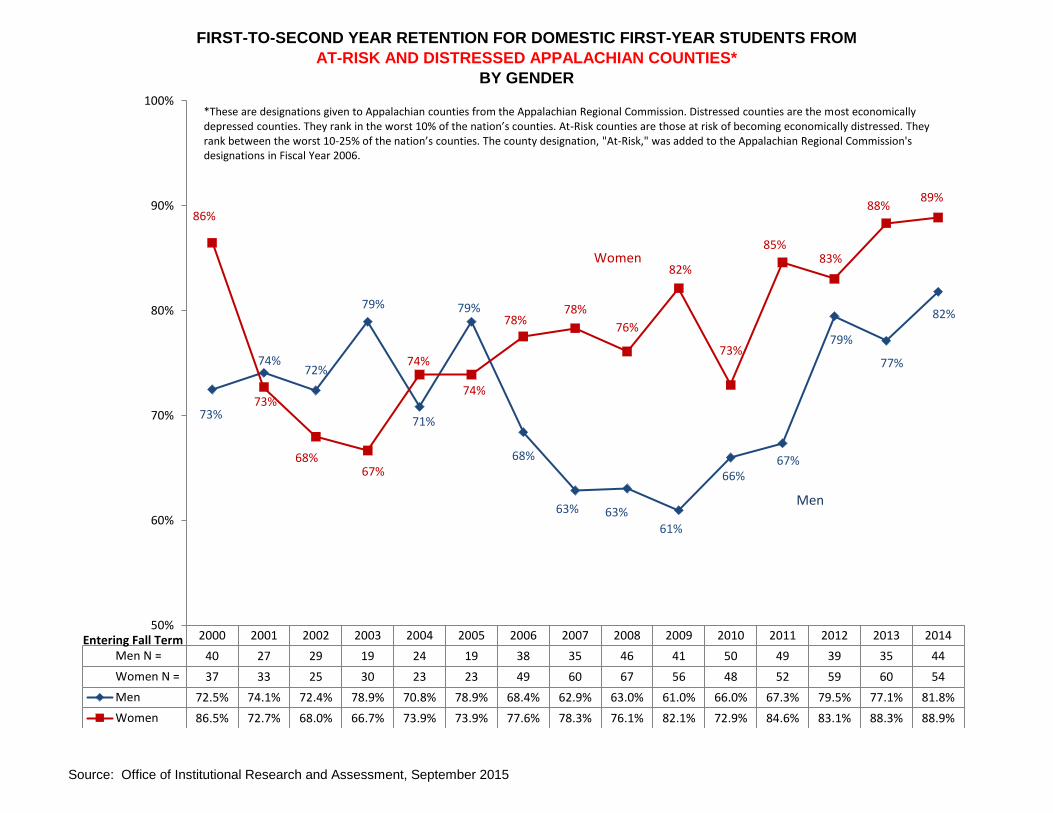
FIRST-TO-SECOND YEAR RETENTION FOR DOMESTIC FIRST-YEAR STUDENTS FROM
AT-RISK AND DISTRESSED APPALACHIAN COUNTIES*
BY GENDER
Source: Office of Institutional Research and Assessment, September 2015
2000 2001 2002 2003 2004 2005 2006 2007 2008 2009 2010 2011 2012 2013 2014
Men N = 40 27 29 19 24 19 38 35 46 41 50 49 39 35 44
Women N = 37 33 25 30 23 23 49 60 67 56 48 52 59 60 54
Men 72.5% 74.1% 72.4% 78.9% 70.8% 78.9% 68.4% 62.9% 63.0% 61.0% 66.0% 67.3% 79.5% 77.1% 81.8%
Women 86.5% 72.7% 68.0% 66.7% 73.9% 73.9% 77.6% 78.3% 76.1% 82.1% 72.9% 84.6% 83.1% 88.3% 88.9%
73%
74%72%
79%
71%
79%
68%
63% 63%61%
66%67%
79%
77%
82%
86%
73%
68%67%
74%
74%
78%78%
76%
82%
73%
85%83%
88%89%
50%
60%
70%
80%
90%
100%
Entering Fall Term
Women
Men
*These are designations given to Appalachian counties from the Appalachian Regional Commission. Distressed counties are the most economically depressed counties. They rank in the worst 10% of the nation’s counties. At-Risk counties are those at risk of becoming economically distressed. They rank between the worst 10-25% of the nation’s counties. The county designation, "At-Risk," was added to the Appalachian Regional Commission's designations in Fiscal Year 2006.
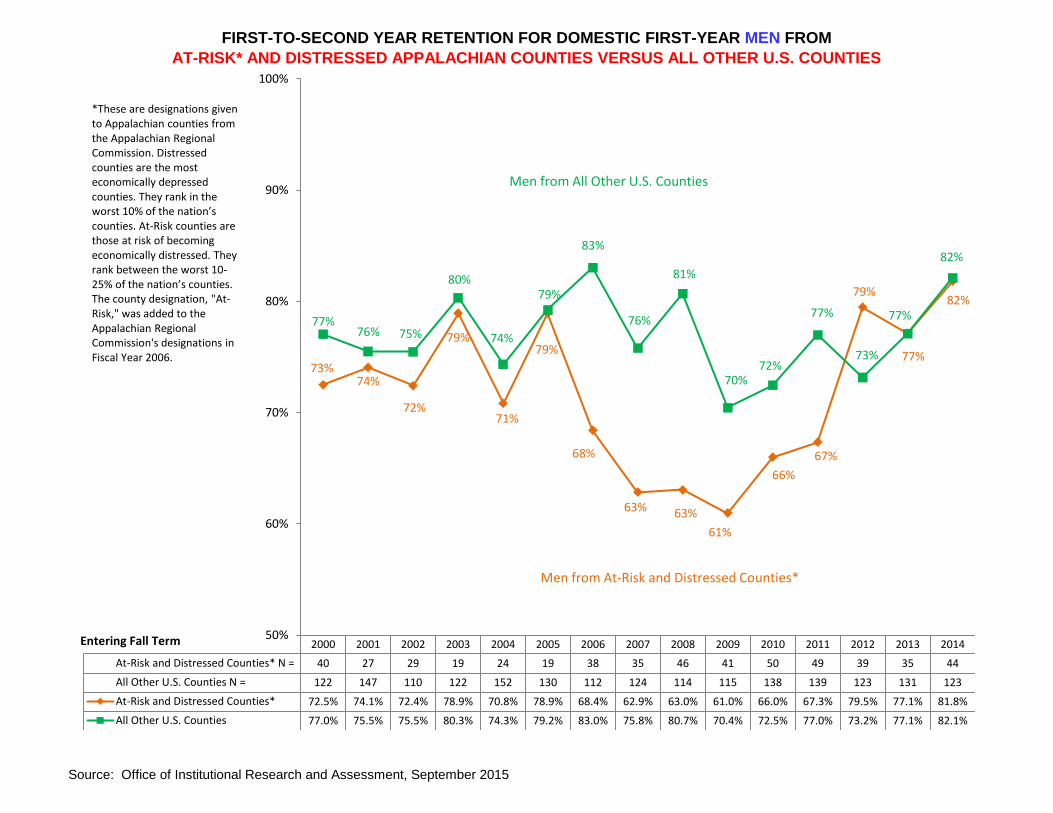
FIRST-TO-SECOND YEAR RETENTION FOR DOMESTIC FIRST-YEAR MEN FROM
AT-RISK* AND DISTRESSED APPALACHIAN COUNTIES VERSUS ALL OTHER U.S. COUNTIES
Source: Office of Institutional Research and Assessment, September 2015
2000 2001 2002 2003 2004 2005 2006 2007 2008 2009 2010 2011 2012 2013 2014
At-Risk and Distressed Counties* N = 40 27 29 19 24 19 38 35 46 41 50 49 39 35 44
All Other U.S. Counties N = 122 147 110 122 152 130 112 124 114 115 138 139 123 131 123
At-Risk and Distressed Counties* 72.5% 74.1% 72.4% 78.9% 70.8% 78.9% 68.4% 62.9% 63.0% 61.0% 66.0% 67.3% 79.5% 77.1% 81.8%
All Other U.S. Counties 77.0% 75.5% 75.5% 80.3% 74.3% 79.2% 83.0% 75.8% 80.7% 70.4% 72.5% 77.0% 73.2% 77.1% 82.1%
73%74%
72%
79%
71%
79%
68%
63% 63%
61%
66%
67%
79%
77%
82%
77%76% 75%
80%
74%
79%
83%
76%
81%
70%72%
77%
73%
77%
82%
50%
60%
70%
80%
90%
100%
Entering Fall Term
Men from All Other U.S. Counties
Men from At-Risk and Distressed Counties*
*These are designations given to Appalachian counties from the Appalachian Regional Commission. Distressed counties are the most economically depressed counties. They rank in the worst 10% of the nation’s counties. At-Risk counties are those at risk of becoming economically distressed. They rank between the worst 10-25% of the nation’s counties. The county designation, "At-Risk," was added to the Appalachian Regional Commission's designations in Fiscal Year 2006.
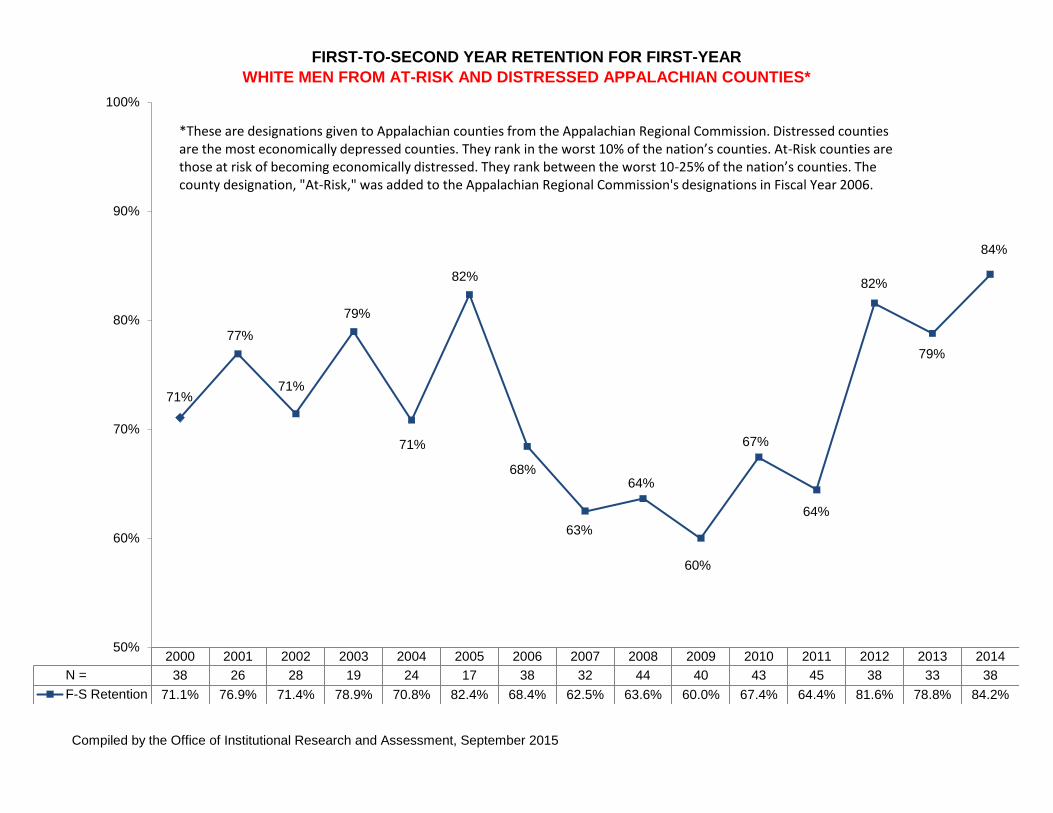
FIRST-TO-SECOND YEAR RETENTION FOR FIRST-YEAR
WHITE MEN FROM AT-RISK AND DISTRESSED APPALACHIAN COUNTIES*
Compiled by the Office of Institutional Research and Assessment, September 2015
2000 2001 2002 2003 2004 2005 2006 2007 2008 2009 2010 2011 2012 2013 2014
N = 38 26 28 19 24 17 38 32 44 40 43 45 38 33 38
F-S Retention 71.1% 76.9% 71.4% 78.9% 70.8% 82.4% 68.4% 62.5% 63.6% 60.0% 67.4% 64.4% 81.6% 78.8% 84.2%
71%
77%
71%
79%
71%
82%
68%
63%
64%
60%
67%
64%
82%
79%
84%
50%
60%
70%
80%
90%
100%
*These are designations given to Appalachian counties from the Appalachian Regional Commission. Distressed counties are the most economically depressed counties. They rank in the worst 10% of the nation’s counties. At-Risk counties are those at risk of becoming economically distressed. They rank between the worst 10-25% of the nation’s counties. Thecounty designation, "At-Risk," was added to the Appalachian Regional Commission's designations in Fiscal Year 2006.
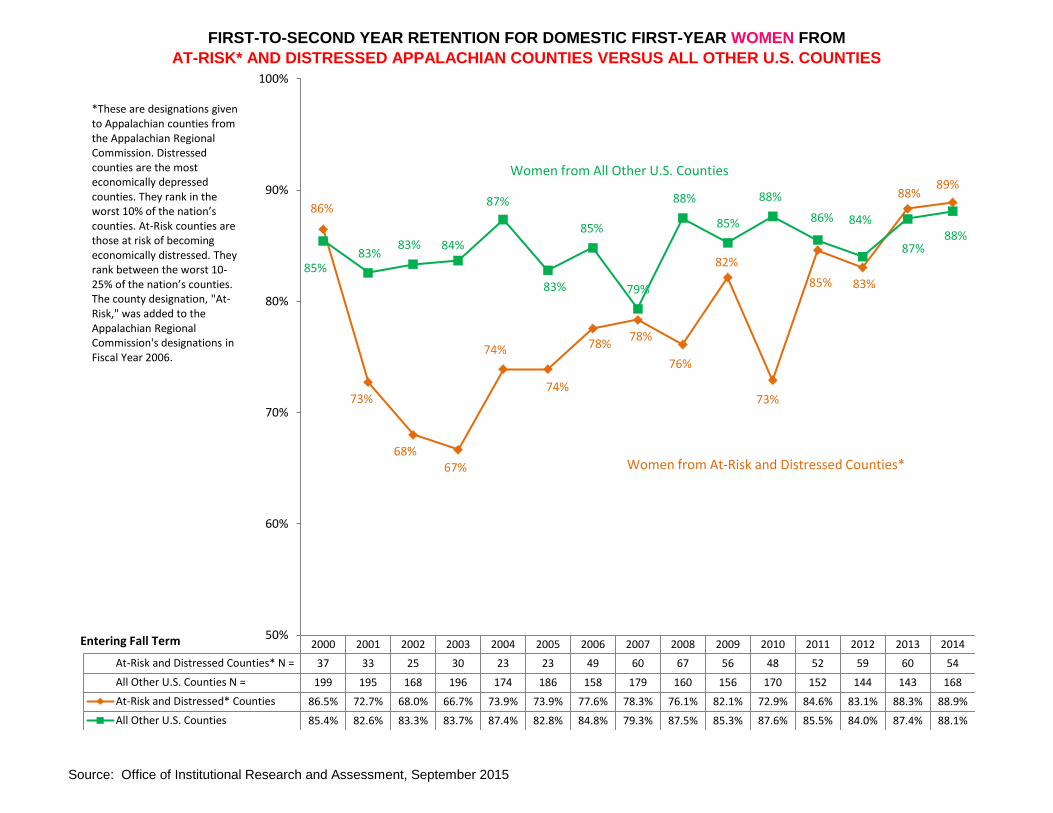
FIRST-TO-SECOND YEAR RETENTION FOR DOMESTIC FIRST-YEAR WOMEN FROM
AT-RISK* AND DISTRESSED APPALACHIAN COUNTIES VERSUS ALL OTHER U.S. COUNTIES
Source: Office of Institutional Research and Assessment, September 2015
2000 2001 2002 2003 2004 2005 2006 2007 2008 2009 2010 2011 2012 2013 2014
At-Risk and Distressed Counties* N = 37 33 25 30 23 23 49 60 67 56 48 52 59 60 54
All Other U.S. Counties N = 199 195 168 196 174 186 158 179 160 156 170 152 144 143 168
At-Risk and Distressed* Counties 86.5% 72.7% 68.0% 66.7% 73.9% 73.9% 77.6% 78.3% 76.1% 82.1% 72.9% 84.6% 83.1% 88.3% 88.9%
All Other U.S. Counties 85.4% 82.6% 83.3% 83.7% 87.4% 82.8% 84.8% 79.3% 87.5% 85.3% 87.6% 85.5% 84.0% 87.4% 88.1%
86%
73%
68%67%
74%
74%
78%78%
76%
82%
73%
85% 83%
88%89%
85%83%
83% 84%
87%
83%
85%
79%
88%
85%
88%
86% 84%
87%88%
50%
60%
70%
80%
90%
100%
Entering Fall Term
Women from All Other U.S. Counties
Women from At-Risk and Distressed Counties*
*These are designations given to Appalachian counties from the Appalachian Regional Commission. Distressed counties are the most economically depressed counties. They rank in the worst 10% of the nation’s counties. At-Risk counties are those at risk of becoming economically distressed. They rank between the worst 10-25% of the nation’s counties. The county designation, "At-Risk," was added to the Appalachian Regional Commission's designations in Fiscal Year 2006.
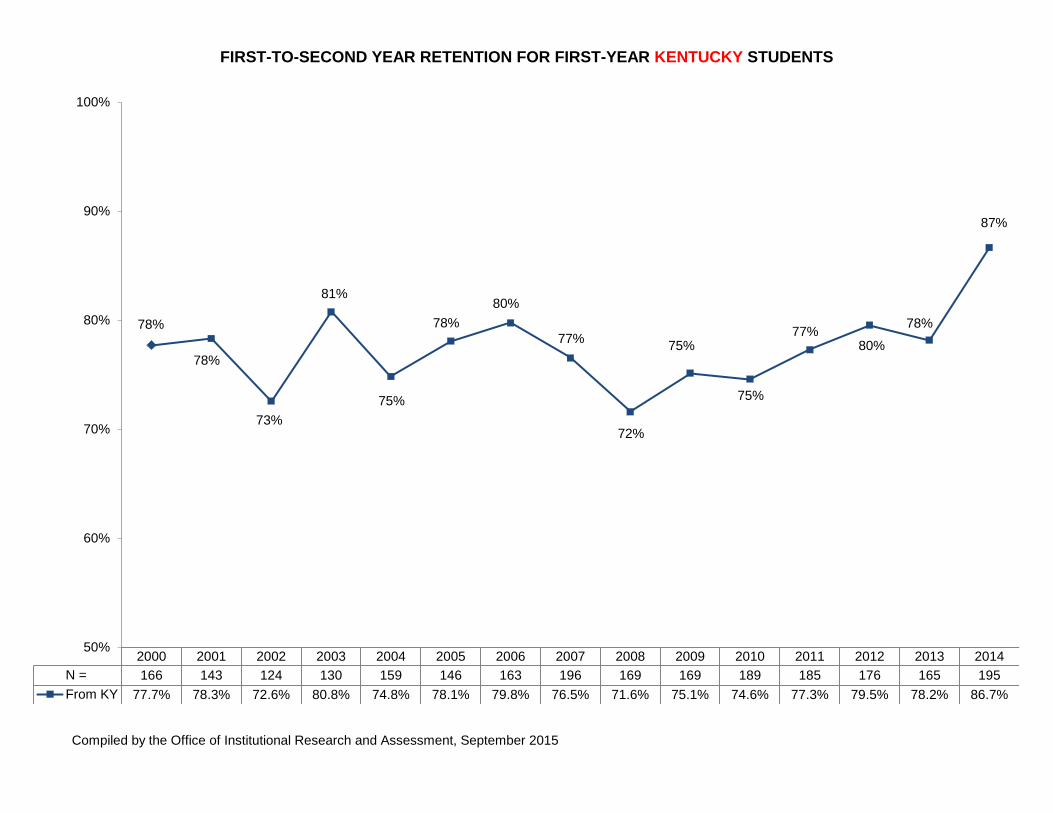
FIRST-TO-SECOND YEAR RETENTION FOR FIRST-YEAR KENTUCKY STUDENTS
Compiled by the Office of Institutional Research and Assessment, September 2015
2000 2001 2002 2003 2004 2005 2006 2007 2008 2009 2010 2011 2012 2013 2014
N = 166 143 124 130 159 146 163 196 169 169 189 185 176 165 195
From KY 77.7% 78.3% 72.6% 80.8% 74.8% 78.1% 79.8% 76.5% 71.6% 75.1% 74.6% 77.3% 79.5% 78.2% 86.7%
78%
78%
73%
81%
75%
78%
80%
77%
72%
75%
75%
77%80%
78%
87%
50%
60%
70%
80%
90%
100%
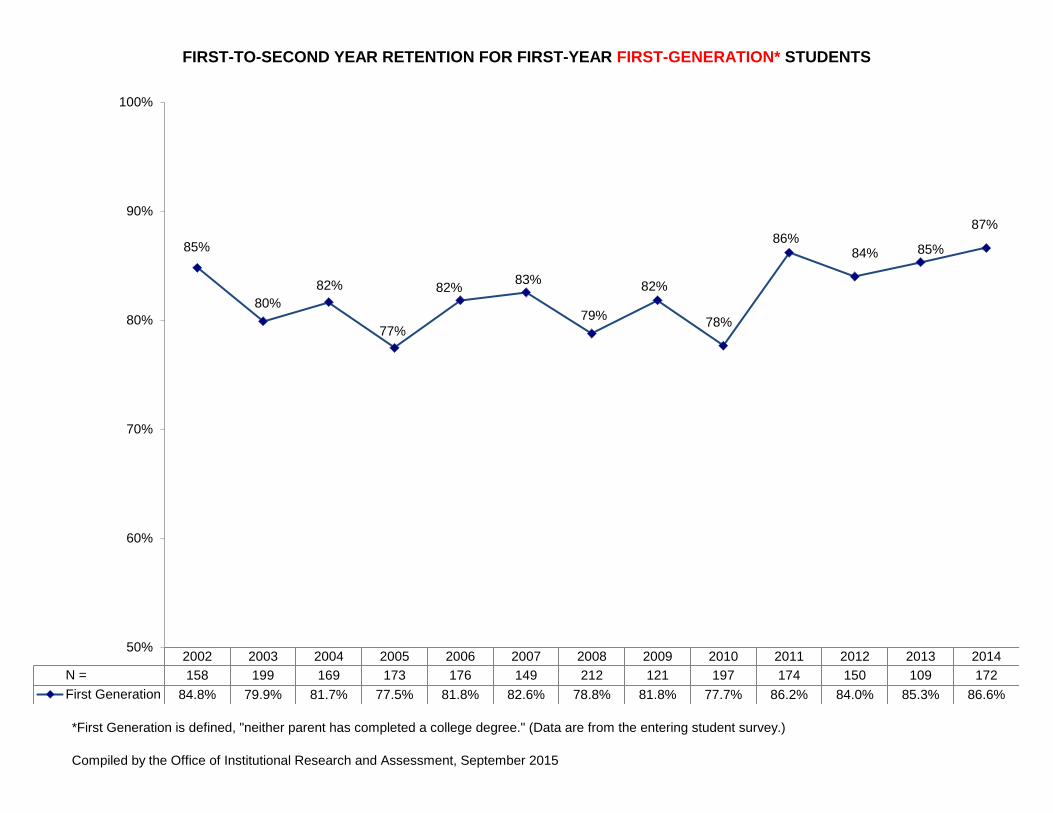
FIRST-TO-SECOND YEAR RETENTION FOR FIRST-YEAR FIRST-GENERATION* STUDENTS
*First Generation is defined, "neither parent has completed a college degree." (Data are from the entering student survey.)
Compiled by the Office of Institutional Research and Assessment, September 2015
2002 2003 2004 2005 2006 2007 2008 2009 2010 2011 2012 2013 2014
N = 158 199 169 173 176 149 212 121 197 174 150 109 172
First Generation 84.8% 79.9% 81.7% 77.5% 81.8% 82.6% 78.8% 81.8% 77.7% 86.2% 84.0% 85.3% 86.6%
85%
80%
82%
77%
82%83%
79%
82%
78%
86%84% 85%
87%
50%
60%
70%
80%
90%
100%
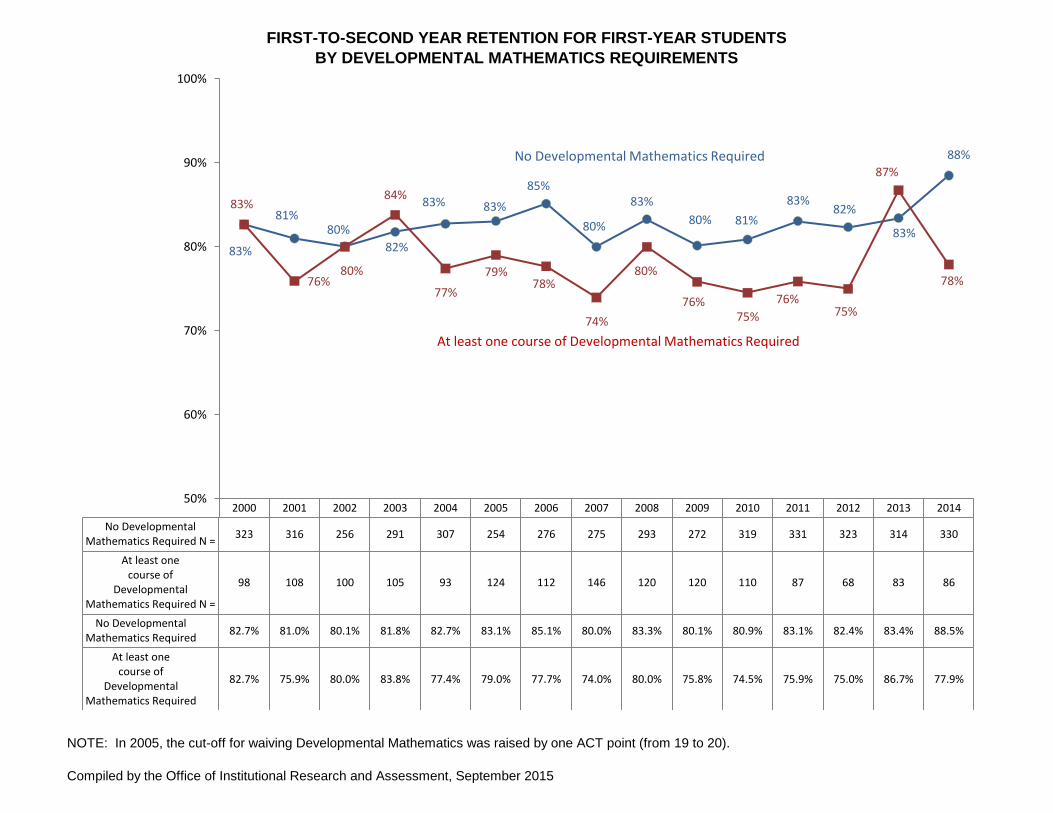
FIRST-TO-SECOND YEAR RETENTION FOR FIRST-YEAR STUDENTS
BY DEVELOPMENTAL MATHEMATICS REQUIREMENTS
NOTE: In 2005, the cut-off for waiving Developmental Mathematics was raised by one ACT point (from 19 to 20).
Compiled by the Office of Institutional Research and Assessment, September 2015
2000 2001 2002 2003 2004 2005 2006 2007 2008 2009 2010 2011 2012 2013 2014
No DevelopmentalMathematics Required N =
323 316 256 291 307 254 276 275 293 272 319 331 323 314 330
At least onecourse of
DevelopmentalMathematics Required N =
98 108 100 105 93 124 112 146 120 120 110 87 68 83 86
No DevelopmentalMathematics Required
82.7% 81.0% 80.1% 81.8% 82.7% 83.1% 85.1% 80.0% 83.3% 80.1% 80.9% 83.1% 82.4% 83.4% 88.5%
At least onecourse of
DevelopmentalMathematics Required
82.7% 75.9% 80.0% 83.8% 77.4% 79.0% 77.7% 74.0% 80.0% 75.8% 74.5% 75.9% 75.0% 86.7% 77.9%
83%
81%80%
82%
83% 83%
85%
80%
83%
80% 81%
83%82%
83%
88%
83%
76%80%
84%
77%
79%78%
74%
80%
76%75%
76%75%
87%
78%
50%
60%
70%
80%
90%
100%
At least one course of Developmental Mathematics Required
No Developmental Mathematics Required
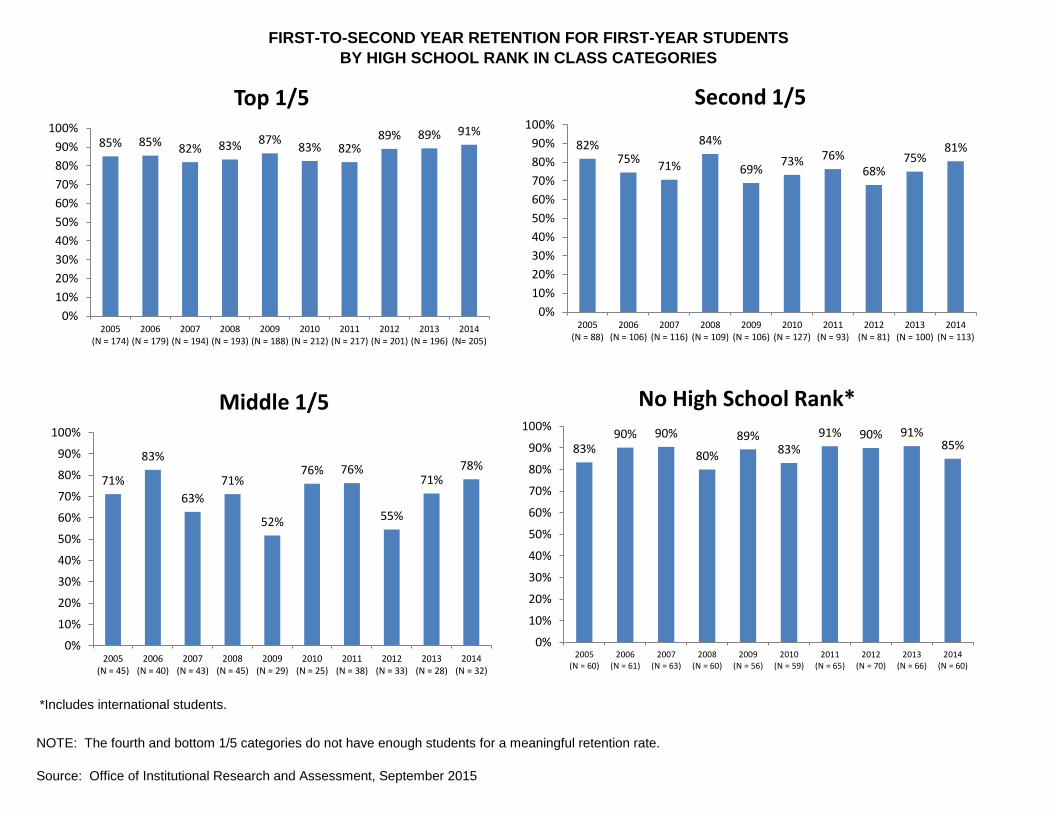
FIRST-TO-SECOND YEAR RETENTION FOR FIRST-YEAR STUDENTS
BY HIGH SCHOOL RANK IN CLASS CATEGORIES
*Includes international students.
82%75%
71%
84%
69%73% 76%
68%75%
81%
0%
10%
20%
30%
40%
50%
60%
70%
80%
90%
100%
2005(N = 88)
2006(N = 106)
2007(N = 116)
2008(N = 109)
2009(N = 106)
2010(N = 127)
2011(N = 93)
2012(N = 81)
2013(N = 100)
2014(N = 113)
Second 1/5
85% 85% 82% 83% 87%83% 82%
89% 89% 91%
0%
10%
20%
30%
40%
50%
60%
70%
80%
90%
100%
2005(N = 174)
2006(N = 179)
2007(N = 194)
2008(N = 193)
2009(N = 188)
2010(N = 212)
2011(N = 217)
2012(N = 201)
2013(N = 196)
2014(N= 205)
Top 1/5
83%90% 90%
80%
89%83%
91% 90% 91%85%
0%
10%
20%
30%
40%
50%
60%
70%
80%
90%
100%
2005(N = 60)
2006(N = 61)
2007(N = 63)
2008(N = 60)
2009(N = 56)
2010(N = 59)
2011(N = 65)
2012(N = 70)
2013(N = 66)
2014(N = 60)
No High School Rank*
71%
83%
63%
71%
52%
76% 76%
55%
71%78%
0%
10%
20%
30%
40%
50%
60%
70%
80%
90%
100%
2005(N = 45)
2006(N = 40)
2007(N = 43)
2008(N = 45)
2009(N = 29)
2010(N = 25)
2011(N = 38)
2012(N = 33)
2013(N = 28)
2014(N = 32)
Middle 1/5
NOTE: The fourth and bottom 1/5 categories do not have enough students for a meaningful retention rate.
Source: Office of Institutional Research and Assessment, September 2015
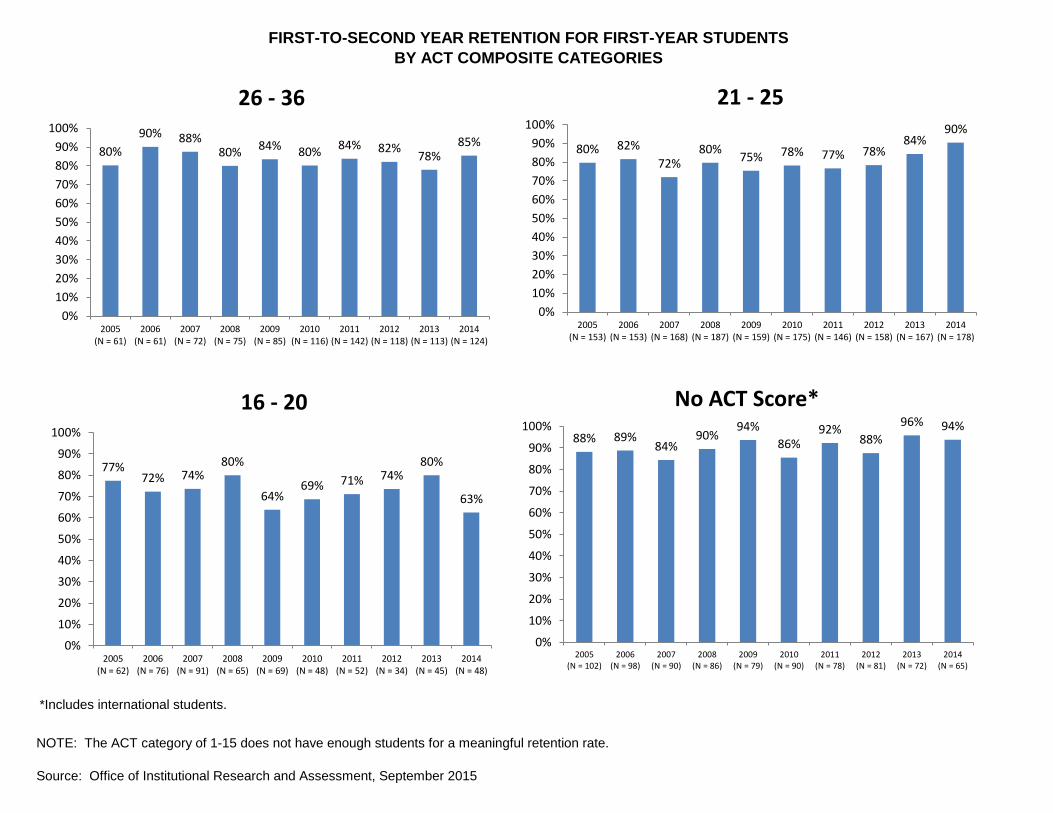
FIRST-TO-SECOND YEAR RETENTION FOR FIRST-YEAR STUDENTS
BY ACT COMPOSITE CATEGORIES
*Includes international students.
80% 82%
72%80%
75% 78% 77% 78%84%
90%
0%
10%
20%
30%
40%
50%
60%
70%
80%
90%
100%
2005(N = 153)
2006(N = 153)
2007(N = 168)
2008(N = 187)
2009(N = 159)
2010(N = 175)
2011(N = 146)
2012(N = 158)
2013(N = 167)
2014(N = 178)
21 - 25
80%
90% 88%80%
84% 80%84% 82%
78%85%
0%
10%
20%
30%
40%
50%
60%
70%
80%
90%
100%
2005(N = 61)
2006(N = 61)
2007(N = 72)
2008(N = 75)
2009(N = 85)
2010(N = 116)
2011(N = 142)
2012(N = 118)
2013(N = 113)
2014(N = 124)
26 - 36
88% 89%84%
90%94%
86%92%
88%
96% 94%
0%
10%
20%
30%
40%
50%
60%
70%
80%
90%
100%
2005(N = 102)
2006(N = 98)
2007(N = 90)
2008(N = 86)
2009(N = 79)
2010(N = 90)
2011(N = 78)
2012(N = 81)
2013(N = 72)
2014(N = 65)
No ACT Score*
77%72% 74%
80%
64%69% 71% 74%
80%
63%
0%
10%
20%
30%
40%
50%
60%
70%
80%
90%
100%
2005(N = 62)
2006(N = 76)
2007(N = 91)
2008(N = 65)
2009(N = 69)
2010(N = 48)
2011(N = 52)
2012(N = 34)
2013(N = 45)
2014(N = 48)
16 - 20
NOTE: The ACT category of 1-15 does not have enough students for a meaningful retention rate.
Source: Office of Institutional Research and Assessment, September 2015
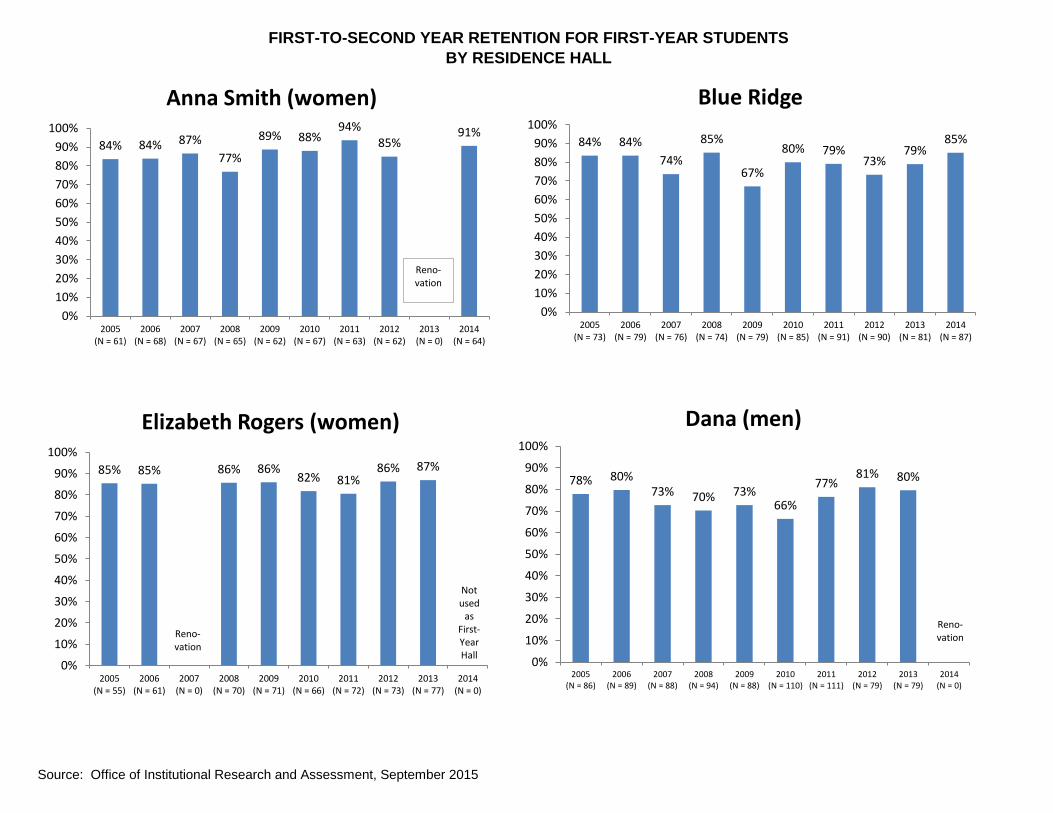
FIRST-TO-SECOND YEAR RETENTION FOR FIRST-YEAR STUDENTS
BY RESIDENCE HALL
84% 84%
74%
85%
67%
80% 79%73%
79%85%
0%
10%
20%
30%
40%
50%
60%
70%
80%
90%
100%
2005(N = 73)
2006(N = 79)
2007(N = 76)
2008(N = 74)
2009(N = 79)
2010(N = 85)
2011(N = 91)
2012(N = 90)
2013(N = 81)
2014(N = 87)
Blue Ridge
84% 84% 87%
77%
89% 88%94%
85%91%
0%
10%
20%
30%
40%
50%
60%
70%
80%
90%
100%
2005(N = 61)
2006(N = 68)
2007(N = 67)
2008(N = 65)
2009(N = 62)
2010(N = 67)
2011(N = 63)
2012(N = 62)
2013(N = 0)
2014(N = 64)
Anna Smith (women)
78% 80%73% 70% 73%
66%
77%81% 80%
0%
10%
20%
30%
40%
50%
60%
70%
80%
90%
100%
2005(N = 86)
2006(N = 89)
2007(N = 88)
2008(N = 94)
2009(N = 88)
2010(N = 110)
2011(N = 111)
2012(N = 79)
2013(N = 79)
2014(N = 0)
Dana (men)
Reno-vation
85% 85% 86% 86%82% 81%
86% 87%
0%
10%
20%
30%
40%
50%
60%
70%
80%
90%
100%
2005(N = 55)
2006(N = 61)
2007(N = 0)
2008(N = 70)
2009(N = 71)
2010(N = 66)
2011(N = 72)
2012(N = 73)
2013(N = 77)
2014(N = 0)
Elizabeth Rogers (women)
Reno-vation
Not used
as First-Year Hall
Reno-vation
Source: Office of Institutional Research and Assessment, September 2015
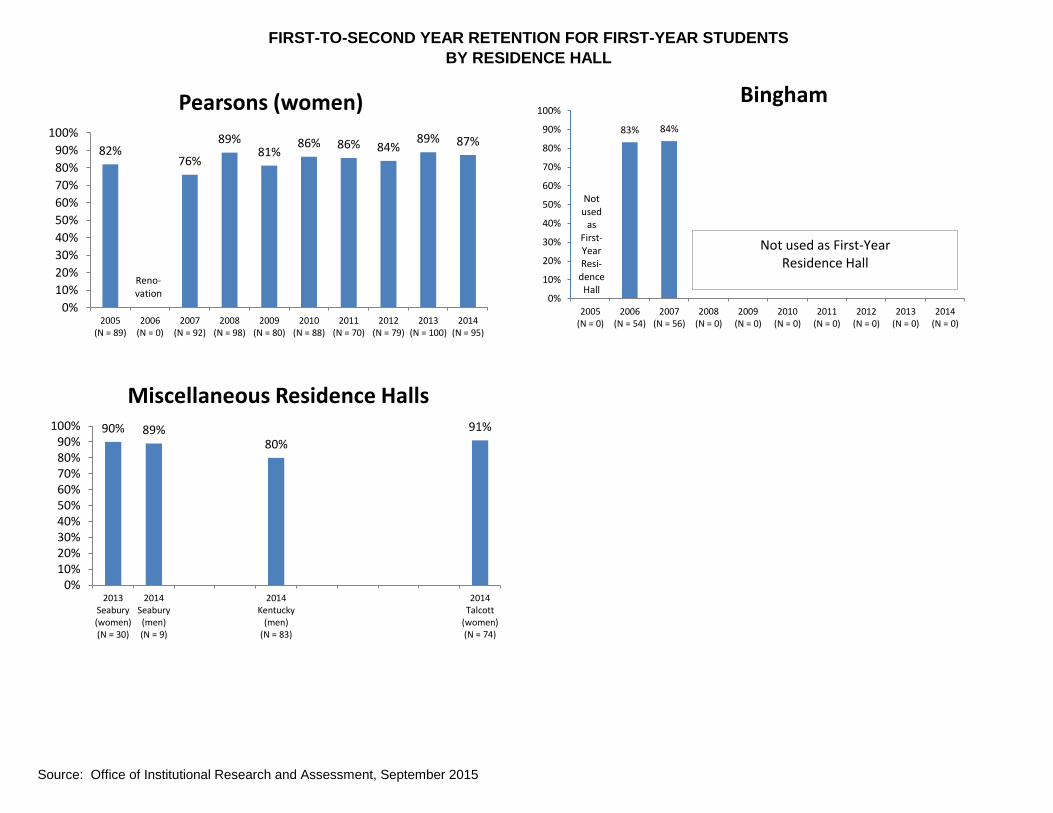
FIRST-TO-SECOND YEAR RETENTION FOR FIRST-YEAR STUDENTS
BY RESIDENCE HALL
83% 84%
0%
10%
20%
30%
40%
50%
60%
70%
80%
90%
100%
2005(N = 0)
2006(N = 54)
2007(N = 56)
2008(N = 0)
2009(N = 0)
2010(N = 0)
2011(N = 0)
2012(N = 0)
2013(N = 0)
2014(N = 0)
Bingham
Not used as First-Year Residence Hall
Notused
as First-Year Resi-
dence Hall
82%76%
89%81%
86% 86% 84%89% 87%
0%
10%
20%
30%
40%
50%
60%
70%
80%
90%
100%
2005(N = 89)
2006(N = 0)
2007(N = 92)
2008(N = 98)
2009(N = 80)
2010(N = 88)
2011(N = 70)
2012(N = 79)
2013(N = 100)
2014(N = 95)
Pearsons (women)
Reno-vation
90% 89%80%
91%
0%10%20%30%40%50%60%70%80%90%
100%
2013Seabury(women)(N = 30)
2014Seabury(men)(N = 9)
2014Kentucky
(men)(N = 83)
2014Talcott
(women)(N = 74)
Miscellaneous Residence Halls
Source: Office of Institutional Research and Assessment, September 2015
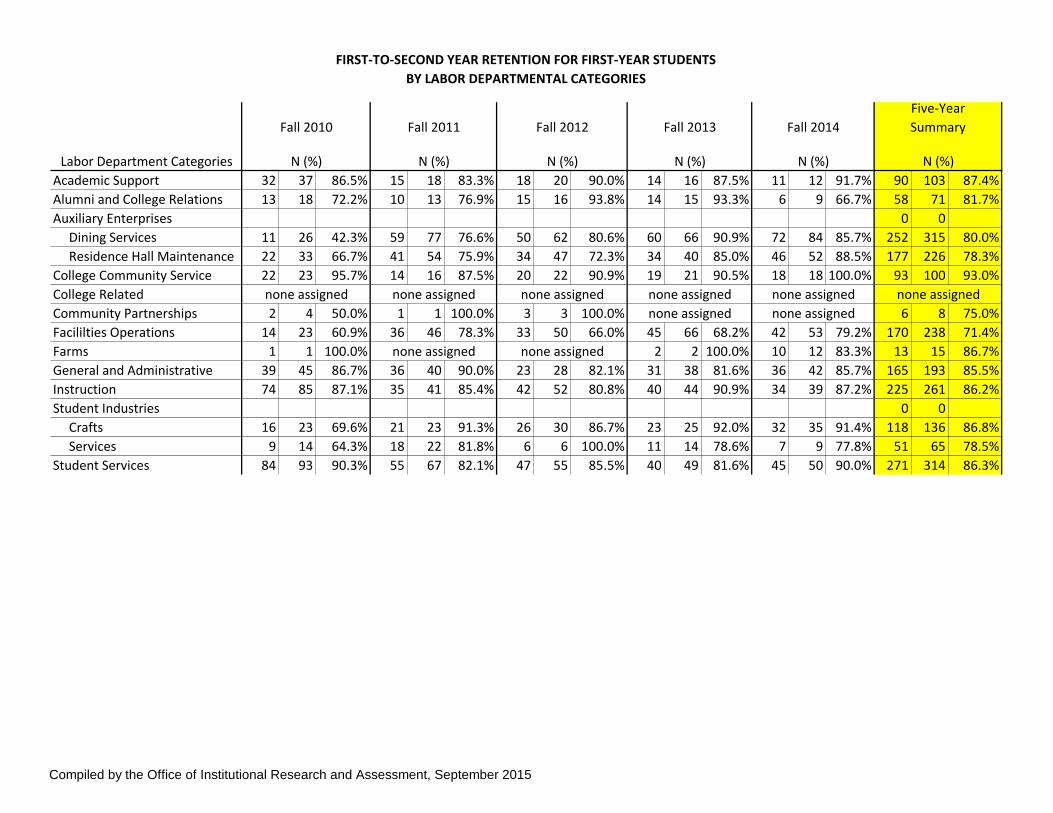
Labor Department Categories
Academic Support 32 37 86.5% 15 18 83.3% 18 20 90.0% 14 16 87.5% 11 12 91.7% 90 103 87.4%
Alumni and College Relations 13 18 72.2% 10 13 76.9% 15 16 93.8% 14 15 93.3% 6 9 66.7% 58 71 81.7%
Auxiliary Enterprises 0 0
Dining Services 11 26 42.3% 59 77 76.6% 50 62 80.6% 60 66 90.9% 72 84 85.7% 252 315 80.0%
Residence Hall Maintenance 22 33 66.7% 41 54 75.9% 34 47 72.3% 34 40 85.0% 46 52 88.5% 177 226 78.3%
College Community Service 22 23 95.7% 14 16 87.5% 20 22 90.9% 19 21 90.5% 18 18 100.0% 93 100 93.0%
College Related
Community Partnerships 2 4 50.0% 1 1 100.0% 3 3 100.0% 6 8 75.0%
Facililties Operations 14 23 60.9% 36 46 78.3% 33 50 66.0% 45 66 68.2% 42 53 79.2% 170 238 71.4%
Farms 1 1 100.0% 2 2 100.0% 10 12 83.3% 13 15 86.7%
General and Administrative 39 45 86.7% 36 40 90.0% 23 28 82.1% 31 38 81.6% 36 42 85.7% 165 193 85.5%
Instruction 74 85 87.1% 35 41 85.4% 42 52 80.8% 40 44 90.9% 34 39 87.2% 225 261 86.2%
Student Industries 0 0
Crafts 16 23 69.6% 21 23 91.3% 26 30 86.7% 23 25 92.0% 32 35 91.4% 118 136 86.8%
Services 9 14 64.3% 18 22 81.8% 6 6 100.0% 11 14 78.6% 7 9 77.8% 51 65 78.5%
Student Services 84 93 90.3% 55 67 82.1% 47 55 85.5% 40 49 81.6% 45 50 90.0% 271 314 86.3%
none assigned
none assigned
Fall 2014
N (%) N (%) N (%)
none assigned
none assigned none assigned none assignednone assigned
none assigned
none assigned
none assigned
Five-Year
Summary
N (%)
FIRST-TO-SECOND YEAR RETENTION FOR FIRST-YEAR STUDENTS
BY LABOR DEPARTMENTAL CATEGORIES
N (%)
Fall 2011 Fall 2012 Fall 2013Fall 2010
N (%)
Compiled by the Office of Institutional Research and Assessment, September 2015
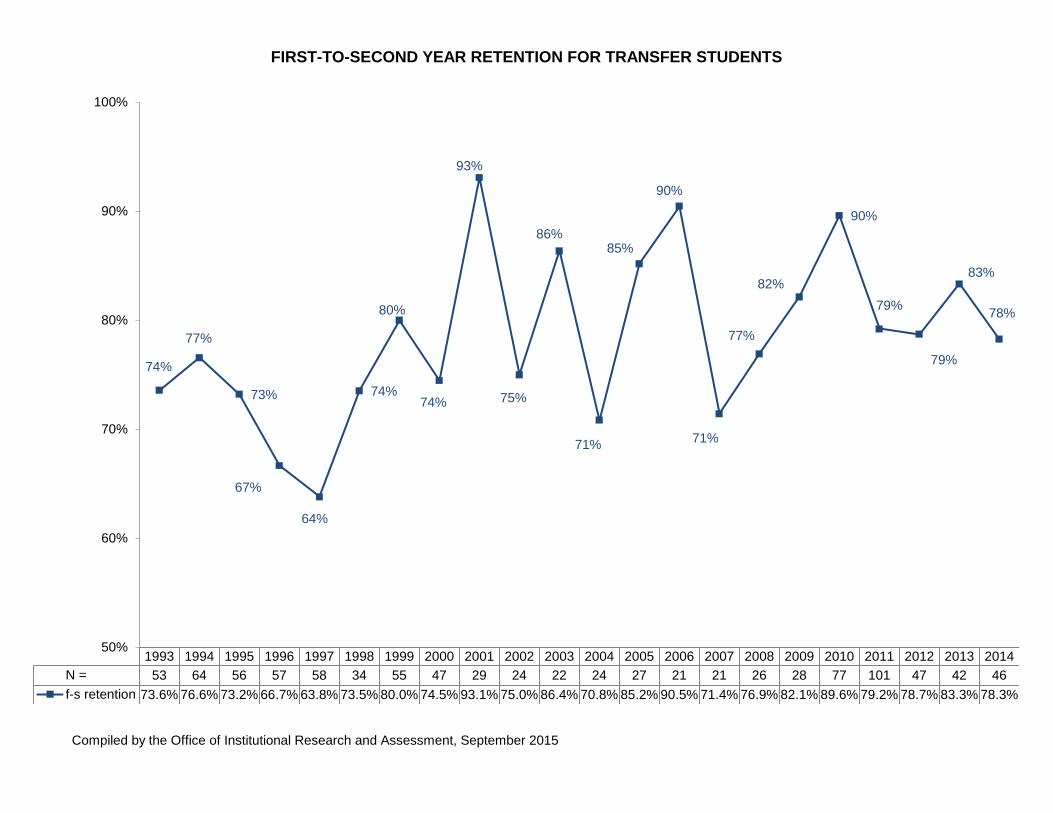
FIRST-TO-SECOND YEAR RETENTION FOR TRANSFER STUDENTS
Compiled by the Office of Institutional Research and Assessment, September 2015
1993 1994 1995 1996 1997 1998 1999 2000 2001 2002 2003 2004 2005 2006 2007 2008 2009 2010 2011 2012 2013 2014
N = 53 64 56 57 58 34 55 47 29 24 22 24 27 21 21 26 28 77 101 47 42 46
f-s retention 73.6% 76.6% 73.2% 66.7% 63.8% 73.5% 80.0% 74.5% 93.1% 75.0% 86.4% 70.8% 85.2% 90.5% 71.4% 76.9% 82.1% 89.6% 79.2% 78.7% 83.3% 78.3%
74%
77%
73%
67%
64%
74%
80%
74%
93%
75%
86%
71%
85%
90%
71%
77%
82%
90%
79%
79%
83%
78%
50%
60%
70%
80%
90%
100%
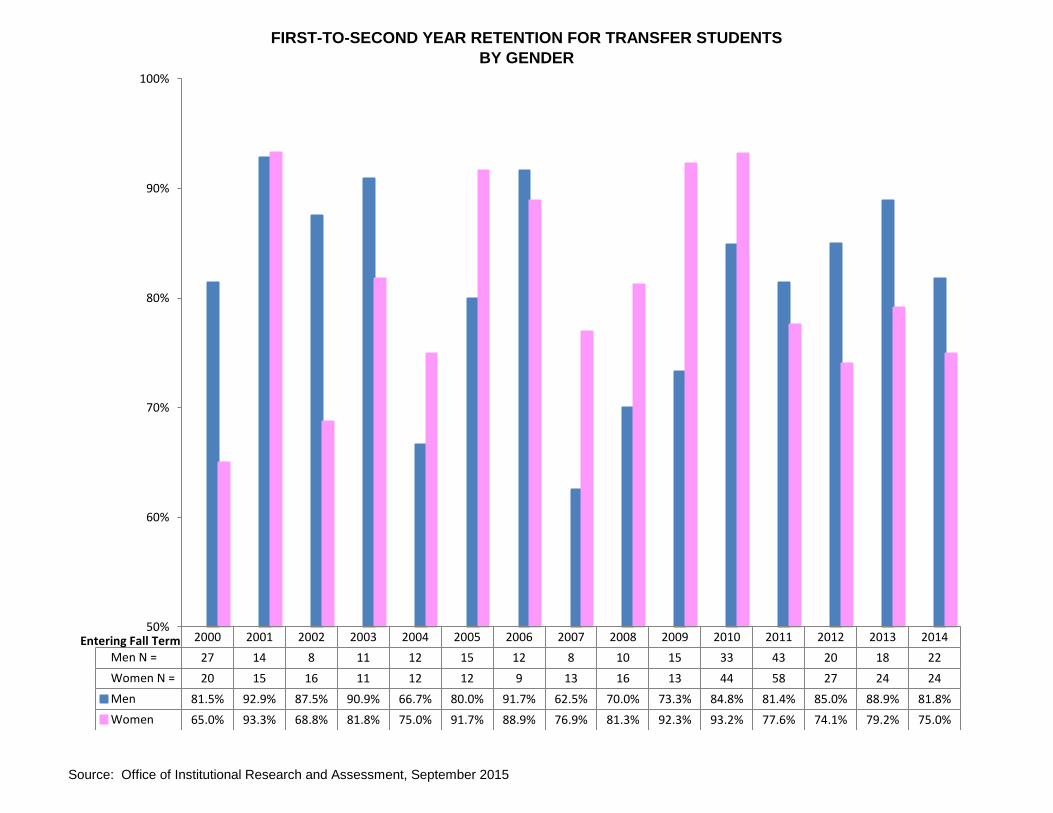
FIRST-TO-SECOND YEAR RETENTION FOR TRANSFER STUDENTS
BY GENDER
Source: Office of Institutional Research and Assessment, September 2015
2000 2001 2002 2003 2004 2005 2006 2007 2008 2009 2010 2011 2012 2013 2014
Men N = 27 14 8 11 12 15 12 8 10 15 33 43 20 18 22
Women N = 20 15 16 11 12 12 9 13 16 13 44 58 27 24 24
Men 81.5% 92.9% 87.5% 90.9% 66.7% 80.0% 91.7% 62.5% 70.0% 73.3% 84.8% 81.4% 85.0% 88.9% 81.8%
Women 65.0% 93.3% 68.8% 81.8% 75.0% 91.7% 88.9% 76.9% 81.3% 92.3% 93.2% 77.6% 74.1% 79.2% 75.0%
50%
60%
70%
80%
90%
100%
Entering Fall Term
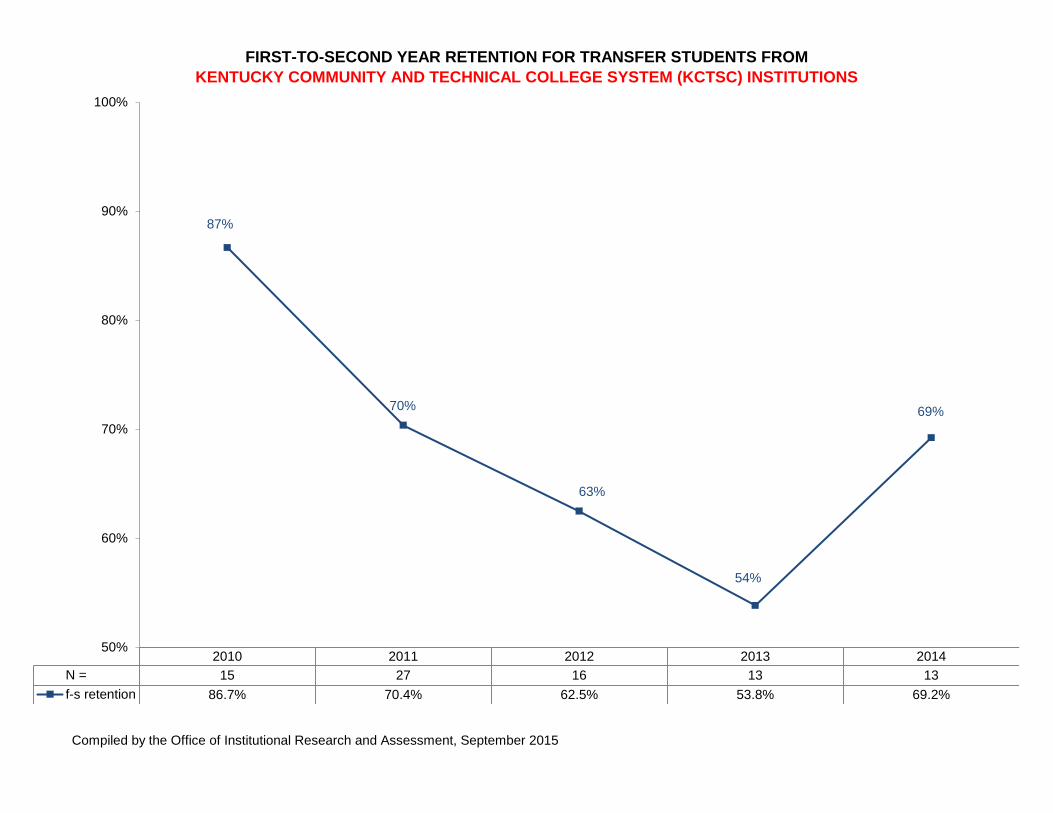
FIRST-TO-SECOND YEAR RETENTION FOR TRANSFER STUDENTS FROM
KENTUCKY COMMUNITY AND TECHNICAL COLLEGE SYSTEM (KCTSC) INSTITUTIONS
Compiled by the Office of Institutional Research and Assessment, September 2015
2010 2011 2012 2013 2014
N = 15 27 16 13 13
f-s retention 86.7% 70.4% 62.5% 53.8% 69.2%
87%
70%
63%
54%
69%
50%
60%
70%
80%
90%
100%
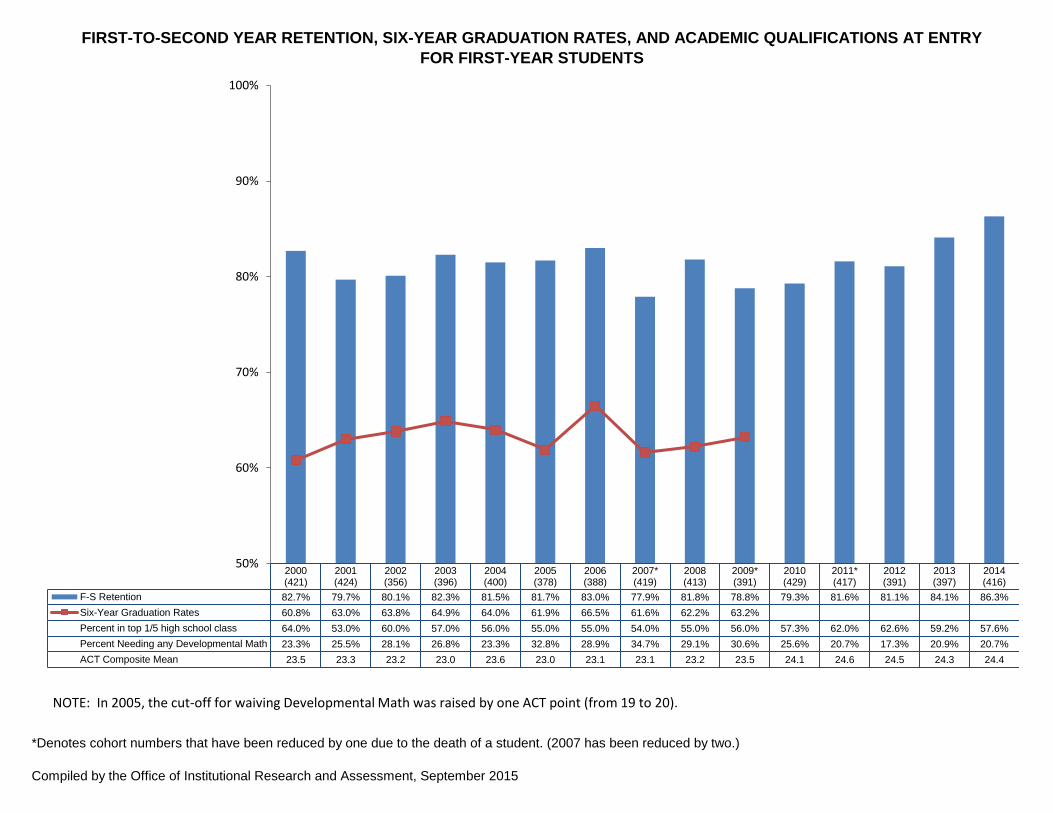
FIRST-TO-SECOND YEAR RETENTION, SIX-YEAR GRADUATION RATES, AND ACADEMIC QUALIFICATIONS AT ENTRY
FOR FIRST-YEAR STUDENTS
*Denotes cohort numbers that have been reduced by one due to the death of a student. (2007 has been reduced by two.)
Compiled by the Office of Institutional Research and Assessment, September 2015
2000(421)
2001(424)
2002(356)
2003(396)
2004(400)
2005(378)
2006(388)
2007*(419)
2008(413)
2009*(391)
2010(429)
2011*(417)
2012(391)
2013(397)
2014(416)
F-S Retention 82.7% 79.7% 80.1% 82.3% 81.5% 81.7% 83.0% 77.9% 81.8% 78.8% 79.3% 81.6% 81.1% 84.1% 86.3%
Six-Year Graduation Rates 60.8% 63.0% 63.8% 64.9% 64.0% 61.9% 66.5% 61.6% 62.2% 63.2%
Percent in top 1/5 high school class 64.0% 53.0% 60.0% 57.0% 56.0% 55.0% 55.0% 54.0% 55.0% 56.0% 57.3% 62.0% 62.6% 59.2% 57.6%
Percent Needing any Developmental Math 23.3% 25.5% 28.1% 26.8% 23.3% 32.8% 28.9% 34.7% 29.1% 30.6% 25.6% 20.7% 17.3% 20.9% 20.7%
ACT Composite Mean 23.5 23.3 23.2 23.0 23.6 23.0 23.1 23.1 23.2 23.5 24.1 24.6 24.5 24.3 24.4
50%
60%
70%
80%
90%
100%
NOTE: In 2005, the cut-off for waiving Developmental Math was raised by one ACT point (from 19 to 20).
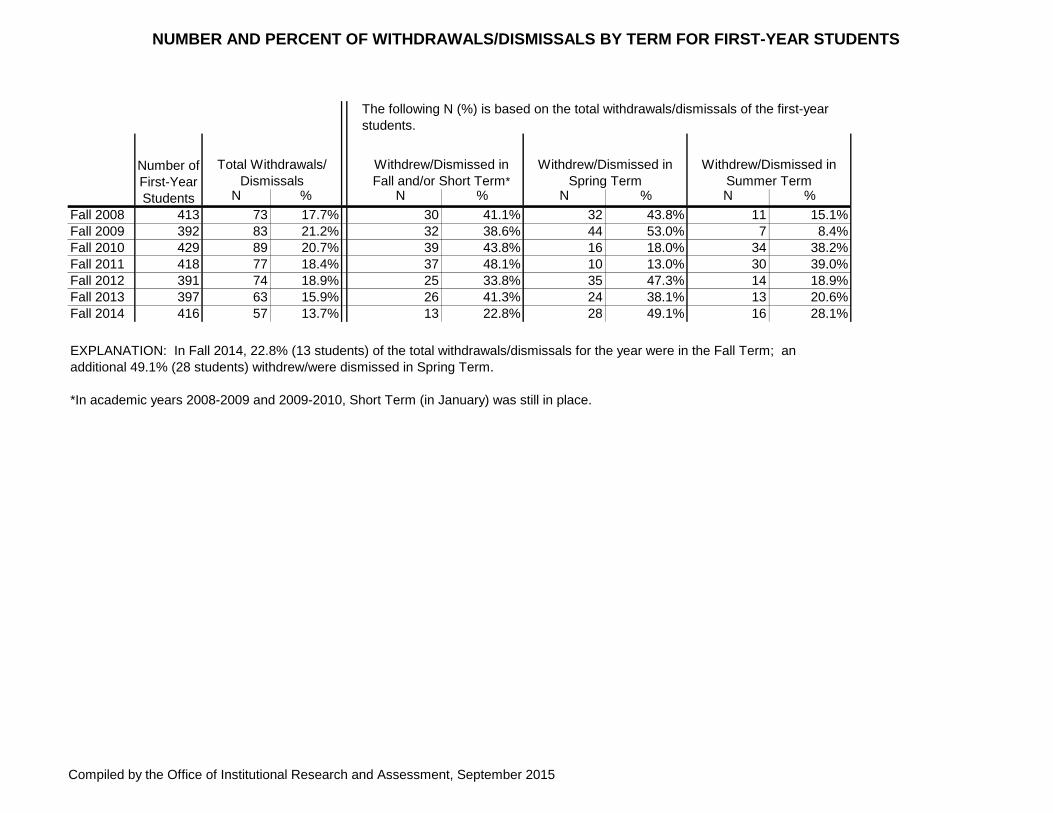
NUMBER AND PERCENT OF WITHDRAWALS/DISMISSALS BY TERM FOR FIRST-YEAR STUDENTS
N % N % N % N %
Fall 2008 413 73 17.7% 30 41.1% 32 43.8% 11 15.1%
Fall 2009 392 83 21.2% 32 38.6% 44 53.0% 7 8.4%
Fall 2010 429 89 20.7% 39 43.8% 16 18.0% 34 38.2%
Fall 2011 418 77 18.4% 37 48.1% 10 13.0% 30 39.0%
Fall 2012 391 74 18.9% 25 33.8% 35 47.3% 14 18.9%
Fall 2013 397 63 15.9% 26 41.3% 24 38.1% 13 20.6%
Fall 2014 416 57 13.7% 13 22.8% 28 49.1% 16 28.1%
*In academic years 2008-2009 and 2009-2010, Short Term (in January) was still in place.
The following N (%) is based on the total withdrawals/dismissals of the first-year
students.
EXPLANATION: In Fall 2014, 22.8% (13 students) of the total withdrawals/dismissals for the year were in the Fall Term; an
additional 49.1% (28 students) withdrew/were dismissed in Spring Term.
Withdrew/Dismissed in
Fall and/or Short Term*
Number of
First-Year
Students
Withdrew/Dismissed in
Summer Term
Withdrew/Dismissed in
Spring Term
Total Withdrawals/
Dismissals
Compiled by the Office of Institutional Research and Assessment, September 2015
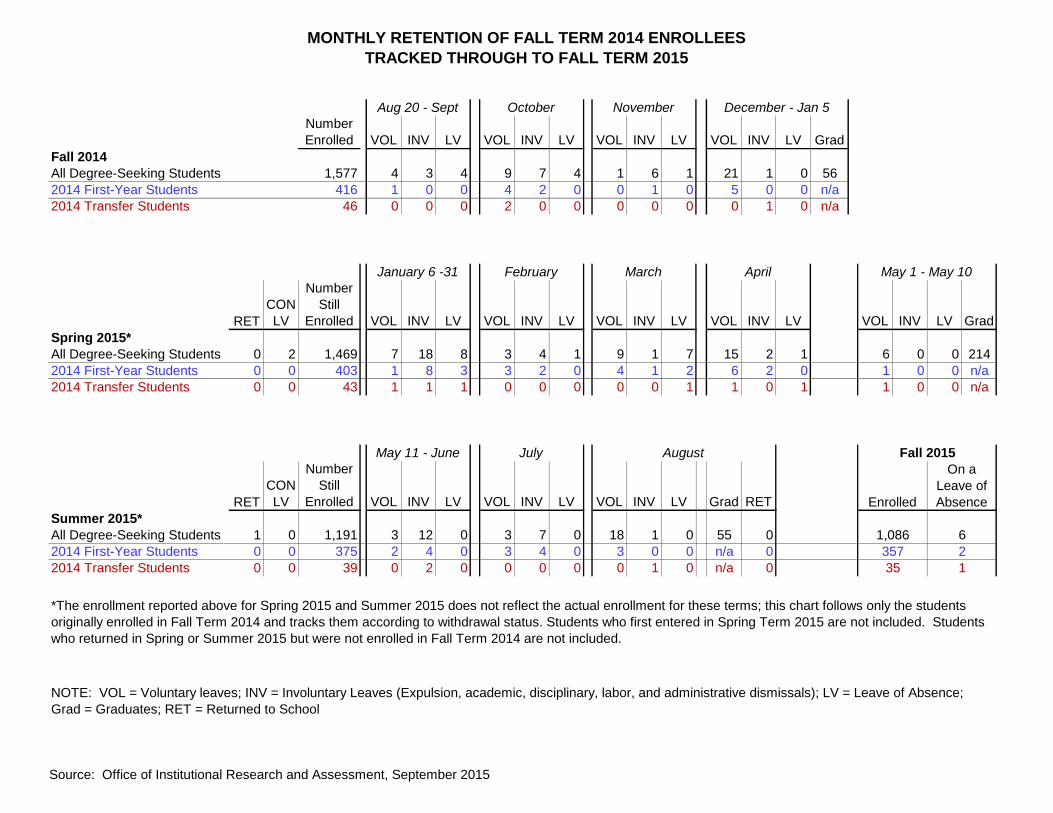
MONTHLY RETENTION OF FALL TERM 2014 ENROLLEES
TRACKED THROUGH TO FALL TERM 2015
Number
Enrolled VOL INV LV VOL INV LV VOL INV LV VOL INV LV Grad
Fall 2014
All Degree-Seeking Students 1,577 4 3 4 9 7 4 1 6 1 21 1 0 56
2014 First-Year Students 416 1 0 0 4 2 0 0 1 0 5 0 0 n/a
2014 Transfer Students 46 0 0 0 2 0 0 0 0 0 0 1 0 n/a
RET
CON
LV
Number
Still
Enrolled VOL INV LV VOL INV LV VOL INV LV VOL INV LV VOL INV LV Grad
Spring 2015*
All Degree-Seeking Students 0 2 1,469 7 18 8 3 4 1 9 1 7 15 2 1 6 0 0 214
2014 First-Year Students 0 0 403 1 8 3 3 2 0 4 1 2 6 2 0 1 0 0 n/a
2014 Transfer Students 0 0 43 1 1 1 0 0 0 0 0 1 1 0 1 1 0 0 n/a
RET
CON
LV
Number
Still
Enrolled VOL INV LV VOL INV LV VOL INV LV Grad RET
Summer 2015*
All Degree-Seeking Students 1 0 1,191 3 12 0 3 7 0 18 1 0 55 0
2014 First-Year Students 0 0 375 2 4 0 3 4 0 3 0 0 n/a 0
2014 Transfer Students 0 0 39 0 2 0 0 0 0 0 1 0 n/a 0
Aug 20 - Sept October November December - Jan 5
January 6 -31 February March May 1 - May 10
35 1
May 11 - June July Fall 2015August
April
*The enrollment reported above for Spring 2015 and Summer 2015 does not reflect the actual enrollment for these terms; this chart follows only the students
originally enrolled in Fall Term 2014 and tracks them according to withdrawal status. Students who first entered in Spring Term 2015 are not included. Students
who returned in Spring or Summer 2015 but were not enrolled in Fall Term 2014 are not included.
NOTE: VOL = Voluntary leaves; INV = Involuntary Leaves (Expulsion, academic, disciplinary, labor, and administrative dismissals); LV = Leave of Absence;
Grad = Graduates; RET = Returned to School
Enrolled
On a
Leave of
Absence
357 2
1,086 6
Source: Office of Institutional Research and Assessment, September 2015
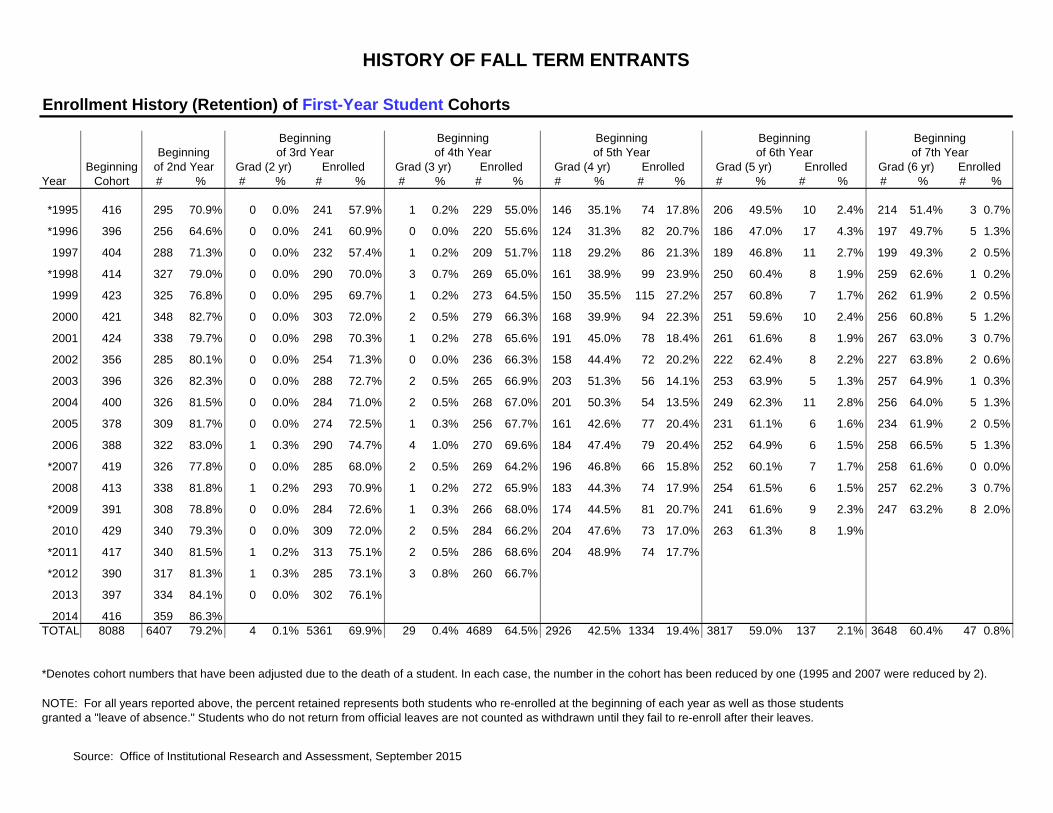
HISTORY OF FALL TERM ENTRANTS
Enrollment History (Retention) of First-Year Student Cohorts
Beginning
Year Cohort # % # % # % # % # % # % # % # % # % # % # %
*1995 416 295 70.9% 0 0.0% 241 57.9% 1 0.2% 229 55.0% 146 35.1% 74 17.8% 206 49.5% 10 2.4% 214 51.4% 3 0.7%
*1996 396 256 64.6% 0 0.0% 241 60.9% 0 0.0% 220 55.6% 124 31.3% 82 20.7% 186 47.0% 17 4.3% 197 49.7% 5 1.3%
1997 404 288 71.3% 0 0.0% 232 57.4% 1 0.2% 209 51.7% 118 29.2% 86 21.3% 189 46.8% 11 2.7% 199 49.3% 2 0.5%
*1998 414 327 79.0% 0 0.0% 290 70.0% 3 0.7% 269 65.0% 161 38.9% 99 23.9% 250 60.4% 8 1.9% 259 62.6% 1 0.2%
1999 423 325 76.8% 0 0.0% 295 69.7% 1 0.2% 273 64.5% 150 35.5% 115 27.2% 257 60.8% 7 1.7% 262 61.9% 2 0.5%
2000 421 348 82.7% 0 0.0% 303 72.0% 2 0.5% 279 66.3% 168 39.9% 94 22.3% 251 59.6% 10 2.4% 256 60.8% 5 1.2%
2001 424 338 79.7% 0 0.0% 298 70.3% 1 0.2% 278 65.6% 191 45.0% 78 18.4% 261 61.6% 8 1.9% 267 63.0% 3 0.7%
2002 356 285 80.1% 0 0.0% 254 71.3% 0 0.0% 236 66.3% 158 44.4% 72 20.2% 222 62.4% 8 2.2% 227 63.8% 2 0.6%
2003 396 326 82.3% 0 0.0% 288 72.7% 2 0.5% 265 66.9% 203 51.3% 56 14.1% 253 63.9% 5 1.3% 257 64.9% 1 0.3%
2004 400 326 81.5% 0 0.0% 284 71.0% 2 0.5% 268 67.0% 201 50.3% 54 13.5% 249 62.3% 11 2.8% 256 64.0% 5 1.3%
2005 378 309 81.7% 0 0.0% 274 72.5% 1 0.3% 256 67.7% 161 42.6% 77 20.4% 231 61.1% 6 1.6% 234 61.9% 2 0.5%
2006 388 322 83.0% 1 0.3% 290 74.7% 4 1.0% 270 69.6% 184 47.4% 79 20.4% 252 64.9% 6 1.5% 258 66.5% 5 1.3%
*2007 419 326 77.8% 0 0.0% 285 68.0% 2 0.5% 269 64.2% 196 46.8% 66 15.8% 252 60.1% 7 1.7% 258 61.6% 0 0.0%
2008 413 338 81.8% 1 0.2% 293 70.9% 1 0.2% 272 65.9% 183 44.3% 74 17.9% 254 61.5% 6 1.5% 257 62.2% 3 0.7%
*2009 391 308 78.8% 0 0.0% 284 72.6% 1 0.3% 266 68.0% 174 44.5% 81 20.7% 241 61.6% 9 2.3% 247 63.2% 8 2.0%
2010 429 340 79.3% 0 0.0% 309 72.0% 2 0.5% 284 66.2% 204 47.6% 73 17.0% 263 61.3% 8 1.9%
*2011 417 340 81.5% 1 0.2% 313 75.1% 2 0.5% 286 68.6% 204 48.9% 74 17.7%
*2012 390 317 81.3% 1 0.3% 285 73.1% 3 0.8% 260 66.7%
2013 397 334 84.1% 0 0.0% 302 76.1%
2014 416 359 86.3%
TOTAL 8088 6407 79.2% 4 0.1% 5361 69.9% 29 0.4% 4689 64.5% 2926 42.5% 1334 19.4% 3817 59.0% 137 2.1% 3648 60.4% 47 0.8%
*Denotes cohort numbers that have been adjusted due to the death of a student. In each case, the number in the cohort has been reduced by one (1995 and 2007 were reduced by 2).
Beginning
NOTE: For all years reported above, the percent retained represents both students who re-enrolled at the beginning of each year as well as those students
granted a "leave of absence." Students who do not return from official leaves are not counted as withdrawn until they fail to re-enroll after their leaves.
Grad (6 yr) Enrolledof 2nd Year Grad (2 yr) Enrolled Grad (3 yr) Enrolled Grad (4 yr) Enrolled Grad (5 yr) Enrolled
Beginning of 3rd Year of 4th Year of 5th Year of 6th Year of 7th Year
Beginning Beginning Beginning Beginning
Source: Office of Institutional Research and Assessment, September 2015
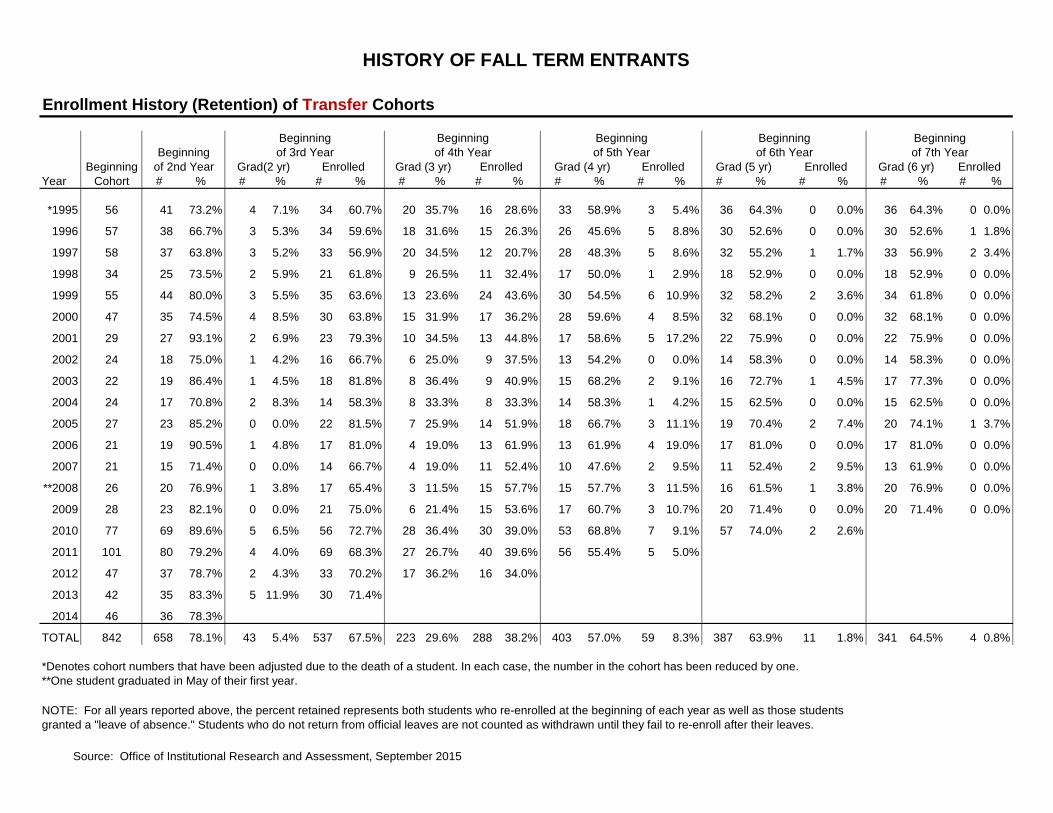
HISTORY OF FALL TERM ENTRANTS
Enrollment History (Retention) of Transfer Cohorts
Beginning
Year Cohort # % # % # % # % # % # % # % # % # % # % # %
*1995 56 41 73.2% 4 7.1% 34 60.7% 20 35.7% 16 28.6% 33 58.9% 3 5.4% 36 64.3% 0 0.0% 36 64.3% 0 0.0%
1996 57 38 66.7% 3 5.3% 34 59.6% 18 31.6% 15 26.3% 26 45.6% 5 8.8% 30 52.6% 0 0.0% 30 52.6% 1 1.8%
1997 58 37 63.8% 3 5.2% 33 56.9% 20 34.5% 12 20.7% 28 48.3% 5 8.6% 32 55.2% 1 1.7% 33 56.9% 2 3.4%
1998 34 25 73.5% 2 5.9% 21 61.8% 9 26.5% 11 32.4% 17 50.0% 1 2.9% 18 52.9% 0 0.0% 18 52.9% 0 0.0%
1999 55 44 80.0% 3 5.5% 35 63.6% 13 23.6% 24 43.6% 30 54.5% 6 10.9% 32 58.2% 2 3.6% 34 61.8% 0 0.0%
2000 47 35 74.5% 4 8.5% 30 63.8% 15 31.9% 17 36.2% 28 59.6% 4 8.5% 32 68.1% 0 0.0% 32 68.1% 0 0.0%
2001 29 27 93.1% 2 6.9% 23 79.3% 10 34.5% 13 44.8% 17 58.6% 5 17.2% 22 75.9% 0 0.0% 22 75.9% 0 0.0%
2002 24 18 75.0% 1 4.2% 16 66.7% 6 25.0% 9 37.5% 13 54.2% 0 0.0% 14 58.3% 0 0.0% 14 58.3% 0 0.0%
2003 22 19 86.4% 1 4.5% 18 81.8% 8 36.4% 9 40.9% 15 68.2% 2 9.1% 16 72.7% 1 4.5% 17 77.3% 0 0.0%
2004 24 17 70.8% 2 8.3% 14 58.3% 8 33.3% 8 33.3% 14 58.3% 1 4.2% 15 62.5% 0 0.0% 15 62.5% 0 0.0%
2005 27 23 85.2% 0 0.0% 22 81.5% 7 25.9% 14 51.9% 18 66.7% 3 11.1% 19 70.4% 2 7.4% 20 74.1% 1 3.7%
2006 21 19 90.5% 1 4.8% 17 81.0% 4 19.0% 13 61.9% 13 61.9% 4 19.0% 17 81.0% 0 0.0% 17 81.0% 0 0.0%
2007 21 15 71.4% 0 0.0% 14 66.7% 4 19.0% 11 52.4% 10 47.6% 2 9.5% 11 52.4% 2 9.5% 13 61.9% 0 0.0%
**2008 26 20 76.9% 1 3.8% 17 65.4% 3 11.5% 15 57.7% 15 57.7% 3 11.5% 16 61.5% 1 3.8% 20 76.9% 0 0.0%
2009 28 23 82.1% 0 0.0% 21 75.0% 6 21.4% 15 53.6% 17 60.7% 3 10.7% 20 71.4% 0 0.0% 20 71.4% 0 0.0%
2010 77 69 89.6% 5 6.5% 56 72.7% 28 36.4% 30 39.0% 53 68.8% 7 9.1% 57 74.0% 2 2.6%
2011 101 80 79.2% 4 4.0% 69 68.3% 27 26.7% 40 39.6% 56 55.4% 5 5.0%
2012 47 37 78.7% 2 4.3% 33 70.2% 17 36.2% 16 34.0%
2013 42 35 83.3% 5 11.9% 30 71.4%
2014 46 36 78.3%
TOTAL 842 658 78.1% 43 5.4% 537 67.5% 223 29.6% 288 38.2% 403 57.0% 59 8.3% 387 63.9% 11 1.8% 341 64.5% 4 0.8%
*Denotes cohort numbers that have been adjusted due to the death of a student. In each case, the number in the cohort has been reduced by one.
**One student graduated in May of their first year.
of 7th Year
NOTE: For all years reported above, the percent retained represents both students who re-enrolled at the beginning of each year as well as those students
granted a "leave of absence." Students who do not return from official leaves are not counted as withdrawn until they fail to re-enroll after their leaves.
EnrolledGrad (6 yr)Grad (5 yr) Enrolledof 2nd Year Grad(2 yr) Enrolled Grad (3 yr) Enrolled Grad (4 yr) Enrolled
Beginning of 3rd Year of 4th Year of 5th Year of 6th Year
Beginning Beginning Beginning Beginning Beginning
Source: Office of Institutional Research and Assessment, September 2015

Graduation
Graduation Highlights
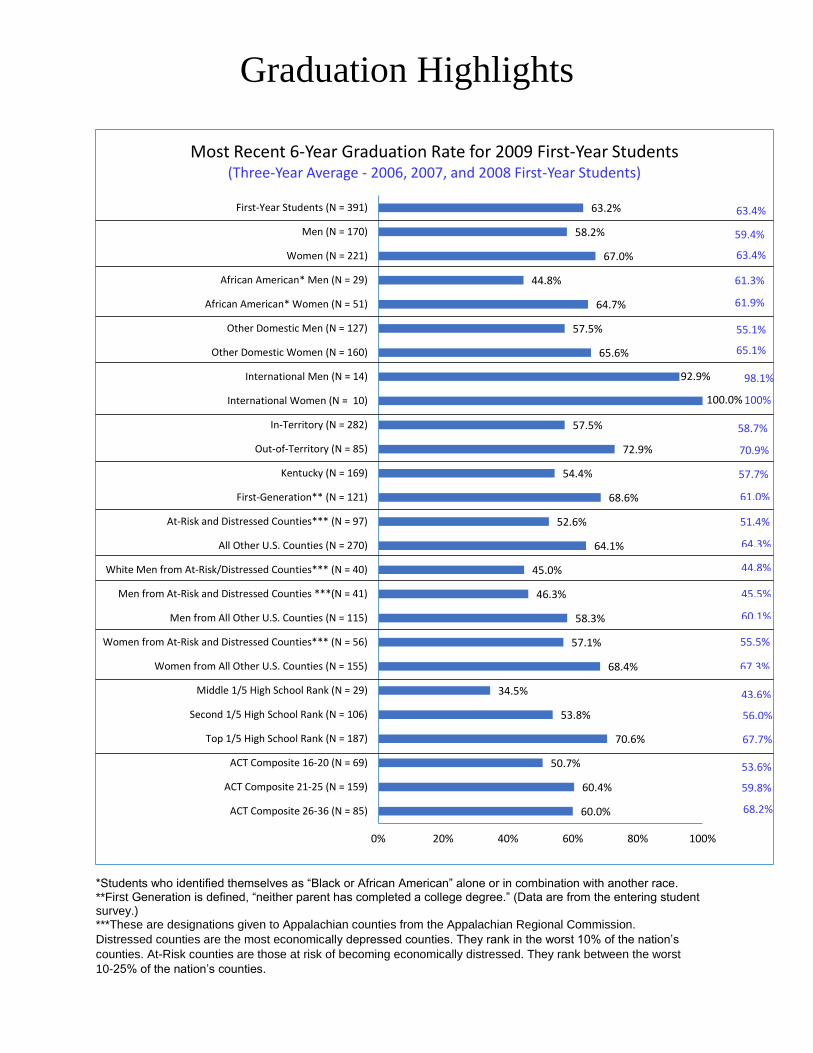
*Students who identified themselves as “Black or African American” alone or in combination with another race. **First Generation is defined, “neither parent has completed a college degree.” (Data are from the entering student survey.) ***These are designations given to Appalachian counties from the Appalachian Regional Commission.
Distressed counties are the most economically depressed counties. They rank in the worst 10% of the nation’s
counties. At-Risk counties are those at risk of becoming economically distressed. They rank between the worst
10-25% of the nation’s counties.
60.0%
60.4%
50.7%
70.6%
53.8%
34.5%
68.4%
57.1%
58.3%
46.3%
45.0%
64.1%
52.6%
68.6%
54.4%
72.9%
57.5%
100.0%
92.9%
65.6%
57.5%
64.7%
44.8%
67.0%
58.2%
63.2%
0% 20% 40% 60% 80% 100%
ACT Composite 26-36 (N = 85)
ACT Composite 21-25 (N = 159)
ACT Composite 16-20 (N = 69)
Top 1/5 High School Rank (N = 187)
Second 1/5 High School Rank (N = 106)
Middle 1/5 High School Rank (N = 29)
Women from All Other U.S. Counties (N = 155)
Women from At-Risk and Distressed Counties*** (N = 56)
Men from All Other U.S. Counties (N = 115)
Men from At-Risk and Distressed Counties ***(N = 41)
White Men from At-Risk/Distressed Counties*** (N = 40)
All Other U.S. Counties (N = 270)
At-Risk and Distressed Counties*** (N = 97)
First-Generation** (N = 121)
Kentucky (N = 169)
Out-of-Territory (N = 85)
In-Territory (N = 282)
International Women (N = 10)
International Men (N = 14)
Other Domestic Women (N = 160)
Other Domestic Men (N = 127)
African American* Women (N = 51)
African American* Men (N = 29)
Women (N = 221)
Men (N = 170)
First-Year Students (N = 391)
Most Recent 6-Year Graduation Rate for 2009 First-Year Students(Three-Year Average - 2006, 2007, and 2008 First-Year Students)
63.4%
59.4%
63.4%
61.3%
61.9%
55.1%
65.1%
98.1%
100%
58.7%
70.9%
57.7%
61.0%
51.4%
64.3%
44.8%
45.5%
60.1%
55.5%
67.3%
43.6%
56.0%
67.7%
53.6%
59.8%
68.2%
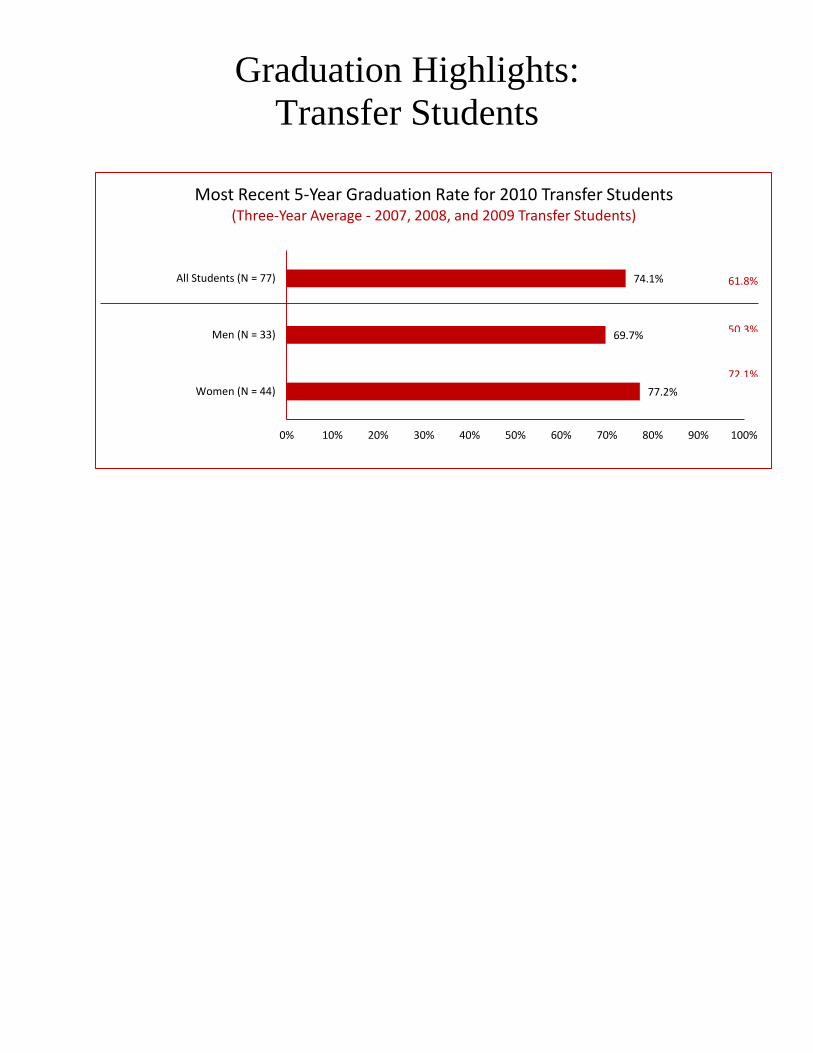
Graduation Highlights:
Transfer Students
77.2%
69.7%
74.1%
0% 10% 20% 30% 40% 50% 60% 70% 80% 90% 100%
Women (N = 44)
Men (N = 33)
All Students (N = 77)
Most Recent 5-Year Graduation Rate for 2010 Transfer Students(Three-Year Average - 2007, 2008, and 2009 Transfer Students)
61.8%
50.3%
72.1%
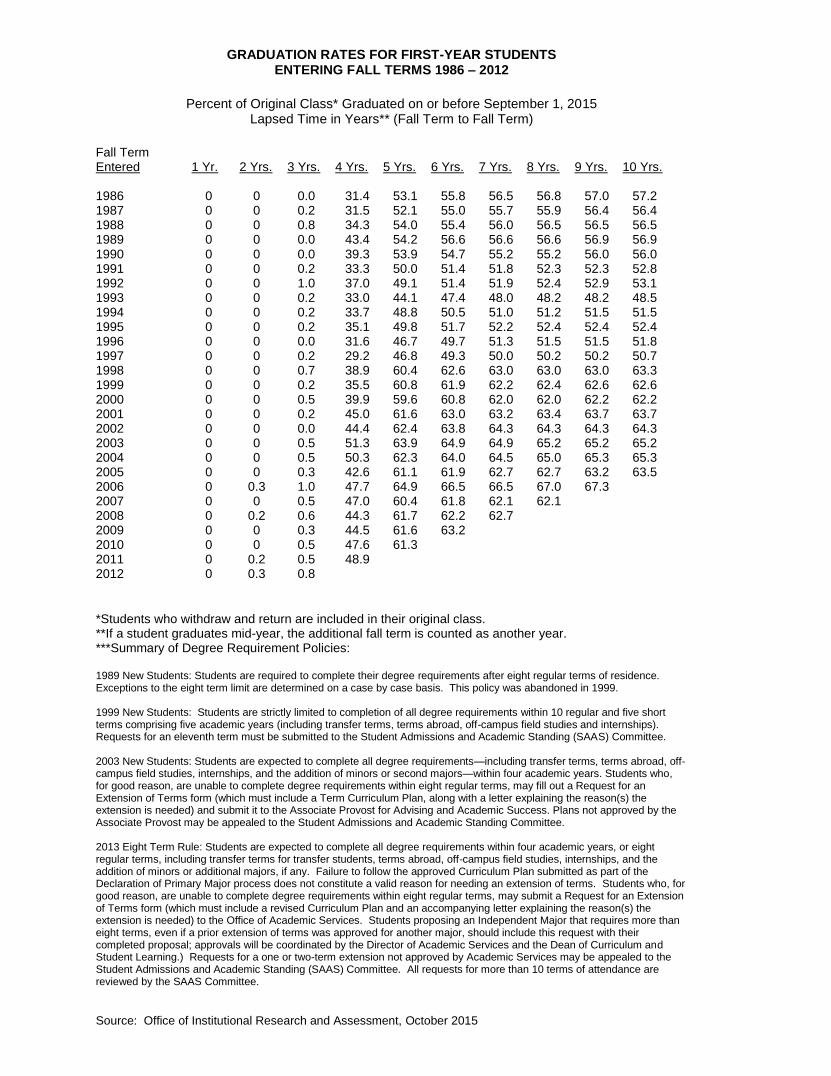
GRADUATION RATES FOR FIRST-YEAR STUDENTS ENTERING FALL TERMS 1986 – 2012
Percent of Original Class* Graduated on or before September 1, 2015
Lapsed Time in Years** (Fall Term to Fall Term)
Source: Office of Institutional Research and Assessment, October 2015
Fall Term Entered 1 Yr. 2 Yrs. 3 Yrs. 4 Yrs. 5 Yrs. 6 Yrs. 7 Yrs. 8 Yrs. 9 Yrs. 10 Yrs. 1986 0 0 0.0 31.4 53.1 55.8 56.5 56.8 57.0 57.2 1987 0 0 0.2 31.5 52.1 55.0 55.7 55.9 56.4 56.4 1988 0 0 0.8 34.3 54.0 55.4 56.0 56.5 56.5 56.5 1989 0 0 0.0 43.4 54.2 56.6 56.6 56.6 56.9 56.9 1990 0 0 0.0 39.3 53.9 54.7 55.2 55.2 56.0 56.0 1991 0 0 0.2 33.3 50.0 51.4 51.8 52.3 52.3 52.8 1992 0 0 1.0 37.0 49.1 51.4 51.9 52.4 52.9 53.1 1993 0 0 0.2 33.0 44.1 47.4 48.0 48.2 48.2 48.5 1994 0 0 0.2 33.7 48.8 50.5 51.0 51.2 51.5 51.5 1995 0 0 0.2 35.1 49.8 51.7 52.2 52.4 52.4 52.4 1996 0 0 0.0 31.6 46.7 49.7 51.3 51.5 51.5 51.8 1997 0 0 0.2 29.2 46.8 49.3 50.0 50.2 50.2 50.7 1998 0 0 0.7 38.9 60.4 62.6 63.0 63.0 63.0 63.3 1999 0 0 0.2 35.5 60.8 61.9 62.2 62.4 62.6 62.6 2000 0 0 0.5 39.9 59.6 60.8 62.0 62.0 62.2 62.2 2001 0 0 0.2 45.0 61.6 63.0 63.2 63.4 63.7 63.7 2002 0 0 0.0 44.4 62.4 63.8 64.3 64.3 64.3 64.3 2003 0 0 0.5 51.3 63.9 64.9 64.9 65.2 65.2 65.2 2004 0 0 0.5 50.3 62.3 64.0 64.5 65.0 65.3 65.3 2005 0 0 0.3 42.6 61.1 61.9 62.7 62.7 63.2 63.5 2006 0 0.3 1.0 47.7 64.9 66.5 66.5 67.0 67.3 2007 0 0 0.5 47.0 60.4 61.8 62.1 62.1 2008 0 0.2 0.6 44.3 61.7 62.2 62.7 2009 0 0 0.3 44.5 61.6 63.2 2010 0 0 0.5 47.6 61.3 2011 0 0.2 0.5 48.9 2012 0 0.3 0.8
*Students who withdraw and return are included in their original class. **If a student graduates mid-year, the additional fall term is counted as another year. ***Summary of Degree Requirement Policies: 1989 New Students: Students are required to complete their degree requirements after eight regular terms of residence. Exceptions to the eight term limit are determined on a case by case basis. This policy was abandoned in 1999. 1999 New Students: Students are strictly limited to completion of all degree requirements within 10 regular and five short terms comprising five academic years (including transfer terms, terms abroad, off-campus field studies and internships). Requests for an eleventh term must be submitted to the Student Admissions and Academic Standing (SAAS) Committee. 2003 New Students: Students are expected to complete all degree requirements—including transfer terms, terms abroad, off-campus field studies, internships, and the addition of minors or second majors—within four academic years. Students who, for good reason, are unable to complete degree requirements within eight regular terms, may fill out a Request for an Extension of Terms form (which must include a Term Curriculum Plan, along with a letter explaining the reason(s) the extension is needed) and submit it to the Associate Provost for Advising and Academic Success. Plans not approved by the Associate Provost may be appealed to the Student Admissions and Academic Standing Committee. 2013 Eight Term Rule: Students are expected to complete all degree requirements within four academic years, or eight regular terms, including transfer terms for transfer students, terms abroad, off-campus field studies, internships, and the addition of minors or additional majors, if any. Failure to follow the approved Curriculum Plan submitted as part of the Declaration of Primary Major process does not constitute a valid reason for needing an extension of terms. Students who, for good reason, are unable to complete degree requirements within eight regular terms, may submit a Request for an Extension of Terms form (which must include a revised Curriculum Plan and an accompanying letter explaining the reason(s) the extension is needed) to the Office of Academic Services. Students proposing an Independent Major that requires more than eight terms, even if a prior extension of terms was approved for another major, should include this request with their completed proposal; approvals will be coordinated by the Director of Academic Services and the Dean of Curriculum and Student Learning.) Requests for a one or two-term extension not approved by Academic Services may be appealed to the Student Admissions and Academic Standing (SAAS) Committee. All requests for more than 10 terms of attendance are reviewed by the SAAS Committee.
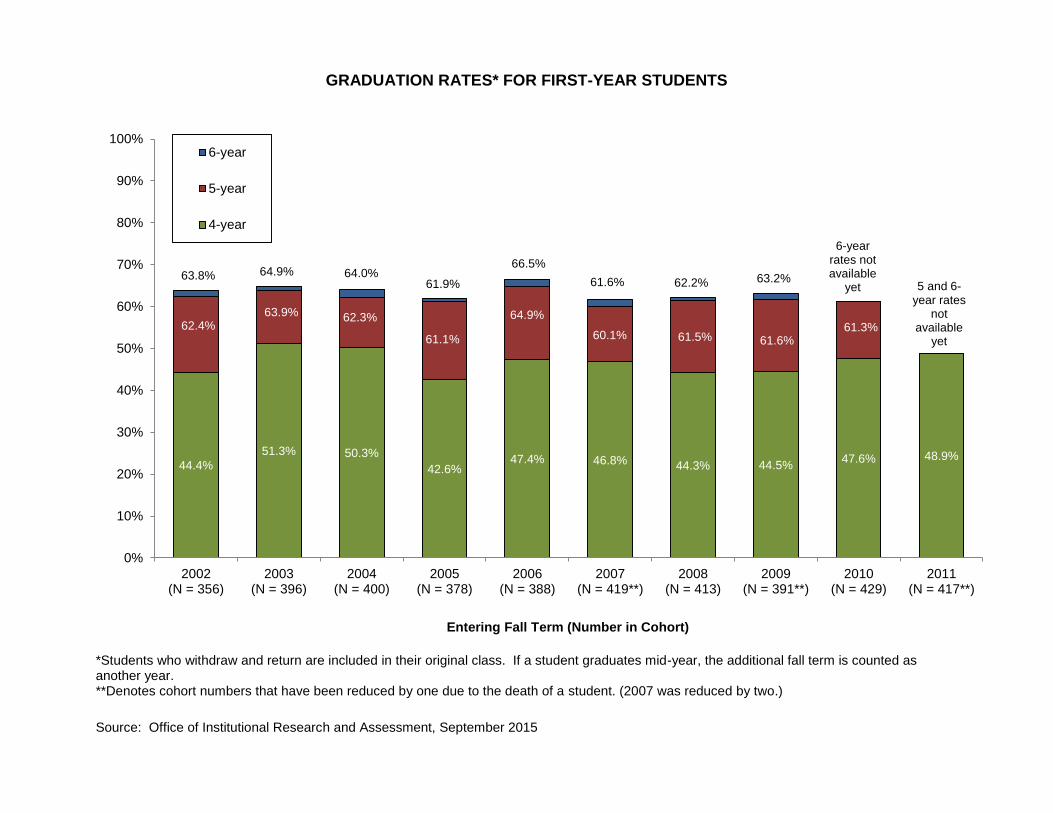
GRADUATION RATES* FOR FIRST-YEAR STUDENTS
Source: Office of Institutional Research and Assessment, September 2015
*Students who withdraw and return are included in their original class. If a student graduates mid-year, the additional fall term is counted as another year. **Denotes cohort numbers that have been reduced by one due to the death of a student. (2007 was reduced by two.)
44.4%
51.3% 50.3%
42.6%47.4% 46.8% 44.3% 44.5%
47.6% 48.9%
0%
10%
20%
30%
40%
50%
60%
70%
80%
90%
100%
2002(N = 356)
2003(N = 396)
2004(N = 400)
2005(N = 378)
2006(N = 388)
2007(N = 419**)
2008(N = 413)
2009(N = 391**)
2010(N = 429)
2011(N = 417**)
Entering Fall Term (Number in Cohort)
6-year
5-year
4-year
60.1% 61.5% 61.6%61.3%62.4%
66.5%
61.6% 62.2% 63.2%
6-year rates not available
yet 5 and 6-year rates
not available
yet
63.9%
63.8% 64.9% 64.0%
61.1%
64.9%
61.9%
62.3%
%
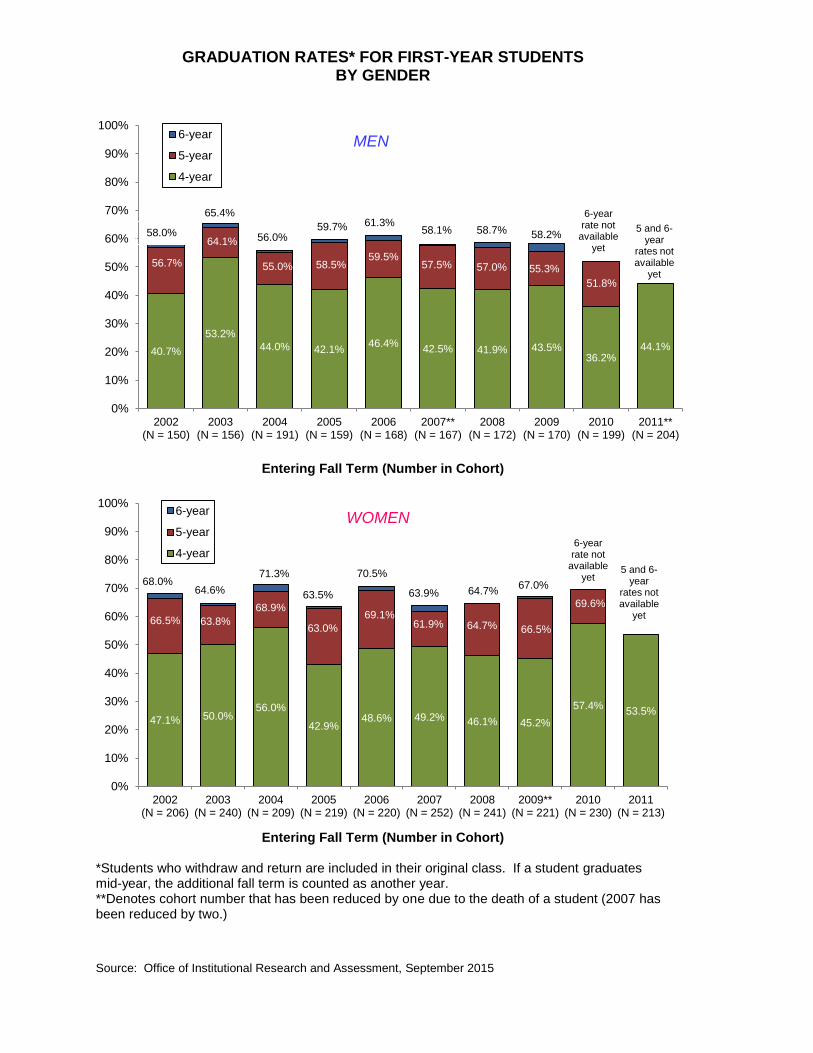
GRADUATION RATES* FOR FIRST-YEAR STUDENTS BY GENDER
Source: Office of Institutional Research and Assessment, September 2015
Entering Fall Term (Number in Cohort)
Entering Fall Term (Number in Cohort)
*Students who withdraw and return are included in their original class. If a student graduates mid-year, the additional fall term is counted as another year. **Denotes cohort number that has been reduced by one due to the death of a student (2007 has been reduced by two.)
40.7%
53.2%
44.0% 42.1%46.4%
42.5% 41.9% 43.5%36.2%
44.1%
0%
10%
20%
30%
40%
50%
60%
70%
80%
90%
100%
2002(N = 150)
2003(N = 156)
2004(N = 191)
2005(N = 159)
2006(N = 168)
2007**(N = 167)
2008(N = 172)
2009(N = 170)
2010(N = 199)
2011**(N = 204)
6-year
5-year
4-year
6-year rate not
available yet
MEN
5 and 6-year
rates not available
yet
65.4%
55.0%
59.7%
59.5%
64.1%
47.1% 50.0%56.0%
42.9%48.6% 49.2% 46.1% 45.2%
57.4%53.5%
0%
10%
20%
30%
40%
50%
60%
70%
80%
90%
100%
2002(N = 206)
2003(N = 240)
2004(N = 209)
2005(N = 219)
2006(N = 220)
2007(N = 252)
2008(N = 241)
2009**(N = 221)
2010(N = 230)
2011(N = 213)
6-year
5-year
4-year
5 and 6-year
rates not available
yet
6-year rate not
available yet
WOMEN
57.5% 57.0% 55.3%
51.8%
56.7%
61.3% 58.1% 58.7% 58.2%
69.1% 61.9% 64.7% 66.5%
69.6%
66.5%
63.5%
70.5%
63.9% 64.7% 67.0% 68.0%
63.8%
58.0%
%
64.6%
68.9%
56.0%
58.5%
71.3%
63.0%
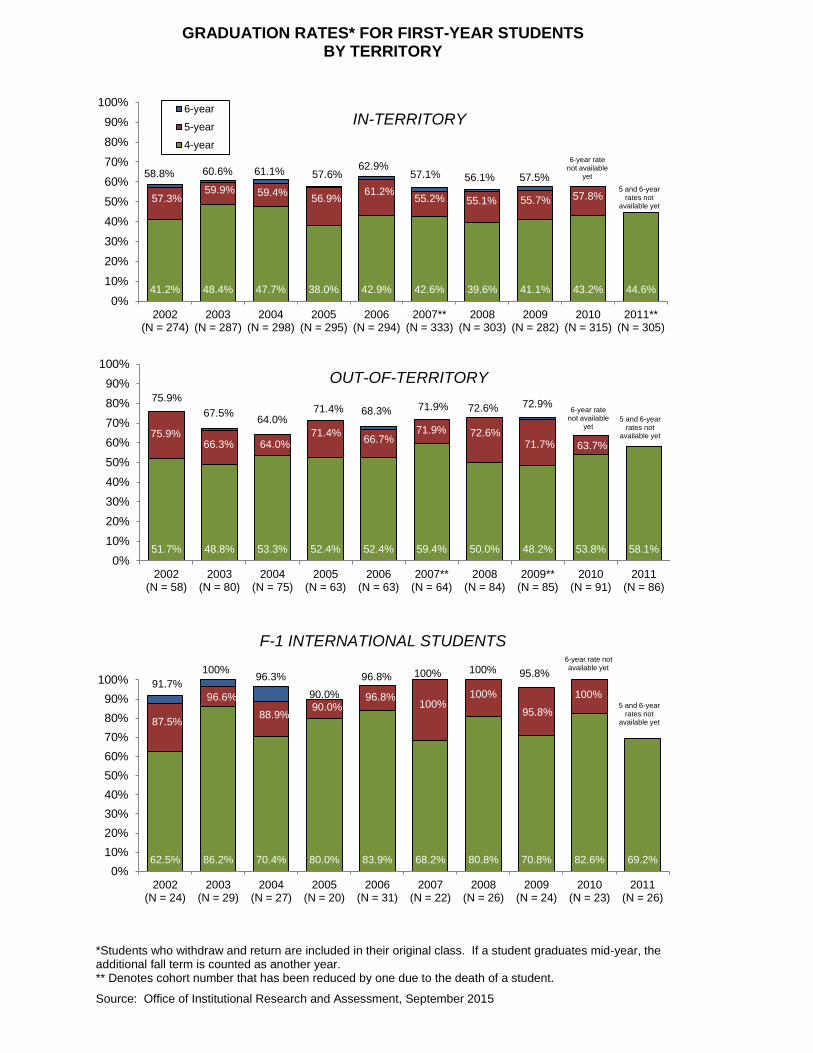
GRADUATION RATES* FOR FIRST-YEAR STUDENTS BY TERRITORY
*Students who withdraw and return are included in their original class. If a student graduates mid-year, the additional fall term is counted as another year. ** Denotes cohort number that has been reduced by one due to the death of a student.
Source: Office of Institutional Research and Assessment, September 2015
F-1 INTERNATIONAL STUDENTS
41.2% 48.4% 47.7% 38.0% 42.9% 42.6% 39.6% 41.1% 43.2% 44.6%0%
10%
20%
30%
40%
50%
60%
70%
80%
90%
100%
2002(N = 274)
2003(N = 287)
2004(N = 298)
2005(N = 295)
2006(N = 294)
2007**(N = 333)
2008(N = 303)
2009(N = 282)
2010(N = 315)
2011**(N = 305)
6-year
5-year
4-year
5 and 6-year rates not
available yet
6-year rate not available
yet
IN-TERRITORY
51.7% 48.8% 53.3% 52.4% 52.4% 59.4% 50.0% 48.2% 53.8% 58.1%0%
10%
20%
30%
40%
50%
60%
70%
80%
90%
100%
2002(N = 58)
2003(N = 80)
2004(N = 75)
2005(N = 63)
2006(N = 63)
2007**(N = 64)
2008(N = 84)
2009**(N = 85)
2010(N = 91)
2011(N = 86)
5 and 6-year rates not
available yet
6-year rate not available
yet
OUT-OF-TERRITORY
62.5% 86.2% 70.4% 80.0% 83.9% 68.2% 80.8% 70.8% 82.6% 69.2%0%
10%
20%
30%
40%
50%
60%
70%
80%
90%
100%
2002(N = 24)
2003(N = 29)
2004(N = 27)
2005(N = 20)
2006(N = 31)
2007(N = 22)
2008(N = 26)
2009(N = 24)
2010(N = 23)
2011(N = 26)
5 and 6-year rates not
available yet
6-year rate not available yet
61.2% 55.2% 55.1% 55.7% 57.8% 57.3%
57.6% 62.9%
57.1% 56.1% 57.5% 60.6%
59.9% 59.4%
58.8%
66.7% 71.9% 72.6%
71.7% 63.7% 75.9%
71.4% 68.3% 71.9% 72.6% 72.9%
64.0% 66.3%
67.5%
75.9%
61.1%
56.9%
64.0%
71.4%
100% %% 96.8%
100% 100%
95.8%
100%
87.5%
90.0%
96.8% 100% 100% 95.8%
96.6%
91.7%
88.9%
96.3%
90.0%
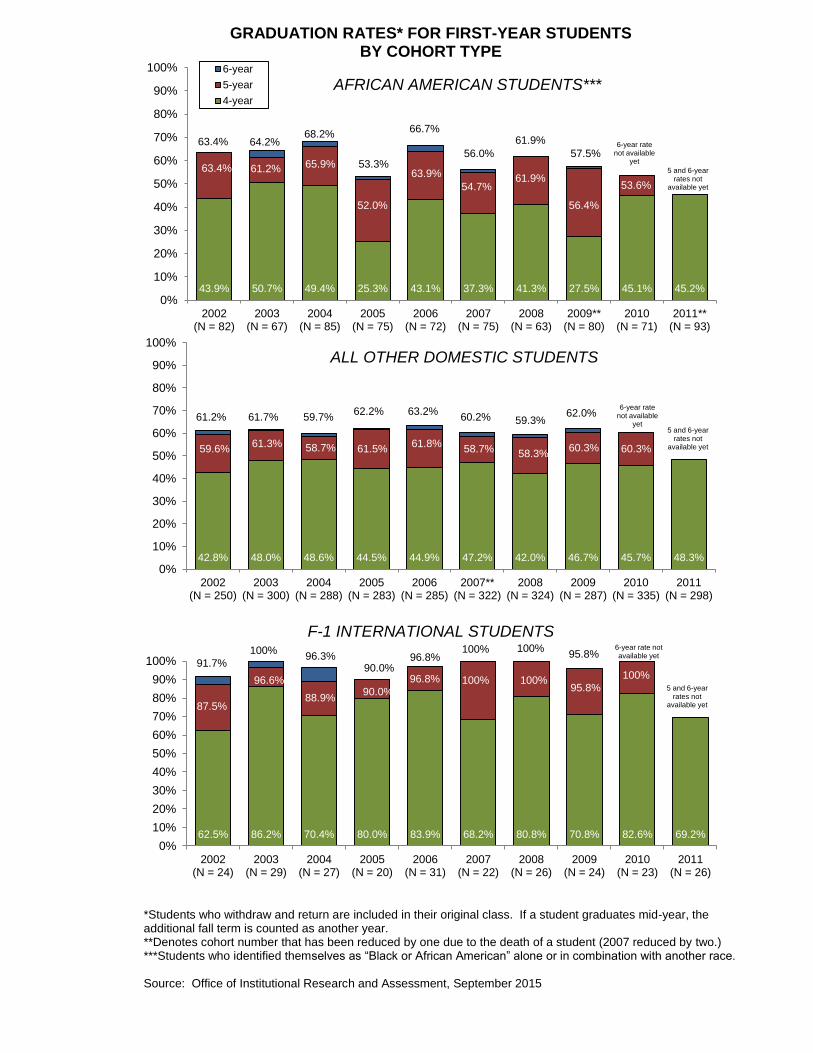
GRADUATION RATES* FOR FIRST-YEAR STUDENTS BY COHORT TYPE
*Students who withdraw and return are included in their original class. If a student graduates mid-year, the additional fall term is counted as another year. **Denotes cohort number that has been reduced by one due to the death of a student (2007 reduced by two.) ***Students who identified themselves as “Black or African American” alone or in combination with another race. Source: Office of Institutional Research and Assessment, September 2015
F-1 INTERNATIONAL STUDENTS
43.9% 50.7% 49.4% 25.3% 43.1% 37.3% 41.3% 27.5% 45.1% 45.2%0%
10%
20%
30%
40%
50%
60%
70%
80%
90%
100%
2002(N = 82)
2003(N = 67)
2004(N = 85)
2005(N = 75)
2006(N = 72)
2007(N = 75)
2008(N = 63)
2009**(N = 80)
2010(N = 71)
2011**(N = 93)
6-year
5-year
4-year
5 and 6-year rates not
available yet
6-year rate not available
yet
AFRICAN AMERICAN STUDENTS***
42.8% 48.0% 48.6% 44.5% 44.9% 47.2% 42.0% 46.7% 45.7% 48.3%0%
10%
20%
30%
40%
50%
60%
70%
80%
90%
100%
2002(N = 250)
2003(N = 300)
2004(N = 288)
2005(N = 283)
2006(N = 285)
2007**(N = 322)
2008(N = 324)
2009(N = 287)
2010(N = 335)
2011(N = 298)
5 and 6-year rates not
available yet
6-year rate not available
yet
ALL OTHER DOMESTIC STUDENTS
62.5% 86.2% 70.4% 80.0% 83.9% 68.2% 80.8% 70.8% 82.6% 69.2%0%
10%
20%
30%
40%
50%
60%
70%
80%
90%
100%
2002(N = 24)
2003(N = 29)
2004(N = 27)
2005(N = 20)
2006(N = 31)
2007(N = 22)
2008(N = 26)
2009(N = 24)
2010(N = 23)
2011(N = 26)
5 and 6-year rates not
available yet
96.8%
6-year rate not available yet
54.7% 61.9%
56.4%
53.6%
63.4% 53.3%
66.7%
56.0%
61.9%
57.5% 63.4%
61.2%
61.8% 58.7% 58.3%
60.3% 60.3% 59.6%
62.2% 63.2% 60.2% 59.3%
62.0% 61.7%
61.3% 58.7%
61.2%
100% %%
90.0% 100% 100%
95.8%
100%
87.5%
90.0% 96.8%
100% 100% 95.8%
96.6%
91.7%
64.2%
65.9%
68.2%
52.0%
59.7%
61.5%
96.3%
88.9%
63.9%
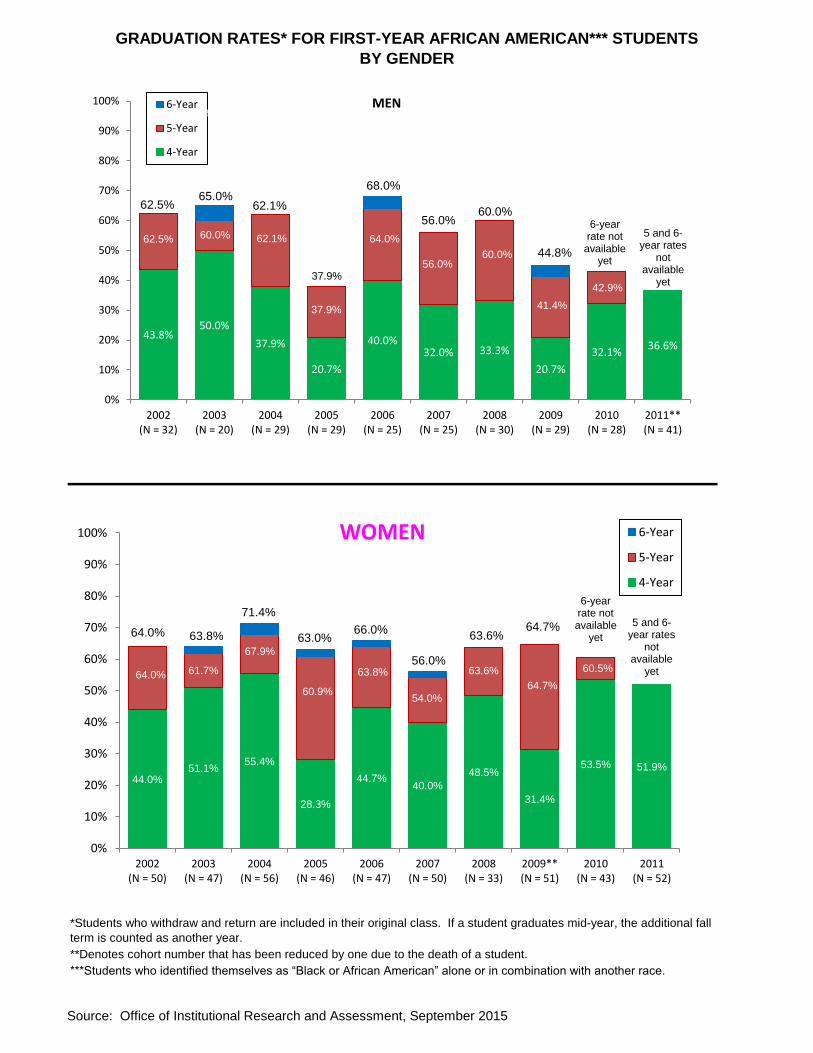
GRADUATION RATES* FOR FIRST-YEAR AFRICAN AMERICAN*** STUDENTS
BY GENDER
**Denotes cohort number that has been reduced by one due to the death of a student.
***Students who identified themselves as “Black or African American” alone or in combination with another race.
*Students who withdraw and return are included in their original class. If a student graduates mid-year, the additional fall
term is counted as another year.
43.8%50.0%
37.9%
20.7%
40.0%32.0% 33.3%
20.7%
32.1%36.6%
0%
10%
20%
30%
40%
50%
60%
70%
80%
90%
100%
2002(N = 32)
2003(N = 20)
2004(N = 29)
2005(N = 29)
2006(N = 25)
2007(N = 25)
2008(N = 30)
2009(N = 29)
2010(N = 28)
2011**(N = 41)
MEN6-Year
5-Year
4-Year
68.0%
60.0%
44.8%
62.5%65.0%
62.1%
64.0%
56.0%60.0%
41.4%
62.5% 60.0% 62.1%
56.0% 6-year rate not
available yet
5 and 6-year rates
not available
yet42.9%
37.9%
37.9%
44.0%51.1%
55.4%
28.3%
44.7%40.0%
48.5%
31.4%
53.5% 51.9%
0%
10%
20%
30%
40%
50%
60%
70%
80%
90%
100%
2002(N = 50)
2003(N = 47)
2004(N = 56)
2005(N = 46)
2006(N = 47)
2007(N = 50)
2008(N = 33)
2009**(N = 51)
2010(N = 43)
2011(N = 52)
WOMEN 6-Year
5-Year
4-Year
63.0%
63.8%
66.0%
56.0%
63.6%64.7%
64.0% 63.8%
71.4%6-year
rate not available
yet
5 and 6-year rates
not available
yet61.7%
54.0%
63.6%
64.7%
60.5%64.0%
61.7%
67.9%
60.9%
Source: Office of Institutional Research and Assessment, September 2015
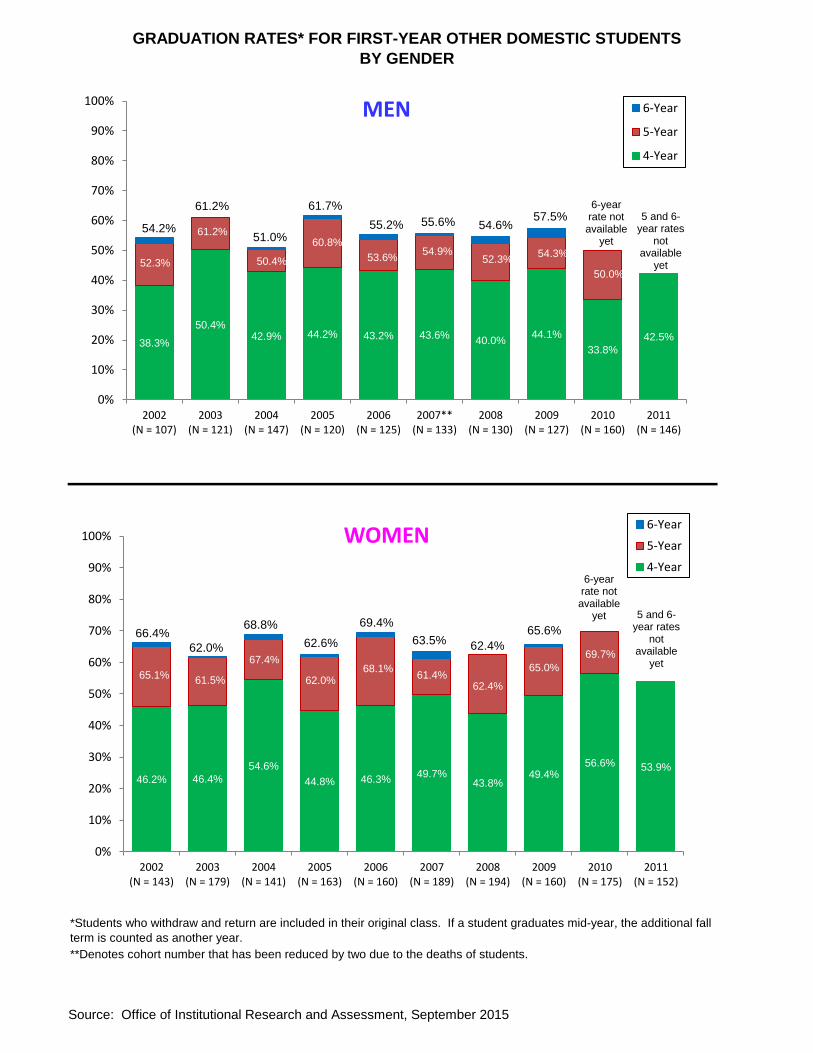
GRADUATION RATES* FOR FIRST-YEAR OTHER DOMESTIC STUDENTS
BY GENDER
**Denotes cohort number that has been reduced by two due to the deaths of students.
*Students who withdraw and return are included in their original class. If a student graduates mid-year, the additional fall
term is counted as another year.
38.3%
50.4%42.9% 44.2% 43.2% 43.6%
40.0%44.1%
33.8%
42.5%
0%
10%
20%
30%
40%
50%
60%
70%
80%
90%
100%
2002(N = 107)
2003(N = 121)
2004(N = 147)
2005(N = 120)
2006(N = 125)
2007**(N = 133)
2008(N = 130)
2009(N = 127)
2010(N = 160)
2011(N = 146)
MEN 6-Year
5-Year
4-Year
55.2% 54.6%57.5%
54.2%
61.2%
51.0%
53.6%54.9%
52.3%54.3%
52.3%
61.2%55.6%
61.7% 6-year rate not available
yet
5 and 6-year rates
not available
yet50.0%
50.4%
60.8%
46.2% 46.4%
54.6%
44.8% 46.3%49.7%
43.8%49.4%
56.6% 53.9%
0%
10%
20%
30%
40%
50%
60%
70%
80%
90%
100%
2002(N = 143)
2003(N = 179)
2004(N = 141)
2005(N = 163)
2006(N = 160)
2007(N = 189)
2008(N = 194)
2009(N = 160)
2010(N = 175)
2011(N = 152)
WOMEN6-Year
5-Year
4-Year
62.6%
68.1%
69.4%
63.5% 62.4%
65.6%66.4%
62.0%
68.8%
6-year rate not available
yet 5 and 6-year rates
not available
yet65.0%67.4%
61.4%62.4%
69.7%
65.1%61.5% 62.0%
Source: Office of Institutional Research and Assessment, September 2015
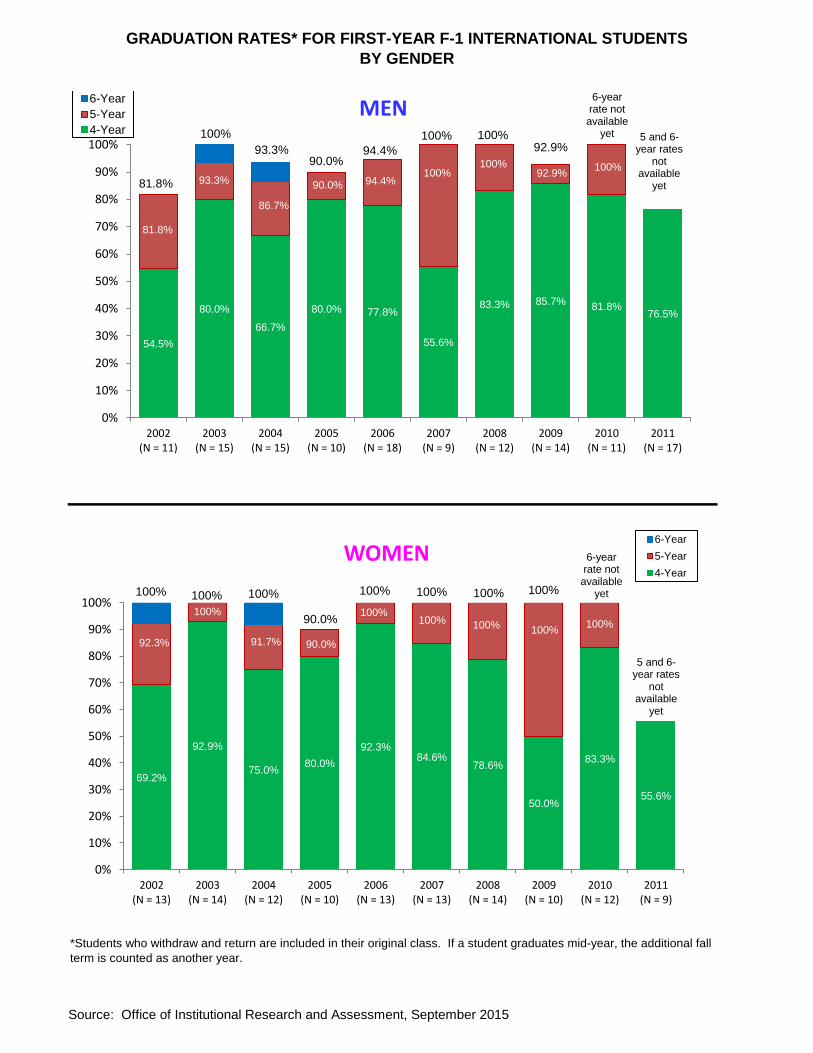
GRADUATION RATES* FOR FIRST-YEAR F-1 INTERNATIONAL STUDENTS
BY GENDER
*Students who withdraw and return are included in their original class. If a student graduates mid-year, the additional fall
term is counted as another year.
54.5%
80.0%
66.7%
80.0% 77.8%
55.6%
83.3% 85.7%81.8%
76.5%
0%
10%
20%
30%
40%
50%
60%
70%
80%
90%
100%
2002(N = 11)
2003(N = 15)
2004(N = 15)
2005(N = 10)
2006(N = 18)
2007(N = 9)
2008(N = 12)
2009(N = 14)
2010(N = 11)
2011(N = 17)
MEN6-Year
5-Year
4-Year
94.4%
100%92.9%
81.8%
100%
93.3%
94.4%100% 92.9%
81.8%
93.3%
90.0%
100%
6-year rate not available
yet 5 and 6-year rates
not available
yet
100%
86.7%
90.0%
69.2%
92.9%
75.0%80.0%
92.3%84.6%
78.6%
50.0%
83.3%
55.6%
0%
10%
20%
30%
40%
50%
60%
70%
80%
90%
100%
2002(N = 13)
2003(N = 14)
2004(N = 12)
2005(N = 10)
2006(N = 13)
2007(N = 13)
2008(N = 14)
2009(N = 10)
2010(N = 12)
2011(N = 9)
WOMEN6-Year
5-Year
4-Year
90.0%
100% 100% 100% 100%100% 100% 100%
6-year rate not available
yet
5 and 6-year rates
not available
yet
100%
100%100%100%
100%
100%
92.3%
100%
91.7% 90.0%
Source: Office of Institutional Research and Assessment, September 2015
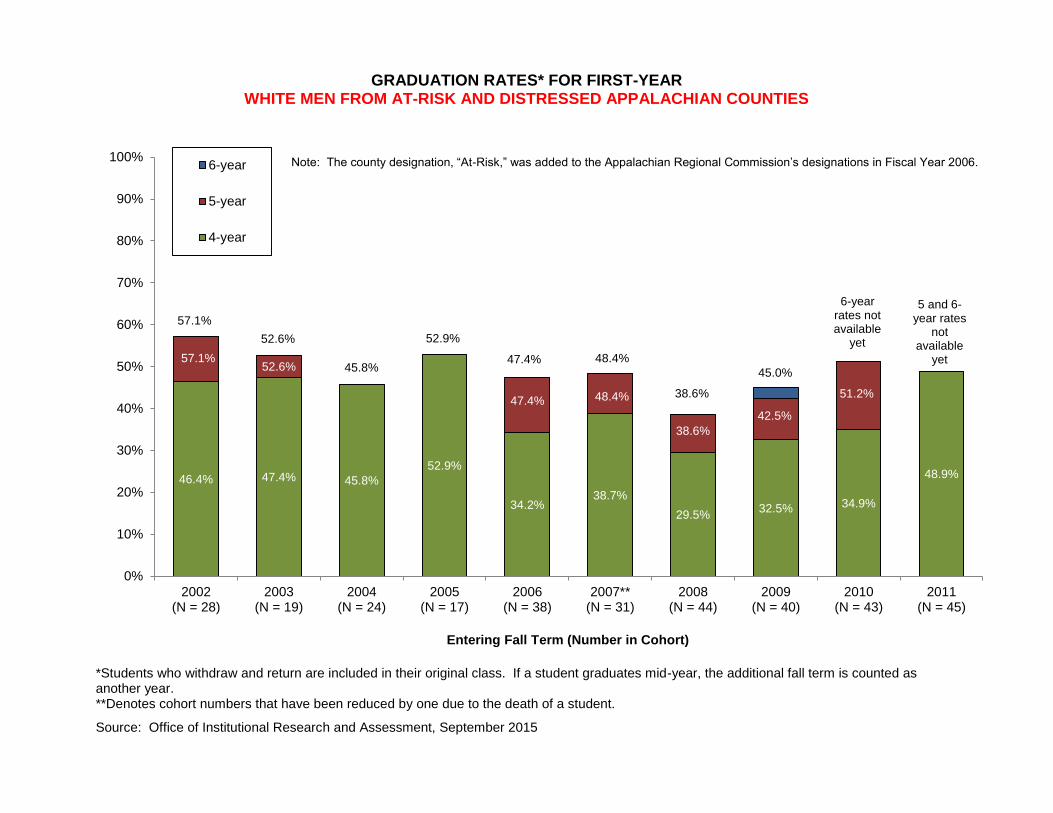
GRADUATION RATES* FOR FIRST-YEAR WHITE MEN FROM AT-RISK AND DISTRESSED APPALACHIAN COUNTIES
Source: Office of Institutional Research and Assessment, September 2015
*Students who withdraw and return are included in their original class. If a student graduates mid-year, the additional fall term is counted as another year. **Denotes cohort numbers that have been reduced by one due to the death of a student.
46.4% 47.4% 45.8%
52.9%
34.2%38.7%
29.5%32.5% 34.9%
48.9%
0%
10%
20%
30%
40%
50%
60%
70%
80%
90%
100%
2002(N = 28)
2003(N = 19)
2004(N = 24)
2005(N = 17)
2006(N = 38)
2007**(N = 31)
2008(N = 44)
2009(N = 40)
2010(N = 43)
2011(N = 45)
Entering Fall Term (Number in Cohort)
6-year
5-year
4-year
38.6%
42.5%
51.2%
57.1% 47.4% 48.4%
38.6%
45.0%
6-year rates not available
yet
5 and 6-year rates
not available
yet52.6%
57.1%
52.6%
45.8%
47.4%
52.9%
48.4%
%
Note: The county designation, “At-Risk,” was added to the Appalachian Regional Commission’s designations in Fiscal Year 2006.
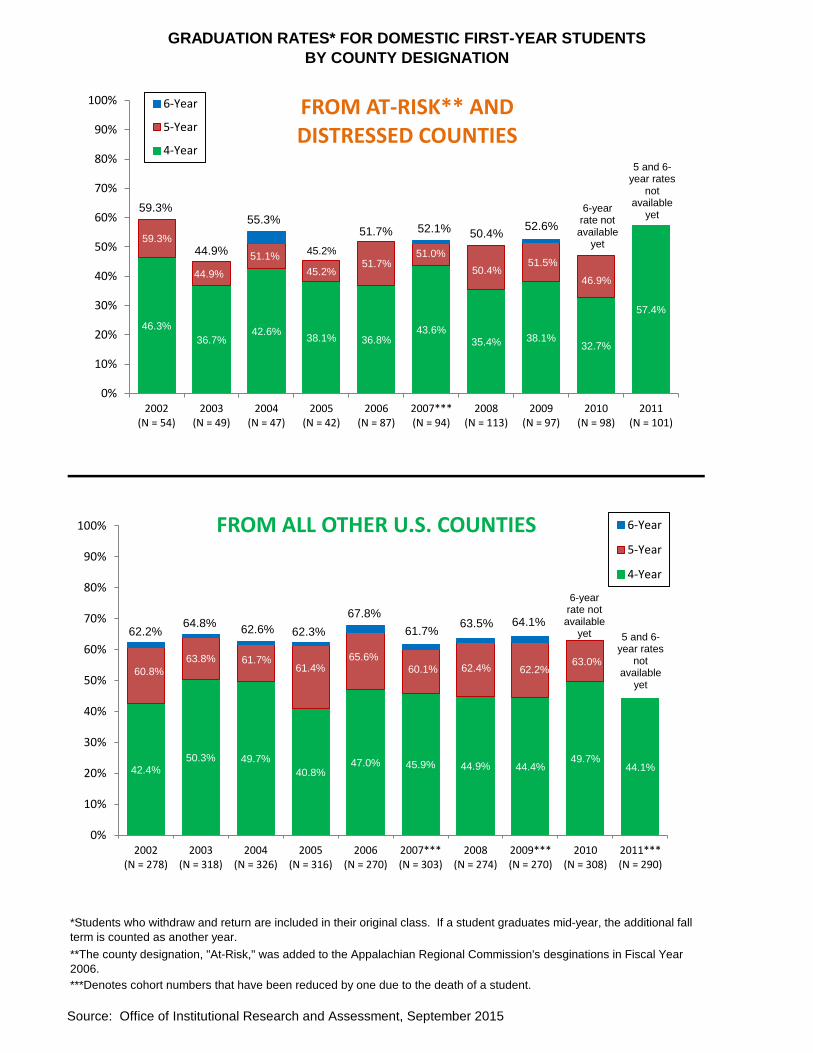
GRADUATION RATES* FOR DOMESTIC FIRST-YEAR STUDENTS
BY COUNTY DESIGNATION
***Denotes cohort numbers that have been reduced by one due to the death of a student.
*Students who withdraw and return are included in their original class. If a student graduates mid-year, the additional fall
term is counted as another year.
**The county designation, "At-Risk," was added to the Appalachian Regional Commission's desginations in Fiscal Year
2006.
46.3%
36.7%42.6%
38.1% 36.8%43.6%
35.4% 38.1%32.7%
57.4%
0%
10%
20%
30%
40%
50%
60%
70%
80%
90%
100%
2002(N = 54)
2003(N = 49)
2004(N = 47)
2005(N = 42)
2006(N = 87)
2007***(N = 94)
2008(N = 113)
2009(N = 97)
2010(N = 98)
2011(N = 101)
FROM AT-RISK** AND DISTRESSED COUNTIES
6-Year
5-Year
4-Year
51.7% 50.4%52.6%
59.3%
44.9%
55.3%
51.7%51.0%
50.4%51.5%
59.3%
44.9%
51.1%
52.1%
6-year rate not available
yet
5 and 6-year rates
not available
yet
46.9%
45.2%
42.4%50.3% 49.7%
40.8%47.0% 45.9% 44.9% 44.4%
49.7%44.1%
0%
10%
20%
30%
40%
50%
60%
70%
80%
90%
100%
2002(N = 278)
2003(N = 318)
2004(N = 326)
2005(N = 316)
2006(N = 270)
2007***(N = 303)
2008(N = 274)
2009***(N = 270)
2010(N = 308)
2011***(N = 290)
FROM ALL OTHER U.S. COUNTIES 6-Year
5-Year
4-Year
62.3%
65.6%
67.8%
61.7%63.5% 64.1%
62.2%64.8%
62.6%
6-year rate not available
yet 5 and 6-year rates
not available
yet
63.8%60.1% 62.4% 62.2%
63.0%60.8%
45.2%
61.7%61.4%
Source: Office of Institutional Research and Assessment, September 2015
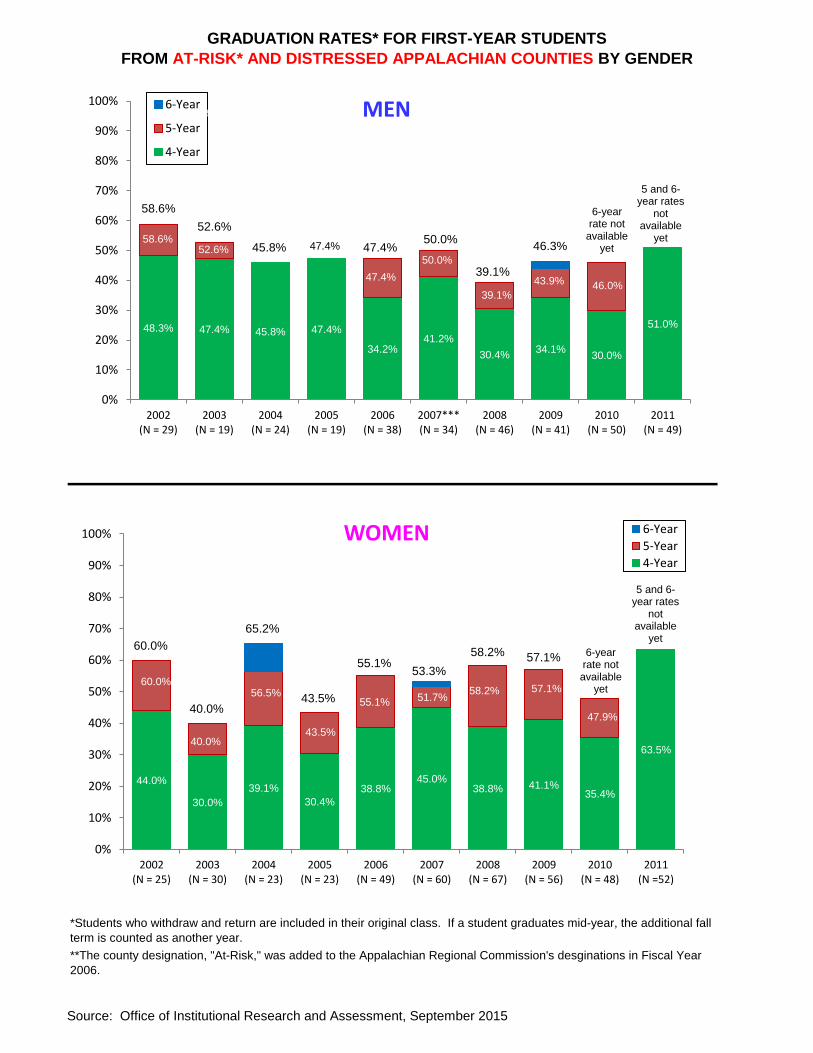
GRADUATION RATES* FOR FIRST-YEAR STUDENTS
FROM AT-RISK* AND DISTRESSED APPALACHIAN COUNTIES BY GENDER
*Students who withdraw and return are included in their original class. If a student graduates mid-year, the additional fall
term is counted as another year.
**The county designation, "At-Risk," was added to the Appalachian Regional Commission's desginations in Fiscal Year
2006.
48.3% 47.4% 45.8% 47.4%
34.2%41.2%
30.4%34.1%
30.0%
51.0%
0%
10%
20%
30%
40%
50%
60%
70%
80%
90%
100%
2002(N = 29)
2003(N = 19)
2004(N = 24)
2005(N = 19)
2006(N = 38)
2007***(N = 34)
2008(N = 46)
2009(N = 41)
2010(N = 50)
2011(N = 49)
MEN6-Year
5-Year
4-Year
47.4%
39.1%
46.3%
58.6%
52.6%
45.8%
47.4%
50.0%
39.1%
43.9%
58.6%52.6%
50.0%
6-year rate not
available yet
5 and 6-year rates
not available
yet
46.0%
47.4%
44.0%
30.0%
39.1%
30.4%
38.8%45.0%
38.8% 41.1%35.4%
63.5%
0%
10%
20%
30%
40%
50%
60%
70%
80%
90%
100%
2002(N = 25)
2003(N = 30)
2004(N = 23)
2005(N = 23)
2006(N = 49)
2007(N = 60)
2008(N = 67)
2009(N = 56)
2010(N = 48)
2011(N =52)
WOMEN 6-Year
5-Year
4-Year
43.5% 55.1%
55.1%53.3%
58.2% 57.1%60.0%
40.0%
65.2%
6-year rate not available
yet
5 and 6-year rates
not available
yet
40.0%
51.7%58.2% 57.1%
47.9%
60.0%
61.7%
56.5%
43.5%
Source: Office of Institutional Research and Assessment, September 2015
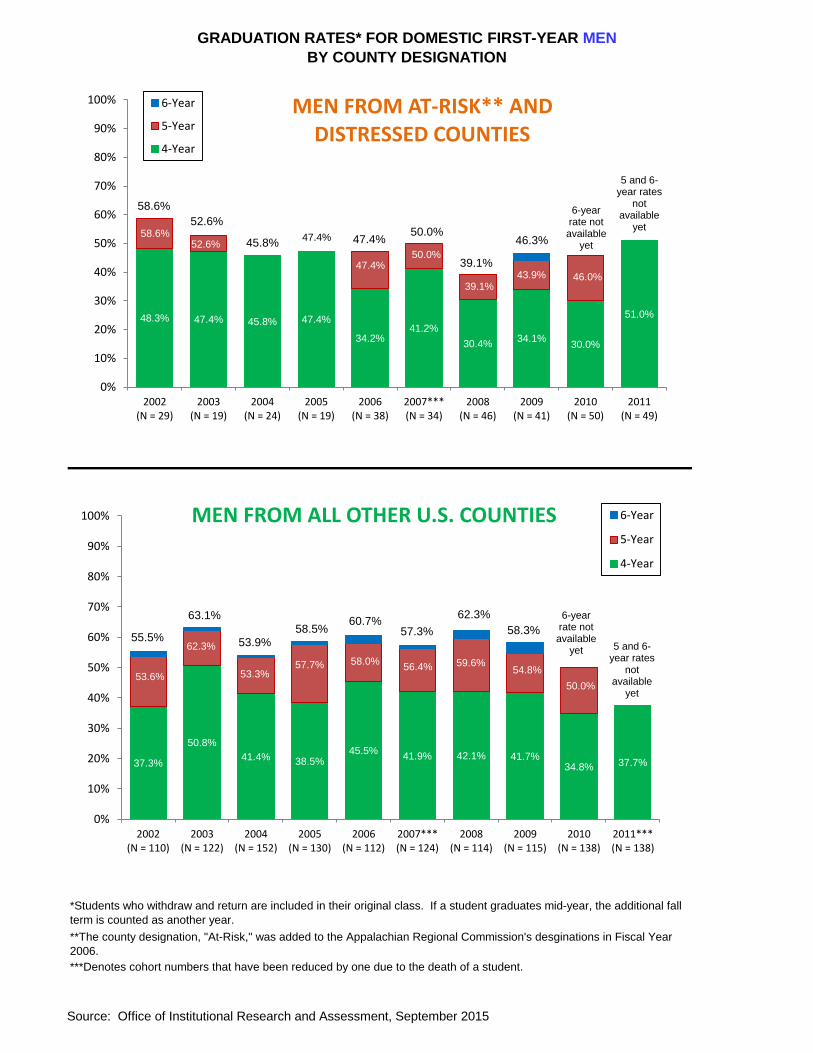
GRADUATION RATES* FOR DOMESTIC FIRST-YEAR MEN
BY COUNTY DESIGNATION
***Denotes cohort numbers that have been reduced by one due to the death of a student.
*Students who withdraw and return are included in their original class. If a student graduates mid-year, the additional fall
term is counted as another year.
**The county designation, "At-Risk," was added to the Appalachian Regional Commission's desginations in Fiscal Year
2006.
48.3% 47.4% 45.8% 47.4%
34.2%41.2%
30.4%34.1%
30.0%
51.0%
0%
10%
20%
30%
40%
50%
60%
70%
80%
90%
100%
2002(N = 29)
2003(N = 19)
2004(N = 24)
2005(N = 19)
2006(N = 38)
2007***(N = 34)
2008(N = 46)
2009(N = 41)
2010(N = 50)
2011(N = 49)
MEN FROM AT-RISK** AND DISTRESSED COUNTIES
6-Year
5-Year
4-Year
47.4%
39.1%
46.3%
58.6%
52.6%
45.8%
47.4%50.0%
39.1%43.9%
58.6%52.6%
50.0%
6-year rate not available
yet
5 and 6-year rates
not available
yet
46.0%
47.4%
37.3%
50.8%
41.4% 38.5%45.5%
41.9% 42.1% 41.7%34.8% 37.7%
0%
10%
20%
30%
40%
50%
60%
70%
80%
90%
100%
2002(N = 110)
2003(N = 122)
2004(N = 152)
2005(N = 130)
2006(N = 112)
2007***(N = 124)
2008(N = 114)
2009(N = 115)
2010(N = 138)
2011***(N = 138)
MEN FROM ALL OTHER U.S. COUNTIES 6-Year
5-Year
4-Year
58.5%
58.0%
60.7%57.3%
62.3%
58.3%55.5%
63.1%
53.9%
6-year rate not available
yet 5 and 6-year rates
not available
yet
62.3%
56.4% 59.6%54.8%
50.0%53.6% 53.3%
57.7%
Source: Office of Institutional Research and Assessment, September 2015
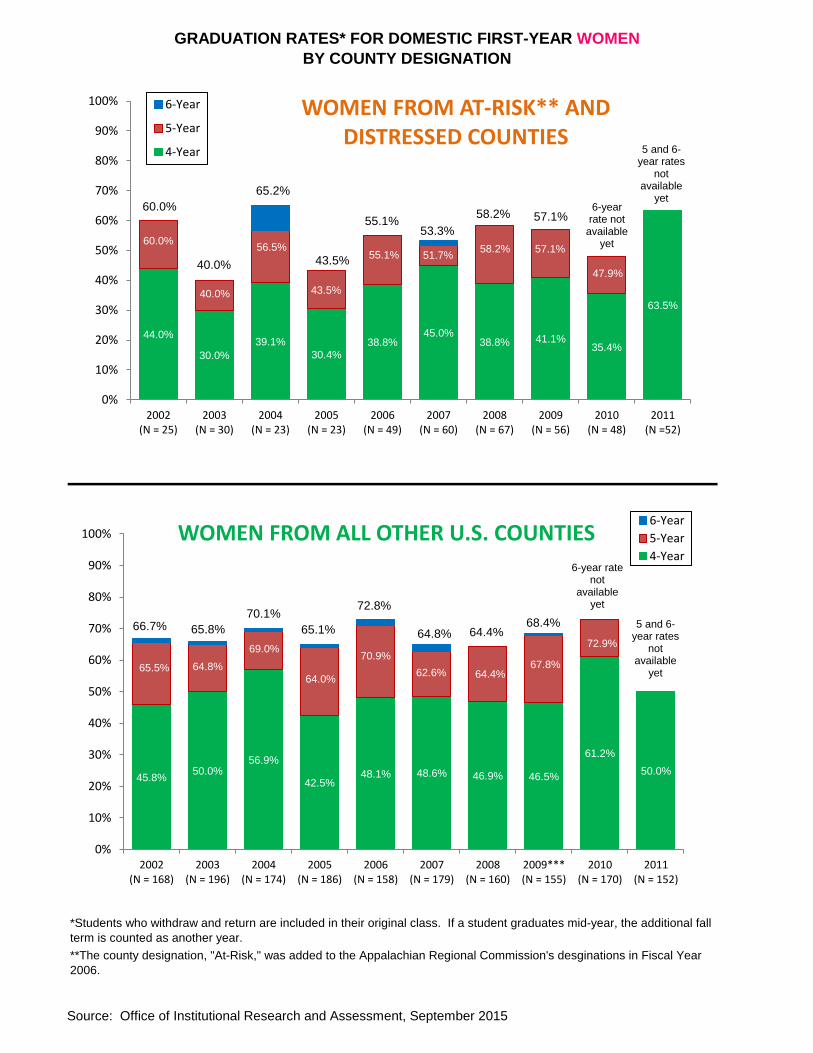
GRADUATION RATES* FOR DOMESTIC FIRST-YEAR WOMEN
BY COUNTY DESIGNATION
*Students who withdraw and return are included in their original class. If a student graduates mid-year, the additional fall
term is counted as another year.
**The county designation, "At-Risk," was added to the Appalachian Regional Commission's desginations in Fiscal Year
2006.
44.0%
30.0%
39.1%
30.4%38.8%
45.0%38.8% 41.1%
35.4%
63.5%
0%
10%
20%
30%
40%
50%
60%
70%
80%
90%
100%
2002(N = 25)
2003(N = 30)
2004(N = 23)
2005(N = 23)
2006(N = 49)
2007(N = 60)
2008(N = 67)
2009(N = 56)
2010(N = 48)
2011(N =52)
WOMEN FROM AT-RISK** AND DISTRESSED COUNTIES
6-Year
5-Year
4-Year
55.1%58.2% 57.1%
60.0%
40.0%
65.2%
55.1% 51.7%58.2% 57.1%
60.0%
40.0%
56.5%
43.5%
47.9%
53.3%
6-year rate not
available yet
5 and 6-year rates
not available
yet57.6%
43.5%
45.8%50.0%
56.9%
42.5%48.1% 48.6% 46.9% 46.5%
61.2%
50.0%
0%
10%
20%
30%
40%
50%
60%
70%
80%
90%
100%
2002(N = 168)
2003(N = 196)
2004(N = 174)
2005(N = 186)
2006(N = 158)
2007(N = 179)
2008(N = 160)
2009***(N = 155)
2010(N = 170)
2011(N = 152)
WOMEN FROM ALL OTHER U.S. COUNTIES6-Year
5-Year
4-Year
65.1%
70.9%
72.8%
64.8% 64.4%68.4%66.7% 65.8%
70.1%
6-year rate not
available yet
5 and 6-year rates
not available
yet64.8%
62.6%67.8%
69.0%
64.4%
72.9%
65.5%64.0%
Source: Office of Institutional Research and Assessment, September 2015
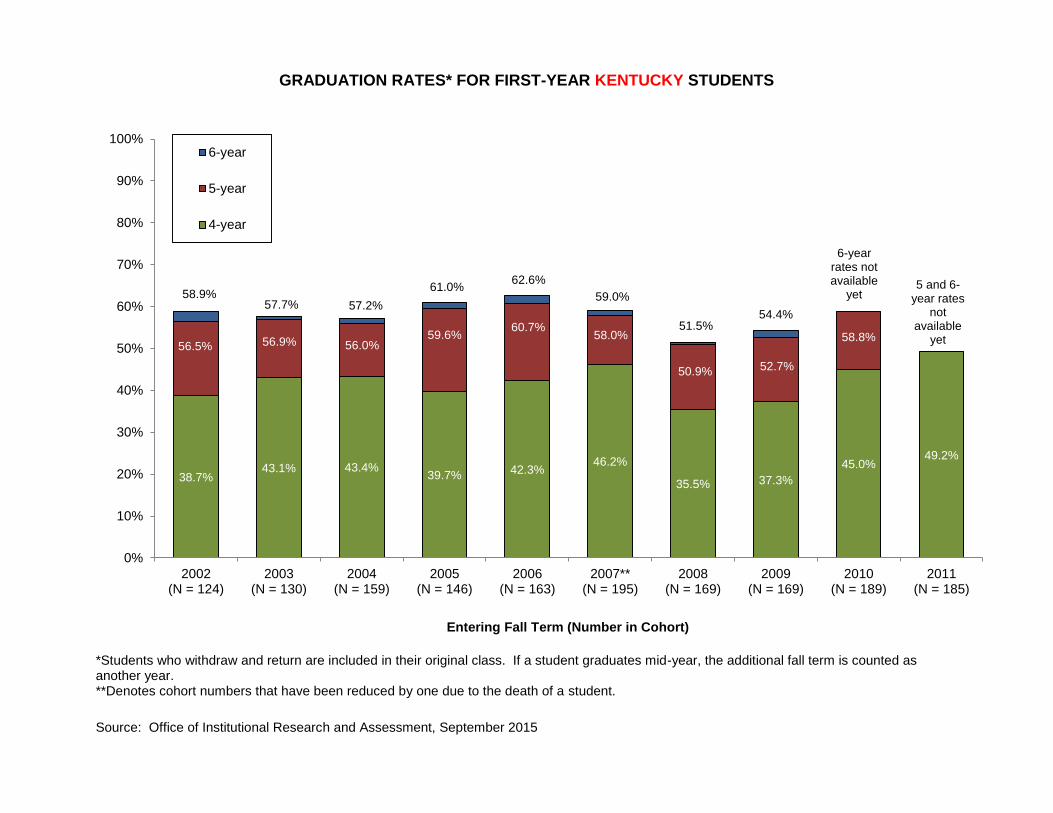
GRADUATION RATES* FOR FIRST-YEAR KENTUCKY STUDENTS
Source: Office of Institutional Research and Assessment, September 2015
*Students who withdraw and return are included in their original class. If a student graduates mid-year, the additional fall term is counted as another year. **Denotes cohort numbers that have been reduced by one due to the death of a student.
38.7%43.1% 43.4%
39.7% 42.3%46.2%
35.5% 37.3%
45.0%49.2%
0%
10%
20%
30%
40%
50%
60%
70%
80%
90%
100%
2002(N = 124)
2003(N = 130)
2004(N = 159)
2005(N = 146)
2006(N = 163)
2007**(N = 195)
2008(N = 169)
2009(N = 169)
2010(N = 189)
2011(N = 185)
Entering Fall Term (Number in Cohort)
6-year
5-year
4-year
58.0%
50.9% 52.7%
58.8%56.5%
62.6%
59.0%
51.5%54.4%
6-year rates not available
yet5 and 6-
year rates not
available yet56.9%
58.9%57.7% 57.2%
59.6%60.7%
61.0%
56.0%
%
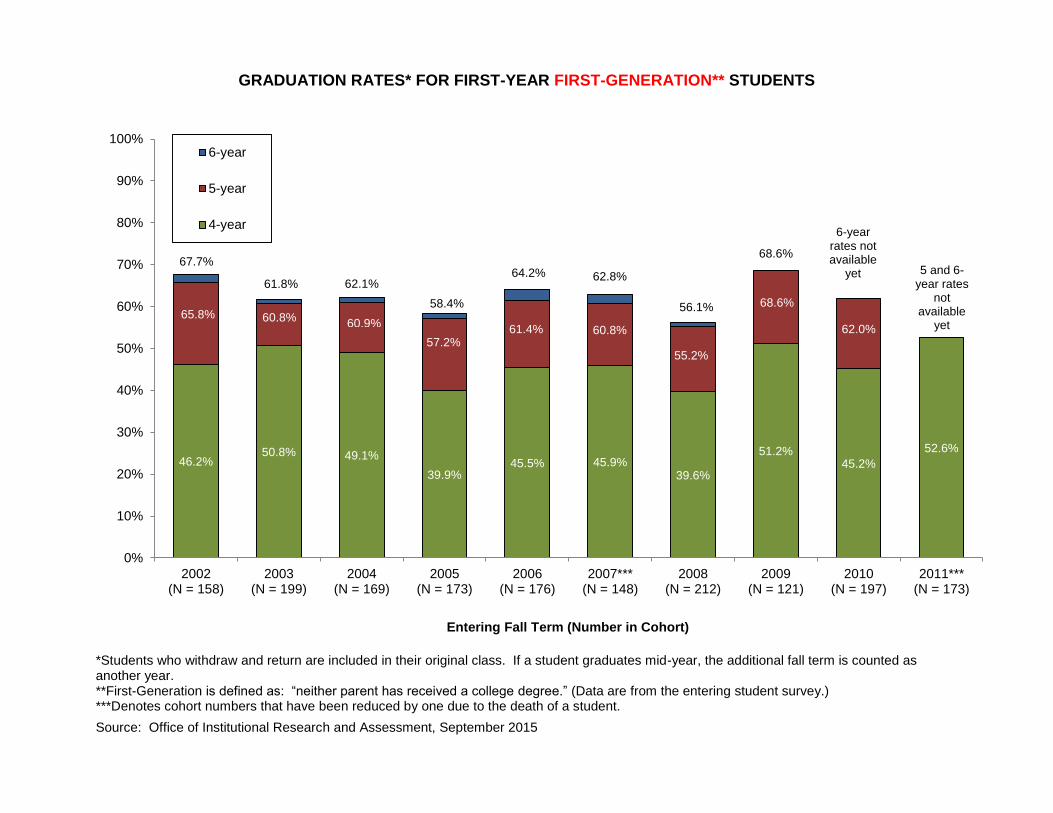
GRADUATION RATES* FOR FIRST-YEAR FIRST-GENERATION** STUDENTS
Source: Office of Institutional Research and Assessment, September 2015
*Students who withdraw and return are included in their original class. If a student graduates mid-year, the additional fall term is counted as another year. **First-Generation is defined as: “neither parent has received a college degree.” (Data are from the entering student survey.) ***Denotes cohort numbers that have been reduced by one due to the death of a student.
46.2%50.8% 49.1%
39.9%45.5% 45.9%
39.6%
51.2%45.2%
52.6%
0%
10%
20%
30%
40%
50%
60%
70%
80%
90%
100%
2002(N = 158)
2003(N = 199)
2004(N = 169)
2005(N = 173)
2006(N = 176)
2007***(N = 148)
2008(N = 212)
2009(N = 121)
2010(N = 197)
2011***(N = 173)
Entering Fall Term (Number in Cohort)
6-year
5-year
4-year
60.8%
55.2%
68.6%
62.0%
65.8%
64.2% 62.8%
56.1%
68.6%
6-year rates not available
yet 5 and 6-year rates
not available
yet60.8%
67.7%
61.8% 62.1%
57.2%61.4%
58.4%
60.9%
%
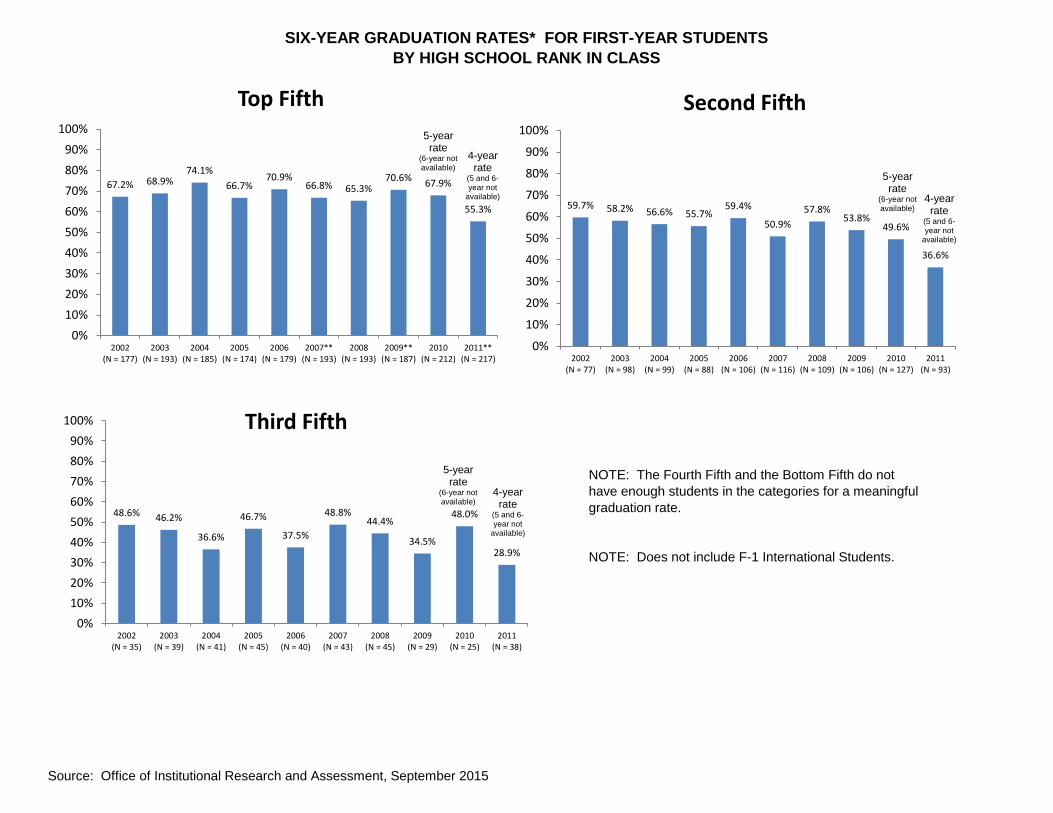
SIX-YEAR GRADUATION RATES* FOR FIRST-YEAR STUDENTS
BY HIGH SCHOOL RANK IN CLASS
NOTE: Does not include F-1 International Students.
NOTE: The Fourth Fifth and the Bottom Fifth do not
have enough students in the categories for a meaningful
graduation rate.
67.2% 68.9%74.1%
66.7%70.9%
66.8% 65.3%70.6%
67.9%
55.3%
0%
10%
20%
30%
40%
50%
60%
70%
80%
90%
100%
2002(N = 177)
2003(N = 193)
2004(N = 185)
2005(N = 174)
2006(N = 179)
2007**(N = 193)
2008(N = 193)
2009**(N = 187)
2010(N = 212)
2011**(N = 217)
Top Fifth
5-year rate
(6-year not available)
4-year rate
(5 and 6-year not
available)59.7% 58.2% 56.6% 55.7%
59.4%
50.9%
57.8%53.8%
49.6%
36.6%
0%
10%
20%
30%
40%
50%
60%
70%
80%
90%
100%
2002(N = 77)
2003(N = 98)
2004(N = 99)
2005(N = 88)
2006(N = 106)
2007(N = 116)
2008(N = 109)
2009(N = 106)
2010(N = 127)
2011(N = 93)
Second Fifth
5-year rate
(6-year not available)
4-year rate
(5 and 6-year not
available)
48.6% 46.2%
36.6%
46.7%
37.5%
48.8%44.4%
34.5%
48.0%
28.9%
0%
10%
20%
30%
40%
50%
60%
70%
80%
90%
100%
2002(N = 35)
2003(N = 39)
2004(N = 41)
2005(N = 45)
2006(N = 40)
2007(N = 43)
2008(N = 45)
2009(N = 29)
2010(N = 25)
2011(N = 38)
Third Fifth
5-year rate
(6-year not available)
4-year rate
(5 and 6-year not
available)
Source: Office of Institutional Research and Assessment, September 2015
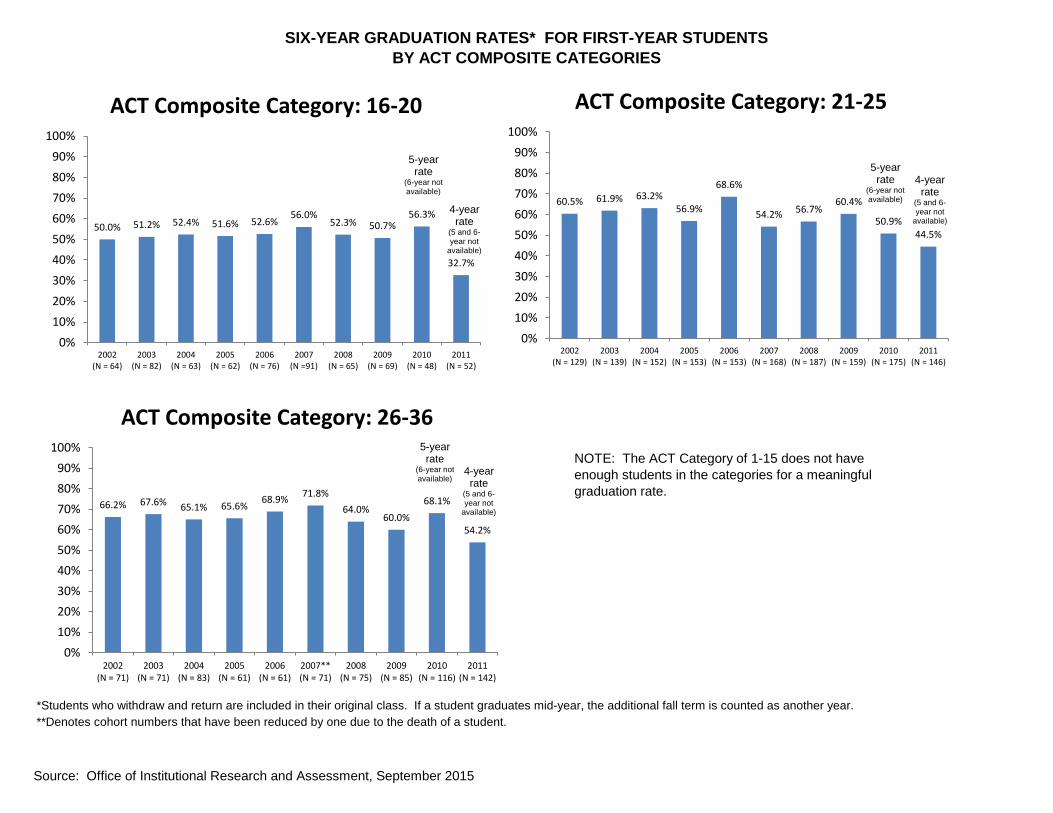
SIX-YEAR GRADUATION RATES* FOR FIRST-YEAR STUDENTS
BY ACT COMPOSITE CATEGORIES
**Denotes cohort numbers that have been reduced by one due to the death of a student.
NOTE: The ACT Category of 1-15 does not have
enough students in the categories for a meaningful
graduation rate.
*Students who withdraw and return are included in their original class. If a student graduates mid-year, the additional fall term is counted as another year.
50.0% 51.2% 52.4% 51.6% 52.6%56.0%
52.3% 50.7%56.3%
32.7%
0%
10%
20%
30%
40%
50%
60%
70%
80%
90%
100%
2002(N = 64)
2003(N = 82)
2004(N = 63)
2005(N = 62)
2006(N = 76)
2007(N =91)
2008(N = 65)
2009(N = 69)
2010(N = 48)
2011(N = 52)
ACT Composite Category: 16-20
5-year rate
(6-year not available)
4-year rate
(5 and 6-year not
available)
60.5% 61.9% 63.2%56.9%
68.6%
54.2% 56.7%60.4%
50.9%44.5%
0%
10%
20%
30%
40%
50%
60%
70%
80%
90%
100%
2002(N = 129)
2003(N = 139)
2004(N = 152)
2005(N = 153)
2006(N = 153)
2007(N = 168)
2008(N = 187)
2009(N = 159)
2010(N = 175)
2011(N = 146)
ACT Composite Category: 21-25
5-year rate
(6-year not available)
4-year rate
(5 and 6-year not
available)
66.2% 67.6% 65.1% 65.6%68.9%
71.8%
64.0%60.0%
68.1%
54.2%
0%
10%
20%
30%
40%
50%
60%
70%
80%
90%
100%
2002(N = 71)
2003(N = 71)
2004(N = 83)
2005(N = 61)
2006(N = 61)
2007**(N = 71)
2008(N = 75)
2009(N = 85)
2010(N = 116)
2011(N = 142)
ACT Composite Category: 26-365-year rate
(6-year not available)
4-year rate
(5 and 6-year not
available)
Source: Office of Institutional Research and Assessment, September 2015
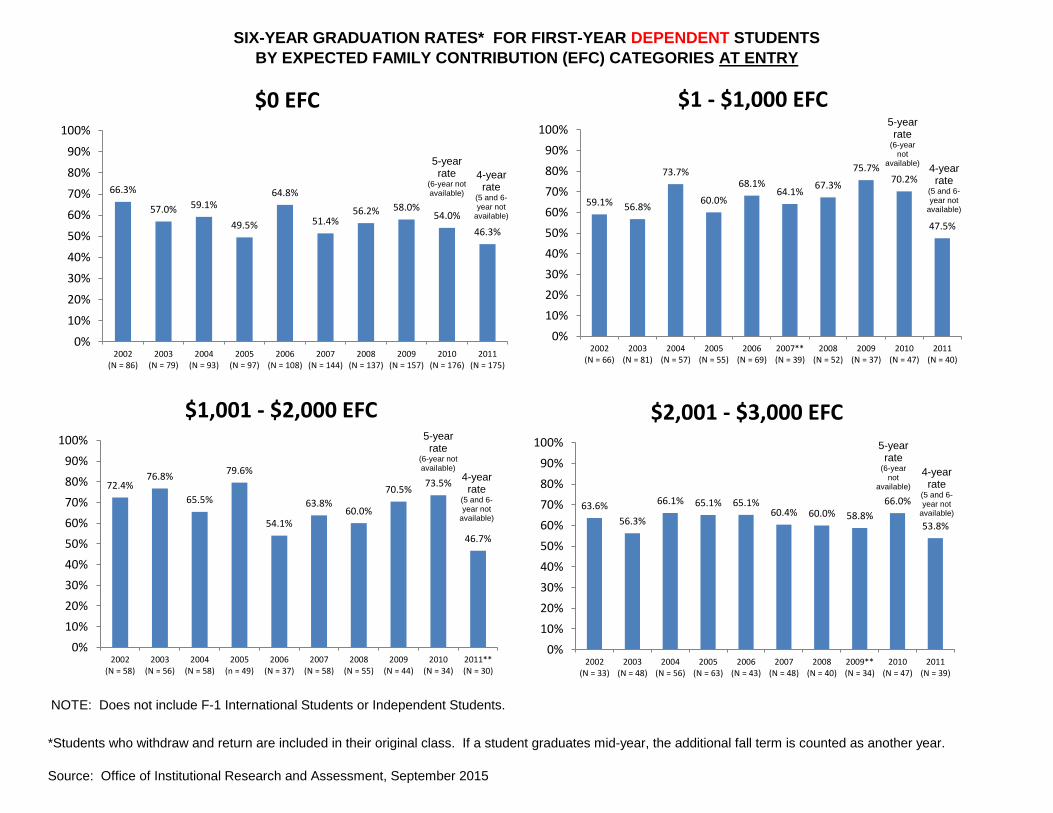
SIX-YEAR GRADUATION RATES* FOR FIRST-YEAR DEPENDENT STUDENTS
BY EXPECTED FAMILY CONTRIBUTION (EFC) CATEGORIES AT ENTRY
NOTE: Does not include F-1 International Students or Independent Students.
66.3%
57.0% 59.1%
49.5%
64.8%
51.4%56.2% 58.0%
54.0%
46.3%
0%
10%
20%
30%
40%
50%
60%
70%
80%
90%
100%
2002(N = 86)
2003(N = 79)
2004(N = 93)
2005(N = 97)
2006(N = 108)
2007(N = 144)
2008(N = 137)
2009(N = 157)
2010(N = 176)
2011(N = 175)
$0 EFC
5-year rate
(6-year not available)
4-year rate
(5 and 6-year not
available)
59.1% 56.8%
73.7%
60.0%
68.1%64.1%
67.3%
75.7%70.2%
47.5%
0%
10%
20%
30%
40%
50%
60%
70%
80%
90%
100%
2002(N = 66)
2003(N = 81)
2004(N = 57)
2005(N = 55)
2006(N = 69)
2007**(N = 39)
2008(N = 52)
2009(N = 37)
2010(N = 47)
2011(N = 40)
$1 - $1,000 EFC5-year rate
(6-year not
available)4-year rate
(5 and 6-year not
available)
72.4%76.8%
65.5%
79.6%
54.1%
63.8%60.0%
70.5%73.5%
46.7%
0%
10%
20%
30%
40%
50%
60%
70%
80%
90%
100%
2002(N = 58)
2003(N = 56)
2004(N = 58)
2005(n = 49)
2006(N = 37)
2007(N = 58)
2008(N = 55)
2009(N = 44)
2010(N = 34)
2011**(N = 30)
$1,001 - $2,000 EFC5-year rate
(6-year not available)
4-year rate
(5 and 6-year not
available)
63.6%
56.3%
66.1% 65.1% 65.1%60.4% 60.0% 58.8%
66.0%
53.8%
0%
10%
20%
30%
40%
50%
60%
70%
80%
90%
100%
2002(N = 33)
2003(N = 48)
2004(N = 56)
2005(N = 63)
2006(N = 43)
2007(N = 48)
2008(N = 40)
2009**(N = 34)
2010(N = 47)
2011(N = 39)
$2,001 - $3,000 EFC5-year rate
(6-year not
available)
4-year rate
(5 and 6-year not
available)
*Students who withdraw and return are included in their original class. If a student graduates mid-year, the additional fall term is counted as another year.
Source: Office of Institutional Research and Assessment, September 2015
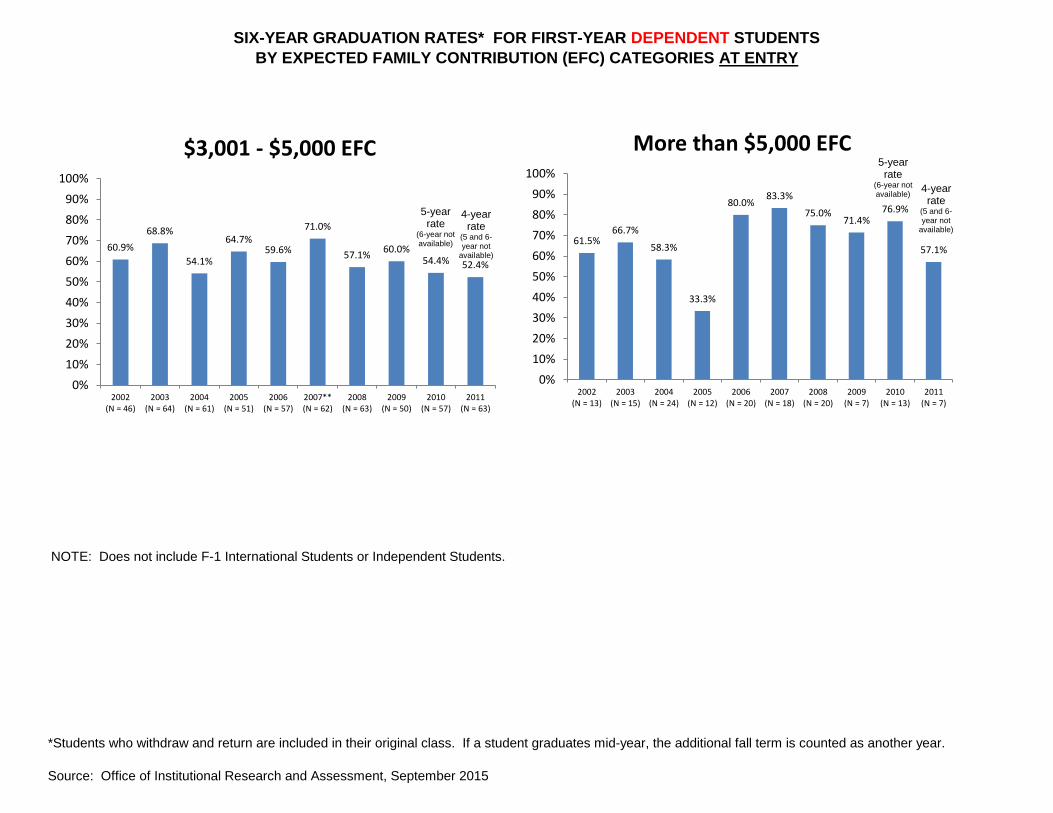
SIX-YEAR GRADUATION RATES* FOR FIRST-YEAR DEPENDENT STUDENTS
BY EXPECTED FAMILY CONTRIBUTION (EFC) CATEGORIES AT ENTRY
NOTE: Does not include F-1 International Students or Independent Students.
60.9%
68.8%
54.1%
64.7%59.6%
71.0%
57.1%60.0%
54.4% 52.4%
0%
10%
20%
30%
40%
50%
60%
70%
80%
90%
100%
2002(N = 46)
2003(N = 64)
2004(N = 61)
2005(N = 51)
2006(N = 57)
2007**(N = 62)
2008(N = 63)
2009(N = 50)
2010(N = 57)
2011(N = 63)
$3,001 - $5,000 EFC
5-year rate
(6-year not available)
4-year rate
(5 and 6-year not
available)
61.5%66.7%
58.3%
33.3%
80.0%83.3%
75.0%71.4%
76.9%
57.1%
0%
10%
20%
30%
40%
50%
60%
70%
80%
90%
100%
2002(N = 13)
2003(N = 15)
2004(N = 24)
2005(N = 12)
2006(N = 20)
2007(N = 18)
2008(N = 20)
2009(N = 7)
2010(N = 13)
2011(N = 7)
More than $5,000 EFC5-year rate
(6-year not available)
4-year rate
(5 and 6-year not
available)
*Students who withdraw and return are included in their original class. If a student graduates mid-year, the additional fall term is counted as another year.
Source: Office of Institutional Research and Assessment, September 2015
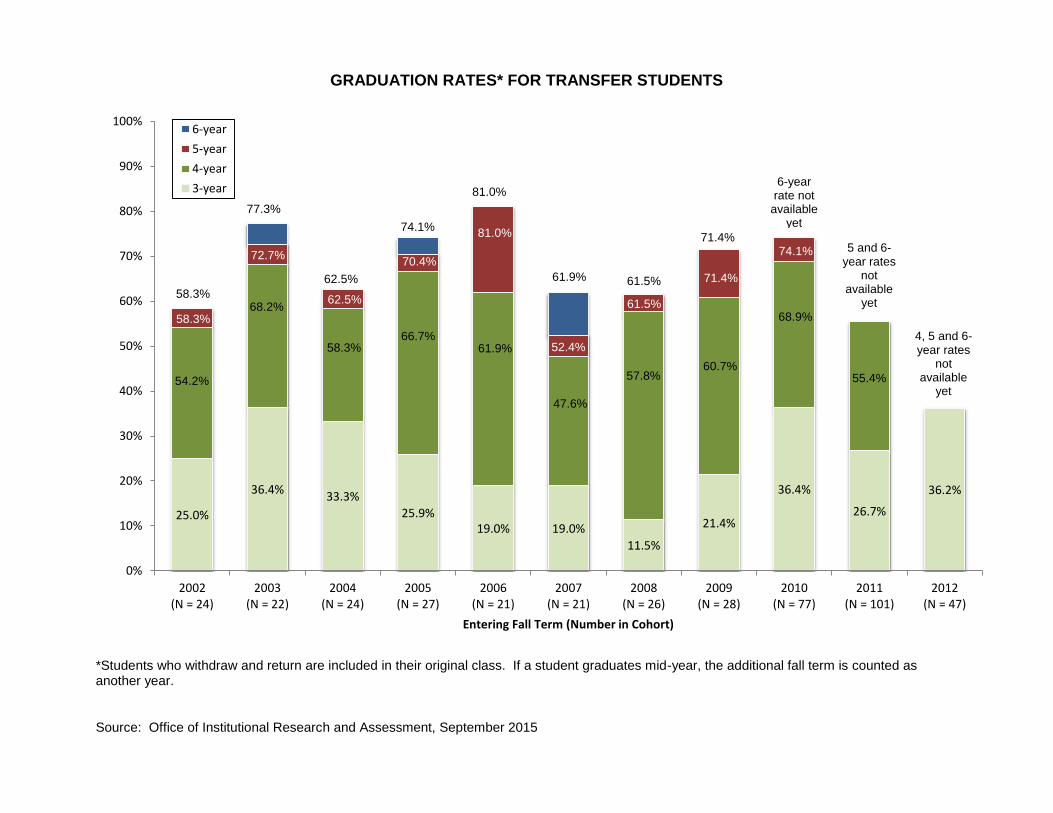
GRADUATION RATES* FOR TRANSFER STUDENTS
Source: Office of Institutional Research and Assessment, September 2015
69
*Students who withdraw and return are included in their original class. If a student graduates mid-year, the additional fall term is counted as another year.
25.0%
36.4%33.3%
25.9%19.0% 19.0%
11.5%
21.4%
36.4%
26.7%
36.2%
0%
10%
20%
30%
40%
50%
60%
70%
80%
90%
100%
2002(N = 24)
2003(N = 22)
2004(N = 24)
2005(N = 27)
2006(N = 21)
2007(N = 21)
2008(N = 26)
2009(N = 28)
2010(N = 77)
2011(N = 101)
2012(N = 47)
Entering Fall Term (Number in Cohort)
6-year
5-year
4-year
3-year
77.3%
62.5%
61.9% 52.4%
61.5%
71.4%
74.1%
58.3%
72.7%
81.0%
81.0%
61.9% 61.5%
71.4%5 and 6-
year rates not
available yet
58.3%
62.5%
70.4%
57.8%60.7%
68.9%
55.4%54.2%
68.2%
58.3%66.7%
74.1%
47.6%
4, 5 and 6-year rates
not available
yet
6-year rate not
available yet
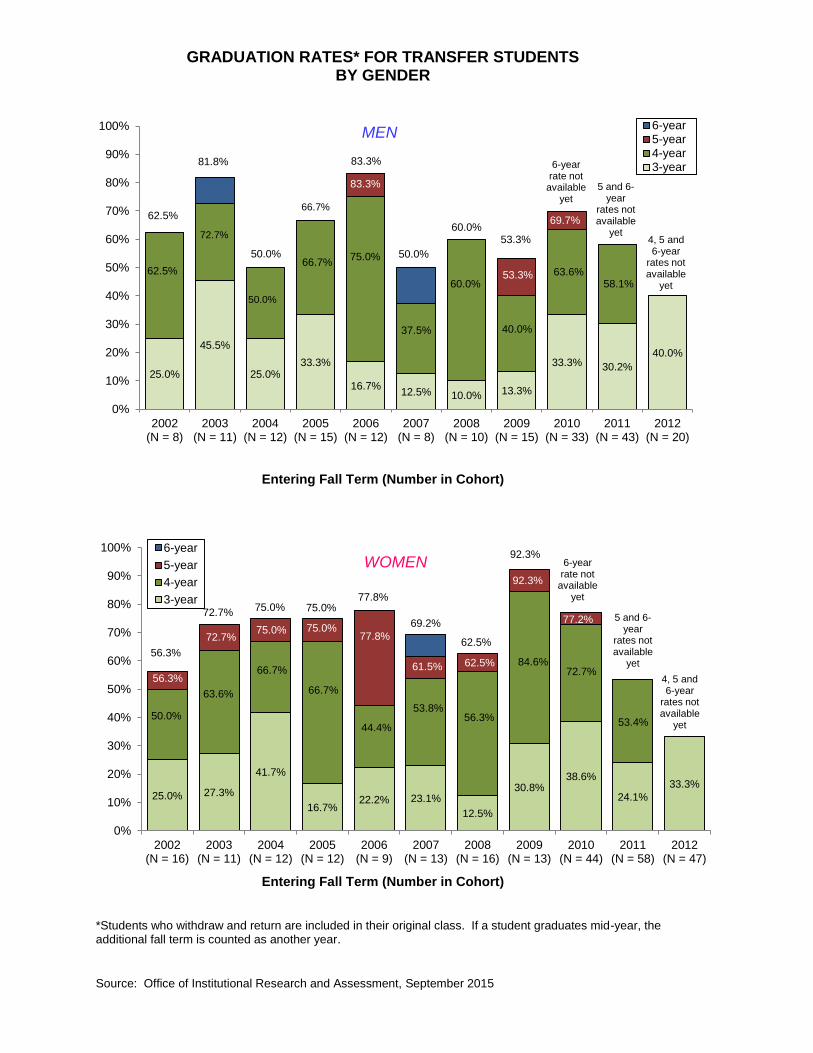
GRADUATION RATES* FOR TRANSFER STUDENTS BY GENDER
Source: Office of Institutional Research and Assessment, September 2015
Entering Fall Term (Number in Cohort)
Entering Fall Term (Number in Cohort)
*Students who withdraw and return are included in their original class. If a student graduates mid-year, the additional fall term is counted as another year.
25.0%
45.5%
25.0%33.3%
16.7%12.5% 10.0% 13.3%
33.3% 30.2%
40.0%
0%
10%
20%
30%
40%
50%
60%
70%
80%
90%
100%
2002(N = 8)
2003(N = 11)
2004(N = 12)
2005(N = 15)
2006(N = 12)
2007(N = 8)
2008(N = 10)
2009(N = 15)
2010(N = 33)
2011(N = 43)
2012(N = 20)
6-year5-year4-year3-year
5 and 6-year
rates not available
yet
6-year rate not
available yet
MEN
83.3%
40.0%
63.6%58.1%
62.5%
50.0%66.7%
75.0%
83.3%
4, 5 and 6-year
rates not available
yet
25.0% 27.3%
41.7%
16.7%22.2% 23.1%
12.5%
30.8%38.6%
24.1%
33.3%
0%
10%
20%
30%
40%
50%
60%
70%
80%
90%
100%
2002(N = 16)
2003(N = 11)
2004(N = 12)
2005(N = 12)
2006(N = 9)
2007(N = 13)
2008(N = 16)
2009(N = 13)
2010(N = 44)
2011(N = 58)
2012(N = 47)
6-year
5-year
4-year
3-year
5 and 6-year
rates not available
yet
6-year rate not
available yet
WOMEN
56.3%
61.5% 72.7%
53.4%50.0%
63.6%
66.7%
66.7%
75.0%
44.4%
77.8%
4, 5 and 6-year
rates not available
yet
62.5%
53.3%
53.3%
37.5%
60.0%
50.0%
60.0% 69.7%
53.8%
84.6%
92.3%
77.2%
56.3%
77.8%
69.2%
62.5%
92.3%
81.8%
62.5%
72.7%
72.7% 75.0%
56.3%
72.7%
50.0%
66.7%
75.0%
75.0%
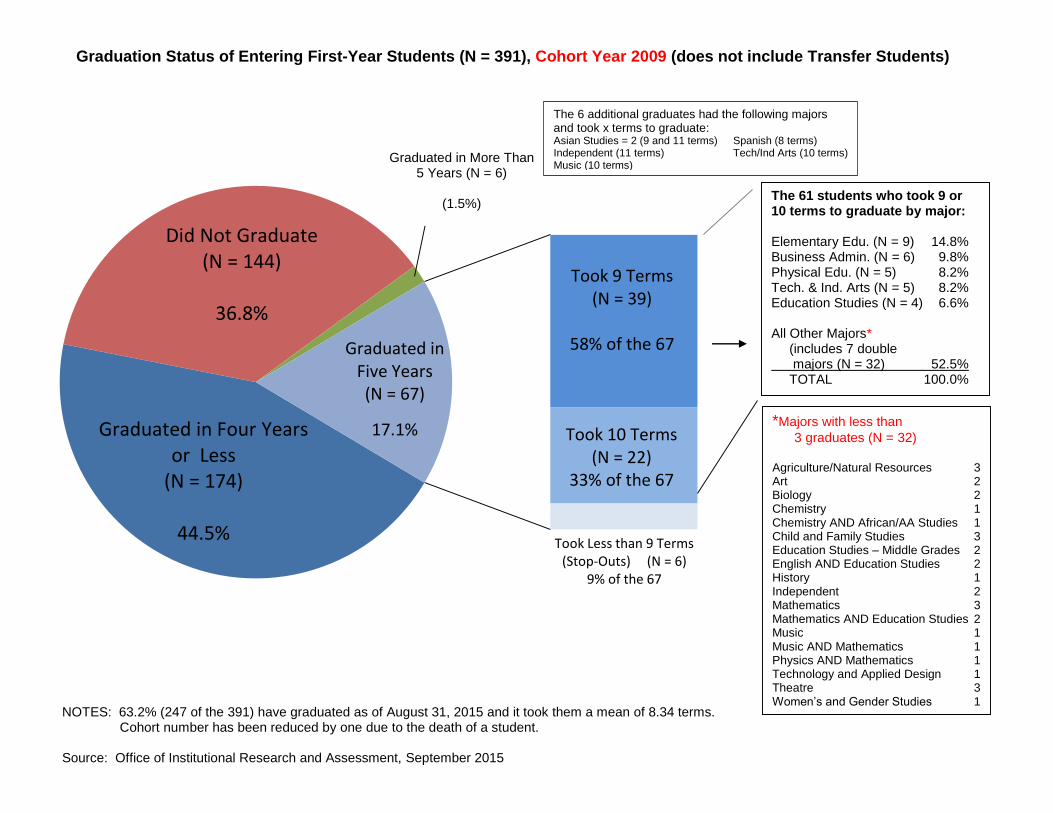
Graduation Status of Entering First-Year Students (N = 391), Cohort Year 2009 (does not include Transfer Students)
NOTES: 63.2% (247 of the 391) have graduated as of August 31, 2015 and it took them a mean of 8.34 terms. Cohort number has been reduced by one due to the death of a student. Source: Office of Institutional Research and Assessment, September 2015
Did Not Graduate(N = 144)
36.8%
Graduated in Four Years or Less
(N = 174)
44.5%
Graduated in Five Years(N = 67)
17.1%
Took 9 Terms(N = 39)
58% of the 67
Took 10 Terms(N = 22)
33% of the 67
Took Less than 9 Terms(Stop-Outs) (N = 6)
9% of the 67
Graduated in More Than 5 Years (N = 6)
(1.5%)
The 61 students who took 9 or 10 terms to graduate by major: Elementary Edu. (N = 9) 14.8% Business Admin. (N = 6) 9.8% Physical Edu. (N = 5) 8.2% Tech. & Ind. Arts (N = 5) 8.2% Education Studies (N = 4) 6.6% All Other Majors* (includes 7 double majors (N = 32) 52.5% TOTAL 100.0%
The 6 additional graduates had the following majors and took x terms to graduate: Asian Studies = 2 (9 and 11 terms) Spanish (8 terms) Independent (11 terms) Tech/Ind Arts (10 terms) Music (10 terms)
*Majors with less than
3 graduates (N = 32) Agriculture/Natural Resources 3 Art 2 Biology 2 Chemistry 1 Chemistry AND African/AA Studies 1 Child and Family Studies 3 Education Studies – Middle Grades 2 English AND Education Studies 2 History 1 Independent 2 Mathematics 3 Mathematics AND Education Studies 2 Music 1 Music AND Mathematics 1 Physics AND Mathematics 1 Technology and Applied Design 1 Theatre 3 Women’s and Gender Studies 1
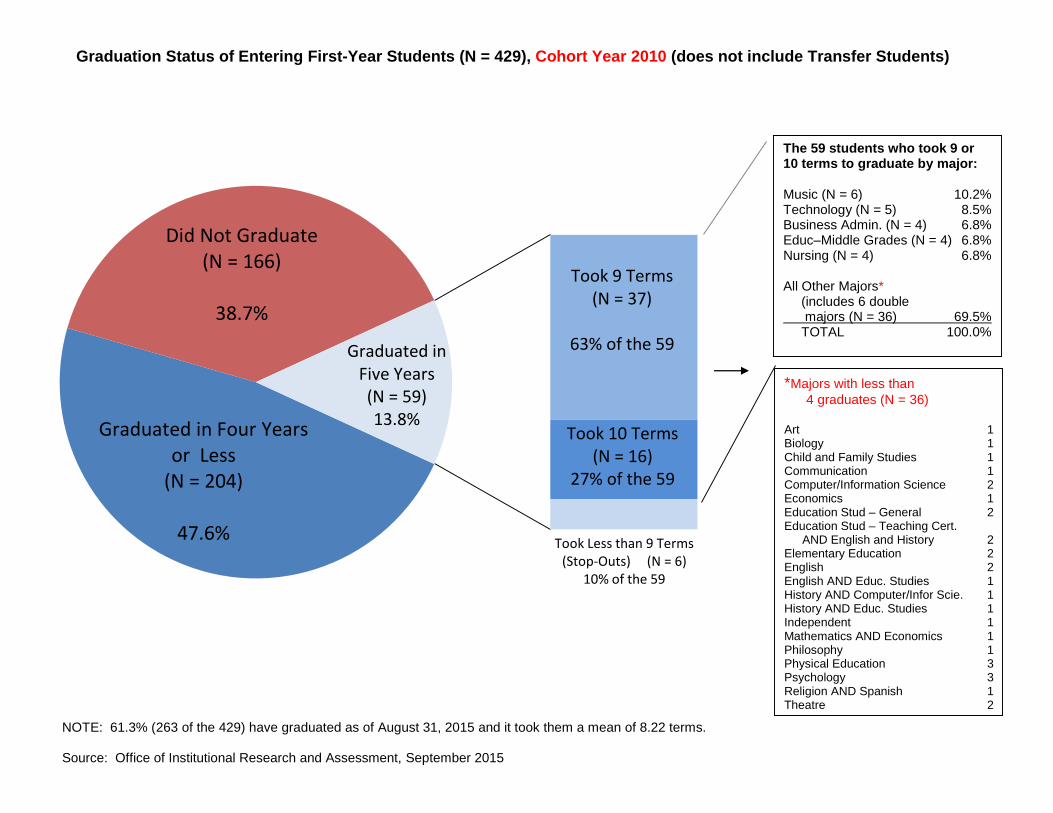
Graduation Status of Entering First-Year Students (N = 429), Cohort Year 2010 (does not include Transfer Students)
NOTE: 61.3% (263 of the 429) have graduated as of August 31, 2015 and it took them a mean of 8.22 terms. Source: Office of Institutional Research and Assessment, September 2015
Did Not Graduate(N = 166)
38.7%
Graduated in Four Years or Less
(N = 204)
47.6%
Graduated in Five Years(N = 59)13.8%
Took 9 Terms(N = 37)
63% of the 59
Took 10 Terms(N = 16)
27% of the 59
Took Less than 9 Terms(Stop-Outs) (N = 6)
10% of the 59
*Majors with less than
4 graduates (N = 36) Art 1 Biology 1 Child and Family Studies 1 Communication 1 Computer/Information Science 2 Economics 1 Education Stud – General 2 Education Stud – Teaching Cert. AND English and History 2 Elementary Education 2 English 2 English AND Educ. Studies 1 History AND Computer/Infor Scie. 1 History AND Educ. Studies 1 Independent 1 Mathematics AND Economics 1 Philosophy 1 Physical Education 3 Psychology 3 Religion AND Spanish 1 Theatre 2
The 59 students who took 9 or 10 terms to graduate by major: Music (N = 6) 10.2% Technology (N = 5) 8.5% Business Admin. (N = 4) 6.8% Educ–Middle Grades (N = 4) 6.8% Nursing (N = 4) 6.8% All Other Majors* (includes 6 double majors (N = 36) 69.5% TOTAL 100.0%