Embed Size (px)
Citation preview

Final Report
ENOW Hawaii: Exploring the Hawaii Ocean Economy through a Deeper Dive into the ENOW Dataset
July 2018
Eastern Research Group, Inc. Lexington, Massachusetts
Written under contract for the NOAA Office for Coastal Management www.coast.noaa.gov

NOAA ENOW Hawaii
ii
Eastern Research Group, Inc. Learn more at www.erg.com.
The Coastlines Group Learn more at www.coastlinesgroup.org.
Center for the Blue Economy Learn more at www.centerfortheblueeconomy.org.
Acknowledgements NOAA’s Office for Coastal Management would like to thank the following individuals that collaborated on this project. NOAA Project Team: Kate Quigley, Jeff Adkins, Camille Martineau, Jennifer Zhuang, and Jean Tanimoto. ERG Project Team: Charles Goodhue (Project Manager) (ERG), Dr. Charles S. Colgan (Middlebury Institute of International Studies at Monterey, Center for the Blue Economy), Dr. Christopher Hawkins (The Coastlines Group), and Doug Lyons (ERG). NOAA’s Office for Coastal Management “Coastal management” is the term used by communities and organizations striving to keep the nation’s coasts safe from storms, rich in natural resources, and economically strong. The national lead for these efforts is NOAA’s Office for Coastal Management (OCM), an organization devoted to partnerships, science, and good policy. Housed within the National Ocean Service, OCM oversees major initiatives that include the National Coastal Zone Management Program, Coral Reef Conservation Program, Digital Coast, and National Estuarine Research Reserve System.

NOAA ENOW Hawaii
iii
Table of Contents
Executive Summary ............................................................................................................................ 1 Ship and Boat Building Sector: GDP and Wage Discrepancy .......................................................... 1
Tourism and Recreation: Data Adjusted in an Island Setting ......................................................... 2 Living Resources: The Informal Fish Sales Market ........................................................................ 3
1. Introduction ............................................................................................................................... 4 2. Overview of ENOW and Previous Work ....................................................................................... 5
2.1 ENOW Data ......................................................................................................................... 5
2.2 Additional Ocean Dependent Industries: ENOW+ ................................................................. 6 3. Ship Building............................................................................................................................... 9
3.1 Background: The ENOW Ship Building Conundrum ............................................................... 9 3.2 Methods: Developing a More Accurate Estimate for Hawaii and Other States ..................... 11
3.2.1 Step 1. Designate defense and nondefense ship building estimates in the OESA ............ 12 3.2.2 Step 2. Reorganize QCEW data into defense and nondefense categories of ship building and repair. ................................................................................................................................... 12
3.2.3 Step 3. Substitute the defense and nondefense GDP estimates for OTE in calculating ENOW. ......................................................................................................................................... 13 3.2.4 Step 4. Re-estimate ENOW data series ............................................................................. 13
3.2.5 Other Issues ....................................................................................................................... 13 3.3 Results: Developing a Rough GDP Estimate for Ship and Boat Building ................................ 14
3.3.1 Reported Jobs and Wages ................................................................................................. 14
3.3.2 Estimated GDP .................................................................................................................. 14 4. Tourism and Recreation ............................................................................................................ 16
4.1 Background: The ENOW Issue ............................................................................................ 16 4.2 Methods and Limitations: Estimating the Tourism and Recreation Sector ............................ 17
4.3 Findings: The Size of Hawaii’s Tourism and Recreation Sector ............................................. 18 5. Living Resources: The Informal Fish Sales Market ...................................................................... 21
5.1 Background: The Issue ....................................................................................................... 21
5.2 Estimating the Informal Fishing Market .............................................................................. 23 5.3 Recommendations: Estimating the Size of the Informal Fishing Market ............................... 25
6. Recommendations: Other Ocean-Dependent Industries Beyond ENOW ..................................... 27 7. References ............................................................................................................................... 28

NOAA ENOW Hawaii
iv
List of Tables
Table ES-1. Total Ocean-Dependent Tourism and Recreation Sector in Hawaii .......................................... 2 Table 1-1. Hawaii Establishments, Employment, Wages, and GDP by ENOW Sector (2015) ....................... 4 Table 2-1. ENOW Sectors and Industries by NAICS ....................................................................................... 5 Table 2-2. ENOW+ Industries ........................................................................................................................ 7 Table 3-1. Ratio of Wages to Ship Building and Repair GDP (ENOW) and GDP (ENOW) to OTE (BEA) by state .............................................................................................................................................................. 9 Table 3-2. Comparison of Ship Building in ENOW and Public QCEW .......................................................... 11 Table 3-3. Comparison of Ship Building in ENOW and Public QCEW .......................................................... 12 Table 3-4. ENOW Data for Ship Building and Repair................................................................................... 14 Table 4-1. Establishment, Employment, Wages, and GDP in Hawaii Tourism and Recreation (2015) . Error! Bookmark not defined. Table 4-2. ENOW+ Location Quotient Adjusted Establishments, Employment, and Wages (2015) .... Error! Bookmark not defined. Table 4-3. Total Ocean-Dependent Tourism and Recreation Sector in Hawaii (2015) . Error! Bookmark not defined. Table 5-1. Establishments, Employment, Wages, and GDP in Hawaii Living Resources (2015) ........... Error! Bookmark not defined.

NOAA ENOW Hawaii
v
List of Figures
Figure ES-1. Hawaii Employment by ENOW Sector (2015) ........................................................................... 1 Figure 5-1. Estimate of the Informal Fishing Market in Hawaii .................................................................. 24

NOAA ENOW Hawaii
1
Executive Summary
Hawaii’s economy has a strong dependency on the ocean. The National Oceanic and Atmospheric Administration’s (NOAA) Economics: National Ocean Watch (ENOW) dataset provides an annual time series of employment, establishment, wage, and gross domestic product data for 47 industries grouped into six ocean-dependent ENOW sectors. In 2015, this included over 114,000 employees across the six ENOW sectors, which are presented in Figure ES-1.
Figure ES-1. Hawaii Employment by ENOW Sector (2015)
This report explores a few issues with ENOW data and opportunities to estimate more accurate economic indicators for the ocean-dependent economy in three of the ENOW sectors: ship and boat building, tourism and recreation, and living resources.
Ship and Boat Building Sector: GDP and Wage Discrepancy Hawaii presents a problem in the ENOW data for the ship building and repair industry. In some states, the wages reported from the Bureau of Labor Statistics’ (BLS) Quarterly Census of Employment and Wages (QCEW) can exceed the calculated gross domestic product (GDP), which should not happen as wages are only one component of the value measured in the GDP-state series and should always be less than GDP. In 2015, reported wages for the ship and boat building sector in Hawaii were $479.9 million while GDP was reported at $70.8 million.
This report presents a four-step method to rectify the discrepancy:
• Step 1. Designate defense and nondefense shipbuilding estimates in the Bureau of Economic Analysis Ocean Economy Satellite Account (OESA).
• Step 2. Reorganize QCEW data into defense and nondefense categories of ship building and ship repair.

NOAA ENOW Hawaii
2
• Step 3. Substitute the defense and nondefense GDP value added estimates for other transportation equipment in calculating ENOW.
• Step 4. Re-estimate ENOW data series.
While we have not implemented this because OESA data are not available yet, we have developed a rough order of magnitude estimate based GDP to wage ratios for 13 states (excluding Hawaii and three other states that have the same GDP issue) with Ship Building and Repair (NAICS 336611) industries. We estimate the Pearl Harbor Naval Shipyard (the only shipbuilding facility on the island) supported 4,771 jobs (BLS QCEW, 2018), approximately $430 million in annual total wages, and contributed in the range of $480 to $1,250 million in GDP. Adding back in the contribution from the private sector, we estimate the revised GDP for the Ship and Boat Building ENOW sector (for 2015) will be revised from $70 million to about $830 million (with a range of $550 to $1,320 million) once the more accurate methodology outlined in Section 4.2 of this report is implemented.
Tourism and Recreation: Data Adjusted in an Island Setting The tourism and recreation ENOW sector is a large component of Hawaii’s economy and in 2015 employed 103,000 of 638,000 (16 percent) total private and government employees in the state (BLS QCEW, 2018). In an island setting, however, the ocean-dependent tourism and recreation industry may be larger than indicated by the traditional ENOW sectors. A wide variety of economic activities that are not typically ocean dependent for other coastal states tend to be partially or completely dependent on the ocean in an island setting. For example, jewelry stores, gift and novelty stores, and passenger car rentals may primarily depend on tourists who are primarily visiting for ocean-related activities.
To incorporate this economic activity, Section 5 of this report presents a method to consider the ocean-dependent contribution of these additional sectors. Using location quotients (the relative concentration of establishments, employment, and wages), we identified tourism and recreation-related industries that were more concentrated in Hawaii relative to the rest of the United States and calculated an adjusted number of establishments, employment, and wages (those above and beyond the average concentration in the United States). Table ES-1 shows these additional (ENOW+) industries account for another 15,000 ocean-dependent jobs and nearly 1,400 establishments beyond those already included in the traditional ENOW industries. These ENOW+ industries included clothing stores, gift and jewelry stores, passenger transportation, and sightseeing, among others.
Table ES-1. Total Ocean-Dependent Tourism and Recreation Sector in Hawaii
Establishments Employment Wages (million)
ENOW Total 3,893 102,606 $3,234.9
(Adjusted) ENOW+ Total 1,376 15,432 $513.2
Total for Tourism and Recreation Sector 5,269 118,038 $3,748.1

NOAA ENOW Hawaii
3
Living Resources: The Informal Fish Sales Market There is no comprehensive enumeration of Hawaii’s informal fishing marketplace. While an important part of the ocean economy, the 938 employees in ENOW’s living resources sector do not include those partaking in informal fish sales. An enumeration of economic activity in this sector has been hindered by the nature of these informal outlets and lack of a State marine recreational fishing license. Therefore, estimating the contribution of the informal marketplace to Hawaii’s ocean economy is difficult. In this report, we examine the size of Hawaii’s informal fishing market by examining some recent research.
Based on the findings of recent published research, the sales of Hawaii’s nearshore informal fishing marketplace would appear to range between $370,000 and $1.65 million dollars of revenue per year (total of unlicensed sales from commercial and non-commercial) plus an additional approximately $6 million to $13 million (based on market prices) caught by nearshore non-commercial fisherman for subsistence—this is all economic activity not captured by the NOAA ENOW Living Resources sector. In addition, the same market issues, conditions, and considerations apply to pelagic and bottomfish species, which are often higher value and more plentiful. Thus, the total informal market (not captured by ENOW) is likely to be several orders of magnitude greater than the estimate for nearshore fisheries.

NOAA ENOW Hawaii
4
1. Introduction The National Oceanic and Atmospheric Administration’s (NOAA) Economics: National Ocean Watch (ENOW) dataset provides an annual time series of employment, establishment, wage, and gross domestic product (GDP) data for all 30 U.S. coastal and Great Lakes states as far back as 2005. ENOW covers 47 6-digit NAICS industries across six ocean and Great Lakes-dependent sectors of the economy (Living Resources, Marine Construction, Marine Transportation, Offshore Mineral Resources, Ship and Boat Building, and Tourism and Recreation).
ENOW data play an important role in characterizing and determining the importance of the ocean economies of the United States, states, and sub-state regions, as well as enhancing our understanding of the economic impacts of natural and human-made disasters, such as hurricanes and oil spills. Most importantly, ENOW allows NOAA and other stakeholders to clearly describe the importance of the ocean and coastal economies and to access such information for policy development. ENOW data can be used to support a wide variety of analyses that are important to making the case for coastal protection and investment in coastal resources, as well as selecting the most appropriate management approach from among a suite of alternatives.
Table 1-1 shows 2015 values for various economic indicators by the six ENOW ocean-dependent sectors (NOAA ENOW, 2018).
Table 1-1. Hawaii Establishments, Employment, Wages, and GDP by ENOW Sector (2015) ENOW Sector Establishments Employment Wages (million) GDP (million)
Marine Construction 28 1,128 $117.4 $223.0 Living Resources 123 938 $35.9 $86.2 Offshore Mineral Extraction 10 110 $13.0 $42.8 Ship and Boat Building 23 5,551 $479.9 $70.8 Tourism and Recreation 3,893 102,606 $3,234.9 $6,958.1 Marine Transportation 107 3,828 $289.4 $670.7 All Ocean-dependent Sectors 4,184 114,164 $4,170.5 $8,051.6
The objectives of this report include:
1. Develop a method to adjust data for the shipbuilding and repair sector that rectifies the discrepancy between GDP and wages in Hawaii (and other states with similar discrepancies) caused by how BLS and the U.S. Bureau of Economic Analysis (BEA) capture government employment data differently. Additionally, develop an interim rough estimate of GDP for Hawaii’s Ship and Boat Building sector.
2. Develop adjusted economic data for the tourism and recreation industry in Hawaii, which expands beyond the traditional ENOW tourism and recreation sector.
3. Estimate the size of the subsistence and informal fishing market in Hawaii.

NOAA ENOW Hawaii
5
2. Overview of ENOW and Previous Work
2.1 ENOW Data NOAA collects, synthesizes, and publishes annual time series data via its ENOW program. NOAA currently uses industry-level (6-digit NAICS) establishment-level data from BLS QCEW and state-level BEA data as the basis for ENOW. The purpose of the ENOW program and ENOW data sets is to identify and communicate the contribution of ocean- and Great Lakes-dependent economic activities to the overall economy of a state, county, or region. NOAA has identified six ocean or Great Lakes-dependent sectors. NOAA OCM currently identifies six sectors as ocean- or Great Lakes-dependent:
• Living Resources • Marine Construction • Marine Transportation • Offshore Mineral Resources • Ship and Boat Building • Tourism and Recreation
Table 2-1 shows the six ocean- or Great Lakes-dependent sectors are comprised of 47 ocean or Great Lakes-dependent industries that the ENOW program covers (NOAA).
Table 2-1. ENOW Sectors and Industries by NAICS Sector General Industry NAICS NAICS Industry
Living Resources
Fishing Hatcheries and Aquaculture
112511 Finfish Farming and Fish Hatcheries 112512 Shellfish Farming 112519 Other Aquaculture
Fishing 114111 Finfish Fishing 114112 Shellfish Fishing 114119 Other Marine Fishing
Seafood Processing 311710 Seafood Product Preparation and Packaging Seafood Markets 445220 Fish and Seafood Markets
Marine Construction Marine Related Construction 237990 Other Heavy and Civil Engineering Construction
Marine Transportation
Deep Sea Freight 483111 Deep Sea Freight Transportation 483113 Coastal and Great Lakes Freight Transportation
Marine Passenger Transportation
483112 Deep Sea Passenger Transportation 483114 Coastal and Great Lakes Passenger Transportation
Marine Transportation Services
488310 Port and Harbor Operations 488320 Marine Cargo Handling 488330 Navigational Services to Shipping
488390 Other Support Activities for Water Transportation
Search and Navigation Equipment 334511 Search, Detection, Navigation, Guidance, Aeronautical
and Nautical System and Instrument Manufacturing

NOAA ENOW Hawaii
6
Sector General Industry NAICS NAICS Industry
Warehousing 493110 General Warehousing and Storage 493120 Refrigerated Warehousing and Storage 493130 Farm Product Warehousing and Storage
Offshore Mineral Resources
Limestone, Sand and Gravel 212321 Construction Sand and Gravel Mining 212322 Industrial Sand Mining
Oil and Gas Exploration and Production
211111 Crude Petroleum and Natural Gas Extraction 211112 Natural Gas Liquid Extraction 213111 Drilling Oil and Gas Wells 213112 Support Activities for Oil and Gas Operations 541360 Geophysical Exploration and Mapping Services
Ship and Boat Building
Boat Building and Repair 336612 Boat Building and Repair
Ship Building and Repair 336611 Ship Building and Repair
Tourism and Recreation
Boat Dealers 441222 Boat Dealers
Eating and Drinking Places
722511 Full Service Restaurants 722513 Limited Service Eating Places 722514 Cafeterias 722515 Snack and Nonalcoholic Beverage Bars
Hotels and Lodging 721110 Hotels (except Casino Hotels) and Motels 721191 Bed and Breakfast Inns
Marinas 713930 Marinas
Recreational Vehicle Parks and Campsites 721211 RV Parks and Recreational Camps
Scenic Water Tours 487210 Scenic and Sightseeing Transportation, Water Sporting Goods 339920 Sporting and Athletic Goods Manufacturing
Amusement and Recreation Services
487990 Scenic and Sightseeing Transportation, Other 611620 Sports and Recreation Instruction
532292 Recreation Goods Rental
713990 Amusement and Recreation Services Not Elsewhere Classified
Zoos and Aquaria 712130 Zoo and Botanical Gardens 712190 Nature Parks and Other Similar Institutions
2.2 Additional Ocean Dependent Industries: ENOW+ On islands, especially remote islands, a wide variety of economic activities that are not typically ocean dependent for other coastal states tend to be partially or completely dependent on the ocean. For example, airport or taxi operations may depend almost entirely on tourists who visit primarily for ocean-related activities. If this ocean-dependent tourism suddenly stopped, airport and most taxi operations would be significantly reduced. To better characterize the economic activities that are partially or completely ocean-dependent in island territories, NOAA sponsored studies in Puerto Rico, the U.S. Virgin Islands, American Samoa, Guam, and the Commonwealth of the Mariana Islands. These NOAA studies identified industries outside of the traditional

NOAA ENOW Hawaii
7
ENOW framework that are partially or wholly ocean dependent and which NOAA has labeled ENOW+ industries. The ENOW+ industries generated by NOAA are listed below in Table 2-2.
Table 2-2. ENOW+ Industries Sector NAICS NAICS Industry
Living resources
424460 Fish and Seafood Merchant Wholesalers 445210 Meat Markets 541620 Environmental Consulting Services 813312 Environment and Conservation Organizations 924120 Administration of Conservation Programs
Marine Construction 236220 Commercial and Institutional Building Construction 541330 Engineering Services 541370 Other Surveying and Mapping Services
Marine Transportation
483212 Inland Water Passenger Transportation 484110 General Freight Trucking, Local 488510 Freight Transportation Arrangement 493190 Other Warehousing and Storage
Tourism and Recreation
448110 Men’s Clothing Stores 448120 Women’s Clothing Stores 448310 Jewelry Stores 448320 Luggage and Leather Goods Stores 453220 Gift, Novelty, and Souvenir Stores 485310 Taxi Service 487110 Scenic and Sightseeing Transportation, Land 481111 Scheduled Passenger Air Transportation 481211 Nonscheduled Air Passenger Chartering 481219 Other Non-scheduled Air Transportation 488111 Air Traffic Control 488119 Other Airport Operations 488190 Other Support Activities for Air Transport 512110 Motion Picture and Video Production 531110 Lessors of Residential Buildings 531210 Offices of Real Estate Agents and Brokers 531311 Residential Property Managers 531312 Nonresidential Property Managers 532111 Passenger Car Rental 541922 Commercial Photography 561311 Employment Placement Agencies 561320 Temporary Help Services 561510 Travel Agencies 561520 Tour Operators 561599 All Other Travel Arrangement Services

NOAA ENOW Hawaii
8
Sector NAICS NAICS Industry 712120 Historical Sites 721120 Casino Hotels 721199 All Other Traveler Accommodation 722410 Drinking Places, Alcoholic Beverages 812199 Other Personal Care Services

NOAA ENOW Hawaii
9
3. Ship Building
3.1 Background: The ENOW Ship Building Conundrum Hawaii presents a problem in the ENOW data for the ship building and repair industry. In some states, the shipbuilding and repair wages reported from the QCEW can exceed the shipbuilding and repair calculated GDP, which should not happen as wages are only one component of the value added measured in the GDP-state series and should always be less than GDP. In 2015, reported wages for the ship and boat building sector in Hawaii were $479.9 million while GDP was reported at $70.8 million (NOAA ENOW, 2018). A similar problem exists in Maine, where wages in ship and boat building in 2015 were reported as $862.2 million and GDP as $726.2 million.
The problem arises because the GDP-state category used for calculating the ENOW GDP figure is Other Transportation Equipment (OTE), a broad category that includes all transportation equipment that is not automobile related. The wage/GDP discrepancy in Hawaii is due to Ship and boat building in the QCEW coming from both privately owned shipyards and federal government-owned shipyards (which all belong to the Navy), and Ship building and repair for the government being counted in government GDP-state, not in OTE. The result is a complicated mixture of data across the states.
The middle column of Table 3-1 shows the ratio of ENOW wages in Ship Building and Repair (SBR) to the ENOW GDP estimate. There is substantial variation across the states where disclosure is permitted (empty cells are non-disclosed). There is substantial variation in the wage/GDP ratio for ship building. Across all (disclosed) coastal states, wages are 68.2 percent of GDP in the ship building industry. The cells highlighted in red show wage ratios higher than this average; non-highlighted cells are below the average. The issue in Maine is shown by a ratio of 1.187 wages to GDP.
Table 3-1. Ratio of Wages to Ship Building and Repair GDP (ENOW) and GDP (ENOW) to OTE (BEA) by state
State SBR Wage/ SBR GDP SBR GDP / OTE GDP Alabama
Alaska 0.864 0.714
California 0.560 0.058 Connecticut
Delaware
Florida 0.638 0.106 Georgia
Hawaii
Illinois Indiana
Louisiana 0.532 0.600
Maine 1.187 0.804 Maryland 0.576 0.062
Massachusetts 0.894 0.009
Michigan

NOAA ENOW Hawaii
10
State SBR Wage/ SBR GDP SBR GDP / OTE GDP Minnesota
Mississippi 0.739 0.912
New Hampshire New Jersey
New York 0.454 0.071
North Carolina Ohio
Oregon 0.769 0.214
Pennsylvania Rhode Island 0.484 0.858
South Carolina 0.801 0.036
Texas 0.398 0.054 Virginia 0.824 0.951
Washington 0.349 0.098
Wisconsin 0.343 0.192 All Coastal States 0.623 0.132
The right-hand column in Table 3-1 shows the ratio of ENOW-estimated GDP in ship building to OTE estimates from BEA. The average ratio is 13.2 percent, a hint that some ship building activity may be missing given the complexity and cost of naval ships. The cells highlighted in green are those whose ship building to OTE GDP is above average. States with very low ratios, such as Washington, South Carolina, New York, Maryland, and California are states where other industries make up the OTE sector. In most cases, such as Washington, South Carolina, Texas, and California, the largest OTE industry is aircraft manufacturing. However, states such as Virginia and Maine show very high proportions of GDP-S in ship and boat building, and almost all of the ship building in these states is for the Navy. The problem appears to be that ship building for the Navy when done in private yards such as those of General Dynamics (Bath Iron Works) and Litton-Ingalls (Newport News) is counted in ship building by BEA, but in government GDP when performed at a Navy-owned facility. For the QCEW, however, both private and Navy shipyards are in NAICS 336611.
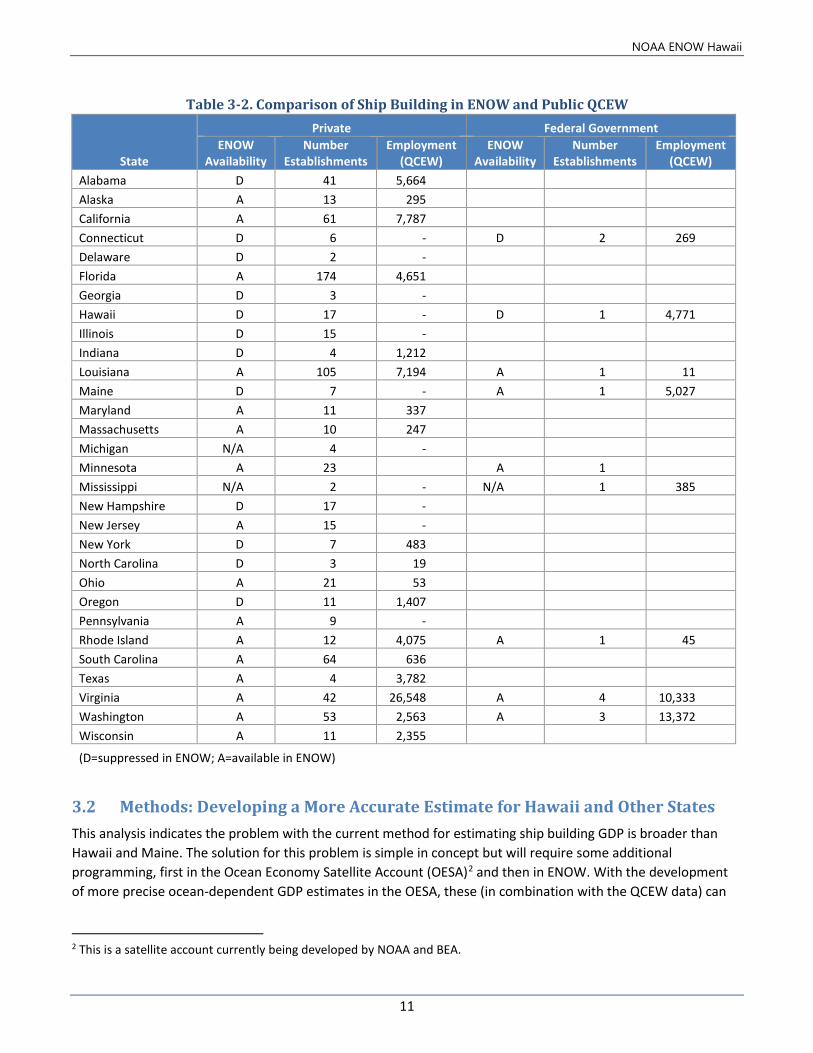
Table 3-2 provides additional detail on how the private/federal government ownership characteristics of shipyards are displayed in the ENOW and the public QCEW data. Note that in some states such as Connecticut and Hawaii, the data on Navy shipyards is not disclosed in ENOW but is disclosed in the public data. In ENOW, the ownership classes are combined, creating a disclosure problem in states where there are large private facilities (like Electric Boat in Connecticut) which cause the suppression under the p-percent rule.1
1 The p-percent rule is a statistical test designed to prevent disclosure of the largest two values in a distribution. See Sullivan, C. 1992 An Overview of Disclosure Principles Washington: Bureau of the Census. https://www.census.gov/srd/papers/pdf/rr92-09.pdf
NOAA ENOW Hawaii
11
Table 3-2. Comparison of Ship Building in ENOW and Public QCEW
State
Private Federal Government ENOW
Availability Number
Establishments Employment
(QCEW) ENOW
Availability Number
Establishments Employment
(QCEW) Alabama D 41 5,664 Alaska A 13 295 California A 61 7,787 Connecticut D 6 - D 2 269 Delaware D 2 - Florida A 174 4,651 Georgia D 3 - Hawaii D 17 - D 1 4,771 Illinois D 15 - Indiana D 4 1,212 Louisiana A 105 7,194 A 1 11 Maine D 7 - A 1 5,027 Maryland A 11 337 Massachusetts A 10 247 Michigan N/A 4 - Minnesota A 23 A 1 Mississippi N/A 2 - N/A 1 385 New Hampshire D 17 - New Jersey A 15 - New York D 7 483 North Carolina D 3 19 Ohio A 21 53 Oregon D 11 1,407 Pennsylvania A 9 - Rhode Island A 12 4,075 A 1 45 South Carolina A 64 636 Texas A 4 3,782 Virginia A 42 26,548 A 4 10,333 Washington A 53 2,563 A 3 13,372 Wisconsin A 11 2,355
(D=suppressed in ENOW; A=available in ENOW)
3.2 Methods: Developing a More Accurate Estimate for Hawaii and Other States This analysis indicates the problem with the current method for estimating ship building GDP is broader than Hawaii and Maine. The solution for this problem is simple in concept but will require some additional programming, first in the Ocean Economy Satellite Account (OESA)2 and then in ENOW. With the development of more precise ocean-dependent GDP estimates in the OESA, these (in combination with the QCEW data) can
2 This is a satellite account currently being developed by NOAA and BEA.

NOAA ENOW Hawaii
12
be used in place of the GDP-S Other Transportation Equipment estimates to improve the ENOW GDP estimates for ship building. To do this will require the following steps:
3.2.1 Step 1. Designate defense and nondefense ship building estimates in the OESA
Table 3-3 shows the ship building and repair product codes from the BEA benchmark I/O accounts and a designation of whether they should be designated as defense or nondefense.
Table 3-3. Comparison of Ship Building in ENOW and Public QCEW BEA I-O Code BEA I-O Code Description Defense Nondefense
3366113366111 Nonpropelled ships, new construction
3366113366113 Military self-propelled ships (incl. combat ships, troop transport vessels, fleet auxiliaries, & svc craft), new constr.
3366113366116100 Nonmilitary self-propelled yachts, 65 ft or more in length (requires a professional crew as specified by the Coast Guard)
3366113366116110 Nonmilitary self-propelled ferryboats, new construction
3366113366116120 Other nonmilitary ships (including container and trailer ships, dry bulk carriers, and tankers)
33661133661161X Self-propelled nonmilitary commercial fishing trawlers and vessels, tugboats, and support vessels for offshore drilling and mining
3366113366116Y Self-propelled ships, nonmilitary, new construction, nsk 3366113366118 Ship repair, military 336611336611A Ship repair, nonmilitary 336611336611W Ship building and repairing, nsk, total 336611AO Ship building and repairing Other Miscellaneous Receipts 336611CW Ship building and repairing Contract Work 336611IC Ship building and repairing Inventory Change 336611RSL Ship building and repairing Value of Resales 336611SCRAP Ship building and repairing Sales of Scrap and Refuse
Activity codes for “Defense Ship Building” and “Nondefense Ship Building) should be assigned to these product codes so that the OESA can show the total industry (defense + nondefense) and the separate categories.
3.2.2 Step 2. Reorganize QCEW data into defense and nondefense categories of ship building and repair.
Reorganizing QCEW ship building and repair data into defense and nondefense categories will require creating two industries in the ENOW categorization, will need to be done in two stages, and will have to be done with the confidential establishment data.
A. Federal Shipyards. Designate all “Federal Government” ownership shipyards as “Defense ship building and repair”. These are almost exclusively repair and maintenance facilities.

NOAA ENOW Hawaii
13
B. Non-Federal Shipyards. Other private ship building yards that build for the Navy will have to be individually designated, but there are relatively few of them, so it should be possible to identify the major ones. These would include:
• Austal USA (Alabama) • Bath Iron Works (Maine) • Electric Boat (Connecticut) • Ingalls Shipyard (Mississippi) • National Steel and Shipbuilding (California) • Newport News Shipbuilding (Virginia)
Other shipyards could be identified from various sources.3
The usual confidentiality screens would be run, but it would be possible to divide ship building and repair into defense and nondefense, total for ship building, and then total for ship and boat building. This would provide more detail and might permit data disclosure of the states where Navy shipyards are not disclosed (like Hawaii), though complementary suppressions may still be necessary.
3.2.3 Step 3. Substitute the defense and nondefense GDP estimates for OTE in calculating ENOW.
The same basic calculation for estimating GDP for ship building can be used, but rather than the state-level GDP-S OTE, the national totals of GDP value added from ship building and repair will need to be disaggregated to the state and county levels. Totals for wages in ship building at the national level will be required (which may present some issues for non-participating states, none of which are major ship building states). This would need to be done first to the state level and then to the county level.
3.2.4 Step 4. Re-estimate ENOW data series The ENOW data series should be re-estimated using this procedure back to 2006, but this would require that the defense and nondefense portions of ship building be calculated for each year. The result of this re-estimation will be a significant change in the ship and boat building sector and in the total ocean GDP estimated by ENOW. Employment, establishments, and wages should not change in aggregate, though disclosures probably will.
The methods to make the adjustments for the next generation of ENOW data should be applicable to earlier years. In addition, GDP numbers for the categories in Table 3-3 should be provided for each year by BEA. This should be relatively simple as all the output will be in defense and nondefense federal government final demand.
3.2.5 Other Issues
There are several categories of federal government ships whose designation as defense versus nondefense requires additional information. These include NOAA Research Vessels, Coast Guard cutters and buoy tenders, and Military Transport Service vessels, which serve the Navy but are crewed by civilian personnel. There are also
3 See for example: https://www.bts.gov/archive/publications/maritime_trade_and_transportation/2007/table_07_01

NOAA ENOW Hawaii
14
defense vessels classified as boats which the current boat data for GDP may not pick up. Access to DOD procurement information, which should be mostly public, would allow a more detailed look at these categories.
3.3 Results: Developing a Rough GDP Estimate for Ship and Boat Building While we have not implemented the method proposed in Section 3.2 to calculate Ship Building and Repair GDP, we have developed a rough estimate using GDP to wage ratios from other states with private ship building wage (from BLS QCEW) and GDP data (from BEA), which are part of the ENOW dataset.
3.3.1 Reported Jobs and Wages The 2015 ENOW data for Hawaii’s Ship and Boat Building sector report the following figures (NOAA ENOW, 2018):
• employment: 5,551 • wages: $479.9 million • gross domestic product: $70.8 million
Employment and wage statistics are derived from BLS QCEW (2018) data, which include the Pearl Harbor Navy Shipyard as part of the shipbuilding sector. Gross domestic product is derived from BEA’s GDP by State statistics, which do not include the Navy shipyard as part of the shipbuilding sector; instead, it is counted as part of the federal government sector. As a consequence, gross domestic product for ENOW’s Ship and Boat Building sector is significantly understated, with the $70.8 million in gross domestic product accounting for only private sector shipbuilding and maintenance activities, boat building, and boat repairs.
3.3.2 Estimated GDP To develop a rough estimate of GDP for Hawaii Ship Building and Repair (NAICS 336611), we developed GDP to wage ratios for all states in the U.S. with Ship Building and Repair data in ENOW except we removed those four states with government naval shipyards (Hawaii, Maine, Virginia, and Washington) because their GDP was not included in the ENOW estimates as highlighted in Section 3.1 of this report. Table 3-4 shows the weighted average GDP to wage ratio was 1.77 across all states, the minimum was 1.12 (Massachusetts), the maximum was 2.92 (Wisconsin), and 9 of the 13 states fell in the narrower GDP to wage ratio range of 1.25 to 2.06.
Table 3-4. ENOW Data for Ship Building and Repair State Establishments Employment Wages GDP GDP/Wage Ratio
Alaska 13 294 $15,411,298 $17,846,134 1.16 California 64 7,787 $514,900,768 $918,805,995 1.78 Florida 190 4,675 $257,730,820 $403,883,656 1.57 Louisiana 108 7,205 $432,232,057 $813,161,852 1.88 Maryland 11 337 $19,280,115 $33,466,424 1.74 Massachusetts 10 247 $11,643,742 $13,030,930 (Min) 1.12 Mississippi 26 13,458 $839,141,345 $1,134,809,578 1.35 New York 15 483 $42,680,091 $94,089,275 2.2 Oregon 20 1,406 $104,303,004 $135,562,246 1.3 Rhode Island 10 4,119 $247,743,853 $511,499,817 2.06 South Carolina 12 636 $32,651,429 $40,744,777 1.25 Texas 67 3,782 $250,937,003 $630,895,794 2.51
NOAA ENOW Hawaii
15
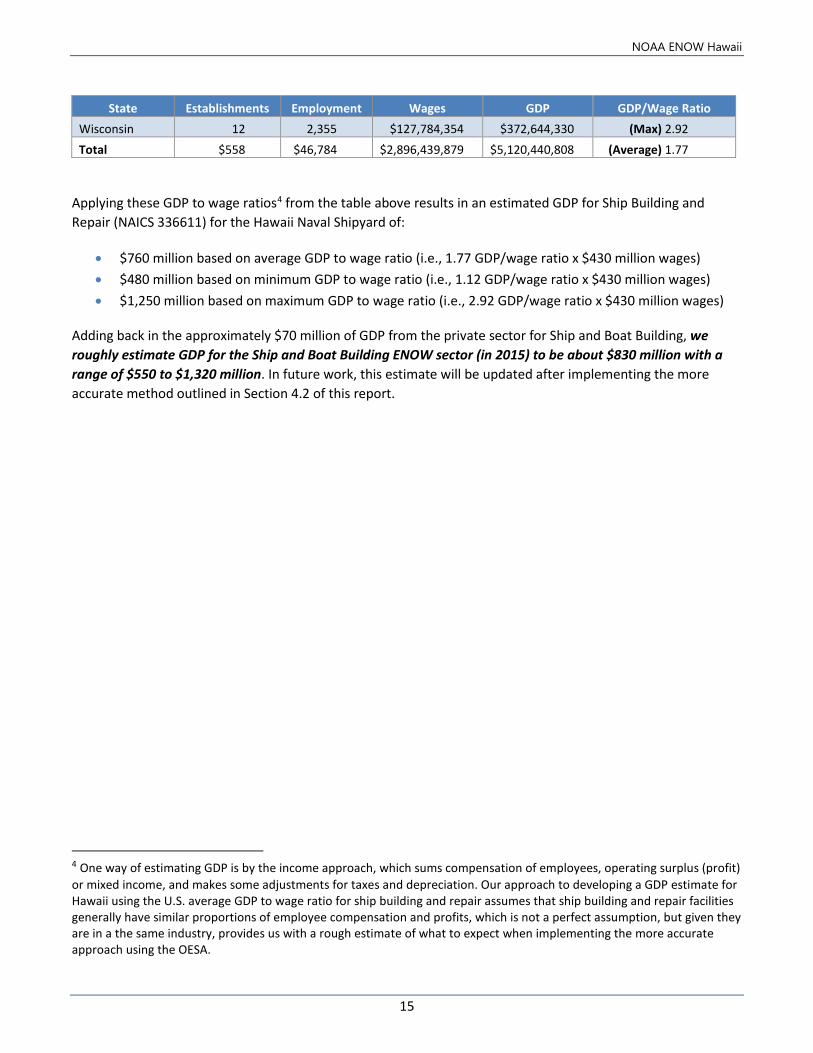
State Establishments Employment Wages GDP GDP/Wage Ratio Wisconsin 12 2,355 $127,784,354 $372,644,330 (Max) 2.92 Total $558 $46,784 $2,896,439,879 $5,120,440,808 (Average) 1.77
Applying these GDP to wage ratios4 from the table above results in an estimated GDP for Ship Building and Repair (NAICS 336611) for the Hawaii Naval Shipyard of:
• $760 million based on average GDP to wage ratio (i.e., 1.77 GDP/wage ratio x $430 million wages) • $480 million based on minimum GDP to wage ratio (i.e., 1.12 GDP/wage ratio x $430 million wages) • $1,250 million based on maximum GDP to wage ratio (i.e., 2.92 GDP/wage ratio x $430 million wages)
Adding back in the approximately $70 million of GDP from the private sector for Ship and Boat Building, we roughly estimate GDP for the Ship and Boat Building ENOW sector (in 2015) to be about $830 million with a range of $550 to $1,320 million. In future work, this estimate will be updated after implementing the more accurate method outlined in Section 4.2 of this report.
4 One way of estimating GDP is by the income approach, which sums compensation of employees, operating surplus (profit) or mixed income, and makes some adjustments for taxes and depreciation. Our approach to developing a GDP estimate for Hawaii using the U.S. average GDP to wage ratio for ship building and repair assumes that ship building and repair facilities generally have similar proportions of employee compensation and profits, which is not a perfect assumption, but given they are in a the same industry, provides us with a rough estimate of what to expect when implementing the more accurate approach using the OESA.

NOAA ENOW Hawaii
16
4. Tourism and Recreation
4.1 Background: The ENOW Issue The tourism and recreation ENOW sector is a large component of Hawaii’s economy, and in 2015 it employed 103,000 of 638,000 (16 percent) total private and government employees (BLS QCEW, 2018).
Table 4-1 presents the ENOW tourism and recreation industry by ocean-dependent industries within the traditional ENOW sector (NOAA ENOW, 2018). This shows approximately 90 percent of the tourism and recreation establishments, employment, and GDP being related to the Eating and Drinking Places and Hotels and Lodging industries.
Table 4-1. Establishment, Employment, Wages, and GDP in Hawaii Tourism and Recreation (2015) ENOW Ocean Industry Establishments Employment Wages (million) GDP (million)
Boat Dealers 10 93 $2.8 $6.8
Eating and Drinking Places 2,979 56,737 $1,214.0 $2,323.4
Hotels and Lodging 298 37,389 $1,761.5 $4,081.9
Marinas Suppressed Suppressed Suppressed Suppressed
Recreational Vehicle Parks and Campsites Suppressed Suppressed Suppressed Suppressed
Scenic Water Tours 159 1,970 $59.2 $108.0
Sporting Goods 28 97 $3.3 $6.7
Amusement and Recreation Services 383 5,336 $157.4 $351.0
Zoos and Aquaria 28 851 $32.6 $72.8
Total for Tourism and Recreation 3,893 102,606 $3,234.9 $6,958.1
Additionally, there were 861 self-employed individuals (in 2014) in the tourism and recreation sector as estimated by ENOW (NOAA ENOW, 2018), but this figure is not available broken out by industry.
The ocean-dependent tourism and recreation industry may be larger in an island setting. As discussed in Section 2, a wide variety of economic activities that are not typically ocean dependent for other coastal states tend to be partially or completely dependent on the ocean in an island setting. For example, airport or taxi operations may depend almost entirely on tourists who visit primarily for ocean-related activities. If this ocean-dependent tourism suddenly stopped, airport and most taxi operations would be significantly reduced. To incorporate this economic activity, Section 4.2 presents a methodology for calculating the additional ocean-dependent tourism and recreation activity (ENOW+) beyond the traditional ENOW sector in Hawaii.

NOAA ENOW Hawaii
17
4.2 Methods and Limitations: Estimating the Tourism and Recreation Sector The more expanded (combined ENOW and ENOW+) ocean-dependent tourism and recreation sector includes the sum of:
• All economic activity (establishments, employment, wages, and GDP) for traditional ENOW industries.
• A location quotient-adjusted portion of economic activity of ENOW+ industries. Location quotients (LQs) show relative concentration of an industry in a given region. An LQ above 1.0 indicates that an industry is more concentrated in the given region (in this case, Hawaii) than in the rest of the United States.
Traditional ENOW Industries. The economic data for traditional ENOW industries is included in Table 4-1 above. No further modification of that data is needed.
LQ-adjusted portion of economic activity in tourism and recreation ENOW+ industries. The following steps were taken to perform this calculation.
1. Began with the universe of ENOW+ industries in Table 3-2 based on previous work.
2. Expanded this universe slightly after reviewing tourism and recreation-related industries in Hawaii with high LQs and ensuring their inclusion was theoretically justified based on local knowledge of this industry. This included the addition of:
a. Other clothing stores (NAICS 448190)—establishment LQ of 3.22 b. All other ground passenger transportation (NAICS 485999)—establishment LQ of 3.07 c. Convention and visitors bureaus (NAICS 561591)—establishment LQ of 2.89 d. Mobile food services (NAICS 722330)—establishment LQ of 3.13
3. Obtaining establishment, employment, and wages data from the BLS QCEW dataset for the private sector for the expanded universe of ENOW+ industries (from steps 1 and 2).
4. Obtaining LQs for establishment, employment, and wages data from the BLS QCEW dataset for the private sector for the expanded universe of ENOW+ industries (from steps 1 and 2).
5. Adjusting the data in step 3 by the LQ in step 4 as follows:
a. For any industries with an establishment, employment, or wage location quotient less than 1, exclude from the ocean-dependent tourism and recreation sector. An LQ below 1.0 signals that the economic activity in a given industry is less concentrated than in the rest of the United States, thus the activity in the industry is considered standard, and cannot be attributed to or classified as ocean-dependent.
b. For industries with establishment, employment, and wage location quotients greater than or equal to 1, perform the following adjustment for establishments, employees, and wages. i. Adjusted Number of Establishment = Original Number of Establishments * [(Establishment LQ -
1)/Establishment LQ] ii. Adjusted Number of Employees = Original Number of Employees * [(Employee LQ - 1)/Employee
LQ] iii. Adjusted Wages = Original Wages * [(Wages LQ - 1)/Wages LQ]

NOAA ENOW Hawaii
18
Limitations: A more accurate estimate of the number of employees, establishments, and wages would be to create coefficients (percent of each industry that is ocean-dependent) to estimate industry-level ocean-dependent activity for ENOW+ industries. The method used in this analysis is a simplified attempt at developing those coefficients based on location quotients. For example, if 300 employees are in a tourism and recreation-related industry and the LQ is 3, we would assume the first 100 employees (1/LQ of 3) would be there anyway (and are not related to the ocean) and the remaining 200 are driven by the ocean. This higher-level approach may underestimate in some cases where there is a low LQ but the economic activity is actually ocean dependent, and it may overestimate in other cases where there is a high LQ but the activity is actually not ocean dependent.
4.3 Findings: The Size of Hawaii’s Tourism and Recreation Sector This section presents the quantitative findings followed by qualitative descriptions of the major ENOW+ industries that comprise Hawaii’s tourism and recreation sector.
Table 4-2 presents (from left to right) ENOW+ industries' LQs, original (unadjusted) establishment, employment, and wage data; and adjusted establishment, employment, and wage data. As presented in the methodology in the previous section (Section 4.2), this data excludes ENOW+ industries with an establishment, employment, or wages LQ of less than 1.
Table 4-2. ENOW+ Location Quotient Adjusted Establishments, Employment, and Wages (2015) 2015 BLS QCEW data Location Quotients Unadjusted BLS QCEW LQ Adjusted
NAICS
NAICS Definition Esta
blis
hmen
ts
Empl
oym
ent
Wages Esta
blis
hmen
ts
Empl
oym
ent
Wages Esta
blis
hmen
ts
Empl
oym
ent
Wages
448110 Men’s Clothing Stores 2.2 3.4 2.8 56 812 $17,768,632 30 575 $11,330,722
448120 Women’s Clothing Stores
2.4 2.3 3.1 274 2,961 $68,197,871 161 1,662 $46,339,579
448190 Other clothing stores 3.2 2.7 2.7 166 1,502 $29,697,212 114 954 $18,616,163
448310 Jewelry Stores 3.5 2.9 3.3 301 1,622 $59,483,257 215 1,067 $41,292,659
448320 Luggage and Leather Goods Stores
3 3.2 5 17 218 $11,145,478 11 151 $8,925,263
453220 Gift, Novelty, and Souvenir Stores
2.9 3 5 262 2,224 $60,714,216 173 1,490 $48,571,373
485999 All other ground passenger transportation
3.1 5.9 5.3 25 901 $19,734,468 17 749 $15,989,787
487110 Scenic and Sightseeing Transportation, Land
12.5 27.3 31.1 46 1,671 $54,805,666 42 1,610 $53,042,859

NOAA ENOW Hawaii
19
2015 BLS QCEW data Location Quotients Unadjusted BLS QCEW LQ Adjusted
NAICS
NAICS Definition Esta
blis
hmen
ts
Empl
oym
ent
Wages Esta
blis
hmen
ts
Empl
oym
ent
Wages Esta
blis
hmen
ts
Empl
oym
ent
Wages
531210 Offices of Real Estate Agents and Brokers
1.1 1.2 1.3 471 1,631 $108,288,872 58 272 $26,251,848
532111 Passenger Car Rental 3 4.2 4.6 119 2,325 $82,872,914 79 1,777 $64,896,143
561510 Travel Agencies 3.2 3.1 2.4 183 1,217 $53,000,256 126 823 $31,278,840
561520 Tour Operators 13.9 24.7 19.4 163 3,137 $105,642,965 151 3,010 $100,194,643
561591 Convention and visitors bureaus
2.9 2.3 3.9 12 93 $7,371,953 8 52 $5,500,899
561599 All Other Travel Arrangement Services
4.5 1.4 1.4 73 512 $23,153,889 57 154 $6,496,415
712120 Historical Sites 3.6 4.3 4.1 9 317 $8,986,001 6 243 $6,815,469
721199 All Other Traveler Accommodation
10.5 9.8 14.5 84 615 $19,941,686 76 552 $18,565,448
722330 Mobile food services 3.1 2.3 2.3 46 162 $2,519,836 31 92 $1,433,700
812199 Other Personal Care Services
1.3 1.4 1.8 94 735 $17,576,779 21 199 $7,702,184
Table 4-3. Total Ocean-Dependent Tourism and Recreation Sector in Hawaii (2015)
Establishments Employment Wages (million)
ENOW Total (from Table 4-1) 3,893 102,606 $3,234.9
(Adjusted) ENOW+ Total (from Table 4-2) 1,376 15,432 $513.2
Total for Tourism and Recreation Sector 5,269 118,038 $3,748.1
• Four industries in Table 4-2 have LQ-adjusted wages of approximately $50 million or more annually: • Scenic and Sightseeing Transportation – Land • Tour Operators • All Other Traveler Accommodation • Passenger Car Rental • Gift, Novelty, and Souvenir Stores

NOAA ENOW Hawaii
20
These five sectors are heavily dependent on tourism. Visitor spending, which is tied closely to Hawaii’s ocean setting, was a record $15.6 billion in 2016 and the visitor industry supported nearly 200,000 jobs that year (Schaefers, 2017). Collectively, these five sectors contributed almost $300 million in wages to Hawaii’s tourism economy in 2015 (based on location quotient-adjusted wages). Hawaii tourism is further tied to the ocean as the most-often recommended activities when visiting Hawaii are ocean-related (Davis, 2017). For example, the top 10 activities recommended by National Geographic for Hawaii include surfing, whale watching, snorkeling and diving, visiting the Kauai seascapes, hiking trails with ocean views, and watching the lava flow enter the ocean.

NOAA ENOW Hawaii
21
5. Living Resources: The Informal Fish Sales Market
5.1 Background: The Issue NOAA ENOW data for Hawaii’s Living Resources Sector: NOAA ENOW presents economic data for Hawaii’s living resources sector, which contains the four ocean-dependent industries shown in Table 5-1 below. Table 5-1 presents economic indicators within the living resources ocean sector (NOAA ENOW, 2018). This table includes data for employers and excludes self-employment, as the data are derived from BLS QCEW, which tabulates the data from information reported to the Unemployment Insurance (UI) programs of the United States employers. The table breaks these indicators down by smaller ocean industries. The majority of the 938 employed are employed in the seafood markets and fish hatcheries and aquaculture industries. The remaining 146 employees are distributed in the seafood processing or fishing industries; however, these data are suppressed to protect potentially sensitive business data.
Table 5-1. Establishments, Employment, Wages, and GDP in Hawaii Living Resources (2015) ENOW Ocean Industry Establishments Employment Wages GDP Seafood Processing Suppressed Suppressed Suppressed Suppressed Seafood Markets 32 383 $10,253,393 $25,480,225 Fishing Suppressed Suppressed Suppressed Suppressed Fish Hatcheries and Aquaculture 22 409 $18,030,716 $27,423,358 Total for Living Resources 123 938 $35,874,357 $86,234,136 Note: Columns do not sum to totals because of data suppressions
Additionally, there were 1,366 self-employed individuals (in 2014) in the living resources sector as estimated by ENOW (NOAA ENOW, 2018), but this figure is not available broken out by industry. Relatedly, recent NOAA NMFS figures indicate that approximately 673 people are directly employed by charter fishing boat services in Hawaii (Rollins and Lovell, 2018), but this employment is captured in the ENOW tourism and recreation sector as it is part of NAICS 487210 (Scenic and Sightseeing Transportation, Water).
Though we cannot determine exactly how many of the remaining 146 employees from Table 5-1, or the approximate 1,350 self-employed individuals can be classified under the fishing sector, it is likely that at least some of these individuals can be classified as part of the fishing industry. However, ENOW also excludes data on informal economic activity, or the “informal fishing market,” which is prevalent in Hawaii. This presents a significant challenge in accurately characterizing the relative size of Hawaii’s total fishing market.
Challenges in estimating the economic contribution of the informal fishing market: We are defining the informal fishing market as made up of unreported sales from commercial fishermen and sales from unlicensed non-commercial fisherman.5 Additionally, non-commercial fisherman also consume their catch directly, which never reaches the market but brings a huge value to Hawaii. Understanding the factors that contribute to the informal fishing marketplace and developing estimates of the number of commercial fishermen in Hawaii, as well as their sales, income, and their contribution to Hawaii’s employment landscape, is a challenge. This is due in large part to the relative ease of market access and socio-cultural motivations for fishing. To date, several
5 This is somewhat of a simplification of the market as is just focuses on who caught the fish and not the entire supply chain.

NOAA ENOW Hawaii
22
researchers have employed qualitative, ex-post approaches to the problem (e.g., Grafeld, Oleson, Teneva, and Kittinger, 2017; Miller, 1996; Hamilton, 1999; Hamilton and Huffman, 1997; Glazier, 1999; 2007; Hospital, Bruce, and Pan, 2011; Hospital and Beavers, 2012).
Formal and informal fish sale markets: There are a number of formal and informal outlets available to fishermen in Hawaii who wish to sell their catch. These outlets include:
• the United Fishing Agency (UFA) auction in Honolulu; • dealers/wholesalers; • markets/stores; • restaurants; • roadside; • door-to-door; • sales to friends and coworkers; and • sales via social media, such as Facebook.
Buyers across the first four entities (UFA, dealers/wholesalers, markets/stores, and restaurants) in the above list may purchase fish from unlicensed fishermen on occasion, but certainly would be hesitant to admit this to researchers or regulators. For various reasons, including lack of Commercial Marine License (CML) enforcement and tax implications, neither the state nor the federal government know the value and quantity of the fish being sold via the remaining four outlets in the list above. However, some information is available that can be used to inform our thinking about the magnitude of these sales and to develop a method for estimating such.
Factors that contribute to the informal fishing market: The ease of “market” access in Hawaii is perhaps the largest challenge in characterizing the informal fish sales in Hawaii, and is underpinned by the following:
• inexpensive and easy-to-obtain commercial marine license (CML); • lack of CML enforcement, especially in the informal fish sales outlets (roadside; door-to-door; sales to
friends and coworkers; and social media); • relatively few true commercial (licensed to sell) fishermen and a fishing culture that lends itself more to
non-commercial (unlicensed to sell) fishermen who occasionally sell part of their catch to make extra money or to recoup the expenses involved in taking a fishing trip;
• lack of awareness and enforcement of rules governing roadside vendors; and • emerging use of social media to facilitate direct-to-consumer sales of locally-harvested seafood.
Existing work that highlights the challenges of characterizing the informal fishing market: The above factors that contribute to the informal fishing market make it extremely challenging to accurately characterize its economic activity. Previous efforts to identify these challenges highlight the opaque nature of the informal fishing market. In a report of a survey of small boat fishermen conducted across Hawaii, Hospital et al. (2011) neatly sum up the issue: “While 42% of fishermen responding to our survey self-classified themselves as commercial fishermen, we found that 60% of respondents actually sold fish in the past 12 months… Just over 30% of fishermen who self-classified themselves as recreational indicated that they had sold fish in the past year.” Similarly, in a 2013 survey of 1,233 Hawaii boat-based fishermen, Hawkins et al. (2015) found that

NOAA ENOW Hawaii
23
although 20% of respondents reported selling fish, only five percent of respondents subsequently classified themselves as commercial fishermen (defined in their survey as fishing conducted for profit).
Grafeld et al. (2017) further illustrates the challenges of accurately characterizing the fishing market in Hawaii due to the opaque nature of the informal market. Grafeld et al. (2017) concludes that the non-commercial nearshore sector generated 2.8 times more fish than the commercial sector, with 2.4 to 4.4 times more value and a shorter distribution chain. Additionally, Grafeld et al. (2017) determined that nearshore fisheries had annual value-added of between $10.3 and $16.4 million and estimated that this fishing activity made up just over eight percent of the Hawaii’s total fishing market value. This is especially noteworthy, because Grafeld et al. (2017) defines “nearshore fishery” as licensed commercial fishermen + commercial fishermen (with unlicensed sales) + non-commercial fishermen (unlicensed to sell) who may sell part of their catch. Thus, the informal fishing activity (unlicensed commercial and non-commercial fishermen who may sell part of their catch) is a significant contributor to Hawaii’s overall fishing market. Finally, in a historical catch reconstruction of Hawaii’s coral reef and bottom fisheries using 1950 to 2002 data, Zellar, Booth, Davis, and Pauly (2007) estimated that, summed over the entire 52 years, non-commercial catches were approximately 1.8 times higher than commercial landings reported by the state.
Grafeld et al. (2017) summarizes the challenges associated with characterizing the informal fishing market by stating, “Despite the importance of small-scale, nearshore fisheries for human wellbeing in Hawaiʻi and beyond, the sector is notoriously data poor, undervalued, and has less investment in management than other fisheries sectors.” Ultimately, the ease-of-access to enter the fishing market, and the complex socio-cultural motivations make it extremely challenging, despite many previous attempts, to characterize the informal fishing market. In turn, this challenge prevents an accurate and defensible enumeration of the fishing market as a whole, as an unknown portion is inherently difficult to characterize.
5.2 Estimating the Informal Fishing Market Estimating the informal fishing market based on recent studies: There is no comprehensive enumeration of Hawaii’s informal fishing marketplace. Such an enumeration has been hindered by the nature of the informal fishing market and lack of a State marine recreational fishing license. Therefore, estimating the contribution of the informal marketplace to Hawaii’s ocean economy is difficult. The best method currently available to estimate the size of Hawaii’s informal fishing market is to examine recent research and thinking around the issue.
First, in a survey of small boat fishermen conducted across Hawaii, Hospital et al. (2011) found that the major difference between full-time and part-time commercial fishers is that full-time commercial fishers more often utilize markets and stores. Part-time commercial fishermen (and probably non-commercial fishermen who occasionally sell some of their catch) will more often sell to friends, neighbors, or coworkers than will fulltime commercial fishermen.
In their study of the “hidden blue economy” of reef-associated fish in Hawaii, Grafeld et al. (2017) provide several key insights, in addition to estimating the informal market for nearshore fishing:
1. The total annual value of the nearshore fishery in Hawaii is estimated to be between $10.3 and $16.4 million.
NOAA ENOW Hawaii
24
2. The wider market (i.e., all the outlets listed in Section 5.1) is heavily underpinned by fish originating from those who consider themselves non-commercial, even in the well-developed Hawaii economy. Recent research examining the economy of reef-associated fisheries have failed to account for market nuance and complexity.
3. Only about 62 percent of commercial fish catch harvested by licensed fishermen was subsequently reported in the State’s purchase report system. The authors assume that a large portion of the unreported 38 percent was likely sold, thus entering a “hidden blue economy.”
4. Grafeld and colleagues obtained purchase reports via a data request to the State. The purchase report system captures the initial sale of fish by licensed commercial fishermen. It is a voluntary reporting system. Sales from licensed commercial fishers to fish dealers who chose not to participate in optional sales reporting are de facto unreported and enter a hidden economy. Unlicensed sales, where unlicensed fishers sell fish to fish dealers, also de facto enter the hidden economy as both unreported and illegal catch.
5. Key stakeholders estimated the amount of unlicensed commercial catch entering the market, where fish dealers purchased fish from fishers who did not hold a commercial license, as a percentage of legal sales (“estimated at 10–30% the volume of legal commercial catch based upon key stakeholder information”). The data obtained from fish dealer purchase reports, therefore, only provides a partial picture of the market transactions along the value chain.
6. Grafeld and colleagues estimate an additional $148,500-$445,500 are derived from unlicensed (and hence unreported) catch that was commercially sold, thus entering a “hidden blue economy.”
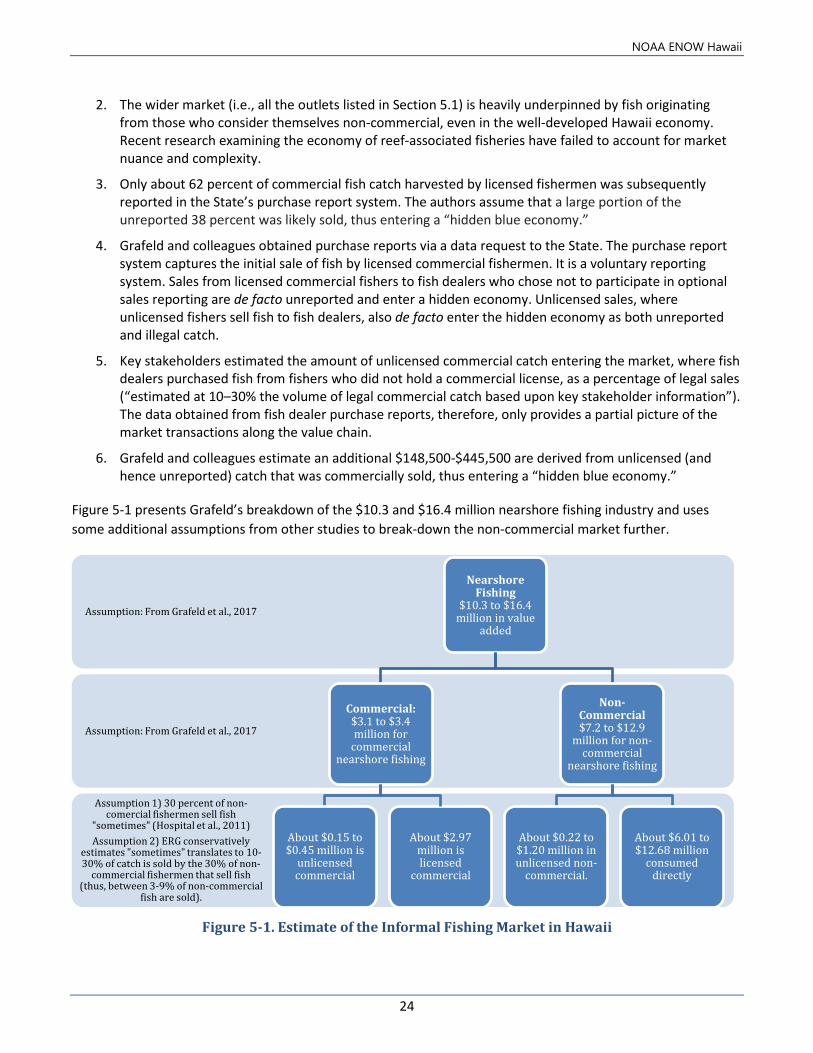
Figure 5-1 presents Grafeld’s breakdown of the $10.3 and $16.4 million nearshore fishing industry and uses some additional assumptions from other studies to break-down the non-commercial market further.
Figure 5-1. Estimate of the Informal Fishing Market in Hawaii
Assumption 1) 30 percent of non-comercial fishermen sell fish
"sometimes" (Hospital et al., 2011)Assumption 2) ERG conservatively
estimates "sometimes" translates to 10-30% of catch is sold by the 30% of non-
commercial fishermen that sell fish (thus, between 3-9% of non-commercial
fish are sold).
Assumption: From Grafeld et al., 2017
Assumption: From Grafeld et al., 2017
Nearshore Fishing
$10.3 to $16.4 million in value
added
Commercial:$3.1 to $3.4 million for
commercial nearshore fishing
About $0.15 to $0.45 million is
unlicensed commercial
Non-Commercial$7.2 to $12.9
million for non-commercial
nearshore fishing
About $2.97 million is licensed
commercial
About $0.22 to $1.20 million in unlicensed non-
commercial.
About $6.01 to $12.68 million
consumed directly
NOAA ENOW Hawaii
25
Value of the informal nearshore fishery market: Given the findings of recent published research, the sales of Hawaii’s nearshore informal fishing marketplace would appear to range between $370,000 and $1.65 million dollars of revenue per year (total of unlicensed sales from commercial and non-commercial) plus an additional approximately $6 million to $13 million (based on market prices) caught by nearshore non-commercial fisherman and consumed—this is all economic activity not captured by the NOAA ENOW Living Resources sector.
Limitations: This analysis does not consider the informal fishing market beyond nearshore fishing. In addition, as Hospital (pers. comm. 2018) suggests, the same market issues, conditions, and considerations apply to pelagic and bottomfish species, which are often higher value and more plentiful. Thus, the total informal market is likely to be several orders of magnitude greater than the estimate for nearshore fisheries.
5.3 Recommendations: Estimating the Size of the Informal Fishing Market As Grafeld et al. (2017) indicate, the flow and disposition of unreported commercial seafood sales remains hidden in part because, at the point of initial sale, commercial dealers are not required to report their purchases or sales to fisheries managers. Understanding of catch and post-catch distribution could be improved through:
1. mandatory seafood dealer reporting on sales and purchases;
2. mandatory fish dealer purchase and sale reporting on species of concern in the state’s coral reef fisheries management plan; and
3. initiating a marine recreational licensing scheme.
Absent some of these improvements, it is possible to implement a study to assess the general size of the informal/hidden marketplace. This study would be based on several of the key insights described in Section 6.2, especially those referenced in Section 6.3. We recommend future work be focused and proceed along at least two lines of inquiry—commercially licensed fishermen and unlicensed fishermen. Fishermen in this case stand to lose less than businesses, such as grocers and wholesalers, for engaging in illegal activity and hence will be more likely to work with researchers seeking to understand the informal market. Businesses are more likely to face stiffer fines and other sanctions for engaging in illegal sales than a fisherman and are therefore less likely to cooperate with researchers. Two key insights we recommend considering for future work are:
• Guaranteeing licensed fishermen confidentiality and anonymity. Grafeld and colleagues found that nearly 40% of the licensed nearshore catch they observed was not subsequently recorded by the State’s purchase reporting system.6 If assured of confidentiality or anonymity, licensed fishermen may be willing to share information about the amount and type of fish they sell and why they do not record all sales.
• Guaranteeing unlicensed fishermen confidentiality and anonymity. With similar assurances, unlicensed fishermen (including those that consider themselves non-commercial, part-time commercial, and even full-time commercial fishermen) may also be willing to share information about the amount and type of
6 As indicated above, Grafeld and colleagues assume that most of this catch was indeed sold, rather than consumed at home or given away to family or friends. However, it should be noted that the Pacific Islands Fisheries Science Center (Hospital, pers. comm. 2018) strongly questions this assumption.

NOAA ENOW Hawaii
26
fish they sell. Such fishermen in the past have been willing to provide answers to survey questions regarding the post-trip sale of catch.
The State, through its Hawaii Marine Recreational Information Program, routinely intercepts fishermen. Through these interactions, MRIP surveyors have engendered trust in the fishing community. If researchers explained that responses are used only to understand the nature of Hawaii’s informal marketplace and not to identify and punish those who sell fish without a license (and are therefore outside of any reporting system), they could obtain more accurate information.

NOAA ENOW Hawaii
27
6. Recommendations: Other Ocean-Dependent Industries Beyond ENOW ENOW may wish to consider the economic activities and contributions of the National Energy Laboratory of the Hawaii Ocean Science and Technology Park (HOST Park). HOST Park’s mission is to play an important role in “Hawaii’s ocean energy technologies by promoting and facilitating the development and diversification of energy, ocean-related research, education, and commercial activities” (Bonham, 2012). The State of Hawaii has invested over $100 million since 1974 to create and grow HOST Park. In 2017, the National Energy Laboratory Hawaii Authority (NELHA) co-sponsored the Hawaii Statewide Aquaculture Industry Summit, entitled: “The Future of Hawaii’s Blue Economy: Organizing for 2020.”
A 2012 economic impact analysis conducted for NELHA estimated the impact of the facility’s Hawaii-based expenditures that year on the State’s output, earnings, and tax revenues at $87.7, $24.7, and $4.5 million, respectively (Bonham, 2012). The study also found that NELHA and its tenants employ hundreds of people and their expenditures also contribute to hundreds of other jobs in the economy (583 total, including NELHA employees) (Bonham, 2012). Finally, the analysis revealed that the State’s average input of $2 million per year to NELHA yields an economic output of about $42.8 million (Bonham, 2012).

NOAA ENOW Hawaii
28
7. References Bonham, C.S., Burnett, K., Cintina, I., and P. Bernstein. (2012). Economic Impact of The Natural Energy Laboratory Hawaii Authority Tenants on The State of Hawaii. Economic Research Organization at the University of Hawaii. Retrieved from http://nelha.hawaii.gov/wp-content/uploads/2013/05/NELHA-Tenants-Impact-Study-UHERO-2012_Color.pdf
Bureau of Labor Statistics (BLS). Quarterly Census of Employment and Wages (QCEW). “2015.annual 15000 Hawaii -- Statewide.” Available at: https://www.bls.gov/cew/datatoc.htm.
Chamber of Commerce Hawaii. (2018). Military Impact on Hawaii. Retrieved from: http://www.cochawaii.org/military-impact-in-hawaii/
Davis, H.G. (2017, April) 10 of the Most Striking Spots in Hawaii. National Geographic. Retrieved from https://www.nationalgeographic.com/travel/destinations/north-america/united-states/hawaii/top-10-things-to-do/
Glazier, E.W. (2007). Hawaiian Fishermen. Belmont, CA: Wadsworth-Thomson Publishers. 145 p.
Glazier, E. W. (1999). Social aspects of Hawaii’s small vessel troll fishery. Phase II Social aspects of Pacific pelagic fisheries. Pelagic Fisheries Research Program, Joint Institute for Marine and Atmospheric Research, SOEST. University of Hawaiʻi at Mānoa. 280 pp.
Grafeld S., Oleson K.L.L., Teneva L., and J.N. Kittinger. (2017). Follow that fish: Uncovering the hidden blue economy in coral reef fisheries. PLoS One, 12: 1–25.
Hamilton, M. (1999). Thalassorama - System for Classifying Small Boat Fishermen in Hawaii. Marine Resource Economics, 13:289-291.
Hawkins C., Ma, H., DeMello, J., and W. Ikehara. (2015). A Survey of Hawaii’s Registered Boaters: Results and Implications for Boat-Based Non-commercial Fishery Data and Management. Report of a 2012-2013 Marine Recreational Information Program study. 33 p.
Hamilton, M. and S. Huffman. (1997). Cost-earnings study of Hawaii’s small boat fishery, 1995- 1996. SOEST 97-06, JIMAR Contribution 97-314, Pelagic Fisheries Research Program, Joint Institute for Marine and Atmospheric Research, SOEST. University of Hawaiʻi at Mānoa.
Hospital, J. and C. Beavers. (2012). Economic and social characteristics of bottomfish fishing in the main Hawaiian Islands. Pacific Islands Fish. Sci. Cent., Natl. Mar. Fish. Serv., NOAA, Honolulu, HI 96822-2396. Pacific Islands Fish. Sci. Cent. Admin. Rep. H-12-01, 44 p. + Appendix.
Hospital, J., Bruce, S.S., and M. Pan. (2011). Economic and social characteristics of the Hawaii small boat pelagic fishery. Pacific Islands Fish. Sci. Cent., Natl. Mar. Fish. Serv., NOAA, Honolulu, HI 96822-2396. Pacific Islands Fish. Sci. Cent. Admin. Rep. H-11-01, 50 p. + Appendices.
Miller, M.L. (1996). Social aspects of Pacific pelagic fisheries, Phase I: The Hawai'i troll and handline fishery. SOEST 96-04, JIMAR Contribution 96-303.
National Oceanic Atmospheric Administration. ENOW Explorer. Accessed 2018. Retrieved from https://coast.noaa.gov/digitalcoast/tools/enow.html
National Oceanic and Atmospheric Administration Office for Coastal Management (OCM). Crosswalk Table Economics: National Ocean Watch (ENOW), Sectors, Industries and the North American Industry Classification System (NAICS). Accessed 2018. Retrieved from https://coast.noaa.gov/data/digitalcoast/pdf/enow-crosswalk-table.pdf

NOAA ENOW Hawaii
29
National Oceanic and Atmospheric Administration. (2016). Describing the Ocean Economies of the U.S. Virgin Islands and Puerto Rico. Retrieved from https://coast.noaa.gov/data/digitalcoast/pdf/econ-usvi-pr.pdf
Rollins, E. and S. Lovell. (Under review 2018). Charter Fishing in Hawaii: A multi-region analysis of the economic linkages and contributions within and outside Hawaii.
Schaefers, A. (2017, January 30) Hawaii Visitor Arrivals, Spending See Record Numbers. The Honolulu Star Advertiser. Retrieved from http://www.staradvertiser.com/2017/01/30/business/business-breaking/hawaii-visitor-arrivals-spending-see-record-numbers/
Zeller, D., Booth, S., Davis, G., and D. Paully. (2007). Re-estimation of small-scale fisheries catches for U.S. flag island areas in the Western Pacific: the last 50 years. Fish. Bull. 105, 266–277.