Embed Size (px)
Citation preview

Rev. index. Validity Status
Rev. No.
Eni JPDA 06-105
Company document identification
00177_DV_CD.HSE.0206.000_01
Owner document
identification
CD 01
Sheet of sheets
APPENDIX B
Oil Spill Modelling Study

ENI-JPDA-06-105 PTY LTD
KITAN OIL SPILL RISK ASSESSMENT MODELLING
Document No. ENI046-KitanOilSpillModelling
23 September 2010
105 PTY LTD
KITAN OIL SPILL RISK ASSESSMENT MODELLING
KitanOilSpillModelling-Rev2
KITAN OIL SPILL RISK ASSESSMENT MODELLING

ENI-JPDA-06-105 PTY LTD
KITAN OIL SPILL RISK ASSESSMENT MODELLING23 September 2010
Revision
Rev A
Draft for internal review
Rev 0
Final report for issue to client
Rev 1 Revised final report
incorporating additional modelling scenarios
Rev 2 Revised final report
incorporating additional modelling scenarios
KITAN OIL SPILL RISK ASSESSMENT MODELLING
Author Review Approval
J Nielsen J Miragliotta J Miragliotta
J Nielsen J Miragliotta J Miragliotta
J Nielsen J Miragliotta J Miragliotta
J Nielsen J Miragliotta J Miragliotta
Approval Date
J Miragliotta 11 May 2009
J Miragliotta 11 Jun 2009
J Miragliotta 14 Jan 2010
J Miragliotta 23 Sep 2010

ENI-JPDA-06-105 PTY LTD
KITAN OIL SPILL RISK ASSESSMENT MODELLING23 September 2010
TABLE OF CONTENTS
EXECUTIVE SUMMARY ................................
1. INTRODUCTION ................................
1.1 BACKGROUND ................................
1.2 OBJECTIVE ................................
1.3 SCOPE ................................
2. DESCRIPTION OF RECEIVING ENVIRONMEN
2.1 CLIMATE ................................
2.2 WINDS ................................
2.3 TIDAL RANGES ................................
2.4 CURRENTS ................................
2.5 WAVES ................................
2.6 WATER TEMPERATURES
3. METHODS ................................
3.1 GENERAL ................................
3.2 HYDRODYNAMIC MODEL
3.3 OIL SPILL WEATHERING
3.4 OIL SPILL TRAJECTORY
3.5 OIL SPILL SCENARIOS
4. RESULTS 18
4.1 EVENT 1: LOSS OF 70
4.2 EVENT 2: LOSS OF 18
4.3 EVENT 3: LOSS OF 10
4.4 EVENT 4: INSTANTANE
4.5 EVENT 5: LOSS OF 80
4.6 EVENT 6: LOSS OF 2.5M
5. DISCUSSION ................................
5.1 KITAN CRUDE OIL ................................
5.2 DIESEL ................................
6. REFERENCES ................................
7. ABBREVIATIONS ................................
KITAN OIL SPILL RISK ASSESSMENT MODELLING
TABLE OF CONTENTS
................................................................................................
................................................................................................
................................................................................................
................................................................................................
................................................................................................
RECEIVING ENVIRONMENT ................................
................................................................................................
................................................................................................
................................................................................................
................................................................................................
................................................................................................
WATER TEMPERATURES ................................................................................................
................................................................................................
................................................................................................
HYDRODYNAMIC MODEL ................................................................................................
OIL SPILL WEATHERING MODULE ................................................................
OIL SPILL TRAJECTORY MODULE ................................................................
................................................................................................
EVENT 1: LOSS OF 7000M3 OF CRUDE OVER 24 HOURS ................................
EVENT 2: LOSS OF 1800M3/DAY OF CRUDE OVER 56 DAYS ................................
EVENT 3: LOSS OF 100M3 OF CRUDE OVER SIX HOURS ................................
EVENT 4: INSTANTANEOUS SPILL OF 10M3 OF CRUDE ................................
EVENT 5: LOSS OF 80M3 OF DIESEL OVER 6 HOURS ................................
5M3 OF DIESEL OVER 1 HOUR ................................
................................................................................................
................................................................................................
................................................................................................
................................................................................................
.............................................................................................
.................................... 1
................................ 3
................................................. 3
...................................................... 3
............................................................ 3
..................................................... 5
......................................................... 5
............................................................ 5
................................................ 7
...................................................... 7
............................................................ 8
.................................. 8
......................................... 9
........................................................ 9
................................. 9
.................................................. 12
................................................... 13
................................... 17
................................................. 18
............................................ 24
................................................. 32
................................................... 39
...................................................... 45
....................................................... 54
................................... 60
......................................... 60
.......................................................... 62
.................................. 63
............................. 65

ENI-JPDA-06-105 PTY LTD
KITAN OIL SPILL RISK ASSESSMENT MODELLING23 September 2010
FIGURES
Figure 1.1 Location of the Kitan oilfield
Figure 1.2 Location of the Kitan oilfield in relation to regional seamounts and shoals
Figure 2.1 Seasonal wind roses for the Timor Sea (Saipem Energy Services 2009)
Figure 3.1 Timor Sea model grid.
Figure 3.2 Model Bathymetry.
Figure 3.3 Mechanisms included in the three dimensional model
Figure 4.1 Predicted weathering of Kitan oil for a continuous release of 7000mover 24 hours for a 4ms
Figure 4.2 Predicted weathering of Kitan oil for a continuous release of 7000m
over 24 hours for a 10ms
Figure 4.3 Probability of surface exposure at day 5 under summer conditions from a 7000m3 spill of crude oil occurring over a 24 hour period
Figure 4.4 Predicted minimum time to exposure under summer conditions from a
7000m3 spill of crude oil occurring over a 24 hour period
Figure 4.5 Probability of surface exposure at day 5 under winter conditions from a 7000m3 spill of crude oil occurring over a 24 hour period
Figure 4.6 Predicted minimum time to exposure under winter conditions from a 7000m
spill of crude oil occurring over a 24 hour period
Figure 4.7 Predicted weathering of Kitan oil for a continuous release of 1800mspill for a 4ms-1 wind
Figure 4.8 Predicted weathering of Kitan oil for a continuous release of 1800m
spill for a 10ms-1
Figure 4.9 Predicted probability of surface exposure under summer conditions from a continuous 1800m
Figure 4.10 Predicted minimum time to exposure under summer conditions from a
continuous 1800m
Figure 4.11 Predicted probability of surface exposure under winter conditions from a continuous 1800m
Figure 4.12 Predicted minimum time to exposure under winter conditions from a
continuous 1800m
Figure 4.13 Predicted oil spill trajectory and vertical oil concentration (kg/mhypothetical well blowout scenario (Scenario 2)
Figure 4.14 Predicted weathering of Kitan oil for a continuous relea
hours for a 4ms-1
Figure 4.15 Predicted weathering of Kitan oil for a continuous release of 100mhours for a 10ms
Figure 4.16 Probability of surface exposure at day 5 under summer conditions from a
100m3 spill of crude
KITAN OIL SPILL RISK ASSESSMENT MODELLING
Location of the Kitan oilfield ................................................................
Location of the Kitan oilfield in relation to regional seamounts and shoals
Seasonal wind roses for the Timor Sea (Saipem Energy Services 2009)
Timor Sea model grid. ................................................................
Model Bathymetry. ...............................................................................................
Mechanisms included in the three dimensional model ................................
Predicted weathering of Kitan oil for a continuous release of 7000mover 24 hours for a 4ms-1 wind ................................................................
Predicted weathering of Kitan oil for a continuous release of 7000m
over 24 hours for a 10ms-1 wind ................................................................
Probability of surface exposure at day 5 under summer conditions from a spill of crude oil occurring over a 24 hour period ................................
Predicted minimum time to exposure under summer conditions from a
spill of crude oil occurring over a 24 hour period ................................
Probability of surface exposure at day 5 under winter conditions from a spill of crude oil occurring over a 24 hour period ................................
Predicted minimum time to exposure under winter conditions from a 7000m
spill of crude oil occurring over a 24 hour period ................................
Predicted weathering of Kitan oil for a continuous release of 1800mwind ............................................................................................
Predicted weathering of Kitan oil for a continuous release of 1800m1 wind ................................................................
Predicted probability of surface exposure under summer conditions from a continuous 1800m3/day spill of crude oil occurring over a 56 day period
Predicted minimum time to exposure under summer conditions from a
continuous 1800m3/day spill of crude oil occurring over a 56 day period
Predicted probability of surface exposure under winter conditions from a continuous 1800m3/day spill of crude oil occurring over a 56 day period
Predicted minimum time to exposure under winter conditions from a
continuous 1800m3/day spill of crude oil occurring over a 56 day period
Predicted oil spill trajectory and vertical oil concentration (kg/m3) hypothetical well blowout scenario (Scenario 2) ................................
Predicted weathering of Kitan oil for a continuous release of 100m1 wind ................................................................
Predicted weathering of Kitan oil for a continuous release of 100mhours for a 10ms-1 wind ................................................................
Probability of surface exposure at day 5 under summer conditions from a
spill of crude oil occurring over a 6 hour period ................................
.................................................... 4
Location of the Kitan oilfield in relation to regional seamounts and shoals .................. 4
Seasonal wind roses for the Timor Sea (Saipem Energy Services 2009) ..................... 6
.......................................................... 10
............................... 11
............................................. 14
Predicted weathering of Kitan oil for a continuous release of 7000m3 spill ............................................. 18
Predicted weathering of Kitan oil for a continuous release of 7000m3 spill
............................................ 19
Probability of surface exposure at day 5 under summer conditions from a ........................................ 20
Predicted minimum time to exposure under summer conditions from a
........................................ 21
Probability of surface exposure at day 5 under winter conditions from a ........................................ 22
Predicted minimum time to exposure under winter conditions from a 7000m3
.................................................... 23
Predicted weathering of Kitan oil for a continuous release of 1800m3/day ............................ 24
Predicted weathering of Kitan oil for a continuous release of 1800m3/day
.......................................................... 25
Predicted probability of surface exposure under summer conditions from a /day spill of crude oil occurring over a 56 day period .................. 26
Predicted minimum time to exposure under summer conditions from a
/day spill of crude oil occurring over a 56 day period .................. 27
Predicted probability of surface exposure under winter conditions from a g over a 56 day period .................. 28
Predicted minimum time to exposure under winter conditions from a
of crude oil occurring over a 56 day period .................. 29
) for a single ..................................................... 30
se of 100m3 over 6
.......................................................... 33
Predicted weathering of Kitan oil for a continuous release of 100m3 over 6 ........................................................ 33
Probability of surface exposure at day 5 under summer conditions from a
........................................... 35

ENI-JPDA-06-105 PTY LTD
KITAN OIL SPILL RISK ASSESSMENT MODELLING23 September 2010
Figure 4.17 Predicted minimum time to exposure under summer conditions from a
100m3 spill of crude oil occurring over a 6 hour period
Figure 4.18 Probability of surface exposure at day 5 under winter conditions f100m3 spill of crude oil occurring over a 6 hour period
Figure 4.19 Predicted minimum time to exposure under winter condit
spill of crude oil occurring over a 6 hour period
Figure 4.20 Predicted weathering of Kitan oil for an instant4ms-1 wind ................................
Figure 4.21 Predicted weathering of Kitan oil for an instantaneous release of 10m
10ms-1 wind ................................
Figure 4.22 Probability of surface exposure at day 5 under summer conditions from an instantaneous 10m
Figure 4.23 Predicted minimum time to exposure under summer conditions from an
instantaneous 10m
Figure 4.24 Probability of surface exposure at day 5 under winter conditions from an instantaneous 10m
Figure 4.25 Predicted minimum time to exposure under winter conditions from an
instantaneous 10m
Figure 4.26 Predicted weathering of diesel fuel oil for a continuous release of 80m6 hours for a 4ms
Figure 4.27 Probability of surface exposure at day 5 under summer conditions from a
80m3 spill of diesel occurring over a 6 hour period
Figure 4.28 Predicted minimum time to exposure under summer conditions from a 80mspill of diesel occurring over a 6 hour period
Figure 4.29 Probability of surface exposure at day 5 under winter conditions from a
80m3 spill of diesel occurring over a 6 hour period
Figure 4.30 Predicted minimum time to exposure under winter conditions from a 80spill of diesel occurring over a 6 hour period
Figure 4.31 Predicted oil spill trajectory and vertical oil concentration (kg/
hypothetical loss of 80m
Figure 4.32 Predicted weathering of diesel oil for a continuou1 hour for a 4ms
Figure 4.33 Probability of surface exposure at day 5 under summer conditions
2.5m3 spill of diesel occurring over a 1 hour period
Figure 4.34 Predicted minimum time to exposure under summer conditio
spill of diesel occurring over a 1 hour period
Figure 4.35 Probability of surface exposure at day 5 under winter
2.5m3 spill of diesel occurring over a 1 hour period
Figure 4.36 Predicted minimum time to exposure under
spill of diesel occurring over a 6 hour period
KITAN OIL SPILL RISK ASSESSMENT MODELLING
Predicted minimum time to exposure under summer conditions from a
spill of crude oil occurring over a 6 hour period ................................
Probability of surface exposure at day 5 under winter conditions fspill of crude oil occurring over a 6 hour period ................................
Predicted minimum time to exposure under winter conditions from a 100m
spill of crude oil occurring over a 6 hour period ................................
Predicted weathering of Kitan oil for an instantaneous release of 10m................................................................................................
Predicted weathering of Kitan oil for an instantaneous release of 10m
................................................................................................
Probability of surface exposure at day 5 under summer conditions from an instantaneous 10m3 spill of crude oil ................................................................
Predicted minimum time to exposure under summer conditions from an
instantaneous 10m3 spill of crude oil ................................................................
Probability of surface exposure at day 5 under winter conditions from an instantaneous 10m3 spill of crude oil ................................................................
Predicted minimum time to exposure under winter conditions from an
instantaneous 10m3 spill of crude oil ................................................................
Predicted weathering of diesel fuel oil for a continuous release of 80m6 hours for a 4ms-1 wind ................................................................
Probability of surface exposure at day 5 under summer conditions from a
spill of diesel occurring over a 6 hour period ................................
Predicted minimum time to exposure under summer conditions from a 80mspill of diesel occurring over a 6 hour period ................................
Probability of surface exposure at day 5 under winter conditions from a
spill of diesel occurring over a 6 hour period ................................
Predicted minimum time to exposure under winter conditions from a 80spill of diesel occurring over a 6 hour period ................................
Predicted oil spill trajectory and vertical oil concentration (kg/m3) for a single
hypothetical loss of 80m3 of diesel (Scenario 5) ................................
Predicted weathering of diesel oil for a continuous release of 2.5mhour for a 4ms-1 wind ................................................................
Probability of surface exposure at day 5 under summer conditions
spill of diesel occurring over a 1 hour period ................................
Predicted minimum time to exposure under summer conditions from a 2.5m
spill of diesel occurring over a 1 hour period ................................
Probability of surface exposure at day 5 under winter conditions from a
spill of diesel occurring over a 1 hour period ................................
Predicted minimum time to exposure under winter conditions from a 2.5m
spill of diesel occurring over a 6 hour period ................................
Predicted minimum time to exposure under summer conditions from a
........................................... 36
Probability of surface exposure at day 5 under winter conditions from a ........................................... 37
ions from a 100m3
...................................................... 38
aneous release of 10m3 and ........................................... 40
Predicted weathering of Kitan oil for an instantaneous release of 10m3 and
......................................... 40
Probability of surface exposure at day 5 under summer conditions from an ...................................... 41
Predicted minimum time to exposure under summer conditions from an
...................................... 42
Probability of surface exposure at day 5 under winter conditions from an ...................................... 43
Predicted minimum time to exposure under winter conditions from an
...................................... 44
Predicted weathering of diesel fuel oil for a continuous release of 80m3 over ....................................................... 45
Probability of surface exposure at day 5 under summer conditions from a
................................................. 47
Predicted minimum time to exposure under summer conditions from a 80m3 .......................................................... 48
Probability of surface exposure at day 5 under winter conditions from a
................................................. 49
Predicted minimum time to exposure under winter conditions from a 80m3 .......................................................... 50
) for a single
...................................................... 51
s release of 2.5m3 over ........................................................ 54
Probability of surface exposure at day 5 under summer conditions from a
................................................ 56
ns from a 2.5m3
.......................................................... 57
conditions from a
................................................ 58
winter conditions from a 2.5m3
.......................................................... 59

ENI-JPDA-06-105 PTY LTD
KITAN OIL SPILL RISK ASSESSMENT MODELLING23 September 2010
TABLES
Table 2.1 Standard tide levels for Kitan (Saipem Energy Services 2009)
Table 3.1 Expected Kitan oil properties (from Intertek, 2008)
Table 3.2 Properties of diesel fuel oil used in the model
Table 3.3 Summary of oil spill scenarios
Table 5.1: Summary of oil spill trajectory modelling results
KITAN OIL SPILL RISK ASSESSMENT MODELLING
Standard tide levels for Kitan (Saipem Energy Services 2009) ................................
oil properties (from Intertek, 2008) ................................
Properties of diesel fuel oil used in the model ................................
Summary of oil spill scenarios ................................................................
Summary of oil spill trajectory modelling results ................................
................................... 7
................................................ 12
........................................................ 13
............................................... 17
..................................................... 61

ENI-JPDA-06-105 PTY LTD
KITAN OIL SPILL RISK ASSESSMENT MODELLING
23 September 2010
EXECUTIVE SUMMARY
ENI-JPDA-06-105 PTY LTD (Eni) is planning
the region of the Sahul Banks
spill modelling study to predict the trajectory and fate of
event of a spill occurring from the proposed Kitan Oilfield Development.
Six representative spill events for production were analysed:
• Scenario 1: a 7,000m
instantaneous volume that would be spilt in the event of a rupture of a full cargo
tank;
• Scenario 2: a 1,800m
blowout;
• Scenario 3: a 100m3 spill of crude oil over 6 hours, representing the upper end of an
accidental spill such as a transfer hose rupture or process leak;
• Scenario 4: an instantaneous 10m
significant accidental spill;
• Scenario 5: an 80m3 spill of diesel over 6 hours, representing a loss from a ruptured
fuel tank; and
• Scenario 6: a 2.5m3
incident.
The assessment used an oil spill weathering model and coupled hydrodynamic and oil spill
trajectory models for the Timor Sea. The models were run both deterministically and
stochastically. In deterministic mode a single oil spill event is run
mode multiple oil spill trajectory simulations were undertaken using historic wind data for
summer and winter seasons.
The study found that the oil dispersion probability envelopes
seasonal wind patterns. During summer, winds are predominantly from the west and the
probability envelopes extended to the east whereas for winter, the reverse was true.
Environmentally sensitive areas in the region consist of shoals, small seamounts and reefs.
The closest of these, Big Bank Shoals, is located 3km to the southwest of Kitan.
probability of oil spreading to the Big Bank Shoals was over 70% for the larger crude oil
scenarios (7000m3 over 24hrs and
scenarios, and was 30% for the smaller crude spills. The minimum time to reach Big Bank
Shoals was less than three hours during which time the spill volume would reduce by at
least 60% due to evaporation.
KITAN OIL SPILL RISK ASSESSMENT MODELLING
EXECUTIVE SUMMARY
105 PTY LTD (Eni) is planning to develop the Kitan oilfield, which is
Sahul Banks in the Timor Sea. This report presents the findings of an oil
spill modelling study to predict the trajectory and fate of both Kitan crude oil or diesel in the
event of a spill occurring from the proposed Kitan Oilfield Development.
spill events for production were analysed:
Scenario 1: a 7,000m3 spill of crude oil over 24 hours, considered the largest
instantaneous volume that would be spilt in the event of a rupture of a full cargo
Scenario 2: a 1,800m3/day spill of crude oil over 56 days, representing a well
spill of crude oil over 6 hours, representing the upper end of an
accidental spill such as a transfer hose rupture or process leak;
Scenario 4: an instantaneous 10m3 spill of crude oil, representing the lower end of a
significant accidental spill;
spill of diesel over 6 hours, representing a loss from a ruptured
3 spill of diesel spill over 1 hours, representing a refuelling
The assessment used an oil spill weathering model and coupled hydrodynamic and oil spill
trajectory models for the Timor Sea. The models were run both deterministically and
stochastically. In deterministic mode a single oil spill event is run and model. In stochastic
mode multiple oil spill trajectory simulations were undertaken using historic wind data for
the oil dispersion probability envelopes reflected the prevailing
During summer, winds are predominantly from the west and the
bility envelopes extended to the east whereas for winter, the reverse was true.
Environmentally sensitive areas in the region consist of shoals, small seamounts and reefs.
these, Big Bank Shoals, is located 3km to the southwest of Kitan.
probability of oil spreading to the Big Bank Shoals was over 70% for the larger crude oil
over 24hrs and 1800m3/day over 56 days) and for both diesel spill
scenarios, and was 30% for the smaller crude spills. The minimum time to reach Big Bank
Shoals was less than three hours during which time the spill volume would reduce by at
least 60% due to evaporation.
Page 1
to develop the Kitan oilfield, which is located in
This report presents the findings of an oil
both Kitan crude oil or diesel in the
spill of crude oil over 24 hours, considered the largest
instantaneous volume that would be spilt in the event of a rupture of a full cargo
e oil over 56 days, representing a well
spill of crude oil over 6 hours, representing the upper end of an
oil, representing the lower end of a
spill of diesel over 6 hours, representing a loss from a ruptured
spill of diesel spill over 1 hours, representing a refuelling
The assessment used an oil spill weathering model and coupled hydrodynamic and oil spill
trajectory models for the Timor Sea. The models were run both deterministically and
and model. In stochastic
mode multiple oil spill trajectory simulations were undertaken using historic wind data for
reflected the prevailing
During summer, winds are predominantly from the west and the
bility envelopes extended to the east whereas for winter, the reverse was true.
Environmentally sensitive areas in the region consist of shoals, small seamounts and reefs.
these, Big Bank Shoals, is located 3km to the southwest of Kitan. The
probability of oil spreading to the Big Bank Shoals was over 70% for the larger crude oil
days) and for both diesel spill
scenarios, and was 30% for the smaller crude spills. The minimum time to reach Big Bank
Shoals was less than three hours during which time the spill volume would reduce by at

ENI-JPDA-06-105 PTY LTD
KITAN OIL SPILL RISK ASSESSMENT MODELLING
23 September 2010
Deterministic modelling indicated that spilled oil would remain at the sea surface. Thus,
although oil may become entrained into the water column overlying the nearby Big Bank
Shoals (particularly in winter), impacts on the benthic communities would not be expected
to occur due to the water depth (
and the degree of weathering and dilution that would occur prior to any potential contact.
Neither Kitan crude oil or diesel
spill volume and season scenarios
likely to biodegrade at sea and should therefore be monitored and allowed to degrade
naturally without the use of dispersants.
KITAN OIL SPILL RISK ASSESSMENT MODELLING
modelling indicated that spilled oil would remain at the sea surface. Thus,
although oil may become entrained into the water column overlying the nearby Big Bank
Shoals (particularly in winter), impacts on the benthic communities would not be expected
occur due to the water depth (≥20m water depth LAT), distance from the Kitan oilfield,
and the degree of weathering and dilution that would occur prior to any potential contact.
Neither Kitan crude oil or diesel were predicted to make contact with land u
spill volume and season scenarios. Any spill occurring at the Kitan oilfield would be most
likely to biodegrade at sea and should therefore be monitored and allowed to degrade
naturally without the use of dispersants.
Page 2
modelling indicated that spilled oil would remain at the sea surface. Thus,
although oil may become entrained into the water column overlying the nearby Big Bank
Shoals (particularly in winter), impacts on the benthic communities would not be expected
20m water depth LAT), distance from the Kitan oilfield,
and the degree of weathering and dilution that would occur prior to any potential contact.
land under any of the
Any spill occurring at the Kitan oilfield would be most
likely to biodegrade at sea and should therefore be monitored and allowed to degrade

ENI-JPDA-06-105 PTY LTD
KITAN OIL SPILL RISK ASSESSMENT MODELLING23 September 2010
1. INTRODUCTION
1.1 BACKGROUND
ENI-JPDA-06-105 PTY LTD (Eni)
(Figure 1.1). This report presents the findings of stochastic
study to predict the trajectory and fate of both Kitan crude oil or diesel in the event of a spill
occurring during the construction or operation of the Kitan Oilfield Development
results from this work will form part of ENI’s Environment
assist the development of an effective Oil Spill Contingency Plan (OSCP) for the
The Kitan oilfield is situated in Joint Production Development Area (JPDA) in the Timor Sea,
approximately 170km south of the coast of Timor
Australia. It is located on an area of the Australian continental shelf know
Banks, in water depths of approximately 300m. Shallow shoals and small sea mounts occur
along the edge of the shelf (Figure 1.2)
• Big Bank, 3km to the southwest;
• Karmt, 50km to the southwest;
• Echo, 90km to the northeast; and
• Pea Shoals, 200km to the southwest.
Most of these shoals and reefs support assemblages of scleractinian coral as well as coralline
algae. The nearest emergent reefs, Ashmore, Cartier and Hibernia, are located on the
southwest end of Sahul Shelf. The nearest
southwest of the Kitan oilfield.
1.2 OBJECTIVE
The objective of the study is to determine the likely fate of an oil spill occurring during the
development and operation of the Kitan oilfield.
1.3 SCOPE
The scope of this study included:
• a review of Kitan oilfield oil properties;
• an assessment of oil weathering of Kitan oilfield crude
• oil spill trajectory modelling, taking into account Kitan oil properties, weathering
behaviour, and seasonal tide
KITAN OIL SPILL RISK ASSESSMENT MODELLING
INTRODUCTION
105 PTY LTD (Eni) is planning to develop the Kitan oilfield in the Timor Sea
(Figure 1.1). This report presents the findings of stochastic and deterministic
to predict the trajectory and fate of both Kitan crude oil or diesel in the event of a spill
ing during the construction or operation of the Kitan Oilfield Development
results from this work will form part of ENI’s Environment Management
assist the development of an effective Oil Spill Contingency Plan (OSCP) for the
is situated in Joint Production Development Area (JPDA) in the Timor Sea,
approximately 170km south of the coast of Timor-Leste and 360km north of the coast of
Australia. It is located on an area of the Australian continental shelf know
Banks, in water depths of approximately 300m. Shallow shoals and small sea mounts occur
(Figure 1.2), including:
Big Bank, 3km to the southwest;
Karmt, 50km to the southwest;
Echo, 90km to the northeast; and
Shoals, 200km to the southwest.
Most of these shoals and reefs support assemblages of scleractinian coral as well as coralline
algae. The nearest emergent reefs, Ashmore, Cartier and Hibernia, are located on the
southwest end of Sahul Shelf. The nearest, Hibernia reef, is more than 300 km to the
southwest of the Kitan oilfield.
The objective of the study is to determine the likely fate of an oil spill occurring during the
development and operation of the Kitan oilfield.
study included:
a review of Kitan oilfield oil properties;
an assessment of oil weathering of Kitan oilfield crude and Australian diesel
oil spill trajectory modelling, taking into account Kitan oil properties, weathering
behaviour, and seasonal tide and wind conditions.
Page 3
is planning to develop the Kitan oilfield in the Timor Sea
and deterministic modelling
to predict the trajectory and fate of both Kitan crude oil or diesel in the event of a spill
ing during the construction or operation of the Kitan Oilfield Development. The
Management Plan (EMP) and
assist the development of an effective Oil Spill Contingency Plan (OSCP) for the project.
is situated in Joint Production Development Area (JPDA) in the Timor Sea,
Leste and 360km north of the coast of
Australia. It is located on an area of the Australian continental shelf known as the Sahul
Banks, in water depths of approximately 300m. Shallow shoals and small sea mounts occur
Most of these shoals and reefs support assemblages of scleractinian coral as well as coralline
algae. The nearest emergent reefs, Ashmore, Cartier and Hibernia, are located on the
, Hibernia reef, is more than 300 km to the
The objective of the study is to determine the likely fate of an oil spill occurring during the
and Australian diesel; and
oil spill trajectory modelling, taking into account Kitan oil properties, weathering

ENI-JPDA-06-105 PTY LTD
KITAN OIL SPILL RISK ASSESSMENT MODELLING23 September 2010
Figure 1.1 Location of the Kitan oilfield
Figure 1.2 Location of the Kitan oilfield
KITAN OIL SPILL RISK ASSESSMENT MODELLING
Location of the Kitan oilfield
Location of the Kitan oilfield in relation to regional seamounts and shoals
Page 4
in relation to regional seamounts and shoals

ENI-JPDA-06-105 PTY LTD
KITAN OIL SPILL RISK ASSESSMENT MODELLING23 September 2010
2. DESCRIPTION
2.1 CLIMATE
The Timor Sea has two distinct seasons: “winter” from April to September and “summer”
from October to March. The short period between the two seasons is termed the transition
season. During this period, either winter or summer regimes could dominate.
2.1.1 Winter
The “winter” dry season (April to September) is characterised by steady easterly (northeast
to southeast) winds of 5 to 13m/s driven by the South East Trade Winds over Australia.
2.1.2 Summer
The “summer” season (October to March) is the period of the pred
Monsoon. It is characterised by mostly westerly (west
of 5 to 10 days with surges in the airflow of 10 to 18 m/s for the period of 1 to 3 days.
Tropical cyclones can develop between November and Apr
storm events often with strong but variable winds.
2.2 WINDS
Joint frequency distributions were calculated from 10 complete years (July 1997
of verified NCEP ambient modelled data for the Kitan location. Wind ro
summer and transitional seasons are presented in
seasonal variation in prevailing wind direc
persisting from October to March, and a fairly rapid shift to easterlies (northeast
southeast) in late March or early April that then persist until late October or early November
before the return to the wester
KITAN OIL SPILL RISK ASSESSMENT MODELLING
DESCRIPTION OF RECEIVING ENVIRONMENT
The Timor Sea has two distinct seasons: “winter” from April to September and “summer”
from October to March. The short period between the two seasons is termed the transition
season. During this period, either winter or summer regimes could dominate.
The “winter” dry season (April to September) is characterised by steady easterly (northeast
to southeast) winds of 5 to 13m/s driven by the South East Trade Winds over Australia.
The “summer” season (October to March) is the period of the predominant North West
Monsoon. It is characterised by mostly westerly (west-southwest) winds of 5m/s for periods
of 5 to 10 days with surges in the airflow of 10 to 18 m/s for the period of 1 to 3 days.
Tropical cyclones can develop between November and April resulting in short lived, severe
storm events often with strong but variable winds.
Joint frequency distributions were calculated from 10 complete years (July 1997
of verified NCEP ambient modelled data for the Kitan location. Wind ro
summer and transitional seasons are presented in Figure 2.1. These display the expected
seasonal variation in prevailing wind direction, with westerlies (southwest
persisting from October to March, and a fairly rapid shift to easterlies (northeast
southeast) in late March or early April that then persist until late October or early November
before the return to the westerlies.
Page 5
MENT
The Timor Sea has two distinct seasons: “winter” from April to September and “summer”
from October to March. The short period between the two seasons is termed the transition
season. During this period, either winter or summer regimes could dominate.
The “winter” dry season (April to September) is characterised by steady easterly (northeast
to southeast) winds of 5 to 13m/s driven by the South East Trade Winds over Australia.
ominant North West
southwest) winds of 5m/s for periods
of 5 to 10 days with surges in the airflow of 10 to 18 m/s for the period of 1 to 3 days.
il resulting in short lived, severe
Joint frequency distributions were calculated from 10 complete years (July 1997 – Jun 2007)
of verified NCEP ambient modelled data for the Kitan location. Wind roses for the winter,
. These display the expected
tion, with westerlies (southwest-northwest)
persisting from October to March, and a fairly rapid shift to easterlies (northeast –
southeast) in late March or early April that then persist until late October or early November

ENI-JPDA-06-105 PTY LTD
KITAN OIL SPILL RISK ASSESSMENT MODELLING23 September 2010
Figure 2.1 Seasonal wind roses for the Timor Sea
KITAN OIL SPILL RISK ASSESSMENT MODELLING
Seasonal wind roses for the Timor Sea (Saipem Energy Services
Page 6
(Saipem Energy Services 2009)
ENI-JPDA-06-105 PTY LTD
KITAN OIL SPILL RISK ASSESSMENT MODELLING23 September 2010
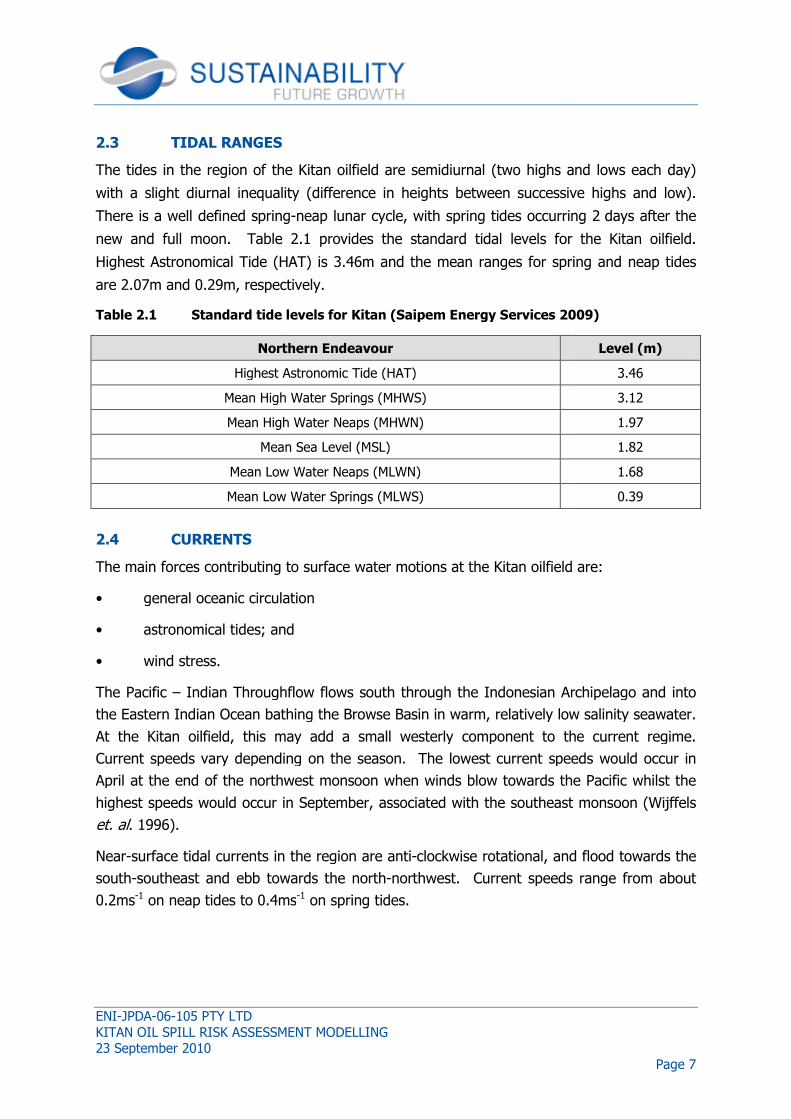
2.3 TIDAL RANGES
The tides in the region of the
with a slight diurnal inequality (difference in heights between successive highs and low).
There is a well defined spring
new and full moon. Table
Highest Astronomical Tide (HAT) is 3.46m and the mean ranges for spring and neap tides
are 2.07m and 0.29m, respectively.
Table 2.1 Standard tide levels for Kitan (Saipem Energy Services 2009)
Northern Endeavour
Highest Astronomic Tide (HAT)
Mean High Water Springs (MHWS)
Mean High Water Neaps (MHWN)
Mean Sea Level (MSL)
Mean Low Water Neaps (MLWN)
Mean Low Water Springs (MLWS)
2.4 CURRENTS
The main forces contributing to surface water motions at the Kitan oilfield are:
• general oceanic circulation
• astronomical tides; and
• wind stress.
The Pacific – Indian Throughflow flows south through the Indonesian Archipelago and into
the Eastern Indian Ocean bathing the Browse Basin in warm, relatively low salinity seawater.
At the Kitan oilfield, this may ad
Current speeds vary depending on the season. The lowest current speeds would occur in
April at the end of the northwest monsoon when winds blow towards the
highest speeds would occur in September, associated with the southeast monsoon (Wijffels
et. al. 1996).
Near-surface tidal currents in the region are anti
south-southeast and ebb towards the north
0.2ms-1 on neap tides to 0.4ms
KITAN OIL SPILL RISK ASSESSMENT MODELLING
the Kitan oilfield are semidiurnal (two highs and lows each day)
with a slight diurnal inequality (difference in heights between successive highs and low).
There is a well defined spring-neap lunar cycle, with spring tides occurring 2
Table 2.1 provides the standard tidal levels for the Kitan
Highest Astronomical Tide (HAT) is 3.46m and the mean ranges for spring and neap tides
are 2.07m and 0.29m, respectively.
Standard tide levels for Kitan (Saipem Energy Services 2009)
Northern Endeavour
Highest Astronomic Tide (HAT)
Mean High Water Springs (MHWS)
Mean High Water Neaps (MHWN)
Mean Sea Level (MSL)
Mean Low Water Neaps (MLWN)
Mean Low Water Springs (MLWS)
The main forces contributing to surface water motions at the Kitan oilfield are:
general oceanic circulation
astronomical tides; and
Indian Throughflow flows south through the Indonesian Archipelago and into
the Eastern Indian Ocean bathing the Browse Basin in warm, relatively low salinity seawater.
At the Kitan oilfield, this may add a small westerly component to the current regime.
Current speeds vary depending on the season. The lowest current speeds would occur in
April at the end of the northwest monsoon when winds blow towards the
in September, associated with the southeast monsoon (Wijffels
surface tidal currents in the region are anti-clockwise rotational, and flood towards the
southeast and ebb towards the north-northwest. Current speeds range from ab
on neap tides to 0.4ms-1 on spring tides.
Page 7
are semidiurnal (two highs and lows each day)
with a slight diurnal inequality (difference in heights between successive highs and low).
neap lunar cycle, with spring tides occurring 2 days after the
provides the standard tidal levels for the Kitan oilfield.
Highest Astronomical Tide (HAT) is 3.46m and the mean ranges for spring and neap tides
Standard tide levels for Kitan (Saipem Energy Services 2009)
Level (m)
3.46
3.12
1.97
1.82
1.68
0.39
The main forces contributing to surface water motions at the Kitan oilfield are:
Indian Throughflow flows south through the Indonesian Archipelago and into
the Eastern Indian Ocean bathing the Browse Basin in warm, relatively low salinity seawater.
d a small westerly component to the current regime.
Current speeds vary depending on the season. The lowest current speeds would occur in
April at the end of the northwest monsoon when winds blow towards the Pacific whilst the
in September, associated with the southeast monsoon (Wijffels
clockwise rotational, and flood towards the
northwest. Current speeds range from about

ENI-JPDA-06-105 PTY LTD
KITAN OIL SPILL RISK ASSESSMENT MODELLING23 September 2010
Surface currents are expected to reflect seasonal wind regimes. The‘typical ‘rule of thumb’
for wind driven surface currents is that they are approximately 2
10m above the sea surface. Local wind
of 0.7ms-1 during extreme monsoonal or Trade Wind surges. More typically however, wind
driven surface current speeds would be in the range of 0.2ms
2.5 WAVES
Waves at the Kitan oilfield will comprise contributions from:
• Southern Ocean swells;
• summer monsoonal swells;
• winter easterly swells; and
• locally generated seas.
The most persistent swell arrives from the south and southwest with typical heights of 1m in
summer and 2m in winter. Since longer period swell suffers less dissipation, periods of
long-travelled swell commonly reach 18 seconds and occasionally exceed 20 seconds.
Shorter period swell (6 to 10 seconds) may result from summer westerlies over the wester
portions of the Timor Sea, winter easterlies over the Arafura Sea and the eastern portions of
the Timor Sea and from tropical cyclones.
Local wind-generated sea is highly variable but typically ranges in period from 2 to 6
seconds with heights of up to 6
et. al. 1994).
2.6 WATER TEMPERATURES
Surface sea temperatures in the vicinity of the Kitan oilfield are expected to range from
about 30°C in summer to 28°C in winter.
KITAN OIL SPILL RISK ASSESSMENT MODELLING
Surface currents are expected to reflect seasonal wind regimes. The‘typical ‘rule of thumb’
for wind driven surface currents is that they are approximately 2% – 4% of the wind speed
surface. Local wind-driven surface currents may attain maximum speeds
during extreme monsoonal or Trade Wind surges. More typically however, wind
driven surface current speeds would be in the range of 0.2ms-1 to 0.4ms-1
itan oilfield will comprise contributions from:
Southern Ocean swells;
summer monsoonal swells;
winter easterly swells; and
locally generated seas.
The most persistent swell arrives from the south and southwest with typical heights of 1m in
and 2m in winter. Since longer period swell suffers less dissipation, periods of
travelled swell commonly reach 18 seconds and occasionally exceed 20 seconds.
Shorter period swell (6 to 10 seconds) may result from summer westerlies over the wester
portions of the Timor Sea, winter easterlies over the Arafura Sea and the eastern portions of
the Timor Sea and from tropical cyclones.
generated sea is highly variable but typically ranges in period from 2 to 6
seconds with heights of up to 6m during strong persistent forcing at some locations (Swan
WATER TEMPERATURES
Surface sea temperatures in the vicinity of the Kitan oilfield are expected to range from
about 30°C in summer to 28°C in winter.
Page 8
Surface currents are expected to reflect seasonal wind regimes. The‘typical ‘rule of thumb’
4% of the wind speed
driven surface currents may attain maximum speeds
during extreme monsoonal or Trade Wind surges. More typically however, wind-
.
The most persistent swell arrives from the south and southwest with typical heights of 1m in
and 2m in winter. Since longer period swell suffers less dissipation, periods of
travelled swell commonly reach 18 seconds and occasionally exceed 20 seconds.
Shorter period swell (6 to 10 seconds) may result from summer westerlies over the western
portions of the Timor Sea, winter easterlies over the Arafura Sea and the eastern portions of
generated sea is highly variable but typically ranges in period from 2 to 6
m during strong persistent forcing at some locations (Swan
Surface sea temperatures in the vicinity of the Kitan oilfield are expected to range from

ENI-JPDA-06-105 PTY LTD
KITAN OIL SPILL RISK ASSESSMENT MODELLING23 September 2010
3. METHODS
3.1 GENERAL
The trajectory and fate of Kitan crude oil and diesel were modelled using an
trajectory model comprising three modules:
• a hydrodynamic module that provides the necessary velocity fields to advect the oil;
• an oil spill weathering module that predicts the beha
environment; and
• an oil spill trajectory module that simulates the fate of the oil.
These modules are described in more detail in the following subsections.
3.2 HYDRODYNAMIC MODEL
3.2.1 Tidal hydrodynamics
The hydrodynamics applied in the present study were computed
HYbrid Coordinate Ocean Model (HYCOM) and the finite elements model QUODDY.
is a data-compiled hybrid generalised coordinate ocean model, sponsored by the National
Ocean Partnership Program as part of the U. S. Global Ocean Data Assimilation Experiment.
Computations are carried out on a cylindrical map projection grid between 78°S and 47°N
(1/12° equatorial resolution), where the horizontal dimensions of the global gr
3298 grid points resulting in ~7 km spacing on average. Daily hindcast values are available
from 3 November 2003 to the present day.
QUODDY solves the time dependent, free surface circulation problems in three
(Ip and Lynch 1995). The algorithms that comprise QUODDY utilise the finite element
method in space and the model can be applied to computational domains encompassing the
Deep Ocean, continental shelves, coastal seas and estuarine systems.
Model grid and bathymetry are sho
bathymetry was interpolated from the Australian Geological Survey Office database. The
model was forced from the open boundary by tidal elevations calculated from the M2,
N2, O1 and K1 tidal constituents. Amplitudes and phases for these were taken from the
FES-95.2 global ocean model (Le Provost
The model has undergone extensive validation and found to compare favourably against
measured currents and tidal elevations in the Timor Sea.
KITAN OIL SPILL RISK ASSESSMENT MODELLING
d fate of Kitan crude oil and diesel were modelled using an
three modules:
a hydrodynamic module that provides the necessary velocity fields to advect the oil;
an oil spill weathering module that predicts the behaviour of the oil in the receiving
an oil spill trajectory module that simulates the fate of the oil.
These modules are described in more detail in the following subsections.
HYDRODYNAMIC MODEL
Tidal hydrodynamics
The hydrodynamics applied in the present study were computed using a combination of
HYbrid Coordinate Ocean Model (HYCOM) and the finite elements model QUODDY.
compiled hybrid generalised coordinate ocean model, sponsored by the National
cean Partnership Program as part of the U. S. Global Ocean Data Assimilation Experiment.
Computations are carried out on a cylindrical map projection grid between 78°S and 47°N
(1/12° equatorial resolution), where the horizontal dimensions of the global gr
3298 grid points resulting in ~7 km spacing on average. Daily hindcast values are available
from 3 November 2003 to the present day.
QUODDY solves the time dependent, free surface circulation problems in three
. The algorithms that comprise QUODDY utilise the finite element
method in space and the model can be applied to computational domains encompassing the
Deep Ocean, continental shelves, coastal seas and estuarine systems.
Model grid and bathymetry are shown in Figure 3.1 and Figure 3.2,
bathymetry was interpolated from the Australian Geological Survey Office database. The
model was forced from the open boundary by tidal elevations calculated from the M2,
N2, O1 and K1 tidal constituents. Amplitudes and phases for these were taken from the
ocean model (Le Provost et al. 1998).
The model has undergone extensive validation and found to compare favourably against
idal elevations in the Timor Sea.
Page 9
d fate of Kitan crude oil and diesel were modelled using an oil spill
a hydrodynamic module that provides the necessary velocity fields to advect the oil;
viour of the oil in the receiving
using a combination of
HYbrid Coordinate Ocean Model (HYCOM) and the finite elements model QUODDY. HYCOM
compiled hybrid generalised coordinate ocean model, sponsored by the National
cean Partnership Program as part of the U. S. Global Ocean Data Assimilation Experiment.
Computations are carried out on a cylindrical map projection grid between 78°S and 47°N
(1/12° equatorial resolution), where the horizontal dimensions of the global grid are 4500 x
3298 grid points resulting in ~7 km spacing on average. Daily hindcast values are available
QUODDY solves the time dependent, free surface circulation problems in three dimensions
. The algorithms that comprise QUODDY utilise the finite element
method in space and the model can be applied to computational domains encompassing the
respectively. The
bathymetry was interpolated from the Australian Geological Survey Office database. The
model was forced from the open boundary by tidal elevations calculated from the M2, S2,
N2, O1 and K1 tidal constituents. Amplitudes and phases for these were taken from the
The model has undergone extensive validation and found to compare favourably against

ENI-JPDA-06-105 PTY LTD
KITAN OIL SPILL RISK ASSESSMENT MODELLING23 September 2010
Figure 3.1 Timor Sea model grid.
122 124
−22
−20
−18
−16
−14
−12
−10
−8
−6
−4
−2
KITAN OIL SPILL RISK ASSESSMENT MODELLING
Timor Sea model grid.
126 128 130 132 134
Page 10
136

ENI-JPDA-06-105 PTY LTD
KITAN OIL SPILL RISK ASSESSMENT MODELLING23 September 2010
Figure 3.2 Model Bathymetry.
3.2.2 Wind Data
Verified NCEP modelled wind
Seasonal wind roses are shown in Figure 2.1. Two distinct seasons are evident: summer
and winter.
122 124
−20
−18
−16
−14
−12
−10
−8
−6
−4
1000 1000
1000
1000
500
1000
500
100
100100
50
Nor
thin
g(m
)
KITAN OIL SPILL RISK ASSESSMENT MODELLING
Model Bathymetry.
wind data for the Kitan location were applied in the model.
Seasonal wind roses are shown in Figure 2.1. Two distinct seasons are evident: summer
126 128 130 132 134
1000
500 100 10050
50
50
500500
500500
1000 100
50
100
50
5050
Easting (m)
Page 11
were applied in the model.
Seasonal wind roses are shown in Figure 2.1. Two distinct seasons are evident: summer
136
50
50

ENI-JPDA-06-105 PTY LTD
KITAN OIL SPILL RISK ASSESSMENT MODELLING23 September 2010
3.3 OIL SPILL WEATHERING
The National Oceanic and Atmospheric Administration’s (NOAA’s) Automated Data Inquiry
for Oil Spills (ADIOS2) model was used to simulate detailed evaporation, dispersion and
emulsification of the spill. Input data for ADIOS2 includes:
• oil properties (API, viscosity, distillation curves);
• spill details (volume and duration of the spill); and
• environmental data (wind and sea surface temperature).
3.3.1 Kitan Oil
The properties of Kitan crude
in Table 3.1. It is a light crude with an API of 57° and a specific gravity of 0.751. The
distillation cuts indicate that about 80% of the oil is volatile or semi
boiling off at less than 265°C) suggesting that it will evaporate readily.
Asphaltene and wax concentration
Studies with a sample of Kitan oil showed that no persistent viscous/solid emulsion layers
were observed in the water cuts ranging from 5 to 70 volume percent at 7.6°C (EAL, 2009).
The oil is therefore not expected to form a stable emulsion at the temperatures found in the
Timor Sea.
Table 3.1 Expected Kitan
Kinematic Viscosity (cSt)
Distillation Cuts
KITAN OIL SPILL RISK ASSESSMENT MODELLING
OIL SPILL WEATHERING MODULE
The National Oceanic and Atmospheric Administration’s (NOAA’s) Automated Data Inquiry
Spills (ADIOS2) model was used to simulate detailed evaporation, dispersion and
emulsification of the spill. Input data for ADIOS2 includes:
oil properties (API, viscosity, distillation curves);
spill details (volume and duration of the spill); and
environmental data (wind and sea surface temperature).
crude oil were characterised by Intertek (2008) and
light crude with an API of 57° and a specific gravity of 0.751. The
distillation cuts indicate that about 80% of the oil is volatile or semi-volatile (percentage
s than 265°C) suggesting that it will evaporate readily.
sphaltene and wax concentration are low (<0.05%mass and <5%mass
Studies with a sample of Kitan oil showed that no persistent viscous/solid emulsion layers
cuts ranging from 5 to 70 volume percent at 7.6°C (EAL, 2009).
The oil is therefore not expected to form a stable emulsion at the temperatures found in the
Kitan oil properties (from Intertek, 2008)
Parameter Value
API 56.8
Specific Gravity 0.751
Kinematic Viscosity (cSt) 1.04@20°C
Asphaltene <0.05%mass
Wax <5%mass
Distillation Cuts Temp
(°C)
Mass %
30 8
60 12
90 29
120 47
150 57
180 68
210 74
230 78
270 86
300 90
Page 12
The National Oceanic and Atmospheric Administration’s (NOAA’s) Automated Data Inquiry
Spills (ADIOS2) model was used to simulate detailed evaporation, dispersion and
oil were characterised by Intertek (2008) and are summarised
light crude with an API of 57° and a specific gravity of 0.751. The
volatile (percentage
<5%mass, respectively).
Studies with a sample of Kitan oil showed that no persistent viscous/solid emulsion layers
cuts ranging from 5 to 70 volume percent at 7.6°C (EAL, 2009).
The oil is therefore not expected to form a stable emulsion at the temperatures found in the

ENI-JPDA-06-105 PTY LTD
KITAN OIL SPILL RISK ASSESSMENT MODELLING23 September 2010
3.3.2 Diesel
Diesel is a light petroleum distillate.
density in the range 0.84 to 0.88 g cm
and -30°C. As such they are classed as Group II oils
expected to undergo a rapid spreading with moderate evaporative loss in tropical waters
and, consequently, slicks are likely to break up. Diesel oils tend not to form emulsions at
the temperatures likely to be found in th
of the slick or evaporation rates.
For the purpose of modelling, the API was set at of 32° and viscosity at 4cSt (
Distillation cuts were obtained from the ADIOS2 database. These indicate that just over
30% of the oil is volatile or semi
Table 3.2 Properties of di
Parameter
API (°)
Viscosity @15°C (cSt)
Pour Point (°C)
Distillation Cuts
Temp
160
180
200
250
300
350
400
3.4 OIL SPILL TRAJECTORY
The oil spill module is based on the classic random walk pa
(Sherwin 1992) and assumes that the oil can be idealised as a large number of particles that
move independently under the action of tide and wind. The oil spill trajectory m
integrally linked with the finite element model and uses a highly accurate fourth order
Runge-Kutta method to track particles (Blanton
KITAN OIL SPILL RISK ASSESSMENT MODELLING
Diesel is a light petroleum distillate. Different diesels have varying properties, but have a
density in the range 0.84 to 0.88 g cm-3 (30 – 32 °API), with pour points of between
ey are classed as Group II oils i.e. light persistent oils. Diesels are
expected to undergo a rapid spreading with moderate evaporative loss in tropical waters
and, consequently, slicks are likely to break up. Diesel oils tend not to form emulsions at
the temperatures likely to be found in the Timor Sea and so these will not inhibit spreading
of the slick or evaporation rates.
For the purpose of modelling, the API was set at of 32° and viscosity at 4cSt (
Distillation cuts were obtained from the ADIOS2 database. These indicate that just over
30% of the oil is volatile or semi-volatile (proportion boiling off at less than 265°C).
Properties of diesel fuel oil used in the model
Parameter Heavy Oil
API (°) 32
Viscosity @15°C (cSt) 4
Pour Point (°C) -14
Distillation Cuts
Temp (°C) Vol %
160 3
180 6
200 11
250 31
300 63
350 89
400 99
OIL SPILL TRAJECTORY MODULE
The oil spill module is based on the classic random walk particle tracking method
1992) and assumes that the oil can be idealised as a large number of particles that
move independently under the action of tide and wind. The oil spill trajectory m
integrally linked with the finite element model and uses a highly accurate fourth order
ck particles (Blanton 1995).
Page 13
properties, but have a
32 °API), with pour points of between -17°C
ght persistent oils. Diesels are
expected to undergo a rapid spreading with moderate evaporative loss in tropical waters
and, consequently, slicks are likely to break up. Diesel oils tend not to form emulsions at
e Timor Sea and so these will not inhibit spreading
For the purpose of modelling, the API was set at of 32° and viscosity at 4cSt (Table 3.2).
Distillation cuts were obtained from the ADIOS2 database. These indicate that just over
volatile (proportion boiling off at less than 265°C).
rticle tracking method
1992) and assumes that the oil can be idealised as a large number of particles that
move independently under the action of tide and wind. The oil spill trajectory model is
integrally linked with the finite element model and uses a highly accurate fourth order

ENI-JPDA-06-105 PTY LTD
KITAN OIL SPILL RISK ASSESSMENT MODELLING23 September 2010
Physical mechanisms included in the model are summarised in
• advection by ambient
• dispersion due to turbulence
• buoyancy.
Figure 3.3 Mechanisms included in the three dimensional model
Advection is calculated by stepping through the variations in the current field in time.
effects of wind induced surface shear are modelled by the inclusion of a logarithmic velocity
profile. It is assumed that the surface layer, of thickness z
3% of the wind speed) and that the wind induced velocity decays with depth according to:
Where zc is the depth at which the velocity is zero. It is assumed that z
wavelength (L) of the surface waves, z
been set to 4. z0 is also a free parameter in the model and has been set to 1 cm.
Current Wind
zc
Z0
Depth
KITAN OIL SPILL RISK ASSESSMENT MODELLING
Physical mechanisms included in the model are summarised in Figure 3.3
ambient currents (tide, residual, wind and wave);
dispersion due to turbulence; and
Mechanisms included in the three dimensional model
Advection is calculated by stepping through the variations in the current field in time.
induced surface shear are modelled by the inclusion of a logarithmic velocity
profile. It is assumed that the surface layer, of thickness z0, moves at a velocity U
3% of the wind speed) and that the wind induced velocity decays with depth according to:
)/log(
)/log(1(
0
0
zz
zzUU
csz −=
is the depth at which the velocity is zero. It is assumed that z
wavelength (L) of the surface waves, zc = µL. µ is a free parameter in the model and has
is also a free parameter in the model and has been set to 1 cm.
Wind Waves
Diffusion
Page 14
and include:
Advection is calculated by stepping through the variations in the current field in time. The
induced surface shear are modelled by the inclusion of a logarithmic velocity
, moves at a velocity Us (typically
3% of the wind speed) and that the wind induced velocity decays with depth according to:
is the depth at which the velocity is zero. It is assumed that zc scales on the
µ is a free parameter in the model and has
is also a free parameter in the model and has been set to 1 cm.
Buoyancy

ENI-JPDA-06-105 PTY LTD
KITAN OIL SPILL RISK ASSESSMENT MODELLING23 September 2010
Waves are accounted for by including the Stokes drift to linear waves:
Where a is the wave amplitud
of period T and wavelength
provided in the U.S. Army Corps of Engineers Shore
and fetch are determined in the model from the grid data. At an open grid boundary, a fetch
of 100 km (i.e. virtually non-limiting) is assumed.
Dispersion is included by subjecting each particle to a random displaceme
step. The dispersive displacement (random step) of each particle at each time step (dt) is
scaled by the square root of the increment in the variance of the effluent plume which is
given by the product:
where K is the horizontal (Kxy
taken by each particle is also determined by a random number selected from a normal
distribution with zero mean and unit variance which is scaled by the product (2
in the x, y and z co-ordinate directions are made independently. Steps in the vertical plane
allow for reflection of the particle from the seabed and surface. The current velocity applied
to each particle is corrected according to its level
relationship.
The horizontal dispersion coefficient is approximated from data on dye diffusion studies
reported by Okubo (1971, 1974) as reviewed by Bowden (1983):
As the variance of a cloud increas
increasingly larger spatial scales, such that the apparent dispersion coefficient increases with
time. A maximum of 100 m2/day is applied here, in accordance with Kullenberg (1982).
The vertical turbulent diffusion coefficient above the pycnocline is related to the wave
conditions following Ichiye (1967):
Below the pycnocline depth, K
1982).
KITAN OIL SPILL RISK ASSESSMENT MODELLING
Waves are accounted for by including the Stokes drift to linear waves:
)(sinh2
))(2cosh(2
2
kH
zHkkaU z
−= ω
is the wave amplitude, H is the water depth, w = 2π /T and k
and wavelength L. Wave height and period are calculated from equations
provided in the U.S. Army Corps of Engineers Shore Protection Manual (1984). Local depth
and fetch are determined in the model from the grid data. At an open grid boundary, a fetch
limiting) is assumed.
Dispersion is included by subjecting each particle to a random displaceme
step. The dispersive displacement (random step) of each particle at each time step (dt) is
scaled by the square root of the increment in the variance of the effluent plume which is
(increment in variance) = 2Kdt
xy ) or vertical ( Kz) diffusion coefficient. The actual step length
taken by each particle is also determined by a random number selected from a normal
distribution with zero mean and unit variance which is scaled by the product (2
ordinate directions are made independently. Steps in the vertical plane
allow for reflection of the particle from the seabed and surface. The current velocity applied
to each particle is corrected according to its level in the water column using a power law
The horizontal dispersion coefficient is approximated from data on dye diffusion studies
reported by Okubo (1971, 1974) as reviewed by Bowden (1983):
Kx = 0.0027 t1.34
As the variance of a cloud increases, the cloud is dispersed by turbulence associated with
increasingly larger spatial scales, such that the apparent dispersion coefficient increases with
/day is applied here, in accordance with Kullenberg (1982).
bulent diffusion coefficient above the pycnocline is related to the wave
conditions following Ichiye (1967):
)2exp(028.02
kzT
HK z −=
Below the pycnocline depth, Kz is assumed to be a constant equal to 10-
Page 15
k = 2π /L for waves
. Wave height and period are calculated from equations
Protection Manual (1984). Local depth
and fetch are determined in the model from the grid data. At an open grid boundary, a fetch
Dispersion is included by subjecting each particle to a random displacement at each time
step. The dispersive displacement (random step) of each particle at each time step (dt) is
scaled by the square root of the increment in the variance of the effluent plume which is
) diffusion coefficient. The actual step length
taken by each particle is also determined by a random number selected from a normal
distribution with zero mean and unit variance which is scaled by the product (2Kdt). Steps
ordinate directions are made independently. Steps in the vertical plane
allow for reflection of the particle from the seabed and surface. The current velocity applied
in the water column using a power law
The horizontal dispersion coefficient is approximated from data on dye diffusion studies
es, the cloud is dispersed by turbulence associated with
increasingly larger spatial scales, such that the apparent dispersion coefficient increases with
/day is applied here, in accordance with Kullenberg (1982).
bulent diffusion coefficient above the pycnocline is related to the wave
4 m2/s (Kullenberg,

ENI-JPDA-06-105 PTY LTD
KITAN OIL SPILL RISK ASSESSMENT MODELLING23 September 2010
Vertical advection is included as a rise velocity due to buoyancy effects. This is a function of
the diameter and density of the droplets. For small particles d < d
ν is viscosity of sea water, ρ
density of sea water, then the rise velocity, U
Water properties and atmospheric conditions were input to the model to predic
behaviour and fate of the oil.
(Fay 1969) and evaporation (Fingas 1999)
The model can be run in deterministic or stochastic mode. In deterministic mode, a single
oil spill scenario was run. In stochastic mode,
spill time selected randomly from the prevailing wind and tide conditions. This approach
provides a more informative estimate of the risk of hydrocarbon exposure as it pro
statistical weighting to the potential outcomes of a spill based on the frequency of
occurrence of different ambient environmental conditions. The model output was presented
as contour plots showing:
• the probability of surface exposure to oil; and
• the minimum time until contact.
In stochastic mode, processes that were modelled included spreading, evaporation and
advection of the oil. Once a simulated particle reached a shoreline it was regarded as
stranded. The location, drift time and remainin
was no longer tracked (i.e. no out
model).
KITAN OIL SPILL RISK ASSESSMENT MODELLING
included as a rise velocity due to buoyancy effects. This is a function of
the diameter and density of the droplets. For small particles d < dc, where
dc =
wg ρ
ρν
03/1
3/2
1(
52.9
−
oρ is the density of the droplet for diameter d and
density of sea water, then the rise velocity, UB, is given by a Stokes Law:
νρ
ρ
18
1(2
w
o
B
gdU
−=
Water properties and atmospheric conditions were input to the model to predic
ehaviour and fate of the oil. Industry standard algorithms were used to predict spreading
and evaporation (Fingas 1999) of hydrocarbons.
can be run in deterministic or stochastic mode. In deterministic mode, a single
ill scenario was run. In stochastic mode, 200 simulations were undertaken with the
spill time selected randomly from the prevailing wind and tide conditions. This approach
provides a more informative estimate of the risk of hydrocarbon exposure as it pro
statistical weighting to the potential outcomes of a spill based on the frequency of
occurrence of different ambient environmental conditions. The model output was presented
the probability of surface exposure to oil; and
the minimum time until contact.
In stochastic mode, processes that were modelled included spreading, evaporation and
advection of the oil. Once a simulated particle reached a shoreline it was regarded as
stranded. The location, drift time and remaining oil mass were registered and the particle
was no longer tracked (i.e. no out-washing of oil from the shore was allowed for in the
Page 16
included as a rise velocity due to buoyancy effects. This is a function of
, where
is the density of the droplet for diameter d and wρ is the
Water properties and atmospheric conditions were input to the model to predict the
Industry standard algorithms were used to predict spreading
can be run in deterministic or stochastic mode. In deterministic mode, a single
200 simulations were undertaken with the
spill time selected randomly from the prevailing wind and tide conditions. This approach
provides a more informative estimate of the risk of hydrocarbon exposure as it provides
statistical weighting to the potential outcomes of a spill based on the frequency of
occurrence of different ambient environmental conditions. The model output was presented
In stochastic mode, processes that were modelled included spreading, evaporation and
advection of the oil. Once a simulated particle reached a shoreline it was regarded as
g oil mass were registered and the particle
washing of oil from the shore was allowed for in the
ENI-JPDA-06-105 PTY LTD
KITAN OIL SPILL RISK ASSESSMENT MODELLING23 September 2010
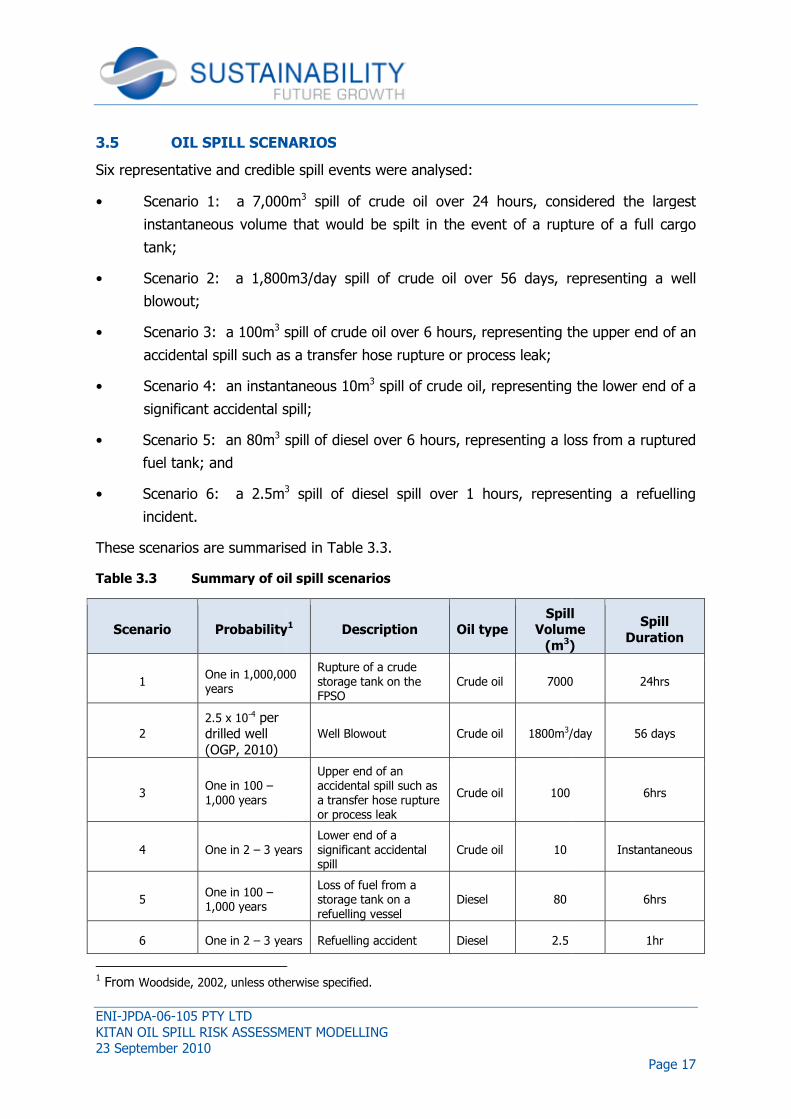
3.5 OIL SPILL SCENARIOS
Six representative and credible spill events were analysed:
• Scenario 1: a 7,000m
instantaneous volume that
tank;
• Scenario 2: a 1,800m
blowout;
• Scenario 3: a 100m3 spill of crude oil over 6 hours, representing the upper end of an
accidental spill such as a transfer hose rupture or process leak;
• Scenario 4: an instantaneous 10m
significant accidental spill;
• Scenario 5: an 80m3 spill of diesel over 6 hours, representing a loss from a ruptured
fuel tank; and
• Scenario 6: a 2.5m3
incident.
These scenarios are summarised in Table 3.
Table 3.3 Summary of oil spill scenarios
Scenario Probability
1 One in 1,000,000 years
2
2.5 x 10⁻⁴ per
drilled well
(OGP, 2010)
3 One in 100 –
1,000 years
4 One in 2 – 3 years
5 One in 100 – 1,000 years
6 One in 2 – 3 years
1 From Woodside, 2002, unless otherwise specified.
KITAN OIL SPILL RISK ASSESSMENT MODELLING
OIL SPILL SCENARIOS
representative and credible spill events were analysed:
7,000m3 spill of crude oil over 24 hours, considered the largest
instantaneous volume that would be spilt in the event of a rupture of a full cargo
1,800m3/day spill of crude oil over 56 days, representing a well
spill of crude oil over 6 hours, representing the upper end of an
accidental spill such as a transfer hose rupture or process leak;
Scenario 4: an instantaneous 10m3 spill of crude oil, representing the lower end of a
significant accidental spill;
spill of diesel over 6 hours, representing a loss from a ruptured
3 spill of diesel spill over 1 hours, representing a refuelling
These scenarios are summarised in Table 3.3.
Summary of oil spill scenarios
Probability1 Description Oil type Spill
Volume
(m3)
One in 1,000,000 Rupture of a crude
storage tank on the FPSO
Crude oil 7000
Well Blowout Crude oil 1800m3/day
Upper end of an accidental spill such as
a transfer hose rupture or process leak
Crude oil 100
3 years
Lower end of a
significant accidental spill
Crude oil 10
Loss of fuel from a storage tank on a
refuelling vessel
Diesel 80
3 years Refuelling accident Diesel 2.5
Woodside, 2002, unless otherwise specified.
Page 17
considered the largest
ould be spilt in the event of a rupture of a full cargo
days, representing a well
spill of crude oil over 6 hours, representing the upper end of an
spill of crude oil, representing the lower end of a
spill of diesel over 6 hours, representing a loss from a ruptured
spill of diesel spill over 1 hours, representing a refuelling
Spill Volume
)
Spill
Duration
7000 24hrs
/day 56 days
6hrs
Instantaneous
6hrs
1hr

ENI-JPDA-06-105 PTY LTD
KITAN OIL SPILL RISK ASSESSMENT MODELLING23 September 2010
4. RESULTS
4.1 EVENT 1: LOSS OF 70
4.1.1 Predicted Weathering Behaviour
Figure 4.1 and Figure 4.2 show the results from the ADIOS2 modelling for light and strong
winds, respectively. Under light winds (4ms
evaporate within 24 hours, 1% is predict
leaving 39% on the sea surface (Figure 4.1). After five days, these numbers increase to
80%, 3% and 17%, respectively.
Under strong winds (10ms-1), approximately 65% of the original spill volume is predicted to
evaporate within 24 hours, 5
leaving just 30% on the sea surface (Figure 4.2). After five days, these numbers increase to
80%, 12% and 8%, respectively.
Figure 4.1 Predicted weathering of Kitan oil for a continuous release of 7000m
over 24 hours for a 4ms
KITAN OIL SPILL RISK ASSESSMENT MODELLING
EVENT 1: LOSS OF 7000M3 OF CRUDE OVER 24 HOURS
Predicted Weathering Behaviour
show the results from the ADIOS2 modelling for light and strong
Under light winds (4ms-1), approximately 60% of the oil is predicted to
evaporate within 24 hours, 1% is predicted to become entrained into the water column
leaving 39% on the sea surface (Figure 4.1). After five days, these numbers increase to
80%, 3% and 17%, respectively.
), approximately 65% of the original spill volume is predicted to
5% is predicted to become entrained into the water column
% on the sea surface (Figure 4.2). After five days, these numbers increase to
80%, 12% and 8%, respectively.
Predicted weathering of Kitan oil for a continuous release of 7000m
over 24 hours for a 4ms-1 wind
Page 18
RS
show the results from the ADIOS2 modelling for light and strong
), approximately 60% of the oil is predicted to
ed to become entrained into the water column
leaving 39% on the sea surface (Figure 4.1). After five days, these numbers increase to
), approximately 65% of the original spill volume is predicted to
% is predicted to become entrained into the water column
% on the sea surface (Figure 4.2). After five days, these numbers increase to
Predicted weathering of Kitan oil for a continuous release of 7000m3 spill

ENI-JPDA-06-105 PTY LTD
KITAN OIL SPILL RISK ASSESSMENT MODELLING23 September 2010
Figure 4.2 Predicted weathering of Kitan oil for a continuous release of 7000m
over 24 hours for a 10ms
4.1.2 Stochastic Modelling
Under summer conditions, the outer (1%) probability envelope extended 125km to the east
and 50km to the west, reflecting the predominant wind direction during this season
(Figure 4.3). Under this scenario, there was a 70% probability that oil would reach the Big
Bank Shoals and 1% probability of reaching the Karmt Shoals. The predicted minimum time
to exposure at Big Bank Shoals was three hours (Figure 4.4) by which time the spill would
have evaporated by about 50% of its original volume. The spill was not predicted to make
contact with land.
Under winter conditions, the outer (1%) probability envelope extended 100km to the west
and <50km to the east, reflecting the predominant wind direction du
(Figure 4.5). Under this scenario, there was a >80% probability that oil would reach the Big
Bank Shoals and 1 to 5% probability of reaching the Karmt Shoals. The predicted minimum
time to exposure at Big Bank Shoals was three hours (Fig
would have evaporated by 50% of its original volume. The spill was not predicted to make
contact with land.
KITAN OIL SPILL RISK ASSESSMENT MODELLING
Predicted weathering of Kitan oil for a continuous release of 7000m
over 24 hours for a 10ms-1 wind
Stochastic Modelling
Under summer conditions, the outer (1%) probability envelope extended 125km to the east
and 50km to the west, reflecting the predominant wind direction during this season
s scenario, there was a 70% probability that oil would reach the Big
Bank Shoals and 1% probability of reaching the Karmt Shoals. The predicted minimum time
to exposure at Big Bank Shoals was three hours (Figure 4.4) by which time the spill would
porated by about 50% of its original volume. The spill was not predicted to make
Under winter conditions, the outer (1%) probability envelope extended 100km to the west
and <50km to the east, reflecting the predominant wind direction du
4.5). Under this scenario, there was a >80% probability that oil would reach the Big
Bank Shoals and 1 to 5% probability of reaching the Karmt Shoals. The predicted minimum
time to exposure at Big Bank Shoals was three hours (Figure 4.6) by which time the spill
would have evaporated by 50% of its original volume. The spill was not predicted to make
Page 19
Predicted weathering of Kitan oil for a continuous release of 7000m3 spill
Under summer conditions, the outer (1%) probability envelope extended 125km to the east
and 50km to the west, reflecting the predominant wind direction during this season
s scenario, there was a 70% probability that oil would reach the Big
Bank Shoals and 1% probability of reaching the Karmt Shoals. The predicted minimum time
to exposure at Big Bank Shoals was three hours (Figure 4.4) by which time the spill would
porated by about 50% of its original volume. The spill was not predicted to make
Under winter conditions, the outer (1%) probability envelope extended 100km to the west
and <50km to the east, reflecting the predominant wind direction during this season
4.5). Under this scenario, there was a >80% probability that oil would reach the Big
Bank Shoals and 1 to 5% probability of reaching the Karmt Shoals. The predicted minimum
ure 4.6) by which time the spill
would have evaporated by 50% of its original volume. The spill was not predicted to make

ENI-JPDA-06-105 PTY LTD
KITAN OIL SPILL RISK ASSESSMENT MODELLING23 September 2010
Notes: Probability contours calculated from 200 oil spill simulations using randomly for the period
Figure 4.3 Probability of surface exposure at day 5 under summer conditions from a
7000m3 spill of crude oil occurring over a 24 hour period
KITAN OIL SPILL RISK ASSESSMENT MODELLING
Probability contours calculated from 200 oil spill simulations using randomly selected wind and circulation data
Probability of surface exposure at day 5 under summer conditions from a
spill of crude oil occurring over a 24 hour period
Big Bank
Page 20
selected wind and circulation data
Probability of surface exposure at day 5 under summer conditions from a
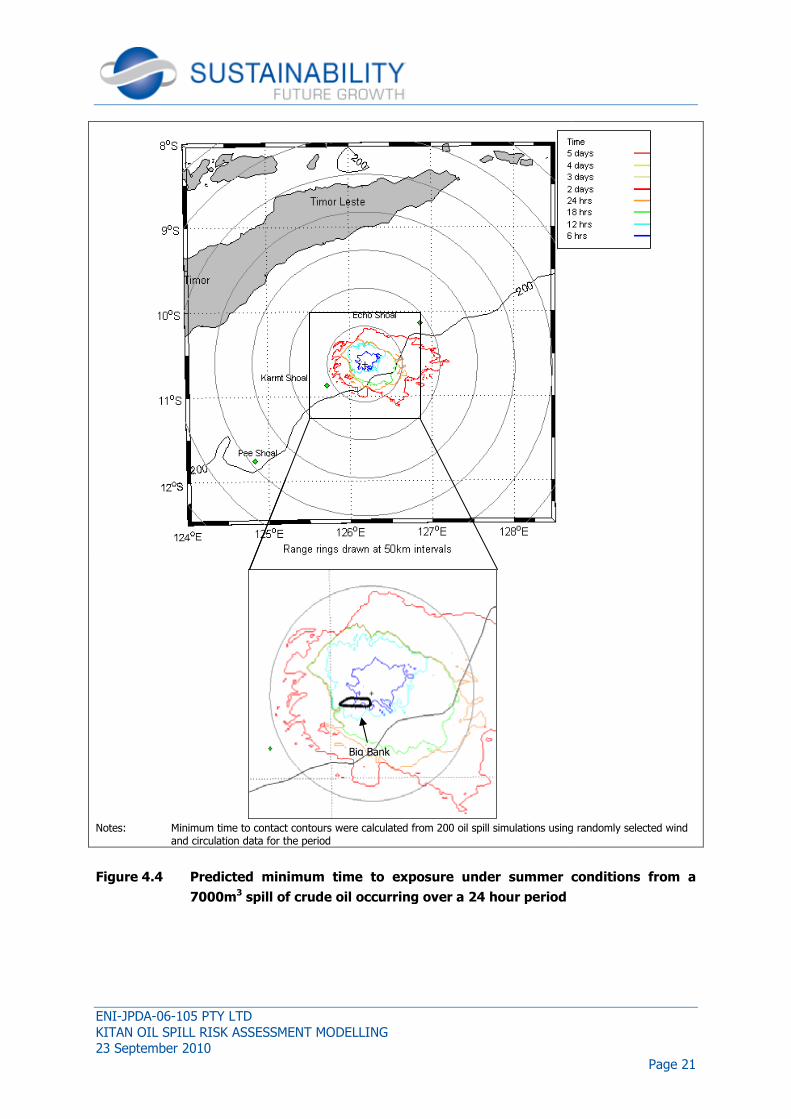
ENI-JPDA-06-105 PTY LTD
KITAN OIL SPILL RISK ASSESSMENT MODELLING23 September 2010
Notes: Minimum time to contact contours were calculated from 200 oil spill simulations using randomly selected wind and circulation data for the period
Figure 4.4 Predicted minimum time to
7000m3 spill of crude oil occurring over a 24 hour period
KITAN OIL SPILL RISK ASSESSMENT MODELLING
Minimum time to contact contours were calculated from 200 oil spill simulations using randomly selected wind and circulation data for the period
Predicted minimum time to exposure under summer conditions from a
spill of crude oil occurring over a 24 hour period
Big Bank
Page 21
Minimum time to contact contours were calculated from 200 oil spill simulations using randomly selected wind
exposure under summer conditions from a

ENI-JPDA-06-105 PTY LTD
KITAN OIL SPILL RISK ASSESSMENT MODELLING23 September 2010
Notes: Probability contours calculated from 200 oil spill simulations using randomly selected wind and circulation data for the period
Figure 4.5 Probability of surface exposure at day 5 under winter conditions from a
7000m3 spill of crude oil occurring over a 24 hour period
KITAN OIL SPILL RISK ASSESSMENT MODELLING
Probability contours calculated from 200 oil spill simulations using randomly selected wind and circulation data
Probability of surface exposure at day 5 under winter conditions from a
spill of crude oil occurring over a 24 hour period
Big Bank
Page 22
Probability contours calculated from 200 oil spill simulations using randomly selected wind and circulation data
Probability of surface exposure at day 5 under winter conditions from a

ENI-JPDA-06-105 PTY LTD
KITAN OIL SPILL RISK ASSESSMENT MODELLING23 September 2010
Notes: Minimum time to contact contours and circulation data for the period
Figure 4.6 Predicted minimum time to exposure under winter conditions from a
7000m3 spill of cr
KITAN OIL SPILL RISK ASSESSMENT MODELLING
Minimum time to contact contours were calculated from 200 oil spill simulations using randomly selected wind and circulation data for the period
Predicted minimum time to exposure under winter conditions from a
spill of crude oil occurring over a 24 hour period
Big Bank
Page 23
were calculated from 200 oil spill simulations using randomly selected wind
Predicted minimum time to exposure under winter conditions from a

ENI-JPDA-06-105 PTY LTD
KITAN OIL SPILL RISK ASSESSMENT MODELLING23 September 2010
4.2 EVENT 2: LOSS OF
4.2.1 Predicted Weathering Behaviour
Under light winds (4ms-1), approximately 7
hours and 2% is predicted to become
sea surface (Figure 4.7). After five days,
entrainment into the water column accounts for 3
Under strong winds (10ms-1), approximately 7
evaporate within 24 hours, 7
leaving 20% on the sea surface (
the surface through evaporation and entrainment, leaving
Figure 4.7 Predicted weathering of
spill for a 4ms-
KITAN OIL SPILL RISK ASSESSMENT MODELLING
: LOSS OF 1800M3/DAY OF CRUDE OVER 56 DAYS
Predicted Weathering Behaviour
), approximately 72% of the oil is predicted to evaporate within 24
% is predicted to become entrained into the water column leaving 2
). After five days, evaporation accounts for 80% of the spill volume
inment into the water column accounts for 3%, leaving 17% on the sea surface
), approximately 73% of the original spill volume is predicted to
7% is predicted to become entrained into the water column
% on the sea surface (Figure 4.8). After five days, oil is continually removed from
the surface through evaporation and entrainment, leaving about 15% on the sea surface.
Predicted weathering of Kitan oil for a continuous release of -1 wind
Page 24
56 DAYS
% of the oil is predicted to evaporate within 24
entrained into the water column leaving 26% on the
of the spill volume,
on the sea surface.
% of the original spill volume is predicted to
% is predicted to become entrained into the water column
After five days, oil is continually removed from
about 15% on the sea surface.
for a continuous release of 1800m3/day

ENI-JPDA-06-105 PTY LTD
KITAN OIL SPILL RISK ASSESSMENT MODELLING23 September 2010
Figure 4.8 Predicted weathering of
spill for a 10ms
4.2.2 Stochastic Modelling
Under summer conditions, the outer (1%) probability envelope extended 1
and 90km to the west of Kitan
this season. Under this scenario, there was a
Bank Shoals and 10% probability of reaching the
time to exposure at Big Bank Shoals was
spill would have evaporated by about 50% of its original volume. The spill was not
predicted to make contact with land.
Under winter conditions, the outer (1%) probability envelope extended 1
and 50km to the east of Kitan
(Figure 4.11). Under this scenario, there was a >80% probability that oil would reach the
Big Bank Shoals and 40% probability o
time to exposure at Big Bank Shoals was
spill would have evaporated by 50% of its original volume. The spill was not predicted to
make contact with land.
KITAN OIL SPILL RISK ASSESSMENT MODELLING
Predicted weathering of Kitan oil for a continuous release of
spill for a 10ms-1 wind
Stochastic Modelling
Under summer conditions, the outer (1%) probability envelope extended 1
of Kitan (Figure 4.9), reflecting the predominant wind direction during
this season. Under this scenario, there was a >80% probability that oil would reach the Big
% probability of reaching the Karmt Shoals. The predicted minimum
time to exposure at Big Bank Shoals was within three hours (Figure 4.10) by which time the
rated by about 50% of its original volume. The spill was not
predicted to make contact with land.
Under winter conditions, the outer (1%) probability envelope extended 1
of Kitan, reflecting the predominant wind direction during this season
). Under this scenario, there was a >80% probability that oil would reach the
% probability of reaching the Karmt Shoals. The predicted minimum
time to exposure at Big Bank Shoals was within three hours (Figure 4.12) by which time the
uld have evaporated by 50% of its original volume. The spill was not predicted to
Page 25
for a continuous release of 1800m3/day
Under summer conditions, the outer (1%) probability envelope extended 170km to the east
), reflecting the predominant wind direction during
0% probability that oil would reach the Big
Karmt Shoals. The predicted minimum
) by which time the
rated by about 50% of its original volume. The spill was not
Under winter conditions, the outer (1%) probability envelope extended 170km to the west
ion during this season
). Under this scenario, there was a >80% probability that oil would reach the
f reaching the Karmt Shoals. The predicted minimum
) by which time the
uld have evaporated by 50% of its original volume. The spill was not predicted to
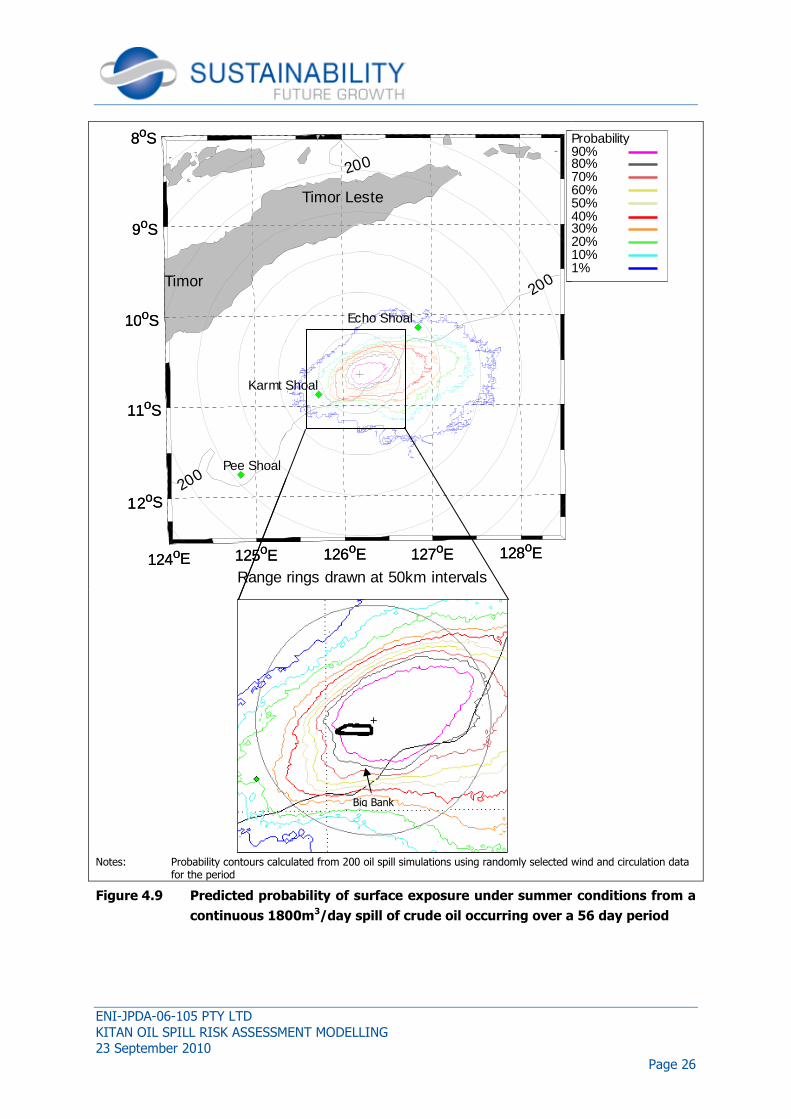
ENI-JPDA-06-105 PTY LTD
KITAN OIL SPILL RISK ASSESSMENT MODELLING23 September 2010
Notes: Probability contours calculated from 200 oil spill simulations using randomly selected wind and circulation data for the period
Figure 4.9 Predicted probability of surface exposure under
continuous 1800m
200
Range rings drawn at 50km intervals 124oE 125oE
12oS
11oS
10oS
9oS
8oS
124oE 125oE
12oS
11oS
10oS
9oS
8oS
Pee Shoal
Karmt Shoal
Timor
KITAN OIL SPILL RISK ASSESSMENT MODELLING
Probability contours calculated from 200 oil spill simulations using randomly selected wind and circulation data
robability of surface exposure under summer
continuous 1800m3/day spill of crude oil occurring over a 56 day period
200
200
Range rings drawn at 50km intervals
126oE 127oE 128oE 126oE 127oE 128oE
Echo Shoal
Karmt Shoal
Timor Leste
1%10%20%30%40%50%60%70%80%90%Probability
Big Bank
Page 26
Probability contours calculated from 200 oil spill simulations using randomly selected wind and circulation data
summer conditions from a
/day spill of crude oil occurring over a 56 day period
1%10%20%30%40%50%60%70%80%90%Probability

ENI-JPDA-06-105 PTY LTD
KITAN OIL SPILL RISK ASSESSMENT MODELLING23 September 2010
Notes: Minimum time to contact contours were calculated from 200 oil spill simulations using randomly selected wind and circulation data for the period
Figure 4.10 Predicted minimum time to
continuous 1800
200
Range rings drawn at 50km intervals 124oE 125oE
12oS
11oS
10oS
9oS
8oS
124oE 125oE
12oS
11oS
10oS
9oS
8oS
Pee Shoal
Karmt Shoal
Timor
KITAN OIL SPILL RISK ASSESSMENT MODELLING
time to contact contours were calculated from 200 oil spill simulations using randomly selected wind
and circulation data for the period
minimum time to exposure under summer conditions from a
continuous 1800m3/day spill of crude oil occurring over a 5
200
200
Range rings drawn at 50km intervalsE 126oE 127oE 128oE E 126oE 127oE 128oE
Pee Shoal
Echo Shoal
Karmt Shoal
Timor Leste
Big Bank
Page 27
time to contact contours were calculated from 200 oil spill simulations using randomly selected wind
conditions from a
spill of crude oil occurring over a 56 day period
6 hrs12 hrs18 hrs24 hrs2 days3 days4 days5 daysTime

ENI-JPDA-06-105 PTY LTD
KITAN OIL SPILL RISK ASSESSMENT MODELLING23 September 2010
Notes: Probability contours calculated from 200 oil spill simulations using randomly selected wind and circulation data for the period
Figure 4.11 Predicted probability of surface exposure under
continuous 1800m
200
Range rings drawn at 50km intervals 124oE 125oE
12oS
11oS
10oS
9oS
8oS
124oE 125oE
12oS
11oS
10oS
9oS
8oS
Pee Shoal
Karmt Shoal
Timor
KITAN OIL SPILL RISK ASSESSMENT MODELLING
Probability contours calculated from 200 oil spill simulations using randomly selected wind and circulation data
robability of surface exposure under winter
continuous 1800m3/day spill of crude oil occurring over a 56 day period
200
200
Range rings drawn at 50km intervals
126oE 127oE 128oE 126oE 127oE 128oE
Echo Shoal
Karmt Shoal
Timor Leste
1%10%20%30%40%50%60%70%80%90%Probability
Big Bank
Page 28
Probability contours calculated from 200 oil spill simulations using randomly selected wind and circulation data
conditions from a
/day spill of crude oil occurring over a 56 day period
1%10%20%30%40%50%60%70%80%90%Probability

ENI-JPDA-06-105 PTY LTD
KITAN OIL SPILL RISK ASSESSMENT MODELLING23 September 2010
Notes: Minimum time to contact contours were calculated from 200 oil spill simulations using randomly selected wind and circulation data for the period
Figure 4.12 Predicted minimum time to
continuous 1800
KITAN OIL SPILL RISK ASSESSMENT MODELLING
contact contours were calculated from 200 oil spill simulations using randomly selected wind
and circulation data for the period
minimum time to exposure under winter conditions from a
continuous 1800m3/day spill of crude oil occurring over a 5
Big Bank
Page 29
contact contours were calculated from 200 oil spill simulations using randomly selected wind
conditions from a
spill of crude oil occurring over a 56 day period

ENI-JPDA-06-105 PTY LTD
KITAN OIL SPILL RISK ASSESSMENT MODELLING23 September 2010
4.2.3 Deterministic Modelling
Deterministic modelling predicted the trajectory and fate of a single, continuous oil spill of
1800m3/day over five consecutive days (Figure 4.13a
vertical distribution of oil in the water column can be predicted
vertical resolution of the model is 1m
Figures 4-13a-d present examples from the deterministic simulation
dynamic nature of the slick as it is transported by the ambient currents. Under certain
hydrodynamic conditions the slick sweeps over Big Bank, however, the vertical pr
that the oil remains at the surface and will not make contact with the sensitive benthi
habitats and communities some 20m below the
Figure 4.13 Predicted oil spill trajectory and vertical oil concentration (kg/m
single hypothetical well blowout scenario (Scenario
KITAN OIL SPILL RISK ASSESSMENT MODELLING
Deterministic Modelling
Deterministic modelling predicted the trajectory and fate of a single, continuous oil spill of
/day over five consecutive days (Figure 4.13a-d). Using deterministic mode, the
vertical distribution of oil in the water column can be predicted (note that the minimum
vertical resolution of the model is 1m).
present examples from the deterministic simulation. The plots show the
re of the slick as it is transported by the ambient currents. Under certain
hydrodynamic conditions the slick sweeps over Big Bank, however, the vertical pr
that the oil remains at the surface and will not make contact with the sensitive benthi
habitats and communities some 20m below the sea surface.
Predicted oil spill trajectory and vertical oil concentration (kg/m
hypothetical well blowout scenario (Scenario 2)
Page 30
Deterministic modelling predicted the trajectory and fate of a single, continuous oil spill of
deterministic mode, the
ote that the minimum
The plots show the
re of the slick as it is transported by the ambient currents. Under certain
hydrodynamic conditions the slick sweeps over Big Bank, however, the vertical profiles show
that the oil remains at the surface and will not make contact with the sensitive benthic
Predicted oil spill trajectory and vertical oil concentration (kg/m3) for a
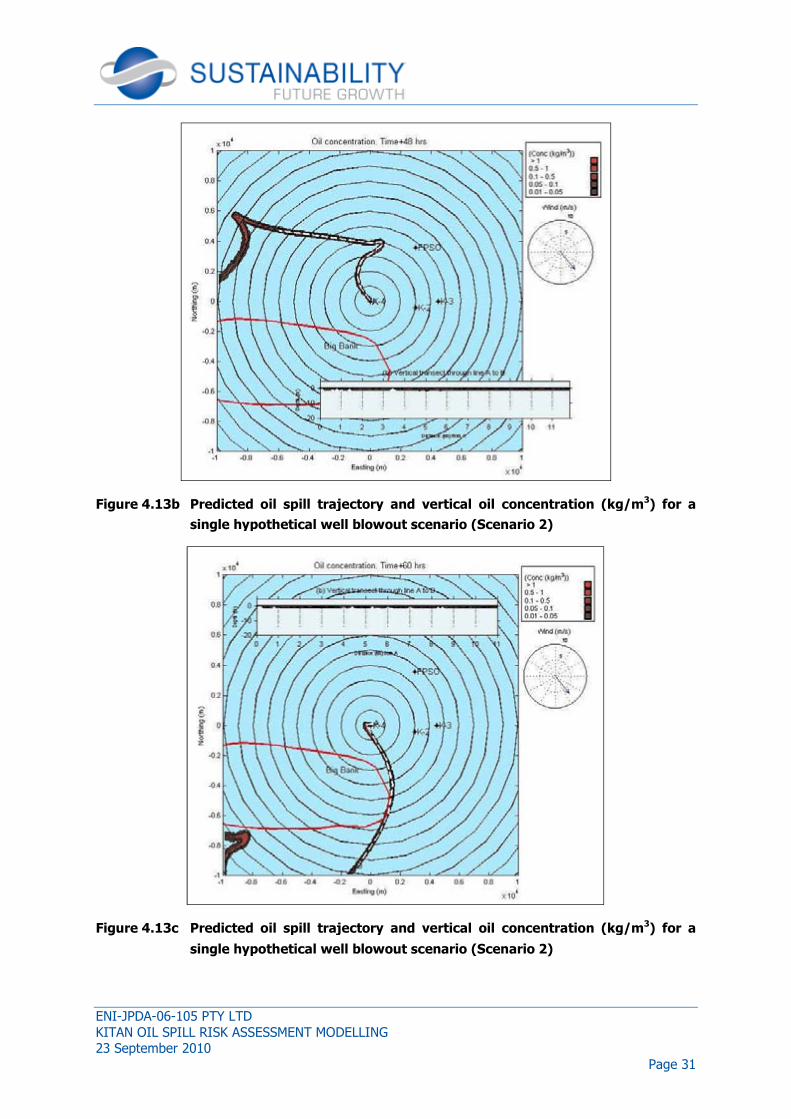
ENI-JPDA-06-105 PTY LTD
KITAN OIL SPILL RISK ASSESSMENT MODELLING23 September 2010
Figure 4.13b Predicted oil spill trajectory and vertical oil concentration (kg/m
single hypothetical well blowout scenario (Scenario
Figure 4.13c Predicted oil spill trajectory and vertical oil concentration (kg/m
single hypothetical well blowout scenario (Scenario
KITAN OIL SPILL RISK ASSESSMENT MODELLING
Predicted oil spill trajectory and vertical oil concentration (kg/m
hypothetical well blowout scenario (Scenario 2)
Predicted oil spill trajectory and vertical oil concentration (kg/m
hypothetical well blowout scenario (Scenario 2)
Page 31
Predicted oil spill trajectory and vertical oil concentration (kg/m3) for a
Predicted oil spill trajectory and vertical oil concentration (kg/m3) for a

ENI-JPDA-06-105 PTY LTD
KITAN OIL SPILL RISK ASSESSMENT MODELLING23 September 2010
Figure 4.13d Predicted oil spill trajectory and vertical oil concentration (kg/m
single hypothetical well blowout scenario (Scenario
4.3 EVENT 3: LOSS OF 100M
4.3.1 Predicted Weathering Behaviour
Under light winds (4ms-1), approximately 82% of the oil is predicted to evaporate after 24
hours, with a further 2% evaporating over the following four days (Figure 4.
percent is predicted to become entrained into the water colum
surface.
Under strong winds (10ms-1
evaporate after 24 hours (Figure 4.
into the water column leaving 6% on the sea sur
water column increases the longer the oil is at sea.
KITAN OIL SPILL RISK ASSESSMENT MODELLING
Predicted oil spill trajectory and vertical oil concentration (kg/m
hypothetical well blowout scenario (Scenario 2)
: LOSS OF 100M3 OF CRUDE OVER SIX HOURS
hering Behaviour
), approximately 82% of the oil is predicted to evaporate after 24
hours, with a further 2% evaporating over the following four days (Figure 4.
is predicted to become entrained into the water column leaving 14% on the sea
1), again 82% of the original spill volume is predicted to
evaporate after 24 hours (Figure 4.15). Twelve percent is predicted to become entrained
into the water column leaving 6% on the sea surface. The proportion entrained into the
water column increases the longer the oil is at sea.
Page 32
Predicted oil spill trajectory and vertical oil concentration (kg/m3) for a
URS
), approximately 82% of the oil is predicted to evaporate after 24
hours, with a further 2% evaporating over the following four days (Figure 4.14). Four
n leaving 14% on the sea
), again 82% of the original spill volume is predicted to
is predicted to become entrained
face. The proportion entrained into the

ENI-JPDA-06-105 PTY LTD
KITAN OIL SPILL RISK ASSESSMENT MODELLING23 September 2010
Figure 4.14 Predicted weathering of Kitan oil for a continuous release of 100m
hours for a 4ms
Figure 4.15 Predicted weathering of Kitan oil for a continuous release of 100m
hours for a 10ms
KITAN OIL SPILL RISK ASSESSMENT MODELLING
Predicted weathering of Kitan oil for a continuous release of 100m
hours for a 4ms-1 wind
Predicted weathering of Kitan oil for a continuous release of 100m
hours for a 10ms-1 wind
Page 33
Predicted weathering of Kitan oil for a continuous release of 100m3 over 6
Predicted weathering of Kitan oil for a continuous release of 100m3 over 6

ENI-JPDA-06-105 PTY LTD
KITAN OIL SPILL RISK ASSESSMENT MODELLING23 September 2010
4.3.2 Stochastic Modelling
Under summer conditions, the outer (1%) probability envelope extended
50km to the south and approximately 30km to the west, reflecting the predominant wind
direction during this season (Figure
that oil would reach the Big Bank
Bank Shoals was within three hours (Figure 4.1
evaporated by 80%. The spill was not predicted to make contact with land.
Under winter conditions, the outer (1%) probability envelope extende
the northeast to the southwest (Figure 4.1
probability that oil would reach the Big Bank Shoals. The predicted minimum time to
exposure at Big Bank Shoals is three hours (Figure 4.1
evaporated by 80% of its original volume. The spill is not predicted to make contact with
land.
KITAN OIL SPILL RISK ASSESSMENT MODELLING
Stochastic Modelling
Under summer conditions, the outer (1%) probability envelope extended
50km to the south and approximately 30km to the west, reflecting the predominant wind
direction during this season (Figure 4.16). Under this scenario, there was a 30% probability
that oil would reach the Big Bank Shoals. The predicted minimum time to exposure at Big
Bank Shoals was within three hours (Figure 4.17) by which time the oil would have
evaporated by 80%. The spill was not predicted to make contact with land.
Under winter conditions, the outer (1%) probability envelope extended 40km around from
the northeast to the southwest (Figure 4.18). Under this scenario, there was an 80%
probability that oil would reach the Big Bank Shoals. The predicted minimum time to
exposure at Big Bank Shoals is three hours (Figure 4.19) by which time the spill would have
evaporated by 80% of its original volume. The spill is not predicted to make contact with
Page 34
Under summer conditions, the outer (1%) probability envelope extended 75km to the east,
50km to the south and approximately 30km to the west, reflecting the predominant wind
). Under this scenario, there was a 30% probability
inimum time to exposure at Big
which time the oil would have
evaporated by 80%. The spill was not predicted to make contact with land.
d 40km around from
). Under this scenario, there was an 80%
probability that oil would reach the Big Bank Shoals. The predicted minimum time to
ime the spill would have
evaporated by 80% of its original volume. The spill is not predicted to make contact with

ENI-JPDA-06-105 PTY LTD
KITAN OIL SPILL RISK ASSESSMENT MODELLING23 September 2010
Notes: Probability contours calculated from 200 oil spill simulations using randomly selected wind and for the period
Figure 4.16 Probability of surface exposure at day 5 under summer conditions from a
100m3 spill of crude oil occurring over a 6 hour period
KITAN OIL SPILL RISK ASSESSMENT MODELLING
Probability contours calculated from 200 oil spill simulations using randomly selected wind and
Probability of surface exposure at day 5 under summer conditions from a
spill of crude oil occurring over a 6 hour period
Big Bank
Page 35
Probability contours calculated from 200 oil spill simulations using randomly selected wind and circulation data
Probability of surface exposure at day 5 under summer conditions from a

ENI-JPDA-06-105 PTY LTD
KITAN OIL SPILL RISK ASSESSMENT MODELLING23 September 2010
Notes: Minimum time to contact contours were calculated from 200 oil spill simulations using randomly selected wind and circulation data for the period
Figure 4.17 Predicted minimum time to exposure under summer c
100m3 spill of crude oil occurring over a 6 hour period
KITAN OIL SPILL RISK ASSESSMENT MODELLING
Minimum time to contact contours were calculated from 200 oil spill simulations using randomly selected wind and circulation data for the period
Predicted minimum time to exposure under summer c
spill of crude oil occurring over a 6 hour period
Big Bank
Page 36
Minimum time to contact contours were calculated from 200 oil spill simulations using randomly selected wind
Predicted minimum time to exposure under summer conditions from a

ENI-JPDA-06-105 PTY LTD
KITAN OIL SPILL RISK ASSESSMENT MODELLING23 September 2010
Notes: Probability contours calculated from 200 oil spill simulations using randomly selected wind and circulation data for the period
Figure 4.18 Probability of surface exposure at day 5 under winter conditions from a
100m3 spill of crude oil occurring over a 6 hour period
KITAN OIL SPILL RISK ASSESSMENT MODELLING
Probability contours calculated from 200 oil spill simulations using randomly selected wind and circulation data
Probability of surface exposure at day 5 under winter conditions from a
spill of crude oil occurring over a 6 hour period
Big Bank
Page 37
Probability contours calculated from 200 oil spill simulations using randomly selected wind and circulation data
Probability of surface exposure at day 5 under winter conditions from a
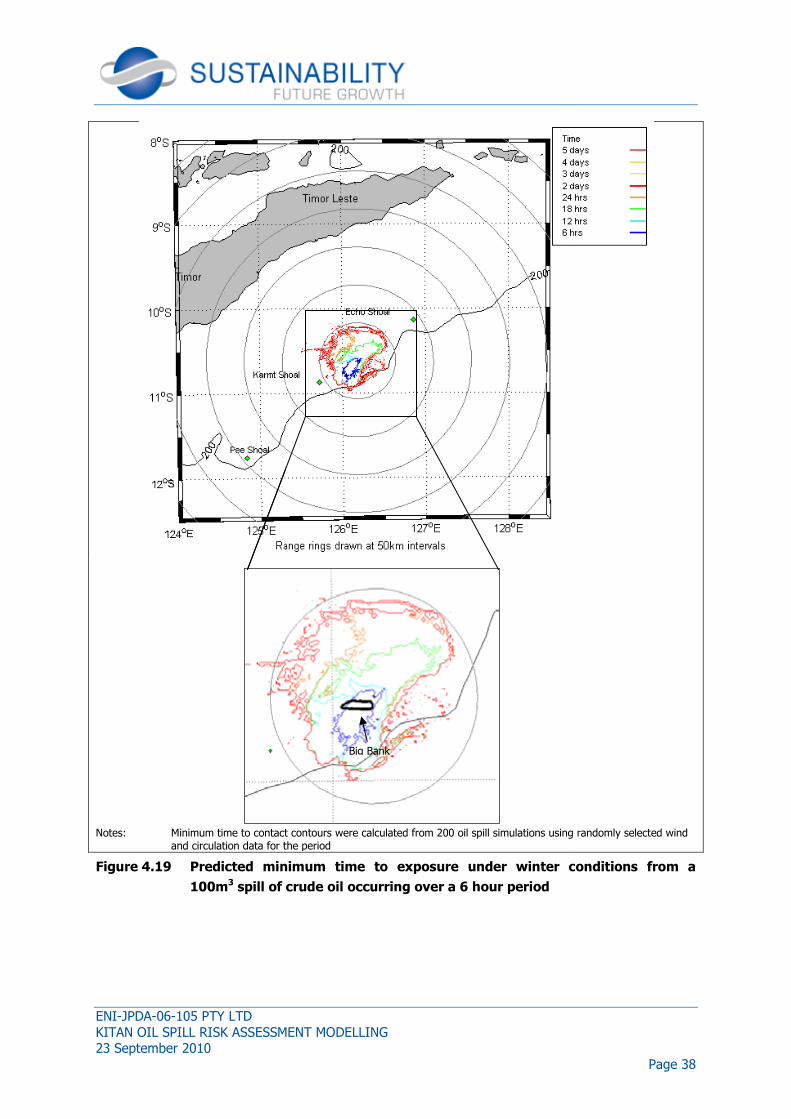
ENI-JPDA-06-105 PTY LTD
KITAN OIL SPILL RISK ASSESSMENT MODELLING23 September 2010
Notes: Minimum time to contact contours were calculated from 200 oil spill simulations using randomly selected wind and circulation data for the period
Figure 4.19 Predicted minimum time to exposure under winter c
100m3 spill of crude oil occurring over a 6 hour period
KITAN OIL SPILL RISK ASSESSMENT MODELLING
Minimum time to contact contours were calculated from 200 oil spill simulations using randomly selected wind and circulation data for the period
Predicted minimum time to exposure under winter c
spill of crude oil occurring over a 6 hour period
Big Bank
Page 38
Minimum time to contact contours were calculated from 200 oil spill simulations using randomly selected wind
Predicted minimum time to exposure under winter conditions from a

ENI-JPDA-06-105 PTY LTD
KITAN OIL SPILL RISK ASSESSMENT MODELLING23 September 2010
4.4 EVENT 4: INSTANTANEOUS SPILL
4.4.1 Predicted Weathering Behaviour
Under light winds (4ms-1), approximately 85% of the oil is predicted to evaporate within 24
hours, 4% is predicted to become entrained into the water column leaving 11% on the sea
surface (Figure 4.20).
Under strong winds (10ms-1), approximately 88% of the original spill volume is predicted to
evaporate within 3 hours, 9% is predicted to become entrained i
leaving just 3% on the sea surface (
4.4.2 Stochastic Modelling
Under summer conditions, the outer (1%) probability envelope extended <30km to the east
and west (Figure 4.22). Under this scenario, there was a 40% probability
reach the Big Bank Shoals. The predicted minimum time to exposure at Big Bank Shoals
was three hours (Figure 4.23) by which time the spill would have evaporated by 85% of its
original volume. The spill was not predicted to make contact wit
Under winter conditions, the outer (1%) probability envelope extended 40km to the west
(Figure 4.24). Under this scenario, there was a 40% probability that oil would reach the Big
Bank Shoals. The predicted minimum time to exposure at Big Bank Sh
(Figure 4.25) by which time the spill would have evaporated by 85% of its original volume.
The spill is not predicted to make contact with land.
KITAN OIL SPILL RISK ASSESSMENT MODELLING
INSTANTANEOUS SPILL OF 10M3 OF CRUDE
Predicted Weathering Behaviour
), approximately 85% of the oil is predicted to evaporate within 24
predicted to become entrained into the water column leaving 11% on the sea
), approximately 88% of the original spill volume is predicted to
evaporate within 3 hours, 9% is predicted to become entrained into the water column
leaving just 3% on the sea surface (Figure 4.21).
Stochastic Modelling
Under summer conditions, the outer (1%) probability envelope extended <30km to the east
). Under this scenario, there was a 40% probability
reach the Big Bank Shoals. The predicted minimum time to exposure at Big Bank Shoals
) by which time the spill would have evaporated by 85% of its
original volume. The spill was not predicted to make contact with land.
Under winter conditions, the outer (1%) probability envelope extended 40km to the west
). Under this scenario, there was a 40% probability that oil would reach the Big
Bank Shoals. The predicted minimum time to exposure at Big Bank Shoals was three hours
) by which time the spill would have evaporated by 85% of its original volume.
The spill is not predicted to make contact with land.
Page 39
), approximately 85% of the oil is predicted to evaporate within 24
predicted to become entrained into the water column leaving 11% on the sea
), approximately 88% of the original spill volume is predicted to
nto the water column
Under summer conditions, the outer (1%) probability envelope extended <30km to the east
). Under this scenario, there was a 40% probability that oil would
reach the Big Bank Shoals. The predicted minimum time to exposure at Big Bank Shoals
) by which time the spill would have evaporated by 85% of its
Under winter conditions, the outer (1%) probability envelope extended 40km to the west
). Under this scenario, there was a 40% probability that oil would reach the Big
oals was three hours
) by which time the spill would have evaporated by 85% of its original volume.
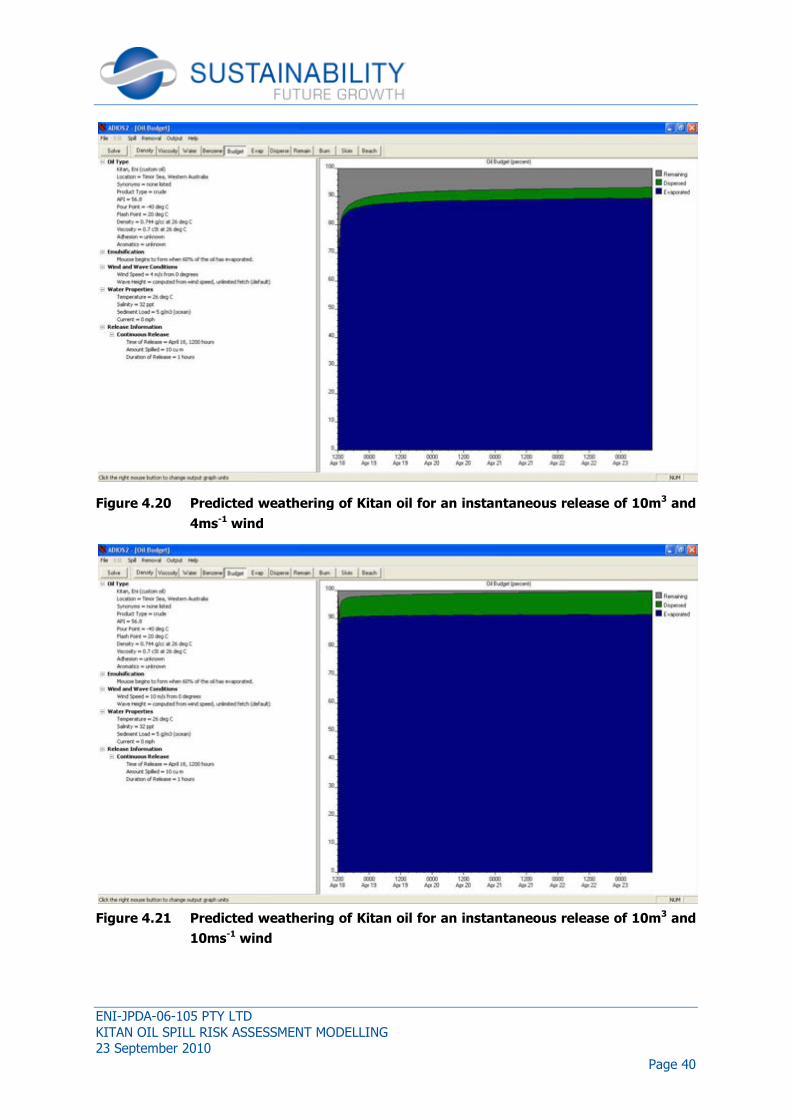
ENI-JPDA-06-105 PTY LTD
KITAN OIL SPILL RISK ASSESSMENT MODELLING23 September 2010
Figure 4.20 Predicted weathering of Ki
4ms-1 wind
Figure 4.21 Predicted weathering of Kitan oil for an instantaneous release of 10m
10ms-1 wind
KITAN OIL SPILL RISK ASSESSMENT MODELLING
Predicted weathering of Kitan oil for an instantaneous release of 10m
Predicted weathering of Kitan oil for an instantaneous release of 10m
Page 40
tan oil for an instantaneous release of 10m3 and
Predicted weathering of Kitan oil for an instantaneous release of 10m3 and
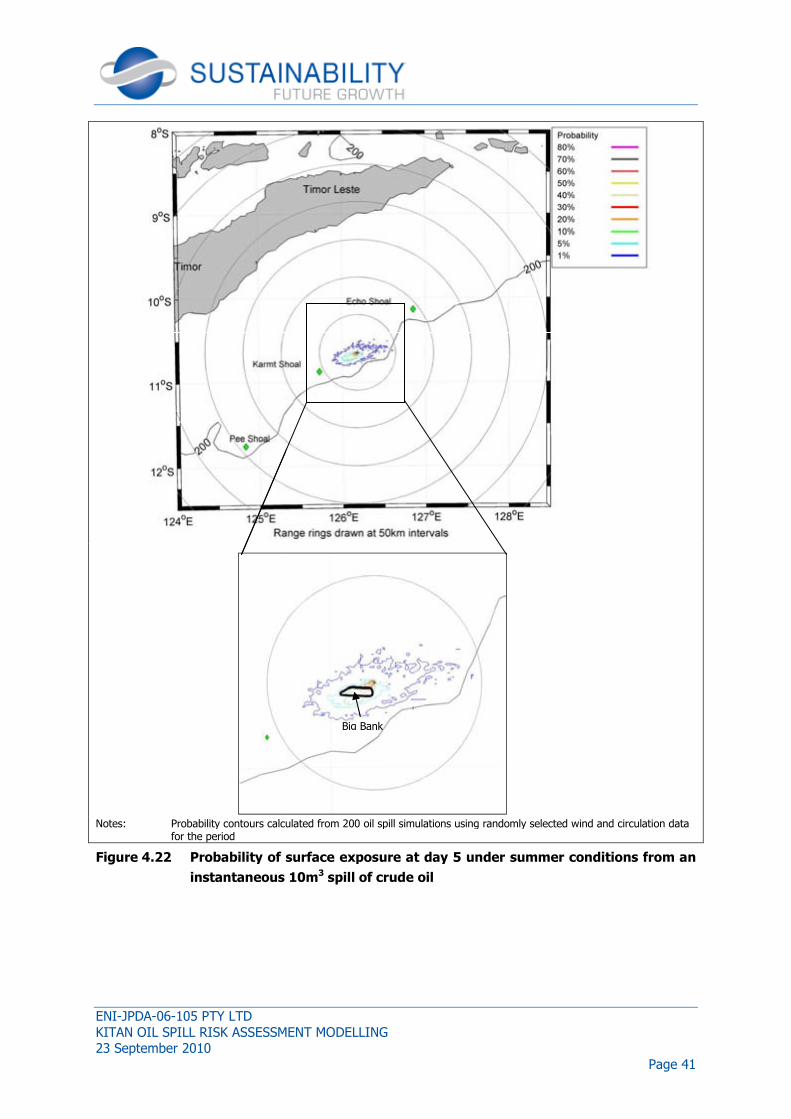
ENI-JPDA-06-105 PTY LTD
KITAN OIL SPILL RISK ASSESSMENT MODELLING23 September 2010
Notes: Probability contours calculated from 200 oil spill simulations using randomly selected wind and circulation data for the period
Figure 4.22 Probability of surface exposure at day 5 under summer conditions f
instantaneous 10m
KITAN OIL SPILL RISK ASSESSMENT MODELLING
Probability contours calculated from 200 oil spill simulations using randomly selected wind and circulation data
Probability of surface exposure at day 5 under summer conditions f
instantaneous 10m3 spill of crude oil
Big Bank
Page 41
Probability contours calculated from 200 oil spill simulations using randomly selected wind and circulation data
Probability of surface exposure at day 5 under summer conditions from an

ENI-JPDA-06-105 PTY LTD
KITAN OIL SPILL RISK ASSESSMENT MODELLING23 September 2010
Notes: Minimum time to contact contours were calculated from 200 oil spill simulations using randomly selected wind and circulation data for the period
Figure 4.23 Predicted minimum time to exposure under summer conditions from an
instantaneous 10m
KITAN OIL SPILL RISK ASSESSMENT MODELLING
Minimum time to contact contours were calculated from 200 oil spill simulations using randomly selected wind and circulation data for the period
Predicted minimum time to exposure under summer conditions from an
instantaneous 10m3 spill of crude oil
Big Bank
Page 42
Minimum time to contact contours were calculated from 200 oil spill simulations using randomly selected wind
Predicted minimum time to exposure under summer conditions from an
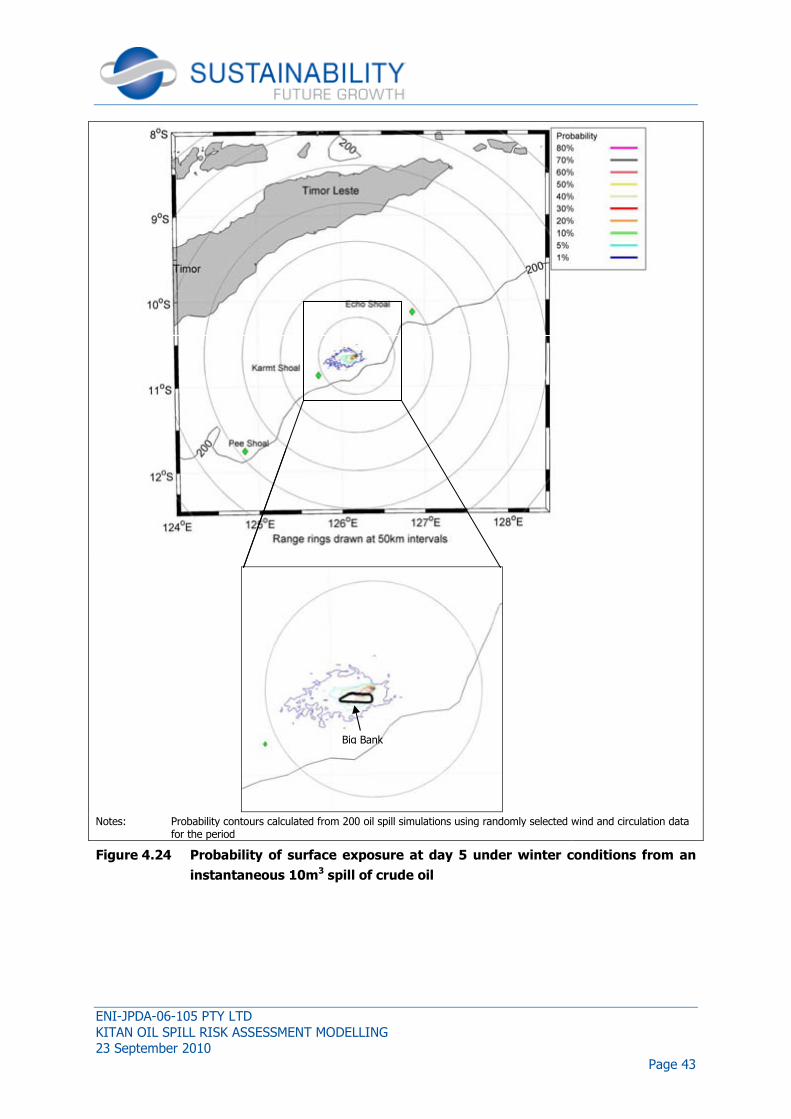
ENI-JPDA-06-105 PTY LTD
KITAN OIL SPILL RISK ASSESSMENT MODELLING23 September 2010
Notes: Probability contours calculated from 200 oil spill simulations using randomly selected wind and circulation data for the period
Figure 4.24 Probability of surface exposure at day 5 under winter conditions f
instantaneous 10m
KITAN OIL SPILL RISK ASSESSMENT MODELLING
Probability contours calculated from 200 oil spill simulations using randomly selected wind and circulation data
Probability of surface exposure at day 5 under winter conditions f
instantaneous 10m3 spill of crude oil
Big Bank
Page 43
Probability contours calculated from 200 oil spill simulations using randomly selected wind and circulation data
Probability of surface exposure at day 5 under winter conditions from an
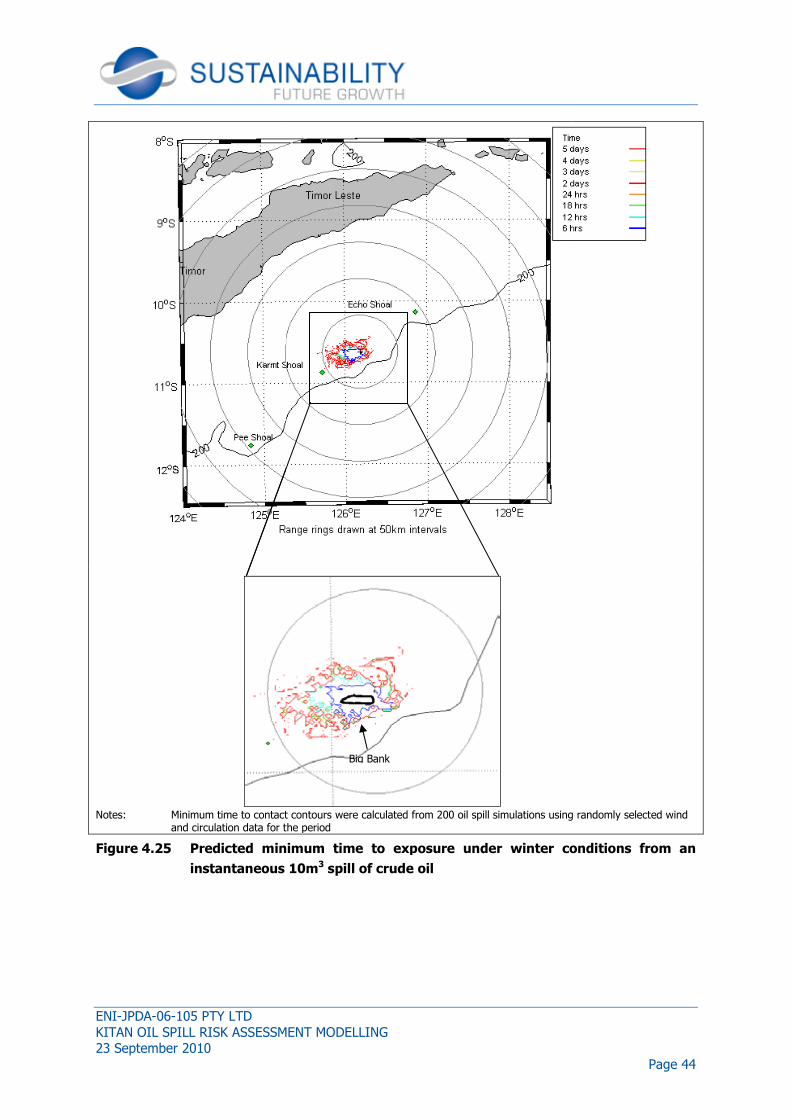
ENI-JPDA-06-105 PTY LTD
KITAN OIL SPILL RISK ASSESSMENT MODELLING23 September 2010
Notes: Minimum time to contact contours were calculated from 200 oil spill simulations using randomly selected wind and circulation data for the period
Figure 4.25 Predicted minimum time to exposure under winter conditions from an
instantaneous 10m
KITAN OIL SPILL RISK ASSESSMENT MODELLING
Minimum time to contact contours were calculated from 200 oil spill simulations using randomly selected wind and circulation data for the period
Predicted minimum time to exposure under winter conditions from an
instantaneous 10m3 spill of crude oil
Big Bank
Page 44
Minimum time to contact contours were calculated from 200 oil spill simulations using randomly selected wind
Predicted minimum time to exposure under winter conditions from an

ENI-JPDA-06-105 PTY LTD
KITAN OIL SPILL RISK ASSESSMENT MODELLING23 September 2010
4.5 EVENT 5: LOSS OF
4.5.1 Predicted Weathering Behaviour
Figure 4.26 shows the predicted weathering behaviour from the ADIOS2 model for a
constant wind speed of 4ms
evaporating within the first 24 hours.
high with the majority of diesel being removed from the sea surface within three days.
Figure 4.26 Predicted weathering of diesel fuel oil for a continuous release of 80m3
over 6 hours for a 4ms
4.5.2 Stochastic Modelling
Under summer conditions, the outer (1%) probability envelope extended 1
and 50km to the west, reflecting the predominant wind direction during this season (
4.27). Under this scenario, there was a
Shoals and 1% probability of reaching the Karmt Shoals. The predicted minimum time to
exposure at Big Bank Shoals was three hours (
have evaporated by about 50% of its original volume. The spill was not predicte
contact with land.
KITAN OIL SPILL RISK ASSESSMENT MODELLING
LOSS OF 80M3 OF DIESEL OVER 6 HOURS
Predicted Weathering Behaviour
shows the predicted weathering behaviour from the ADIOS2 model for a
constant wind speed of 4ms-1. Evaporation rates are initially high with just under 50%
evaporating within the first 24 hours. The rate of dispersion into the water column is also
with the majority of diesel being removed from the sea surface within three days.
Predicted weathering of diesel fuel oil for a continuous release of 80m3
over 6 hours for a 4ms-1 wind
c Modelling
Under summer conditions, the outer (1%) probability envelope extended 1
and 50km to the west, reflecting the predominant wind direction during this season (
). Under this scenario, there was a >80% probability that oil would reach the Big Bank
Shoals and 1% probability of reaching the Karmt Shoals. The predicted minimum time to
ank Shoals was three hours (Figure 4.28) by which time the spill would
have evaporated by about 50% of its original volume. The spill was not predicte
Page 45
shows the predicted weathering behaviour from the ADIOS2 model for a
. Evaporation rates are initially high with just under 50%
The rate of dispersion into the water column is also
with the majority of diesel being removed from the sea surface within three days.
Predicted weathering of diesel fuel oil for a continuous release of 80m3
Under summer conditions, the outer (1%) probability envelope extended 100km to the east
and 50km to the west, reflecting the predominant wind direction during this season (Figure
0% probability that oil would reach the Big Bank
Shoals and 1% probability of reaching the Karmt Shoals. The predicted minimum time to
) by which time the spill would
have evaporated by about 50% of its original volume. The spill was not predicted to make

ENI-JPDA-06-105 PTY LTD
KITAN OIL SPILL RISK ASSESSMENT MODELLING23 September 2010
Under winter conditions, the outer (1%) probability envelope extended
and <50km to the east, reflecting the predominant wind direction during this season (
4.29). Under this scenario, there was a 80% probability that oil would
Shoals and 1% probability of reaching the Karmt Shoals. The predicted minimum time to
exposure at Big Bank Shoals was three hours (Figure 4.
have evaporated by 50% of its original volume. The spill was not predicted to make contact
with land.
4.5.3 Deterministic Modelling
Deterministic modelling predicted the trajectory and fate of
occurring over six hours (Figure 4.31a
of oil in the water column can be predicted (note that the minimum vertical resolution of the
model is 1m).
Figures 4-31a-d present examples from the deterministic simulation. The plots show the
dynamic nature of the slick as it is transported by the ambient currents. Under certain
hydrodynamic conditions the slick sweeps over Big Bank, however, the vertical profiles show
that the oil remains at the surface and will not make contact with the sensitive benthic
habitats and communities some 20m below the sea surface.
KITAN OIL SPILL RISK ASSESSMENT MODELLING
Under winter conditions, the outer (1%) probability envelope extended
and <50km to the east, reflecting the predominant wind direction during this season (
). Under this scenario, there was a 80% probability that oil would reach the Big Bank
% probability of reaching the Karmt Shoals. The predicted minimum time to
Shoals was three hours (Figure 4.30) by which time the spill would
have evaporated by 50% of its original volume. The spill was not predicted to make contact
Deterministic Modelling
Deterministic modelling predicted the trajectory and fate of a single oil spill of 80m
occurring over six hours (Figure 4.31a-d). Using deterministic mode, the vertical distribution
of oil in the water column can be predicted (note that the minimum vertical resolution of the
examples from the deterministic simulation. The plots show the
dynamic nature of the slick as it is transported by the ambient currents. Under certain
hydrodynamic conditions the slick sweeps over Big Bank, however, the vertical profiles show
il remains at the surface and will not make contact with the sensitive benthic
habitats and communities some 20m below the sea surface.
Page 46
Under winter conditions, the outer (1%) probability envelope extended 80km to the west
and <50km to the east, reflecting the predominant wind direction during this season (Figure
reach the Big Bank
% probability of reaching the Karmt Shoals. The predicted minimum time to
) by which time the spill would
have evaporated by 50% of its original volume. The spill was not predicted to make contact
a single oil spill of 80m3
d). Using deterministic mode, the vertical distribution
of oil in the water column can be predicted (note that the minimum vertical resolution of the
examples from the deterministic simulation. The plots show the
dynamic nature of the slick as it is transported by the ambient currents. Under certain
hydrodynamic conditions the slick sweeps over Big Bank, however, the vertical profiles show
il remains at the surface and will not make contact with the sensitive benthic

ENI-JPDA-06-105 PTY LTD
KITAN OIL SPILL RISK ASSESSMENT MODELLING23 September 2010
Notes: Minimum time to contact contours were calculated from 200 oil spill simulations using and circulation data for the period of drilling
Figure 4.27 Probability of surface exposure at day 5 under summer conditions from a
80m3 spill of diesel occurring over a 6 hour period
KITAN OIL SPILL RISK ASSESSMENT MODELLING
Minimum time to contact contours were calculated from 200 oil spill simulations using and circulation data for the period of drilling
Probability of surface exposure at day 5 under summer conditions from a
spill of diesel occurring over a 6 hour period
Big Bank
Page 47
Minimum time to contact contours were calculated from 200 oil spill simulations using randomly selected wind
Probability of surface exposure at day 5 under summer conditions from a

ENI-JPDA-06-105 PTY LTD
KITAN OIL SPILL RISK ASSESSMENT MODELLING23 September 2010
Notes: Minimum time to contact contours were calculated from 200 oil spill simulations using randomly selected wind and circulation data for the period of drilling
Figure 4.28 Predicted minimum time to exposure under summer conditions from a
80m3 spill of diesel
KITAN OIL SPILL RISK ASSESSMENT MODELLING
Minimum time to contact contours were calculated from 200 oil spill simulations using randomly selected wind and circulation data for the period of drilling
Predicted minimum time to exposure under summer conditions from a
diesel occurring over a 6 hour period
Big Bank
Page 48
Minimum time to contact contours were calculated from 200 oil spill simulations using randomly selected wind
Predicted minimum time to exposure under summer conditions from a

ENI-JPDA-06-105 PTY LTD
KITAN OIL SPILL RISK ASSESSMENT MODELLING23 September 2010
Notes: Minimum time to contact contours were calculated from 200 oil spill simulations using randomly selected and circulation data for the period of drilling
Figure 4.29 Probability of surface exposure at day 5 under winter conditions from a
80m3 spill of diesel occurring over a 6 hour period
KITAN OIL SPILL RISK ASSESSMENT MODELLING
Minimum time to contact contours were calculated from 200 oil spill simulations using randomly selected and circulation data for the period of drilling
Probability of surface exposure at day 5 under winter conditions from a
spill of diesel occurring over a 6 hour period
Big Bank
Page 49
Minimum time to contact contours were calculated from 200 oil spill simulations using randomly selected wind
Probability of surface exposure at day 5 under winter conditions from a

ENI-JPDA-06-105 PTY LTD
KITAN OIL SPILL RISK ASSESSMENT MODELLING23 September 2010
Notes: Minimum time to contact contours were calculated from 200 oil spill simulations using randomly selected wind and circulation data for the period of drilling
Figure 4.30 Predicted minimum time to exposure under
spill of diesel occurring over a
KITAN OIL SPILL RISK ASSESSMENT MODELLING
Minimum time to contact contours were calculated from 200 oil spill simulations using randomly selected wind and circulation data for the period of drilling
Predicted minimum time to exposure under winter conditions from a
occurring over a 6 hour period
Big Bank
Page 50
Minimum time to contact contours were calculated from 200 oil spill simulations using randomly selected wind
conditions from a 80m3

ENI-JPDA-06-105 PTY LTD
KITAN OIL SPILL RISK ASSESSMENT MODELLING23 September 2010
Figure 4.31 Predicted oil spill trajectory and vertical oil concentration (kg/m
single hypothetical
Figure 4.31b Predicted oil spill trajectory and vertical oil concentration (kg/m
single hypothetical
KITAN OIL SPILL RISK ASSESSMENT MODELLING
Predicted oil spill trajectory and vertical oil concentration (kg/m
hypothetical loss of 80m3 of diesel (Scenario 5)
Predicted oil spill trajectory and vertical oil concentration (kg/m
hypothetical loss of 80m3 of diesel (Scenario 5)
Page 51
Predicted oil spill trajectory and vertical oil concentration (kg/m3) for a
Predicted oil spill trajectory and vertical oil concentration (kg/m3) for a
)

ENI-JPDA-06-105 PTY LTD
KITAN OIL SPILL RISK ASSESSMENT MODELLING23 September 2010
Figure 4.31c Predicted oil spill trajectory and
single hypothetical
Figure 4.31d Predicted oil spill trajectory and vertical oil concentration (kg/m
single hypothetical
KITAN OIL SPILL RISK ASSESSMENT MODELLING
Predicted oil spill trajectory and vertical oil concentration (kg/m
hypothetical loss of 80m3 of diesel (Scenario 5)
Predicted oil spill trajectory and vertical oil concentration (kg/m
hypothetical loss of 80m3 of diesel (Scenario 5)
Page 52
vertical oil concentration (kg/m3) for a
Predicted oil spill trajectory and vertical oil concentration (kg/m3) for a

ENI-JPDA-06-105 PTY LTD
KITAN OIL SPILL RISK ASSESSMENT MODELLING23 September 2010
Figure 4.31e Predicted oil spill trajectory and vertical oil concentration (kg/m
single hypothetical
Figure 4.31f Predicted oil spill trajectory and vertical oil concentration (kg/m
single hypothetical
KITAN OIL SPILL RISK ASSESSMENT MODELLING
Predicted oil spill trajectory and vertical oil concentration (kg/m
hypothetical loss of 80m3 of diesel (Scenario 5)
Predicted oil spill trajectory and vertical oil concentration (kg/m
hypothetical loss of 80m3 of diesel (Scenario 5)
Page 53
Predicted oil spill trajectory and vertical oil concentration (kg/m3) for a
Predicted oil spill trajectory and vertical oil concentration (kg/m3) for a

ENI-JPDA-06-105 PTY LTD
KITAN OIL SPILL RISK ASSESSMENT MODELLING23 September 2010
4.6 EVENT 6: LOSS OF
4.6.1 Predicted Weathering Behaviour
For a refuelling accident the volume of diesel was set at 2.5m
Figure 4.32 shows the predicted weathering behaviour fr
speed of 4ms-1. Evaporation rates are initially high with just under 50% evaporating within
the first 24 hours. The rate of dispersion into the water column is also high
majority of diesel being removed from the se
Figure 4.32 Predicted weathering of diesel oil for a continuous release of 2.5m
1 hour for a 4ms
4.6.2 Stochastic Risk Assessment Modelling
Under summer conditions, the outer (1%) probability envelope extended
and 30km to the west of Kitan
(Figure 4.33). Under this scenario, there was a
Bank Shoals and no chance of reaching the Karmt Shoals. The predicted minimum time to
exposure at Big Bank Shoals was
evaporated by about 50% of its original volume. The spill was not predicted to make
contact with land.
KITAN OIL SPILL RISK ASSESSMENT MODELLING
LOSS OF 2.5M3 OF DIESEL OVER 1 HOUR
Predicted Weathering Behaviour
For a refuelling accident the volume of diesel was set at 2.5m3 over a duration of 1 hour.
shows the predicted weathering behaviour from the ADIOS2 model for a wind
. Evaporation rates are initially high with just under 50% evaporating within
The rate of dispersion into the water column is also high
majority of diesel being removed from the sea surface within three days.
Predicted weathering of diesel oil for a continuous release of 2.5m
hour for a 4ms-1 wind
Stochastic Risk Assessment Modelling
Under summer conditions, the outer (1%) probability envelope extended
of Kitan, reflecting the predominant wind direction during this season
. Under this scenario, there was a 5% probability that oil woul
of reaching the Karmt Shoals. The predicted minimum time to
exposure at Big Bank Shoals was six hours (Figure 4.34) by which time the spill would have
evaporated by about 50% of its original volume. The spill was not predicted to make
Page 54
over a duration of 1 hour.
om the ADIOS2 model for a wind
. Evaporation rates are initially high with just under 50% evaporating within
The rate of dispersion into the water column is also high with the
Predicted weathering of diesel oil for a continuous release of 2.5m3 over
Under summer conditions, the outer (1%) probability envelope extended 70km to the east
, reflecting the predominant wind direction during this season
% probability that oil would reach the Big
of reaching the Karmt Shoals. The predicted minimum time to
) by which time the spill would have
evaporated by about 50% of its original volume. The spill was not predicted to make

ENI-JPDA-06-105 PTY LTD
KITAN OIL SPILL RISK ASSESSMENT MODELLING23 September 2010
Under winter conditions, the outer (1%) probability envelope extended
and <10km to the east of Kitan
season (Figure 4.35). Under this scenario, there was a
the Big Bank Shoals and zero
minimum time to exposure at Big Bank Shoals was
spill would have evaporated by 50% of its original volume. The spill was not predicted to
make contact with land.
KITAN OIL SPILL RISK ASSESSMENT MODELLING
Under winter conditions, the outer (1%) probability envelope extended
of Kitan, reflecting the predominant wind direction during this
). Under this scenario, there was a <5% probability that oil woul
the Big Bank Shoals and zero probability of reaching the Karmt Shoals. The predicted
minimum time to exposure at Big Bank Shoals was six hours (Figure 4.36) by which time the
spill would have evaporated by 50% of its original volume. The spill was not predicted to
Page 55
Under winter conditions, the outer (1%) probability envelope extended 50km to the west
, reflecting the predominant wind direction during this
% probability that oil would reach
probability of reaching the Karmt Shoals. The predicted
) by which time the
spill would have evaporated by 50% of its original volume. The spill was not predicted to

ENI-JPDA-06-105 PTY LTD
KITAN OIL SPILL RISK ASSESSMENT MODELLING23 September 2010
Notes: Probability contours calculated from 200 oil spill simulations using for the period of drilling
Figure 4.33 Probability of surface exposure at day 5 under summer conditions from a
2.5m3 spill of diesel occurring over a 1 hour period
KITAN OIL SPILL RISK ASSESSMENT MODELLING
Probability contours calculated from 200 oil spill simulations using randomly selected wind and circulation data
Probability of surface exposure at day 5 under summer conditions from a
spill of diesel occurring over a 1 hour period
Big Bank
Page 56
randomly selected wind and circulation data
Probability of surface exposure at day 5 under summer conditions from a

ENI-JPDA-06-105 PTY LTD
KITAN OIL SPILL RISK ASSESSMENT MODELLING23 September 2010
Notes: Minimum time to contact contours were calculated from 200 oil spill simulations using randomly selected wind and circulation data for the period of drilling
Figure 4.34 Predicted minimum time to exposure under summer conditions from a
2.5m3 spill of diesel
KITAN OIL SPILL RISK ASSESSMENT MODELLING
Minimum time to contact contours were calculated from 200 oil spill simulations using randomly selected wind and circulation data for the period of drilling
Predicted minimum time to exposure under summer conditions from a
diesel occurring over a 1 hour period
Big Bank
Page 57
Minimum time to contact contours were calculated from 200 oil spill simulations using randomly selected wind
Predicted minimum time to exposure under summer conditions from a

ENI-JPDA-06-105 PTY LTD
KITAN OIL SPILL RISK ASSESSMENT MODELLING23 September 2010
Notes: Probability contours calculated from 200 oil spill simulations using randomly selected wind and for the period of drilling
Figure 4.35 Probability of surface exposure at day 5 under winter conditions from a
2.5m3 spill of diesel occurring over a 1 hour period
KITAN OIL SPILL RISK ASSESSMENT MODELLING
Probability contours calculated from 200 oil spill simulations using randomly selected wind and
Probability of surface exposure at day 5 under winter conditions from a
spill of diesel occurring over a 1 hour period
Big Bank
Page 58
Probability contours calculated from 200 oil spill simulations using randomly selected wind and circulation data
Probability of surface exposure at day 5 under winter conditions from a
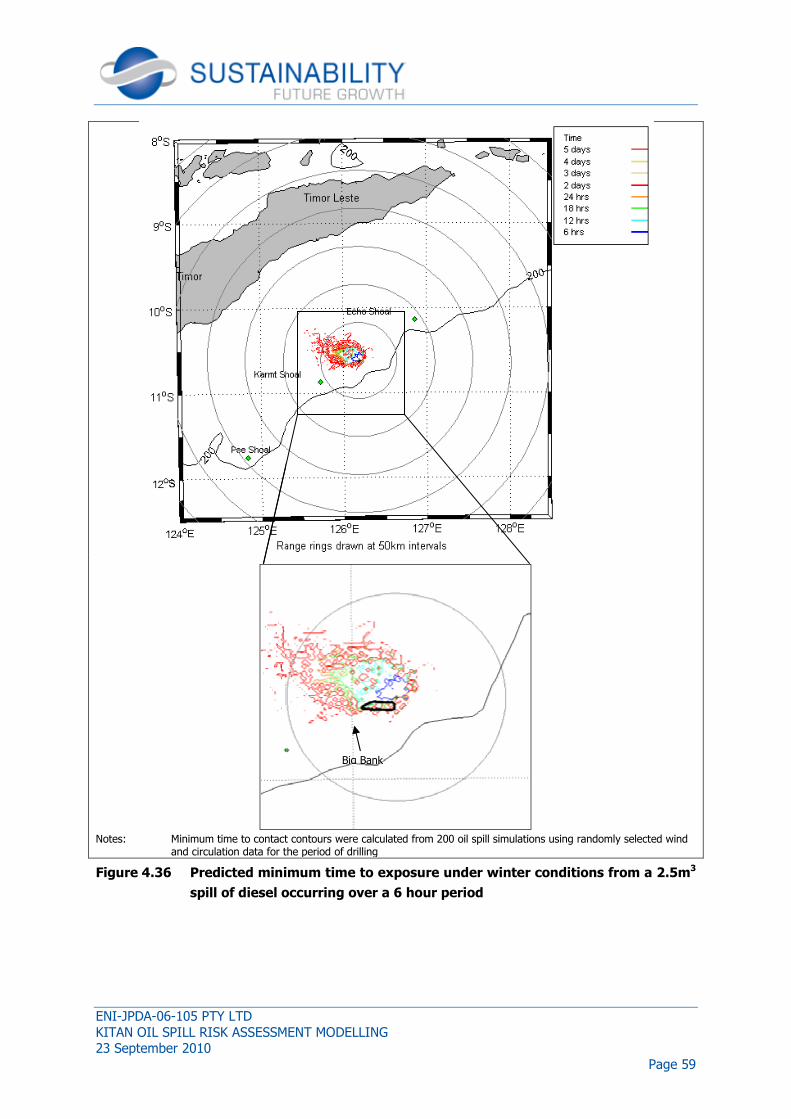
ENI-JPDA-06-105 PTY LTD
KITAN OIL SPILL RISK ASSESSMENT MODELLING23 September 2010
Notes: Minimum time to contact contours were calculated from 200 oil spill simulations using randomly selected wind and circulation data for the period of drilling
Figure 4.36 Predicted minimum time to expos
spill of diesel occurring over a
KITAN OIL SPILL RISK ASSESSMENT MODELLING
Minimum time to contact contours were calculated from 200 oil spill simulations using randomly selected wind and circulation data for the period of drilling
Predicted minimum time to exposure under winter conditions from a
occurring over a 6 hour period
Big Bank
Page 59
Minimum time to contact contours were calculated from 200 oil spill simulations using randomly selected wind
conditions from a 2.5m3

ENI-JPDA-06-105 PTY LTD
KITAN OIL SPILL RISK ASSESSMENT MODELLING23 September 2010
5. DISCUSSION
5.1 KITAN CRUDE OIL
Kitan crude oil is light and evaporates readily from the sea surface. For example, a large
spill would be expected to evaporate by over 60% of its original volume after 24hours.
Under low wind conditions across all for crude oil spill scenarios, evaporation accounte
between 60% and 85% of weathering whereas entrainment into the water column
accounted for between 1% and 4%. In contrast, under strong wind conditions, entrainment
accounted for between 4% and 12% of weathering across the
Under strong winds, oil droplets of less than 100µm would become entrained rapidly into the
water column. As wind strength and surface wave intensity increases, oil droplets of greater
than 100µm would also become mixed into the water column
content and low asphaltene concentrations suggesting that it is unlikely to form a stable
emulsion. This has been confirmed by studies on a sample of Kitan oil
The oil dispersion probability envelopes reflected the prevail
During summer, winds are predominantly from the west and the probability envelopes
extended to the east whereas for winter, the
The probability of crude oil spreading to the Big Bank Shoals was over 70% to 8
the large spill size scenarios
for the smaller scenarios (Table 5.1). The minimum time to reach Big Bank Shoals was less
than six hours during which time it would be most likely to degrade by between 50%
80% of its initial volume. Deterministic modelling indicated that spilled oil would remain at
the sea surface. Thus, although oil may become entrained into the water column overlying
the nearby Big Bank Shoals (particularly in winter), impacts on the benthic communities
would not be expected to occur due to the water depth (
from the Kitan oilfield, and the degree of weathering and dilution that would occur prior to
any potential contact.
Crude oil was not predicted to reach land under any of the spill volume and season
scenarios, reflecting the light nature of the oil and i
occurring at the Kitan oilfield would be most likely to biodegrade at sea and should therefore
be monitored and allowed to degrade naturally without the use of dispersants.
KITAN OIL SPILL RISK ASSESSMENT MODELLING
KITAN CRUDE OIL
oil is light and evaporates readily from the sea surface. For example, a large
spill would be expected to evaporate by over 60% of its original volume after 24hours.
Under low wind conditions across all for crude oil spill scenarios, evaporation accounte
between 60% and 85% of weathering whereas entrainment into the water column
accounted for between 1% and 4%. In contrast, under strong wind conditions, entrainment
accounted for between 4% and 12% of weathering across the four crude oil
Under strong winds, oil droplets of less than 100µm would become entrained rapidly into the
water column. As wind strength and surface wave intensity increases, oil droplets of greater
than 100µm would also become mixed into the water column. Kitan oil has a low wax
content and low asphaltene concentrations suggesting that it is unlikely to form a stable
emulsion. This has been confirmed by studies on a sample of Kitan oil (EAL, 2009)
The oil dispersion probability envelopes reflected the prevailing seasonal wind patterns.
During summer, winds are predominantly from the west and the probability envelopes
extended to the east whereas for winter, the reverse was true.
oil spreading to the Big Bank Shoals was over 70% to 8
the large spill size scenarios (7000m3 over 24hrs and 1800m3/day over 5
(Table 5.1). The minimum time to reach Big Bank Shoals was less
than six hours during which time it would be most likely to degrade by between 50%
80% of its initial volume. Deterministic modelling indicated that spilled oil would remain at
urface. Thus, although oil may become entrained into the water column overlying
the nearby Big Bank Shoals (particularly in winter), impacts on the benthic communities
would not be expected to occur due to the water depth (≥20m water depth LAT), distance
from the Kitan oilfield, and the degree of weathering and dilution that would occur prior to
il was not predicted to reach land under any of the spill volume and season
scenarios, reflecting the light nature of the oil and its tendency to weather rapidly. Any spill
occurring at the Kitan oilfield would be most likely to biodegrade at sea and should therefore
be monitored and allowed to degrade naturally without the use of dispersants.
Page 60
oil is light and evaporates readily from the sea surface. For example, a large
spill would be expected to evaporate by over 60% of its original volume after 24hours.
Under low wind conditions across all for crude oil spill scenarios, evaporation accounted for
between 60% and 85% of weathering whereas entrainment into the water column
accounted for between 1% and 4%. In contrast, under strong wind conditions, entrainment
four crude oil spill scenarios.
Under strong winds, oil droplets of less than 100µm would become entrained rapidly into the
water column. As wind strength and surface wave intensity increases, oil droplets of greater
n oil has a low wax
content and low asphaltene concentrations suggesting that it is unlikely to form a stable
(EAL, 2009).
ing seasonal wind patterns.
During summer, winds are predominantly from the west and the probability envelopes
oil spreading to the Big Bank Shoals was over 70% to 80% under
over 56 days) and 30%
(Table 5.1). The minimum time to reach Big Bank Shoals was less
than six hours during which time it would be most likely to degrade by between 50% and
80% of its initial volume. Deterministic modelling indicated that spilled oil would remain at
urface. Thus, although oil may become entrained into the water column overlying
the nearby Big Bank Shoals (particularly in winter), impacts on the benthic communities
20m water depth LAT), distance
from the Kitan oilfield, and the degree of weathering and dilution that would occur prior to
il was not predicted to reach land under any of the spill volume and season
ts tendency to weather rapidly. Any spill
occurring at the Kitan oilfield would be most likely to biodegrade at sea and should therefore
be monitored and allowed to degrade naturally without the use of dispersants.
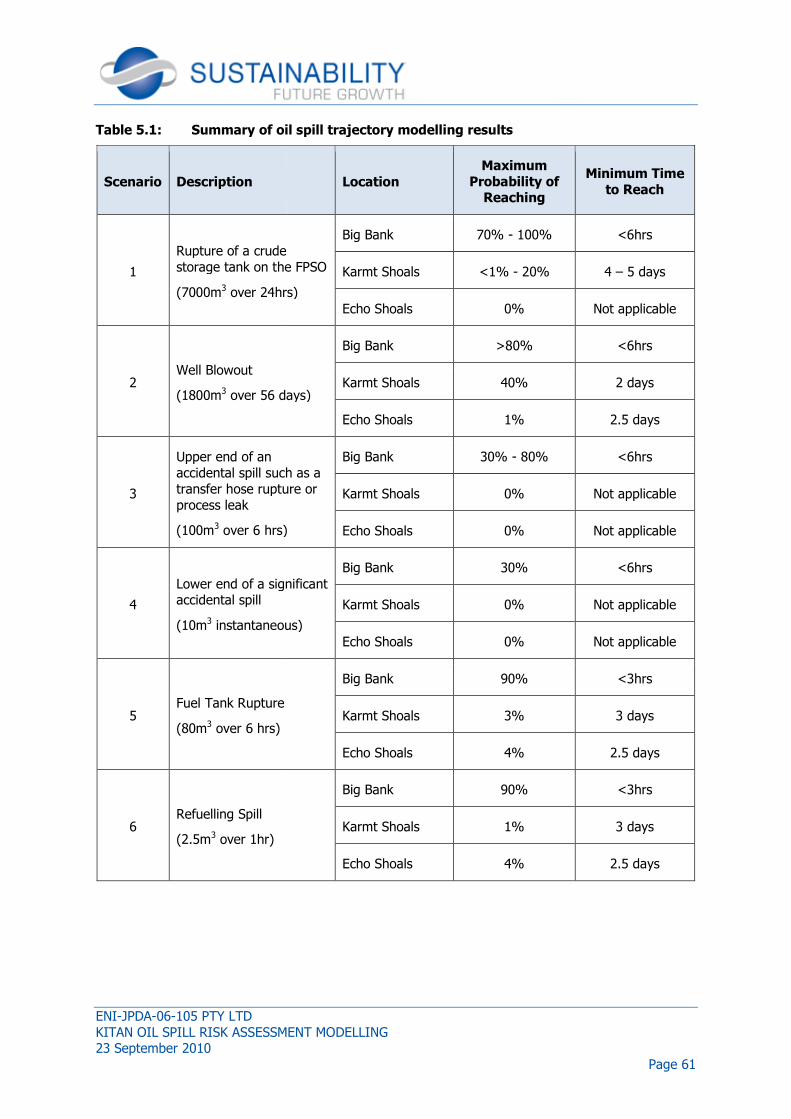
ENI-JPDA-06-105 PTY LTD
KITAN OIL SPILL RISK ASSESSMENT MODELLING23 September 2010
Table 5.1: Summary of oil spill trajectory modelling results
Scenario Description
1
Rupture of a crude
storage tank on the FPSO
(7000m3 over 24hrs)
2 Well Blowout
(1800m3 over 56 days)
3
Upper end of an
accidental spill such as a
transfer hose rupture or
process leak
(100m3 over 6 hrs)
4
Lower end of a significant accidental spill
(10m3 instantaneous)
5 Fuel Tank Rupture
(80m3 over 6 hrs)
6 Refuelling Spill
(2.5m3 over 1hr)
KITAN OIL SPILL RISK ASSESSMENT MODELLING
Summary of oil spill trajectory modelling results
Location
Maximum
Probability of Reaching
Rupture of a crude
storage tank on the FPSO
over 24hrs)
Big Bank 70% - 100%
Karmt Shoals <1% - 20%
Echo Shoals 0%
days)
Big Bank >80%
Karmt Shoals 40%
Echo Shoals 1%
accidental spill such as a
transfer hose rupture or
over 6 hrs)
Big Bank 30% - 80%
Karmt Shoals 0%
Echo Shoals 0%
Lower end of a significant
instantaneous)
Big Bank 30%
Karmt Shoals 0%
Echo Shoals 0%
Big Bank 90%
Karmt Shoals 3%
Echo Shoals 4%
Big Bank 90%
Karmt Shoals 1%
Echo Shoals 4%
Page 61
Minimum Time
to Reach
<6hrs
4 – 5 days
Not applicable
<6hrs
2 days
2.5 days
<6hrs
Not applicable
Not applicable
<6hrs
Not applicable
Not applicable
<3hrs
3 days
2.5 days
<3hrs
3 days
2.5 days

ENI-JPDA-06-105 PTY LTD
KITAN OIL SPILL RISK ASSESSMENT MODELLING23 September 2010
5.2 DIESEL
Diesel is a light petroleum distillate
with moderate evaporative loss in tropical waters
the temperatures likely to be found in the Timor Sea and so these will not inhibit s
of the slick or evaporation rates.
Unlike Kitan crude oil, only 50% of the diesel would be expected to evaporate after 24hrs,
with the remaining 50% spreading out as a surface slick. Diesel would not be expected to
form an emulsion. Stochastic
spill spreading to the nearby Big Bank Shoals within 3 hours of release (Table 5.1).
Although a diesel slick has a high probability of being
deterministic modelling indicated that most of the oil would remain at the sea surface.
Vertical turbulence generated by waves only mixes the oil particles to a depth of no more
than 5m below the surface.
Like the Kitan crude oil, diesel
and season scenarios. Any diesel
biodegrade at sea and should therefore be monitored and allowed to degrade naturally
without the use of dispersants.
KITAN OIL SPILL RISK ASSESSMENT MODELLING
light petroleum distillate and would be expected to undergo a rapid spreading
with moderate evaporative loss in tropical waters. Diesel oils tend not to form emulsions at
the temperatures likely to be found in the Timor Sea and so these will not inhibit s
of the slick or evaporation rates.
Unlike Kitan crude oil, only 50% of the diesel would be expected to evaporate after 24hrs,
with the remaining 50% spreading out as a surface slick. Diesel would not be expected to
form an emulsion. Stochastic modelling indicated that there is a 90% probability of a diesel
spill spreading to the nearby Big Bank Shoals within 3 hours of release (Table 5.1).
Although a diesel slick has a high probability of being transported over Big Bank Shoals
odelling indicated that most of the oil would remain at the sea surface.
ertical turbulence generated by waves only mixes the oil particles to a depth of no more
, diesel was not predicted to reach land under any of the spill volume
diesel spill occurring at the Kitan oilfield would be most likely to
biodegrade at sea and should therefore be monitored and allowed to degrade naturally
without the use of dispersants.
Page 62
expected to undergo a rapid spreading
Diesel oils tend not to form emulsions at
the temperatures likely to be found in the Timor Sea and so these will not inhibit spreading
Unlike Kitan crude oil, only 50% of the diesel would be expected to evaporate after 24hrs,
with the remaining 50% spreading out as a surface slick. Diesel would not be expected to
modelling indicated that there is a 90% probability of a diesel
spill spreading to the nearby Big Bank Shoals within 3 hours of release (Table 5.1).
transported over Big Bank Shoals,
odelling indicated that most of the oil would remain at the sea surface.
ertical turbulence generated by waves only mixes the oil particles to a depth of no more
under any of the spill volume
spill occurring at the Kitan oilfield would be most likely to
biodegrade at sea and should therefore be monitored and allowed to degrade naturally

ENI-JPDA-06-105 PTY LTD
KITAN OIL SPILL RISK ASSESSMENT MODELLING23 September 2010
6. REFERENCES
Blanton, B.O. (1995). User’s manual for 3
linear finite elements. OPNML.
Bowden, K. F. (1983). Physical Oceanography of Coastal Waters
312p.
EAL (2009). “Rheology and Emulsion Stabili
permit JPDA 06-105, Timor Sea”.WTC
Fay, J. A. (1969). The spread of oil slicks on a calm sea.
pp53 – 64.
Fingas, M. F. (1999). The evaporatio
prediction methodology
American Petroleum Institute, Washington, DC, pp. 281
Ichiye, T. (1967). Upper ocean boundary
Fluids Suppl. Vol. 10, pp 270
Intertek (2008). Kitan-1 oil assay.
Ip, J.T.C. and D.R. Lynch. (1995).
Finite Elements: Nonlinear Prognostic Time
95-1.
Kullenberg, G. (1982). Pollutant transfer and transport in the sea
Fl. , Vol. I. 227 p.
Le Provost, C., A. F. Bennett, and D. E. Cartwright. (1995).
TOPEX/POSEIDON. Science, Vol. 267, 639
OGP (2010). Risk assessment data directory: Blowout frequencies. Report No. 434
International Association of Oil and Gas Producers, London.
Okubo, A. (1971). Oceanic diffusion
Okubo, A., (1974). Some speculation on oceanic diffusion diagrams
Talbot, J. (eds), Physical
Rapp. Proc. Verb Penn. Cons. Inter.
Saipem Energy Services. (2009).
Operational Criteria. Doc. A
Sherwin, T.J. (1992). Methods for determining pollutant dispersion in tidal waters.
Report: U89-5(I:3). March, 1992.
KITAN OIL SPILL RISK ASSESSMENT MODELLING
User’s manual for 3-Dimensional drogue tracking on a FE grid with
. OPNML.
Physical Oceanography of Coastal Waters. Ellis Harwood Ltd, UK.
“Rheology and Emulsion Stability Evaluation – Oil Sample from the Kitan
105, Timor Sea”.WTC-09-001152, dated 11/06/2009
The spread of oil slicks on a calm sea. Oil on the Sea. Plenum, New York,
The evaporation of oil spills: Development and implementation of new
prediction methodology. Proceedings of the 1999 International Oil Spill Conference.
American Petroleum Institute, Washington, DC, pp. 281-287.
Upper ocean boundary-layer flow determined by dye diffusion
Fluids Suppl. Vol. 10, pp 270-277.
1 oil assay. Unpublished report for Eni Australia Limited.
Ip, J.T.C. and D.R. Lynch. (1995). Comprehensive Coastal Circulation Simulation using
s: Nonlinear Prognostic Time-Stepping Model, QUODDY3 User's Manual
Pollutant transfer and transport in the sea. CRC Press, Boca Raton,
Le Provost, C., A. F. Bennett, and D. E. Cartwright. (1995). Ocean tides for and from
. Science, Vol. 267, 639-642.
OGP (2010). Risk assessment data directory: Blowout frequencies. Report No. 434
International Association of Oil and Gas Producers, London.
Oceanic diffusion diagrams. Deep Sea Research 18:789
Some speculation on oceanic diffusion diagrams. In Kullenberg, G. and
Talbot, J. (eds), Physical Processes Responsible for Dispersal of Pollutants in the Sea.
Proc. Verb Penn. Cons. Inter. Expl. Mer. 167: 77-85.
Saipem Energy Services. (2009). Kitan Field Development Project Metocean Design And
Doc. A-050-GR-71500 Rev 0.
Methods for determining pollutant dispersion in tidal waters.
5(I:3). March, 1992.
Page 63
Dimensional drogue tracking on a FE grid with
Ellis Harwood Ltd, UK.
Oil Sample from the Kitan-1 well,
001152, dated 11/06/2009
n the Sea. Plenum, New York,
n of oil spills: Development and implementation of new
Proceedings of the 1999 International Oil Spill Conference.
determined by dye diffusion. Phys.
Unpublished report for Eni Australia Limited.
Comprehensive Coastal Circulation Simulation using
Stepping Model, QUODDY3 User's Manual. NML
CRC Press, Boca Raton,
Ocean tides for and from
OGP (2010). Risk assessment data directory: Blowout frequencies. Report No. 434-2.
18:789-802.
In Kullenberg, G. and
Processes Responsible for Dispersal of Pollutants in the Sea.
Kitan Field Development Project Metocean Design And
Methods for determining pollutant dispersion in tidal waters. UCES

ENI-JPDA-06-105 PTY LTD
KITAN OIL SPILL RISK ASSESSMENT MODELLING23 September 2010
Swan, J.M. J.M. Neff and P.C. Young, Eds. (1994).
Oil and Gas Development in Australia
Review. Australian Petroleum Exploration Association, Can
U.S. Army Corps of Engineers (1984).
Research Center, Vicksburg,
Wijffels, S.E., Bray, N., Hautala, S., Meyers, G. and Morawitz, W.M.L. (1996).
Indonesian Throughflow Repeat Hydrography Sections: I10 and IR6.
Woodside (2002). WA-271-P Field Development Draft Environmental Impact Statement.
KITAN OIL SPILL RISK ASSESSMENT MODELLING
Swan, J.M. J.M. Neff and P.C. Young, Eds. (1994). Environmental Implications of Offshore
Oil and Gas Development in Australia – The Findings of an Independent Scientific
Australian Petroleum Exploration Association, Canberra, Australia.
Army Corps of Engineers (1984). Shore Protection Manual. Coastal Engineering
Research Center, Vicksburg, Mississippi. 2 vols.
Wijffels, S.E., Bray, N., Hautala, S., Meyers, G. and Morawitz, W.M.L. (1996).
Indonesian Throughflow Repeat Hydrography Sections: I10 and IR6.
P Field Development Draft Environmental Impact Statement.
Page 64
Environmental Implications of Offshore
The Findings of an Independent Scientific
berra, Australia.
Coastal Engineering
Wijffels, S.E., Bray, N., Hautala, S., Meyers, G. and Morawitz, W.M.L. (1996). The WOCE
Indonesian Throughflow Repeat Hydrography Sections: I10 and IR6. WOCE, 24.
P Field Development Draft Environmental Impact Statement.

ENI-JPDA-06-105 PTY LTD
KITAN OIL SPILL RISK ASSESSMENT MODELLING23 September 2010
7. ABBREVIATIONS
ADIOS2 Automated Data Inquiry for Oil Spills
AHD Australian Height Datum
API American Petroleum Institute
Eni ENI-JPDA-06
EMP Environmental Management Plan
HAT Highest Astronomic Tide
HYCOM HYbrid Coordinate Ocean Model
JPDA Joint Petroleum Development Authority
LAT Lowest Astronomical Tide
MHWN Mean High Water
MHWS Mean High Water Springs
MLWN Mean Low Water Neaps
MLWS Mean Low Water Springs
MSL Mean Sea Level
NCEP National Center for Environmental Protection
NOAA National Oceanic and Atmospheric Administration
OSCP Oil Spill Contingency Plan
SOI Southern Oscillation Index
KITAN OIL SPILL RISK ASSESSMENT MODELLING
ABBREVIATIONS
Automated Data Inquiry for Oil Spills
Australian Height Datum
American Petroleum Institute
06-105 PTY LTD
Environmental Management Plan
Highest Astronomic Tide
HYbrid Coordinate Ocean Model
Joint Petroleum Development Authority
Lowest Astronomical Tide
Mean High Water Neaps
Mean High Water Springs
Mean Low Water Neaps
Mean Low Water Springs
Mean Sea Level
National Center for Environmental Protection
National Oceanic and Atmospheric Administration
Oil Spill Contingency Plan
thern Oscillation Index
Page 65