Embed Size (px)
Citation preview

RSC Advances
PAPER
Ope
n A
cces
s A
rtic
le. P
ublis
hed
on 2
3 Ju
ne 2
020.
Dow
nloa
ded
on 1
/18/
2022
4:5
0:35
PM
. T
his
artic
le is
lice
nsed
und
er a
Cre
ativ
e C
omm
ons
Attr
ibut
ion
3.0
Unp
orte
d L
icen
ce.
View Article OnlineView Journal | View Issue
Enhancing the n
College of Environmental Science and Engin
79 Yingzexi Road, Taiyuan 030000, P. R. Ch
+86 0351-3176586
Cite this: RSC Adv., 2020, 10, 23782
Received 14th April 2020Accepted 9th June 2020
DOI: 10.1039/d0ra03333b
rsc.li/rsc-advances
23782 | RSC Adv., 2020, 10, 23782–
itrogen removal from swinewastewater digested liquid in a trickling biofilterwith a soil layer
Bowei Zhao, Fei Xie, Xiao Zhang and Xiuping Yue *
Trickling biofilters (TFs) allow for a simultaneous nitrification and denitrification (SND) process, and offer
a favorable solution for the treatment of swine-wastewater digested liquid due to their simple operation
and low cost. In this study, a soil trickling biofilter (STF) was developed to enhance nitrogen removal. A
gravel trickling filter (GTF) and a woodchip trickling filter (WTF) were also constructed and operated
synchronously to demonstrate the advantage of micron-sized media. The results showed that the STF
had a higher ammonium nitrogen (NH4+-N) removal capacity of 21.4%, 24.9%, and 18.3% in comparison
to the GTF when the influent NH4+-N was 192.9 mg L�1, 500.2 mg L�1 and 802.1 mg L�1, respectively.
The total nitrogen (TN) removal capacity of the STF was 104.6%, 89.4%, and 37.5% higher than that of
the WTF. Thus, the addition of micron-sized soil to TF could increase the systemic nitrogen removal
capacity.
1. Introduction
Swine wastewater from large-scale farms can have a highchemical oxygen demand (COD) and high ammonium nitrogen(NH4
+-N) concentration, thus making it a major pollutant invast rural areas.1 Swine wastewater that is not properly disposedof can cause serious problems in the agricultural environment,for example, eutrophication and zoonosis.2–4 With respect to theeconomy, environmental sustainability, and social accept-ability, the technologies for swine wastewater treatment shouldbe low-cost, energy-saving, low-maintenance, effective, andstable.5,6
The key point of swine wastewater treatment is the removalof nitrogen from the digested liquid with a low carbon/nitrogenratio (C/N).7 Most technologies for nitrogen removal are basedon the conventional nitrication and denitrication processes.Generally, the traditional biological nitrogen removal processincludes plug ow reactors [e.g., anoxic oxic (A/O)]8 andcontinuous stirred tank reactors [e.g., sequencing batch reactor(SBR)].9,10 Although these techniques have a favorable effect onnitrogen removal during swine-wastewater digested liquidtreatment, they are disadvantageous in terms of their runningcosts.
The modern nitrogen removal processes include single highammonia removal over nitrite (SHARON), anaerobic ammo-nium oxidation (ANAMMOX), complete autotrophic nitrogenremoval over nitrite (CANON), and oxygen-limited autotrophic
eering, Taiyuan University of Technology,
ina. E-mail: [email protected]; Tel:
23791
nitrication–denitrication (OLAND). These methods haveseveral advantages in terms of their low running costs due to themoney saved for aeration, the organic carbon source for deni-trication, and the reactor volume.11–13 Unfortunately, thesetechnologies require strict operational conditions to maintainthe stability of the system, which increases the operation diffi-culties and restrict their widespread application.
Trickling biolter (TF) is a biolm wastewater treatmentprocess that has been generally recognized as providing aneffective simultaneous nitrication and denitrication (SND)process with a low-cost and convenient management. TF hasbeen widely used to treat domestic wastewater, piggery waste-water, textile wastewater, and leachate.14 The biochemicalprocess is the main pollutant removal pathway, whereby themicrobes growing on the surface of the lter material play themajor role.15 Hence, the characteristics of the lter material arekey factors affecting the efficiency of TF.
An excellent lter material should have a large specicsurface area and a good biolm adhesion. Various materialshave been investigated as lter material for use in TF systems,for example, zeolite, sand, plastic, woodchip and complexmaterial.16 This study focused on the surface characteristics ofthe lter media to obtain favorable treatment efficiency. Withthe exception of the surface characteristics, the size of the ltermaterial is the most direct factor affecting the specic surfacearea of the material. In principle, the smaller the size of a ltermaterial, the larger specic surface area is for the enrichment ofmicrobes. Soil, as the natively weathered gravel, generally hasa small size between millimeters and microns. Hence, soilinltration technology has long since been used for watertreatment.17,18 However, the clogging and blocking of the soil
This journal is © The Royal Society of Chemistry 2020

Table 1 Characteristics of swine-wastewater digested liquid
Period DayCOD(mg L�1)
NH4+-N
(mg L�1)TKN(mg L�1)
TN(mg L�1)
TP(mg L�1) pH
Startup 1–55 295.1 489.7 492.8 496.6 18.7 8.3I 56–155 180.9 192.9 194.5 198.1 8.7 8.0II 156–255 293.1 500.2 502.2 503.8 19.3 8.3III 256–346 508.9 802.1 804.5 807.3 29.2 8.5
Paper RSC Advances
Ope
n A
cces
s A
rtic
le. P
ublis
hed
on 2
3 Ju
ne 2
020.
Dow
nloa
ded
on 1
/18/
2022
4:5
0:35
PM
. T
his
artic
le is
lice
nsed
und
er a
Cre
ativ
e C
omm
ons
Attr
ibut
ion
3.0
Unp
orte
d L
icen
ce.
View Article Online
layer limit the treatment capacity of soil inltration, and alsoprevent the utilization of soil in TF systems.1
In this study, a novel soil TF (STF) is proposed to solve theclogging problem of a micron-sized soil lter material undera high hydraulic and organic load. This novel techniqueinvolves the micron-sized soil adhering to a woodchip frame-work. Thus, the soil layer that becomes xed to the frameworkcan resist a certain hydraulic load and has a large specicsurface area to adhere to the biolm. In order to compare theadvantages of this STF process, a gravel TF (GTF) and a wood-chip TF (WTF) were also constructed and synchronously oper-ated. The aim of using GTF is to demonstrate the size advantageof the micron-size soil for the enrichment of microbes, whereasthe aim of using the WTF is to show the effect of the woodchipframework in the STF.
2. Materials and methods2.1 Wastewater
Raw wastewater was collected from a local pig farm. Theinuent used in this study was the digested liquid with a lowC/N ratio from the UASB treatment of the raw wastewater. Thecharacteristics of the digested liquid are listed in Table 1.
2.2 Reactors
Three TF reactors of the same size were constructed, each witha 0.3 m high plexiglass column of 0.1 m diameter (Fig. 1). Thetotal volume of each reactor was 2.0 L, with an effective volumeof 1.5 L. A circular cone with a volume of 0.2 L was attached to
Fig. 1 Schematic diagram of three trickling filter reactors.
This journal is © The Royal Society of Chemistry 2020
the bottom of the plexiglass column. There were two symmet-rical vents with an area of 2.5 cm2 between the lter bed and thecircular cone to allow natural ventilation.
2.3 Filter material
In this study, pine wood was chosen to make the woodchips,which were 3–5 cm high, 2–3 cm wide, and 0.5–0.8 cm thick.Gravel with a diameter of 1 cm was used for the lter materialin the GTF. The soil was ground to a powder and sievedthrough a screen of 160 meshes per square centimeter. Thebulk density, porosity, and ash content of the soil were0.855 g cm�3, 50% (v/v), and 81.12% (w/w), respectively.Woodchips (of the same size as those used as the lter mate-rial in the WTF) provided the framework in the STF.
To create a soil layer within the framework of the STF, thewoodchips were soaked in fresh water and then rolled over theprepared dry soil powder. As the woodchips were damp, the soiladhered onto the surface of the woodchips. The bulk volumeratio of the woodchips to the soil in the STF was approximately2 : 1. To compare the efficiency of the three TFs, the void volumeratio for each of the three TFs was about 50%.
2.4 Operation
The three TFs were fed with the same swine wastewater digestedliquid. The wastewater was evenly sprayed onto the top of thelter bed with a hydraulic loading of 0.17 m3 m�3 d�1 during alloperating periods. The effluent was collected by the cone anddischarged from the bottom. There were no inoculums withmicroorganisms for all reactors before starting-up. There werefour operating periods according to the different organicvolume loading rate (OLR) and inuent quality. All three reac-tors used natural aeration and were operated at an ambienttemperature of between 15 �C and 25 �C. The operationalparameters are illustrated in Table 1.
2.5 Wastewater quality analysis
The COD, NH4+-N, nitrite nitrogen (NO2
�-N), nitrate nitrogen(NO3
�-N), and total nitrogen (TN) were analyzed according tothe standard methods for the examination of water and
RSC Adv., 2020, 10, 23782–23791 | 23783

RSC Advances Paper
Ope
n A
cces
s A
rtic
le. P
ublis
hed
on 2
3 Ju
ne 2
020.
Dow
nloa
ded
on 1
/18/
2022
4:5
0:35
PM
. T
his
artic
le is
lice
nsed
und
er a
Cre
ativ
e C
omm
ons
Attr
ibut
ion
3.0
Unp
orte
d L
icen
ce.
View Article Online
wastewater.7 The concentrations were determined usinga spectrophotometer (Shimadzu, UV2500). The pH was moni-tored by a DELTA 320 pH meter. Normally, the inuent andeffluent were sampled once every 5 days for analysis.
2.6 Observation of the lter media
Before operating the reactors, the woodchips, gravel, soil, andwoodchips wrapped with soil were all sampled. The sampleswere soaked in a 2.5% glutaraldehyde solution (pH 7.2) for 2 h.Then, all samples were washed three times with a 0.1 mol L�1
phosphate buffer (pH 7.2). Alcohol at a concentration of 50%,60%, 70%, 80%, 90%, and 100% was in turn used to dehydratethe samples, whereby tert-butyl alcohol gradually replaced thealcohol. Aerward, the samples were dried by a desiccator(HCP-2, HITACHI). Finally, the samples were plated with a goldlm of 1 nm by an ion sputtering coater (E-1010, HITACHI) andobserved with a scanning electron microscope (SEM).
2.7 Analyses using PCR and DGGE
On the last day of operation, lter material was sampled fromthe three TFs. Genomic DNA of all samples was extracted usingDNA isolation kit components (MOBIO), which was performedaccording to the manufacturer's operations manual. The purity
Fig. 2 SEM images of the filter media before operation: (A) wood chips; (B(F) gravel 3000�; (G) soil 3000�.
23784 | RSC Adv., 2020, 10, 23782–23791
and quantity of the extracted DNA were determined by ultravi-olet spectrophotometry at 260 nm and 280 nm, and the DNAwas subsequently stored at �20 �C. A nested polymerase chainreaction (PCR) was used to amplify the bacterial specic 16SrRNA gene for denaturing gradient gel electrophoresis (DGGE).The bacterial specic primers CTO189f and CTO654r were usedin the PCR to amplify the DNA fragments. The specic proce-dures of the PCR and DGGE analyses were conducted accordingto.7
3. Results3.1 Observation of lter media before operation
Fig. 2A–D shows the surface of the woodchips, gravel, micron-sized soil, and soil with woodchips in magnied SEM images(�100). As can be seen in Fig. 2A and B, some cut stripes wereclear on the woodchips and a crude surface was observed on thegravel. As Fig. 2C shows, the size of a soil granule rangedbetween 50 and 100 mm, which indicates that, aer grindingand screening through the 160 mesh, the natural soil couldeasily maintain a micron-size. The woodchips that were wrap-ped with soil are illustrated in Fig. 2D, which clearly displaysa thin layer of micron-sized soil adhering to the woodchips. Thecut stripes on the surface of the woodchips had been completely
) gravel; (C) soil; (D) wood chips adhered by soil; (E) wood chips 3000�;
This journal is © The Royal Society of Chemistry 2020

Fig. 3 The performance of the three TFs: (A) COD concentration; (B) COD removal rate; (C) NH4+-N concentration; (D) NH4
+-N removal rate; (E)NO2
�-N concentration; (F) NO3�-N concentration; (G) TN concentration; (H) TN removal rate; (I) pH value.
Paper RSC Advances
Ope
n A
cces
s A
rtic
le. P
ublis
hed
on 2
3 Ju
ne 2
020.
Dow
nloa
ded
on 1
/18/
2022
4:5
0:35
PM
. T
his
artic
le is
lice
nsed
und
er a
Cre
ativ
e C
omm
ons
Attr
ibut
ion
3.0
Unp
orte
d L
icen
ce.
View Article Online
covered by the micron-sized soil. Moreover, Fig. 2E–G reveal thesurface details of the woodchips, gravel, and micron-sized soilin magnied SEM images (�3000). In particular, Fig. 2E
This journal is © The Royal Society of Chemistry 2020
illustrates the smooth wood surface and the side of the woodber layer. Comparing Fig. 2F and G, the surfaces of the soil andgravel were similar and both were crude; hence, the main
RSC Adv., 2020, 10, 23782–23791 | 23785

RSC Advances Paper
Ope
n A
cces
s A
rtic
le. P
ublis
hed
on 2
3 Ju
ne 2
020.
Dow
nloa
ded
on 1
/18/
2022
4:5
0:35
PM
. T
his
artic
le is
lice
nsed
und
er a
Cre
ativ
e C
omm
ons
Attr
ibut
ion
3.0
Unp
orte
d L
icen
ce.
View Article Online
difference between the soil and gravel was their size due tonatural weathering and our operation. The pores on the wood-chip surface were barely noticeable (Fig. 2A and E), even whenmagnied �3000. The pore size of the woodchips with soiladhered (inferred as being 8–10 mm from Fig. 2D) was signi-cantly smaller than that of the gravel and soil only, whichcontributed to its larger specic surface area for microorgan-isms living.
3.2 Removal of COD
The three TF reactors were started at a hydraulic loading volumeof 0.17 m3 m�3 d�1 with an organic volume loading rate (OLR)of 50.8 g m�3 d�1 COD. The removal performances for the CODin the three TFs are presented in Fig. 3A and B. During the rst30 days, the COD of the effluent from each of the three TFs allreduced rapidly. Aer day 30, the COD stabilized. From day 30to the end of start-up period, the average COD removal effi-ciencies of the WTF, GTF, and STF were 46.38%, 56.77%, and38.28%, respectively. Moreover, the COD in the effluent in theSTF was higher than that in the inuent during the rst 5 daysbecause some intrinsic organic matter in the soil was removedby the effluent.
The inuent COD during period I, II, and III was180.9 mg L�1, 293.1 mg L�1, and 508.9 mg L�1 with an organicload of 30.8 g m�3 d�1, 49.8 g m�3 d�1, and 86.5 g m�3 d�1,respectively (Fig. 3A). The COD removal efficiencies of all threeTFs recovered and were stable again within 5 days once theinuent changed. This indicates that the TF process in all of thereactors had a good capacity to resist the organic load impact,which agrees with previous studies.19,20 The average CODremoval rate of the WTF during the stable stages of periods I, II,and III (i.e., day 56 to day 155, day 156 to day 255, and day 256 today 346, respectively) was 11.0%, 44.2%, and 60.6%, respec-tively. Meanwhile, the COD removal rate of the GTF during thestable stages of periods I, II, and III was 35.1%, 41.7%, and60.1%, and that of the STF was 3.9%, 21.7%, and 49.6%,respectively (Fig. 3B).
3.3 Ammonium-nitrogen removal and nitrication
The NH4+-N concentration and removal rate of the three TFs are
displayed in Fig. 3C and D. During the rst 15 days, the WTFhad a low but stable NH4
+-N removal rate, which increasedgradually until day 30 before stabilizing at 65.89%. The NH4
+-Nremoval of the GTF increased rapidly during the rst 15 daysand then slowly aer day 16. At the stable state of the start-upperiod, the NH4
+-N removal rate of the GTF uctuated at�61.63%. The NH4
+-N removal rate of the STF exhibited a “V”trend with the lowest point being on day 10. The NH4
+-Nremoval rate was stable at 72.32% aer day 40. Dissolved oxygen(DO) was used to oxidize ammonia, either by ammoniaoxidizing bacteria (AOB) or nitrite oxidizing bacteria (NOB). Themoisture content of the STF was higher than that of the WTFand GTF; therefore, the DO concentration in the solution of theSTF was relatively high. As shown in Fig. 3D and E, the NH4
+-Nremoval rate was highest in the STF, nevertheless, the NO2
�-Nconcentration in the effluent of the STF was also the highest of
23786 | RSC Adv., 2020, 10, 23782–23791
three TFs. This indicates that nitrogen removal by AOB washigher than that by NOB.
The NO2�-N and NO3
�-N concentrations in the effluents ofthe three TFs are shown in Fig. 3E and F. All three TFs hada similar variation in the NO2
�-N concentration, which rstincreased and then decreased. When the effluent NO2-Nconcentration reduced, the effluent NO3
�-N concentrationincreased, which agrees with the general rule of bio-nitrication. The highest effluent NO2-N concentration in theWTF, GTF, and STF occurred on day 21 (282.8 mg L�1), day 31(268.6 mg L�1), and day 31 (222.4 mg L�1), respectively. Towardsthe end of the start-up period, the effluent NO3
�-N concentra-tion of the WTF, GTF, and STF was 52.6 mg L�1, 45.6 mg L�1,and 70.5 mg L�1, whereas the effluent NO2
�-N decreased to200.9 mg L�1, 200.5 mg L�1, and 155.6 mg L�1.
There were two main processes involved in the removal ofNH4
+-N: physiochemical and microbe catalysis. During thestart-up period, the abundance of microbes was lower witha relatively low activity; thus, absorption to the lter media wasthe main process of NH4
+-N removal. Although Buelna21
considered that NH4+-N stripping was a main removal process
at high pH, absorption may have been more important in thestart-up period of TFs in this study. Different trends wereevident when comparing the NH4
+-N removal in the WTF, GTF,and STF, which could have been caused by adsorption to thelter material. Due to the high adsorption to soil, the STF hada relatively high NH4
+-N removal during the rst 10 days.During period I, the average inuent NH4
+-N concentrationwas 192.9 mg L�1 with an average nitrogen loading ratio (NLR)of 32.79 g m�3 d�1. The NH4
+-N removal rate of the three TFsincreased gradually (Fig. 3C) and the effluent NO2
�-N concen-tration reduced sharply as the NO3
�-N concentration increased(Fig. 3E and F). All three reactors subsequently entered a stablestage from day 81 to day 151, during which, the NH4
+-N removalrate of the WTF, GTF, and STF was 84.50%, 69.80%, and84.86%, respectively. The average NO2-N concentration in theeffluents of the WTF, GTF, and STF during this period was2.1 mg L�1, 11.7 mg L�1, and 2.5 mg L�1, respectively, whereasthe NO3
�-N concentration was 90.6 mg L�1, 90.0 mg L�1, and88.4 mg L�1, respectively. The average NH4
+-N concentration inthe inuent increased to 500.2 mg L�1 during period II, whilethe NLR was 85.03 g m�3 d�1. The NH4
+-N removal rates of thethree TFs reduced sharply during period II before recovering infollowing 45 days. From day 206 to day 251, the amount of NH4
+-N removed by the WTF, GTF, and STF was maintained atapproximately 186.2 mg L�1, 295.6 mg L�1, and 195.7 mg L�1,respectively. The NO2
�-N concentration in the effluents of thethree TFs increased in early stage and then reduced. During thestable stage of period II, the average NO2-N concentration in theeffluents of the WTF, GTF, and STF was 14.1 mg L�1,21.1 mg L�1, and 31.0 mg L�1, respectively. The NO3
�-Nconcentration in the effluents of the WTF, GTF, and STF allincreased gradually before stabilizing aer day 206 at approxi-mately 241.4 mg L�1, 207.3 mg L�1, and 181.0 mg L�1.
When the inuent NH4+-N concentration was further
increased during period III, the average NLR was 136.35 g m�3
d�1, and the NH4+-N removal rate of the three TFs was further
This journal is © The Royal Society of Chemistry 2020

Fig. 4 Ions transfer in the reactions.
Paper RSC Advances
Ope
n A
cces
s A
rtic
le. P
ublis
hed
on 2
3 Ju
ne 2
020.
Dow
nloa
ded
on 1
/18/
2022
4:5
0:35
PM
. T
his
artic
le is
lice
nsed
und
er a
Cre
ativ
e C
omm
ons
Attr
ibut
ion
3.0
Unp
orte
d L
icen
ce.
View Article Online
lowered. When stabilized, the average NH4+-N removal rate of
the WTF, GTF, and STF was 50.13%, 48.44%, and 57.32%,respectively. Aer day 291, the NO2
�-N concentrations in theeffluents of the WTF, GTF, and STF were stable at approximately32.5 mg L�1, 58.8 mg L�1, and 116.1 mg L�1. The NO3
�-Nconcentration in the effluents of the GTF, STF, and WTF uc-tuated slightly around the average values of 169.3 mg L�1,116.8 mg L�1, and 182.2 mg L�1, respectively.
Fig. 5 Analysis of AOBs using PCR–DGGE.
This journal is © The Royal Society of Chemistry 2020
3.4 Total nitrogen removal and denitrication
The three TFs commenced with a TN volume loading of�84.43 g m�3 d�1. The TN concentrations of the inuents andeffluents in each TF are shown in Fig. 3G and H. During the rst15 days, the WTF and STF had a certain TN removal, whereasthe GTF did not. The TN removal of the STF and WTF should begiven by the adsorption of ammonia to each lter material. Aerday 21, the TN removal rate of the three TFs increased graduallyuntil day 46 when the TN removal rate of theWTF, GTF, and STFwas 12.23%, 9.05%, and 25.32%, respectively. As the inuentconcentration increased, the TN volume loading was33.67 g m�3 d�1, 85.64 g m�3 d�1, and 137.25 g m�3 d�1 duringperiods I, II, and III, respectively. Aer each change of theinuent, the TN removal rate of the three TFs synchronouslyrecovered and stabilized. During the stable stages of period I, II,and III, the average TN removal efficiency of the WTF was38.08%, 32.64%, and 26.05%, respectively, whereas that of theGTF was 19.23%, 22.06%, and 23.81%, respectively, and that ofthe STF was 39.36%, 41.85%, and 35.85%, respectively.
As shown in Fig. 4, simultaneous nitrication and denitri-cation occurred in the three reactors, accounting for thenitrogen removal. The Ca2+ and Na+ adsorbed to the surface ofthe soil was replaced by NH4
+, and the Ca2+ and Na+ precipitatedaer combining with OH�. The cations associated with OH�,HCO�, and CO3
2� anions form a dynamic balance of alternatingion changes. In the AOB process, oxygen is consumed for the
RSC Adv., 2020, 10, 23782–23791 | 23787

RSC Advances Paper
Ope
n A
cces
s A
rtic
le. P
ublis
hed
on 2
3 Ju
ne 2
020.
Dow
nloa
ded
on 1
/18/
2022
4:5
0:35
PM
. T
his
artic
le is
lice
nsed
und
er a
Cre
ativ
e C
omm
ons
Attr
ibut
ion
3.0
Unp
orte
d L
icen
ce.
View Article Online
oxidization of ammonia to nitrite. In addition, H+ ions aregenerated from this reaction (eqn (1)). The nitrite and nitratethat are produced are reduced to N2 during the denitricationprocess while H+ ions are consumed (eqn (2)):22
NH4+ + 1.24O2 + 0.16CO2 + 0.04HCO3
�
/ 0.04C5H7O2N + 0.96NO2�
+ 0.94H2O + 1.9H+ (1)
0.1561NO3� + 0.1167CH3OH + 0.1561H+
/ 0.0095C5H7O2N
+ 0.119CO2 + 0.3781H2O (2)
3.5 Analysis of AOB by PCR–DGGE
When all operations were complete, biomass samples were ob-tained from the lter material of each TF. By using the CTO189f/CTO654r primers, the AOB bacterial community was analyzed byPCR–DGGE. The gel is shown in Fig. 5. The 13 bands wereidentied and excised from the DGGE gel. Sequences of thebands were compared with the available sequences in GenBank,and the phylogenetic tree was constructed (Fig. 6).
Fig. 6 Neighbor-joining phylogenetic tree of sequences from the DGG
23788 | RSC Adv., 2020, 10, 23782–23791
The identied species belonged to Nitrosomonas (bandsA1, A2, A4, A8, and A11), Nitrosospira (A9 and A10), Rhoda-nobacter (A6 and A12), Streptococcus australis (A13), Clos-tridiales (A3), Actinomycete (A7), and an unidentied bacteria(A5). The AOB were divided into the b-subclass and g-subclass.23 There were two genera in the b-subclass: Nitro-somonas and Nitrosospira. The later included two subgenera:Nitrosolobus and Nitrosovibrio.24 In this study, all identiedAOB species belong to the b-subclass, although some iden-tied species were not AOBs, which was due to the specicityof the primers. The specicity of PCR is usually limited byonly one AOB specic primer. The CTO189f/CTO654rprimers held a higher specicity within the AOB specicprimer.25 Bacterium for bands A1, A2, A4, and A8 wereidentied (98%) as Nitrosomonas sp. Band A11 was identi-ed (99%) as Nitrosomonas eutropha, which has been re-ported to be a special AOB in aerobic environments and hasa capacity for autotrophic denitrication.26 Band A9 was99% similar to an uncultured Nitrosospira sp. Band A10 wasidentied (100%) as Nitrosospira multiformis. Nitrosospira isa common AOB genus that can compose nitrite reductaseand NO oxidoreductase. These enzymes can both catalyzenitrite to N2O.27–29
E profile.
This journal is © The Royal Society of Chemistry 2020
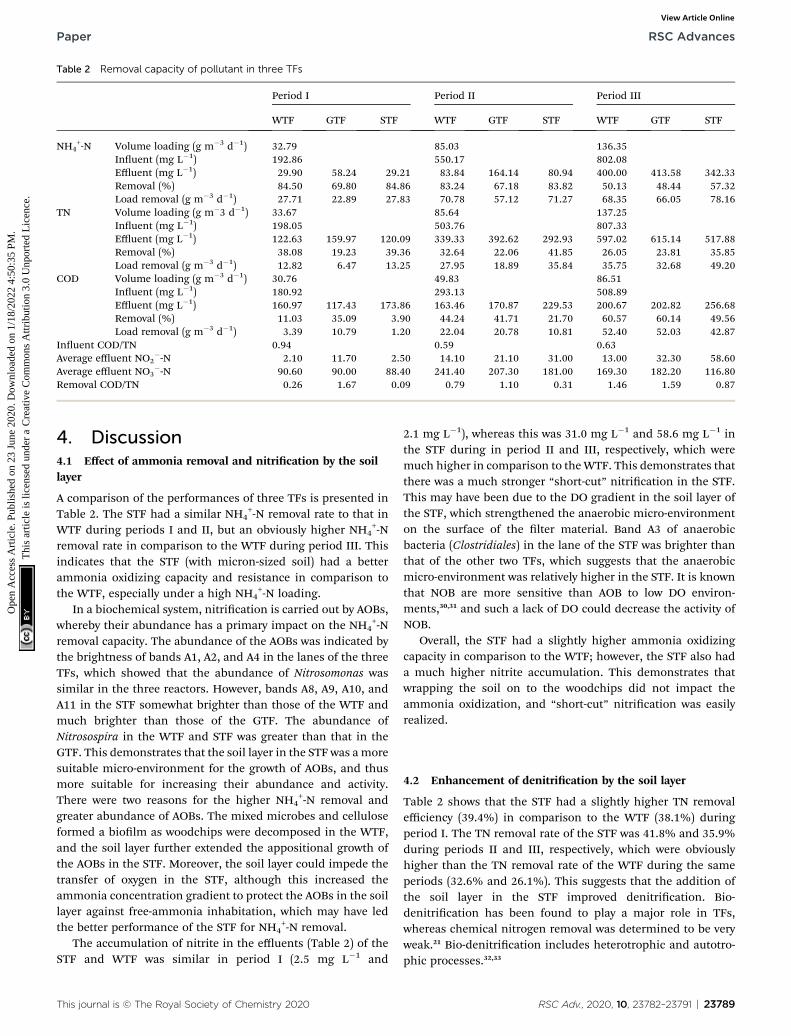
Table 2 Removal capacity of pollutant in three TFs
Period I Period II Period III
WTF GTF STF WTF GTF STF WTF GTF STF
NH4+-N Volume loading (g m�3 d�1) 32.79 85.03 136.35
Inuent (mg L�1) 192.86 550.17 802.08Effluent (mg L�1) 29.90 58.24 29.21 83.84 164.14 80.94 400.00 413.58 342.33Removal (%) 84.50 69.80 84.86 83.24 67.18 83.82 50.13 48.44 57.32Load removal (g m�3 d�1) 27.71 22.89 27.83 70.78 57.12 71.27 68.35 66.05 78.16
TN Volume loading (g m�3 d�1) 33.67 85.64 137.25Inuent (mg L�1) 198.05 503.76 807.33Effluent (mg L�1) 122.63 159.97 120.09 339.33 392.62 292.93 597.02 615.14 517.88Removal (%) 38.08 19.23 39.36 32.64 22.06 41.85 26.05 23.81 35.85Load removal (g m�3 d�1) 12.82 6.47 13.25 27.95 18.89 35.84 35.75 32.68 49.20
COD Volume loading (g m�3 d�1) 30.76 49.83 86.51Inuent (mg L�1) 180.92 293.13 508.89Effluent (mg L�1) 160.97 117.43 173.86 163.46 170.87 229.53 200.67 202.82 256.68Removal (%) 11.03 35.09 3.90 44.24 41.71 21.70 60.57 60.14 49.56Load removal (g m�3 d�1) 3.39 10.79 1.20 22.04 20.78 10.81 52.40 52.03 42.87
Inuent COD/TN 0.94 0.59 0.63Average effluent NO2
�-N 2.10 11.70 2.50 14.10 21.10 31.00 13.00 32.30 58.60Average effluent NO3
�-N 90.60 90.00 88.40 241.40 207.30 181.00 169.30 182.20 116.80Removal COD/TN 0.26 1.67 0.09 0.79 1.10 0.31 1.46 1.59 0.87
Paper RSC Advances
Ope
n A
cces
s A
rtic
le. P
ublis
hed
on 2
3 Ju
ne 2
020.
Dow
nloa
ded
on 1
/18/
2022
4:5
0:35
PM
. T
his
artic
le is
lice
nsed
und
er a
Cre
ativ
e C
omm
ons
Attr
ibut
ion
3.0
Unp
orte
d L
icen
ce.
View Article Online
4. Discussion4.1 Effect of ammonia removal and nitrication by the soillayer
A comparison of the performances of three TFs is presented inTable 2. The STF had a similar NH4
+-N removal rate to that inWTF during periods I and II, but an obviously higher NH4
+-Nremoval rate in comparison to the WTF during period III. Thisindicates that the STF (with micron-sized soil) had a betterammonia oxidizing capacity and resistance in comparison tothe WTF, especially under a high NH4
+-N loading.In a biochemical system, nitrication is carried out by AOBs,
whereby their abundance has a primary impact on the NH4+-N
removal capacity. The abundance of the AOBs was indicated bythe brightness of bands A1, A2, and A4 in the lanes of the threeTFs, which showed that the abundance of Nitrosomonas wassimilar in the three reactors. However, bands A8, A9, A10, andA11 in the STF somewhat brighter than those of the WTF andmuch brighter than those of the GTF. The abundance ofNitrosospira in the WTF and STF was greater than that in theGTF. This demonstrates that the soil layer in the STF was amoresuitable micro-environment for the growth of AOBs, and thusmore suitable for increasing their abundance and activity.There were two reasons for the higher NH4
+-N removal andgreater abundance of AOBs. The mixed microbes and celluloseformed a biolm as woodchips were decomposed in the WTF,and the soil layer further extended the appositional growth ofthe AOBs in the STF. Moreover, the soil layer could impede thetransfer of oxygen in the STF, although this increased theammonia concentration gradient to protect the AOBs in the soillayer against free-ammonia inhabitation, which may have ledthe better performance of the STF for NH4
+-N removal.The accumulation of nitrite in the effluents (Table 2) of the
STF and WTF was similar in period I (2.5 mg L�1 and
This journal is © The Royal Society of Chemistry 2020
2.1 mg L�1), whereas this was 31.0 mg L�1 and 58.6 mg L�1 inthe STF during in period II and III, respectively, which weremuch higher in comparison to theWTF. This demonstrates thatthere was a much stronger “short-cut” nitrication in the STF.This may have been due to the DO gradient in the soil layer ofthe STF, which strengthened the anaerobic micro-environmenton the surface of the lter material. Band A3 of anaerobicbacteria (Clostridiales) in the lane of the STF was brighter thanthat of the other two TFs, which suggests that the anaerobicmicro-environment was relatively higher in the STF. It is knownthat NOB are more sensitive than AOB to low DO environ-ments,30,31 and such a lack of DO could decrease the activity ofNOB.
Overall, the STF had a slightly higher ammonia oxidizingcapacity in comparison to the WTF; however, the STF also hada much higher nitrite accumulation. This demonstrates thatwrapping the soil on to the woodchips did not impact theammonia oxidization, and “short-cut” nitrication was easilyrealized.
4.2 Enhancement of denitrication by the soil layer
Table 2 shows that the STF had a slightly higher TN removalefficiency (39.4%) in comparison to the WTF (38.1%) duringperiod I. The TN removal rate of the STF was 41.8% and 35.9%during periods II and III, respectively, which were obviouslyhigher than the TN removal rate of the WTF during the sameperiods (32.6% and 26.1%). This suggests that the addition ofthe soil layer in the STF improved denitrication. Bio-denitrication has been found to play a major role in TFs,whereas chemical nitrogen removal was determined to be veryweak.21 Bio-denitrication includes heterotrophic and autotro-phic processes.32,33
RSC Adv., 2020, 10, 23782–23791 | 23789

RSC Advances Paper
Ope
n A
cces
s A
rtic
le. P
ublis
hed
on 2
3 Ju
ne 2
020.
Dow
nloa
ded
on 1
/18/
2022
4:5
0:35
PM
. T
his
artic
le is
lice
nsed
und
er a
Cre
ativ
e C
omm
ons
Attr
ibut
ion
3.0
Unp
orte
d L
icen
ce.
View Article Online
In terms of heterotrophic denitrication, the STF had betteranaerobic conditions because the woodchips were wrapped bythe soil layer. This could have advanced the decomposition ofthe woodchips, thus increasing the carbon resources forheterotrophic denitrication, which is supported by the highCOD in the effluent of the STF. Moreover, the high accumula-tion of nitrite in the STF indicates that there should have beena strong “short-cut” nitrication, in which nitrite could directlyconverted to N2 and the carbon resources used for nitratedenitrication could be decreased. This was, therefore, verybenecial for the swine-wastewater digested liquid with a lowCOD/TN ratio.
Some autotrophic nitrogen removal processes have beenobserved in wastewater treatment, for example, ANAMMOX.This requires the coexistence of nitrite accumulation and ananaerobic environment in a nitrication reactor.6,34–36 The STFin this study satised this requirement; hence, ANAMMOX mayhave occurred to a certain extent. Besides, some autotrophicnitrogen removal has been ascertained, for example, earlierresearch found that some AOBs could oxidize NH4
+-N to N2O ina low DO environment.26
5. Conclusion
Overall, the addition of a layer of micro-size soil in a TF couldincrease the ammonia oxidization, nitrite accumulation, anddenitrication capacities. By calculating the NH4
+-N and TNremoval loads, the NH4
+-N removal rate of the STF duringperiods I, II, and III was 21.4%, 24.9%, and 18.3% higher,respectively, than that of the GTF. In addition, the TN removalrate of the STF during periods I, II, and III was 104.6%, 89.4%,and 37.5% higher, respectively, than that of the WTF. Theabundance of identied AOBs genera, belong to the b-subclassof Nitrosomonas and Nitrosospira, were enhanced by wrappinga soil layer around the woodchips in the STF. Moreover, the soillayer in the STF provided a better anaerobic micro-environmentin comparison to the other TFs, which further strengthened thedenitrication process.
Conflicts of interest
There are no conicts to declare.
Acknowledgements
The authors gratefully acknowledge China Postdoctoral ScienceFoundation (2016M601290), China Natural Science Foundationof Shanxi Province (No. 398201801D221343) and the NationalNatural Science Foundation of China (Grant No. 51178136) forvaluable nancial support.
References
1 C. J. G. d. S. Lima, L. d. S. Pereira, T. O. D. S. Santos,S. N. Pinto, A. C. Rodrigues and L. A. P. L. Nunes, RevistaCaatinga, 2019, 32(1), 167–178.
23790 | RSC Adv., 2020, 10, 23782–23791
2 J. Meng, J. L. Li, J. Z. Li, K. W. Deng, J. Nan and P. P. Xu,Bioresour. Technol., 2017, 243, 922–931.
3 J. Meng, J. L. Li, J. Z. Li, K. Sun, P. Antwi, K. W. Deng, C. Wangand G. Buelna, Bioresour. Technol., 2016, 201, 166–173.
4 J. Meng, J. L. Li, J. Z. Li, C. Wang, K. W. Deng and K. Sun,Bioresour. Technol., 2016, 216, 19–27.
5 N. Akdeniz, K. A. Janni and I. A. Salnikov, Bioresour. Technol.,2011, 102(8), 4974–4980.
6 M. Ali, L. Y. Chai, C. J. Tang, P. Zheng, X. B. Min, Z. H. Yang,L. Xiong and Y. X. Song, BioMed Res. Int., 2013, 134914.
7 B. W. Zhao, J. Z. Li and S. Y. Leu, Bioresour. Technol., 2014,173, 384–391.
8 Y. F. Han, L. Y. Yang, X. M. Chen, Y. Cai, X. Y. Zhang,M. C. Qian, X. K. Chen, H. H. Zhao, M. Sheng, G. M. Caoand G. X. Shen, Sci. Total Environ., 2020, 709, 136094.
9 S. N. Wang, R. F. Yuan, C. C. Liu, Q. S. Wang and B. H. Zhou,Fresenius Environ. Bull., 2019, 28(10), 7259–7266.
10 X. C. Wang, Z. L. Chen, J. Kang, X. Zhao and J. M. Shen, RSCAdv., 2018, 8(33), 18284–18293.
11 A. Daverey, N. T. Hung, K. Dutta and J. G. Lin, Bioresour.Technol., 2013, 141, 191–198.
12 M. Figueroa, J. R. Vazquez-Padin, A. Mosquera-Corral,J. L. Campos and R. Mendez, Biochem. Eng. J., 2012, 65,23–29.
13 J. Meng, J. L. Li, J. Z. Li, P. Antwi, K. W. Deng, C. Wang andG. Buelna, Bioresour. Technol., 2015, 198, 884–890.
14 S. P. Wilson, S. K. Ouki, D. P. Saroj, P. A. Pearce, L. Bancroand E. Germain, Water Environ. Res., 2015, 87(1), 80–87.
15 H. C. Flemming and J. Wingender, Nat. Rev. Microbiol., 2010,8(9), 623–633.
16 I. Naz, D. P. Saroj, S. Mumtaz, N. Ali and S. Ahmed, Environ.Technol., 2015, 36(1–4), 424–434.
17 J. Guo, Y. Zhou, Y. Yang, C. Chen and J. Xu, Int. J. Environ.Res. Public Health, 2018, 15, 2688.
18 Z. Lei, T. Wu, Y. Zhang, X. Liu, C. Wan, D. J. Lee and J. H. Tay,Bioresour. Technol., 2013, 128, 774–778.
19 O. O. Aluko and M. K. Sridhar, Waste Manage. Res., 2013,31(7), 700–705.
20 P. P. Pontes and C. A. Chernicharo, Environ. Technol., 2011,32(3–4), 281–287.
21 G. Buelna, R. Dube and N. Turgeon, Desalination, 2008,231(1–3), 297–304.
22 Y. Zou, X. Xu, X. Wang, F. Yang and S. Zhang, Bioresour.Technol., 2018, 268, 539–548.
23 I. M. Head, W. D. Hiorns, T. M. Embley, A. J. McCarthy andJ. R. Saunders, J. Gen. Microbiol., 1993, 139, 1147–1153.
24 U. Purkhold, M. Wagner, G. Timmermann,A. Pommerening-Roser and H. P. Koops, Int. J. Syst. Evol.Microbiol., 2013, 53(Pt 5), 1485–1494.
25 Y. C. Wu, J. J. Wang and Q. L. Wu, Huanjing Kexue, 2010,31(9), 2178–2183.
26 M. Poth and D. D. Focht, Appl. Environ. Microbiol., 1985,49(5), 1134–1141.
27 A. Bollmann, I. Schmidt, A. M. Saunders andM. H. Nicolaisen, Appl. Environ. Microbiol., 2005, 71(3),1276–1282.
This journal is © The Royal Society of Chemistry 2020

Paper RSC Advances
Ope
n A
cces
s A
rtic
le. P
ublis
hed
on 2
3 Ju
ne 2
020.
Dow
nloa
ded
on 1
/18/
2022
4:5
0:35
PM
. T
his
artic
le is
lice
nsed
und
er a
Cre
ativ
e C
omm
ons
Attr
ibut
ion
3.0
Unp
orte
d L
icen
ce.
View Article Online
28 J. M. Norton, M. G. Klotz, L. Y. Stein, D. J. Arp,P. J. Bottomley, P. S. Chain, L. J. Hauser, M. L. Land,F. W. Larimer, M. W. Shin and S. R. Starkenburg, Appl.Environ. Microbiol., 2008, 74(11), 3559–3572.
29 L. J. Shaw, G. W. Nicol, Z. Smith, J. Fear, J. I. Prosser andE. M. Baggs, Environ. Microbiol., 2006, 8(2), 214–222.
30 X. Ma, B. Zhao, X. Zhang, F. Xie, Y. Cui, H. Li and X. Yue,Chemosphere, 2020, 241, 124934.
31 S. Yang and F. L. Yang, J. Hazard. Mater., 2011, 195, 318–323.32 F. Jaramillo, M. Orchard, C. Munoz, M. Zamorano and
C. Antileo, J. Environ. Manage., 2018, 218, 154–164.
This journal is © The Royal Society of Chemistry 2020
33 M. M. M. Kuypers, H. K. Marchant and B. Kartal, Nat. Rev.Microbiol., 2018, 16(5), 263–276.
34 X. Li, S. Klaus, C. Bott and Z. He, Water Environ. Res., 2018,90(7), 634–649.
35 U. Manonmani and K. Joseph, J. Chem. Technol. Biotechnol.,2018, 93(9), 2486–2497.
36 L. Xiong, Y. Y. Wang, C. J. Tang, L. Y. Chai, K. Q. Xu,Y. X. Song, M. Ali and P. Zheng, BioMed Res. Int., 2013,396487.
RSC Adv., 2020, 10, 23782–23791 | 23791