Embed Size (px)
Citation preview

Enhancing silicon solar cells withsinglet fission: the case for Försterresonant energy transfer using aquantum dot intermediate
Stefan Wil TabernigBenjamin DaiberTianyi WangBruno Ehrler
Stefan Wil Tabernig, Benjamin Daiber, Tianyi Wang, Bruno Ehrler, “Enhancing silicon solar cells withsinglet fission: the case for Förster resonant energy transfer using a quantum dot intermediate,” J.Photon. Energy 8(2), 022008 (2018), doi: 10.1117/1.JPE.8.022008.
Downloaded From: https://www.spiedigitallibrary.org/journals/Journal-of-Photonics-for-Energy on 27 Nov 2021Terms of Use: https://www.spiedigitallibrary.org/terms-of-use
Enhancing silicon solar cells with singlet fission:the case for Förster resonant energy transfer using
a quantum dot intermediate
Stefan Wil Tabernig,† Benjamin Daiber,† Tianyi Wang, andBruno Ehrler*
Center for Nanophotonics, AMOLF, Amsterdam, The Netherlands
Abstract. One way for solar cell efficiencies to overcome the Shockley–Queisser limit is down-conversion of high-energy photons using singlet fission (SF) in polyacenes like tetracene (Tc).SF enables generation of multiple excitons from the high-energy photons, which can be har-vested in combination with Si. In this work, we investigate the use of lead sulfide quantumdots (PbS QDs) with a band gap close to Si as an interlayer that allows Förster resonant energytransfer (FRET) from Tc to Si, a process that would be spin-forbidden without the intermediateQD step. We investigate how the conventional FRET model, most commonly applied to thedescription of molecular interactions, can be modified to describe the geometry of QDs betweenTc and Si and how the distance between QD and Si, and the QD bandgap affects the FRETefficiency. By extending the acceptor dipole in the FRET model to a 2-D plane, and to thebulk, we see a relaxation of the distance dependence of transfer. Our results indicate thatFRET efficiencies from PbS QDs to Si well above 50% are possible at very short but possiblyrealistic distances of around 1 nm, even for QDs with relatively low photoluminescence quantumyield. © The Authors. Published by SPIE under a Creative Commons Attribution 4.0 Unported License.Distribution or reproduction of this work in whole or in part requires full attribution of the original pub-lication, including its DOI. [DOI: 10.1117/1.JPE.8.022008]
Keywords: energy transfer; quantum dots; silicon; Förster resonant energy transfer; singlet fis-sion; solar cells.
Paper 17117SS received Nov. 7, 2017; accepted for publication Apr. 13, 2018; published onlineMay 10, 2018; corrected Aug. 10, 2019.
1 Introduction
The domination of the solar cell market by silicon led to the search of add-ons that could increaseefficiency while also maintaining low cost. One possible way to increase efficiency is by down-converting high-energy light using an organic material that exhibits singlet fission (SF).
In a single-junction solar cell, photons with energy above the bandgap can excite an electroninto the conduction band. Excess energy is lost, as the charge carriers quickly thermalize to theband edge. Downconversion schemes minimize the energy lost by thermalization, by convertinghigh-energy photons to lower-energy charge carriers. Downconversion via SF can improve onthe single-junction Shockley–Queisser1,2 efficiency limit, raising it from 33.7% to 44.4%.3
SF in organic semiconductors describes the conversion of a singlet exciton into two tripletexcitons, conserving spin. In tetracene (Tc), SF is faster (90 ps)4 than other decay channels,which leads to a yield of almost two triplet excitons per absorbed photon. The resulting tripletexcitons cannot relax radiatively to the singlet ground state, as this process is spin-forbidden,leading to a long triplet lifetime. In Tc, the energy of the triplet excitons (1.25 eV)5 is close tothe bandgap of silicon (1.12 eV), allowing in principle for the triplet excitons to be injected intosilicon (Si). In one possible realization, the triplet exciton energy is first transferred into a lead
*Address all correspondence to: Bruno Ehrler, E-mail: [email protected]†Both authors are contributed equally.
Journal of Photonics for Energy 022008-1 Apr–Jun 2018 • Vol. 8(2)
Downloaded From: https://www.spiedigitallibrary.org/journals/Journal-of-Photonics-for-Energy on 27 Nov 2021Terms of Use: https://www.spiedigitallibrary.org/terms-of-use

sulphide (PbS) quantum dot (QD)6 interlayer and subsequently transferred into Si7,8 (see Fig. 1).Once the triplet exciton is in the QD, the presence of lead with strong spin-orbit coupling leads tointersystem crossing of singlet and triplet states. The spin triplet and singlet excitons are energydegenerate (≈3 meV),9 which makes the spin mixing efficient. Hence, the exciton can decayradiatively, in principle allowing for energy transfer into Si via photon emission, or Förster res-onant energy transfer (FRET). Transfer into lead sulfide6 and lead selenide10 QDs was recentlydemonstrated with high efficiency (>90%).6 While energy transfer from core/shell CdSe/ZnSQDs into c-Si7 as well as inter-QD FRET for cases, where energy was transferred among thesame QD species11–13 and between two different QD species,12,14 has been demonstrated, energytransfer from PbS QDs into Si with a QD bandgap close to the one of c-Si remains to be shown.
One of the processes competing with FRET is the emission of photons by the QDs and thereabsorption in Si. For that process to be efficient, careful light management to funnel photonsinto silicon is required. In addition, the low external quantum efficiency of the Si cell nearthe indirect band edge might somewhat limit the achievable efficiency. Direct energy transferin the form of FRET would be an elegant solution to allow for higher efficiency, as FRET canoutcompete radiative energy transfer at distances smaller than the system-specific Förster dis-tance R0, which is around 8 nm in the case of FRET between PbS QDs.13,15 Once the excitonresides in Si it will contribute to charge generation, as the extraction efficiency of state-of-the-artSi solar cells is close to unity. Thus, the SF-FRET geometry could lead to additional current inSi solar cells, if short distances between the donor and acceptor can be achieved.
Apart from radiative energy transfer or FRET, other transfer mechanisms are also possible inthe Tc-QD-Si geometry. The triplets from Tc could be transferred directly into silicon, bypassingthe QDs. This would happen via the Dexter energy transfer mechanism,8,16 which proceeds viacorrelated two-electron transfer. In this case, the excited electron of the triplet exciton would betransferred into the excited state in Si, while a ground-state electron from Si transfers into the TcHOMO. Dexter energy transfer could also act as a transfer channel from the PbS QDs into Si.However, the Dexter transfer efficiency falls exponentially with distance from donor to acceptordue to the required wave function overlap. Thus, Dexter energy transfer is only relevant for shortdistances <1 nm. The QD ligands already contribute to a ∼1-nm separation between donor andacceptor. Hence, the overall contribution of Dexter energy transfer will presumably be negligiblecompared to FRET, which has a weaker distance dependency.
Sequential charge transfer from Tc or the PbS QDs to Si is another possible pathway forexciton dissociation, meaning that the electron would be transferred into Si and a hole wouldtransfer from Si into Tc (or vice versa). This mechanism would require sandwiching the activelayer between electrodes and is hence undesirable compared to the FRETor Dexter mechanisms.
Here, we establish the theoretical requirements for FRET between PbS QDs and Si, consid-ering the QD bandgap, the distance between Si and QDs, and the geometry of the interface. Wefind that FRET can be efficient when the QDs are within 3.5 nm to the surface of Si, even forQDs with a bandgap close to the Si bandgap. This is a much shorter distance compared tointer-QD FRET or organic molecules, mostly because the molar absorption coefficient ofSi is very low near the band edge. We further find that the distance dependence is somewhatrelaxed when considering the Si surface as a plane or bulk acceptor. Finally, we lay out the path
Fig. 1 (a) Illustration of the SF-FRET geometry. A Tc-layer lies on top of the PbS-QD (+ligands)monolayer, which is on top of c-Si. The two yellow circles indicate the two energy transfer steps,namely Tc→QD (1) and QD→Si (2). (b) The Jablonski diagram, with the FRET process betweenQDs and Si highlighted in red. S1 and T1 correspond to the first excited singlet and triplet state inTc, respectively. The excited states of the QD and Si are indicated by QD� and Si�.
Tabernig et al.: Enhancing silicon solar cells with singlet fission: the case for Förster resonant. . .
Journal of Photonics for Energy 022008-2 Apr–Jun 2018 • Vol. 8(2)
Downloaded From: https://www.spiedigitallibrary.org/journals/Journal-of-Photonics-for-Energy on 27 Nov 2021Terms of Use: https://www.spiedigitallibrary.org/terms-of-use

to prepare the Si surface to allow for efficient FRET from Tc into Si. Once efficient transfer ofenergy between QDs and Si can be achieved experimentally, SF could provide a direct pathtoward more efficient Si solar cells with minimal need for changes of the Si cell geometry.
2 Förster Resonant Energy Transfer
The FRET efficiency of excitons from QDs into Si, ηFRET, is defined in Eq. (1). The main goal ofthis work is to determine how ηFRET depends on donor–acceptor distance on the bandgap of theQDs and on the geometry of the system. The FRET efficiency ηFRET compares the FRET ratekFRET to all the competing rates, defined as the exciton decay rate of the QD donor in absence ofthe silicon acceptor kD;0:
17
EQ-TARGET;temp:intralink-;e001;116;597ηFRET ¼ kFRETkD;0 þ kFRET
; (1)
where kD;0 ¼ 1∕τD;0 and τD;0 represents the donor exciton lifetime in absence of an acceptor.FRET is a distance-dependent energy transfer mechanism between two molecules, which are
approximated to be point dipoles. Förster derived an expression for the FRET rate,18 whichdepends on the emission spectrum of the donor, absorption spectrum of the acceptor, donorlifetime, and donor acceptor distance. The classical as well as quantum mechanical approachboth lead to Eq. (2):17,18
EQ-TARGET;temp:intralink-;e002;116;480kFRETðRDAÞ ¼1
τD;0
�R0
RDA
�6
; (2)
where RDA represents the distance between donor and acceptor and R0 is the Förster distance.R0 determines how strongly the FRET rate depends on the distance and is given by Eq. (3):17
EQ-TARGET;temp:intralink-;e003;116;411R60 ¼
9000 lnð10Þ128π5NA
�QDκ2J
n4: (3)
In Eq. (3), the prefactor summarizes several numerical constants and Avogadro’s number NA.QD is the donor photoluminescence quantum yield (PLQY), κ2 is a parameter that depends onthe relative orientation between donor and acceptor dipole, and n represents the refractive indexof the medium separating donor and acceptor. The parameter J is commonly referred to as spec-tral overlap integral as it represents the spectral matching of the donor emission and acceptorabsorption spectra and is calculated as follows in Eq. (4):17
EQ-TARGET;temp:intralink-;e004;116;293J ¼Z∞
0
fDðλÞαM;AðλÞλ4dλ: (4)
The overlap integral contains the normalized emission spectrum of the donor fDðλÞ and themolar absorption coefficient of the acceptor αM;AðλÞ, integrated over the wavelength λ [gray areain Fig. 2(a)]. We can use the far-field absorption coefficient of silicon for the near-field (Förster)coupling, because FRET has been measured to also be phonon assisted.7
Figure 2(a) depicts αM;Si and fQD as a function of energy. The FWHM assumed for the QDPL is 200 meV, in agreement with literature.20–22 The refractive index of the separating mediumdepends on how one accounts for the contributions of the dielectric functions of the QD itself, thesurrounding ligand, and the spacer material. Following Yeltik et al.,7 we consider the average ofrefractive indices in a straight line from QD to the silicon surface. We approximate the refractiveindex as constant for different spacer thicknesses. As such, nSiO2
¼ 1.45 is used, which is theindex of the SiO2 spacer layer in between the QDs and the Si bulk. In fact, the QDs and theligands will also influence the overall refractive index, as the light will be influenced by aneffective medium given that the wavelength of emission is much larger than the distancesinvolved in our system. The refractive index of the QDs is well above 1.45, and the refractive
Tabernig et al.: Enhancing silicon solar cells with singlet fission: the case for Förster resonant. . .
Journal of Photonics for Energy 022008-3 Apr–Jun 2018 • Vol. 8(2)
Downloaded From: https://www.spiedigitallibrary.org/journals/Journal-of-Photonics-for-Energy on 27 Nov 2021Terms of Use: https://www.spiedigitallibrary.org/terms-of-use

index of the organic ligands is between 1.45 for oleic acid (OA)23 and 1.5 (3-mercatopropyonicacid)24 for most organic ligands. Inorganic ligands like ZnI2 are very short so we can neglect theirinfluence on the electromagnetic field. However, since the ligands do not fill the entire volume,21
we deem the approximation of n ¼ 1.45 valid for distances larger than 1 nm. The orientationparameter κ2 depends on the relative transition dipole orientation of donor and acceptor.17 Sincethe QDs have rotational symmetry, the dipole orientation in the QDs will be isotropic, whichyields κ2iso ¼ 2
3.17 The quantum yield of PbS-QDs depends on various factors, including size,25
excitation wavelength,26 QD concentration,26 ligands,27 and whether they are in solution or insolid state. The choice of QD size is important because the corresponding bandgap has to belower than the Tc triplet exciton energy and higher than the Si bandgap, to ensure that bothtransfer processes are downhill in energy. We choose QDs with emission centered at 1.2 eV,which corresponds to an average size of 3.4 nm.25 The PLQY for these QDs ranges from20% to 55%26 in solution and up to 15% in films.28 We determined the radiative lifetime ofour 1.2 eV PbS QDs (see experimental methods for details on QD synthesis and PL lifetimemeasurement) in octane as τPbS ¼ 2.4 μs [inset Fig. 2(b)], which is in good agreement withliterature.13,20,25 For a more accurate description of the FRET rate, the measured lifetime ofthe QDs in solution should be replaced by the QD lifetime measured after deposition on quartz,to obtain the reference value for “infinite” donor–acceptor separation τD;0. We exclude the effectsof parasitic absorption in the QD layer because we assume a submonolayer QD coverage. To bespecific, the ideal QD coverage to maximize transfer and minimize QD-absorption would be asubmonolayer coverage, where the inter-QD spacing is far bigger than the inter-QD Försterradius of 8 nm.13,15 Making this assumption allows us to neglect any significant contributionsof inter-QD FRET. Inter-QD FRET should be regarded as an undesirable decay channel becausescreening more QDs increases the chance to find a surface trap state, and there will be a tendencyto transfer toward lower energy QDs. The upper limit for the QD spacing is determined by the Tctriplet diffusion length. In the final geometry, the QD coverage has to be dense enough to allowall Tc triplets to diffuse toward a QD, meaning that the ideal QD separation corresponds to thetriplet diffusion length of around 400 nm.29,30 Such a QD coverage absorbs less than 0.01% ofthe solar spectrum, and thus, we can neglect absorption of the incident light by QDs (seeAppendix for details on this estimate).
In the following, we calculate R0, which is the distance for that the transfer efficiency reaches50% in the dipole–dipole model. While this is not exactly the case for the plane and bulk geom-etries we will introduce later, R0 is still a useful quantity to estimate separation distances. As canbe seen in the upper plot of Fig. 3, the values for R0 vary from 0.9 nm to up to 1.5 nm, dependingon the QY and bandgap of the QDs. The steep loss of transfer efficiency below the bandgap ofsilicon (around 1.12 eV) can be attributed to the exponential decrease in the absorption coef-ficient. The largest QD bandgap for which energy transfer from triplet excitons in Tc was
Fig. 2 (a) αM;Si and PL of 1.2 eV PbS QDs as a function of photon energy. The gray shaded areaindicates the spectral overlap between the QD donor and the Si acceptor (J). αM;Si was taken fromGreen and Keevers19 and the PL spectrum was modeled as a Gaussian centered at 1.2 eV witha FWHM of 200 meV, which corresponds to a broadening of σ ¼ 84 meV. The PL is scaled bya factor of 25 for visibility. (b) Molar absorption coefficient of silicon αM;Si as a function of photonenergy. The inset shows the measured transient PL lifetime for 1.2 eV PbS QDs in solution.
Tabernig et al.: Enhancing silicon solar cells with singlet fission: the case for Förster resonant. . .
Journal of Photonics for Energy 022008-4 Apr–Jun 2018 • Vol. 8(2)
Downloaded From: https://www.spiedigitallibrary.org/journals/Journal-of-Photonics-for-Energy on 27 Nov 2021Terms of Use: https://www.spiedigitallibrary.org/terms-of-use

observed is 1.23 eV,6 and we indicate the QD bandgap range by the gray area in Fig. 3. Thebottom panel of the same figure shows the FRET efficiency, which obeys a relatively steep slopearound 1.2 eV, compared to higher bandgaps, suggesting the importance of a careful choice ofthe QD bandgap. The bottom plot of Fig. 3 shows FRET efficiencies for 1- and 2-nm separationdistances, with varying QY. Changes in distance by only 1 nm around R0 lead to an efficiencyincrease of up to 75%. The efficiencies at 1-nm separation saturate for bandgaps slightlyhigher than required in the given geometry at values close to 100%. It is worth noting thathigh FRET efficiencies (>65%) can be achieved at realistic distances (1 nm) even for a lowQY (20%).
3 Influence of Geometry
Up until now, we have calculated the FRET efficiencies according to a dipole–dipole model thatdoes not take into account the extended nature of the silicon acceptor geometry. We introducetwo potentially more accurate descriptions of the FRET rate in our system, in the followingreferred to as “dipole—infinite plane model” and “dipole—bulk model,” similar to earlierapproaches.11,31 Our final geometry will probably be best represented by the bulk model,and in the following, we show how it differs from the more conventionally used dipole–dipoledescription laid out above.
The silicon acceptor occupies one half-space instead of being a point-dipole, leading toa modification of Eq. (2).32,33 For the dipole-infinite plane model, the zero-dimensional dipoleacceptor is substituted with a 2-D acceptor extended over the x-y plane, assuming that theacceptor dipole of FRET mainly resides on the surface of Si [see Eq. (5)]:
EQ-TARGET;temp:intralink-;e005;116;143
kFRET ¼ σSiR60
τD;0
ZZ∞;2π
0;0
rðRDAðrDA; rÞÞ6
dr dϕ
¼ σSiR60
τD;0
ZZ∞;2π
0;0
r� ffiffiffiffiffiffiffiffiffiffiffiffiffiffiffiffiffiffir2DA þ r2
p �6dr dϕ ¼ σSi
R60
τD;0� π
2r4DA; (5)
Fig. 3 The upper graph shows the QD bandgap dependence of the Förster distance R0 for differ-ent quantum yields. In the bottom figure, the FRET efficiency as function of QD bandgap isdepicted. Dashed lines represent a donor–acceptor distance of 1 nm, solid lines correspond to2-nm separation. The colors correspond to the same QYs as in the upper figure. The gray shadedregion in both plots indicates the bandgap range from 1.12 to 1.23 eV, which is the range relevantfor the transfer from Tc into Si.
Tabernig et al.: Enhancing silicon solar cells with singlet fission: the case for Förster resonant. . .
Journal of Photonics for Energy 022008-5 Apr–Jun 2018 • Vol. 8(2)
Downloaded From: https://www.spiedigitallibrary.org/journals/Journal-of-Photonics-for-Energy on 27 Nov 2021Terms of Use: https://www.spiedigitallibrary.org/terms-of-use

where RDAðrDA; rÞ is the distance from the donor dipole to an infinitesimal acceptor dipole, andσSi is the density of silicon atoms on a <111> silicon surface (σSi ¼ 7.8∕nm2). After integrationover the Si surface (r is the radial component in polar/cylindrical coordinates), the rate onlydepends on the distance component perpendicular to the surface, thus on rDA. The parameter-izations used are illustrated in Fig. 5(b).
While this model is closer to the physical reality, it only considers the Si surface. In order toinclude the Si bulk, we can simply integrate Eq. (5) over the half space occupied by Si, whichleads to Eq. (6):
EQ-TARGET;temp:intralink-;e006;116;350kFRET ¼ ρSiπR6
0
2τD;0
Z−∞
0
1
ðz 0ðz; rDAÞÞ4dz ¼ ρSi
πR60
2τD;0
Z−∞
0
1�z�nSin
�þ rDA�4dz
¼ ρSiπR6
0
6τD;0
�nnSi
�1
r3DA: (6)
For the integration, z 0ðz; rDAÞ is split into the integration variable for the half space z andthe distance from the donor to the surface of the bulk acceptor rDA, and ρSi is the density ofsilicon atoms (ρSi ¼ 50∕nm3). The additional prefactor n
nSiarises because we have to consider the
refractive index of the part of bulk silicon between the infinitesimal acceptor and the QD donoras part of the separating medium. We use a refractive index of 3.55 for silicon nSi, correspondingto the relevant energy region (1.2 eV).19 For a derivation, see Appendix. We note that the pre-factor is independent of distance between donor and acceptor. Mathematically, this is due to the
choice of integration limits and leads to an effective Förster distance R0;eff ¼ ðnSiO2nSiÞ16R0.
Figure 4 shows the FRET efficiencies for both models introduced above. From comparisonwith the bottom panel of Fig. 3, it becomes obvious that for 2-nm separation, the FRET effi-ciencies are improved considerably up to around 85% for the dipole—infinite plane model in therelevant region compared to 15% for the dipole—dipole model, whereas the values for 1 nmdo not change significantly. This occurs due to the different distance dependencies in differentmodels and acceptor dipole densities (ρSi and σSi) in different models, as shown in Fig. 5.Figure 5 shows that the point model shows the steepest distance dependency, which is relaxedin the planar geometry, and the efficiency drop with distance in the bulk model is the most
Fig. 4 FRET efficiencies for the “dipole-infinite plane model” (top) and the “dipole-bulk model”(bottom). Dashed and continuous lines represent 1- and 2-nm separation, respectively. The grayshaded region indicates the bandgap range of interest. The colors correspond to the same QYvalues as in Fig. 3.
Tabernig et al.: Enhancing silicon solar cells with singlet fission: the case for Förster resonant. . .
Journal of Photonics for Energy 022008-6 Apr–Jun 2018 • Vol. 8(2)
Downloaded From: https://www.spiedigitallibrary.org/journals/Journal-of-Photonics-for-Energy on 27 Nov 2021Terms of Use: https://www.spiedigitallibrary.org/terms-of-use

shallow. The efficiency is unity for small separations rda for all models and drops of to zero at2 nm for the point model, 8 nm for the plane model, and is nonzero even for separations exceed-ing 10 nm for the bulk model.
Usually the characteristic length for FRET, the distance at which the transfer efficiency is50%, is in the order of 10 nm (QD-QD FRET of 8 nm,13,15) which is considerably longer than inthe case of QD-silicon energy transfer which we discuss in this paper. However, the FRET dis-tance becomes larger going from point (1.8 nm) to plane (2.5 nm) to bulk (3.5 nm) model. Theslope is mainly determined by the distance dependence of the FRET rate [Eq. (1)] which changesfrom r−6 (point model) to r−4 (plane model) to r−3 (bulk model). The absolute efficiencies goingfrom point to plane to bulk model are larger because the FRET rate is dominant compared to baserate kD;0 [Eq. (1)]. The underlying reason for the larger efficiencies is that there are more accept-ors available in bulk (ρSi) compared to plane (σSi) and point (one acceptor) models.
With increasing distance, first dipole-plane and then dipole-bulk interactions become rela-tively stronger as they take into account more area/volume. Which model most accuratelydescribes the distance dependence in our QD-silicon geometry? While the bulk-model representsthe geometry more accurately, one could argue that due to the strong distance dependence ofFRET, the majority of the interaction occurs already at the surface, so the plane-model might bevalid after all. However, the spatial extend of the Bloch waves in silicon will ultimately governthe transition geometry.
We note that the mathematical treatment shown here does not take into account that part ofthe electromagnetic field is reflected by silicon, which leads to a reduced donor lifetime for smalldistances according to CPS theory.34 Furthermore, the exciton in the QD could be more accu-rately described as an extended dipole. The point-dipole approximation is no longer valid if thedistance between donor and acceptor is on the order of the exciton (QD) size. If the separationbetween electron and hole (1.8 nm for PbS QDs26) is taken into account, the near field will nolonger be accurately described by the r−3 dependence used in the FRET derivation. The final stepwould be the addition of a quantitative description of Dexter transfer,16 which is a possibly com-peting charge-mediated energy transfer. Dexter transfer has an exponential distance dependence,which leads to transfer distances of around 1 nm but it does not depend on the absolute molarabsorption coefficient of silicon (only on the spectral shape), which could make Dexter ratescomparable with FRET rates in this case.
A factor that greatly affects kFRET is the overlap between QD emission and Si absorptionspectra. The QD absorption energy must be lower than the Tc triplet exciton energy and theemitted energy of the QD must be above the Si bandgap. The broadening of the QD emissionspectrum leads to additional losses when the emission spectrum broadens beyond the given lim-its. Sharper QD emission spectra could be achieved with a QD ensemble with sharper size
Fig. 5 The three pictures on the left show the three different models [(a) dipole–dipole, (b) dipole–infinite plane, (c) dipole–bulk] and the corresponding donor acceptor distance dependenciesobtained by starting from Eq. (2) and integrating over a surface or space. The colors indicatewhich lines in (d) the dependencies correspond to. (d) The graph shows the FRET efficiency forthose three models at distances in the order of R0. The QD bandgap is 1.2 eV and the QD QY is55%, corresponding to R0 ¼ 1.26 nm.
Tabernig et al.: Enhancing silicon solar cells with singlet fission: the case for Förster resonant. . .
Journal of Photonics for Energy 022008-7 Apr–Jun 2018 • Vol. 8(2)
Downloaded From: https://www.spiedigitallibrary.org/journals/Journal-of-Photonics-for-Energy on 27 Nov 2021Terms of Use: https://www.spiedigitallibrary.org/terms-of-use
distribution.35 Apart from that, the Stokes shift might influence the choice of QD size strongly.We now assumed emission at 1.2 eV, which means that the absorption of the QDs would occurat a higher energy. However, the absorption is limited by the fact that Tc triplet states imposean upper boundary for the QD bandgap of around 1.25 eV.
4 Experimental Methods
4.1 QD Synthesis and Passivation
The colloidal PbS QDs were synthesized via the hot injection method.36 In order to obtain the1.2-eV QDs we measured, the following recipe was followed.37
Most chemicals were purchased from Sigma-Aldrich. For those that were not, the distributorwill be indicated.
The octadecene is degassed heating to 80°C. A 20-mL syringe is filled with 0.213mL ofbis(trimethylsilyl)sulphide (synthesis grade) together with 10 mL of octadecene (technicalgrade 90%) in a glove box (< 0.5 ppmH2O, <0.5 ppmO2) environment. The 0.45 g of PbO(99.999%, Alpha Aesar), 1.34 g of OA (technical grade 90%), and 14.2 g of octadecene aremixed together in a three-necked Schlenk flask. At a temperature of 95°C and under vacuum,this forms a clear solution. Then, the temperature is increased to around 170°C in a nitrogenenvironment. Now, the Schlenk flask containing the lead precursor is transferred to a heatingmantle, which is at room temperature. As soon as the temperature has reached the injectiontemperature of 150°C (for 1.2-eV QDs), the sulphur precursor is injected into the flask withthe solution being vigorously stirred. When the solution has cooled down to 35°C, 20 mLof acetone are added.
For surface passivation with I2, we follow Lan et al.38 After the completed synthesis, the QDsare precipitated with acetone in a glovebox. After centrifuging for 4 to 10 min at 4000 to5000 rpm, the residual liquid is disposed of, which is followed by vacuum-drying of the pre-cipitate overnight. The QDs are then redispersed in toluene (≥99.9%) to obtain a concentrationof 150 mg
ml. Now, a 25-mM iodine (99.999%) in toluene solution is added to the QD solution at a
1∶5 ratio and stirred for 24 h. Afterward, the QDs are precipitated with methanol and centrifugedat 1500 to 5000 rpm for 2 to 5 min. The residual fluid was disposed of, and after a night ofvacuum-drying, the QDs were dispersed in octane to obtain a 37.5 mg
mlsolution.
Eventually, this solution was diluted with octane to obtain a 4.4 mgml
solution, which was usedin the lifetime measurements.
4.2 PL Lifetime Measurement
The photoluminescence decay of the 1.2 eV bandgap PbS QD was measured on a home-builttime-correlated single-photon counting (TCSPC) system consisting of a 640-nm pulsed laser(PicoQuant LDH-D-C-640) with a repetition rate of 0.2 MHz as an excitation source controlledby a PicoQuant PDL 828 “Sepia II.” The signal was collected by a single-photon avalanchediode (SPAD) detector (Micro Photon Devices, MPD-5CTD) connected to a PicoQuantHydraHarp 400 multichannel picosecond event timer. The laser has a power of 14.6 μW atthe used repetition rate. The laser light was filtered out of the collection path by a ChromaZET 642-nf notch filter and a Chroma ET 655lp long-pass filter. The TCSPC decays werecollected for 5 min.
5 Conclusion
In conclusion, we showed that FRET from PbS QDs to silicon is possible with sufficiently highFRET efficiencies, even for QDs that have a bandgap close to silicon and low PLQY. Whileefficient FRET is only possible over small separation distances in the order of a few nanometers,those distances are physically feasible, given careful engineering of the interface.
It is of great importance that the emission and absorption peak of the QDs are betweenthe Tc triplet exciton energy and the bandgap of Si, with a narrow emission spectrum.
Tabernig et al.: Enhancing silicon solar cells with singlet fission: the case for Förster resonant. . .
Journal of Photonics for Energy 022008-8 Apr–Jun 2018 • Vol. 8(2)
Downloaded From: https://www.spiedigitallibrary.org/journals/Journal-of-Photonics-for-Energy on 27 Nov 2021Terms of Use: https://www.spiedigitallibrary.org/terms-of-use
Hence, to obtain high FRET efficiency for using SF to improve silicon solar cells, a narrow sizedistribution of adequate QDs leading to a narrow PL peak and to fine tuning of the bandgap andemission yield of the QDs is necessary. Additionally, the silicon surface needs to be passivatedelectrically and against oxidation with a very thin (sub-nm) layer. Such layers can be achievedwith thin metal oxides39 or self-assembled monolayers of organic molecules.40 In case of theorganic molecules, they could also act as covalent linkers and passivating ligands for the QDs.
Appendix
A.1 Introduction of Bulk Silicon as Additional Separating Medium inthe Dipole—Bulk Model
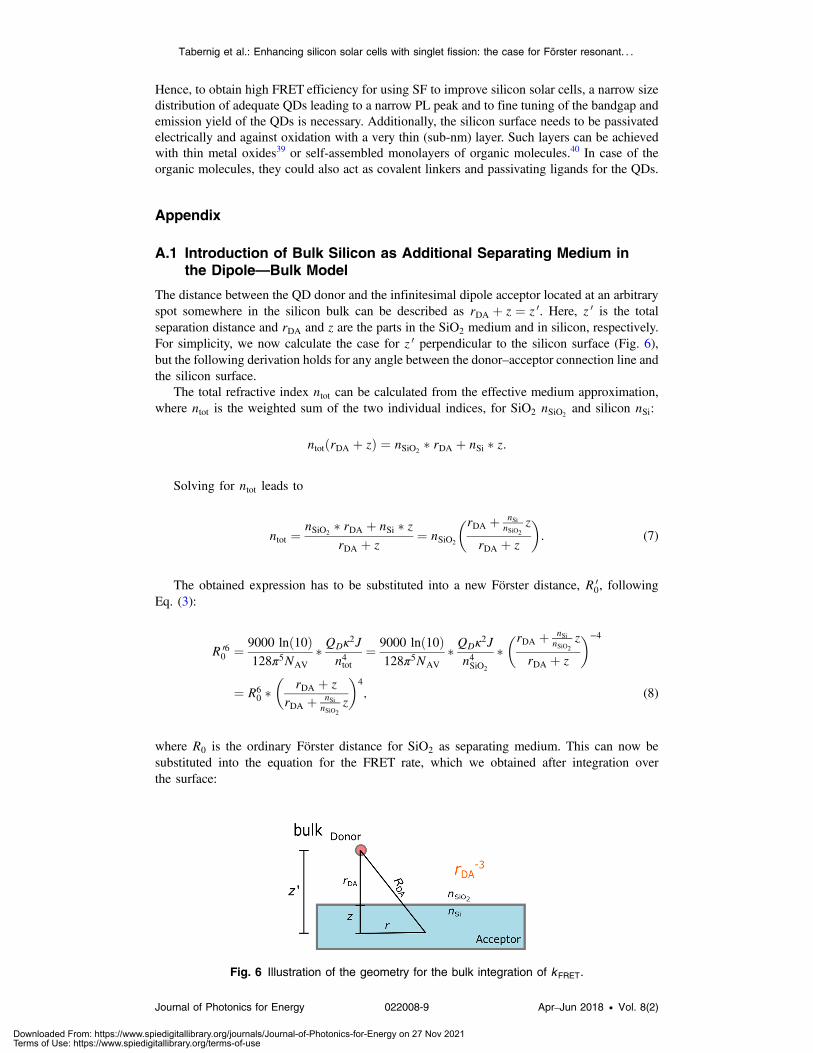
The distance between the QD donor and the infinitesimal dipole acceptor located at an arbitraryspot somewhere in the silicon bulk can be described as rDA þ z ¼ z 0. Here, z 0 is the totalseparation distance and rDA and z are the parts in the SiO2 medium and in silicon, respectively.For simplicity, we now calculate the case for z 0 perpendicular to the silicon surface (Fig. 6),but the following derivation holds for any angle between the donor–acceptor connection line andthe silicon surface.
The total refractive index ntot can be calculated from the effective medium approximation,where ntot is the weighted sum of the two individual indices, for SiO2 nSiO2
and silicon nSi:
EQ-TARGET;temp:intralink-;secA1;116;497ntotðrDA þ zÞ ¼ nSiO2� rDA þ nSi � z:
Solving for ntot leads to
EQ-TARGET;temp:intralink-;e007;116;452ntot ¼nSiO2
� rDA þ nSi � zrDA þ z
¼ nSiO2
�rDA þ nSinSiO2
z
rDA þ z
�: (7)
The obtained expression has to be substituted into a new Förster distance, R 00, following
Eq. (3):
EQ-TARGET;temp:intralink-;e008;116;378R 060 ¼ 9000 lnð10Þ
128π5NAV
� QDκ2J
n4tot¼ 9000 lnð10Þ
128π5NAV
� QDκ2J
n4SiO2
��rDA þ nSi
nSiO2z
rDA þ z
�−4
¼ R60 �
�rDA þ z
rDA þ nSinSiO2
z
�4
; (8)
where R0 is the ordinary Förster distance for SiO2 as separating medium. This can now besubstituted into the equation for the FRET rate, which we obtained after integration overthe surface:
Fig. 6 Illustration of the geometry for the bulk integration of kFRET.
Tabernig et al.: Enhancing silicon solar cells with singlet fission: the case for Förster resonant. . .
Journal of Photonics for Energy 022008-9 Apr–Jun 2018 • Vol. 8(2)
Downloaded From: https://www.spiedigitallibrary.org/journals/Journal-of-Photonics-for-Energy on 27 Nov 2021Terms of Use: https://www.spiedigitallibrary.org/terms-of-use

EQ-TARGET;temp:intralink-;e009;116;735
kFRET ¼ π
2
Z∞
0
R 060
ðrDA þ zÞ4 dz ¼π
2R60
Z∞
0
1
ðrDA þ zÞ4�
rDA þ zrDA þ nSi
nSiO2z
�4
dz
¼ π
2R60
Z∞
0
1�rDA þ nSi
nSiO2z
�4dz ¼ π
2R60
nSiO2
nSi
Z∞
0
1
ðuÞ4 du
¼ −π
6R60
nSiO2
nSi
�0 −
1
r3DA
�¼ π
6R60
�nSiO2
nSi
�1
r3DA: (9)
The equations above show the derivation of the nnSi
prefactor in Eq. (6) of the main text.
For the integration, substitution of variables was used with u ¼ rDA þ nSin z.
A.2 Estimate of the Fraction of Light That is Absorbed by the PbS QDLayer
As a conservative estimate, we assume that the QDs are separated by 50 nm on a square lattice,which is well below the triplet diffusion length.29,30 This means that one QD occupies an area of50 nm × 50 nm. The QDs are approximated as spheres with a radius of 1.75 nm, which cor-responds to a bandgap of 1.2 eV. The volume of the QDs was calculated and divided by the areaoccupied by one QD, which gives an effective QD layer thickness across the whole geometry ofdQD;eff ¼ 9 � 10−3 nm. With this effective layer thickness, we estimated the relative absorptionof incident light by the QDs by using the Beer–Lambert law, as shown in Eq. (10):
EQ-TARGET;temp:intralink-;e010;116;443IQDðλÞ ¼ I0ðλÞ � expð−αQDðλÞdQD;effÞ: (10)
Here, IQDðλÞ stands for the intensity of light behind the QD layer. I0ðλÞ is the incident lightintensity for which we used the AM1.5 solar spectrum.41 αQDðλÞ denotes the wavelength-dependent absorption coefficient of PbS QDs.42 The relative intensity loss due to the QDs canthen be calculated, as shown in Eq. (11), with the integrals going over the whole wavelengthrange:
EQ-TARGET;temp:intralink-;e011;116;350ΔIrel ¼R ðI0ðλÞ − IQDðλÞÞdλR
I0ðλÞdλ: (11)
This leads to a relative intensity loss of ΔIrel ¼ 0.006%, which confirms our assumption thatQD absorption is negligible in our geometry.
Acknowledgments
This work is part of the research program of The Netherlands Organization for ScientificResearch (NWO). The authors thank Ruirt Bosma for the preparation of the PbS QDs andSven Askes for valuable discussions.
References
1. W. Shockley and H. J. Queisser, “Detailed balance limit of efficiency of p-n junction solarcells,” J. Appl. Phys. 32, 510–519 (1961).
2. A. De Vos, “Detailed balance limit of the efficiency of tandem solar cells,” J. Phys. D Appl.Phys. 13, 839–846 (1980).
3. M. C. Hanna and A. J. Nozik, “Solar conversion efficiency of photovoltaic and photoelec-trolysis cells with carrier multiplication absorbers,” J. Appl. Phys. 100, 074510 (2006).
4. M. W. B. Wilson et al., “Temperature-independent singlet exciton fission in tetracene,”J. Am. Chem. Soc. 135, 16680–16688 (2013).
Tabernig et al.: Enhancing silicon solar cells with singlet fission: the case for Förster resonant. . .
Journal of Photonics for Energy 022008-10 Apr–Jun 2018 • Vol. 8(2)
Downloaded From: https://www.spiedigitallibrary.org/journals/Journal-of-Photonics-for-Energy on 27 Nov 2021Terms of Use: https://www.spiedigitallibrary.org/terms-of-use

5. Y. Tomkiewicz, R. P. Groff, and P. Avakian, “Spectroscopic approach to energetics ofexciton fission and fusion in tetracene crystals,” J. Chem. Phys. 54, 4504–4507 (1971).
6. N. J. Thompson et al., “Energy harvesting of non-emissive triplet excitons in tetracene byemissive PbS nanocrystal,” Nat. Mater. 13, 1039–1043 (2014).
7. A. Yeltik et al., “Phonon-assisted exciton transfer into silicon using nanoemitters: the role ofphonons and temperature effects in Förster resonance energy transfer,” ACS Nano 7, 10492–10501 (2013).
8. A. Rao and R. H. Friend, “Harnessing singlet exciton fission to break the Shockley-Queisserlimit,” Nat. Rev. Mater. 2, 17063 (2017).
9. I. Kang and F. W. Wise, “Electronic structure and optical properties of PbS and PbSequantum dots,” J. Opt. Soc. Am. B 14, 1632–1646 (1997).
10. M. Tabachnyk et al., “Resonant energy transfer of triplet excitons from pentacene to PbSenanocrystals,” Nat. Mater. 13, 1033–1038 (2014).
11. M. Lunz et al., “Concentration dependence of Förster resonant energy transfer betweendonor and acceptor nanocrystal quantum dot layers: effect of donor-donor interactions,”Phys. Rev. B 83, 115423 (2011).
12. K. Chou and A. Dennis, “Förster resonance energy transfer between quantum dot donorsand quantum dot acceptors,” Sensors 15, 13288–13325 (2015).
13. S. W. Clark, J. M. Harbold, and F. W. Wise, “Resonant energy transfer in PbS quantumdots,” J. Phys. Chem. C 111, 7302–7305 (2007).
14. C. Wang et al., “Resonant energy transfer between CdSe/ZnS Type I and CdSe/ ZnTe type IIquantum dots,” J. Phys. Chem. C 113(35), 15548–15552 (2009).
15. A. P. Litvin et al., “Photoluminescence of lead sulfide quantum dots of different sizes ina nanoporous silicate glass matrix,” J. Phys. Chem. C 121, 8645–8652 (2017).
16. D. L. Dexter, “A theory of sensitized luminescence in solids,” J. Chem. Phys. 21, 836–850(1953).
17. B. W. Van der Meer, G. Coker, and S.-Y. S. Chen, Resonant Energy Transfer Theory andData, John Wiley & Sons, Inc., New York (1991).
18. T. Forster, “Energiewanderung und fluoreszenz,” Naturwissenschaften 33, 166–175 (1946).19. M. A. Green and M. J. Keevers, “Optical properties of intrinsic silicon at 300 K,”
Prog. Photovoltaics 3, 189–192 (1995).20. A. P. Litvin et al., “Size-dependent room-temperature luminescence decay from PbS quan-
tum dots,” Proc. SPIE 8564, 85641Z (2012).21. I. Moreels et al., “Size-tunable, bright, and stable PbS quantum dots: a surface chemistry
study,” ACS Nano 5, 2004–2012 (2011).22. C. C. Reinhart and E. Johansson, “Colloidally prepared 3-mercaptopropionic acid capped
lead sulfide quantum dots,” Chem. Mater. 27, 7313–7320 (2015).23. B. M. Craig, “Refractive indices of some saturated and monoethenoid fatty acids and methyl
esters 1,” Can. J. Chem. 31 (1961).24. “Mercaptoacetic acid,” http://www.chemicalbook.com/ChemicalProductProperty_EN_
CB6477604.htm (6 November 2017).25. I. Moreels et al., “Size-dependent optical properties of colloidal PbS quantum dots,” ACS
Nano 3, 3023–3030 (2009).26. M. Greben, A. Fucikova, and J. Valenta, “Photoluminescence quantum yield of PbS nano-
crystals in colloidal suspensions,” J. Appl. Phys. 117, 144306 (2015).27. O. E. Semonin et al., “Absolute photoluminescence quantum yields of IR-26 dye, PbS, and
PbSe quantum dots,” J. Phys. Chem. Lett. 1, 2445–2450 (2010).28. G. M. Akselrod et al., “Efficient nanosecond photoluminescence from infrared PbS quantum
dots coupled to plasmonic nanoantennas,” ACS Photonics 3, 1741–1746 (2016).29. G. M. Akselrod et al., “Visualization of exciton transport in ordered and disordered molecu-
lar solids,” Nat. Commun. 5, 1–8 (2014).30. G. Vaubel and H. Kallmann, “Diffusion length and lifetime of triplet excitons and
crystal absorption coefficient in tetracene determined from photocurrent measurements,”Phys. Status Solidi 35, 789–792 (1969).
31. P. K. Wolber and B. S. Hudson, “An analytic solution to the Förster energy transfer problemin two dimensions,” Biophys. J. 28, 197–210 (1979).
Tabernig et al.: Enhancing silicon solar cells with singlet fission: the case for Förster resonant. . .
Journal of Photonics for Energy 022008-11 Apr–Jun 2018 • Vol. 8(2)
Downloaded From: https://www.spiedigitallibrary.org/journals/Journal-of-Photonics-for-Energy on 27 Nov 2021Terms of Use: https://www.spiedigitallibrary.org/terms-of-use

32. M. Stavola, D. L. Dexter, and R. S. Knox, “Electron-hole pair excitation in semiconductorsvia energy transfer from an external sensitizer,” Phys. Rev. B 31, 2277–2289 (1985).
33. J. R. Lakowicz, Principles of Fluorescence Spectroscopy, 3rd ed., Springer-Verlag US(2006) .
34. R. R. Chance, A. Prock, and R. Silbey, “Molecular fluorescence and energy transfer nearinterfaces,” Adv. Chem. Phys. 37, 1–65 (2007).
35. B. Hou et al., “Highly monodispersed PbS quantum dots for outstanding cascaded-junctionsolar cells,” ACS Energy Lett. 1, 834–839 (2016).
36. M. A. Hines and G. D. Scholes, “Colloidal PbS nanocrystals with size-tunable near-infraredemission: observation of post-synthesis self-narrowing of the particle size distribution,”Adv. Mater. 15, 1844–1849 (2003).
37. R. Bosma, “Size-dependent open-circuit voltage in lead sulfide colloidal quantum dot solarcells,” Master Thesis, University of Amsterdam (2017).
38. X. Lan et al., “Passivation using molecular halides increases quantum dot solar cell perfor-mance,” Adv. Mater. 28, 299–304 (2016).
39. A. Richter et al., “Excellent silicon surface passivation with 5 nm thin ALD Al2O3 layers:influence of different thermal post-deposition treatments,” Phys. Status Solidi 5, 202–204(2011).
40. F. Bournel et al., “Adsorption of 2-butyne on Si(0 0 1) at room temperature: a valence bandphotoemission study,” Surf. Sci. 601, 3750–3754 (2007).
41. American Society for Testing and Materials (ASTM), “Terrestrial reference spectra forphotovoltaic performance evaluation,” Reference Solar Spectral Irradiance: Air Mass 1.5,http://rredc.nrel.gov/solar/spectra/am1.5/#about (16 March 2018).
42. Z. Hens and I. Moreels, “Light absorption by colloidal semiconductor quantum dots,”J. Mater. Chem. 22, 10406–10415 (2012).
Stefan Wil Tabernig received his bachelor’s degree in physics at the Graz University ofTechnology and then went on to do a master’s degree in advanced matter and energy physicsat the University of Amsterdam. As part of that, he joined the Hybrid Solar Cells group atAMOLF, 2017, where he is conducting research for his master thesis.
Benjamin Daiber received his bachelor of physics at the University of Heidelberg and hismaster of physics at the University of Amsterdam. Since 2016 he is a PhD student at AMOLF,Amsterdam, in the Hybrid Solar Cells group of Bruno Ehrler. He is focusing his research oninvestigating charge carrier dynamics in perovskites and singlet fission materials, like tetracene,and how these insights can inform the design of novel solar cells.
Tianyi Wang received his master’s degree in materials science under the Erasmus Mundusmaster programme master in materials science exploiting large-scale facilities (MAMASELF)in 2014. In December 2014, he joined Hybrid Solar Cell group at AMOLF as a PhD student. Hisresearch interests are in synthesizing and understanding photophysics of novel photovoltaicmaterials.
Bruno Ehrler is leading the Hybrid Solar Cell group at the Institute AMOLF in Amsterdamsince 2014. Before he worked as a research fellow at the Optoelectronics group of the CavendishLaboratory, University of Cambridge. His research interests include organic, quantum dot, andperovskite solar cells.
Tabernig et al.: Enhancing silicon solar cells with singlet fission: the case for Förster resonant. . .
Journal of Photonics for Energy 022008-12 Apr–Jun 2018 • Vol. 8(2)
Downloaded From: https://www.spiedigitallibrary.org/journals/Journal-of-Photonics-for-Energy on 27 Nov 2021Terms of Use: https://www.spiedigitallibrary.org/terms-of-use