Embed Size (px)
Citation preview

Enhancing Service Quality At Srilankan Airlines: A Critical
Analysis Of It Factors And Recommendations
Gosthinghgho Waduge Nadeesha Gayathri
(129057U)
Master of Business Administration Degree in Information Technology
Department of Computer Science and Engineering
University of Moratuwa
Sri Lanka
April 2016

ENHANCING SERVICE QUALITY AT SRILANKAN
AIRLINES: A CRITICAL ANALYSIS OF IT FACTORS
AND RECOMMENDATIONS
Gosthinghgho Waduge Nadeesha Gayathri
(129057 U)
Thesis submitted in partial fulfillment of the requirements for the degree of Master of
Business Administration
Department of Computer Science and Engineering
University of Moratuwa
Sri Lanka
April 2016

i
Declaration
I declare that this is my own work and this thesis does not incorporate without
acknowledgement any material previously submitted for a degree or diploma in any
other university or institute of higher learning and to the best of my knowledge and
belief it does not contain any material previously published or written by another
person except where the acknowledgement is made in the text.
Also, I hereby grant to University of Moratuwa the non-exclusive right to reproduce
and distribute my thesis, in whole or in part in print, electronic or other medium. I
retain the right to use this content in whole or part in future works (such as articles or
books).
Signature: .................................... Date:..................................
Gayathri G.W.N
(129057U)
The above candidate has carried out research for the Master’s thesis under my
supervision.
Signature of the supervisor:.................................... Date:..................................
Dr. H M N Dilum Bandara
Department of Computer Science and Engineering
University of Moratuwa.

ii
Abstract
Airline industry transports passengers, luggage and freight using a combination of
service processes from multiple domains that are complementary to each other. IT
services play a key role as they integrate many other services and provide a means of
directly interacting with the passengers. Therefore, dependable and high-quality IT
services are essential for an airline to strengthen its competitiveness or even to survive.
Continuous enhancement of IT service quality results in enhanced customer
satisfaction, increased efficiency and maximization of business.
The objective of this research is to identify means of enhancing the airline service
quality at SriLankan Airlines through enhanced IT service delivery. First, the research
identify critical factors that affect the IT service delivery. Second, a suitable set of
recommendations is identified to enhance the IT service delivery. This research
adopted a mixed method approach. First, the current IT service quality was measured
using IT service quality measurement framework, which cover six common issue
areas. The evaluation was carried out using KPIs, baselines and target values, as well
as data collected from monthly reports produced by cost centers in IT department.
Based on the evaluation IT service availability, capacity, reliability, maintainability,
continuity, utilization, customer feedback, customer support, mutual value creation,
adjustability and IT governance were found to be favorable. However, it was also
identified that areas such as IT service performance and information security need
improvements. Second, a set of interviews was conducted with relevant stakeholders
to identify possible actions to further enhance the IT service quality as well as to
address the identified limitations/issues. Some of the key recommendations include
promptly notifying passengers via SMS (e.g., about flight status and loading of
baggage), enhance IT services provided for operationally critical areas, implement six
areas of IATA self-service fast travel initiatives and sharing IT knowledge with mega
carriers.
Keywords: IT service, IT service quality, IT service quality measurement framework
iii
Acknowledgement
I would frankly offer my heartfelt gratitude to my supervisor Dr. Dilum Bandara,
Senior Lecturer, Department of Computer Science & Engineering, Faculty of
Engineering, university of Moratuwa for his immense support and guidance given to
carry out and manage this research from its beginning to the end.
I would also extend my superior gratitude to Dr. Chandana Gamage, Head of the
department, Department of Computer Science and Engineering, University of
Moratuwa for sparing his valuable time by providing continuous support for the
research work and reviewing research progress, which contributed immensely in
carrying out the research successfully.
My sincere gratitude goes to my external supervisor Mr. Chamara Perera, Head of IT,
SriLankan Airlines Ltd for his motivation and guidance. I take this opportunity to
express my thankfulness to all managers of SriLankan Airlines those who contribute
their precious time during the interview and after by providing information.
My sincere gratitude is further extended to all the academic and non-academic staff of
Department of Computer Science & Engineering, University of Moratuwa and my
colleagues from MBA in IT degree program for their support in numerous ways.
Further, my sincere gratitude is to superiors and colleagues at my work place for the
support and encouragement given to complete this exercise.
Lastly, I extend my sincere thanks to my loving husband, daughter, son and parents
for the continuous support and encouragement given, and without their support, this
milestone would not be possible.

iv
Table of Contents
Declaration .................................................................................................................... i
Abstract .........................................................................................................................ii
Acknowledgement........................................................................................................ iii
List of Figures ..............................................................................................................vi
List of Tables............................................................................................................... vii
List of Abbreviations.................................................................................................. viii
Chapter 1 - Introduction ............................................................................................ 1
1.1 Introduction ................................................................................................... 1
1.2 Problem Statement......................................................................................... 3
1.3 Research Objectives and Motivation ............................................................. 4
1.4 Outline ........................................................................................................... 4
Chapter 2 - Literature Review ...................................................................................... 6
2.1 Airline Services ................................................................................................. 6
2.1.1 Preliminary Steps of Airline Service Process ............................................ 6
2.1.2 Airline Service Process Steps .................................................................... 8
2. 2 Service Quality ............................................................................................ 13
2. 2.1 Airline Service Quality .......................................................................... 14
2. 2.2 Defining Service Quality ....................................................................... 15
2. 2.3 Measuring Service Quality .................................................................... 15
2.3 IT Service Quality Measurement Framework ................................................ 17
2. 4 Sri Lankan Airline Ltd................................................................................. 19
2. 4.1 Corporate Profile ..................................................................................... 19
2. 4.2 Corporate Organization Chart ................................................................. 22
2. 4.3 Sri Lankan Services ................................................................................ 23
2.4.4 Catering ....................................................................................................... 25
2. 5 Airline Service Delivery Process..................................................................... 25
2. 5.1 Core Services .......................................................................................... 25
2. 5.2 Augmented Services ............................................................................... 25
2.6 Summary........................................................................................................... 30

v
Chapter 3 - Research Methodology............................................................................ 31
3. 1 Research Method and Approach ................................................................... 31
3. 2 Assessment of IT Service Quality Using Framework ................................... 33
3. 3 Research Instrument for Interviews................................................................. 0
3. 4 Sample Population ........................................................................................... 0
3. 5 Summary.......................................................................................................... 1
Chapter 4 - Data Analysis ............................................................................................ 2
4. 1. Measurements of Quality Framework ............................................................. 2
4. 2 Recommendations ........................................................................................... 1
Chapter 5 – Conclusion and Recommendations .......................................................... 0
5. 1 Evaluation of Research Objectives.................................................................. 0
5. 2 Analysis of Recommendation.......................................................................... 1
5. 3 Limitation and Future Work .......................................................................... 12
REFERENCES........................................................................................................... 13
APPENDIX A – Questioner List ............................................................................... 17

vi
List of Figures
Figure 2.1 Preliminary steps of airline service process. ...................................................... 7
Figure 2.2 IT service quality measurement framework (without indicators)........................18
Figure 2.3 Organizational chart of Sri Lankan airlines.. ....................................................23
Figure 2.4 Augmented services of Sri Lankan airlines. .....................................................26
Figure 2.5 Flowers of services at Sri Lankan. ...................................................................27
Figure 3.1 Research methodology. ..................................................................................32
vii
List of Tables
Table 3.1 Quantitative intrinsic measures of IT service quality framework. ............. 35
Table 3.2 Quantitative extrinsic measures of IT service quality ................................ 37
Table 3.3 Quantitative extrinsic and intrinsic measures of IT service quality ........... 38
Table 3.4 Qualitative intrinsic measures of IT service quality .................................. 38
Table 4.1 Characteristics of SriLankan Airlines Ltd.................................................. 44
Table 4.2 Quantitative intrinsic measures of IT service quality ................................ 45
Table 4.3 Quantitative intrinsic measures of Information system quality ................. 46
Table 4.4 Quantitative intrinsic measures of Process performance ........................... 47
Table 4.5 Quantitative extrinsic measures of Customer satisfaction ......................... 47
Table 4.6 Quantitative, and both extrinsic and intrinsic measures of IT service
value ........................................................................................................................... 48
Table 4.7 Qualitative intrinsic measures of IT service quality .................................. 49
Table 4.8 Qualitative intrinsic measures of Information system quality ................... 50
Table 4.9 Qualitative intrinsic measures of Process performance ............................. 50
Table 4.10 Qualitative intrinsic measures of Service behavior.................................. 51
Table 4.11 Qualitative intrinsic measures of IT service value ................................... 52
Table 4.12 List of factors which are favorable and ones that need improvements .... 54
Table 4.13 List of recommendations .......................................................................... 56

viii
List of Abbreviations
AA American Airlines
ASP Airline Service Process
ATC Air Traffic Control
AQR Airline Quality Rating
AWB Air Waybill
BA British Airways
BIA Bandaranaike International Airport
CMB Colombo
CDN Content Delivery Network
CRM Customer relationship management
DCS Departure Control System
DGCA Director General Civil Aviation
ECO Electronic Customer Outlook
GDS Global Distribution System
GOM Ground Operation Manual
IAA International Aviation Academy
IATA International Airline Training Association
IBE Internet booking Engine
IFE Inflight entertainment
ITIL IT Infrastructure Library
KPI Key Performance Indicators
MICE Meetings, Incentives, Conventions, and Exhibitions
MYB Manage Your Booking
NOC Network Operation and Central
SGHA Standard Ground Handling Agreement
SLA Service Level Agreements
SLIM Sri Lankan Institute of Marketing
SMS Short Message Service
TAASL Travel Agents’ Association of Sri Lanka

1
Chapter 1 - Introduction
1.1 Introduction
SriLankan Airlines (UL) is the National Airline of Sri Lanka. It is an award-winning
carrier with a firm reputation as a global leader in service, comfort, safety, reliability,
and punctuality. The airline’s hubs are located at Bandaranaike International Airport
in Colombo and Mahindha Rajapaksa International Airport in Mattala. It serves about
89 destinations in 44 countries in Europe, Middle East, South Asia, Southeast Asia,
Far East, North America, Australia and Africa. The carrier operates a fleet of 22
aircrafts consisting wide-bodied and mid-range Airbuses. UL extends its network via
code-sharing relationships with Etihad Airways, Malaysia Airlines, Air Canada, S7,
Oman Air, Finnair, Asiana Airlines, Alitalia, Mihin Lanka, Air India and Saudi
Arabian Airlines. SriLankan joined the Oneworld airline alliance as the first carrier
from the Indian sub-continent and offers more services and benefits to its customers ,
such as a wider route network, opportunities to earn and redeem frequent flyer miles
on any one of the OneWorld carriers, and most extensive ranges of alliance fares.
The basic service delivery process of the Sri Lankan Airlines can be briefly described
as follows. Assume a customer buys a ticket online. Initially consumer seeks
information about the flight over the UL’s official website. When the customer decides
which flight to buy, he/she may buy the ticket by paying directly using a credit card,
via an agent, or contact the call center to figure out other buying options. After the
reservation customer reaches the airport and go to the check-in desk. At the check- in
desk passenger puts the luggage onto the scale while the agent checks out the
documents, prints the boarding pass and the barcode tag for the luggage. After check-
in, the passenger can go through the security control. Subsequently the passenger can
go to the gate where the airline employees check the boarding passes and lead
passengers to the airplane.
After takeoff, the monitors are turned on and start to display information about the
flight. In the business class, a passenger may ask to make a phone call or to send a fax.
On the backstage, the IT and radio systems of the plane work to create a connection to

2
the Earth to transmit the actual voice but also to connect to the credit card circuit.
When the call is over, the billing and electronic payment procedures take place.
As the flight approaches the destination, the pilot gets information from the control
tower about the weather, the estimated time of landing and the connecting flights. That
information is shared with the passengers by public announcements and/or displaced
on the monitors.
When the passengers arrive at the arrival gate of the airport they usually go through
the passport control queues leading to the passport control. After passport control is
passed, it is important that the baggage is transferred to the belt fast enough and safely.
In case of a lost baggage, passenger get the assistance of customer service. There the
baggage is traced, and once located baggage is delivered to the address of passenger’s
preference. This may take up to 2 days, depending on the final destination of the
passenger. Furthermore, UL offers frequent fliers program. Every customer has the
opportunity to sign up for this program. The account statements include the number of
miles travelled. These miles are collected and can be used to receive free gifts/flights
once the required amount is achieved.
Flower of services theory explains how to break down and analyze basic service
delivery process into all core and supplementary services that the UL provides for its
passengers (Slidesharenet, 2016). Transported fast, on-time, safely and comfortably
are the core services delivered and post flight customer care, frequent flyer program,
baggage handling, on board food, on board entertainment, on board flight assistants,
reservation system, airport desk, call-center, airport lounge and website are
supplementary services provided by UL. Information Technology (IT) is involved
throughout the service delivery process as described above and quality service is
required across all delivery processes to satisfy the customers. So to measure the IT
service quality IT service quality measurement framework (Lepmets et al., 2013) was
used. However, the actual conditions at SriLankan Airlines did not allow full
application of this framework.

3
1.2 Problem Statement
SriLankan Airlines continues to expand while capitalizing on the market opportunit ies
and the steady growth of global travelers and tourists to Sri Lanka. SriLankan spread
its wings into every aspect of travel and tourism to become a leading corporation in its
field. However, there is a fierce competition in airline industry because all are trying
to gain their own market share by using different strategies such as providing excellent
customer services, cheap tickets and more benefits to the passengers (e.g., extra
baggage allowance).
Therefore, to compete with other international airlines, it is important to first identify
the Sri Lankan’s position with respect to other airlines. According to Skytrax, a leading
airline reviewer, SriLankan has a 3-star rating while world’s top airline like Cathay
Pacific Airways, Qatar Airways and Singapore Airlines have a 5-star rating
(SKYTRAX, 2016). Airline website, airport ticket counters, check-in (self-serve and
staffed counters), airline lounges (First and Business Class lounges, arrival lounges),
boarding services, transfer services, arrival services, delay/incident handling are the
evaluation criteria while ranking an airport. In addition to that, cabin services are
assessed by using cabin seating, cabin safety procedures, cabin cleanliness, cabin
comfort amenities, cabin announcements, onboard catering, duty free service,
newspapers and magazines, airline magazine, inflight entertainment, and cabin staff
service. In 7-star assessment criteria for full service airlines, SriLankan has 5.5-start
rating. Assessment criteria includes seat pitch in economy class, in-flight
entertainment, website information, flat beds, meals, blankets and pillows, and editor’s
discretionary (Airlineratings, 2016).
According to the flightStats, a world famous on-time performance evaluator, between
October 15 and December 15, 2014 SriLankan’s flights on-time performance was only
73% (Flightstats.com, 2016). 13% of cases were classified as late, 5% as very late and
6% as excessively late. Whereas for Cathay pacific, departures on time performance
was 78% and arrivals on time performance was 74%.
These numbers show that SriLankan comply with the industry standards and regularly
maintain the industry benchmarks. While this is commendable, SriLankan’s
competition has set a much higher bar and continuing to raise it far beyond the
4
minimum industry standards. Contemporary passengers not only expect higher levels
of service, but also are aware of various amenities offered by modern airlines. In an
era where passengers have multiple choices, and are more knowledgeable, have easy
access to information, and can easily spread the bad word, it is imperative for an airline
to be par with the competition or even outcompete them. So continuous improvement
in service quality is vital. Stemming from the fact that you cannot improve what you
cannot measure, therefore measuring is required before enhancing. Hence, the problem
that this research try to address is:
What are the critical factors that affect service quality at SriLankan airlines and
what actions are required to enhance the service quality?
1.3 Research Objectives and Motivation
This research focuses on the Information Technology (IT) related factors that affect
the service quality at SriLankan Airlines. As IT spans across all form of services
processes that are required to provide airline services, as well as it is an essential tool
to measure and improve each service process, it has a wider impact to the problem
statement outlined in previous section. Hence, our objective is to enhance the airline
service quality at SriLankan Airlines through enhance IT service delivery. Following
are the specific objectives that this research try to achieve:
Identify critical factors that affect IT service delivery using IT service quality
measurement framework, using the data that is already available at SriLankan
airlines.
Identify a set of recommendations address the known issues as well as to
enhance the IT service delivery to be par with or even go beyond other
international airlines.
1.4 Outline
Chapter 2 presents the knowledge acquired from the literature survey related to the
research topic. Once of the key related work is the IT service quality measurement
5
framework, which is used to measure the current IT service quality at SriLankan.
Chapter 3 presents the research methodology. Evaluation of SriLankan Airlines based
on the IT service Measurement framework is presented in Chapter 4.Chapter also
present key recommendations identified during the stakeholder interviews. Chapter 5
discusses the conclusion of this research study and future works. This consists with
recommendations actions to enhance IT service quality at SriLankan.

6
Chapter 2 - Literature Review
2.1 Airline Services
Air transportation service is used to transport passengers, luggage and freights via an
aircraft between two airports to provide place and time benefit. While air
transportation operations are performed by airline companies, they rely on many other
parties/services such as civil aviation services at airport, airport ground handling,
catering, fueling, security, customs and air traffic controlling. It is important to
consider all these services as one whole services, as failure of one sub-service could
lead to a catastrophic failure of the whole service. This is identified in concepts such
as Gate-to-Gate (G2G) concept, which consists of the many service processes from the
beginning to the end of the airline service. Another is Airport Collaborative Decision
Making (ACDM) that supports and encourages all the shareholders to work in
cooperation (Eurocontrol, 2011a). The Airline Service Process (ASP) is defined as the
combination of the different operation steps complementary to the various companies
that contribute directly and indirectly to each other at the airport.
The air transportation service consists of the strategic, tactical and operational
activities that begin months before the date of travel. Therefore, the steps can be
divided into two parts as the preliminary steps of airline service process and airline
service process steps.
2.1.1 Preliminary Steps of Airline Service Process
The aviation authority, airline companies, airport companies, and ground handling
companies, freight sender, and passenger are taken as the focus groups of preliminary
steps in ASP. Airport companies are the most important infrastructure provider of
ASP. Airport authority performs annual slot allocation for the airline companies
depending on the analyses and plans. The airport enterprise performs capacity
allocation for seasons in two different sections as airside and landside in accordance
with slot allocations. For the passenger-terminal capacity allocation, the planning is
performed based on the number of counter, passport, customs and security
checkpoints. The main subject of these plans is the assignment of the equipment and

7
personnel. For cargo facilities, the planning of storage area assignments is also
required.
Figure 2.1 shows the preliminary steps of airline service process (Ates S.S., and
Kagniciolu C.H, 2013). Section 2.1.2 describe airline service process in very
descriptive manner. The most important step prior to ASP is that the airline company
publishes their flight schedule. The airline company first conducts a market survey to
identify markets that they want to operate flights. Relevant departments of the airline
search for the frequency of airline service in the market, pricing policies, competitors’
behavior, and code sharing within the region and cooperation opportunities to decide
the city pairs (Bazargan, 2004). The company creates a draft flight schedule consisting
of the city pairs that meet the priorities and technical requirements. The airline
company then requests for the flight permission from the respective authority of the
country to access to the markets in the draft schedule. In addition, the airline requests
for slot allocation for the time slots which they intended to perform the flights from
the airport company (Diederiksand Butler, 2006).
Figure 2.1 Preliminary steps of airline service process.

8
On the airside of the airport, the Runway, Apron, Taxi way capacity is allocated based
on the airline schedules. Another operation performed before airline service process is
the airside and parking position allocation plans that directly affects the ground times.
On the air side, another important plan is performed based on navigation facilities.
Airport ground handling services plans on tactical level based on the flight schedules
before the airline service process. A ground handling agreement is prepared between
the airline and ground handling companies according to the quality and quantity of the
services to be received by the airline enterprises. The airline companies prepare service
agreements based on the content of Ground Operation Manual. The ground handling
companies plans separately the equipment and personnel, ramp, passenger services,
operation and cargo departments according to the agreement they prepare with the
airline and frequencies on the flight schedule.
Passengers’ different reasons for travel can be named as travel sources. On the
passenger part, some of the factors determining the transportation type include the
purpose of travel, destination and socio-economic characteristics of the individua ls.
For the preference of the airline company, the flight schedule is one of the most
important factors. In addition, the ticket price, number of transfers, timeliness, duration
of travel, comfort and image of airline are also important.
The air cargo sender decides the type of transport they use considering the
characteristics of the load to be send. Such factors as the value, weight, and possibility
of disruption are effective in determining the type of transport. The customer who
decides on the air cargo dispatch makes a decision considering such factors as the
dispatch price and number of transfers while choosing the airline company. Air cargo
passes through the customs documentation issuing operations such as packaging,
marking, coding, AWB before the flight moment (IATA, 2011b; IATA, 2009).
2.1.2 Airline Service Process Steps
The airline service process is performed within the process beginning from the point
where the passenger, luggage and cargo enters into the departure airport using the land
transport systems to the point where the flight ends, and the passenger, luggage and

9
cargo departs from the arrival airport. Although the services provided differ in their
physical characteristics, passenger and cargo type, the basic purpose is to provide the
flight service safely and efficiently. The services provided by the aviation companies
have a similar structure with respect to the international rules. At the passenger,
luggage, cargo and mail airport terminal, they get the service from one of the three
different categories including arrival (domestic-international flights), departure
(domestic-international) and transit. Next, each of those are briefly described.
Services Provided for the Departure Passenger
The services provided for the departure passenger begins with the entry into the airport
and use of the interior ways within the airport. The car park may be required based on
the type of the transport used by the passenger to access to the airport. The passenger
and if any, the companions are subjected to the security checks at the entry to the
terminal building. After the entry security check, the passenger arrives at the passenger
terminal where facilities such as post office, bank, cafe and restaurant are provided.
The passenger goes to the check-in counter, and gets a boarding card and delivers their
checked-in luggage. The luggage to be loaded under the aircraft is separated from the
passenger after the check-in operation. For the international flights, the passenger is
subjected to passport control by the customs and security units, and then, pass through
the security check. The passenger goes to the boarding gate as written on the boarding
card or specified on the passenger information boards using the passenger
conveniences. After the boarding operation, the passenger is transported to the aircraft
and get on the aircraft.
Services Provided for the Departure Luggage
The luggage separated from the passenger during check-in process is transferred to the
chute area through conveyor belts. The luggage is sorted and subjected to the security
scanning. If the flight is an international one, then the luggage passes through the
customs check and loaded into the luggage trolley. The luggage on the trolleys are
transferred to the aircraft, and loaded into the aircraft after baggage identification.
10
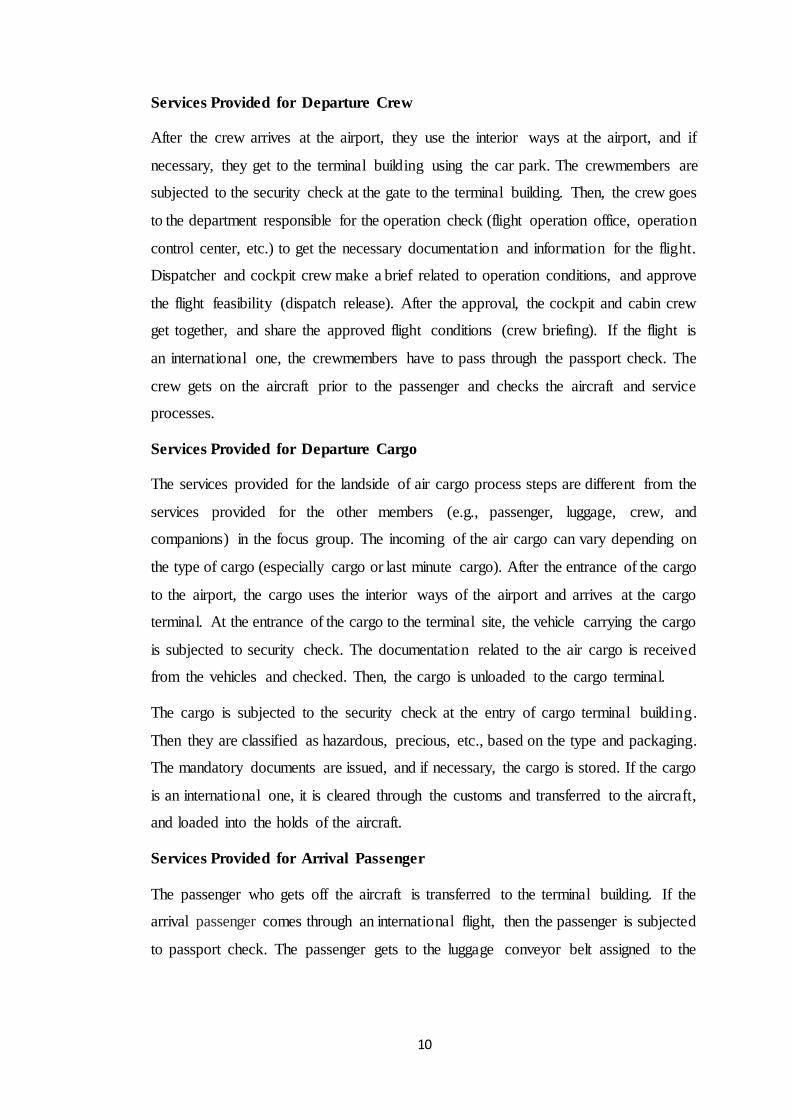
Services Provided for Departure Crew
After the crew arrives at the airport, they use the interior ways at the airport, and if
necessary, they get to the terminal building using the car park. The crewmembers are
subjected to the security check at the gate to the terminal building. Then, the crew goes
to the department responsible for the operation check (flight operation office, operation
control center, etc.) to get the necessary documentation and information for the flight.
Dispatcher and cockpit crew make a brief related to operation conditions, and approve
the flight feasibility (dispatch release). After the approval, the cockpit and cabin crew
get together, and share the approved flight conditions (crew briefing). If the flight is
an international one, the crewmembers have to pass through the passport check. The
crew gets on the aircraft prior to the passenger and checks the aircraft and service
processes.
Services Provided for Departure Cargo
The services provided for the landside of air cargo process steps are different from the
services provided for the other members (e.g., passenger, luggage, crew, and
companions) in the focus group. The incoming of the air cargo can vary depending on
the type of cargo (especially cargo or last minute cargo). After the entrance of the cargo
to the airport, the cargo uses the interior ways of the airport and arrives at the cargo
terminal. At the entrance of the cargo to the terminal site, the vehicle carrying the cargo
is subjected to security check. The documentation related to the air cargo is received
from the vehicles and checked. Then, the cargo is unloaded to the cargo terminal.
The cargo is subjected to the security check at the entry of cargo terminal building.
Then they are classified as hazardous, precious, etc., based on the type and packaging.
The mandatory documents are issued, and if necessary, the cargo is stored. If the cargo
is an international one, it is cleared through the customs and transferred to the aircraft,
and loaded into the holds of the aircraft.
Services Provided for Arrival Passenger
The passenger who gets off the aircraft is transferred to the terminal building. If the
arrival passenger comes through an international flight, then the passenger is subjected
to passport check. The passenger gets to the luggage conveyor belt assigned to the

11
flight and takes their luggage. The arrival passenger who comes from the internationa l
flights uses facilities like duty free shops, and they are subjected to the customs check.
The passenger gets to the area where they can make use of such facilities as rent-a-car,
bank, etc., following to the free terminal zone. If the passenger has any greeters, then
the greeters can accompany the passenger following to this point. The passenger makes
use of the car park, after getting out of the terminal building, if they need to do so, and
leaves the airport using the interior ways of the airport.
Services Provided for Arrival Luggage
The incoming luggage is transferred to the terminal building after being unloaded from
the aircraft, and they are loaded onto the luggage conveyor belts.
Services Provided for Arrival Crew
If the arrival crew does not proceed with the next flight, they can get off the aircraft
after the passenger de-boarding operation is completed, and the technical crew gets on
the aircraft. The arrival crew is transferred to the passenger terminal. For the
international flights, the crew has to pass through the passport and customs check. If
the crew does not have any documentation required to be submitted with respect to the
flight performed by the crew (captain report), they can pass through the free zone and
leave the terminal building. If necessary, the crew makes use of the car park, and leaves
from the airport using the interior ways of the airport.
Services Provided for Arrival Cargo
After the arrival cargo is unloaded from the aircraft, it is transferred to the cargo
terminal. The cargo is sorted after their documentation operations are completed, and
if necessary, the cargo is stored. If the flight is an international one, then it is subjected
to the customs operations. Later, the cargo is loaded onto the land vehicles to deliver
it to the customer. The cargo leaves the airport using the interior ways of the airport.
Services Provided for Connected Passengers
For the connected flights, the passengers or the cargos change the flight, or wait for
the next flight without getting off the aircraft at the transit airport to arrive at the
destination. In this process, the passenger who changes flight from the domestic flight

12
to the international flight is not subjected to a further customs and passport operation,
if they have already passed through the first departure airport. The passenger coming
from international flight and going to another international flight is transferred to the
departure. If the waiting time is too long for the connected flight, the passengers are
transferred into the transit lounge, and the transit/transfer operations are performed.
Services Provided for Connected Luggage
After the luggage owned by the connected passenger is unloaded from the aircraft, the
transit/transfer luggage operations are applied. After the transit/transfer operations, the
luggage is loaded onto the connected flight.
Services Provided for Arrival Aircraft
The arrival aircraft is provided with the approach and final approach service from the
ATC clearance and land to the runway. When the aircraft starts the final approach
process, the ground handling company pulls over their service equipment to the
parking position, and takes ramp safety measures and waits for the aircraft. The ramp
safety measures include such operations as FOD scan, installing cones, and marshaling
service. Following to the taxiway, the aircraft gets to the parking position. The aircraft
is marshaled to the parking position by being routed by the ground handling or airline
personnel. While these processes are going on, bridge-stairs is connected on aircraft,
the loading equipment is pulled over, and the aircraft doors are opened with the
clearance of the cabin crew and operation personal, and the passengers get off the
aircraft. The passengers who get off and the loads are transferred to the termina l
building, and the arrival aircraft service process on the air side is completed. The
ground handling personnel checks the incoming aircraft for the damages by walking
around the aircraft (aka. walk around check). In case of any damage, the damage forms
are filled in regarding that the aircraft is arrived as damaged from the departure airport,
and the airline company is informed thereof.
Services Provided for Departure Aircraft
The departure aircraft is to be visually checked by the cockpit crew before the
departure of the aircraft. The operation personnel of the ground handling service
company shares the information about the processes carried out for the outgoing

13
aircraft and other subjects (e.g., the payload and properties, the number of the
passengers, etc.) by cockpit briefing with the cockpit crew. The operation personnel
are informed by the cockpit crew about the fuel and optional services provided for the
aircraft during ground time (equipment support based on the requirements) with
cockpit briefing. The operation personnel coordinate the fueling and the loading of
catering required for the flight. At the time of these processes, required amount of
clean water for the flight is loaded onto the aircraft, and the dirty water is ensured to
be discharged from the aircraft. The technical crew holds a technical briefing with the
cockpit crew about the technical conditions of the aircraft (technical briefing), and
reviews the technical logbook of the aircraft. Consequently, the technical crew and
cockpit crew decide on the preventive and/or corrective maintenance operations
related to the aircraft failures. Such documentation operations as the documentat ion
used in loading the aircraft, the passenger manifest, the customs documentation for the
international flights, etc., are completed at the same time. The crew release is expected
to receive the passengers on board. The cabin crew confirms to take the passengers
onboard, after the cleaning has been completed. As there are special conditions to be
complied with for simultaneous performance of boarding passengers and refueling, the
refueling is usually performed when the passenger is not on the aircraft. After the
loading, the aircraft doors are closed upon the decision made by the cabin crew and
operation personnel. The bridge/stairs and loading equipment are taken back, and if
any, the GPU is disconnected from the aircraft. If necessary, air starter unit is used.
The cones are displaced by taking ramp safety measures. When it is confirmed by the
air traffic control unit, the push-back, engine start-up and taxiway processes are
started. Following to the taxiway operation, the aircraft gets clearance to enter into the
runway at the holding point. After aircraft gets the clearance, it enters into the runway
and takes off.
2.2 Service Quality
Service quality is customer’s long term, cognitive evaluations of a firm’s service
delivery. Customers compare what they expect to get with what they actually receive
during the post purchase stage of the service purchase process. Before customers

14
purchase a service, they have an expectation about service quality that is based on
individual needs, past experiences, word-of-mouth recommendations, and a service
provider’s advertising. After buying and consuming the service, customers compare
its expected quality with what they actually received (Lovelock and Wright, 1999).
Delivering high service quality has been recognized as the most efficient way of
ensuring that a company’s offerings are uniquely positioned in a market filled with
lookalike competitive offerings (Parasuraman, 1991). Improving the quality of
manufactured goods has become a major strategy for both establishing efficient,
smoothly running operations and increasing demanding higher and higher quality
(Hoffman and Bateson, 2001). Providing high quality service and ensuring customer
satisfaction are widely recognized as important factors leading to the success of the
various service industries (Stevens, 1995). It is commonly believed that higher service
quality can lead to a higher overall satisfaction of customers and subsequently to
positive behavioral intentions. Like other service industries, service quality is an
important issue in the airport management.
2.2.1 Airline Service Quality
Service quality is like beauty in the eyes of the beholder and hence a matter of
perception (Rhoades and Waguespack, 2004). However, it is a measurement that plays
an important role in assessing a service organization’s performance, scrutinizing
service problems, managing service delivery and determining corporate rewards
(DeMoranville and Bienstock, 2003). Service excellence and delivering quality service
are importance to service firms. Service firms like airlines emphasize their service
attributes to establish a favorable image to differentiate themselves from their
competitors (Gursoy, 2005). The issues concerning airline service qualities were traced
back in 1978. During the deregulation of American airline industry supporters of
deregulation argued that the regulation had forced competition among airlines based
on service quality and not on price. Whilst, service quality is more noticeable to the
passengers than safety quality (Rhoades and Waguespack, 2000). Service quality was
used as a basis for judging the overall quality of the airline and hence determined
satisfaction of an airline passenger (Johnston, 1995). Whilst every interaction between
15
a customer and an airline employee influences customer’s perception of service
quality. Understanding customer’s perceptions of services were an essential
component for airlines and providing quality services were acknowledged to be of the
key factors in attracting and retaining customer’s loyalty.
2.2.2 Defining Service Quality
Service quality has been defined in different ways by researchers. Kasper (1999)
defined service quality as “the extent to which the service, the service process and the
service organization can satisfy the expectations of the user”. Parasuraman (1988)
defined service quality as “a function of the difference between service expected and
customers’ perceptions of the actual service delivered”. Gronors (1978) suggests that
service quality is made of two components – technical quality and functional quality.
Technical quality refers to what the service provider delivers during the service
provision while functional quality is how the service employee provides the service.
In the services marketing literature, the quality construct can be summarized as
providing customer value (Feigenbaum, 1951), conformance to requirements (Crosby,
1979), fitness for use (Juran, 1974) and meeting customers’ expectations
(Parasuraman, 1985). Service quality can be defined as a consumer’s overall
impression of the relative efficiency of the organization and its services. Understanding
exactly what customers expect is the most crucial step in defining and delivering high-
quality service. Singapore Airlines, British Airways and American Airlines are among
the few airlines that have successfully positioned themselves globally as offering
excellent service quality (Chan, 2000b).
2.2.3 Measuring Service Quality
Measuring service quality is challenging. Studies suggests that the first airline service
quality came to limelight in America in 1991 (Janawade, 2012) where AQR system
was developed by the Aviation Institute at University of Nebraska, Omaha. However,
it was later criticized as it considered just basic services like on-time percentage, flight
issues, denied boarding’s, refunds and fare complaints, and not airline customer

16
amenities like seat comfort, ease of check-in, airline schedule availability and meal
quality. As the overall quality of airlines became subject of discussion, service quality
data were released as the Department of Transportation’s air travel consumer report
1987-2002.This report emphasized total service quality, total safety rate and passenger
satisfaction of American airlines.
Passenger satisfaction was measured by travel public’s perception of airport check-in,
schedule/flight information, on time performance, gate location, aircraft interior, flight
attendants, post flight services, seating comfort, food services and frequent flier
programs were judged. However, the total service quality was represented by the
percentage of late flights, total consumer complaints, total mishandled baggage and
total involuntary denied boarding per year divided by the total yearly departures of a
particular airline. Safety rate was calculated as the sum of the total accidents, incidents,
near mid-air collisions, pilot deviation per year divided by the total yearly departures
of a particular airline. Together, these quality issues represent the quality problems per
departure (Rhoades and Waguespack, 2004). As quality is a matter of development of
processes, execution, training, tracking and regular improvements. An airline can
institutionalize a quality process for better operations with necessary skills and tools.
However, to improve service quality, a firm commitment of an airline can equate the
same skills to the service side of the operation (Rhoades and Waguespack, 2000).
As airlines provide experiences and performances but not physical objects,
experiences and performances differ from service provider to service provider as well
as from customer to customer (Gursoy, 2005). Therefore, the structural content of the
service as a process may influence the service evaluations by the consumer. In service
quality research, literature suggests various concepts of measuring quality. To date,
several researchers have proposed a finer measure to evaluate airline service quality.
It is perceived that the airline service quality as a multidimensional construct and using
on time performance may not address the total service quality of an airline (Parast and
Fini, 2010). Wen and Lai (2010) measured airline service quality based on airfare,
schedule time difference, flight frequency, on time performance, airport check in
service, in-flight seat space, in-flight food and beverage service. Tiernan (2008)
measured service quality of international airlines in the America and Europe based on

17
percentage of not cancelled flights, percentage of passengers filling baggage lost,
damaged, delayed or stolen, and on-time performances. Babbar and Koufteros (2008)
suggested that an element of personal touch and nature of an employee’s attention,
helpfulness, promptness, and courtesy enables better management of quality.
However, many researchers like Tsaur (2002), Sultan and Simpson (2000), Chen
(1994) and Frost and Kumar (2001) measured airline service quality based on
Parasuraman’s Servqual service quality model (1988). The Servqual instrument is
based on five service quality dimensions that were obtained through extensive focus
group interviews with consumers. The five dimensions include tangibles, reliability,
responsiveness, assurance, and empathy, and they provide the basic skeleton
underlying service quality (Hoffman & Bateson, 2001). However, Robeldo (2001)
challenged Servqual and created his own airline service quality measurement model
called Servpex.
2.3 IT Service Quality Measurement Framework
“Quality” means meeting a business need or satisfying requirements. These definit ions
apply to IT Services just as they do to anything else. The IT Infrastructure Library
(ITIL) Service-Level Management process is responsible for translating each IT
customer’s business needs into statements of IT Service Requirements, and ultima te ly
the Service Level Agreement (SLA).
Those SLAs’ become the basis for judging the quality of service delivered to each IT
customer. This means that IT service quality is not just a matter of lots of capability,
fast responses, high availability, etc. Whereas IT service quality is a matter of ensuring
the capabilities, response times, availability, etc., that the business needs as
documented in the SLA.
IT service quality must be measured from the perspective of the ultimate customer of
that service. The quality of the individual pieces drives the quality of the service, but
is not the ultimate measure of service quality (Askprocesscom, 2016).
The IT service quality measurement framework (Lepmets et al., 2013) was selected
because it was developed in December 2013, and has undergone multiple rounds of
18
validation by relevant stakeholders. Moreover, it provides both quantitative and
qualitative measures to cover many related aspects of IT service quality.
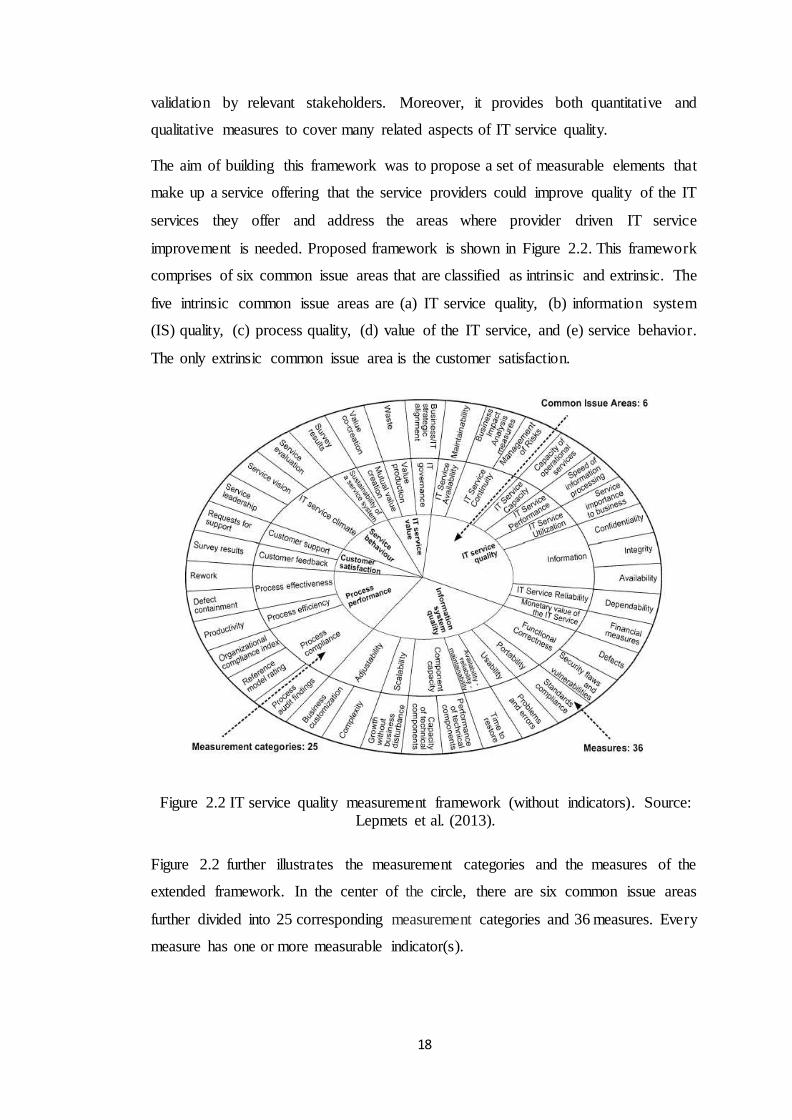
The aim of building this framework was to propose a set of measurable elements that
make up a service offering that the service providers could improve quality of the IT
services they offer and address the areas where provider driven IT service
improvement is needed. Proposed framework is shown in Figure 2.2. This framework
comprises of six common issue areas that are classified as intrinsic and extrinsic. The
five intrinsic common issue areas are (a) IT service quality, (b) information system
(IS) quality, (c) process quality, (d) value of the IT service, and (e) service behavior.
The only extrinsic common issue area is the customer satisfaction.
Figure 2.2 further illustrates the measurement categories and the measures of the
extended framework. In the center of the circle, there are six common issue areas
further divided into 25 corresponding measurement categories and 36 measures. Every
measure has one or more measurable indicator(s).
Figure 2.2 IT service quality measurement framework (without indicators). Source: Lepmets et al. (2013).
19
The common issue area of IT service quality describes the measures that support the
stability of the IT service, since the constant quality of the service is one of the most
important but also one of the most difficult aspects faced by the service industry (Polter
et al., 2008). The common issue area of Information system quality relates to the
system’s ability to support the IT services delivered. The aim of common issue area of
Process performance is to measure process effectiveness, efficiency and compliance
using standards vital to the business. IT employees’ shared perceptions of the practices
and behaviors in their workplace, which is highly influential on client evaluation of
service quality (Jia and Reich 2011), is summarized in the common issue area of
Service behavior. Finally, analyzing the measures of the IT service value, another
common issue area, helps the provider determine whether gearing its activities and
processes towards supporting customer’s practices will generate productivity gains
that can be shared as value to the customer and value to the provider (Lepmets et al.,
2013). The extrinsic measures of the Customer satisfaction common issue area
illustrate the perceptions of the IT service from the customer viewpoint.
2.4 Sri Lankan Airlines Ltd.
2.4.1 Corporate Profile
SriLankan Airlines was launched in 1979 as the national airline of Sri Lanka. It is
currently expanding and further diversifying its wide range of products and services in
order to drive the country’s ongoing boom in tourism and economic development. The
airline’s hubs are located at Bandaranaike International Airport in Colombo and
Mattala Rajapaksa International Airport, Hambantota providing convenient
connections to its global route network of 95 destinations in 44 countries (includ ing
codeshare operations) in Europe, the Middle East, South Asia, Southeast Asia, the Far
East, North America, Australia and Africa.
It joined the Oneworld airline alliance on May 1, 2014 as the first carrier from the
Indian Sub-continent. SriLankan now flies alongside some of the biggest and premier
brands in the airline business – Air berlin, American Airlines, British Airways, Cathay
Pacific, Finnair, Iberia, Japan Airlines, LAN, Malaysia Airlines, Qantas, Royal

20
Jordanian and S7 airlines. With its OneWorld membership, the flagship carrier of Sri
Lanka offers its customers more services and benefits: such as a wider route network,
opportunities to earn and redeem frequent flyer miles on any one of the OneWorld
carriers.
Mutual code-share services are established with Etihad Airways, Malaysia Airlines,
Air Canada, S7, Oman Air, Finnair, Asiana Airlines, Alitalia, Japan Airlines and Mihin
Lanka. Air India and Saudi Arabian Airlines also code-share on some of SriLankan
routes. It operates a fleet of 22 aircraft including wide-bodied A340 and A330 aircraft,
A321 aircraft and mid-range A320s.
Global workforces of approximately 6,800 employees are in Sri Lanka and overseas.
The airline has strong training programs in all aviation related fields, to cater to its own
expansion and the constant need to replace its staff, in high demand by other airlines.
The SriLankan fleet contains luxurious seats that have ample pitch and width. Seating
is in a two-class system of Business and Economy. Business classes on long haul
aircraft are equipped with flatbed seats. The AVOD in-flight entertainment system has
the latest Audio and Video on Demand function with games. Complementing this
facility are the wide screens with superior high-resolution picture quality for infinite
viewing pleasure. Also available is the air-show with forward and downward cameras
and video games in most seats.
SriLankan Holidays is the leisure arm of the airline, which promotes travel to and from
Sri Lanka, and within all points throughout the airline’s network. SriLankan Holidays
collaborates with many leading hotels, tour operators and other tourism related
organizations to give travelers a wide selection of holiday opportunities with an all-
inclusive concept, which includes customized packages. SriLankan Holidays won the
prestigious title of Best Outbound Tour Operator at the Presidential Awards for Travel
and Tourism in 2008 and in 2009. For information visit www.srilankan-holidays.com
SriLankan Air Taxi entered into a codeshare agreement with Cinnamon Air to provide
easy access to many picturesque locations across the country. With the new code share
agreement, all Cinnamon Air scheduled flights will operate with SriLankan Airlines’
designated flight numbers as well of those of Cinnamon Air (C7).

21
FlySmiLes, the frequent flyer programme of SriLankan Airlines, offers its members
an extensive range of benefits, with the Airline’s induction to the OneWorld airline
alliance in May 2014. FlySmilLes is made up of five tiers namely Platinum, Gold,
Classic, Silver and blue. FlySmiLes Club, the top tier frequent flyer categories,
comprised of Platinum, Classic and Gold, are matched with the corresponding
OneWorld top tiers. Together with OneWorld, FlySmiLes members can now enjoy
access to over 600 lounges in over 150 airports and connections to almost 1,000
destinations across the globe on any OneWorld member carrier while enjoying free
tickets, upgrades, lounge access, additional luggage allowances, pre-assigned seating
and priority confirmation when flying SriLankan. With its line-up of airline and non-
airline associates ranging from hospitality, retail and transportation partners,
FlySmiLes continues to reward its loyal customers with more opportunities to earn and
redeem miles.
Sri Lanka is a popular destination for business events in the South Asian region. The
airline has a separate department for MICE Tourism that works with local partners to
arrange many types of events.
SriLankan has a special focus on sports tourism and supports all major sporting events
in Sri Lanka. The airline also sponsors Surfing classics in Sri Lanka and the Maldives;
the International Rugby Sevens; the SriLankan Golf Classic in Sri Lanka; and co-
sponsors several events that focus arts and culture.
SriLankan’s IAA, caters to manpower requirements of airlines, airports, travel agents,
and other aviation industry organizations. It is accredited with the IATA, DGCA,
SLIM, University of Moratuwa and the TAASL.
The SriLankan Technical Training School, which is certified to the EASA 147
standard by the European aviation body, provides comprehensive basic and aircraft
type training for both internal engineers as well as external individuals. The aviation
authorities of Pakistan and the Maldives also accredit it.
The community development arm of the airline, SriLankan Cares actively participates
in fundraising and charity activities, with its focus being the empowerment of children.
SriLankan Cares has carried out major development projects in three rural schools in

22
the country, providing buildings and infrastructure such as classrooms, libraries, and
computer labs.
Following is the Vision and Mission of Sri Lankan Airlines Ltd.
Vision – To be the most preferred airline in Asia.
Mission – We are in the air transportation business and provide our customers
with a reliable and pleasant travel experience. We provide our business partners
with a variety of innovative, professional and mutually profitable services. We
meet Shareholder expectations of profitably marketing Sri Lanka and
contributing towards the well-being of Society. We are a competent, proactive
and diligent team. Our contribution is recognized and rewarded.
2.4.2 Corporate Organization Chart
Figure 2.3 shows the Sri Lankan Airlines Organization chart, which has a relative ly
flat structure.

23
2.4.3 Sri Lankan Services
2.4.3.1 Airport Services
SriLankan offer our customers all range of airport services as per the SGHA of 2008
January, published by IATA. We provide tailor made services to suit specific needs of
each of our customers offering all or a mix of the following services:
Aircraft maintenance
Aircraft servicing and cleaning
Airport aviation security
Cargo and mail handling (on-/off-airport)
Catering services
Flight operations and crew administration
Coordination of Fueling with relevant parties
Load control and communications
Passenger and baggage handling
Ramp services
Representation and accommodation
Station supervision and administration
Surface transport of passengers and crews
Unit Load Device control and management
Hotel accommodation and leisure activities
2.4.3.2 Engineering
For over thirty years, SriLankan Airlines Engineering has remained a consistent
benchmark in aircraft maintenance, providing the highest quality of maintenance
services with staff strength of 600 well-trained, highly qualified and dedicated
engineering staff, using state-of-the-art technology.
Figure 2.3 Organizationalchart of SriLankan airlines. Source: Srilankan Airlines Ltd (2016).

24
Sri Lankan today a provider of comprehensive aircraft maintenance services in the
region, under approval from Civil Aviation Authority of Sri Lanka, the European
Aviation Safety Agency and several other National Aviation Authorities. Strategica lly
located at the Colombo International Airport, company indeed a convenient and cost-
effective one-stop-shop for all your integrated aviation maintenance and engineer ing
needs.
Capabilities on Airframe, Engines, Component Maintenance and Inventory
Management, along with its international offices and line facilities are located in South
India and Male, enables us to provide line maintenance support at important locations
in the region and comprehensive base maintenance support in Colombo, right up to
8C/12Y maintenance.
2.4.3.4 Cargo
General Freight
SriLankan cargo has the most economical global distribution cargo service for general
freight. This service is available on all SriLankan Airlines flights. Registered users can
make reservations online. If passengers are not already registered, they may register
online or contact one of the SriLankan Cargo offices for further details.
On Board Courier
With On-board Courier customers get an extremely convenient and economical
method in transporting goods. The concept behind this product is to enable our
customers to collect their cargo from the passenger belt. However, this product would
perform differently from country to country due to local regulations.
Dangerous Goods
Handled only by specially trained staff in accordance with IATA laws and regulations,
SriLankan Airlines provides safe and secure movement for dangerous cargo items such
as explosives, radioactive materials, etc. They are constantly monitored while differe nt
loading procedures are followed in compliance with the prevailing internationa l
standards.

25
2.4.4 Catering
SriLankan Catering Limited is the sole airline caterer in Sri Lanka and launched in
1979 as a subsidiary of SriLankan Airlines. Its hub is at Bandaranaike Internationa l
Airport where it provides services for many of the world's finest airlines. Winner of
many awards in the global flight catering industry, SriLankan Catering’s main line of
business is in-flight catering to airlines that operate to BIA. It was recently awarded
the franchise through the year 2022 to be the exclusive provider of in-flight catering
for airlines at BIA, and also for food and beverage products at all of BIA’s restaurants
and lounges. Its state-of-the-art flight kitchen at BIA has a capacity of 25,000 meals
per day and it is one of the few airline caterers in the world to hold four global
certifications. The Company is currently diversifying its business operations into
following hospitality related fields:
Management of Serenediva Transit Hotel
Management of Semondu Restaurant
Operation of Aero Clean industrial laundry
Outdoor Catering operations (to be launched shortly)
2.5 Airline Service Delivery Process
2.5.1 Core Services
Core service is a reason why the company is in the market. For an airline this would
be transporting passengers or cargo. Transportation of passengers from A to B is the
core service of an air trip. Additional services may be offered before, during or after
the journey. These additional services allow to distinguish the homogeneous product
of an air trip from one competitor to another. However, the core service occupies a
superior position within the service chain. Punctuality, safety and comfortability are
main services delivered to passengers in airline business.
2.5.2 Augmented Services
Enhancing and facilitating services that the company provided to deliver the core
service. These services are used to increase the value of the service and/or to
26
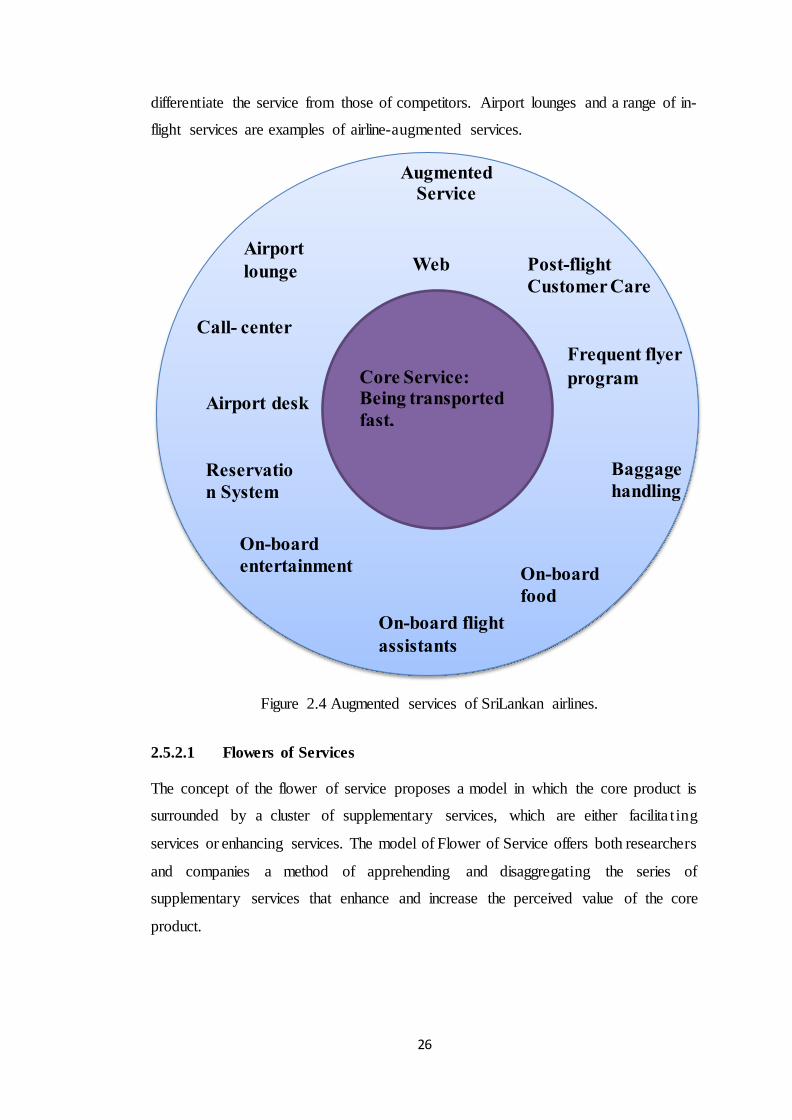
differentiate the service from those of competitors. Airport lounges and a range of in-
flight services are examples of airline-augmented services.
2.5.2.1 Flowers of Services
The concept of the flower of service proposes a model in which the core product is
surrounded by a cluster of supplementary services, which are either facilita t ing
services or enhancing services. The model of Flower of Service offers both researchers
and companies a method of apprehending and disaggregating the series of
supplementary services that enhance and increase the perceived value of the core
product.
Airport desk
Reservatio
n System
On-board
entertainment
On-board flight
assistants
On-board
food
Baggage
handling
Augmented Service
Airport
lounge
Call- center
Frequent flyer
program
Post-flight
Customer Care
Core Service: Being transported
fast, Safely and
Web site
Figure 2.4 Augmented services of SriLankan airlines.

27
Information
The process starts with the information gathering before attending the flight. It is very
important for the airline to advertise effectively to differentiate from the competitors
so that the customer can decide which airline brand to choose. When advertising it is
recommended to underline the features, services and competitive advantages of a
brand, as nowadays, being the airline industry in its maturity, many brands seem to be
similar in the eyes of the customer.
In recent years, so it is crucial to have a well-designed website that allows potential
customer to get a feeling of what experience the company is offering and not only to
compare prices and routes.
Consultation
When booking through a travel agent, it is important whether the agent knows about
the subject and is able to give the customer the information he/she needs. Price in travel
Facilitating Elements Enhancing Elements
Core
Information
Consultation
Order Taking
Hospitality
Safekeeping
Exceptions
Payment
Billing
Figure 2.5 Flowers of services at SriLankan.

28
agencies is higher than online so the customer expects the service, which he/she is
additionally paying for. Even if the Internet is a low contact channel people may expect
some form of consultation may be via email or through a specialized online chat. The
same applies to the call center, even though people might already know what they
want, the operator needs to be prepared to answer any specific question about the flight
or the before and after flight.
Order Taking
An online booking procedure, which is common in these days, is a convenient way for
the customer to make a reservation. It saves time and money. By the way, older or
uneducated people still have some problem in booking through the internet. In case a
problem appears while making an online booking or if the customer has a problem, the
effectiveness of a call center staff is crucial.
The availability of the customer service can be an important factor when a situation
like that appears. The customer service should be well informed about the products of
the company and well trained in order to react properly in different situations.
Hospitality
If there are any delays the flight, it is very important for the airline to provide
hospitality to the customer. For shorter delays airline gives vouchers to customers, so
they can use these during the waiting times to eat or drink in the restaurants/bars at the
airport. Furthermore, if there are longer delays and the customer has an overnight stay,
the airline usually has to provide for a suitable accommodation for the customer in a
hotel near the airport. Even if there are no delays, we must remember that the customer
probably has to wait about one hour at the airport so it is important that the services
cape is comfortable in order to minimize the impact of waiting time.
Safekeeping
Travelling by plane is made inconvenient for the customer by the several safety
procedures that people have to attend to before and after the flight. Moreover, with
recent concerns about terrorism the security procedures have become even stricter.
This has an effect on the waiting times and customers, especially if frequent flyers,

29
may be annoyed by this lengthy process. It is important that the ground staff is friendly
and patient both with experienced and inexperienced customers.
Exceptions
The airline has to be prepared in case there are customers who constitute an exception.
Exceptions may be handicapped customers, elderly people and babies who need
special accommodation. Exceptions can be made with food. Individual references may
be considered. Furthermore, there are exceptions, which can be made with luggage.
Billing
The billing procedures should be as clear but at the same time as easy as possible. The
online purchase of flights is very common lately. However, a high number of
customers are skill skeptical with reveling their bank details online, so it is very
important to design the billing procedures as clear and easy understandable as possible.
As for the brick and mortar agencies, the bill should be standardized in order to impose
consistency among the different independent agencies. Most of the time the price of
the ticket include almost all the extra like inboard food and entertainment while low
cost companies base their strategy on the separate bills where customers have to pay
for each extra service they ask for.
Payments
The payment for the ticket is usually done at the time of the reservation either via credit
card or, if done in agency, through cash or check. Payments may be asked from the
customer also after the ticket has been issued, for example, when the luggage exceeds
the allowance the customer has to pay certain amount because of maintenance reasons.
Every airline has restrictions when it comes to the luggage allowance. Furthermore,
there are certain items, which can be purchased during the flight, such as duty free
products. The customers also have the opportunity to purchase additional drinks such
as alcoholic beverages, which are not included with the meal. For all these in-flight
payments, it is important to give customers many options. Being the plane non-place
customers may expect to be able to pay with different currencies, as well as with major
credit cards.

30
2.6 Summary
This chapter reviewed current literature available in related with airline service process
steps including core and augmented services. Then moved to understand service
quality, IT service quality and IT service quality measurement frameworks with
company profile. Research was carried out based on this framework found in literature
survey and data was collated according to the indications mentioned in this framework.
In the next chapter research methodology, measures and measurements are described.

31
Chapter 3 - Research Methodology
This chapter presents the research methodology. It discusses the mix method approach
used to measure IT service quality delivered by the IT department of SriLankan.
Moreover, the approach used to identify the recommendations to enhance the quality
of IT services. Research method and approach is described in Section 3.1. Section
3.2describes how the measurement and measures in the framework are applied.
Section 3.4 explain about the research instrument for interviews and the sample
population is discussed in Section 3.5.
3. 1 Research Method and Approach
Figure 3.1 illustrates the research methodology used for study. Based on the data
collected from internal departments of SriLankan Airlines research problem was
identified. It was realized that continuous improvement of IT service quality is
required to be at least par with the competition. Before improving, it is important to
first understand the current state of IT service quality. Then based on the literature
review IT service quality framework by Marion Lepmets et al. (2013) was identified
as a suitable measure to assess the current state of IT service quality through
quantitative and qualitative measurements. This framework consists with six issue
areas as follows:
1. IT service quality
2. Information system quality
3. Process quality
4. Value of the IT service
5. Service behavior
6. Customer satisfaction
Under six common issue areas data were collected and relevant indicators were
calculated. Some of the indicators were eliminated based on company goals and
objectives. Data that were not available were ignored while calculating the indicators.
After calculating the quantitative indicators, those are compared with baseline values.
Intrinsic measures
Extrinsic measures

32
When applicable industry standard baseline values were considered. When such a
baseline does not exist, a suitable baseline was defined. Qualitative indicators were
also considered while measuring IT service quality. However, unavailability of data at
SriLankan airlines related to the some of the six issue areas did not allow the full
application of the IT service quality framework.
Then a set of interviews was conducted to identify key factors and relevant
recommendations to improve IT service quality. Ten managers were interviewed and
the interview findings were coded to identify key recommendations. Those
recommendations were then categorized according to the importance (as High,
Medium and Low), as well as resource, financial and knowledge requirements. As a
final step another three managers were interviewed to find out their views and ideas
regarding the suggested recommendations.
Initial Data
Collection
Research
Problem
Literature Review
IT Service Quality
Measurement Framework
Create Questioner
for Interviews
Set of
Recommendations
Validate Recommendations
Based on Interviews
Interviews
Figure 3.1 Research methodology.

33
3. 2 Assessment of IT Service Quality Using Framework
IT service quality measurement framework consists with six common issue areas as
mentioned in Section 3.2. Those six areas are further divides into 25 measurement
categories and sub-divided into 36 measures as shown in Table 3.1 to 3.4.
Indicator values are compared with target or baselines to measure IT service quality
delivered. Target values are defined by the company itself, according to the company
goals and objectives and extracted from monthly reports produced by cost centers in
IT department. If target or baseline values are not available derived those values from
already defined values. Those derived baselines are Incidents related to IT service
capacity, Incidents related to IT service performance, Incidents related to informatio n
confidentiality, Incidents related to information availability, Incidents RFCs &
problems handled daily. To calculate the baseline values, incidents received per month
was taken as 2,500, which is a company-defined target.

0
Table 3.1 – Quantitative intrinsic measures of IT service quality framework.
Common
Issue Area
Measurement
Category
Measure Indicator Target or Baseline
IT service
quality
IT service
availability
Maintainability Mean time to restore IT service after failure Availability of IT systems (Hosted)-99.50%
Availability of IT systems (On-premise)-99.50%
IT service
capacity
Capacity of
operational
services
Incidents related to IT service capacity < 10% of Target incidents received per month
(Target incidents received per month=2500)
Changes related to IT service capacity Target not defined
IT service
performance
Speed of
information
processing
Incidents related to IT service performance < 10% of Target incidents received per month
(Target incidents received per month=2500)
Changes related to IT service performance Target not defined
Information
security
Confidentiality Incidents related to information confidentiality < 3% of Target incidents received per month.
(Target incidents received per month=2500)
Changes related to information confidentiality Target not defined
Integrity Incidents related to information integrity Target not defined
Changes related to information integrity Not measured
Availability Incidents related to information availability <3% of Target incidents received per month.
(Target incidents received per month=2500)
Changes related to information availability Target not defined
IT service
reliability
Dependability Incidents, RFCs &problems handled daily No of incidents handled daily-(2500/30)
Mean time to achieve incident resolution IT Incident Resolution Rate -85%
IT service
continuity
Business impact
analysis
measures
Mean time to recovery Target not defined
Incidents related to IT service continuity
Target not defined

1
Common
Issue Area
Measurement
Category
Measure Indicator Target or Baseline
Changes related to IT service continuity Not measured
Monetary value
of IT service
Financial
measures
Price– actual price paid for received service Target not defined
Information
system
quality
Functional
correctness
Defects Defect density Target not defined
Portability Standards
compliance
Interface compliance validation Target not defined
Usability Problems and
Errors
No of prevented problems daily Target not defined
No of incidents related to problems daily Target not defined
Availability–
reliability–
maintainability
Time to Restore MTBSI – mean time between system incidents Target not defined
MTBF – mean time between system failures Target not defined
MTRS – mean time to restore system Target not defined
No of incidents resolved out of all incidents Incident Completion Rate -90%
Component
capacity
Performance of
technical
components
No of system failures related to component
performance
Target not defined
Capacity of
technical
components
No of system failures related to component capacity Target not defined
Scalability Growth without
business
disturbance
Incidents related to the speed of growth Target not defined
Process
performance
Process
effectiveness
Defect
containment
Requirements defects discovered after design phase Target not defined

2
Table 3.2 - Quantitative extrinsic measures of IT service quality.
Common
Issue Area
Measurement
Category
Measure Indicator Target or Baseline Value
Customer
satisfaction
Customer
feedback
Survey
results
Appearance of physical facilities, equipment, personnel
&communications material
Target not defined
IT service is provided dependably &accurately Target not defined
IT service provider is willing to help customers& provide prompt
service
Customer Satisfaction 70%
IT service provider conveys trust &confidence Target not defined
IT service provider provides caring, individualized attention Target not defined
Perception of IT service stability Perception of IS quality Target not defined
Perception of IT service processes’ performance Target not defined
Customer support Requests for
support
Total calls per day answered, abandoned Calls Abandoned – 10%
Calls Received - 9000
Average call response time Target not defined
Incidents handled daily by service desk Incident Completion Rate - 90%
Incidents Received - 2500
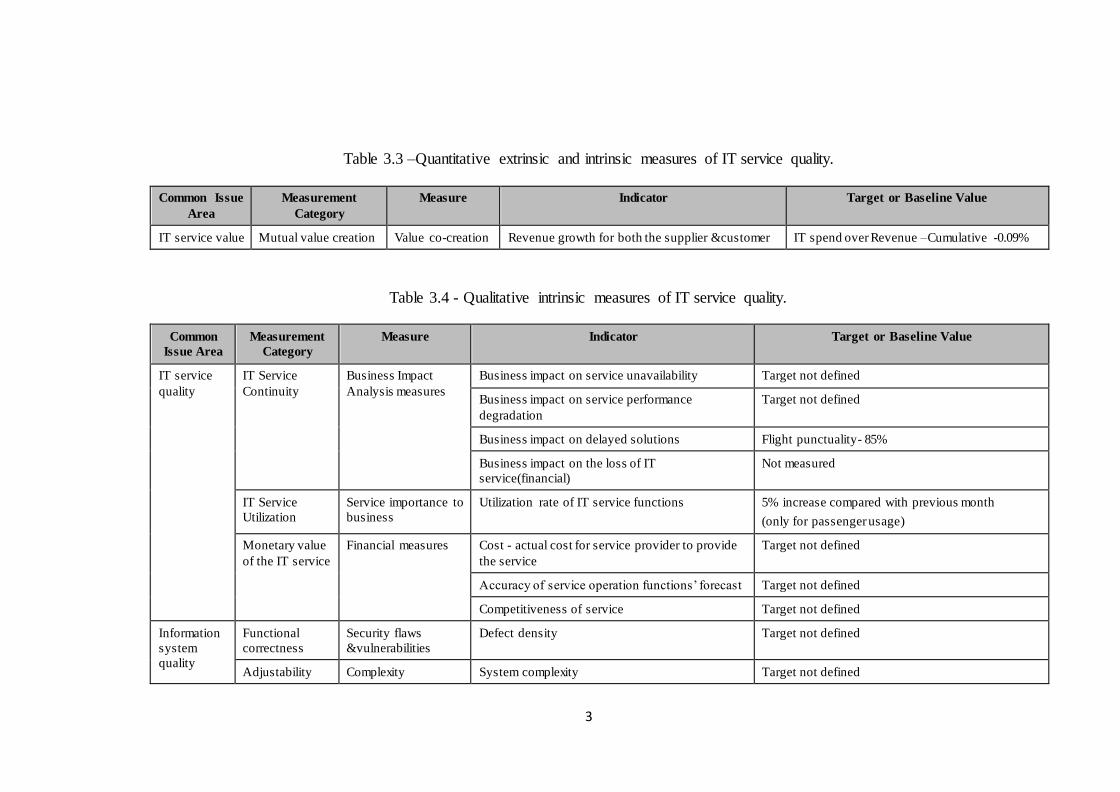
3
Table 3.3 –Quantitative extrinsic and intrinsic measures of IT service quality.
Common Issue
Area
Measurement
Category
Measure Indicator Target or Baseline Value
IT service value Mutual value creation Value co-creation Revenue growth for both the supplier &customer IT spend over Revenue –Cumulative -0.09%
Table 3.4 - Qualitative intrinsic measures of IT service quality.
Common
Issue Area
Measurement
Category
Measure Indicator Target or Baseline Value
IT service
quality
IT Service
Continuity
Business Impact
Analysis measures
Business impact on service unavailability Target not defined
Business impact on service performance
degradation
Target not defined
Business impact on delayed solutions Flight punctuality- 85%
Business impact on the loss of IT
service(financial)
Not measured
IT Service
Utilization
Service importance to
business
Utilization rate of IT service functions 5% increase compared with previous month
(only for passenger usage)
Monetary value
of the IT service
Financial measures Cost - actual cost for service provider to provide
the service
Target not defined
Accuracy of service operation functions’ forecast Target not defined
Competitiveness of service Target not defined
Information
system
quality
Functional
correctness
Security flaws
&vulnerabilities
Defect density Target not defined
Adjustability Complexity System complexity Target not defined

4
Common
Issue Area
Measurement
Category
Measure Indicator Target or Baseline Value
Business
customization
System adjustability Application enhancement(Change request-in-
house)-15
Process
performance
Process
compliance
Process audit findings Process audit results Target not defined
Reference model
rating
Process assessment results Target not defined
Organizational
compliance index
Process
efficiency
Productivity Historical vs. proposed &actual Target not defined
Process
effectiveness
Rework Rework effort Target not defined
Service
behavior
IT service
climate
IT service provider’s
employee survey
results on: Service
leadership
Work performance goals are regularly discussed
with employees
Target not defined
Employees know how provided service
contributes to better performance of clients
Target not defined
Best approaches to serve clients are discussed
regularly
Target not defined
Emphases of daily work are on providing
excellent service to clients
Target not defined
Service vision Effort is made by service provider to be a
respected partner to clients
Target not defined
Being flexible when dealing with clients’
perspectives
Target not defined
Frequent communication with clients Target not defined

5
Common
Issue Area
Measurement
Category
Measure Indicator Target or Baseline Value
Service evaluation Recognition and rewards given for providing
excellent client service
Target not defined
Evaluation of how clients were served was a part
of the most recent personal performance review
Target not defined
Customer service is an important criterion of
formal performance evaluation
Target not defined
Sustainabilit
y of a
service
system
Survey results Saturation &sustainability of resource quantity Target not defined
Resource quality–capability &reliability of
resource (education level &experience)
Target not defined
Resource sustainability to maintain certain level
of quality
Target not defined
Value Value
production
Waste Non-value added activities Target not defined
IT governance Business/IT strategic
alignment
IS audit results Pass

0
3. 3 Research Instrument for Interviews
Recommended actions to enhance the IT service quality was found out using a set of
interviews. The specific questioner is given in Appendix A. This questioner was
prepared based on the data collected initially from IT department and literature review
conducted. It mainly consists of three questions. Each main questions has a set of sub-
questions.
3. 4 Sample Population
Initial data collection was carried out based on random sampling of documents and
literature that were easier to find. Once the problem and research methodology were
finalized, data were then collected according to the indicators mentioned in IT service
quality framework. After that, selected sub-set of relevant managers and department
heads were interviewed to find the recommended actions to enhance the IT service
quality. Selected list of interviews are as follows:
1. Manager IT Projects & Systems Integration – IT Department
2. Manager IT Business Relations – IT Department
3. Manager IT Business Development & Agreements –IT Department
4. Manager Product Development – Marketing - Product Development
5. Flight Operations Manager (Punctuality Improvement)– Flight Operations
6. Airport Service Manager– Airport Service Delivery
7. Senior Manager Aircraft Engineering– Aircraft Engineering
8. Manager Promotions And Brand Management–Marketing - Corporate
Communications
9. Customer affairs Manager– Customer Affairs
10. Head of Service Delivery –Service Delivery Department
Then for the second round of interviews that were conducted to get feedback for the
identified recommendations and prioritize them, IT department head and two
managers were interviewed. Those interviewees are as follows:
1. Head of IT– IT Department
2. Manager IT Business Systems (Service Delivery, Flight Operations &
Engineering) – IT Department

1
3. Manager IT service desk– IT Department
3. 5 Summary
This chapter presented the research methodology used in the study. 36 indicators were
found out through literature review and those are tested in this study. Baseline values
defined by the company and industry standards are used to measure the IT service
quality. As a second phase, interviews were used as the method of data collection to
find out the recommended actions to enhance the IT service quality. Second round of
interviews were used to get industry expertise opinions regarding suggested
recommendations.
2
Chapter 4 - Data Analysis
This chapter analyses the data collected through monthly reports and questionna ire
based interviews. Section 4.1.1 analyzes values related to IT service quality framework
and Section 4.1.2 explains the prioritize recommendation list.
4. 1 Measurements of Quality Framework
Indicators are calculated to measure the overall IT service quality delivered by IT
department. Some of the relevant indicators are directly taken from the KPIs in various
reports such as monthly progress reports (For the month of February and March
in2016) produced by cost centers in IT department and monthly reports (For the month
of February and March in 2016) produced to present senior management team. Then
those values were compared with the baseline values from the industry and provided
by the company to measure the IT service quality.
While the IT service quality measurement framework consider six common issue
areas, according to the company goals and objectives only four areas are applicable
for SriLankan. Those are IT service quality, information system quality, customer
satisfaction and value of the IT service. Table 4.1 lists the basic characteristics required
to deliver a high quality service. Table 4.2 lists the quantitative intrinsic measures of
IT service quality. Quantitative intrinsic measures of Information system quality is
listed in Table 4.3. Table 4.4 lists the quantitative intrinsic measures of process
performance. Quantitative intrinsic measures of customer satisfaction is listed in Table
4.5. Table 4.6 lists the quantitative extrinsic and intrinsic measures of IT service value.
Qualitative intrinsic measures of IT service value is listed in Table 4.7. Table 4.8 lists
the qualitative intrinsic measures of information system quality. Qualitative intrins ic
measures of process performance is listed in Table 4.9. Table 4.10 lists the qualitat ive
intrinsic measures of service behavior and qualitative intrinsic measures of IT service
value is listed in Table 4.11. Based on these, it can be seen that the IT service quality

3
measures can only be applied to about 25% of the quantitative and qualitative measures
due to lack of data.
Table 4.1 – Characteristics of SriLankan Airlines Ltd.
Company Size Core Business Client Sector ITIL QMS
Large Airline Travel V3 ISO 9001:2008

0
Table 4.2 – Quantitative intrinsic measures of IT service quality.
Measurement
Category
Measure Indicator Mean Value Actual Target or Baseline
IT service
availability
Maintainability Mean time to restore IT
service after failure
Availability of IT systems (Hosted) 99.90% 99.50%
Availability of IT systems (On-premise) 99.90% 99.50%
IT service
capacity
Capacity of
operational
services
Incidents related to IT
service capacity
No of incidents related to service capacity
per month
143 250 (< 10% of Target
incidents received)
Changes related to IT
service capacity
Data not found
IT service
performance
Speed of
information
processing
Incidents related to IT
service performance
No of Incidents related to IT service
performance per month
507 250 (< 10% of Target
incidents received per month)
Changes related to IT
service performance
Data not found
Information
security
Confidentiality Incidents related to
information confidentiality
No of incidents related to information
confidentiality per month
455 75 (< 3% of Target incidents
received per month)
Changes related to
information confidentiality
Data not found
Integrity Incidents related to
information integrity
Data not found
Changes related to
information integrity
Data not found
Availability Incidents related to
information availability
No of Incidents related to information
availability per month
871 75 (< 3% of Target incidents
received per month)

1
Changes related to
information availability
Data not found
IT service
reliability
Dependability Incidents, RFCs and
problems handled daily
No of incidents handled daily 80 2500/30( Target incidents
received monthly2,500)
Mean time to achieve
incident resolution
IT Incident Resolution Rate 93% 85%
IT service
continuity
Business impact
analysis
Mean time to recovery Data not found
Incidents related to IT
service continuity
Data not found
Changes related to IT
service continuity
Data not found
Monetary
value of IT
services
Financial
measures
Price—actual price paid for
received service
Data not found

2
Table 4.3 –Quantitative intrinsic measures of Information system quality.
Measurement
Category
Measure Indicator Mean Value Actual Target or Baseline
Functional
correctness
Defects Defect density Data not found
Portability Standards
compliance
Interface compliance validation Data not found
Usability Problems and
Errors
Number of prevented problems daily Data not found
Number of incidents related to problems daily Data not found
Availability–
reliability–
maintainability
Time to Restore Mean time between system incidents Data not found
Mean time between system failures Data not found
Mean time to restore system Data not found
Number of incidents resolved out of all incidents Incident Completion Rate 94.4% 90%
Component
capacity
Performance of
technical
components
Number of system failures related to component
performance
Data not found
Capacity of
technical
components
Number of system failures related to component
capacity
Data not found
Scalability Growth without
business
disturbance
Incidents related to the speed of growth Data not found
Process
effectiveness
Defect
containment
Requirements defects discovered after design
phase
Data not found

3
Table 4.4 – Quantitative intrinsic measures of Process performance.
Measurement Category Measure Indicator Actual Mean Value Target or Baseline Value
Process effectiveness Defect containment Requirements defects discovered after design phase Data not found
Table 4.5 – Quantitative extrinsic measures of Customer satisfaction.
Measurement Category Measure Indicator Mean Value Actual Target or
Baseline
Customer feedback Survey
results
Appearance of physical facilities, equipment,
personnel and communications material
Data not found
IT service is provided dependably and
accurately
Data not found
IT service provider is willing to help
customers& provide prompt service
Customer Satisfaction 72% 70%
IT service provider conveys trust and
confidence
Data not found
IT service provider provides caring,
individualized attention
Data not found
Perception of IT service stability Perception
of IS quality
Data not found
Perception of IT service processes’
performance
Data not found
Customer support Requests
for support
Total calls per day answered, abandoned Calls Abandoned Calls
Received
11%
10608
10%
9000
Average call response time Data not found
Incidents handled daily by service desk Incident Completion Rate 94.3% 90%

4
Measurement Category Measure Indicator Mean Value Actual Target or
Baseline
Incidents Received 2670 2500
Table 4.6 – Quantitative extrinsic and intrinsic measures of IT service value.
Measurement
Category
Measure Indicator Mean Value Actual Target or Baseline
Mutual value
creation
Value co-
creation
Revenue growth for both the supplier & the
customer
IT spend over Revenue – Cumulative 0.07% 0.09%

5
Table 4.7 – Qualitative intrinsic measures of IT service quality.
Measurement
Category
Measure Indicator Mean Value Actual Target or Baseline
IT Service
Continuity
Business
Impact
Analysis
measures
Business impact on service
unavailability
Data not found
Business impact on service
performance degradation
Data not found
Business impact on delayed
solutions
Flight delay due to IT
Flight punctuality
3 delays per month
86%
(Flight punctuality- 85%)
Business impact on the loss
of IT service (financial)
Data not found
IT Service
Utilization
Service
importance
to business
Utilization rate of IT service
functions
Kiosk Check-in per month (Previous month)
Hand Held Device Check-in per month
(Previous month)
Mobile Check-in per month (Previous month)
Intranet usage per day (Previous month)
Received mails per month (Previous month)
Sent mails per month (Previous month)
15473 (14140)
3479 (1041)
180 (152)
1241 (1358)
886,442 (886,654)
482,849 (480,784)
5% increase compared
with previous month (only
for passenger usage)
Monetary
value of the IT
service
Financial
measures
Cost - actual cost for service
provider to provide the
service
Data not found
Accuracy of service
operation functions’ forecast
Data not found
Competitiveness of service Data not found

6
Table 4.8 – Qualitative intrinsic measures of Information system quality.
Measurement
Category
Measure Indicator Mean Value Actual Target or
Baseline
Functional
correctness
Security flaws
&vulnerabilities
Defect density Data not found
Adjustability Complexity System complexity Data not found
Business customization System
adjustability
Application enhancement(Change request-in-
house)
10 15
Table 4.9 – Qualitative intrinsic measures of Process performance.
Measurement Category Measure Indicator Actual Mean
Value
Target or
Baseline Value
Process compliance Process audit findings Process audit results Data not found
Reference model rating Process assessment results Data not found
Organizational compliance index Data not found
Process efficiency Productivity Historical vs. proposed and actual Data not found
Process effectiveness Rework Rework effort Data not found

7
Table 4.10 – Qualitative intrinsic measures of Service behavior.
Measurement Category Measure Indicator Actual Mean
Value
Target or
Baseline Value
IT service climate IT service provider’s
employee survey
results on: Service
leadership
Work performance goals are regularly discussed with
employees
Data not found
Employees know how the provided service contributes to
better performance of the clients
Data not found
Best approaches to serve clients are discussed regularly Data not found
Emphases of daily work are on providing excellent
service to clients
Data not found
Service vision Effort is made by the service provider to be a respected
partner to clients
Data not found
Being flexible when dealing with clients’ perspectives Data not found
Frequent communication with clients Data not found
Service evaluation Recognition and rewards given for providing excellent
client service
Data not found
Evaluation of how clients were served was a part of the
most recent personal performance review
Data not found
Customer service is an important criterion of formal
performance evaluation
Data not found
Survey results Saturation and sustainability of resource quantity Data not found
Resource quality–capability and reliability of resource
(education level and experience)
Data not found
Resource sustainability to maintain certain level of
quality
Data not found

8
Table 4.11 – Qualitative intrinsic measures of IT service value.
Measurement Category Measure Indicator Actual Mean Value Target or Baseline Value
Value production Waste Non-value added activities Data not found
IT governance Business/IT strategic alignment IS audit results Pass Pass
0
To determine IT service quality (see Table 4.2 and 4.7) IT service availability, IT
service capacity, IT service performance, information security, IT service reliability,
IT service continuity and IT service utilization were Measured. Among those
measurement categories IT service availability, IT service capacity, IT service
reliability, IT service continuity and IT service utilization are favorable as those
indicators comply with the company baselines and target values. Company expects 5%
increase on IT service utilization only from services which passenger are involves. It
cannot be expected from internal departments use services as number of employees
are increasing very slowly. However, as seen in Table 4.2, IT service performance
needs improvement as the target incidents received per month should be less than 250,
whereas the actual incidents received were 507 per month. Moreover, information
security also needs improvement those actual incidents received were 455 which is
above the target of 250.
For information systems’ quality incidents completion rate is a relevant KPI and it is
94.4%. This is higher than the target completion rate of 90 % (see Table 4.3). As seen
in Table 4.5Customer satisfaction is also a favorable factor as the actual KPI is 72%,
which is greater than the target of 70%.Incident completion rate 94.3% is also
favorable than the baseline of 90% although IT service desk is receiving 2,670
incidents per month which is higher than the target value of 2,500. Calls received is
much higher than the target where 10,608 calls were received per month while the
target is 9000. However, calls abandoned is 11%, which is not good as the target rate
is 10%.
Mutual value creation is also a favorable measurement category related to IT service
because IT spend over revenue cumulative value is 0.07%, which is less than the target
value of 0.09%. That means IT department’s revenue is higher than the target as IT
spend is a budgeted value defined with the start of financial year. Company complies
with the IT governance because successful completion of IS audits.
Process quality and service behavior were not measured because company is not very
much interested on those areas. Identified list of favorable factors and factors that need
improvements are listed in Table 4.12.

1
Table 4.12 – List of factors which are favorable and ones that need improvements.
Common Issue Area Favorable Factors Factors Needing
Improvements
IT service quality IT service availability, IT service
capacity, IT service reliability, IT
service continuity &IT service
utilization
IT service performance,
Information security
Information system quality Availability–reliability–maintainability
Customer satisfaction Customer feedback, Customer support
Value of the IT service Mutual value creation
4. 2 Recommendations
According to the Table 4.12, factors needing improvement are IT service performance
and information security. To improve the IT service performance it is recommended
to use ITIL and IT service management best practices for IT service performance
management such as clearly establish performance goals related to the delivery of IT
service across all channels (IT service desk, field team, etc.), and communicate them
to all key stakeholders, improve visibility into service performance, and more
accurately measure progress towards defined objectives and strictly adhere to service
level agreements (Samanagecom, 2016). In addition to that, value-based management
and balance scorecard approaches can be used to specifically measure the IT service
performance in various aspects (Praeg and Schnabel, 2006).
Practice Standard of Good Practice for Information Security to enhance the
information security factor. Some of the best practices are enable compliance with
major information security related standards and form a basis for policies, standards
and procedures (Securityforumorg, 2016).
Interview data are coded using MAXQDA software (Maxqda, 2016) to find out the
recommended action to enhance the quality of service delivered and those are
categorized according to the impact as high, medium and low. Moreover, resources,
financial and knowledge requirements are also analyzed. After coding the interview
results a list of recommendations were derived. Those recommendations are listed in
Table 4.13. Those recommendations are also prioritized according to the required

2
resources, financial support and/or knowledge required to implement those
recommendations, as well as business impact. Depending on the business impact of
the recommendations, they are ranked from low to high impact. If Sri Lankan can
implement or carry out below recommendations, it could compete with other
international airlines by providing a high quality IT service to the passengers as well
as internal departments of the company.

0
Table 4.13–List of recommendations.
Priority
No*
Recommendation Impact Resource,
Financial ,
and/or
Knowledge
Requirement
Common Issue
Area
H-1 Notify passengers via SMS
If the flight delay is known in advance, notify passengers about the delay via SMS.
For already delayed flights airline prove hotel facility to certain passengers. In those cases, also
send the updates related to next flights and delay status . For this, passengers’ mobile numbers are
required. While passengers doing online reservations enter their number, offline reservation agents
are putting their number instead of customers. Therefore, need to verify and make sure that the
passengers’ mobile no are insert at the check in
High Low
Customer
satisfaction
H-2 Notify baggage loading status to customer via SMS
Baggage loading: When baggage are loaded to aircraft at the origin (only in Colombo) notify
passengers via SMS.
o BRS system can send SMS to pax that his/her bag is loaded to the correct flight. As DCS
system transfer relevant data to BRS system. That means passenger details with bags. BRS
has the data which bags are loaded or not
High Medium
Customer
satisfaction
H-3 Enhance IT services in operationally critical areas
Enhance IT services provided for operationally critical areas such as engineering, flight ops, airport
and ramp as they directly deal with core business.
o Provide dedicated IT field team to attend faults in those areas.
Provide speedy and reliable Internet facility and PC’s and continuously monitors those services.
High
Medium
IT service quality
H-4 Implement IATA self-service fast travel initiatives.
Implement six areas of IATA self-service fast travel initiatives.
o Check-in-Already implemented (Automated Kiosk, Web or Mobile)
High
High
Process
performance &
Customer
satisfaction

1
Priority
No*
Recommendation Impact Resource,
Financial ,
and/or
Knowledge
Requirement
Common Issue
Area
o Bags ready to go - Self-tagging and Fast Baggage Drop off (one counter available). Self-
tagging is available now with Kiosk. Adding weight is at the counter.
o Document check - Only the passport, not the ID cards, Driving licenses
o Flight rebooking - In case of disruption( Cancellation or delay)
o Self-boarding
o Bag recovery
H-5 Partner with other airlines on IT services
o Mega carriers and small airlines are working together rather than competing with one another
by sharing IT knowledge know how when coupling each other systems.
High High
Information
system quality &
Customer
satisfaction
M-1 Introduce social media for marketing
Introduce social media (Facebook and Twitter) to advertise and market new airfares, promotions
and company updates.
Medium Low Customer
satisfaction
M-2 Co-operate web site enhancements
Enhancements to co-operate web site:
o Increase performance by reducing loading time
o Introduce site Map
o Introduce web responsive design
o Multilingual support for major languages
o Ease of accessibility
o User friendliness
o Enable Google analytics to co-operate web site.
Medium Low
IT service quality
& Customer
satisfaction
M-3 Enhance online feed-back system Medium Low Information
system quality &

2
Priority
No*
Recommendation Impact Resource,
Financial ,
and/or
Knowledge
Requirement
Common Issue
Area
Enhance (more user friendly and mobile version) SriLankan passenger online feed-back system
(as there is a paper version- passenger feed-back forms with magazines are available )
Evaluation categories
o Airport services, Inflight services, Post flight services, Point of contact, Comfort
Customer
satisfaction
M-4 Develop and enhance bar –consumption monitoring system
Develop and enhance current systems to provide better measurements about items loaded to the
flight with the help of CRM system.
o E.g., Provide a better bar –consumption monitoring system, so it could reduce the weight of
the aircraft and loads with required items (rather than just loading previously load foods and
liquor)
Medium Low Information
system quality, IT
service value &
Customer
satisfaction
M-5 Install CCTV cameras for all the belts
We are being rated as a company that is losing passenger bags or damaging. So to outcompete it
they support to install the CCTV cameras for all the belts in arrival and continuously monitor and
display monitors of sceneries and provide report when required .
o Then passengers are fear to do stealing by seeing the CCTV camera photos captured through
large monitors and track the passenger who is doing so intentionally
Medium Medium Customer
satisfaction
L-1 Provide IT know how and domain knowledge to internal departments
Since company has an idea to expand and capture Maintenance Repair and Overhaul (MRO)
business, deploy (either purchase or develop) a MRO system which caters all engineering
requirements (Current system has data issues and lot of problems)
So provide IT know how and domain knowledge as well as previous system IT related issues when
engineering department required.
Low Low Customer
satisfaction
L-2 Develop online CD –DVD library system Low Low Information
system
quality &

3
Priority
No*
Recommendation Impact Resource,
Financial ,
and/or
Knowledge
Requirement
Common Issue
Area
Now we have the latest IFE systems in our aircrafts and oldest one is built in year 2011. To enhance
the customer satisfaction develop online CD –DVD library system for the in-flight services.
Customer
satisfaction
L-3 To aware what exactly happening in the market
Competition is everything. Especially in terms of sales. So get the help of IT to be aware of what
exactly happening in the market with the competition and to have a good market /business
intelligence
Low Medium IT
service
value
* H – high, M – Medium, and L – Low priority

0
Chapter 5 – Conclusion and Recommendations
This chapter discuss the conclusion and recommendations based on the research
findings. Section 5.1describes the evaluation of the research objectives. Section 5.2
presents an analysis of recommendation. Sections 5.3 presents the limitations and
future directions respectively.
5. 1 Evaluation of Research Objectives
Based on IT service quality measurement framework by Lepmets et al. (2013)
following measurement categories are evaluated; IT service quality, information
system quality, customer satisfaction and value of the IT service except process quality
and service behavior. Following factors were identified as Favorable:
IT service quality: IT service availability, IT service capacity, IT service
reliability, IT service continuity and IT service utilization
Information system quality: Availability, reliability and maintainability
Customer satisfaction: Customer feedback, Customer support
Value of the IT service: Mutual value creation
Based on the framework it was further identified that the following factors need
improvements:
IT service quality: IT service performance, Information security
After conducting interview based questioner set of recommendations are derived to
enhance the IT service delivery to par with or go beyond other international airlines.
Second level analysis was done and it is described in Section 5.3. Therefore, this
research achieve the objectives that were outlines in Section 1.3. While specific
recommendations are discussed next in detail, study also experienced a set of
limitations mainly due to lack of relevant data. Those issues are further discussed in
subsequent sections.

1
5. 2 Analysis of Recommendation
Priority No: H-1 – Notify Passengers via SMS
This is a service expectation and most of the airline are providing this service.
Passengers prefer to have flight status on their mobile. Preferably, they need SMS
notification. Considering global trend 97% of travelers use their mobile while
travelling. Out of that 97% more than 60% passengers have smart phones. People
prefer to have push notifications (IATA, 2016). Therefore, This concern can be address
in three ways:
1. Encourage Sri Lankan Airline’s passengers to use SriLankan Airline’s mobile
app. Because it pops up all flight related information, which is very much
important for passengers. Via the app flight delays, flight changes, equipment
changes, climate changes and all these information could be notified.
2. The second option is for those who do not have Sri Lankan Airlines mobile
app. For them the solution can be Short Message Service (SMS), if passenger
mobile numbers are known. Moreover, automated notification about flight
delays also can be also sent.
3. Notify flight delays through emails to fly smiles members.
One complexity that company need to address is that the passengers who do
reservations through agents. Agents do not pass passengers personal information to the
airline. Therefore, request can be made from passengers, that there is online page
where they can register for reservations by themselves, if passengers want to get
additional preferred services about onboard catering, or may be online notifica t ion
about SriLankan Airlines services and operations, they can put their PNR and other
relevant information and get registered. Those who are doing this will automatica l ly
get the notification.
Priority No: H-2–Notify baggage loading status to customer via SMS
If this technical solution is provided passengers do not have to wait until destination
to realize whether their baggage is loaded or not. This status could be notified through
SMS to passengers. In cases of an unbounded baggage, they could notify the airline

2
staff to take promptly actions. This solution has a limitation, as all foreign passenger’s
mobile connections may not be international roaming enabled.
Priority No: H-3– Enhance IT services in operationally critical areas
From IT point of view, Technology can basically help to address this demand, because
if company has a proactive service monitoring setup in operational areas, IT team
could see whether there is any service disruptions. For example, if network condition
in engineering side can be monitored, no one need to be there all the time to attend to
issues. From the backend one can see how the engineering network behaves. If there
is any network related bottlenecks, rather than waiting until the user finds the issue can
be fixed from the back end. This can be done in a very productive manner and without
having a dedicated IT team for that.
This is the demand, as the engineering division want an IT service they prefer to have
a dedicated IT staff. However, going forward, to optimize the resources in IT, a pool
can be created, and enable that pool to work in anywhere. However, for a second-level
escalation, such as changing a router or change in an application, can be channeled
through the backend engineers. But IT department may not be able to dedicate one
staff to an individual division, and expert pool can give a solution.
Therefore, it is recommended that the Network Operation Center, service desk and
Data center will proactively monitor the operational issues in Engineering and other
key operational areas on a 24×7 basis. A common pool of staff and special attention
will be given to engineering and other business critical areas.
IT department should focus on the quality of the service that offer than the number of
staff members allocated for various services given that the minimum required number
of staff is allocated. Consider Printer cost as against the flight delay cost. For example,
flight crew may not get the list of passenger delaying on time departure. For the cost
of this single delay, 10 to 15 printers can be bought. Hence, it is more important to
reduce service interruptions by having the required level of redundancy. Hence, it is
essential to have a reliable and robust setup with sufficient backup. If one printer fails,
at least there should be another printer to do the same job. So single point of failure
should be minimized. Solutions should be designed in such a way that means almost

3
zero downtime. SriLankan SAN environment, backend data center environment, all
are specifically designed for zero downtime.
Priority No: H-4– Implement IATA self-service fast travel initiatives
SriLankan has initiated IT driven solution to implement IATA standards on
Simplifying the Business (STB), where some of the six areas of IATA self-service fast
travel initiatives are already implemented while others need to be implemented and/or
expanded.
Check-in-Already implemented (Automated Kiosk, Web or Mobile)–One of
that initiative is Self-Service KIOSK. Company has already implemented
self-service KIOSK at Katunayake, Paris, Frankfurt, Chennai and two other
airports. As a result, SriLankan is able to cut down check in time. Also, it is
a customer centric service where company is able to increase the customer
satisfaction during their journey. Not only self-check-in service but also
company has introduced hand-held checking machines, where the agent can
do checking using a tablet. The tablet is attached to a Bluetooth printer. If the
passengers are lined up in a queue, the agent can go to the passenger and
request the passport and it can be scanned and swiped on the hand-held device
and here and there you can make passengers check in. It has also contributed
to increase the passenger satisfaction in Colombo Airport.
These Initiatives have helped the airline to cut down the total cost of
passenger handling. Especially in Paris, CDG Airport. The station manager
in Paris confirmed that they are in the process of removing one counter saving
huge amount of money. About 60% of Paris passengers are now using KIOSK
for self-check in. While introducing these services one of the key challenge
to address is how to maintain these solutions. Company has to provide 24×7
service. Thus, right now at Colombo Airport self-check in and passport travel
checking and all check in mechanisms are being monitored by service desk
and our dedicated departure control assistance Staff. This service is to be
expanded to other airports. From the services point of view IT department
considers this as a mission critical service and hence provided a high
monitoring and a critical attention of this service management.

4
Bags ready to go (self-tagging and fast baggage drop off)–Recently company
implemented self-bag tag option in Colombo whereas already implemented
this in Paris three months ago. So now, the passengers do not need to go to
counters to tag bags, as it is provided with KIOSK. So now Self-tagging is
available with kiosk but adding weight is at the counter.
Document Checking – This is also provided with the check in. Because
passenger can swipe their passport in kiosk machine, they can get advance
passenger information. That information is captured in the departure control
system and then they can see whether this passenger has all the passport
compliances. However, currently SriLankan do not have ID and Driving
license scanners. If company has a national-wide, global digitalization or
unique identification, IT can implement them in self-service options.
Flight Rebooking – Currently sales and rebooking are not allowed with kiosk.
These features are already available in mobile app and online app. The
features like Flight rebooking, flight changes cancellations are enabled in
mobile app and online check in. This is called Manage Your Booking. Going
forward, passengers may prefer to use their mobile for reservation, date
changes and even for bordering than kiosks. Therefore, the “Mobile
Bordering Card” is necessary at Colombo Airport. Once it is implemented
company can cover the full passenger journey.
Bag recovery – Bag recovery can be a feature in mobile app where it can alert
passengers on bag status. If SriLankan want to get any disruption or the
mishandling of a baggage such notification can be push to the passenger’s
mobile.
Self-boarding – Systems are ready for mobile boarding card but not
authorized yet by immigration and airport authority.
Priority No: H-5–Partner with other airlines on IT services
This is about Alliances. The classic example is “One World Alliance. As a member,
the company has one world alliance membership with key airlines like American and
British Airways. Generally, it is a win-win situation. So being a member of one world
alliance, company can support the alliance activities in this region. Those who are

5
having loyalty membership in other airlines can get the benefits from SriLankan
Airlines Loyalty management program. It could happen in vice versa as well.
IT could help here while integrating with other systems in One World Alliance, where
company developed a common data hub. Common data hub is connecting SriLankan
Airlines Frequent Flyer Program (FFP) database into OneWorld common data hub.
For example, a fly-smiles member could redeem any services from American Airlines
when he/she is travelling to Los Angeles. Such integrations enable many such benefits
to passengers while increasing the loyalty to the airline.
If company knows better than its competitor, company can be at least one-step ahead.
If the company can track the competitor activities and can track the global traveler’s
profiles, it is in a better position to do their marketing. Therefore, when planning the
next summer marketing by now, if company knows the potential travelers who visits
this part of the world, it can easily tap them and introduce Sri Lanka. Therefore, that
company can get that passenger base to Sri Lanka from transit points like Doha and
Dubai. Likewise, company can do strategic and tactical marketing by using a
comprehensive database of passengers. This is where the CRM also involve. However,
even with or without CRM, if you know the passenger profile of this part of the world
that will be beneficial.
Priority No: M-1– Introduce social media for marketing
Social Media has become a world trend now. How airline should use social media is
mainly comes under marketing. It means whenever you get a special offer or a
promotion during any season social media should talk about it. Especially the younger
generation travels together as a group. Hence, spread of such messages is very
important to attract a larger customer base.
So if company can incorporate SriLankan Airlines IBE in Social media like Facebook,
Twitter, that is always better. Simply it says if anyone log into a Social media he or
she should be able to do a booking through that account rather than visiting again to
the SriLankan website. Some airlines have already stared this procedure and for that,
all the redirections and navigations should happen with in the social media. Moreover,

6
the company has to make flight availability, flight charts and display and all booking
related information should be there in the social media. If there is every information,
more interaction will be there. More interactions lead to more bookings. It is clear that
social media should be a part of sales channels and company has to capitalize on it.
Hence, SriLankan need to make sure www.srilankan.com’s booking engine is available
for bookings through Facebook Twitter.
IATA has predicted that next two to four years the passenger growth will be increased
in this part of the world (IATA, 2016). Therefore, you could see many travelers in Asia
pacific, China, Singapore and India. SriLankan can benefit from this opportunity.
Competitively company has lot of advantages, strategically it is also advantageous,
and tactically you can do lots of marketing using social media.
Priority No: M-2– Co-operate web site enhancements
Company’s main focus is to improve sales channels. Especially in the airline sector
web is the most powerful tool. Most important things is, if company increases direct
sales that will definitely reduce GDS cost. GDS cost is a one of major cost component
in airline structure. GDS cost means backend cost that company pay for inventory
holders like ABACUS, AMADEUS, and GALELIO. More the company improve
direct sales more revenue or more yield that comes to the airline. This is strategica lly
very important aspect that is considered by SriLankan IT as well. Recently IT
department has took the responsibility for in house development of SriLankan website.
Consequently, the company is now more focused than ever before. So most important
is how IT should improve the performance of Srilankan.com loading time. For that, IT
team has initiated an infrastructure solution empowered with a Content Delivery
Network (CDN).So even though company main site is located in Colombo, IT
department will be setting up mirror sites in Singapore, America, Europe and all these
continents. Hence, the visitors who are coming from those areas will get a richer
experience. IT department is also in the process of introducing multi- lingual support.
Based on Google altitudes, IT department has identified that most visitors come from
Sri Lanka, India, far and middle east. Hence, the company cannot support English as

7
the only language. Currently company is already supporting Chinese, French and
Arabic. Introduce Sinhala and Tamil language also to support to co-operate website.
To select the language there should be mechanisms, e.g., show county flag aside.
Another important fact is the product will become no use if it is not user friendly.
Therefore, a user-friendly design is necessary. That is the very reason why company
is worrying about certain navigations. The entire website is to be revamped with the
new structure, identifying industry best technology to do transaction and simplif ied
navigation.
Company has also taken lots of feedback from visitors where they can find the
difficulties in making transactions. Many questions are being asked from the visitors
and now incorporating them in the new revamping project.
Another thing is look to book ratio in srilankan.com. If you analysis the look-to-book
ratio, there are lots of looks but only a few bookings. This means either customer visit
SriLankan web only to see the prices but they do not do any ticketing through the Web.
It is important to identify the reason. Perhaps most of them would have attempted to
do the booking but bookings were failed due to whatever the reason. Therefore, that
has to be investigated. The other thing is if you look at from the regional point of view,
in Sri Lankan and Indian customers visit the website to get current information (new
fares) and they are not actually travelers. There is a percentage of that kind of visitors
but SriLankan is in par with the industry standards when it comes to look-to-book
ratio.
So the web site should be intelligent enough to understand who is checking the web
site and for what purpose. For example, if you see a large number of look-ups from
India during the Diwali season, company has to identify whether there is a real need
for them. Then customize the approach and as well as give better offers to those
customers during the season.
Another aspect is the web presence of SriLankan Airlines. Take Emirates for example.
They have published their web site everywhere in the world. Even in a cricket match,
you can see their website published. Because that is the number one single point of
contact for their airline. So similar to that srilankan.com should be a very popular web

8
site within the travel community. This could be achieved through better web presence
coupled with better marketing and e-commerce. What IT can provide is the
technological support, the design, and the product concept, but commercial and the
marketing division should concern about the web promotion.
Company has the tools but question is are company really getting the maximum use of
them. While most tools are there it seems company is not using them effective ly.
Although UL is not flying to certain destinations, since company is an OneWorld
member, all the destination should available in co-operate website. For example, LON-
MAA and CMB-VIE are not available for reservation. That is a competitive dis-
advantage in SriLankan website compared to Emirates and Qatar airlines who provide
this.
Priority No: M-3– Enhance online feedback system
This is very important. Why SriLankan should take feedback from customer, because
they know about the airlines better than anyone does. Company has to understand what
their views are. So wherever make customer touch point, company should be able to
get their feedback. So if you look at SriLankan or travel map of any other airline they
interact with customers in many other phases, at the time of doing booking, check in,
on-board after departure if they want to get frequent flyer mileage, then they will
definitely interact with the airline. Therefore, whenever they interact with the airline,
company should be able to place whatever the mechanism to get their feedback.
Previously feedback was collated only using paper-based forms, now both online and
paper based options are available. The most important thing what SriLankan IT has
done is not only getting customer feedback but also recovery the effect that customer
had. Suppose if you have seen a kiosk next to your counter displaying rate our service
good or bad may be very bad or may be excellent. The moment you say very bad SMS
should generate and send to the duty manager there saying that so and so rated your
ticket office services are very bad. Therefore, duty manager can talk with that
passenger if available and apologize. It is called customer or passenger recovery. Still
company Electronic Customer Outlook has a privilege to pass that message to onboard
person saying that this passenger has rated SriLankan Airline services as very bad

9
please do recover this passenger. Therefore, if you are on board cabin manager or the
purser can come and apologize or give you some special service.
Priority No: M-4–Develop and enhance bar –consumption monitoring system
Currently, items loaded to the flights are not well planned. How technology can serve
this issue is recommend that the Customer Relationship Management is No1. Because
if flight-crew knows them, and their preferences, they can load their preferences well
in advance, then the customers do not need to request anything but the airline should
be ready enough of to accommodate the preferences through the CRM, without
disappointing the passengers onboard.
But even if company do not have a sophisticated CRM, also can do a successful
booking or ticketing, airline should be getting engage with the passenger or send an
email or notification of request for pre-ordering meal with an extra fare .This will also
increase upselling opportunities.
This increases the customer satisfaction towards the airline while increasing up selling
opportunities. Hence, the Recommendation is technology can use to communicate
with passengers to inform about pre-orders or special orders to improve up selling
opportunities.
Another important fact is if SriLankan can load only the required amount of food and
beverage actually company can save the cost. Because some people on-board they do
not eat, rather than carrying unnecessary load, if company knows what they really want
on board, can cut down this meal wastage and weight.
Priority No: M-5–Install CCTV cameras for all the belts
Damaging or mishandling baggage will critically is about the reputation of SriLankan
Airlines. So the reputation can be damaged if you do a lot of mishandling of baggage.
Any of Airline in the industry face this challenge. Because sometimes there’s nothing
to do with the airline, something beyond their control these could be occur while
transferring baggage from one place to another. How technology can support here is
again by giving some monitoring mention in recommendation like CCTV cameras.
10
When it comes to CCTV cameras, recently introduced cameras with” intelligent video
recording “feature. The company can use these cameras to handle baggage as
everything can be recorded by them and can be visible to passengers if they requested.
In most of the airports these services are welcomed.
Priority No: L-1– Provide IT know how and domain knowledge to internal
departments
IT department is not that big to develop MRO system to this airline. Company anyway
find a package solution to that. However, there also company has big value addition.
Here rather going for a new application, can identify what is really need (requirement).
Have company optimized the use of existing application and that is also a question to
be. Company still using only 70% of AURA capabilities. It is not the product that has
lot of issues it is the process that has not align with the product. For example, AURA
has a template to populate aircraft components and staff. Even for new aircraft people
do not use AURA to gather that. It is about technology adoption. Sri Lankan IT can
add this whole domain IT expertise to engineering saying that if you can make use of
AURA whatever the requisition allocation, inventory management, whatever the
modules then you can see a huge improvement or the traceability of your components.
There is a bit of argument saying that company wait until the last moment to order
aircraft equipment. By doing this company is incurring high expense. So need
enterprise planning solution. That means an ERP solution for MRO. Company
maximize the use of AURA is a question. How best company can address them with a
new version or new system like AMAOS, SOTRACKS. That again company has to
evaluate and see. Is company processes are ready to align with new system? That is a
whole transformation process that needs to carry out. Normally that sort of exercise
will take 2 years. In this you have to transfer data, map the processes and put up a new
system.
Priority No: L-2– Develop online CD –DVD library system
There are standard things like that IFE, which is called Media Kiosk. Now media kiosk
is nothing but it is a machine, which decimates which broadcasts all popular movies,
new telecasts everything. Some airlines are now in the process of setting up those
11
media kiosk in their languages. Assume business class passenger and he carries an
iPad. Passengers can get connected to the media kiosk online with a very strong
bandwidth. If passenger is intersected he can download most recent block busters and
movies on to his i-pad since he is waiting for the aircraft. That is given in addition to
what you get in the aircraft. Passengers can download those in to their iPad and it is
available in most of the airlines. Going forward, there are some media broad casters
onboard which is called the servers, you can broadcast media on to your personnel
devices. During that flight, it will be broadcasted. Therefore, when you are on board,
you can either switch on to your normal video channel or you are really go to that thing
and you can request it. Copyright is enabled for downloaded movies and songs
otherwise, they can watch those in anywhere else also.
Priority No: L-3– To aware what exactly happening in the market
It is important to know the customer base. For example, in winter and peak period,
company do not know whether it is filled capacity adequate, if company had filled
capacity, has filled capacity with most optimum yield which could collect that is also
something which company do not know. This kind of high-level good information can
be made available to decision makers or senior people. For example, if Narita flight is
fully booked, is company reach the breakeven point? Is company running this flight in
a profitable manner? Those things you have to find it in very generous way. Therefore,
BI is number one requirement. That is why company has started, once company won
an award for CIMA 2010 annual award, why company won this annual award.
Unblocking BI award Sri Lanka Airlines, commend by CIMA. IT department did that,
since company wanted to make big hype in BI. Need to make a BI team in IT, who
can make very dynamic and innovative results which showcase where company do not
perform, where do not capitalize.
Commercial department says they are very much empowered with the tools and
subscribe for everything that is required. However, the problem is still that has not
affected to company bottom line. Sometimes still IT department found there are some
lost opportunities. To check whether the company is on track, IT can provide trend
analysis for other user departments and IT can show case history and current
information to senior management to take decisions.

12
5. 3 Limitation and Future Work
5.3.1 Limitations
Although IT service quality measurement framework consists of six common issue
areas, only four out of those six were evaluated, as the data was not available.
According to the company goals and objectives, those areas are not relevant to the IT
department. Even for the four areas considered many data and KPIs were lacking.
Hence, this study make conclusions only in light of the available data. Moreover,
variety, experience and experience in the roles of interviewees might have provided
different perspectives to the responses.
5.3.2 Future Directions
Following are suggested as future research:
For a more comprehensive assessment is it recommend collecting some of the
key data and KPIs that are missing and then reevaluate the IT service quality
of SriLankan Airlines in the presence of additional data.
IT service quality was measured using IT service quality measurement
framework which is currently in the third iteration. In the next iteration, authors
plan to evaluate the framework in terms of utility and particular focus will be
set on finding out the reasons why some measures of the framework are not
collected. Hence, this research study is suggested to be continued with the new
iterations of the framework.
The alignment the business goals and the IT service quality measurement
objectives in industry could be studied and that could provide additiona l
support to the usage of the measurement framework.
Another potential area of research is the close follow up on how the proposed
recommendations were implemented, to what extents, and difficult ies
experienced in the process and reevaluate the IT service quality and its impact
to overall airline service quality.
13
REFERENCES
Airlineratings, (2016). Airline quality rating. Retrieved 7 April, 2016, from www.airlineratings.com
Askprocesscom. (2016). Askprocesscom. Retrieved 8 April, 2016, from http://www.askprocess.com/resources/articles/CMCrossroads/0610ITILQualityService.html
Ates S.S., and Kagniciolu C.H, (2013). Airline Service Process at Ataturk Airport: An Analysis of the Current Situation. International Journal of Business, Humanities and
Techno, 3(6)
Bazargan, M. (2004). Airline Operations and Scheduling. Hampshire: Ashgate,
Chen I.J., Gupta, A., and Rom. W., (1994) “A Study of Price and Quality in Service Operations”, International Journal of Service Industry Management, 5(2), 23-33
Chan, D. (2000b), “Beyond Singapore girl – grand and product/service differentia t ion strategies in the new millennium”, Journal of Management Development, Vol. 19 No. 6, pp. 515-42.
Crosby, P.B. (1979), Quality Is Free: The Art of Making Quality Certain, New American Library, New York, NY.
DeMoranville, C.W., and Bienstock. C. C., (2003). Question order effects in measuring service quality. International Journal of Research in Marketing, 20 217-231.
Diederiks, I., .H & Butler, M.A. (2006). an introduction to air law. Alphen and den
Rijn: Kluwer Law International
Eurocontrol. (2011a). Network Manager Annual Network Operations Report,
Bürüksel: Eurocontrol.
Feigenbaum, A.V. (1951), Quality Control: Principles, Practice and Administrat ion,
McGraw-Hill, New York, NY.
Flightstatscom. (2016). FlightStats. Retrieved 7 April, 2016, from http://www.flightstats.com/
Frost, F.A., and Kumar, M., (2001) “Service quality between internal customers and internal suppliers in an international airline” International Journal of Quality &
Reliability Management, 18(4), 371-386.
Gronroos, C. (1978), “A service oriented approach to marketing of services”,
European Journal of Marketing, Vol. 12 No. 8, pp. 588-601.

14
Gursoy, D., Chen, M.H., and Kim H. J., (2005)” The US airlines relative positioning based on attributes of service quality, Tourism Management, 26(1), 57-67
Hoffman, K. D., Bateson, John, E. G., (2001). Essentials of services marketing:
concepts, strategies, & cases. (2nd Ed.). South-Western:Thomson Learning,(Chap ter 12-13).
IATA. (2009). Dangerous Goods Regulations. Geneva: IATA publications.
IATA. (2011b). Airport Handling Manual. Geneva: IATA Publication.
Iata. (2016). Iataorg. Retrieved 22 April, 2016, from
http://www.iata.org/whatwedo/passenger/fast-travel/Pages/index.aspx
Jia, R., & Reich, B. H., (2011). IT service climate—an essential managerial tool to
improve client satisfaction with IT service quality. Information Systems Management, 28(2), 174–179.
Johnston, R., (1995) "The determinants of service quality: satisfiers and dissatisfie rs",
International Journal of Service Industry Management, 6 (5), 53-71
Juran, J.M., Gryna, F. and Bingham, R.S. (1974), Quality Control Handbook,
McGraw-Hill, New York, NY.
Kasper, H., Van, H. P., and De Vries, V. (1999), Services Marketing Management, John Wiley & Sons, New York, NY.
Lovelock, C. H., Wright, L. K., (1999). Principles of service marketing and management. New Jersey:Prentice-Hall,(Chapter 5).
Marion Lepmets et al. (2013). The Evaluation of the IT Service Quality Measurement Framework in Industry. Dundalk Institute of Technology.
Maxqda. (2016). the Art of Data Analysis. Retrieved 22 April, 2016, from
http://www.maxqda.com/
Parast, M. M., and Fini E.H., (2010) "The effect of productivity and quality on profitability in US airline industry: An empirical investigation", Managing Service
Quality, 20 (5), 458-474
Parasuraman, A., Berry, L.L. and Zeithaml, V.A. (1985), “A conceptual model of
service quality and its implications for future research”, Journal of Marketing, Vol. 49, autumn, pp. 41-50.
Parasuraman, A., Berry, L.L. and Zeithaml, V.A. (1988), “SERVQUAL: a multip le -
item scale for measuring consumer perceptions of service quality”, Journal of Retailing, Vol. 4 No. 1, pp. 12-37.

15
Parasuraman, A., Zeithaml, V.A., & Berry, L.L. (1991). Refinement and reassessment of the SERVQUAL scale.Journal of Retailing. 64(4), 420-450.
Polter, S., Verheijen, T., & van S. L., (2008). ISO/IEC 20000—an introduction (First
Edition, ITSM Library). Zaltbommel: VanHaren Publishing.
Praeg, C.L.A.U.S.-.P & Schnabel, U.L.R.I.C.H. (2006). IT-Service Cachet –
Managing IT-service performance and IT-service quality. Proceedings of the 39th Hawaii International Conference on System Sciences:
Rhoades, D. L., and Waguespack, B., (1999) "Better safe than service? The
relationship between service and safety quality in the US airline industry", Managing Service Quality, 9(6), 396-401
Rhoades D. L., Waguespack J, B., and Young, S., (2000) "Developing a quality index for US airports", Managing Service Quality, 10(4), 257- 262
Robledo, M.A., (2001),"Measuring and managing service quality: integrat ing
customer expectations", Managing Service Quality, 11(1) 22-31
Rhoades D., and Waguespack B, (2004), "Service and safety quality in US airlines :
pre- and post-September 11th", Managing Service Quality, 14 (4), 307-316
Rhoades D. L., and Waguespack J, B., (2000) " Service quality in the US airline industry: Variations in performance within airlines and between airlines and the
industry", Journal of Air Transport Management, 5(1), 60-77
Samanagecom. (2016). The Value of Service Performance Management. [Weblog].
Retrieved 17 May 2016, from https://blog.samanage.com/it-service-management/the-value-of-service-performance-management/
Securityforumorg. (2016). Information Security Forum. Retrieved 17 May, 2016, from
https://www.securityforum.org/tool/the-standard-of-good-practice-for- information-security/
SKYTRAX, (2016). Retrieved 7 April, 2016, from www.airlinequality.com
Slidesharenet. (2016). Slidesharenet. Retrieved 21 April, 2016, from
http://www.slideshare.net/cripoll/flower-of-service- in-a-restaurant
Srilankan Airlines Ltd, (2016). Organization chart. Retrieved 18 April, 2016, from
www.home.srilankan.com
Stevens, P., Knutson, B., & Patton, M. (1995). A tool for measuring service quality in
restaurants. Cornell Hotel and Restaurant Administration Quarterly, 36(2), 56 A tool: 10.1016/0010-8804(95)93844-K, http://dx.doi.org/10.1016/0010-8804 (95)93844-K

16
Tiernan S., Rhoades D., and Waguespack B, (2008),”Airline alliance service quality performance-An analysis of US and EU member airlines”, Journal of Air Transport Management, 14(2), 99-102
Tsaur, S.H., Chang, T.Y., and Chang, H.Y., (2002),”The evaluation of airline service quality by fuzzy MCDM”, Tourism Management, 23(2), 107-115
Janawade V. (2012). Consumer perceptions of service quality of complex services: An application to airline alliances. Paul Cezanne University, France, 5(4),
Wen, C.H., and Lai, S.C., (2010) “Latent class models of international air carrier
choice”, Transportation Research Part E 46, 211–221.

17
APPENDIX A – Questioner List
1. Should SriLankan Airlines be concerned about the competition?
a. If Yes – Why?
b. If No – Why?
2. Should SriLankan compete or even outcompete the competition?
a. If Yes
I. In, what areas should we compete & why (or what are the areas
to target)?
ii. What are the actions/steps we have taken so far to compete?
iii. What other ideas/actions/steps do you think we should
consider & why?
iv. What kind of the role do you believe IT can/should play in
these?
v. What challenges do you think we may face while competing or
trying out these ideas?
b. If No
I. Why do you believe we don’t need to compete?
ii. Then, how can we at least retain where we are today?
3. What is your envision for SriLankan in future? Where do you would like Sri
Lankan to be in another 3 – 5 years’ time?