Embed Size (px)
Citation preview

ENHANCING OPERATION OF THE EXISTING NATURAL GAS COMPRESSION INFRASTRUCTURE – PHASE I
2004 GMRC Gas Machinery Conference – October 4-6, 2004 – Albuquerque, New Mexico By:
Ralph E. Harris, Ph.D. Gary D. Bourn
Anthony J. Smalley, Ph.D. Southwest Research Institute®
ABSTRACT This paper presents results from the first phase of an investigation into methods to enhance operation of integral engine compressors in gas transmission service. The project is funded by the Department of Energy’s (DOE) Office of Fossil Energy and managed by the National Energy Technology Laboratory (NETL) as part of their Natural Gas Infrastructure Reliability Program, with co-funding from the Gas Machinery Research Council (GMRC) and PRC International (PRCI). A number of technologies and methods have been evaluated and compared with baseline data, including global air fuel ratio control, knock detection for timing control, oil temperature control, high pressure fuel injection, automated combustion balancing, rod load monitoring, and new procedures for combustion balancing in automated or manual systems. Field tests have been performed on an HBA-6T and two GMW10s in active pipeline service, with a suite of instrumentation (including fuel flow, dynamic pressure from all cylinders, lateral and torsional vibration, manifold dynamic pressures, crankshaft dynamic strain, and rod load). A number of evaluations are presented, including the influence on heat rate, compressor thermal efficiency, overall system efficiency, combustion stability, crankshaft integrity, frame vibration, and torsional vibration. Some promising methods are demonstrated and some significant performance benchmarks are set.
INTRODUCTION The gas transmission industry operates over 4,000 integral engine compressors, with a median age of 50 years, and a median size of 2,000 horsepower. In spite of their age, associated costs and logistics will inhibit wholesale replacement of these compressors. Growth in the US natural gas market to 30-TCF-plus must occur on the backs of this existing compression infrastructure, and depends on the continued integrity, enhanced capacity, efficient fuel conversion, and response to regulation of this large fleet of old engines. Technology options and solutions need to be cost effective. In October 2002, the Department of Energy’s (DOE) Office of Fossil Energy announced the award of Financial Assistance to Southwest Research Institute® (SwRI®) to fund a three-year project entitled: “Technologies to Enhance Operation of the Existing Natural Gas Compression Infrastructure”. The project, managed by the National Energy

2
Technology Laboratory (NETL), is co-funded by GMRC and PRCI, and forms part of DOE’s Natural Gas Infrastructure Reliability Program. The objective of the project is as follows:
To develop and substantiate methods for operating integral engine/compressors in gas pipeline service which reduce fuel consumption, increase capacity, and enhance mechanical integrity.
During the project, tests are planned at six different gas transmission sites. A suite of instruments have been assembled and a field data system has been designed to acquire (concurrently) the many channels of data involved, which include dynamically varying pressure in both power and compression cylinders. The data will be analyzed and hypotheses developed and evaluated for methods (technology options) to optimize operation and performance of these units. One emphasis of the project will be to view the integral engine/compressor unit as a system comprising an engine, a compressor, and a complex power transmission system between them. A topical report [1] has recently been prepared. This paper presents highlights from this report.
INSTRUMENTATION Central to the project and valuable technology in itself is the suite of instrumentation and associated data acquisition which has been assembled. The measurements taken during the tests include: • Power Cylinder Pressure (concurrent; all cylinders) • Compressor Cylinder Pressure (concurrent; all ends) • Dynamic Rod Load Variation • Crankshaft Strain Data Capture Module (SDCM) • Global Equivalence Ratio using UEGO Sensor • Instantaneous Rotational Velocity • Frame Vibration • Fuel Flow • Exhaust and Inlet Air Manifold Pressure • Knock Detection
INSTALLATION PHOTOGRAPHS Figures 1 presents the test installations for the second of two tests on an HBA-6T at El Paso Station 823 in Kinder, Louisiana. The four individual photos in this figure show the four compressor cylinders, the power cylinders, the back of the compressor frame, and the flow measurement system connected to the flange taps of the station fuel flow measurement.

3
Figure 1. Kinder HBA-6T for Second Test
Figure 2 presents the test installation on a GMW10 at Williams Station 40 (Sour Lake). This unit has been modified for high-pressure fuel injection (using Enginuity’s HPFI system), including addition of a turbocharger. The four individual photos in Figure 2 show one of the pressure transducers installed on the a power cylinder; an overview of one bank of power cylinders with high-pressure fuel injection installed; the exhaust manifold dynamic pressure transducer installed with water cooling; and the strain data capture module (SDCM) during the function of down-loading data, which is presently performed after each day’s testing. Figure 3 shows the turbocharger for the modified GMW10.

4
Figure 2. Williams Station 40; GMW10 with High-Pressure Fuel
Transducer
Figure 3. Turbocharger Added to GMW10 with High-Pressure Fuel Conversion, showing
Air Manifold Dynamic Pressure Transducer

5
Figure 4 presents the test installation on a GMW10 at Williams Station 60; this unit is scheduled for modification with high-pressure fuel injection (using Enginuity’s HPFI system), which includes the installation of a turbocharger to replace the flapper valve. The four individual photos show the three compressor cylinders, one bank of power cylinders, the power cylinder pressure transducer installation, and the rod load monitor (RLM) installation – this RLM is batter-powered, which is most convenient for short-term tests data gathering, but must be replaced with a self-powering capability for long-term monitoring.
Figure 4. Williams Station 60; GMW10 - Unmodified
RESULTS
TYPICAL DATA Figure 5 shows a typical set of pressure records with power cylinder data on the left and compressor cylinder data on the right. An obvious feature of the power cylinder data is wide variability from cylinder-to-cylinder; the compressor cylinders are more uniform in their peak pressure, but exhibit cylinder-to-cylinder variation in the waveforms during the

6
suction and discharge events - most likely as a result of pulsations. Figure 6 presents a typical strain data record. A 10-cycle snapshot is acquired in each record. This data is then analyzed for peak-to-peak cyclic variation.
Power Cylinder Pressures Compressor Cylinder Pressures Figure 5. HBA-6T Typical Power and Compressor Pressure Records
CYLINDER-TO-CYLINDER VARIABILITY Fuel supply, trapped air, and their ratio all vary from cylinder-to-cylinder. Figure 6 presents a set of waveforms for five cylinders on the HBA-6T from the first test series on this unit (problems were identified with the sixth trace, so it is not reproduced here). The pressure traces in Figure 7 result from averaging over a number of cycles to eliminate the effect of cycle-to-cycle variation. These time-averaged pressure traces re-emphasize the cylinder-to-cylinder variability in behavior. The cylinder-to-cylinder variability has two contributory causes and two associated features in the pressure traces: 1) air imbalance, and 2) fuel imbalance. Air imbalance is a difference in the air trapped in the individual cylinders, evidenced in the pressure traces by the variation in pressure before top dead center, and before heat has been released; such variability has been observed on all engines tested on this program, ranging in magnitude from 6 to 12%. This pressure before any influence of ignition is called compression pressure. Fuel imbalance causes the combustion process to vary from cylinder-to-cylinder and tends to be evidenced by the variation in peak-firing pressure (PFP), which Figure 6 clearly shows.

7
Figure 6. Typical 10 Cycles of Crank Strain Data from HBA-6T
Industry widely uses fuel adjustment to balance combustion, although the high cycle-to-cycle variation complicates this practice and limits the benefits of balancing, as will be discussed further. The most common method of combustion balancing seeks to equalize peak-firing pressures, but analysis with unequal trapped air [1] has shown that unequal fuel/air ratios can result. Figure 7 shows the summarized variation of compression pressure across the cylinders. Figure 8 includes both the magnitude of compression pressure averaged over a day’s testing, and the standard deviation over the same period. The first value in this 10-cylinder set is also suspect, but the variation in the other nine values is 6%. The standard deviation varies across the cylinders also, but its maximum value is quite small – 4.4 psi. As subsequent data will show, the standard deviation in peak-firing pressure is much higher – about 55 psi and over ten times the compression pressure variance. Interestingly in two successive day’s testing, with each day’s data separately processed for average and standard deviation, the quantities in Figure 8 were exactly duplicated for every cylinder, indicating very repeatable behavior in the variation of pressure prior to ignition.

8
Cylinder Pressure Traces04_16_2003_15_14_36_300
0
100
200
300
400
500
600
700
800
90 135 180 225 270
Crank Angle (degree)
Ave
rage
Cyl
inde
r Pre
ssur
e (p
sia)
Cyl #2 Cyl #3 Cyl #4 Cyl #5 Cyl #6
Engine Spread
Spreadcompressionpressure
Cylinder Pressure Traces04_16_2003_15_14_36_300
0
100
200
300
400
500
600
700
800
90 135 180 225 270
Crank Angle (degree)
Ave
rage
Cyl
inde
r Pre
ssur
e (p
sia)
Cyl #2 Cyl #3 Cyl #4 Cyl #5 Cyl #6
Engine Spread
Spreadcompressionpressure
Figure 7. Compression Pressure Spread; HBA-6T
180195 198 192
204195 202 199 200 194
3.3 3.1 2.9 4.4 3.5 3.7 2.9 3.0 2.9 2.80
50
100
150
200
250
1R 1L 2R 2L 3R 3L 4R 4L 5R 5L
Pres
sure
- PS
I
mean P20sdev p20
Figure 8. Compression Pressure; Average and Standard Deviation; Sour Lake
MANIFOLD DYNAMICS On all engines tested, the dynamic variation in inlet manifold pressure was measured and recorded. It was not always possible to measure the dynamic variation in exhaust manifold pressure, but at Williams Station 40, this data was successfully obtained on both inlet and exhaust manifold. Figure 9 presents the inlet and exhaust data for Station 40. It

9
shows the data both as waveforms in the upper pair of frame and as orders of running speed in the lower frames. Inlet pressure varies over one cycle from a low of 4.6 to a high of 5.7 psi - a range of 1.1 psi. Exhaust pressure varies from a low of 3.1 to a high of 5.9 psi - a range of 2.8 psi. Expressed as a percentage, it was found that inlet pressure dynamic variation was in the range 15 to 22%, and the exhaust pressure variation ranged from 47 to 71%. These measurements were made at a single location, and present the variation seen at that location. It is most logical to assume that these temporal variations are generated by acoustic response to dynamic excitation by the cylinder flows, and that the spatial variation along the length of the manifold has a similar range. Recognizing that the air flow into and out of any cylinder is driven by the differential between inlet and exhaust pressures, as seen by that cylinder while valves are open, it a reasonable further hypothesis that the trapped air mass could vary from cylinder-to-cylinder by a related percentage.
Air Manifold PressureAir Manifold Pressure Exhaust Manifold PressureExhaust Manifold Pressure Figure 9. Air and Exhaust Manifold; GMW10 with Turbo;
Time Wave (Top); Order Spectrum (Bottom)
Based on this hypothesis, controlling the dynamic variation in exhaust and inlet manifolds would be expected to reduce the magnitude of dynamic variation in airflow and in trapped air. It is recognized that there may be other contributors to compression pressure variation, but the extent of dynamic manifold pressure variation observed must dynamically change the effective boost, and thereby have a strong effect on trapped air. As with any hypothesis, this needs verification and, if verified, the feasibility of beneficial action to overcome the variation by modified manifold design should be investigated. This case has been made with strong support of pipeline company representatives, and a set of tasks directed at this validation and exploitation process on a laboratory engine has been initiated with co-funding by DOE, GMRC, and Cooper. It is hoped that these tasks will be completed early in calendar year 2005.

10
Part of the benefit of air balancing is to increase margins between operation and limits imposed by detonation and by misfire. Figure 10 illustrates this. If the different cylinders operate with a wide range of air fuel ratios because of air imbalance, some cylinders will operate close to the detonation limit, and some will operate close to the lean (misfire) limit. If all cylinders were air-balanced (had the same trapped air) and were balanced to the same peak-firing pressure, they would maximize these margins and allow more efficient, lower NOx, operation.
Figure 10. Engine Operating Map showing Lean Limit and Knock Limit Lines for
Spark Timing versus Equivalence Ratio
COMBUSTION PRESSURE RATIO (CPR) BALANCING As shown above, the cylinder-to-cylinder variation of compression pressures prior to the effects of ignition is a very repeatable unit characteristic. Thus, a balancing process which seeks to equalize peak-firing pressure tends to fight this characteristic variation. Adding extra fuel to cylinders with low compression pressures in order to make their peak-firing pressures match those of cylinders with higher compression pressure leads to a mismatch in air fuel ratio and, therefore, does not tend to achieve balanced combustion; the more the trapped air to the cylinders varies, the more the combustion will vary as a result of PFP balancing.

11
Simulations of combustion with mismatched fuel supply superimposed on mismatched air supply for the HBA-6T engine tested have helped identify a quantity referred to as combustion pressure ratio (CPR). This is the ratio for each cylinder of peak-firing pressure for that cylinder to compression pressure for that cylinder. The simulations were performed starting with a fixed 10% variation between highest and lowest supply of air (and, therefore, a 10% variation in cylinder compression pressure). The values of CPR for each cylinder were predicted for three different combinations of fuel supplied to each cylinder: • The amount required to give equal ratio of fuel to air in each cylinder. • 15% variation between minimum and maximum – arbitrarily distributed (unbalanced
case. • The amount required to make peak-firing pressure the same in each cylinder (PFP
balanced). Figure 11 shows the resulting distribution of CPR across the six cylinders. This shows that equal fuel to air ratio (i.e., equal equivalence ratios) for the assumed conditions cause the values of CPR for each cylinder to equalize. The arbitrarily distributed 15% variation causes arbitrarily unequal CPR values and (though not shown here) unbalanced peak-firing pressures. The CPR values for equal PFP show a uniform variation, which follows the variation in fuel to air ratio required to achieve this equality.
0
0.5
1
1.5
2
2.5
AF Balanced Unbalanced PFP balanced
Rat
io: P
FP/P
-Com
pres
sion
Figure 11. Engine Simulation Results; Effect of CPR and PFP Balancing for Six Cylinders
12
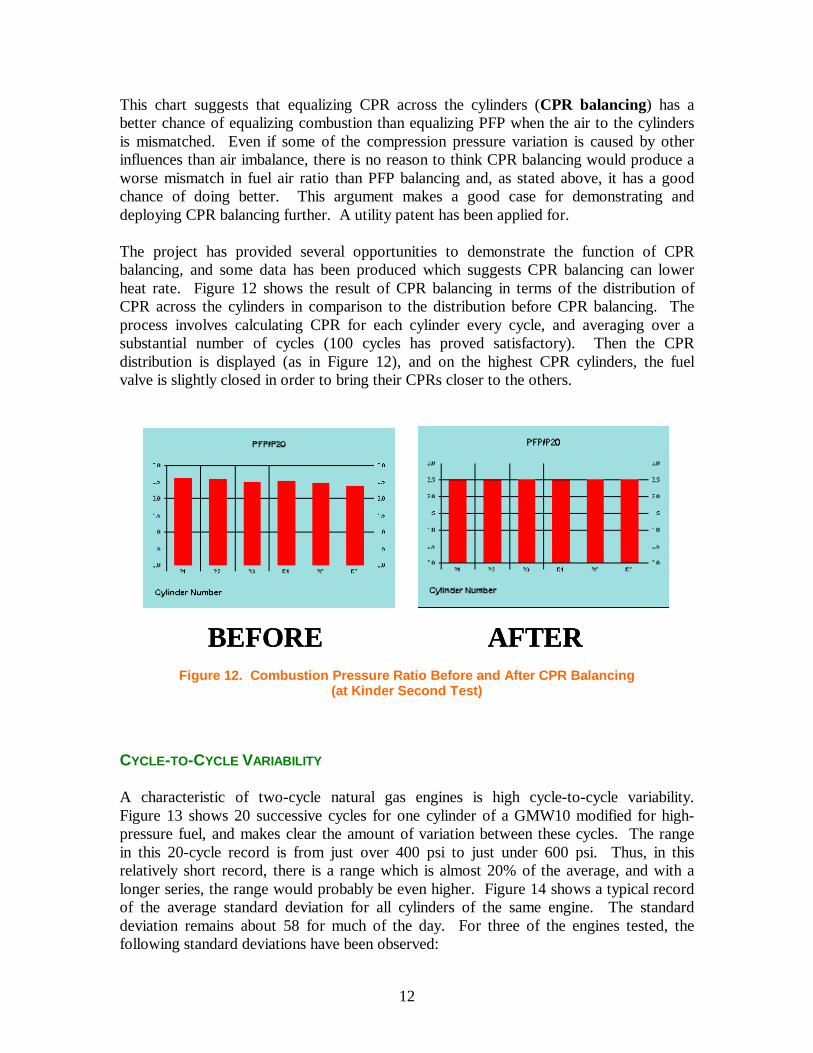
This chart suggests that equalizing CPR across the cylinders (CPR balancing) has a better chance of equalizing combustion than equalizing PFP when the air to the cylinders is mismatched. Even if some of the compression pressure variation is caused by other influences than air imbalance, there is no reason to think CPR balancing would produce a worse mismatch in fuel air ratio than PFP balancing and, as stated above, it has a good chance of doing better. This argument makes a good case for demonstrating and deploying CPR balancing further. A utility patent has been applied for. The project has provided several opportunities to demonstrate the function of CPR balancing, and some data has been produced which suggests CPR balancing can lower heat rate. Figure 12 shows the result of CPR balancing in terms of the distribution of CPR across the cylinders in comparison to the distribution before CPR balancing. The process involves calculating CPR for each cylinder every cycle, and averaging over a substantial number of cycles (100 cycles has proved satisfactory). Then the CPR distribution is displayed (as in Figure 12), and on the highest CPR cylinders, the fuel valve is slightly closed in order to bring their CPRs closer to the others.
BEFOREBEFORE AFTERAFTER
Figure 12. Combustion Pressure Ratio Before and After CPR Balancing (at Kinder Second Test)
CYCLE-TO-CYCLE VARIABILITY A characteristic of two-cycle natural gas engines is high cycle-to-cycle variability. Figure 13 shows 20 successive cycles for one cylinder of a GMW10 modified for high-pressure fuel, and makes clear the amount of variation between these cycles. The range in this 20-cycle record is from just over 400 psi to just under 600 psi. Thus, in this relatively short record, there is a range which is almost 20% of the average, and with a longer series, the range would probably be even higher. Figure 14 shows a typical record of the average standard deviation for all cylinders of the same engine. The standard deviation remains about 58 for much of the day. For three of the engines tested, the following standard deviations have been observed:

13
• GMW10 Modified for High-Pressure Fuel 58 psi for a 475 Mean PFP (12.2%) • GMW10 Unmodified 45 psi for a 600 Mean PFP (7.5%) • HBA-6T 65 psi for a 520 Mean PFP (12.5%)
0
100
200
300
400
500
600
700
142
384
512
6716
8921
1125
3329
5533
7737
9942
2146
4350
6554
8759
0963
3167
5371
7575
9780
1984
4188
6392
8597
0710
129
sample
psig
Figure 13. 20 Successive Cycles; Williams Station 40
Average Engine Power Cylinder Deviations - PSI - Turbocharged GMW10 - Sour lake
0.00
10.00
20.00
30.00
40.00
50.00
60.00
70.00
8:11
:35 A
M8:
49:2
6 AM
9:28
:38 A
M9:
54:3
7 AM
10:1
6:20
AM
10:3
8:27
AM
11:0
6:01
AM
11:2
7:11
AM
11:4
9:00
AM
12:1
1:44
PM
12:3
1:52
PM
12:5
2:01
PM
1:27
:10
PM1:
59:3
1 PM
time
Figure 14. Power Cylinder Cycle-to-Cycle Standard Deviation (psi); Sour Lake;
GMW10 Turbocharged (Over 10x Compression Pressure Deviation!)
14
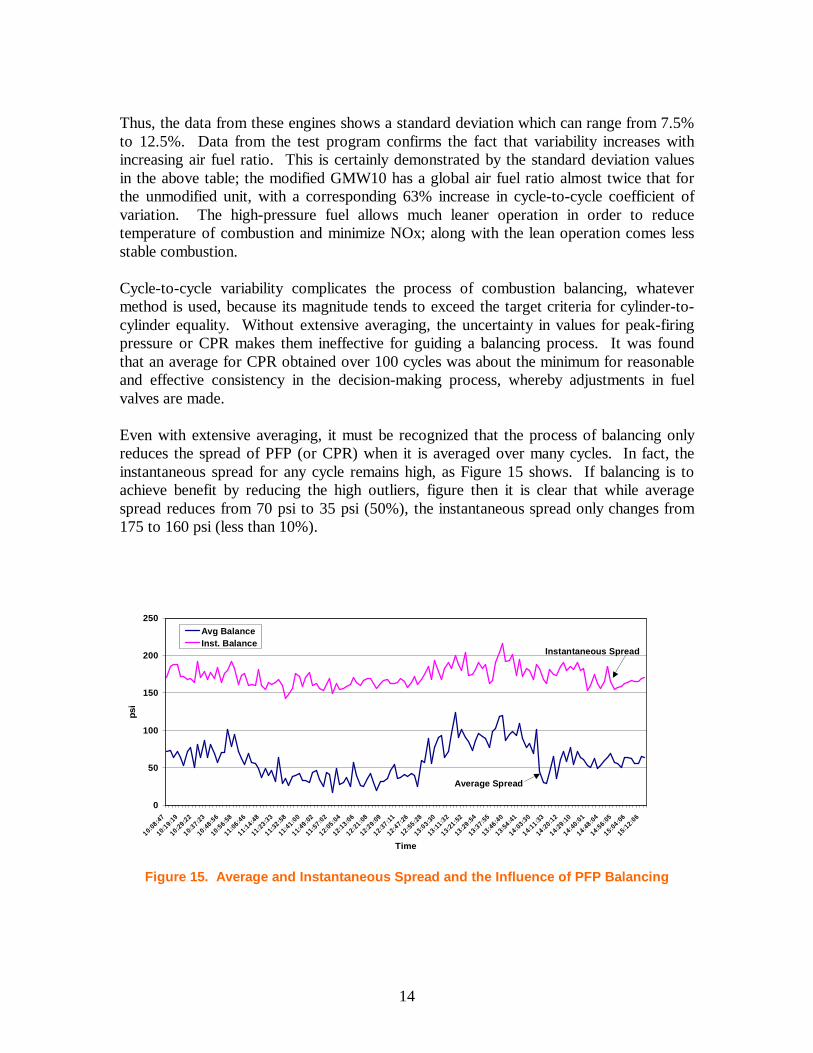
Thus, the data from these engines shows a standard deviation which can range from 7.5% to 12.5%. Data from the test program confirms the fact that variability increases with increasing air fuel ratio. This is certainly demonstrated by the standard deviation values in the above table; the modified GMW10 has a global air fuel ratio almost twice that for the unmodified unit, with a corresponding 63% increase in cycle-to-cycle coefficient of variation. The high-pressure fuel allows much leaner operation in order to reduce temperature of combustion and minimize NOx; along with the lean operation comes less stable combustion. Cycle-to-cycle variability complicates the process of combustion balancing, whatever method is used, because its magnitude tends to exceed the target criteria for cylinder-to-cylinder equality. Without extensive averaging, the uncertainty in values for peak-firing pressure or CPR makes them ineffective for guiding a balancing process. It was found that an average for CPR obtained over 100 cycles was about the minimum for reasonable and effective consistency in the decision-making process, whereby adjustments in fuel valves are made. Even with extensive averaging, it must be recognized that the process of balancing only reduces the spread of PFP (or CPR) when it is averaged over many cycles. In fact, the instantaneous spread for any cycle remains high, as Figure 15 shows. If balancing is to achieve benefit by reducing the high outliers, figure then it is clear that while average spread reduces from 70 psi to 35 psi (50%), the instantaneous spread only changes from 175 to 160 psi (less than 10%).
0
50
100
150
200
250
10:08:47
10:19:19
10:29:22
10:37:23
10:48:56
10:56:58
11:06:46
11:14:48
11:23:33
11:32:58
11:41:00
11:49:02
11:57:02
12:05:04
12:13:06
12:21:08
12:29:09
12:37:11
12:47:26
12:55:28
13:03:30
13:11:32
13:21:52
13:29:54
13:37:55
13:46:40
13:54:41
14:03:30
14:11:33
14:20:12
14:29:10
14:40:01
14:48:04
14:56:05
15:04:06
15:12:06
Time
psi
Avg BalanceInst. Balance
Instantaneous Spread
Average Spread
Figure 15. Average and Instantaneous Spread and the Influence of PFP Balancing

15
HIGH-PRESSURE FUEL The use of high-pressure fuel injection has evolved over the last five years as a means to achieve lean, but stable operation of a two-stroke natural gas engine, and thereby reduce NOx emissions. Several individual high and moderate pressure fuel products now exist. This project first tested a GMW10 with high-pressure fuel (using Enginuity’s HPFI) at Williams Station 40 (Sour Lake), and found lean operation and low emissions. Figures 2 and 3 have shown the test installation at Station 40, including one bank of power cylinders and the new turbocharger. It was decided that high-pressure fuel should be evaluated by a test on the same engine before and after the high-pressure fuel modification was implemented. This test was undertaken on Unit 6 at Williams Station 60 (St. Francisville). Although the “after modification” test is scheduled to be completed by the time of the 2004 Gas Machinery Conference (GMC), the data reduction and evaluation cannot be available for this paper. As an intermediate alternative, comparisons have been made between the data from Station 60 before modification, and the data from Station 40 on the modified unit. This is not a one for one comparison since the units tested are different, but serves to suggest the trends to be expected once the comparisons on the same unit do become available. Figures 16 and 17 make some comparisons of key parameters in the form of ratios between values on the modified unit and values on the unmodified unit. Data is available on both units at very similar timing (8 or 8.5o BTDC) and at close to 100% load. The quantities compared are heat rate, NOx, system thermal efficiency, equivalence ratio, crankshaft strain, mean compression pressure, combustion pressure ratio, and peak-firing pressure. All behave qualitatively as expected. Heat rate is reduced by a number of points (over 7% for this comparison). NOx is reduced by a factor of about 8. System thermal efficiency is increased by over 8%; equivalence ratio is much lower. Crankshaft strain is reduced by a substantial amount, though the effect may be exaggerated by differences in strain gage location between the two tests. Some reduction in crankshaft strain is expected as a benefit of improved thermal efficiency and associated reduction in peak-firing pressure, but probably not as much as this comparison shows. The compression pressure is increased by over 28% as a result of the increase in boost which the added turbocharger provides. The mean combustion pressure ratio is lower, partly because of the increase in the compression pressure which forms the denominator in the expression for CPR, and partly because the increase in thermal efficiency achieved by eliminating the flapper valve typical of GMW10s of this vintage allows a reduction in peak-firing pressure for a given load. The last bar in Figure 17 shows the reduction in peak pressure – over 20% reduction is shown here.

16
0.928
0.126
1.090
0.528
0.000
0.200
0.400
0.600
0.800
1.000
1.200
Heat Rate Normalized Nox SystemEfficiency, %
Eq ratio
Mod
ified
/Unm
odifi
ed
Figure 16. Ratio of Performance for Modified GMW10 (Turbo + High-Pressure Fuel) to
Another Unmodified GMW10; 8º BTDC Timing
0.478
1.288
0.613
0.790
0.000
0.200
0.400
0.600
0.800
1.000
1.200
1.400
C-Shaft Micro-Strain (P-P)
MeanCompression
Pressure
CombustionPressure Ratio
Peak Pressure
Rat
io
Figure 17. Crankshaft Strain, Mean Compression Pressure, Combustion Pressure Ratio, and Peak Pressure; Ratio of Typical Values for GMW10 Modified for High-Pressure Fuel +
Turbocharger Compared to Unmodified GMW10
17
It is emphasized, again, that the trends of Figures 16 and 17 should at this stage be considered qualitative; however, they are promising and suggest the full before and after tests will indicate significant benefits to the use of high-pressure fuel with added boost from a turbo.
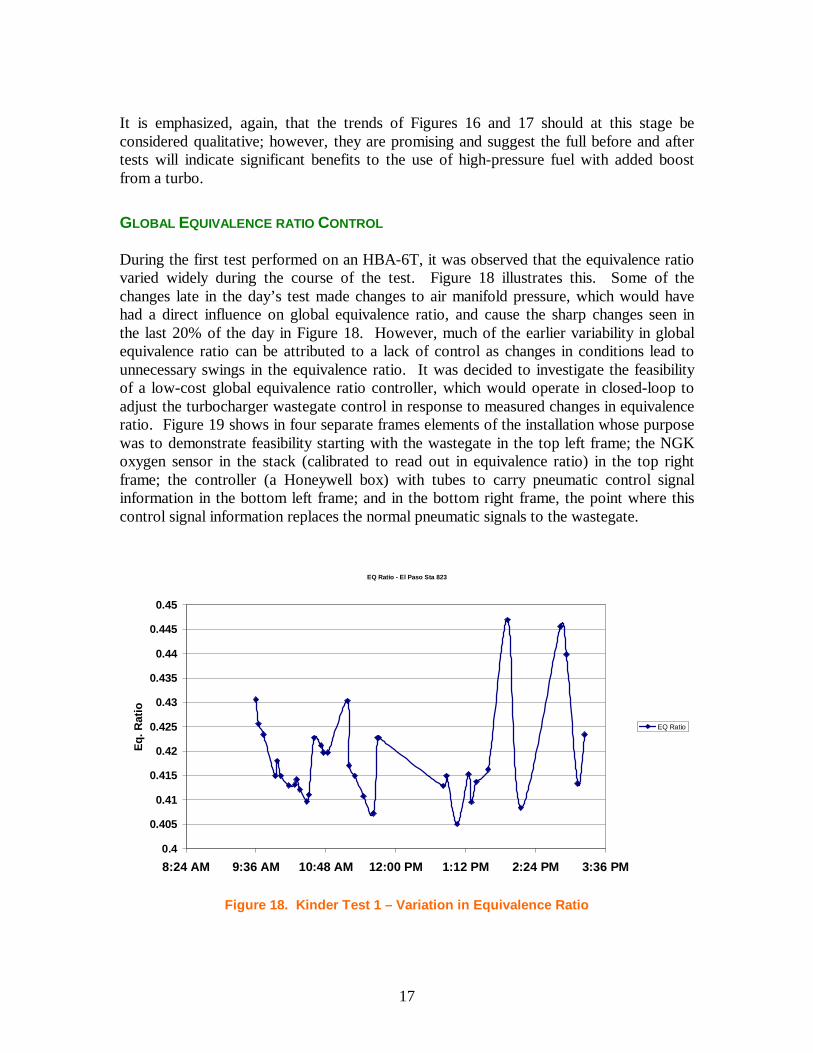
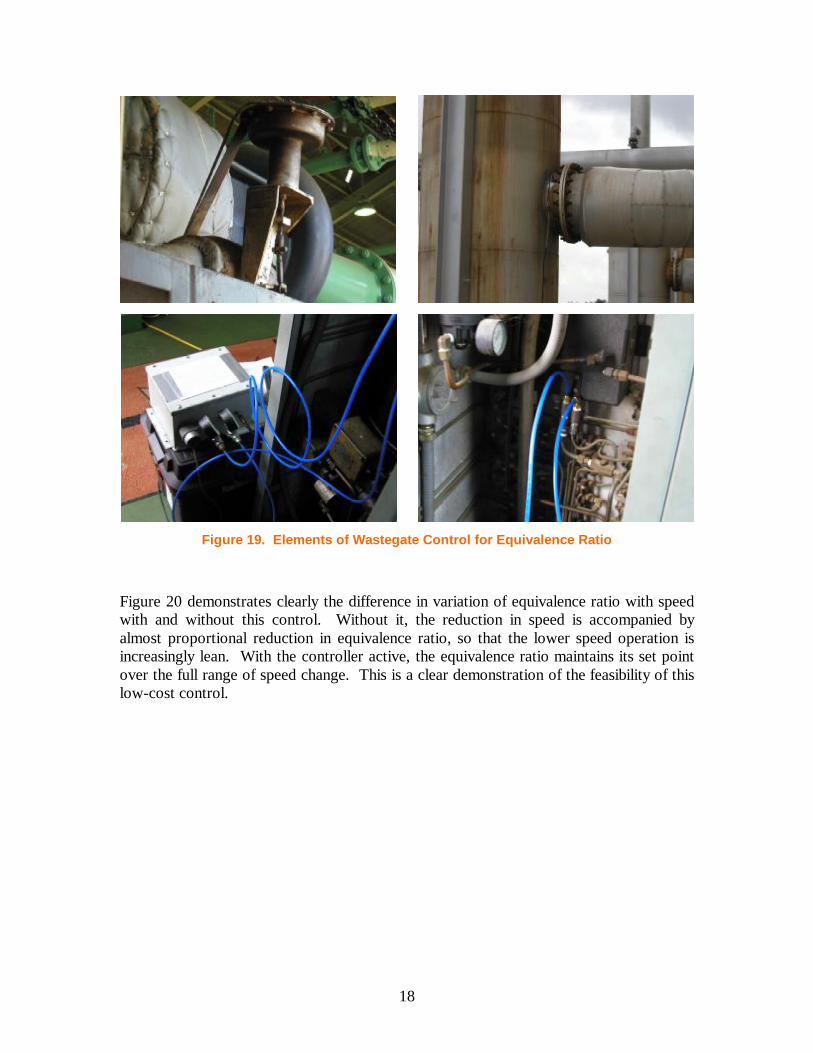
GLOBAL EQUIVALENCE RATIO CONTROL During the first test performed on an HBA-6T, it was observed that the equivalence ratio varied widely during the course of the test. Figure 18 illustrates this. Some of the changes late in the day’s test made changes to air manifold pressure, which would have had a direct influence on global equivalence ratio, and cause the sharp changes seen in the last 20% of the day in Figure 18. However, much of the earlier variability in global equivalence ratio can be attributed to a lack of control as changes in conditions lead to unnecessary swings in the equivalence ratio. It was decided to investigate the feasibility of a low-cost global equivalence ratio controller, which would operate in closed-loop to adjust the turbocharger wastegate control in response to measured changes in equivalence ratio. Figure 19 shows in four separate frames elements of the installation whose purpose was to demonstrate feasibility starting with the wastegate in the top left frame; the NGK oxygen sensor in the stack (calibrated to read out in equivalence ratio) in the top right frame; the controller (a Honeywell box) with tubes to carry pneumatic control signal information in the bottom left frame; and in the bottom right frame, the point where this control signal information replaces the normal pneumatic signals to the wastegate.
EQ Ratio - El Paso Sta 823
0.4
0.405
0.41
0.415
0.42
0.425
0.43
0.435
0.44
0.445
0.45
8:24 AM 9:36 AM 10:48 AM 12:00 PM 1:12 PM 2:24 PM 3:36 PM
Eq. R
atio
EQ Ratio
Figure 18. Kinder Test 1 – Variation in Equivalence Ratio
18
Figure 19. Elements of Wastegate Control for Equivalence Ratio
Figure 20 demonstrates clearly the difference in variation of equivalence ratio with speed with and without this control. Without it, the reduction in speed is accompanied by almost proportional reduction in equivalence ratio, so that the lower speed operation is increasingly lean. With the controller active, the equivalence ratio maintains its set point over the full range of speed change. This is a clear demonstration of the feasibility of this low-cost control.

19
0.395
0.4
0.405
0.41
0.415
0.42
0.425
0.43
0.435
0.44
265 270 275 280 285 290 295 300 305 310
Speed - RPM
Eq. r
atio
_
CLOSED-LOOP
0.395
0.4
0.405
0.41
0.415
0.42
0.425
0.43
0.435
0.44
265 270 275 280 285 290 295 300 305 310
Speed - RPM
Eq. r
atio
_
0.395
0.4
0.405
0.41
0.415
0.42
0.425
0.43
0.435
0.44
265 270 275 280 285 290 295 300 305 310
Speed - RPM
Eq. r
atio
_
CLOSED-LOOP
0.395
0.4
0.405
0.41
0.415
0.42
0.425
0.43
0.435
0.44
265 270 275 280 285 290 295 300 305 310
Speed - RPM
Eq. R
atio
0.395
0.4
0.405
0.41
0.415
0.42
0.425
0.43
0.435
0.44
265 270 275 280 285 290 295 300 305 3100.395
0.4
0.405
0.41
0.415
0.42
0.425
0.43
0.435
0.44
265 270 275 280 285 290 295 300 305 310
Speed - RPM
Eq. R
atio
0.395
0.4
0.405
0.41
0.415
0.42
0.425
0.43
0.435
0.44
265 270 275 280 285 290 295 300 305 310
Speed - RPM
Eq. r
atio
_
0.395
0.4
0.405
0.41
0.415
0.42
0.425
0.43
0.435
0.44
265 270 275 280 285 290 295 300 305 310
Speed - RPM
Eq. r
atio
_
0.395
0.4
0.405
0.41
0.415
0.42
0.425
0.43
0.435
0.44
265 270 275 280 285 290 295 300 305 310
Speed - RPM
Eq. r
atio
_
0.395
0.4
0.405
0.41
0.415
0.42
0.425
0.43
0.435
0.44
265 270 275 280 285 290 295 300 305 310
Speed - RPM
Eq. r
atio
_
0.395
0.4
0.405
0.41
0.415
0.42
0.425
0.43
0.435
0.44
265 270 275 280 285 290 295 300 305 310
Speed - RPM
Eq. r
atio
_
0.395
0.4
0.405
0.41
0.415
0.42
0.425
0.43
0.435
0.44
265 270 275 280 285 290 295 300 305 310
Speed - RPM
Eq. r
atio
_
Figure 20. Variation of Equivalence Ratio with Speed – Comparison of Open-Loop and
Closed-Loop Control
Figure 21 shows that this control does have an influence on combustion behavior – in this illustration on the standard deviation of peak-firing pressure; without the controller active, the leanness of the low-speed operation increases the cycle-to-cycle variability substantially, and the standard deviation in PFP increases from 61 to almost 67. With the closed-loop controller active, the standard deviation actually decreases with reducing speed.

20
56
58
60
62
64
66
68
275 280 285 290 295 300 305
RPM
Stan
dard
Dev
OPEN LOOP
CLOSED LOOP
56
58
60
62
64
66
68
275 280 285 290 295 300 305
RPM
Stan
dard
Dev
OPEN LOOP
CLOSED LOOP
Figure 21. Mean Cylinder Cycle-to-Cycle Standard Deviation vs. Speed - Comparison of
Open-Loop and Closed-Loop Control of Wastegate
As a result of operating less lean at reduced speed, it was also noted that the normalized NOx concentration was higher with reduced speed under closed-loop control. No effort was made in this first feasibility demonstration to use the equivalence ratio control to achieve a particular performance goal; it can be argued that the achievement of lower NOx concentration under reduced speed without this control came with a penalty of an approach towards or beyond the acceptable limit of lean operation – certainly the standard deviation was as high as 13% of the peak-firing pressure (around 510 psi during the speed reduction test in open loop). However, the option does exist to set the controller to operate leaner at 300 RPM – the most common speed of operation for this unit – yet not to run so lean as currently under reduced speed. Equivalence ratio has a very direct influence on combustion behavior, and the observed changes without this active control are very significant.
INFLUENCE OF TIMING ON HEAT RATE AND CRANK STRAIN A parameter known to influence combustion behavior very strongly is timing. It has been observed that at some stations, there exists a tendency to maintain timing at a point more retarded than the manufacturer’s factory setting. The operational benefit is that retarding timing provides increased margin against detonation. An operator may choose to sacrifice possible efficiency gains from advanced timing in favor of assured integrity on days when conditions such as high ambient temperature might cause an engine with more advanced timing to detonate. The project has investigated the influence of advanced timing on engine behavior and has also investigated the possibility of actively protecting against detonation.

21
In Figures 22 through 25, a rather consistent (and generally known) story is quantified for three different engines. Figure 22 tracks timing and other changes during a day’s testing on an HBA-6T (turbocharged). The timing advance from 6 to 8 degrees immediately cuts heat rate about 75 BTU/HP-hr.; and the timing retard from 8 to 6 degrees cause an increase in heat rate of over 100 BTU/HP-hr. In Figure 23, the influence of timing on a GMW10 with high-pressure fuel is shown – as much as 600 BTU/HP-hr. reduction over the 5 degrees difference between lowest and highest advance. In Figure 24, the corresponding increase in NOx concentration for this GMW10 is noted – an increase from –8% to + 18% - as the timing was changed from 6 to 11 degrees.
7250
7300
7350
7400
7450
7500
7550
7600
7650
10:1
6:37
10:2
7:35
11:0
1:54
11:0
9:12
11:1
3:46
11:1
9:00
11:2
3:01
11:2
7:05
11:3
1:14
11:3
5:18
11:3
9:20
11:4
3:21
11:4
7:22
11:5
3:22
11:5
7:23
12:0
1:22
12:0
5:22
12:0
9:21
12:1
3:21
12:1
7:24
12:2
1:24
12:2
5:24
12:2
9:25
12:3
3:25
12:3
7:25
12:4
1:25
12:4
5:25
12:5
1:19
12:5
5:20
13:0
0:05
Time
Timing from 8 to 6 (11:49 am)
Reduce to 94%Torque (12:45 pm)
Timing from 6 to 8(11:10 am)
Start PFP Balancing(11:15 pm)
Figure 22. Heat Rate with Balancing and Timing Changes – Williams Station 60 – Day 2

22
6500
6600
6700
6800
6900
7000
7100
7200
7300
5 6 7 8 9 10 11 12Degrees before TDC
Hea
t Rat
e B
TU/C
ompr
esso
r IH
P-hr
.)
28
28.5
29
29.5
30
30.5
31
31.5
Ove
rall
Syst
em E
ffici
ency
Heat Rate
System Efficiency
Linear (System
Figure 23. GMW10 with High-Pressure Fuel – Influence of Timing on Heat Rate
Effect of timing on NOx
-15.00%
-10.00%
-5.00%
0.00%
5.00%
10.00%
15.00%
20.00%
4 5 6 7 8 9 10 11 12
Degrees before TDC
% c
hang
e fr
om b
asel
ine
cond
ition
Figure 24. GMW10 with High-Pressure Fuel – Influence of Timing on NOx

23
Heat Rate vs Timing Sta 60
7360
7380
7400
7420
7440
7460
7480
7500
7520
7540
6 Deg BTDC 8 Deg BRDC
Heta
Rat
e B
TU/H
P-Hr
Heat Rate
NOx vs Tining Williams Sta 60
1.55
1.6
1.65
1.7
1.75
1.8
1.85
6 Deg BTDC 8 Deg BRDC
Nor
mal
ized
NO
x C
once
ntra
tion
Normalized NOx
Heat Rate vs Timing Sta 60
7360
7380
7400
7420
7440
7460
7480
7500
7520
7540
6 Deg BTDC 8 Deg BRDC
Heta
Rat
e B
TU/H
P-Hr
Heat Rate
Heat Rate vs Timing Sta 60
7360
7380
7400
7420
7440
7460
7480
7500
7520
7540
6 Deg BTDC 8 Deg BRDC
Heta
Rat
e B
TU/H
P-Hr
Heat Rate
NOx vs Tining Williams Sta 60
1.55
1.6
1.65
1.7
1.75
1.8
1.85
6 Deg BTDC 8 Deg BRDC
Nor
mal
ized
NO
x C
once
ntra
tion
Normalized NOx
NOx vs Tining Williams Sta 60
1.55
1.6
1.65
1.7
1.75
1.8
1.85
6 Deg BTDC 8 Deg BRDC
Nor
mal
ized
NO
x C
once
ntra
tion
Normalized NOx
Heat Rate vs Timing Sta 60
7360
7380
7400
7420
7440
7460
7480
7500
7520
7540
6 Deg BTDC 8 Deg BRDC
Heta
Rat
e B
TU/H
P-Hr
Heat Rate vs Timing Sta 60
7360
7380
7400
7420
7440
7460
7480
7500
7520
7540
6 Deg BTDC 8 Deg BRDC
Heta
Rat
e B
TU/H
P-Hr
Heat Rate
NOx vs Tining Williams Sta 60
1.55
1.6
1.65
1.7
1.75
1.8
1.85
6 Deg BTDC 8 Deg BRDC
Nor
mal
ized
NO
x C
once
ntra
tion
NOx vs Tining Williams Sta 60
1.55
1.6
1.65
1.7
1.75
1.8
1.85
6 Deg BTDC 8 Deg BRDC
Nor
mal
ized
NO
x C
once
ntra
tion
Normalized NOx
Heat Rate vs Timing Sta 60
7360
7380
7400
7420
7440
7460
7480
7500
7520
7540
6 Deg BTDC 8 Deg BRDC
Heta
Rat
e B
TU/H
P-Hr
Heat Rate
Heat Rate vs Timing Sta 60
7360
7380
7400
7420
7440
7460
7480
7500
7520
7540
6 Deg BTDC 8 Deg BRDC
Heta
Rat
e B
TU/H
P-Hr
Heat Rate
NOx vs Tining Williams Sta 60
1.55
1.6
1.65
1.7
1.75
1.8
1.85
6 Deg BTDC 8 Deg BRDC
Nor
mal
ized
NO
x C
once
ntra
tion
NOx vs Tining Williams Sta 60
1.55
1.6
1.65
1.7
1.75
1.8
1.85
6 Deg BTDC 8 Deg BRDC
Nor
mal
ized
NO
x C
once
ntra
tion
Normalized NOx
NOx vs Tining Williams Sta 60
1.55
1.6
1.65
1.7
1.75
1.8
1.85
6 Deg BTDC 8 Deg BRDC
Nor
mal
ized
NO
x C
once
ntra
tion
NOx vs Tining Williams Sta 60
1.55
1.6
1.65
1.7
1.75
1.8
1.85
6 Deg BTDC 8 Deg BRDC
Nor
mal
ized
NO
x C
once
ntra
tion
Normalized NOx
Figure 25. Heat Rate and NOx vs. Timing GMW10 with Low-Pressure Fuel
Figure 25 quantifies the influence of timing on a GMW10 with standard low-pressure fuel supply; a 2-degree advance from 6 to 8 degrees is accompanied by almost exactly a 100 BTU/HP-hr. reduction in heat rate, and by an increase in normalized NOx concentration from 1.66 to 1.83 (about 10% increase). Thus, even for those operators prepared to manage their timing advance to reduce heat rate, the accompanying increase in NOx must be recognized; looked at another way, the reduction in NOx obtained by retarding timing comes with a significant penalty in increased heat rate. Measurements of crank strain also show that advances in timing tend to increase the range of crank strain dynamic variation. Figure 26, for example, shows close to 20 microstrains peak-to-peak higher with 8o than with 6o timing on a low-pressure fuel GMW10. Similar trends have been observed on other units. Thus, there is a potential increase in the damage rate on a crankshaft from advanced timing, although this is an uncalibrated effect. It may also be noted that if advanced timing is used on an engine with another technology which reduces peak load engine load on the crankshaft for a given power output (as high-pressure fuel appears to do), this penalty may be offset by the load reduction.

24
8° Timing
Figure 26. Crankshaft Peak-to-Peak Strain; Day 2 - Williams Station 60
DETONATION DETECTION As discussed earlier, the use of advanced timing to reduce heat rate increases the need to manage detonation (i.e., to detect and avoid it in an orderly manner). The use of wastegate adjustment in a closed-loop control system to maintain global equivalence ratio set point can also create a need for detonation management when the control system calls for more air and the turbocharger is providing as much boost as it can. Under this scenario, the potential for detonation exists, and a need may exist for temporary retardation of timing. With detonation as the primary reason for timing retardation, it would be desirable to be able to reliably detect detonation early, and make changes in timing which respond to observation of the phenomenon, rather than open-loop control of timing based on conditions. With this in mind, the project has tested a detonation detector loaned to SwRI by Metrix. This detector puts out a voltage proportional to the count of acceleration values above a threshold; it will do this for signals in a particular frequency range, which for these engines has been optimized for approximately 5 Hz. On the first occasion, the detonation detector was tested clear, and repeated, audible detonation occurred under some conditions, and Figure 27 shows the detonation detector output went to 5 volts under this condition. On the second occasion when the detonation detector was tested, the

25
conditions of operation were gradually adjusted towards those known to increase the likelihood of detonation; timing was advanced; global equivalence ratio was then increased by lowering air manifold pressure; and then fuel flow was selectively increased to the cylinder on which the detector was mounted by opening its fuel valve. On the occasion of the test, none of these changes led to significant audible detonation, but Figure 28 shows the detonation detector’s output gradually increased to three volts. These results suggest that between three and five volts output from the detector, a threshold exists where action should be taken to retard timing, and perhaps tune the timing to keep the detonation detector’s output below, but acceptably close to the threshold. Some sort of proportional control might be possible using this signal.
0
1
2
3
4
5
1025
13.D
AQ10
3100
.DAQ
1035
48.D
AQ10
4148
.DAQ
1047
48.D
AQ10
5348
.DAQ
1059
48.D
AQ11
0548
.DAQ
1109
50.D
AQ11
1323
.DAQ
1118
55.D
AQ11
2439
.DAQ
1127
40.D
AQ11
3048
.DAQ
1134
28.D
AQ11
3757
.DAQ
1141
35.D
AQ11
4426
.DAQ
1146
21.D
AQ11
5102
.DAQ
1157
02.D
AQ12
0302
.DAQ
1209
02.D
AQ12
1502
.DAQ
1221
02.D
AQ12
2702
.DAQ
1233
02.D
AQ12
3903
.DAQ
1245
03.D
AQ12
5010
.DAQ
1254
56.D
AQ13
0057
.DAQ
1306
02.D
AQ13
1128
.DAQ
Time
Am
plitu
de
LoadingTiming 6 Deg
Advanced TimingTo 8 Deg
Retard TimingTo 6 Deg
Audible KnockingObserved on 4L
Figure 27. Knock Detector Output - Williams Station 60

26
Knock Detector Output
0
0.5
1
1.5
2
2.5
3
3.5
13312
6.DAQ
13342
7.DAQ
1336
49.D
AQ
1339
49.D
AQ
13424
9.DAQ
134549
.DAQ
134849
.DAQ
1351
49.D
AQ
13544
9.DAQ
13572
5.DAQ
1358
59.D
AQ
1400
29.D
AQ
14015
9.DAQ
14032
9.DAQ
1404
59.D
AQ
1406
30.D
AQ
14080
0.DAQ
14093
0.DAQ
14110
0.DAQ
1412
30.D
AQ
14140
0.DAQ
14153
0.DAQ
141700
.DAQ
1418
30.D
AQ
1420
00.D
AQ
14213
0.DAQ
1423
00.D
AQ
1424
30.D
AQ
1426
01.D
AQ
14273
1.DAQ
14290
1.DAQ
1430
31.D
AQ
14320
1.DAQ
14440
5.DAQ
14530
5.DAQ
15020
5.DAQ
1510
38.D
AQ
15193
8.DAQ
15283
8.DAQ
1537
38.D
AQ
1546
38.D
AQ
Time
Volts
Advance timing from 10-12 degrees
Reduce Air Flowincrease EQ from 0.43 to 0.46
Retart Timing to 10 degrees andreset EQ ratio
Figure 28. Knock Detector Output - El Paso Station 823
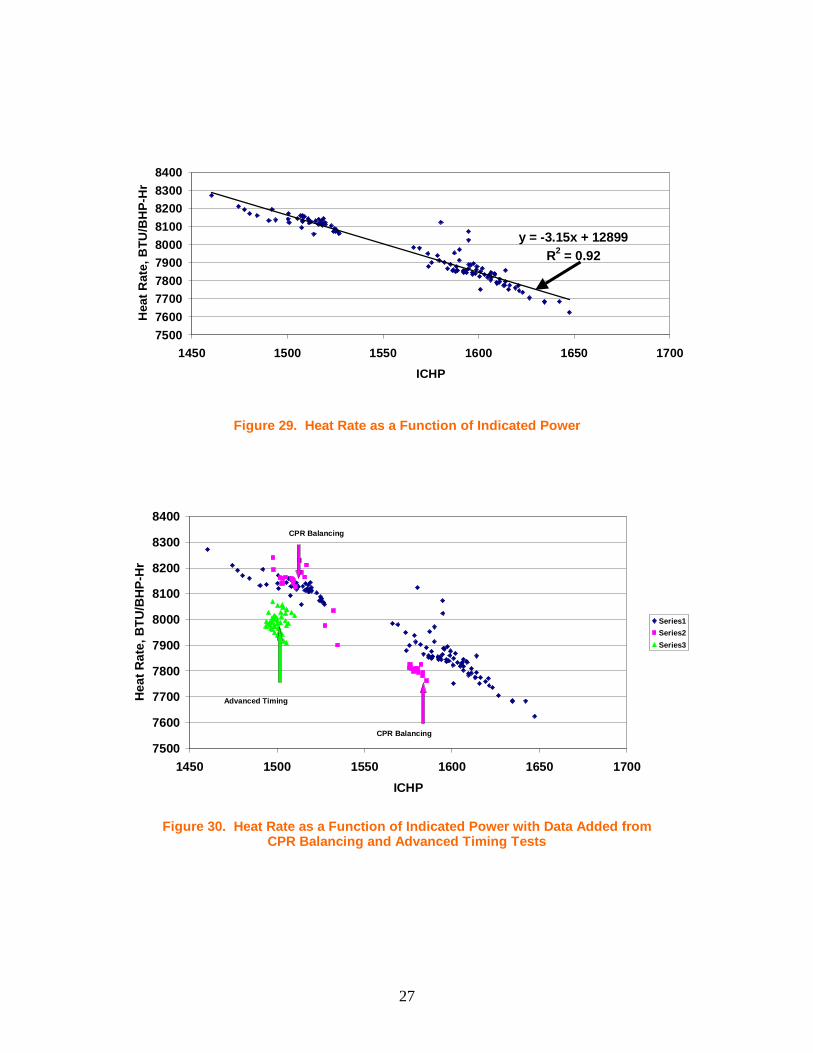
SENSITIVITY OF HEAT RATE TO LOAD As testing was performed to investigate how changes such as timing and balancing might affect heat rate, it became apparent that if intended changes in conditions coincided with an unintended change in load, the influence of the intended change on heat rate could be masked or influenced by the effect of load on heat rate. Data from the HBA-6T tests enable documentation of this sensitivity to load over quite wide conditions. Figure 29 plots heat rate as a function of load and includes a linear trend line. The trend line has a coefficient of determination (R2) of 0.92, which indicates a reasonable quality of fit. The slope is –3.15 BTU/HP-hr. per HP. If we normalize this slope by the ratio of nominal values for ICHP and for heat rate (say 8000 BTU/HP-hr. and 1550 HP, respectively), we obtain a nondimensional value of -0.61. This means the heat rate increases 0.61% for every 1% of power reduction. This suggested an approach whereby the influence of intentional changes is evaluated on the basis of how these changes cause the heat rate to shift relative to the established relationship between heat rate and load. Figure 30 illustrates this. It shows that the green data points associated with timing advance clearly reduce the heat rate relative to the body of blue data points which define the wide ranging dependence of heat rate on load. The magnitude of this benefit appears to be about 100 to 150 BTU/HP-hr. Figure 30 also shows a mixed influence of CPR balancing; at higher loads, CPR balancing seems to cause a distinct downwards shift in heat rate relative to the body of data. At lower loads, the CPR balancing data seems to simply join with the wide-ranging body of data.
27
y = -3.15x + 12899R2 = 0.92
7500760077007800790080008100820083008400
1450 1500 1550 1600 1650 1700ICHP
Hea
t Rat
e, B
TU/B
HP-
Hr
Figure 29. Heat Rate as a Function of Indicated Power
7500
7600
7700
7800
7900
8000
8100
8200
8300
8400
1450 1500 1550 1600 1650 1700ICHP
Hea
t Rat
e, B
TU/B
HP-
Hr
Series1Series2Series3
Advanced Timing
CPR Balancing
CPR Balancing
Figure 30. Heat Rate as a Function of Indicated Power with Data Added from
CPR Balancing and Advanced Timing Tests

28
POWER/TORQUE MEASUREMENT UNCERTAINTY The industry universally seeks to determine torque load imposed on the engine by the compressor, both during routine operation, and during tests for performance and emissions. It does this in two primary ways: in one case, the “fuel torque” is established based on a pre-established relationship between measured fuel energy flow rate and brake power. In another, the ”load torque” is established from compressor conditions via a relationship based on compression physics. Such an “ideal” relationship is typically calibrated by tests in which the actual compressor power is determined from cylinder pressure measurements. Such tests will provide information on how pulsations and flow resistance at compressor valves, orifices, and other flow restrictions combine to establish the compressor power. Correction factors are established so the test results are captured and a formula for power can be used in the future to reflect the realities of flow resistance and pulsations. The use of load torque has potential for the greatest accuracy, but may require a very extensive series of unit-by-unit tests to establish unit dependent and condition dependent adjustment factors. Figures 31 and 32 illustrate the comparison of power measured by the temporary test instruments, and the power determined by the station data acquisition and analysis system operating on data from permanently installed instruments. In one case, the two sets of power values are very close and track changes very well, with an occasional temporary, small, deviation. In another case, there appears to be a distinct bias between the two sets of power values, which ranges from 5 to 10% or even higher.
0
500
1000
1500
2000
2500
3000
0 20 40 60 80 100 120 140 160
BH
P_ Series1
Series2
STATION DATA
PRESSURE BASED BHP
0
500
1000
1500
2000
2500
3000
0 20 40 60 80 100 120 140 160
BH
P_ Series1
Series2
STATION DATA
PRESSURE BASED BHP
Figure 31. Pressure-Based BHP vs. Station Data – Williams Station 60

29
Compressor HP & Station BHP
0
200
400
600
800
1000
1200
1400
1600
1800
2000
8:09:36 9:21:36 10:33:36 11:45:36 12:57:36 14:09:36 15:21:36 16:33:36
Hor
sepo
wer
Compressor hp (Pressure based)
Station BHP Data
Compressor HP & Station BHP
0
200
400
600
800
1000
1200
1400
1600
1800
2000
8:09:36 9:21:36 10:33:36 11:45:36 12:57:36 14:09:36 15:21:36 16:33:36
Hor
sepo
wer
Compressor hp (Pressure based)
Station BHP Data
Figure 32. Pressure-Based BHP vs. Station Data – Test 1
(El Paso Station 823 – Kinder First Test)
The goal of operating companies when conditions allow is to maintain load on the engine right at 100%; to take advantage of the fact that heat rate drops with increasing load, while not overloading the engine by running at over 100%. They typically have load control mechanisms (opening and closing pockets and deactivating cylinder ends) which allow them to closely approach 100% load. The dependence of heat rate on load, previously illustrated by Figure 29, makes clear the value of running at 100% load – anything less can increase heat rate substantially. The potential for 10% uncertainty demonstrated in one case also makes clear that the industry may be either over-loading their engines or suffering from unnecessarily high heat rate. ROD LOAD MONITOR (RLM) The Gas Machinery Research Council (GMRC), with some industry co-funding, has been developing a monitor to measure rod load continuously. Potentially, this device will provide a direct and continuous readout of engine torque and load (meeting the need discussed in the preceding section of this paper). The basic methodologies for measurement, for self-powering, and for digital telemetry of data necessary for the rod load monitor (RLM) have been defined, developed, and tested in the laboratory under GMRC funding. The DOE program, with further GMRC co-funding, has enabled the testing process to continue in the field on large integral units. These tests have revealed the small but critical refinements necessary for a robust, reliable, and accurate RLM. The areas of refinement necessary have included: self-powering reliability, elimination of thermal sensitivity of various system components, and reduction of required electrical

30
power. In the fourth and the fifth tests of the program, repeat tests on an HBA-6T and on a GMW10, the self-powering has switched on at an acceptably low speed – around 200 RPM or below. The first installation with successful power generation on a low-speed integral is shown in Figure 33. This result has validated a predictive procedure for power generation from reciprocating motion, which depends on the length of the stationary magnet array, on the clearance between magnets and moving coils, and on the engine speed. Figure 34 shows a typical waveform of the rod load signal. A function based on this waveform is integrated over each revolution to give rod power. This rod power tracked power from cylinder pressure in both these tests; however, the issue of calibration remains to be fine-tuned. Although the power values tracked, the fourth test results revealed the requirement for a fixed factor to match the absolute values of power based on rod strain, on rod diameter, and on rod material properties. Figure 35 shows how the adjusted rod power tracked cylinder pressure based power over a range of speed variations. The adjustment factor for the fourth test was in the range of 0.9, and in the fifth test, the factor was much closer to one.
Magnet Array Stationary Antenna
Moving Power Generator & Transmitter
Magnet Array Stationary Antenna
Moving Power Generator & Transmitter
Figure 33. First Successful Self-Powered RLM Installation – El Paso Station 823 – Test 2

31
Figure 34. Rod Load Data from Sour Lake
RLM HP
IHP C4
RLM HP
IHP C4
Figure 35. “Scale Facture” – Adjusted Comparison – ICHP vs. RLM (Station 823 – Test 2)

32
Implementation details remain to be defined and refined on how the RLM should be used as a basis for load step adjustments to keep load at 100%. Part of this issue arises from the fact that mechanical losses between power delivered to the crosshead (brake power) by the engine and the rod power differ from those losses between crosshead power (brake power) and compressor cylinder power. In the latter case, losses come from the rings and rider bands as well as from the crosshead bearing. Current practice is to assume a fixed mechanical efficiency (typically 95%) can be used to relate compressor cylinder power back to brake power, and the value for this efficiency will be higher (losses lower) when rod power is to be related back to brake power. Information is needed on compressor mechanical losses. It is hoped that detailed analysis of rod load waveforms and cylinder force waveforms and how their difference depends on speed, load, and on the location in the cylinder motion cycle will help provide some of this knowledge. In summary, the RLM and the contributions of this test program to its refinement will yield a powerful tool for monitoring brake torque and for knowledge development about engine-compressor characteristics.
THE INFLUENCE OF SPEED The project has sought to quantify the influence of speed on component efficiency and integrity. Figure 36 shows that reducing speed has a substantial influence in reducing peak-to-peak crankshaft strain; the variation is more than proportional, so that a 6.5% reduction in speed causes 13% reduction in crankshaft strain or more. Thus, speed reduction looks to be an attractive capacity control option when crankshaft integrity is considered.
50
55
60
65
70
75
80
275 280 285 290 295 300 305
Speed in RPM
Mic
ro-s
trai
n
Micro-Strain Day 1Micro-Strain Day 2
Figure 36. Crankshaft Microstrain as a Function of Speed; HBA-6T

33
Figure 37, at first glance, suggests speed reduction leads to a substantial benefit in heat rate as well. Closer investigation, however, indicates the independent variable is power, so that a reduction in speed for a given power implicitly increases load on the engine – which has clearly been shown to reduce heat rate, and to increase thermal efficiency. However, using trend lines for the 300, 290, and 280 RPM data, the heat rates at 100% torque (1550, 1498.3, 1496.7 HP, respectively) are 8016, 7934, and 7949 BTU/BHP-hr., also indicating that reducing speed does reduce heat rate by a small amount for a given torque; one reason may be that friction losses are reduced by reducing speed. When evaluating the potential benefits for efficiency of speed reduction as a capacity control technique, it is important to consider the influence on the compressor as well as the engine. Figure 38 shows that, for this unit and its installation, compressor efficiency is reduced by reducing speed – about 2.5 percentage points for the 20-RPM speed reduction. It would appear the reason is an increase in pulsations. These reductions in compressor thermal efficiency with reducing speed outweigh the small gains in heat rate with reducing speed. Thus, without some substantial effort to address the pulsations of the unit and the influence of speed on these pulsations, the use of speed reduction as a capacity control technique appears to have limited benefits for this unit, and should be carefully evaluated for any installation.
7500760077007800790080008100820083008400
1400 1450 1500 1550 1600 1650 1700ICHP
Hea
t Rat
e B
TU/B
HP-
Hr_
Series1Series2
280
290
c
Figure 37. Heat Rate as a Function of Indicated Power, showing Effect of Speed

34
Figure 38. Compressor Efficiency for Different Speeds – HBA-6T
(El Paso Station 823 – Test 2)
REFERENCE DATA The tests performed on three different units provide a useful reference set for component and overall efficiency. Figure 39 summarizes a survey of compressor thermal efficiency performed by GMRC in the mid 1990’s, and with two added arrows, shows where the units tested under the present program lie relative to the survey. The GMW units tested show compressor thermal efficiencies around 84 to 85%; the HBA units tested show compressor thermal efficiencies in the range 90 to 91%. Thus, both units tested exhibit compressor efficiencies above the median of the survey data set. Table 1 distinguishes three units tested and includes engine heat rate, compressor efficiency, and overall system thermal efficiency.

35
0
5
10
15
20
25
50 52 54 56 58 60 62 64 66 68 70 72 74 76 78 80 82 84 86 88 90 92 94 96 98 100
Mor
e
Thermal Efficiency Bin
Freq
uenc
y of
Occ
urre
nce HBA-6T
Tested
GMRC Survey Data
0
5
10
15
20
25
50 52 54 56 58 60 62 64 66 68 70 72 74 76 78 80 82 84 86 88 90 92 94 96 98 100
Mor
e
Thermal Efficiency Bin
Freq
uenc
y of
Occ
urre
nce HBA-6T
Tested
GMRC Survey Data
1stGMW10 Stations 40 & 60
Figure 39. Compressor Efficiency Benchmark – Test 1 – El Paso Station 823 –
Williams Stations 40 & 60
Table 1. Preliminary Industry Benchmarks
HBA-6T Open Chamber Low-Pressure Fuel Turbo – Test 2
GMW10 Open Chamber Low-Pressure Fuel
No Turbo – Station 60
GMW10 Open Chamber High-Pressure Fuel
Turbo – Station 40 Heat Rate,
BTU/HP-Hr. 8016 7418 6883
Compressor Efficiency, %
90.2% 84.4% 85.5%
System Efficiency, %
27.2% 27.53% 30%
Typical AMP, PSIG 7.2 1.5 5.5 Equivalence Ratio 0.425 0.36 0.19
EVALUATION OF LOADING SEVERITY AND INSTALLATION CONDITION The integrity-related measurements of crankshaft strain and knock detection have already been discussed. The project has investigated a number of other measurements related to loading severity, including instantaneous rotational velocity and compressor frame vibration. Certain data from the permanently installed instruments have been also been recorded, some of which offer promise for condition monitoring.

36
Figure 40 summarizes the result of analyzing a series of “long” records - data continuously recorded from 20 combustion cycles. The upper left frame shows power from the six cylinders over 20 successive revolutions, with a clear misfire event in revolution 4, for cylinder 4. The top right frame shows power for the compressor cylinders over the corresponding 20 revolutions, emphasizing the compressor power has no major deviation. The bottom left frame compares the total engine power and compressor power over the same 20 cycles – the drop in total power from the misfire is clear. The bottom right frame shows the crankshaft instantaneous rotational velocity over the same 20 revolutions. IRV on the fourth revolution clearly has a totally different characteristic from the other revolutions, with a substantial momentary slow down. This result provides encouraging evidence that pronounced, momentary, loss in power and torque from the engine would be detectable from the behavior of the crankshaft angular velocity as measured at the encoder. Figure 41 shows how crest factor (ratio of maximum to mean) for engine power and for IRV over the second long record correlate with each other. The difference in crest factor between records is not as pronounced as the IRV variation, but if it provides enough discrimination, calculating crest factor involves less intensive data analysis in an integrity monitoring method than tracking the characteristics of individual revolutions.
Figure 40. Individual Long Record Data Sets

37
Figure 41. Deviations in HP and IRV
For all tests, accelerometers have been mounted on the frame – typically 18 to 24 inches above the bearing centerline and at the approximate axial location just outboard of the covers over the first and last throws. The intent was to evaluate the use of vibration as a measure of loading severity. Figure 42 presents a waterfall plot of vibration in the frequency range from zero to 100 Hz for the second HBA-6T tested, a chock-mounted unit. The highest frequency component is at running speed with a level below 0.1 inches per second. This figure shows very little variation over the day’s testing and offers no obvious feature to track that might indicate loading severity. This has been a typical result on all engines tested. At the same time, the value of frame vibration measurement as an indicator of installation integrity should not be neglected. Smalley and Pantermuehl [2] show the ability of frame vibration to distinguish an installation, which should be considered for regrouting from an installation which is in good condition, with a typical threshold around 15 mils peak-to-peak vibration for a 300-RPM unit.

38
Figure 42. Frame Vibration HBA-6T – Chock Mounted Unit
Figure 43 presents cylinder temperature rise as a function of compression ratio for four cylinders of the HBA-6T most recently tested. The pressure ratio exhibits its natural variation over two days of testing. The temperature rise data serves to illustrate the nature of two related approaches to condition monitoring described in more detail in a GMC paper presented in 2003 by McKee, Smalley, Bourn, and Young [3]. In the first approach, functional dependencies are established between measured quantities such as cylinder temperature rise (which directly relates to compressor thermal efficiency) and independent variables such as pressure ratio – generally representative of changing conditions to which the unit is exposed. Once such dependencies are established together with their natural variance, they represent behavioral characteristics and can provide an “expected value” for the measured quantity appropriate to the current operating conditions. When actual behavior starts to exhibit repeated deviation from the expected value(s) with a frequency which significantly exceeds the frequency of such deviation to be expected from normal variance characteristics, then a statistically significant change has been identified. With properly calibrated instruments and data analysis as described in Reference [3], cylinder temperature rise for a cylinder can be a sensitive basis for identifying statistically significant change in compression efficiency, which can then be evaluated for economic significance.

39
R2 = 0.8622
R2 = 0.9663
R2 = 0.9076
R2 = 0.9403
40
42
44
46
48
50
52
54
1.300 1.310 1.320 1.330 1.340 1.350 1.360 1.370 1.380
Ratio (Pd/Ps)
Tem
p. R
ise
Deg
F
Cyl 1 Temp RiseCyl 2 Temp RiseCyl 3 Temp RiseCyl 4 Temp Rise
Figure 43. Cylinder Temperature Rise as a Function of Ratio
A second approach to identifying an expected value for a measured and monitored quantity is to look at values from similar components, which would be expected to behave similarly. For example, the four compressor cylinders would be expected to behave similarly and to show the same temperature rise. Clearly, a 4-degree difference can be seen between the four cylinders in Figure 43. If calibration of the four temperature transducers is confirmed, at least two of these cylinders exceed their expected values on the basis of similar components, and are exhibiting approximately eight to ten percent higher losses than their neighbors.
SUMMARY AND CONCLUSIONS As highlighted in this paper and as documented in more detail in Reference [1], the project has shown: • Fuel supply, trapped air, and their ratio vary cylinder-to-cylinder. The industry
widely uses fuel adjustment to balance combustion, but high cycle-to-cycle variation complicates this practice and limits the benefits of balancing. The most common method equalizes peak-firing pressures (PFP), but with unequal trapped air, unequal fuel/air ratios can result.
• A newly invented method (CPR balancing) equalizes combustion pressure ratio (CPR
equal to ratio of PFP to compression pressure) across cylinders and has proven feasible, with some evidence of reduced heat rate. Implementation involves calculating CPR each cycle, then averaging over multiple cycles. Cutting fuel to high CPR cylinders flattens the CPR distribution. PFP balancing works against

40
compression pressure variation (observed at 6 to 12% across cylinders), while CPR balancing works with this variation.
• An alternative, with similar goal, equalizes each cylinder’s cycle-to-cycle standard
deviation in PFP. Limited testing indicates this benefits crankshaft integrity. • Data shows 25% to 50% dynamic variability in manifold pressures, which likely
contribute to air imbalance. Separate, ongoing tasks will characterize manifold dynamics and air imbalance in a GMVH6, and optimize manifold design to reduce this imbalance.
• Global equivalence ratio can vary - and the project has shown feasibility of a low-cost
means to maintain an equivalence ratio set point via turbocharger wastegate control. • Heat rate depends strongly on load, emphasizing the need for accurate, reliable, brake
power measurement. Inaccurate torque can overload engines or hurt their efficiency. Inferential methods show up to 10% discrepancy; increasing their accuracy requires extensive mapping, and errors can still result when malfunctions occur. The GMRC Rod Load Monitor (RLM) will measure power directly, optimize heat rate, and avoid overload.
• Testing the evolving RLM has guided refinements; the project has now demonstrated
the first self-powered RLM with digital telemetry on a large integral engine. Indicated power provides a viable calibration basis and initial evaluation showed the result remained consistent with indicated power when speed and load varied. The RLM measures torque upstream of ring/rider band losses, and translating RLM power into engine brake torque for set point comparison will demand better knowledge of such mechanical losses.
• The crankshaft Strain Data Capture Module (SDCM) revealed how standard deviation
balancing reduced the number of high strain excursions; how reducing speed and high-pressure fuel cut strain; and how advanced timing increased strain.
• Because of sensitivity to small, natural, load variations, using heat rate directly to
compare operational changes incurs uncertainty. However, the heat rate versus load chart shows promise as basis for comparison. While not conclusive, tests showed a distinct reduction in heat rate after CPR balancing (~100 BTU/HP-hr.), when compared to the baseline heat rate/load chart.
• Similar comparison showed distinct heat rate reduction with 2 degrees HBA-6T
timing advance. GMW10 timing tests showed the same or more heat rate reduction. Operators tend to limit timing advance for reduced heat rate because of the potential for detonation. A detonation detector loaned by Metrix shows promise as a sensitive and discriminating device to avoid detonation when advancing timing.

41
• Comparing two different GMW10’s showed much leaner operation, reduced heat rate, and reduced NOx concentration for a unit modified with high-pressure fuel and turbocharger. This unit also showed lower crankshaft strains and lower peak pressure.
• Data shows system thermal efficiencies from 26.5 to 30% with “as found” timing.
System thermal efficiency helps assess any complete compressor package. Attempts to assess how speed influences system efficiency emphasize the need to enhance mechanical efficiency knowledge and (ideally) avoid depending on assumed mechanical efficiency. Future rod load tests should help generate this knowledge.
• Observed compressor thermal efficiencies (84 to 91%) have significance, because
high values reduce fuel consumption and increase capacity for fixed engine power. • Data confirms the value of monitoring discharge temperature to catch deteriorating
compressor performance, and the potential role of other integrity monitoring methods using vibration and torsional velocity.
REFERENCES [1] Smalley, A. J., Harris, R. E., and Bourn, G. D., Topical Report, “Technologies to
Enhance Operation of the Existing Natural Gas Compression Infrastructure,” SwRI Project No. 18.06223; DOE Award No. DE-FC26-02NT41646; August 2004.
[2] Smalley, A. J. and Pantermuehl, P. J., “Realistically Assessing Load Severity on
Concrete Foundations and Mounting Systems for Large Reciprocating Compressors,” 1998 American Concrete Institute (ACI) Spring Convention, March 22-27, 1998, Houston, Texas.
[3] McKee, R.J., Smalley, A.J., Bourn, G.D., and Young, K.N., “Detecting
Deterioration of Compression Equipment by Normalizing Measured Performance Relative to Expected Performance,” GMRC Gas Machinery Conference (GMC), October 6-8, 2003, Salt Lake City, Utah.