Embed Size (px)
Citation preview

Corporate Partnership Board
CPB
Enhancing Connectivity and Freight in Central Asia
Case-Specific Policy Analysis

Case-Specific Policy Analysis
Enhancing Connectivity and Freight in Central Asia
The International Transport Forum
The International Transport Forum is an intergovernmental organisation with 59 member countries. It acts as a think tank for transport policy and organises the Annual Summit of transport ministers. The ITF is the only global body that covers all transport modes. The ITF is politically autonomous and administratively integrated with the OECD.
The ITF works for transport policies that improve peoples’ lives. Our mission is to foster a deeper understanding of the role of transport in economic growth, environmental sustainability and social inclusion and to raise the public profile of transport policy.
The ITF organises global dialogue for better transport. We act as a platform for discussion and pre-negotiation of policy issues across all transport modes. We analyse trends, share knowledge and promote exchange among transport decision-makers and civil society. The ITF’s Annual Summit is the world’s largest gathering of transport ministers and the leading global platform for dialogue on transport policy.
The Members of the Forum are: Albania, Armenia, Argentina, Australia, Austria, Azerbaijan, Belarus, Belgium, Bosnia and Herzegovina, Bulgaria, Canada, Chile, China (People’s Republic of), Croatia, Czech Republic, Denmark, Estonia, Finland, France, Georgia, Germany, Greece, Hungary, Iceland, India, Ireland, Israel, Italy, Japan, Kazakhstan, Korea, Latvia, Liechtenstein, Lithuania, Luxembourg, Malta, Mexico, Republic of Moldova, Montenegro, Morocco, the Netherlands, New Zealand, North Macedonia, Norway, Poland, Portugal, Romania, Russian Federation, Serbia, Slovak Republic, Slovenia, Spain, Sweden, Switzerland, Turkey, Ukraine, the United Arab Emirates, the United Kingdom and the United States.
International Transport Forum 2 rue André Pascal
F-75775 Paris Cedex 16 [email protected]
www.itf-oecd.org
Case-Specific Policy Analysis Reports
The ITF’s Case-Specific Policy Analysis series presents topical studies on specific issues carried out by the ITF in agreement with local institutions. Any findings, interpretations and conclusions expressed herein are those of the authors and do not necessarily reflect the views of the International Transport Forum or the OECD. Neither the OECD, ITF nor the authors guarantee the accuracy of any data or other information contained in this publication and accept no responsibility whatsoever for any consequence of their use. This work is published under the responsibility of the Secretary-General of the ITF. This document, as well as any data and map included herein, are without prejudice to the status of or sovereignty over any territory, to the delimitation of international frontiers and boundaries and to the name of any territory, city or area.
Cite this work as: ITF (2019), “Enhancing Connectivity and Freight in Central Asia”, International Transport Forum Policy Papers, No. 71, OECD Publishing, Paris.

Acknowledgements
This report presents the findings of the first phase of the joint ITF-OECD “Enhancing Connectivity in Central Asia” project. This first phase of the project has been made possible by the financial support of the Government of Kazakhstan, for which the International Transport Forum (ITF) and the OECD are grateful.
The report was prepared under the guidance of Mr. Jari Kauppila, Head of Quantitative Policy Analysis and Foresight, ITF; and co-ordinated by Mr. Nicolas Wagner, Modeller and Analyst, and by Ms. Olga Petrik, Modeller and Analyst, both of the ITF. The main authors of the report are Ms. Olga Petrik, Mr. Nicolas Wagner, and Mr. Jari Kauppila.
Many of the quantitative aspects of this report make use of the ITF International Freight Model. The authors are grateful to the model’s author, Mr. Luis Martinez, Modeller and Analyst at the ITF.
Substantial contributions to the work and to the report were made by Mr. Vincent Benezech, former Modeller and Analyst, ITF; Ms. Indra Gromule, Head of International Road Carriage Co-ordination Division, Road Transport Administration, Latvia, and Chair of the ITF Road Transport Group’s sub-group on quota development; Ms. Elene Shatberashvili, Manager of the ITF’s Road Transport Group and Multilateral Quota; Mr. Jakub Siwiński, Policy Officer at the European Commission; and Mr. Dejan Makovšek, Economist, ITF. For editorial support the authors thank Ms. Edwina Collins, Content Production Co-ordinator, ITF; Ms. Katherine Farrow, Modeller and Analyst, ITF; and Michael Kloth, Head of Communications, ITF.
The project of which this report is one output is supervised by Mr. William Tompson, Head of the Eurasia Division of the OECD’s Global Relations Secretariat, with the support of Mr. Grégory Lecomte, Central Asia Manager, and Mr. Arnault Prêtet, Project Manager, in the Eurasia Division. Further support was provided by Mr. Luke Mackle, Consultant, and Ms. Tabea Klang, former Consultant, both of the Eurasia division.
The project benefited from invaluable support from Mr. Aidyn Danabayev, Senior Manager in the Transport and Logistics Directorate at Samruk Kazyna, and Ms. Madina Nurakisheva in Kazakhstan, Mr. Bakyt Omurzakov in Kyrgyzstan, Mr. Badral Byambaa, Senior Officer at the Ministry of Road and Transport of Mongolia, Ms. Lakshmi Boojoo, Director of the Director of the Economic Policy and Competitiveness Research Center (EPCRC), and Ms. Buyanchimeg Enkbayar in Mongolia, Ms. Larissa Kislyakovaya, Chairman of the Board of the Union of Professional Consultants, and Ms. Veronika Grushevskaya in Tajikistan, and Ms. Aziza Umarova, Chief Executive Officer at SmartGov Consulting and Ms. Ikbal Yusupova in Uzbekistan.
The report and the project would not have been possible without the co-operation of and input from representatives of numerous ministries and government agencies in Kazakhstan, Kyrgyzstan, Mongolia, Tajikistan, and Uzbekistan. In particular, we are grateful for the co-ordination, assistance and interest shown by our counterparts in the relevant authorities of each country: Mr. Roman Sklyar, Minister of Investment and Infrastructure Development of Kazakhstan, Mr. Timur Toktabayev, Vice Minister for Investments and Development of Kazakhstan, Mr. Serik Bashimov, Director of Department for Transit and Transport logistics development, Mr. Dastan Ramazanov, Head of Transit development division, Department for Transit and Transport logistics development, Ministry of Investment and Developments of Kazakhstan, Mr. Abay Besken, Attaché of the Department for Foreign Economic Policy, Ministry of
Foreign Affairs of Kazakhstan; Mr. Zamirbek Askarov, Deputy Prime Minister of Kyrgyzstan, Mr. Daniiar Imanaliev, Head of the Strategic Development, Economic and Financial Policy Division of the Administration of the President of Kyrgyzstan, Mr. Eldar Abakirov, Deputy Minister of Economy of Kyrgyzstan, Mr. Dastan Abdyldaev, Expert in the Economy and Investment Department of the Office of the Prime Minister; Mr. Damdinsuren Davaasuren, State Secretary at the Ministry of Foreign Affairs of Mongolia, Mr. Tsogtgerel Batchuluun, former Vice Minister for Road and Transport Development of Mongolia, Mr. Batbold Sandagdorj, Director of Road Transport Policy Implementation and Coordination Department, Road and Transport Development Ministry of Mongolia, Mr. Enkhbold Vorshilov, Director General, and Mr. Ulziisaikhhan Ganbold, Deputy Director General of the Ministry of Foreign Affairs, Mr. Banzragch Bayarsaikhan, Chairman, Mr. Adiya Munkhbold, head of Research and Analysis Office, and Mr. Tamir Tugsbilguun, Officer at the Research and Analysis Department, National Development Agency of Mongolia and Ms. Ayush Ariunzaya, Chair of the National Statistics Office of Mongolia; Mr. Azim Ibrohim, Deputy Prime Minister of Tajikistan, Mr. Nematullo Hikmatullozoda, Minister of Economic Development and Trade of Tajikistan, Mr. Khudoyorzoda Khudoyor Zavqibek, Minister of Transport of Tajikistan, Mr. Sukhrob Mirzoev, Vice Minister of Transport of Tajikistan; Mr. Nodir Otajonov, Deputy Advisor to the President of Uzbekistan, Mr. Jamshid Khodjaev, Minister of Foreign Trade of Uzbekistan, Mr. Sahib Saifnazarov, Deputy Minister of Foreign Trade of Uzbekistan, Mr. Mubin Mirzaev, Deputy Minister of Economy of Uzbekistan and Mr. Shukhrat Sadikov, former Head, National Project Management Agency.
We are particularly indebted to the efforts of those that met with the OECD and ITF teams during 2018 for their valuable insights and assistance. Special thanks are due to: Mr. Giovanni Capannelli, Country Director, Kazakhstan, and Mr. Pradeep Srivastava, Country Director, Tajikistan, all at the Asian Development Bank (ADB); Mr. Reza Mohammadi, Field Coordinator, Kazakhstan, UNCTAD; Mr. Ato Brown, Country Manager for Kazakhstan, Mr. Jan-Peter Olters, Country Manager Uzbekistan, Mr. Paul Vallely, Programme Leader for Connectivity and Infrastructure, and Ms. Mathilde Lebrand, all at the World Bank; Ms. Ekaterina Miroshnik, Director, Head of Infrastructure, Russia, Central Asia and Mongolia, Ms. Irina Kravchenko, Country Director Mongolia, Ms. Ayten Rustamova, Country Director Tajikistan, and Ms. Idil Bilgic-Alpaslan, Principal Infrastructure Economist, all of the European Bank for Reconstruction and Development (EBRD); Mr. David Oberhuber, former Programme Manager, Mr. Jens Schlechter, Advisor, and Ms. Asel Uzagalieva, Component Manager, Trade Facilitation in Central Asia, all of the German Development Agency (GIZ); Mr. Hideki Tanabe, Country Director, Japanese International Cooperation Agency; Mr. Temirbek Shabdanaliev, Chairman, Association of Freight Forwarders of Kyrgyzstan; Ms. Battsetseg Jorsuren, President, and Ms. Tsatsral Tsengel, Director of International Affairs, Mongolian Customs Consultants and Brokers Association; Ms. Tsogzolmaa Sanjaa, Foreign Relations Officer of the National Road Transport Association of Mongolia (NARTAM); Ms. Nurisa Diushembieva, BOMCA 9 Deputy Regional Manager in Central Asia, EU Border Management Programme in Central Asia (BOMCA); and Mr. Marco Ferri, Minister Counsellor, Delegation of the European Union to Mongolia, Mr. Federico Birocchi, Head of Trade and Energy Section, Delegation of the European Union to Kazakhstan, Ms. Zulfiya Davlatbekova, Project Manager, Delegation of the European Union to Tajikistan, Mr. Ovidiu Mic, former Head of Co-operation, and Mr. Elbek Khodjaev, Project Manager, Delegation of the European Union to Uzbekistan; Mr. Bekhzod Rakhmatov, Associate Economic Affairs Officer at the Transport Division, United Nations Economic and Social Commission for Asia and the Pacific (UNESCAP).
Final editorial and visual support was provided by Ms Vanessa Berry-Chatelain, Communications Manager, OECD Global Relations Secretariat. Valuable administrative support was provided by Ms. Tatyana Skritskaya, Assistant to the Group on Road Transport, ITF; and Ms. Anna Chahtahtinsky and Ms. Eugenia Klimenka, Assistants within the OECD Eurasia Division.

TABLE OF CONTENTS
ENHANCING CONNECTIVITY AND FREIGHT IN CENTRAL ASIA © OECD/ITF 2019 5
Table of contents
Executive summary ................................................................................................ ............................. 9
1. Introduction ................................................................................................................................ .. 13
Setting the scene: an overview of Central Asian countries ........................................................... 14 Enhancing connectivity in Central Asia: challenges and opportunities ......................................... 23 An evidence-based framework for strategic connectivity planning .............................................. 27
References ................................................................................................................................ ........ 31
2. Connectivity in Central Asia within the global transport system................................ .................... 33
Underlying trade and freight projections ...................................................................................... 34 Assessment framework for freight connectivity............................................................................ 44 Results from freight connectivity analysis for Central Asia ........................................................... 51 Moving forward: cost and travel time reduction is the key........................................................... 62 Enhancing connectivity does not automatically lead to economic benefits.................................. 63
References ................................................................................................................................ ........ 66
3. Benchmarking national freight systems ................................................................ ......................... 68
Transport infrastructure in Central Asia ........................................................................................ 68 Transport services and logistics in Central Asia ............................................................................. 76 Customs policies in Central Asia .................................................................................................... 85
References ................................................................................................................................ ........ 91
4. Transport planning and governance for better connectivity ................................ ......................... 93
Transport planning ........................................................................................................................ 94 Governance and regulation ......................................................................................................... 112 Sustainability ............................................................................................................................... 120 Towards better planning and governance: recommendations across the three dimensions ..... 126
References ...................................................................................................................................... 130
5. Key recommendations ................................................................................................................. 132
Strengthening international and regional co-operation to enhance connectivity ...................... 132 Key recommendations for Tajikistan ........................................................................................... 134 Key recommendations for Kyrgyzstan ......................................................................................... 137 Key recommendations for Uzbekistan ........................................................................................ 138 Key recommendations for Mongolia ........................................................................................... 140 Key messages for Kazakhstan ...................................................................................................... 142
References ...................................................................................................................................... 148
Annex 1. The International Transport Forum’s International Freight Model .................................... 149
References ...................................................................................................................................... 155
Annex 2. Impact of distance on reaching global centres of production and consumption ............... 156
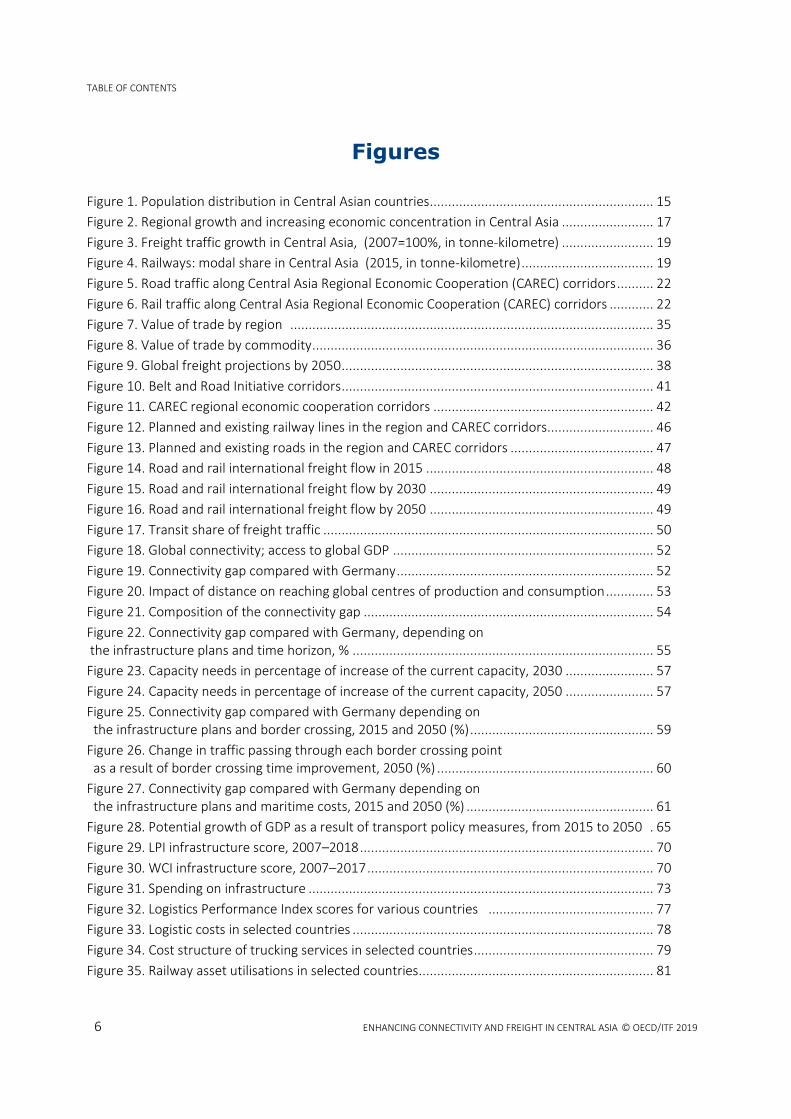
TABLE OF CONTENTS
6 ENHANCING CONNECTIVITY AND FREIGHT IN CENTRAL ASIA © OECD/ITF 2019
Figures
Figure 1. Population distribution in Central Asian countries................................ ............................. 15
Figure 2. Regional growth and increasing economic concentration in Central Asia ......................... 17
Figure 3. Freight traffic growth in Central Asia, (2007=100%, in tonne-kilometre) ......................... 19
Figure 4. Railways: modal share in Central Asia (2015, in tonne-kilometre) ................................ .... 19
Figure 5. Road traffic along Central Asia Regional Economic Cooperation (CAREC) corridors .......... 22
Figure 6. Rail traffic along Central Asia Regional Economic Cooperation (CAREC) corridors ............ 22
Figure 7. Value of trade by region ................................................................................................ ... 35
Figure 8. Value of trade by commodity ................................................................ ............................. 36
Figure 9. Global freight projections by 2050 ................................................................ ..................... 38
Figure 10. Belt and Road Initiative corridors ................................................................ ..................... 41
Figure 11. CAREC regional economic cooperation corridors ................................ ............................ 42
Figure 12. Planned and existing railway lines in the region and CAREC corridors ............................. 46
Figure 13. Planned and existing roads in the region and CAREC corridors ................................ ....... 47
Figure 14. Road and rail international freight flow in 2015 ................................ .............................. 48
Figure 15. Road and rail international freight flow by 2030 ................................ ............................. 49
Figure 16. Road and rail international freight flow by 2050 ................................ ............................. 49
Figure 17. Transit share of freight traffic ................................................................ .......................... 50
Figure 18. Global connectivity; access to global GDP ................................................................ ....... 52
Figure 19. Connectivity gap compared with Germany ................................................................ ...... 52
Figure 20. Impact of distance on reaching global centres of production and consumption ............. 53
Figure 21. Composition of the connectivity gap ................................................................ ............... 54
Figure 22. Connectivity gap compared with Germany, depending on the infrastructure plans and time horizon, % ................................................................ .................. 55
Figure 23. Capacity needs in percentage of increase of the current capacity, 2030 ........................ 57
Figure 24. Capacity needs in percentage of increase of the current capacity, 2050 ........................ 57
Figure 25. Connectivity gap compared with Germany depending on the infrastructure plans and border crossing, 2015 and 2050 (%) ................................ .................. 59
Figure 26. Change in traffic passing through each border crossing point as a result of border crossing time improvement, 2050 (%) ................................ ........................... 60
Figure 27. Connectivity gap compared with Germany depending on the infrastructure plans and maritime costs, 2015 and 2050 (%) ................................ ................... 61
Figure 28. Potential growth of GDP as a result of transport policy measures, from 2015 to 2050 . 65
Figure 29. LPI infrastructure score, 2007–2018 ................................................................ ................ 70
Figure 30. WCI infrastructure score, 2007–2017 ................................................................ .............. 70
Figure 31. Spending on infrastructure ................................................................ .............................. 73
Figure 32. Logistics Performance Index scores for various countries ................................ ............. 77
Figure 33. Logistic costs in selected countries ................................................................ .................. 78
Figure 34. Cost structure of trucking services in selected countries ................................ ................. 79
Figure 35. Railway asset utilisations in selected countries................................................................ 81

TABLE OF CONTENTS
ENHANCING CONNECTIVITY AND FREIGHT IN CENTRAL ASIA © OECD/ITF 2019 7
Figure 36. Staff productivity in selected countries................................................................ ............ 81
Figure 37. Crossing times for road freight at selected borders ................................ ......................... 87
Figure 38. Border crossing costs (top) and times (bottom) along CAREC corridors .......................... 88
Figure 39. Trade Facilitation Indicators for Central Asian countries, benchmarked against South Africa, 2017 ................................................................ ........................ 90
Figure 40. Policy framework and implementation cycle ................................................................ ... 94
Figure 41. Planning: Dimension average scores and indicator scores................................ ............... 94
Figure 42. Governance and regulation: Sub-dimension average scores and indicator scores ........ 113
Real-time information display ......................................................................................................... 119
Figure 43. Sustainability: Sub-dimension average scores and indicator scores .............................. 121
Figure 44. Scores for the three dimensions of transport planning and regulation ......................... 126
Figure 45. Border crossing time at the Kulma pass border crossing point ...................................... 136
Figure 46. Heavy duty truck age and number of employees per road transport company in Kyrgyzstan ..................................................................................... 138
Figure 47. Investments in roads by location in Mongolia (%) ......................................................... 141
Figure 48. Aimags’ GDP between 1995 and 2015 ........................................................................... 141
Tables
Table 1. Key economic indicators for Central Asian countries, 2017 ................................ ................ 15
Table 2. Current and planned transport corridor projects in Central Asia ................................ ........ 40
Table 3. Impact of increased sea transport cost on modal share of China–Europe transport .......... 51
Table 4. Infrastructure capacity required to maintain network performance, 2030 and 2050 56
Table 5. Border crossing reduction effect on countries' needs for
infrastructure increase, transit flow and total flow, 2050 (% of change) ................................ .......... 59
Table 6. Effect of a global 50% maritime cost increase on countries' needs for an infrastructure increase, and traffic flow increase, % of the increase, 2050 ........................... 62
Table 7. Transport infrastructure provision in Central Asian countries and comparators ................ 71
Table 8. Road design in Central Asian core national networks ................................ ......................... 72
Table 9. Implementation of Road Asset Management systems ................................ ........................ 75
Table 10. Assessment of logistics services by local logistics professional ................................ ....... 84
Table 11. National strategies for transportation development ................................ ........................ 96
Boxes
Box 1. Dordoi and Kara-Suu Bazaars ................................................................................................ . 20
Box 2. Agglomeration economies ................................................................................................ ..... 26
Box 3. Modelling framework for long-term global trade scenarios ................................ .................. 33
Box 4. The ITF International Freight Model................................................................ ....................... 37
Box 5. The Trans-European Transport Network (TEN-T) ................................................................ ... 43
Box 6. Measuring the connectivity gap ................................................................ ............................. 45
Box 7. Road user charging in New Zealand ................................................................ ....................... 75

TABLE OF CONTENTS
8 ENHANCING CONNECTIVITY AND FREIGHT IN CENTRAL ASIA © OECD/ITF 2019
Box 8. Chile’s National Public Investment System (SNIP) ................................................................ .. 76
Box 9. Supporting the creation of shortliners in France: Les opérateurs ferroviaires de proximité .. 83
Box 10. The National Transport Strategy and Strategic Transport Projects Review of Scotland ..... 101
Box 11. Chile investment and project appraisal system .................................................................. 103
Box 12. Risk management tools applied Europe ............................................................................. 105
Box 13. The National Project Management Agency under the President of the Republic of Uzbekistan ......................................................................................... 109
Box 14. Features of developed highway asset management systems ............................................ 111
Box 15. Costs and benefits of separation in the railway industry ................................................... 115
Box 16. Border wait times displayed online in real time ................................................................. 119
Box 17. Examples of different types of logistics observatories ....................................................... 125
Box 18. Web-based transport analysis guidance in England ........................................................... 145
Box 19. A German initiative to increase the reliability of transport infrastructures ....................... 145

EXECUTIVE SUMMARY
ENHANCING CONNECTIVITY AND FREIGHT IN CENTRAL ASIA © OECD/ITF 2019 © OECD/ITF 2019 9
Executive summary
What we did
This report provides advice to the Central Asian governments (Kazakhstan, Kyrgyzstan, Mongolia, Tajikistan and Uzbekistan) on the most pressing issues related to freight connectivity, with a focus on transport infrastructure, logistics and institutional capacity. Three streams of analysis are applied to assess connectivity and infrastructure needs in Central Asia: (i) an assessment of the regional large-scale infrastructure programmes and of their capacity to improve connectivity; (ii) a benchmarking of the national freight transport policies against OECD best practices; and (iii) a qualitative assessment of the countries’ capability to design and evaluate freight-related policies, especially when it comes to long-term infrastructure and policy plans. The findings are supported by a review of the literature, interviews with key stakeholders across all sectors, and information collected during fact-finding missions to all five countries.
What we found
Planned investments in the region will improve connectivity but increased transit flows will be a challenge
There is a significant connectivity gap between the Central Asian countries and the most logistically-advanced countries. The Central Asian countries can access 50% less economic opportunities, as measured in terms of world gross domestic product (GDP), than Germany, for example. Current investment plans will increase connectivity by 8% but improving non-infrastructure elements of connectivity, such as border crossings, is still needed.
By attracting a share of the freight flows from the People’s Republic of China to Europe, planned infrastructure will contribute to the increase of transit traffic. This will bring challenges along with benefits. On some corridors, freight flows could triple by 2050, putting considerable stress on the region’s infrastructures. Transit traffic will also be accompanied by negative consequences in terms of increased maintenance costs, congestion, local pollution and road safety, issues that are already faced in many Central Asian countries.
International infrastructure projects foster investments on main corridors but shift attention away from domestic connectivity
In recent years international projects have increased expenditure on road and rail significantly to 1% of GDP which is in line with international standards. Local and regional roads are, however, in poor condition as the continued underfunding of maintenance has left them in a state of disrepair. Existing infrastructure plans focus on key international corridors, but ensuring the connectivity of local business to key corridors is also crucial for realising the benefits from agglomeration economies. Some of these routes will gain a substantial flow increase as soon as 2030. These include routes in the north of Kazakhstan, as well intra-regional routes such as Samarkand – Dushanbe, Kyzylorda – Urganch, and Tashkent – Khujand.
EXECUTIVE SUMMARY
10 ENHANCING CONNECTIVITY AND FREIGHT IN CENTRAL ASIA © OECD/ITF 2019
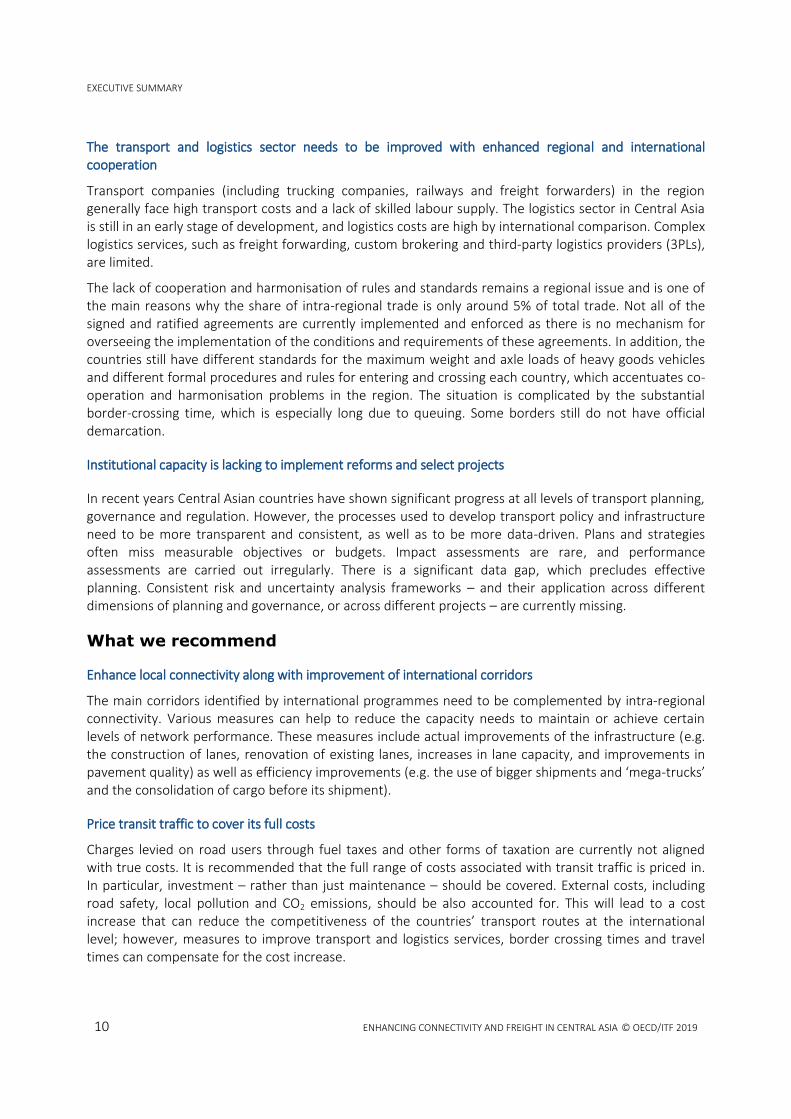
The transport and logistics sector needs to be improved with enhanced regional and international cooperation
Transport companies (including trucking companies, railways and freight forwarders) in the region generally face high transport costs and a lack of skilled labour supply. The logistics sector in Central Asia is still in an early stage of development, and logistics costs are high by international comparison. Complex logistics services, such as freight forwarding, custom brokering and third-party logistics providers (3PLs), are limited.
The lack of cooperation and harmonisation of rules and standards remains a regional issue and is one of the main reasons why the share of intra-regional trade is only around 5% of total trade. Not all of the signed and ratified agreements are currently implemented and enforced as there is no mechanism for overseeing the implementation of the conditions and requirements of these agreements. In addition, the countries still have different standards for the maximum weight and axle loads of heavy goods vehicles and different formal procedures and rules for entering and crossing each country, which accentuates co-operation and harmonisation problems in the region. The situation is complicated by the substantial border-crossing time, which is especially long due to queuing. Some borders still do not have official demarcation.
Institutional capacity is lacking to implement reforms and select projects
In recent years Central Asian countries have shown significant progress at all levels of transport planning, governance and regulation. However, the processes used to develop transport policy and infrastructure need to be more transparent and consistent, as well as to be more data-driven. Plans and strategies often miss measurable objectives or budgets. Impact assessments are rare, and performance assessments are carried out irregularly. There is a significant data gap, which precludes effective planning. Consistent risk and uncertainty analysis frameworks – and their application across different dimensions of planning and governance, or across different projects – are currently missing.
What we recommend
Enhance local connectivity along with improvement of international corridors
The main corridors identified by international programmes need to be complemented by intra-regional connectivity. Various measures can help to reduce the capacity needs to maintain or achieve certain levels of network performance. These measures include actual improvements of the infrastructure (e.g. the construction of lanes, renovation of existing lanes, increases in lane capacity, and improvements in pavement quality) as well as efficiency improvements (e.g. the use of bigger shipments and ‘mega-trucks’ and the consolidation of cargo before its shipment).
Price transit traffic to cover its full costs
Charges levied on road users through fuel taxes and other forms of taxation are currently not aligned with true costs. It is recommended that the full range of costs associated with transit traffic is priced in. In particular, investment – rather than just maintenance – should be covered. External costs, including road safety, local pollution and CO2 emissions, should be also accounted for. This will lead to a cost increase that can reduce the competitiveness of the countries’ transport routes at the international level; however, measures to improve transport and logistics services, border crossing times and travel times can compensate for the cost increase.

EXECUTIVE SUMMARY
ENHANCING CONNECTIVITY AND FREIGHT IN CENTRAL ASIA © OECD/ITF 2019 11
Reform road investment and maintenance funding
There is a clear need for stable funding flows dedicated to road maintenance. The fund should be covered through road-user charges that reflect the marginal cost of road use, rather than through general taxation. Although several road funds already exist in Central Asian countries, they should be restructured so as to have a strong legal basis, act as independent executive authorities, and benefit from in-house technical capacity. Furthermore, investment and maintenance should be allocated through separate budgets. It is advised to complement this with a systematic prioritisation of interventions through better road-asset management systems.
Pursue private investments for cost efficiency
Private finance needs to be pursued on the right merits to avoid the political unsustainability of private investment in infrastructure. The countries should keep in mind, however, that international experience shows that PPPs can help to solve the problem of financing but not of funding. Therefore, the governments should pursue private investments for cost efficiency only and in areas where there is continuous pressure for efficiency, such as competition. The countries should also consider adopting the International Public Sector Accounting Standards (IPSAS 32) to maximize the value for money of private investments.
Support the creation of a modern logistics sector
Policy-makers need to foster the development of the logistic sector through incentives to support professional training and higher education in areas of logistics and transport, and through the involvement of the private sector in the design of national logistics policies. Barriers to market entry should be reduced to attract leading international firms. There is a need to enhance productivity in both the rail and road freight sectors through the adequate regulation of these sectors.
Institutionalise best practices in transport planning
In a context of increasing infrastructure needs and constrained public budgets, the Central Asian countries need to maximise the value for money of their transport investments. The countries should introduce standards for data collection and ensure continued data collection, updates and sharing between relevant actors. Logistics observatories established at national and regional levels can serve as data collection and processing centres. Their key activities could include data collection, analysis, dissemination and benchmarking for policy support. Quantitative models should be used for forecasting traffic. Cost-benefit analysis (CBA) should be applied systematically, with a level of complexity adapted to the scale of each project. Publicly available guidelines, containing values of key parameters to assess costs and benefits, should be produced to document the assessment methodology. Ex-post evaluation of projects should be conducted on a systematic basis to provide feedback. Strategies and other planning frameworks should also account for risks and uncertainties, including their identification, assessment and treatment.
Set performance standards for customs
Significant progress has been made in terms of customs performance. However, border crossing times are still long and highly unpredictable. Moreover, the variability of border crossing times is increasing. This is of particular importance as shippers tend to value consistency in crossing times more than overall travel time itself. A comprehensive set of performance standards for customs would be useful to identify key areas of improvements and monitor them.

EXECUTIVE SUMMARY
12 ENHANCING CONNECTIVITY AND FREIGHT IN CENTRAL ASIA © OECD/ITF 2019
Straighten regional and international cooperation
The countries should continue developing regional agreements aimed at formalising the regional rail, road and dry ports networks as part of an integrated network. The countries also should ensure the enforcement of regional and international agreements at the national level. Executive bodies should receive detailed directives allowing them to enforce agreements. The countries should consider establishing oversight bodies and adopting corresponding mechanisms to ensure intergovernmental supervision of the implementation and application of the agreements and related guarantees. In order to ensure transparency for the participating countries and public, the adoption of a mechanism of reporting to an intergovernmental oversight body should be considered. The countries should also continue harmonising freight-related standards (e.g. train length and, for heavy vehicles, maximum weight and axle loads) and related legislation in the region and with their neighbours.

INTRODUCTION
ENHANCING CONNECTIVITY AND FREIGHT IN CENTRAL ASIA © OECD/ITF 2019 © OECD/ITF 2019 13
1. Introduction
Central Asia has in recent decades been relatively peripheral to global trade flows, despite its historical role as a land bridge between Asia and Europe. The freight volumes passing through the region between Asia and Europe are currently less than 2% of what is carried by sea. Very little cargo traffic between Asia and Europe goes overland, except for what goes by rail through the Russian Federation.
This is changing, however. Rail links between the People’s Republic of China and Europe, both existing and planned, have attracted interest, as they offer a potential advantage a vis-à-vis the shipping link through the Suez Canal. Two potential game-changers – the Eurasian Economic Union and China’s Belt and Road Initiative (BRI) – may further encourage new trade and transport connections in the region (ITF, 2017; Rastogi and Arvis, 2014).
Central Asia also figures prominently in a variety of other initiatives and plans for enhancing connectivity and integration across Europe and Asia. These include the European Union’s TRACECA1 initiative and the New Silk Road (NSR) backed by the United States, as well as various projects sponsored by India and other actors to promote connectivity in the region, such as the International North–South Transport Corridor or the proposed Central Asian Regional Economic Cooperation (CAREC)2 corridors.
Today, Central Asia lags on several dimensions of connectivity and integration (Pomfret, 2010; Rastogi and Arvis, 2014; ADB, 2014), hindering the development of trade. The region’s economic integration is limited by the low density of settlement and economic activity, infrastructure bottlenecks, ageing road and rail networks, and long distances to major markets. It is also constrained by numerous regulatory and policy barriers to cross-border flows. Moreover, the existing connectivity pattern is largely a product of the region’s reliance on exports of primary products and is oriented towards Russia.
The centre of gravity of the world economy is gradually but steadily shifting east and south as a result of GDP growth in Asia. This will also affect production and consumption patterns and hence international trade and supply chains. Economic growth in emerging regions increases the need to improve freight infrastructure to meet growing trade demands. The existing freight infrastructure and related policies may need to change if the Central Asian countries wish to diversify their economic structures (OECD, 2018) and benefit fully from the increasing trade between Asia and Europe.
This report assesses freight connectivity in Central Asia, with a focus on Kazakhstan, Kyrgyzstan, Mongolia, Tajikistan and Uzbekistan. It begins by analysing the current level of connectivity in the region (relative to the needs of the regions’ economies) and the efficiency of the region’s freight and logistics networks; it then reviews the region’s transport and logistics strategies, including infrastructure investments plans. It also identifies possible future bottlenecks and missing links under alternative trade and policy scenarios. The report provides advice on ways to improve connectivity and recommendations for improving the policy process and for regional co-ordination to improve freight efficiency and connectivity.
After presenting the Central Asian regional context, the report reviews the importance of transport connectivity for economic development and discusses current regional ambitions to enhance connectivity. An overview of the International Transport Forum’s (ITF) framework for assessing connectivity and infrastructure needs is also provided. Subsequent chapters offer detailed assessments of regional connectivity (Chapter 2), benchmarking of national freight systems (Chapter 3), and the

INTRODUCTION
14 ENHANCING CONNECTIVITY AND FREIGHT IN CENTRAL ASIA © OECD/ITF 2019
institutional capacity in terms of transport planning and governance (Chapter 4). The report concludes with recommendations for improving planning and governance, sets out policy options to improve connectivity, and highlights the data needed to support decision-making and regional co-operation.
Setting the scene: an overview of Central Asian countries
Central Asian countries have challenging geographies and low population density
The varied geography of Central Asia presents a number of region-specific challenges for increasing the connectivity of its countries. The southeast of the region is bounded by high mountain ranges. In countries such as Tajikistan and Kyrgyzstan, where mountains cover 87% and 94% of the countries, respectively (FAO, 2016), transport and major roads often have to take circuitous routes or pass through high, dangerous passes. A spectacular example is that of the Torugart pass, a strategic border crossing point and the most direct road link between Kyrgyzstan and the Xinjiang Autonomous Region of China. At an elevation of over 3 700 meters, it is remote and has extreme weather that causes it to be closed for several months a year. By contrast, Central Asia also has some of the largest desert and steppe regions in the world, from the Great Dala steppe of Northern Kazakhstan to the Kyzyl Kum of Western Uzbekistan and the Gobi Desert of Mongolia. The combination of impenetrable mountain ranges and vast expanses of underdeveloped land, with the concomitant problem of large distances (both domestic and international) between population and production centres, make it difficult to develop and implement a region-wide programme for improving connectivity.
Low population density is a common feature among Central Asian countries. With the exception of Uzbekistan, the Central Asian countries have some of the lowest population densities in the world. The average density is 13.7 people per km2, compared with 136 in China and 150 in Western Europe. Mongolia, the least densely populated country of the region, has a population similar to that of Lithuania living in an area the size of South Africa. With less than one inhabitant per km2, Mongolia is in fact one of the least densely populated countries in the world, just behind Greenland.
The region’s population is concentrated in medium-sized cities. An important phase of the region’s urbanisation took place under planned economies, and the current situation is still mainly a reflection of that. As a result of the Soviet approach to urbanisation, the majority of urban communities are small and medium-sized towns with populations of not more than 100 000, mostly between 10 000 and 50 000. Such cities account for about 16% of the urban population in Kazakhstan, 25% in Kyrgyzstan, 35% in Tajikistan, and about 35% in Uzbekistan. Human settlement patterns tend to be less concentrated than in OECD countries. For example, the Kazak population is half as concentrated as other large, low-density countries such as Australia, Canada or Brazil.
Figure 1 depicts the region’s general population distribution. It highlights the main urban centres, which are rather isolated – with the exception of the historic settlements of the Silk Road. The route between Bukhara, Samarkand, and Tashkent up to Adihzhan in the Ferghana valley forms a relatively densely populated corridor, sharply contrasting with the rest of the region.
This type of geography is extremely challenging from a transport perspective. There are very few consumption centres within the regions, and connecting them is difficult. On the one hand, this means that the economy is scattered and that an efficient transport system is essential to connect it. On the other hand, expected traffic levels will be low, and the geographical conditions yield high infrastructure unit costs with a low rate of return for infrastructure projects.

INTRODUCTION
ENHANCING CONNECTIVITY AND FREIGHT IN CENTRAL ASIA © OECD/ITF 2019 15
Figure 1. Population distribution in Central Asian countries
Source: ITF computations based on the Global Human Settlement Layer (Pesaresi et al., 2013).
Table 1. Key economic indicators for Central Asian countries, 2017
Countries GDP (USD billion
2015)
Population (million
inhabitants)
Area (‘000 km
2)
Density (inhabitants
per km2)
GDP per capita (USD)
Urbanisation rate (% of population
living in urban areas)
Annual GDP growth average
(2005-2017)
Kazakhstan 184 18.0 2700 7 10510 57% 5.4%
Kyrgyzstan 7 6.2 192 32 1070 36% 4.6%
Mongolia 13 3.1 1554 2 4071 68% 7.5%
Tajikistan 9 8.9 139 64 1015 27% 6.8%
Uzbekistan 66 32.4 425 76 2031 51% 8.0%
Total 290 68.6 5009 14 4224 49% 6.7%
Lower-middle-income countries
— — — 135 2189 40% 5.9%
Upper-middle-income countries
— — — 46 8225 65% 5.4%
Source: World Development Indicators (World Bank, 2017).
Fast-changing economies will lead to new transport needs
As shown in Table 1, the region’s real GDP grew at an average rate of 6.7% between 2005 and 2017. This was despite a significant slowdown caused by the global drop in commodity prices in 2014-15. This strong economic dynamic is shared by all the region’s countries, whose annual growth rates (as estimated by the World Bank) vary from 4.6% (Kyrgyzstan) to 8% (Uzbekistan). In general, hydrocarbons and mineral commodities have been the main drivers of growth. One-fourth of Mongolia’s GDP is produced by its mining industry, and the country is a growing exporter of copper. Kazakhstan is major oil

INTRODUCTION
16 ENHANCING CONNECTIVITY AND FREIGHT IN CENTRAL ASIA © OECD/ITF 2019
producer and has large reserves of a wide range of metallic ores, industrial minerals, and fuels. Uzbekistan is one of the leading world producers of gold and has large gas resources. Although the economies of the Kyrgyzstan and Tajikistan are less commodity-intensive, gold still represents a large share of their exports. The end of the commodity super-cycle, however, led to high year-on-year growth variations in the region – particularly in Kazakhstan and Mongolia, where the economic growth rate was slightly over 1% in 2016.
The economic weight of the region is small and geographically concentrated in medium-sized cities. The countries’ cumulative GDP is 470 billion in 2015 USD. India’s GDP is five times higher, for an area which is three times smaller. As in most OECD countries, the geographical concentration (in GDP) is higher than the one in population, reflecting agglomeration effects. Central Asian economies tend to be heavily concentrated both spatially and in terms of economic sectors. Historically, much of the Central Asia’s industrial capacity has been concentrated in mono-functional cities, where most of the population has worked for a single industry. Examples are numerous: In Kazakhstan, the cities of Arkalyk, Tekeli, and Zhitikara are mining cities where most activities are operated by a single company which is responsible for most of the industrial production of its oblast. Tursunzoda, a city of 40 000 inhabitants in Tajikistan, is home to the Tajik Aluminium Company, one of the largest aluminium plants in the world and Tajikistan’s chief industrial asset.
However, the Central Asian economies are rapidly shifting away from this model. Economic activities and settlement patterns are becoming increasingly concentrated in large cities. Regional growth has been extremely uneven since 1995 in terms of both population and value added (see Figure 2). The economic capitals, including Almaty, have been acting as growth poles, while most other regions are lagging behind. The weight of the economic capitals in the regional economy has dramatically increased in recent decades, from 40% of the total GDP of Central Asia in 1995 to more than 60% in 2015. Only a few secondary growth poles contribute significantly to national growth. All of them either are natural-resource-intensive regions or benefit from economies of agglomeration. Examples include the Qyzlorda region in Kazakhstan, which has benefited from a cluster of activities around the Baikonur Cosmodrome; and the Ömonogovi region in Mongolia, where Oyu Tolgoi, a major open-pit copper mine, was constructed in 2013.
Economic diversification is high on the regional policy agenda. The Central Asian governments are increasingly acknowledging that their economies’ dependence on limited commodities has severe drawbacks. As a result, several policies supporting small and medium-sized enterprises are being implemented.
Here again, considerable challenges are associated with increasing economic concentration and rapid growth. There is a strong demand for infrastructure around growth poles. Large mining sites are producing large flows of bulk materials, and spatial inequity is increasing. The diversification of the economy creates a demand for more sophisticated logistics services.

INTRODUCTION
ENHANCING CONNECTIVITY AND FREIGHT IN CENTRAL ASIA © OECD/ITF 2019 17
Figure 2. Regional growth and increasing economic concentration in Central Asia
Source: ITF computations based on GIS data from (Kummu et al., 2018).

INTRODUCTION
18 ENHANCING CONNECTIVITY AND FREIGHT IN CENTRAL ASIA © OECD/ITF 2019
Transport flows in Central Asia are increasing
Volumes transported by the surface modes – rail, road and waterways – in Central Asia increased by 49% between 2007 and 2015, measured in tonne-kilometres (see Error! Reference source not found.). This orresponds to an annual growth of 5% and is significantly more than in most high-income and upper-middle-income countries. In Western countries, freight transport decreased significantly after the 2008 crisis and has not yet recovered to pre-crisis levels. In Eastern Europe, freight transport is still growing, but at almost half the rate (2.8%) of Central Asia. Yet a growth of this order of magnitude is expected given the economic growth of the region, which was 4.9% per year during that time frame. The freight intensity (in this case, the long-run elasticity of freight activities) usually depends on income levels and is typically around 1 in middle-income countries. As a country grows richer, its economy tends to be less freight-intensive and there is, to a certain extent, a decoupling between economic growth and transport flows.
There is a great degree of variation in the development and nature of transport flows across the region. In Tajikistan, for example, freight flows are growing faster than in the rest of the region because the country has a more freight-intensive economy, relying heavily on agricultural products (especially cotton), mining products and, to a lesser extent, aluminium production. Mongolia’s transport freight flows are extremely volatile – reflecting the variability of its overall economy, which depends primarily on the mining sector.
Rail’s modal share in the region is high (Error! Reference source not found.) but declining. Everywhere in he region, with the notable exception of Tajikistan, the modal share of rail is high compared to international standards. In most Central Asian countries, over 40% of freight (in tonne-kilometres) is transported by rail, as compared to around 20% in European countries (regardless of income level). There are three main reasons for this. First, the region has a well-developed railway network, with good geographical coverage. Second, the types of goods transported – namely bulk freight, including mining and agricultural products – are well suited for railway transport. Finally, the generally poor state of the road network plays a role.
Tajikistan’s low modal share of rail transport is due in part to the nature of its rail network. After the fall of the Soviet Union it was separated into two, non-connected branches that do not serve the national economy adequately. In the north, a railway line crosses Tajikistan, linking Tashkent and the Fergana Valley in Uzbekistan. In the south, a line connects Dushanbe with southern Uzbekistan and the rest of the former Soviet railway network via Turkmenistan. Furthermore, a significant drop in freight traffic occurred after 2009, when a dispute arose with Uzbekistan because of a reduction in Uzbek transit through the northern branch of Tajik railways and a complete blockade of the southern branch. However, if relationships with the Uzbek authorities continue to improve, it is possible that rail activity will return to its former level. (The Kyrgyz railway network is in a similar situation, with two unconnected lines; but it has been less affected due to easier border-crossing conditions.)
As the Central Asian economies diversify, the demand for transport is likely to shift towards road freight. This is indeed what recent trends are showing. Although rail freight (measured in tonne-kilometres) is increasing in all Central Asian countries, it is doing so at a slower pace than road freight. Rail freight grew by 4% per year between 2007 and 2015, compared to an 11% increase for road freight. Consequently, rail’s market share is declining.

INTRODUCTION
ENHANCING CONNECTIVITY AND FREIGHT IN CENTRAL ASIA © OECD/ITF 2019 19
Figure 3. Freight traffic growth in Central Asia, (2007=100%, in tonne-kilometre)
Source: National statistics agencies.
Figure 4. Railways: modal share in Central Asia (2015, in tonne-kilometre)
Source: National statistics agencies.

INTRODUCTION
20 ENHANCING CONNECTIVITY AND FREIGHT IN CENTRAL ASIA © OECD/ITF 2019
International exchanges are fuelling traffic growth
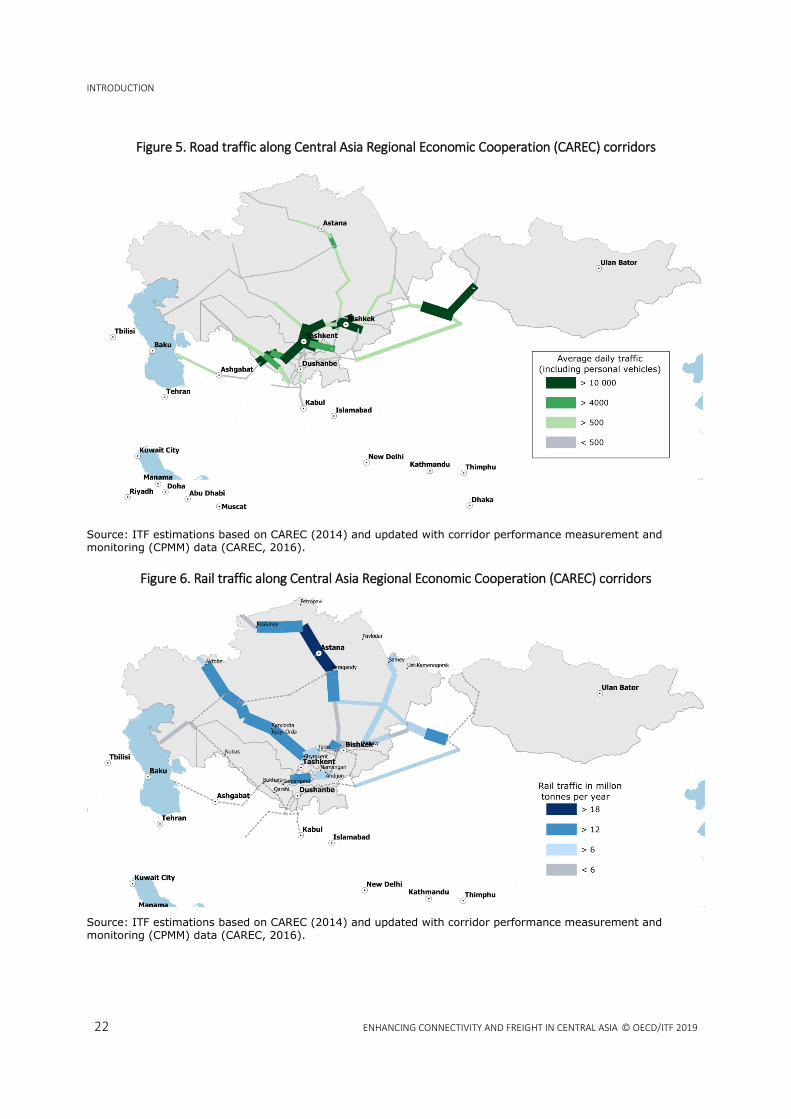
Central Asian road freight flows are largely concentrated around population nodes, and traffic at border-crossing points is light. Figure 5 presents road traffic on the region’s strategic network. In urbanised areas such as the Samarkand–Tashkent–Andijan corridor, road traffic levels can be high, with an average daily traffic of more than 10 000 vehicles (including private vehicles). This is in line with OECD countries, where average traffic on corridors serving densely populated areas typically ranges between 10 000 and 20 000 vehicles per day (UNECE, 2018). In remote rural areas, road traffic quickly decreases to less than 3 000 vehicles per day. Between 50% and 70% of those are trucks operating on inter-urban services. At border crossings points, traffic volume tends to drop to 100-300 trucks a day. This suggests that road freight is serving mainly local markets. Official statistics confirm this, as they show that the average shipment distance is under 100 km. It is 60 km in Tajikistan, and only 20 km in Uzbekistan.
International road transport in the region is developing fast, even if its relative share is still limited. As road links and border crossing points are improved, an increasing number of trucks are crossing the region’s borders. In the first decade of this century, a typical border crossing point in Central Asia would deal with 10-30 trucks. Today, this number is ten times higher in some locations.
Rail freight has historically been serving international demand – that is, import, export and transit. Figure 6 shows that rail freight flows are high along the main economic corridors of the region. The major player in terms of rail freight activity in the region is Kazakhstan, with over 80% of the total activity, equalling over 200 billion tonne-kilometres per year. This is due mainly to the country’s size (in terms of both its area and its economy), but also to the importance of international traffic. Kazakhstan benefits from its strategic location, with most of the freight originating from Europe and Asia having to transit through Kazakhstan to reach Uzbekistan, Tajikistan or the Kyrgyzstan. International traffic is further fuelled by the increasing economic exchange between Central Asian countries.
Box 1. Dordoi and Kara-Suu Bazaars
Bazaars are place of significant economic activity in the Kyrgyzstan. The Dordoi market in Bishkek is the largest public market in Central Asia and also among the largest in all of Asia; it consists of 15 large, independent markets covering about 250 hectares. Kara-Suu, near Osh city, is a marketplace of comparable size. Both bazaars sell consumer goods imported mainly from China but also from Turkey, the United Arab Emirates, Eastern Europe, and Russia. Although there is hawking and retailing, Dordoi and Kara-Suu are mainly wholesale markets. They act as logistic hubs for imported merchandise and its circulation within the country and with neighbouring republics.
The informal nature of bazaar economies makes them difficult to quantify. It is evident, however, that a significant fraction of Kyrgyz imports are re-exported through them to neighbouring countries. In 2008, the re-export accounted for 33% of Kyrgyz GDP. Most of the re-exported goods are imported through shuttle trading from China and then consolidated in the bazaars for re-shipment.
The markets also generate a large number of jobs. Saumya Mitra et al. (2009) estimated that the Dordoi bazaar accounted for more than 10% of the employed labour force of Bishkek. The employment effects include not only people directly employed there, but also providers of logistics services.
Source: Mogilevskii (2012).

INTRODUCTION
ENHANCING CONNECTIVITY AND FREIGHT IN CENTRAL ASIA © OECD/ITF 2019 21
The route from Khorgos to Astana up to the Russian border in particular has witnessed an intense increase of activity subsequent to the opening of Khorgos dry port. Since it started operations, container flows between Asia and Europe have increasingly been shipped by train through Kazakhstan. The transit flow rose from 25 000 20-foot equivalent units (TEUs) in 2014 to 200 000 in 2017. With 40 billion tonne-kilometres per year, international traffic represents one-fifth of the total rail-freight activity of Kazakhstan and is increasing at over 13% per year.
Informal trade plays an important role in Central Asia. At the centre of this trade are Chinese commodities. Notably, consumer goods such as textiles and footwear are massively imported to Kyrgyzstan and Tajikistan by individuals by way of shuttle trade, for which these countries have special import regimes with very low taxes. Some of these commodities are then re-exported to other countries, typically Russia and Kazakhstan. Re-exports are extremely strong in Kyrgyzstan, where a large economy has developed around bazaars, notably Dordoi in Bishkek and Kara-Suu in southern Kyrgyzstan, which act as wholesale markets for re-export to neighbouring countries (see Box 1).
INTRODUCTION
22 ENHANCING CONNECTIVITY AND FREIGHT IN CENTRAL ASIA © OECD/ITF 2019
Figure 5. Road traffic along Central Asia Regional Economic Cooperation (CAREC) corridors
Source: ITF estimations based on CAREC (2014) and updated with corridor performance measurement and monitoring (CPMM) data (CAREC, 2016).
Figure 6. Rail traffic along Central Asia Regional Economic Cooperation (CAREC) corridors
Source: ITF estimations based on CAREC (2014) and updated with corridor performance measurement and monitoring (CPMM) data (CAREC, 2016).

INTRODUCTION
ENHANCING CONNECTIVITY AND FREIGHT IN CENTRAL ASIA © OECD/ITF 2019 23
Enhancing connectivity in Central Asia: challenges and opportunities
The economics of connectivity
The importance of connectivity is very high in today’s globalised economy, where value chains are increasingly interconnected and spread out all over the world. This is particularly important for catching-up economies trying to reduce their productivity gaps with the advanced countries, because higher-tech value chains tend to be particularly internationalised.
Connectivity can be defined as the centrality of a country to its relevant networks. As such, connectivity reflects not only geography and the global structure of transport networks, but also trade transaction costs – which may increase economic (as opposed to physical) distances and hence reduce connectivity (ASEF, 2016). The framework adopted in this report for measuring freight connectivity indeed accounts for both geographical and economic distances of countries from their opportunities. It also considers solutions to address both, since policy-makers can sometimes reduce economic distances substantially, while physical distances remain unchanged.
Transport connectivity is fundamental to increasing Central Asia’s competitiveness. Better connectivity promotes regional integration, reduces trade costs and increases trade volumes, thereby promoting economic growth, social integration and development (see e.g. Rastogi and Arvis, 2014; ASEF, 2016; OECD, 2018; Gould, 2018).
Connectivity lays the foundations for future economic growth through agglomeration effects (OECD, 2015). It improves access to markets and opportunities by improving trade competitiveness and supply chain efficiency. It also builds network resilience through improved reliability and reduced inventory holdings. Improving connectivity can boost the productivity and growth of economies by enhancing links within and between businesses and providing greater access to resources and to international capital markets. Better connectivity has the potential to accelerate the integration of domestic companies into global value chains.
The potential benefits of enhanced connectivity are well supported by the evidence. However, these benefits are neither unlimited nor automatic:
First, it is important to acknowledge that a landlocked location and distance to markets can be mitigated but not eliminated. Infrastructure investments cannot relocate Central Asia on the world map, though changes in the major centres of economic activity can and will shift its location in terms of economic geography (OECD, 2014, pp. 56-62). The evidence does not support the view that the economic significance of distance is declining (Boulhol et al., 2008), despite many clichés about globalisation suggesting the contrary.
Second, realising the benefits of enhanced connectivity in full measure will require progress in addressing other structural reform challenges, particularly in terms of strengthening competition, entrepreneurship and private-sector development (for an overview, see OECD, 2018).
Hard infrastructure and soft policies for better connectivity
Transport systems are a production factor and one of the main determinants of facility location decisions. Transport infrastructure has a significant impact on the productivity and the cost structure of private firms. Global production networks depend on transport operations, and this dependency affects

INTRODUCTION
24 ENHANCING CONNECTIVITY AND FREIGHT IN CENTRAL ASIA © OECD/ITF 2019
a wide array of value-added activities along supply chains from suppliers of raw materials to the end-user, involving also the recycling of materials after use.
That said, infrastructure quality is not the whole story. Significant non-physical, “soft” barriers – such as delays at ports and borders, inefficient customs procedures, redundant clearance procedures and the absence of standard documents – all have a negative impact on global trade. Some analyses find that removing these barriers would have a greater impact on economic growth and competitiveness than removing tariffs (Ferrantino et al., 2013).
The general quality of the logistics sector – including transport infrastructure, customs procedures, tracking and tracing services as well as logistics competencies – is another important constituent of connectivity and is positively associated with increases in trade (Arvis et al., 2014). National logistics performance is linked to a number of factors including legislation, international agreements, hauler and shipper performance and technology. Inadequate infrastructure and poor logistics services increase transport costs and delivery times. Along with remoteness, they are major determinants of a country’s ability to participate in the world economy (ITF, 2016).
High-quality infrastructure is a precondition for the provision of efficient transport services for both freight and passenger movements. These, in turn, support core economic activities and reduce geographic barriers to competition. Well-functioning logistics systems facilitate trade by lowering the cost of access to international markets and by improving the competitiveness of domestic firms (Arvis et al., 2014). Infrastructure investment can be an effective policy tool to address social and territorial imbalances by connecting rural and remote areas to larger centres of production and consumption, creating more economic opportunities for residents and reducing out-migration.
Improving freight transport can enhance competitiveness in several ways: by reducing transit times, increasing the reliability of shipments and lowering costs. Reducing freight and logistics costs allows companies to produce more with fewer resources, become more competitive and lay the foundations for business growth and expansion (FHWA, 2015; Gould, 2018).
Overall, more co-operation among countries along corridors can significantly enhance the potential benefits of transport investment (Gould, 2018). When planning investments, countries should not only look at the impact of the investment on access to neighbouring countries. A closer collaboration and joint planning between countries is crucial in order to enhance connectivity and hence competitiveness.
Such collaboration is equally important when it comes to “soft” policies that can also improve trade logistics and competitiveness. Trade facilitation does not always require investment in hard infrastructure; standardisation of procedures across supply chains can also reduce trade costs effectively. Efficient border management is critical for eliminating avoidable delays and enhancing predictability in border clearance.
Connecting Central Asia to global value chains
Trade patterns are shifting as the world’s economic centre of gravity moves east. Recent years have seen increasing restrictions on trade. The global outsourcing model seems to have come to a halt and manufacturing is becoming more regionalised. Still, growth in global external trade is expected to continue to outpace GDP increases in coming years, albeit by a smaller margin than before. Projections see freight volumes (in tonne-kilometres of goods moved) increase four-fold by 2050 and spatial trade patterns shift. Trade between China and the European Union will grow significantly, but intra-Asian trade will also increase rapidly as emerging economies move up in the global value chains, impacting production and consumption patterns. China’s ambition to developing its western provinces is providing

INTRODUCTION
ENHANCING CONNECTIVITY AND FREIGHT IN CENTRAL ASIA © OECD/ITF 2019 25
another important opportunity for Central Asian countries to connect to global value chains (ITF, 2017; OECD, 2016; EDB, 2018).
Central Asian countries export mainly raw materials and energy products. Their principal markets are Western Europe, China and the Russian Federation (Rastogi and Arvis, 2014). Given its central location, the region is supporting a growing transit trade between Europe and Asia, however. The relocation of production centres in China to sites further away from the coast has encouraged the development of land links between Asia and Europe. The revitalisation of the Silk Road, for instance, aims to connect Asia and Europe and all the major markets in between. New surface links could complement the current modal mix as an intermediate option in terms of price and speed between air and maritime transport. At the same time, they could enable landlocked countries to connect with global supply chains and generate new investments into strategic logistic hubs.
The market potential for such new routes is not yet fully evident. However, they are likely to have effects on maritime and air transport and redefine the optimal role of each mode. A number of companies have started to make use of the advantages offered by the trans-Eurasian transport corridors, and railway container traffic between the European Union and China in particular is expected to increase (EDB, 2018).
Developing a rail link that crosses many borders and passes through mountainous areas or deserts is a difficult task. Transport and logistics in Eurasia are characterised not only by physical barriers and infrastructure gaps between countries with poor transport infrastructure, but also by non-physical barriers related to the absence of harmonised laws or efficient customs procedures. Improving surface transport, in terms of travel time and reliability, requires co-ordination between all stakeholders, countries, shippers and logistics specialists. The question of trust – among the various logistics partners, and between the transport provider and its customers – is also key to the success of new services.
The growth potential of the region and the integration of the Central Asian countries into global value chains depend not only on international connectivity, but also on how national connections function. Most of Central Asia is characterised by low average population density. This low density results in limited opportunities (potential) to realise so-called “agglomeration economies”3 (see Box 2) or to achieve the critical mass needed to benefit from scale economies in key tradable sectors.
It is here that the connectivity agenda connects most directly with the structural reform challenges facing Central Asian states, particularly regarding competition. Low density of settlement and long distances to major markets serve to weaken competition. Consumers (whether of intermediate inputs or of final goods) have less choice of potential suppliers and fewer opportunities to enhance productivity by benefiting from agglomeration economies than they would in larger, denser economies. These two factors are mutually reinforcing: large market size makes it possible to realise economies of scale without undermining competition. Longer distances and concomitant higher transport costs have two major implications for tradable producers in geographically remote regions; both reflect the role of competition:
Constraints on accessibility constitute a form of protection for producers. Other things being equal, local producers enjoy a competitive advantage since would-be importers face higher transport costs. Other factors often overwhelm this advantage, however, since local producers in a small, low-density market may not be able to realise the economies of scale and scope needed to compete with imports. Even if they do, the result is likely to be higher prices for local consumers, including both households and firms reliant on locally produced inputs.

INTRODUCTION
26 ENHANCING CONNECTIVITY AND FREIGHT IN CENTRAL ASIA © OECD/ITF 2019
Long distances and high transport costs make it harder for local producers to export to larger, external markets. To export, they need a productivity advantage great enough to offset the higher transport costs. Being as good as their rivals is not good enough; they have to be better. Otherwise, they may have little incentive to innovate and increase productivity, and little opportunity to increase output and employment. Firms oriented towards such distant markets need to achieve this productivity edge in spite of the costs outlined above – specifically the weak competition (among input suppliers and providers of non-tradable services), which raises the input costs for would-be exporters of tradable goods.
Box 2. Agglomeration economies
The mechanisms that make it beneficial for firms and workers to be located close to each other are often summarised under the term agglomeration economies. Three main mechanisms work to produce them:
1. Sharing mechanisms for:
Indivisible facilities, such as local public goods or facilities that serve several individuals or firms. Some examples, other than public goods, are facilities such as laboratories, universities and other large goods that do not belong to a particular agent but where some exclusion is implicit in their provision.
The gains from the wider variety of input suppliers that can be sustained by a larger final goods industry. In other words, the presence of increasing returns to scale, along with forward and backward linkages, allow firms to purchase intermediate inputs at lower costs.
Gains from the narrower specialisation that can be sustained with higher production levels. Several firms specialise in producing complementary products, thus reducing overall production costs.
Risks. This refers to the idea that an industry gains from having a constant market for skills. If there are market shocks, firms can adjust to changes in demand if they have access to a deep and broad labour market that allows them to expand or contract their demand for labour.
2. Matching mechanisms by which:
Agglomeration improves the expected quality of matches between firms and workers, so both are better able to find a good match for their needs.
An increase in the number of agents trying to match in the labour market also improves the probability of matching.
Delays are alleviated. Contractual problems arising from renegotiation among buyers and suppliers may result in one of the parties losing out to the other party in a renegotiation. However, if the agglomeration is extensive enough, agents can find an alternative partner.
3. Learning mechanisms based on the generation, diffusion and accumulation of knowledge. This refers not only to the learning of technologies, but also to the acquisition of skills.
Metropolitan regions in OECD countries benefit from agglomeration effects and tend to display higher levels of productivity, of employment and GDP per capita than other regions. These benefits, however, are limited by congestion costs, diseconomies of scale and oversupply of labour, among other potential negative factors. Many metro regions have in recent decades underperformed national economies.
Source: Duranton and Puga (2004).

INTRODUCTION
ENHANCING CONNECTIVITY AND FREIGHT IN CENTRAL ASIA © OECD/ITF 2019 27
Taken together, these two factors imply that elevated transport costs reduce the scope for specialisation according to comparative advantage. This is one of the critical drivers for gains from trade, however. While low-density places often have lower prices for land – and thus for many non-tradables and space-intensive activities – prices for other goods and services may be higher than otherwise, owing to weak competition. This is especially the case where high transport costs and the potential for suppliers to engage in price discrimination may more than offset the impact of low prices for land and non-tradables.
There are two important policy implication of this analysis:
First, the costs of policies and regulations that impede competition are likely to be higher for Central Asian economies than they would be in many OECD countries. They will rise as connectivity improves.4
Second, improved connectivity amounts to a reduction in trade protection and exposes local producers to more outside competition. If domestic conditions for doing business are not improving, they may exit the market rather than expand.
The link between two of Central Asia’s greatest challenges – connectivity and diversification – thus runs both ways: On the one hand, diversification in the comparatively small economies of Central Asia requires an external orientation: they are simply too small to focus on the home market, and they can only hope to achieve critical mass in a limited number of exporting sectors. Successful diversification will thus require better connectivity. On the other hand, reaping the full benefits of greater connectivity necessitates improvements in the business environment and better policies for supporting innovation, entrepreneurship and the emergence of new economic activities.
In order to enhance connectivity, governments have defined various national development strategies (see Chapter 4 for more details). In addition to these national strategies, regional plans have been set up, of which the CAREC Program is the most comprehensive. CAREC focuses on identifying the main corridors for long-term investments (CAREC, 2017; CAREC, 2018). In these plans, governments have set physical connections as a priority. However, trade and transport policies should focus on a broad set of policies to compensate for the consequences of being landlocked and far away from main markets.
An evidence-based framework for strategic connectivity planning
Assessing the impact of transport infrastructure on connectivity is complicated. Many traditional measures provide only a limited view of the economic value of improved connections. This is not least because they often neglect economic and regulatory factors that affect the returns on investment in connective infrastructure. The analysis in this section will thus cover policies and regulatory frameworks as well as questions related to hard infrastructure. The analyses applied to assess connectivity and infrastructure needs in Central Asia comprise:
a top-down, quantitative modelling approach based on the ITF International Freight Model;
a bottom-up, benchmarking approach based on data collection and analysis across countries;
a qualitative transport policy assessment review.
The analysis is supported by a review of the literature, interviews with key stakeholders (across all sectors), and information collected during fact-finding missions to all five countries.

INTRODUCTION
28 ENHANCING CONNECTIVITY AND FREIGHT IN CENTRAL ASIA © OECD/ITF 2019
The ITF International Freight Model
The ITF’s International freight model is designed to project international freight transport activities (in tonne-kilometres) for 19 commodities for all major transport modes and routes, while taking into account different transport and economic policy measures (e.g. the development of new infrastructure networks, or the alleviation of trade barriers). The model is built as a four-step freight transport model approach and uses the OECD’s regional trade projections as an input. The model converts trade flows in monetary terms into freight volumes. More specifically, the model is designed to estimate the weight of commodities traded between countries or regions; the choice between modes and transport routes used to transport these commodities, based on transport-network characteristics such as capacity and speed; and variables such as transport costs and time.
Some components of the ITF International Freight Model (notably the freight-transport infrastructure network and world spatial discretisation) are used to calculate the connectivity gaps facing Central Asian countries and to compare them with other countries. The methodological approach for measuring connectivity is a gravity-based model which measures how many opportunities (defined in terms of the share of global GDP) can be reached from each country relative to other countries. The model includes four explanatory variables: distance, transport cost, travel time and border crossing time.
The model is further used to assess the presence of capacity constraints and future infrastructure needs based on projected trade volumes up to the year 2050. In the flow of international trade, the quality of transport infrastructure plays a crucial role, together with efficient administration and cross-border procedures. Well-maintained and well-managed logistics facilities, highways, airports, rail links and related services connect trading partners and reduce transport costs. A large body of literature relies on econometric analysis of historical trends to establish a relationship between infrastructure provision and GDP growth. The ITF International Freight Model makes it possible to move beyond historical relationships between transport infrastructure and growth. It includes detailed data on existing infrastructure capacity and all planned capacity improvements. This enables the analysis of future infrastructure capacity constraints and needs in light of projected growth in GDP and trade. The model is described in detail Annex 1 of this report.
Benchmarking indicators
Benchmarking indicators provide the most useful and balanced information where a set of indicators is used, rather than a single indicator. Performance indicators can play a key role in guiding policy, quantifying objectives and measuring progress but are open to misunderstanding. A best-practice approach would involve a set of indicators that encompass measures of both supply (network physical size, asset quality) and demand (measures of traffic, user satisfaction) as well as externalities (environmental emissions and other external costs).
The available data for Central Asia has major gaps. The number of indicators is thus limited by the availability of comparable data across dimensions and countries. This complicates international comparisons, as does the lack of commonly agreed definitions and methods. Data collection for this report thus focused on assembling a comprehensive set of benchmarking indicators across Central Asian countries and regions, ensuring that the data chosen are comparable and derived from reliable sources. The transport infrastructure characteristics can be assessed against a number of comparators (see Chapter 3 for more details on data used in this analysis).
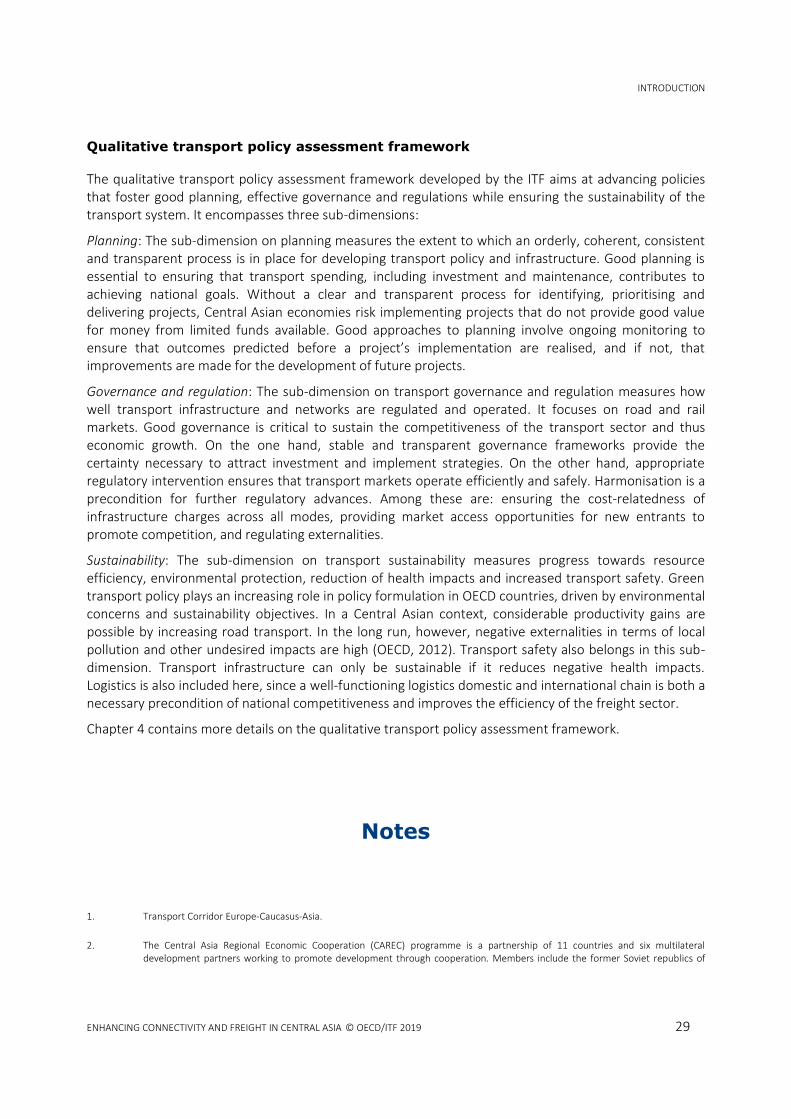
INTRODUCTION
ENHANCING CONNECTIVITY AND FREIGHT IN CENTRAL ASIA © OECD/ITF 2019 29
Qualitative transport policy assessment framework
The qualitative transport policy assessment framework developed by the ITF aims at advancing policies that foster good planning, effective governance and regulations while ensuring the sustainability of the transport system. It encompasses three sub-dimensions:
Planning: The sub-dimension on planning measures the extent to which an orderly, coherent, consistent and transparent process is in place for developing transport policy and infrastructure. Good planning is essential to ensuring that transport spending, including investment and maintenance, contributes to achieving national goals. Without a clear and transparent process for identifying, prioritising and delivering projects, Central Asian economies risk implementing projects that do not provide good value for money from limited funds available. Good approaches to planning involve ongoing monitoring to ensure that outcomes predicted before a project’s implementation are realised, and if not, that improvements are made for the development of future projects.
Governance and regulation: The sub-dimension on transport governance and regulation measures how well transport infrastructure and networks are regulated and operated. It focuses on road and rail markets. Good governance is critical to sustain the competitiveness of the transport sector and thus economic growth. On the one hand, stable and transparent governance frameworks provide the certainty necessary to attract investment and implement strategies. On the other hand, appropriate regulatory intervention ensures that transport markets operate efficiently and safely. Harmonisation is a precondition for further regulatory advances. Among these are: ensuring the cost-relatedness of infrastructure charges across all modes, providing market access opportunities for new entrants to promote competition, and regulating externalities.
Sustainability: The sub-dimension on transport sustainability measures progress towards resource efficiency, environmental protection, reduction of health impacts and increased transport safety. Green transport policy plays an increasing role in policy formulation in OECD countries, driven by environmental concerns and sustainability objectives. In a Central Asian context, considerable productivity gains are possible by increasing road transport. In the long run, however, negative externalities in terms of local pollution and other undesired impacts are high (OECD, 2012). Transport safety also belongs in this sub-dimension. Transport infrastructure can only be sustainable if it reduces negative health impacts. Logistics is also included here, since a well-functioning logistics domestic and international chain is both a necessary precondition of national competitiveness and improves the efficiency of the freight sector.
Chapter 4 contains more details on the qualitative transport policy assessment framework.
Notes
1. Transport Corridor Europe-Caucasus-Asia.
2. The Central Asia Regional Economic Cooperation (CAREC) programme is a partnership of 11 countries and six multilateral development partners working to promote development through cooperation. Members include the former Soviet republics of

INTRODUCTION
30 ENHANCING CONNECTIVITY AND FREIGHT IN CENTRAL ASIA © OECD/ITF 2019
Central Asia (Kazakhstan, Kyrgyzstan, Tajikistan, Turkmenistan, Uzbekistan) as well as Afghanistan, Azerbaijan, China, Georgia, Mongolia and Pakistan.
3 “The diverse mechanisms that make it beneficial for firms and workers to be located close to each other are often summarised under the name “agglomeration economies”. They are primarily concerned with (1) the sharing of place-based public goods (services, infrastructure, input/factor markets, and such abstract public goods as network complementarities); (2) better matching in labour and product markets; and (3) learning based on the generation, diffusion and accumulation of knowledge. For more detail, see Duranton and Puga, 2004.
4 This is consistent with the so-called Frieden-Rogowski hypothesis, which holds that an exogenous reduction in trade costs should increase both the costs of continued protection and the pressure for trade liberalisation from sectors able to compete globally (Frieden and Rogowski, 1996).

INTRODUCTION
ENHANCING CONNECTIVITY AND FREIGHT IN CENTRAL ASIA © OECD/ITF 2019 31
References
ADB (2014), “Connecting Central Asia with Economic Centers”, Asian Development Bank Institute, 2014.
Arvis, J.-F., L. Ojala, B. Shepherd, D. Saslavsky, C. Busch, A. Raj (2014), Connecting to Compete 2014: Trade logistics in the global economy: the logistics performance index and its indicators; The World Bank, 2014.
ASEF (2016), ASEF Outlook Report 2016/2017, Asia-Europe Foundation, June 2016.
Boulhol, H., A. de Serres and M. Molnar (2008), “The contribution of economic geography to GDP per capita”, OECD Economics Department Working Papers, No. 602, OECD Publishing, Paris, http://dx.doi.org/10.1787/242216186836.
CAREC (2018), Transport Sector Progress Report and Work Plan 2018-2020, 17th Transport Sector Coordinating Committee Meeting, Central Asia Regional Economic Cooperation, 18-20 April 2017, Istanbul, Turkey.
CAREC (2017), CAREC 2030 – Connecting the region for shared and sustainable development, Asian Development Bank, October 2017.
Duranton, G. and D. Puga (2004). Micro-foundations of urban agglomeration economies. In Handbook of regional and urban economics, Vol. 4, pp. 2063-2117.
EDB (2018), Silk Road transport corridors: Assessment of trans-EAEU freight traffic growth potential, Eurasian Development bank, Report 49, Saint Petersburg, 2018.
FAO (2016), AQUASTAT database, http://www.fao.org/nr/water/aquastat/data/query/index.html (accessed January 10, 2018).
Ferrantino, M., T. Geiger, M. Tsigas (2013), The Benefits of Trade Facilitation – A Modelling Exercise, Geneva, s.n.
FHWA (2015), Measuring the Impacts of Freight Transportation Improvements on the Economy and Competitiveness, US Department of Transportation, Federal Highway Administration, September 2015.
Frieden, J. and R. Rogowski (1996), "The impact of the international economy on national policies: An analytical overview", in R. Keohane and H. Milner (eds), Internationalization and Domestic Politics, Cambridge University Press, Cambridge, pp. 25-47.
Gould, D.M. (2018), Critical Connections: Promoting Economic Growth and Resilience in Europe and Central Asia. Europe and Central Asia Studies. Washington, DC: World Bank. World Bank. https://openknowledge.worldbank.org/handle/10986/30245.
ITF (2016), "Capacity to Grow: Transport Infrastructure Needs for Future Trade Growth", International Transport Forum Policy Papers, No. 19, OECD Publishing, Paris.
Kummu, M., M. Taka and J. Guillaume (2018), Data from: Gridded global datasets for Gross Domestic Product and Human Development Index over 1990-2015, Dryad Digital Repository.

INTRODUCTION
32 ENHANCING CONNECTIVITY AND FREIGHT IN CENTRAL ASIA © OECD/ITF 2019
Martinez, L., J. Kauppila and M. Castaing Gachassin (2014), "International Freight and Related CO2 Emissions by 2050: A New Modelling Tool", International Transport Forum Discussion Paper No. 2014/21, OECD Publishing, Paris.
Mogilevskii, R. (2012), "Re-export Activities in Kyrgyzstan: Issues and Prospects", University of Central Asia Working Paper No. 9.
OECD (2018), Enhancing Connectivity through Transport Infrastructure: The Role of Official Development Finance and Private Investment, The Development Dimension, OECD Publishing, Paris, https://doi.org/10.1787/9789264304505-en.
OECD (2017), “Gaps and Governance Standards of Public Infrastructure in Chile”, Infrastructure Governance Review, OECD Publishing.
OECD (2016), Cardiac Arrest of Dizzy Spell: Why is World Trade so Weak and What Can Policy Do About It?, OECD Economic Policy Paper No. 18, http://dx.doi.org/10.1787/sjlr2h45q532-en.
OECD (2015), The Metropolitan Century: Understanding Urbanisation and its Consequences, OECD Publishing, Paris, http://dx.doi.org/10.1787/9789264228733-en.
Pesaresi, M., G. Huadong, X. Blaes, D. Ehrlich, S. Ferri, L. Gueguen, L. Lu (2013), "A global human settlement layer from optical HR/VHR RS data: concept and first results", IEEE Journal of Selected Topics in Applied Earth Observations and Remote Sensing, Vol. 6/5, pp. 2102–2131.
Pomfret (2010), “Trade and Transport in Central Asia”, Eurasia Emerging Markets Forum.
Rastogi, C. and J.-F., Arvis (2014), The Eurasian Connection: Supply-Chain Efficiency along the Modern Silk Route through Central Asia. Directions in Development, Washington, D.C.: World Bank. doi: 10.1596/973-8213-9912-5.
Saumya M., B. Kaminski and M. Kholmatov (2009), Bazaars and Trade Integration in CAREC Countries.
Schade, W., W. Rothengatter and S. Mader (2016), Connectivity and Accessibility of Transport Infrastructure in Central and Eastern European EU Member States.
UNECE (2018), UNECE E-Roads Census, https://unece.maps.arcgis.com/apps/webappviewer/index.htm (accessed January 5, 2019).
World Bank (2017), World Development Indicators 2017, World Bank Publications.

CONNECTIVITY IN CENTRAL ASIA WITHIN THE GLOBAL TRANSPORT SYSTEM
ENHANCING CONNECTIVITY AND FREIGHT IN CENTRAL ASIA © OECD/ITF 2019 33
2. Connectivity in Central Asia within the
global transport system
The connectivity needs of Central Asia will be affected by global as well as intra-regional changes in how goods and people are transported. To improve regional connectivity, facilitate trade and accelerate economic growth, the countries of the region are building new infrastructure, improving border crossing services and developing logistics.
At the same time, the soft and hard infrastructure priorities of the governments of Central Asia will be influenced by uncertainties at the global level, from the rate of change in trade volumes and patterns via the costs of different transport modes, to the impact of technological disruption. It is therefore imperative that the connectivity strategies of Central Asian governments are informed by evidence-based analysis and forecasting, taking into account and mitigating to the extent possible the uncertain consequences of the changes that continue to take place across this dynamic region.
The ITF International Freight Model was used for this study to test several scenarios and explore how major Central Asian connectivity strategies could interact with developments beyond the control of governments, such as changes in global freight patterns. The model provides estimates showing how changes in trade at the global, regional, and national levels affect regional connectivity, transit flows, and infrastructure needs, and how these changes can be accommodated to harness future growth (see Box 3; also Annex 1).
In the scenarios tested in this chapter we vary the baseline year (2015, 2030, and 2050), maritime cost (remaining the same or increasing due to the introduction of a global carbon tax), and measures aiming at enhancing connectivity (improvements of hard and soft infrastructure). The hard infrastructure measures tested include the building of new roads and railways as well as the expansion of existing roads. The soft measures are represented by shorter border-crossing times. Strategies other than enhancing infrastructure and reducing border crossing times exist, of course. However, the analysis presented in this chapter shows that these two measures may provide substantial gains in connectivity.
This chapter presents global trade and freight projections and summarizes the largest transport projects planned for the Central Asian region. It provides an overview of the framework used to assess connectivity and infrastructure needs, then presents the results of the analysis – including connectivity indicators, identification of infrastructure bottlenecks, and changes in traffic flows for different scenarios.
Box 3. Modelling framework for long-term global trade scenarios
The OECD’s ENV-Linkages Computable General Equilibrium (CGE) model is an economic model that describes how economic activities are inter-linked across several macroeconomic sectors and regions. It links economic activity to environmental pressure, specifically to emissions of greenhouse gases (GHGs). The links between economic activities and emissions are projected for several decades into the future (currently until 2060).
It is a global economic model built primarily on a database of national economies. Each of the regions is underpinned by an economic input-output table, which is usually obtained from national statistical

CONNECTIVITY IN CENTRAL ASIA WITHIN THE GLOBAL TRANSPORT SYSTEM
34 ENHANCING CONNECTIVITY AND FREIGHT IN CENTRAL ASIA © OECD/ITF 2019
agencies. These tables quantify economic flows across the different economic agents, including purchases of intermediate products and primary factors in all industries and the associated production outputs, as well as sources of income for households and governments and the associated consumption expenditures. All production in ENV-Linkages is assumed to operate under cost minimisation, with an assumption of perfect markets and technologies that exhibit constant returns to scale.
World trade in ENV-Linkages is based on a set of regional bilateral flows. The model assumes that imports originating from different regions are imperfect substitutes. Therefore, in each region, total import demand for each good is allocated across trading partners according to the relationship between their export prices. This implies that each region faces a reduction in demand for its exports if domestic prices increase. All monetary flows are expressed in constant USD, using purchasing power parities as exchange rates for national currencies. The use of purchasing power parities rather than market exchange rates ensures that also the price developments of non-traded commodities are taken into account when projecting economic developments of multiple regions.
The model has been applied to provide baseline and policy scenario projections in the OECD’s Environmental Outlook to 2050: The Consequences of Inaction (OECD 2012).
Source: Château et al. (2014).
Underlying trade and freight projections
Global trade patterns are shifting
Population and income growth will increase future global demand for goods and services. The world’s population will reach nearly 10 billion people by 2050, with an additional 2.4 billion urban dwellers compared to 2015 (United Nations, 2014). The underlying projections for GDP growth suggest continuous growth, albeit at lower levels than in the past. World GDP is projected to grow at an annual compound rate of 3.5%. Non-OECD countries will contribute to the global growth, although at a lower level than expected (OECD, 2018; OECD/ITF, 2017).
In recent years trade restrictions have increased, and there is now a tendency to prefer bilateral agreements over multilateral trade accords. The global outsourcing model is showing signs of its limitations and manufacturing has become more regionalised. World trade has slowed down both in absolute terms and relative to GDP. Trade is still projected to grow, but at an annual rate of 3.5% – significantly slower than the nearly 7% annual average since 1990. Increased protectionism and tariff hikes, as well as uncertainties regarding emerging economies, partly explain the slowdown. Economies are also moving up in the value chain, resulting in an increase in the domestic value-added component of exports. Physical limitations on the fragmentation of global value chains also exist, and there is evidence that global supply chains are consolidating (OECD, 2016; Fontagné and Fouré, 2013).
The geographic shift in trade patterns will reflect regional income convergence, future changes in consumption patterns, and relative productivity. Thanks to rapid economic growth, Asia and Africa will substantially increase their share of global trade after 2030, resulting in large market potential with low production costs. The Transition region (including Kazakhstan, Kyrgyzstan, Tajikistan and Uzbekistan) shows less growth, yet more than doubles the trade value. In parallel, trade within the euro area will grow less fast and some OECD countries will see their trade share drop slightly. The increased role of emerging economies will lead to the reorganisation of the relative importance of different trading

CONNECTIVITY IN CENTRAL ASIA WITHIN THE GLOBAL TRANSPORT SYSTEM
ENHANCING CONNECTIVITY AND FREIGHT IN CENTRAL ASIA © OECD/ITF 2019 35
partners. Trade within the OECD area will halve, while trade among non-OECD economies will more than double.
Figure 7. Value of trade by region (USD billion, 2004)
Source: ITF based on OECD ENV-Linkages model (Chateau et al., 2014).
Economic projections are also characterised by changes in the structure of the economy. Emerging and developing countries will see sizeable increases in their manufacturing market shares at the expense of OECD economies. However, there will not be a total shift of industrial activities away from OECD countries, as trade costs in specific industries will remain high. Fast-growing emerging economies will shift from low-skilled manufacturing towards services and industry as incomes and living standards converge with more advanced economies. The resulting changes in consumption and domestic demand will influence their industrial structure. Material use will also likely decouple from economic growth due to the increasing share of services and changes in production technologies (OECD, 2018).
0
10000
20000
30000
40000
50000
60000
2015 2030 2050
Africa Asia EEA + Turkey Latin America
Middle East North America OECD Pacific Transition

CONNECTIVITY IN CENTRAL ASIA WITHIN THE GLOBAL TRANSPORT SYSTEM
36 ENHANCING CONNECTIVITY AND FREIGHT IN CENTRAL ASIA © OECD/ITF 2019
Figure 8. Value of trade by commodity (USD billion, 2004)
Source: ITF based on OECD ENV-Linkages model (Chateau et al., 2014).
Changes in trade will have significant effects on route choices
Global value chains are central to economic development. They are dependent on relatively inexpensive but reliable transport links, among other factors. Freight transport is a derived demand, directly dependent on the trade of commodities. Changes in trade and manufacturing specialisation will potentially have significant effects on global supply chains. Transport activity is inseparably intertwined with international production and consumption patterns and their evolution, including changes in the location choices of multinational companies. The location of global production and consumption, and the structure of trade in terms of the nature of goods trade and transport costs, all influence the volume of freight as well as the related mode and route choice.
To understand the future evolution of freight flows, the ITF’s International Freight Model was applied in this study (see Box 4). Under the baseline projections of the ITF International Freight Model, the growth in international freight volume is far from uniform, being significantly stronger along maritime routes and inland connections in Asia. The North Pacific corridor facilitated the highest volume of international freight flows in 2015; this was due mainly to the high volume of international trade from China to the United States. As Figure 9 shows, it is estimated that the volume of freight in the North Pacific corridor will increase significantly by 2050. A significant increase in freight volumes is also projected to occur in the Indian Ocean – mainly from China to Europe through the Suez Canal. The increase in trade between Europe and Asia is also responsible for the dynamics of the Mediterranean corridor.
Increasing trade will also bring about an increase in the volume of intra-regional freight flows by road or rail within continents. The highest growth will occur in Asia and Africa, in line with the projections for GDP. Intra-Asian tonne-kilometres grow, in the baseline scenario, by a factor of 4.5, while in Africa this growth factor is 6.5.
0
10000
20000
30000
40000
50000
60000
2015 2030 2050
Agricultural, hunting and forestry products Coal, gas and oil products (refined and crude oil)
Metal, other mining products except machinery and equipments Food products, beverages and tobacco
Textiles and textile products Chemicals, rubber and plastic Other mineral products
Other manufacturing Transport equipment Electronic devices

CONNECTIVITY IN CENTRAL ASIA WITHIN THE GLOBAL TRANSPORT SYSTEM
ENHANCING CONNECTIVITY AND FREIGHT IN CENTRAL ASIA © OECD/ITF 2019 37
Box 4. The ITF International Freight Model
The International Transport Forum’s (ITF) International Freight Model projects international freight transport activity and related CO2 emissions up to 2050 based on global trade projections. The model has seven main components, each feeding into the subsequent calculation:
A general equilibrium model for international trade, covering 26 world regions and 25 commodities, of which 19 require transport.
A detailed global freight transport network model, including capacity information based on the latest available data.
Over 400 global centroids representing the main production and consumption centres of the world.
A model to convert trade in value into weight in tonnes using Eurostat and ECLAC data and network costs as a proxy indicator between centroids. The transport cost performance for each origin-destination (OD) pair is defined by a logsum cost estimation. Because each commodity has a different sensitivity to price, the lower the logsum value falls, the greater the conversion of trade value into freight tonnage is.
An international freight mode choice model calibrated using Eurostat and ECLAC data for each commodity and transport mode. The model splits the estimated trade weight between centroids into different transport modes. The main mode is designated by the longest route component (i.e. sea has always some access and egress travel, either by road or by rail).
Assignment of the freight volumes to the transport network using a combination of an equilibrium model and a route choice model. The latter is applied for the maritime port selection to accelerate convergence.
CO2 intensities and technology pathway by mode.
The final outputs of the model are freight tonnes and tonne-kilometres by transport corridor, by mode, and by commodity as well as related CO2 emissions.
The model has been refined and validated for the Central Asian region with updated information on production and consumption centroids, transport networks and their performance as well as freight volumes.
See Annex 1 for a detailed description of the model.
Source: Martinez et al. (2014).
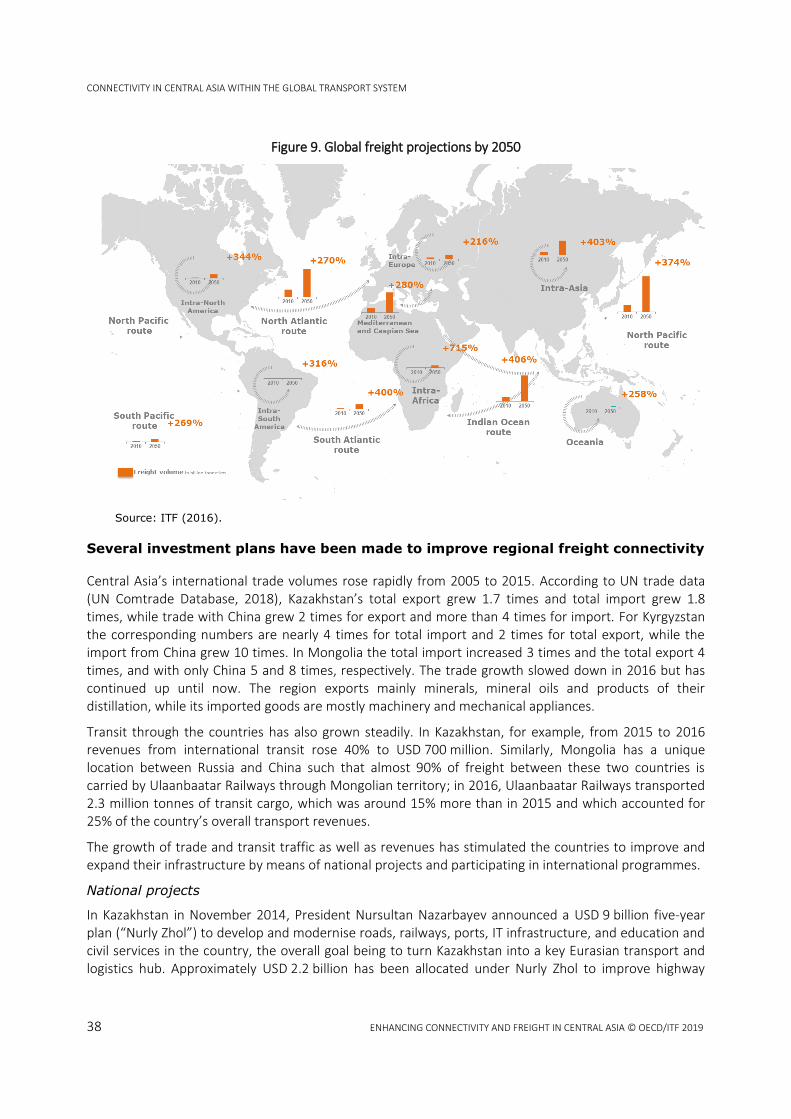
CONNECTIVITY IN CENTRAL ASIA WITHIN THE GLOBAL TRANSPORT SYSTEM
38 ENHANCING CONNECTIVITY AND FREIGHT IN CENTRAL ASIA © OECD/ITF 2019
Figure 9. Global freight projections by 2050
Source: ITF (2016).
Several investment plans have been made to improve regional freight connectivity
Central Asia’s international trade volumes rose rapidly from 2005 to 2015. According to UN trade data (UN Comtrade Database, 2018), Kazakhstan’s total export grew 1.7 times and total import grew 1.8 times, while trade with China grew 2 times for export and more than 4 times for import. For Kyrgyzstan the corresponding numbers are nearly 4 times for total import and 2 times for total export, while the import from China grew 10 times. In Mongolia the total import increased 3 times and the total export 4 times, and with only China 5 and 8 times, respectively. The trade growth slowed down in 2016 but has continued up until now. The region exports mainly minerals, mineral oils and products of their distillation, while its imported goods are mostly machinery and mechanical appliances.
Transit through the countries has also grown steadily. In Kazakhstan, for example, from 2015 to 2016 revenues from international transit rose 40% to USD 700 million. Similarly, Mongolia has a unique location between Russia and China such that almost 90% of freight between these two countries is carried by Ulaanbaatar Railways through Mongolian territory; in 2016, Ulaanbaatar Railways transported 2.3 million tonnes of transit cargo, which was around 15% more than in 2015 and which accounted for 25% of the country’s overall transport revenues.
The growth of trade and transit traffic as well as revenues has stimulated the countries to improve and expand their infrastructure by means of national projects and participating in international programmes.
National projects
In Kazakhstan in November 2014, President Nursultan Nazarbayev announced a USD 9 billion five-year plan (“Nurly Zhol”) to develop and modernise roads, railways, ports, IT infrastructure, and education and civil services in the country, the overall goal being to turn Kazakhstan into a key Eurasian transport and logistics hub. Approximately USD 2.2 billion has been allocated under Nurly Zhol to improve highway

CONNECTIVITY IN CENTRAL ASIA WITHIN THE GLOBAL TRANSPORT SYSTEM
ENHANCING CONNECTIVITY AND FREIGHT IN CENTRAL ASIA © OECD/ITF 2019 39
quality. In 2015-2018 the overhaul of 867 kilometres of railway tracks was completed, 2 400 kilometres of national roads were constructed and reconstructed, and 7 500 kilometres of roads were repaired. According to the plans, in 2020, toll roads will cover approximately 6,600 kilometres. Along major international corridors 260 road side facilities are planned to be constructed and upgraded by 2020, including motels, filling stations, parking spots, retail shops, etc. The plan includes implementation of the intellectual transport system, which will consist of video monitoring, road traffic management systems, and systems to inform drivers about road conditions and collect e-payments for transport services.
Kyrgyzstan plans to build and expand its internal network of highways through the construction of an alternative North–South highway and the reconstruction of the Bishkek–Osh, TyupKegen, Bishkek–Naryn–Torugart, Kochkor–Aral, and Osh–Batken–Isfana–Khujand highways. The construction of the international Balykchy–Karakol road and the Tyop–Kegen highway will continue. The strategic goal in the railway industry is the creation of a unified railway network connecting currently detached northern and southern sections of the national railways. The country has tentative plans to continue negotiations on a project to build a section of the transnational China–Kyrgyzstan–Uzbekistan railway.
Numerous road projects are currently developing in Mongolia aimed at connecting different parts of the country. Those include reconstruction work for 345 km of the Ulaanbaatar–Altanbulag road, as well as the so-called West and East corridors crossing the country from the north to the south. The Mongolian government action plan for 2016–20 includes roads from Ulaanbaatar to provincial capitals, with a total length of 5100 km. In 2018, 904 km of roads to provinces Bayan–Ulgii, Khovd, Uvs, Govi-Altai and Zavkhan were under construction. The country also plans a massive expansion of its railway network that will connect mainly major mining sites with the centre and with the country borders.
Tajikistan is mostly rehabilitating its roads. The country recently finished rehabilitating the Dushanbe–Kyrgyzstan border road, the Dushanbe–Tursunzade–Uzbekistan border road, and the Dushanbe–Kulma–Chinese border road. Numerous other road-rehabilitation projects are ongoing, and others are scheduled for construction by 2020. Most of these roads connect Dushanbe and other cities of Tajikistan with the border crossing points of China, Afghanistan and Central Asian neighbours. Implementation of transport projects in Tajikistan and Kyrgyzstan is especially complicated because most of the roads are mountainous, which means tunnels will be required and construction and maintenance will take place in adverse conditions.
In 2015 Uzbekistan announced a plan for 2015–19 to develop and modernise its national transport infrastructure through the implementation of 150 projects. In terms of railway transport, the planned implementation of 13 development and electrification projects includes the Angren–Pap, Maroqand–Qarshi, Qarshi–Termez and Maroqand–Bukhara rail lines. The plan envisages measures to build and rehabilitate roads and railways, logistic centres and communications. The country also plans to develop a 920-km route going from Uzbekistan through Kyrgyzstan to China (Andijan–Osh–Irkeshtam–Kashgar). Road haulage along this route began in February 2018. Despite the unstable political situation in Afghanistan, Uzbekistan railways regularly transport cargo to this country and intend to participate in the construction of the Mazar-i-Sharif–Herat railroad (the so-called Trans-Afghanistan Corridor). Implementation of this project will in turn permit the construction of two strategically important routes connecting seaports in Iran (port Chabakhar) and Pakistan (port Chaman).
International programmes
Several transport-corridor projects are currently in progress in Central Asia, their collective aim being to boost regional development and integration. They are designed to provide the infrastructure necessary to ensure high levels of transport connectivity and enable the integration of different modes of

CONNECTIVITY IN CENTRAL ASIA WITHIN THE GLOBAL TRANSPORT SYSTEM
40 ENHANCING CONNECTIVITY AND FREIGHT IN CENTRAL ASIA © OECD/ITF 2019
transport. Table 2 summarises the main ongoing projects involving the development of transport corridors in Central Asia.
Table 2. Current and planned transport corridor projects in Central Asia
Project name Investments
(USD billions) Countries or continents
Belt and Road Initiative (BRI) 900–8 000* Europe, Asia, Africa
Central Asia Regional Economic Cooperation (CAREC) Program
31.5** Afghanistan, Azerbaijan, People's Republic of China, Georgia,
Kazakhstan, Kyrgyzstan, Mongolia, Pakistan, Tajikistan, Turkmenistan, Uzbekistan.
Transport Corridor Europe-Caucasus-Asia (TRACECA)
0.16** Armenia, Azerbaijan, Bulgaria, Georgia, Kazakhstan, Kyrgyzstan, Iran, Moldova, Romania, Turkey, Ukraine, Uzbekistan, Tajikistan, Turkmenistan, plus the member states of the European Union.
Trans-Asian Railway (TAR) 75.6*
Afghanistan, Armenia, Azerbaijan, Bangladesh, Belarus, Bhutan, Brunei, Cambodia, China, India, Indonesia, Iran, Kazakhstan, Laos,
Mongolia, Nepal, Pakistan, South Korea, Russia, Sri Lanka, Tajikistan, Thailand, Turkey, Turkmenistan, Uzbekistan, Vietnam.
Note: * – planned investments; ** – has been invested.
The largest initiative is the Belt and Road Initiative (BRI) announced in 2013 by the Chinese President Xi Jinping during his visit to Kazakhstan. In 2017 the initiative was officially launched at the Belt and Road Forum for International Cooperation in Beijing and was incorporated into the Chinese constitution, codifying its position as a primary foreign policy goal of the president. The stated aim of the project is the creation of new infrastructure and the revitalisation and expansion of trade and economic growth across Asia and beyond. After initially focusing on energy and infrastructure, the project later expanded to address trade, manufacturing, the Internet and tourism.
Figure 10 displays the currently proposed BRI corridors. It has two main segments. The first is the Silk Road Economic Belt, which includes land corridors connecting China with different parts of Asia, the Middle East and Europe. The second is the 21st Century Maritime Silk Road, a sea route linking Asia, Africa and Europe.
Some of the projects have been fully or partially implemented. These include, for example, the China-Pakistan Economic Corridor (CPEC), which also demonstrates the BRI’s scope in that it combines infrastructural and industrial development with physical and telecommunications connectivity. As a BRI corridor, CPEC will link Pakistan with the land and sea corridors to the rest of Asia, Europe, and Africa. CPEC allows China to create an alternative to shipping via Singapore and the Melaka Straits (Deloitte, 2018). The corridor was launched in 2014 and related projects are scheduled for completion by 2022. The corridor potentially benefits the Central Asian countries by shortening the path to the maritime routes and, therefore, improving the region’s overall connectivity.
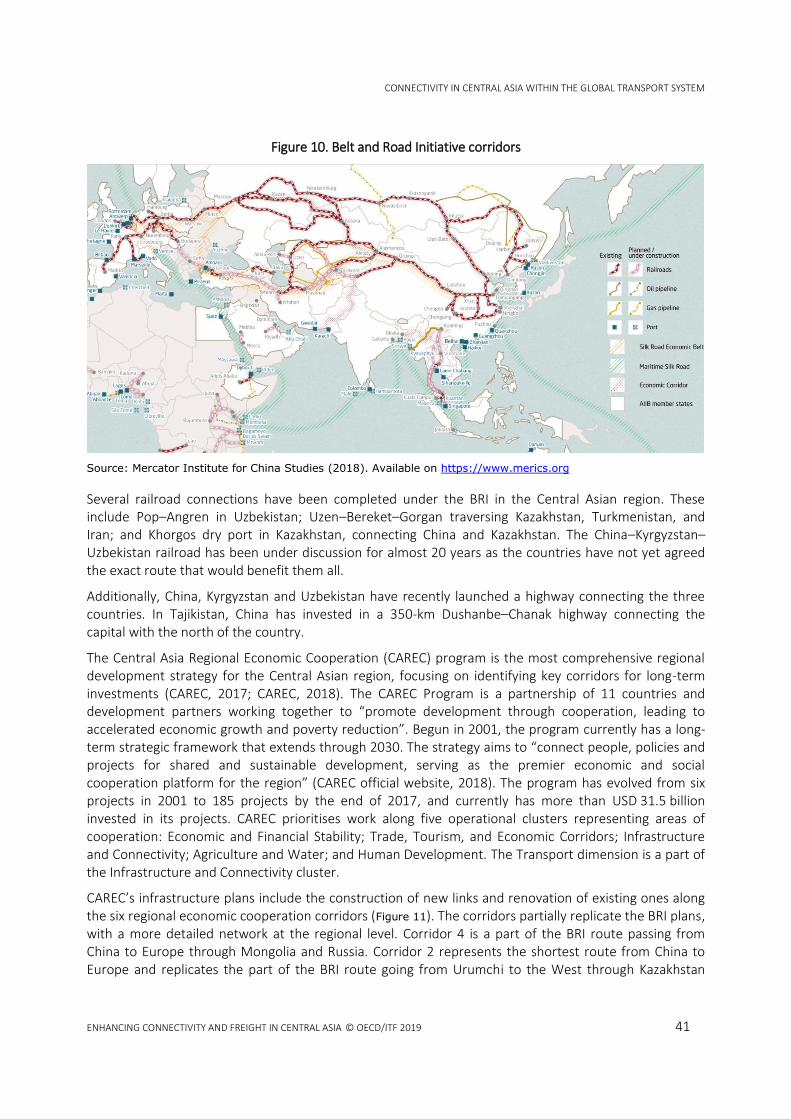
CONNECTIVITY IN CENTRAL ASIA WITHIN THE GLOBAL TRANSPORT SYSTEM
ENHANCING CONNECTIVITY AND FREIGHT IN CENTRAL ASIA © OECD/ITF 2019 41
Figure 10. Belt and Road Initiative corridors
Source: Mercator Institute for China Studies (2018). Available on https://www.merics.org
Several railroad connections have been completed under the BRI in the Central Asian region. These include Pop–Angren in Uzbekistan; Uzen–Bereket–Gorgan traversing Kazakhstan, Turkmenistan, and Iran; and Khorgos dry port in Kazakhstan, connecting China and Kazakhstan. The China–Kyrgyzstan–Uzbekistan railroad has been under discussion for almost 20 years as the countries have not yet agreed the exact route that would benefit them all.
Additionally, China, Kyrgyzstan and Uzbekistan have recently launched a highway connecting the three countries. In Tajikistan, China has invested in a 350-km Dushanbe–Chanak highway connecting the capital with the north of the country.
The Central Asia Regional Economic Cooperation (CAREC) program is the most comprehensive regional development strategy for the Central Asian region, focusing on identifying key corridors for long-term investments (CAREC, 2017; CAREC, 2018). The CAREC Program is a partnership of 11 countries and development partners working together to “promote development through cooperation, leading to accelerated economic growth and poverty reduction”. Begun in 2001, the program currently has a long-term strategic framework that extends through 2030. The strategy aims to “connect people, policies and projects for shared and sustainable development, serving as the premier economic and social cooperation platform for the region” (CAREC official website, 2018). The program has evolved from six projects in 2001 to 185 projects by the end of 2017, and currently has more than USD 31.5 billion invested in its projects. CAREC prioritises work along five operational clusters representing areas of cooperation: Economic and Financial Stability; Trade, Tourism, and Economic Corridors; Infrastructure and Connectivity; Agriculture and Water; and Human Development. The Transport dimension is a part of the Infrastructure and Connectivity cluster.
CAREC’s infrastructure plans include the construction of new links and renovation of existing ones along the six regional economic cooperation corridors (Figure 11). The corridors partially replicate the BRI plans, with a more detailed network at the regional level. Corridor 4 is a part of the BRI route passing from China to Europe through Mongolia and Russia. Corridor 2 represents the shortest route from China to Europe and replicates the part of the BRI route going from Urumchi to the West through Kazakhstan

CONNECTIVITY IN CENTRAL ASIA WITHIN THE GLOBAL TRANSPORT SYSTEM
42 ENHANCING CONNECTIVITY AND FREIGHT IN CENTRAL ASIA © OECD/ITF 2019
(section 2c in Figure 11) and Tajikistan (section 2d). Another BRI corridor going from China to the West through Kyrgyzstan is represented by Corridor 1. Similarly to the BRI, CAREC plans to connect the Central Asian transport network with maritime routes through the territory of Pakistan.
Figure 11. CAREC regional economic cooperation corridors
Source: CAREC (2018).
Both the BRI and CAREC initiatives overlap with the historical Silk Road and are intended to facilitate the movement of people and goods between China and Europe; as such, they inherently affect the connectivity of the countries lying along the route. The proposed routes partially rely on existing infrastructure such as sea ports and highways, often implying their extension and renovation in order to accommodate increasing trade flows and provide competitive routes for regional and global stakeholders. CAREC’s choice of potential routes also takes into account the outcomes of traffic demand models created for the region. Most of the current national plans in the region coincide with the CAREC plans.
Other large transportation projects in the region are TRACECA, the Trans-Asian Railway and the Great Asian Highway. The latter two were initiated in the 1950s and were restarted in 1992, becoming pillars of the Asian Land Transport Infrastructure Development project, which was endorsed by the United Nations Economic and Social Commission for Asia and the Pacific (UNESCAP). The projects target the development of the railway and highway networks as part of UNESCAP’s overall goal of developing an international, integrated, intermodal transport and logistics system in the region.
TRACECA is a multi-mode transportation corridor project developed by the European Union in order to integrate the continents of Europe and Asia. Four countries considered in this study – Kazakhstan,

CONNECTIVITY IN CENTRAL ASIA WITHIN THE GLOBAL TRANSPORT SYSTEM
ENHANCING CONNECTIVITY AND FREIGHT IN CENTRAL ASIA © OECD/ITF 2019 43
Kyrgyzstan, Tajikistan and Uzbekistan – are members of the TRACECA project. The main goals of the project are to harmonise customs and foreign trade regulations among the member countries, to stimulate trade, and to ensure the integration of Central Asian countries by developing transportation infrastructure and connecting them to each other via the Black Sea and the South Caucasus. The project also aims to facilitate member countries’ access to European and global markets as well as establishing the connection of the TRACECA corridors with the Trans-European Network (TEN-T) (see Box 5). Most of the TRACECA infrastructure projects were completed by 2010.
Although a variety of infrastructure initiatives are being implemented in the region, some projects are more active than others, with these having a larger impact on the connectivity of the five Central Asian countries that are the subject of this report.
Box 5. The Trans-European Transport Network (TEN-T)
The Trans-European Transport Network (TEN-T) is a European Commission policy directed towards the implementation and development of a Europe-wide network of roads, railway lines, inland waterways, maritime shipping routes, ports, airports and railroad terminals. The planned network includes two layers:
The Comprehensive Network, which covers all Europe; and
The Core Network, consisting of the most important connections within the Comprehensive Network linking the most important nodes.
The main objective of TEN-T is to close gaps, remove bottlenecks and eliminate technical barriers that exist between the transport networks of European Union (EU) Member States, strengthening the social, economic and territorial cohesion of the Union and contributing to the creation of a single European transport area. The actions towards this objective include the construction of new physical infrastructures, the adoption of innovative digital technologies, and the use of alternative fuels and universal standards.
Nine Core Network Corridors and Two Horizontal Priorities were identified to facilitate implementation of the objectives in line with the funding period, 2014 to 2020. The Two Horizontal Priorities are ERTMS (train control and radio communication standards) and Motorways of the Sea (short sea routes, ports, associated maritime infrastructures, equipment, and related administrative formalities).
Oversight of the Corridors and the implementation of the two Horizontal Priorities lies with European Coordinators; these are high-level personalities with long standing experience in transport, financing and European politics, nominated by the European Commission.
EU funding for projects on each Corridor and Horizontal Priority is provided by the Connecting Europe Facility (CEF). The participating Member States must align their national infrastructure investment policies with European priorities. Other sources of funding and financing include the European Structural and Investment Funds and the European Fund for Strategic Investment.
Source: European Commission (2018).

CONNECTIVITY IN CENTRAL ASIA WITHIN THE GLOBAL TRANSPORT SYSTEM
44 ENHANCING CONNECTIVITY AND FREIGHT IN CENTRAL ASIA © OECD/ITF 2019
Assessment framework for freight connectivity
It is unclear whether the planned infrastructure will meet the demands of future trade patterns in the region. This report models the ability of current and planned infrastructure across Central Asia to cope under different trade scenarios. This section presents details regarding the assessment, which include (i) the connectivity indicator used to assess transport network performance, (ii) the regional road and railway networks tested in the scenarios and (iii) the freight-growth projections used in the baseline scenarios for years 2030 and 2050, as well as an alternative scenario in which global maritime costs increase 50% by 2050.
Several indicators are used to assess connectivity gap and bottlenecks
A gravity-based connectivity index is calculated for each scenario. The ITF international freight model and the related network model are used to calculate the connectivity gap between the Central Asian countries and other countries. The model has been re-calibrated for the Central Asian region with updated information on production and consumption centroids, transport networks and their performance, and freight volumes. For this, raw data were collected from participant countries and information on CAREC projects was analysed and taken into account in the scenarios’ design. The resulting analysis gives us for the first time a clearer understanding of the routes and volumes of future trade flows in the region under different scenarios based on real data and actual plans.
The methodological approach for measuring connectivity is a gravity-based model which measures the percentage of global GDP accessible from one country by going through or over another. The model includes four explanatory variables: distance, transport cost, travel time, and border crossing time (see Box 6).
We identify potential future infrastructure bottlenecks for each freight and infrastructure scenario by measuring the infrastructure performance under each scenario. The performance, in turn, is calculated as the sum of all volume-capacity ratios (that is, the number of vehicles passing through a point in a unit of time) for each country. This is a measure of network congestion. The assessment identifies whether the existing infrastructure is sufficient to meet the future growth in freight volumes or, alternatively, how much additional capacity is required to maintain the existing performance level.
Traffic flows passing through each country vary across the scenarios. Good infrastructure and shorter border crossing times will potentially attract more traffic flows to the region. A maritime cost increase (potentially resulting from various factors, including carbon taxation and oil price increases) might add to rail and road traffic because of the modal shift from sea; but it can also decrease land traffic due to the overall trade reduction on the global level. Changes in traffic flows passing through each country have been calculated for the scenarios.
For benchmarking, we also test the impact of reducing border crossing times to the values for Latvia. Latvia was chosen because of its combination of similar historical background and good performance in border crossing times on a global level: it is in the 25th percentile of the best performers in the world in border crossing.
In the case of border-crossing-time scenarios, the main impacts are on route choice and traffic volumes passing through each crossing point. Therefore, these scenarios include an assessment of the potential traffic changes at each border crossing point.
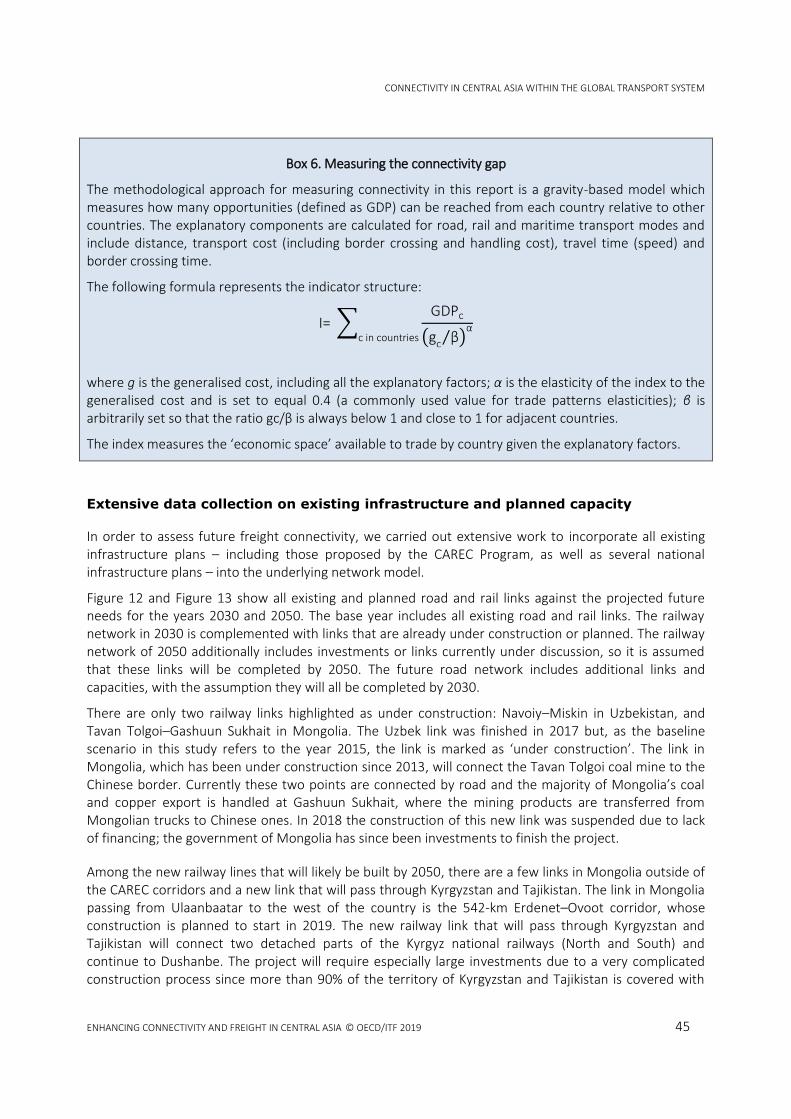
CONNECTIVITY IN CENTRAL ASIA WITHIN THE GLOBAL TRANSPORT SYSTEM
ENHANCING CONNECTIVITY AND FREIGHT IN CENTRAL ASIA © OECD/ITF 2019 45
Box 6. Measuring the connectivity gap
The methodological approach for measuring connectivity in this report is a gravity-based model which measures how many opportunities (defined as GDP) can be reached from each country relative to other countries. The explanatory components are calculated for road, rail and maritime transport modes and include distance, transport cost (including border crossing and handling cost), travel time (speed) and border crossing time.
The following formula represents the indicator structure:
I= ∑GDPc
(gc β⁄ )α
c in countries
where g is the generalised cost, including all the explanatory factors; α is the elasticity of the index to the generalised cost and is set to equal 0.4 (a commonly used value for trade patterns elasticities); β is arbitrarily set so that the ratio gc/β is always below 1 and close to 1 for adjacent countries.
The index measures the ‘economic space’ available to trade by country given the explanatory factors.
Extensive data collection on existing infrastructure and planned capacity
In order to assess future freight connectivity, we carried out extensive work to incorporate all existing infrastructure plans – including those proposed by the CAREC Program, as well as several national infrastructure plans – into the underlying network model.
Figure 12 and Figure 13 show all existing and planned road and rail links against the projected future needs for the years 2030 and 2050. The base year includes all existing road and rail links. The railway network in 2030 is complemented with links that are already under construction or planned. The railway network of 2050 additionally includes investments or links currently under discussion, so it is assumed that these links will be completed by 2050. The future road network includes additional links and capacities, with the assumption they will all be completed by 2030.
There are only two railway links highlighted as under construction: Navoiy–Miskin in Uzbekistan, and Tavan Tolgoi–Gashuun Sukhait in Mongolia. The Uzbek link was finished in 2017 but, as the baseline scenario in this study refers to the year 2015, the link is marked as ‘under construction’. The link in Mongolia, which has been under construction since 2013, will connect the Tavan Tolgoi coal mine to the Chinese border. Currently these two points are connected by road and the majority of Mongolia’s coal and copper export is handled at Gashuun Sukhait, where the mining products are transferred from Mongolian trucks to Chinese ones. In 2018 the construction of this new link was suspended due to lack of financing; the government of Mongolia has since been investments to finish the project.
Among the new railway lines that will likely be built by 2050, there are a few links in Mongolia outside of the CAREC corridors and a new link that will pass through Kyrgyzstan and Tajikistan. The link in Mongolia passing from Ulaanbaatar to the west of the country is the 542-km Erdenet–Ovoot corridor, whose construction is planned to start in 2019. The new railway link that will pass through Kyrgyzstan and Tajikistan will connect two detached parts of the Kyrgyz national railways (North and South) and continue to Dushanbe. The project will require especially large investments due to a very complicated construction process since more than 90% of the territory of Kyrgyzstan and Tajikistan is covered with

CONNECTIVITY IN CENTRAL ASIA WITHIN THE GLOBAL TRANSPORT SYSTEM
46 ENHANCING CONNECTIVITY AND FREIGHT IN CENTRAL ASIA © OECD/ITF 2019
mountains. As the map shows, there are very few motorways in the region with two lanes or more per one direction; these are located mostly in the south of Kazakhstan. Many roads in the region are not paved. Plans for the regional road network involve mostly renovation of existing roads. Additionally, expansion of existing roads or pavement of unpaved roads is either already taking place or planned.
Figure 12. Planned and existing railway lines in the region and CAREC corridors
Source: ITF

CONNECTIVITY IN CENTRAL ASIA WITHIN THE GLOBAL TRANSPORT SYSTEM
ENHANCING CONNECTIVITY AND FREIGHT IN CENTRAL ASIA © OECD/ITF 2019 47
Figure 13. Planned and existing roads in the region and CAREC corridors
Source: ITF
Freight growth scenarios
The scenarios presented in this report are possible future developments and should not be considered as predictions. Any scenario depends on several underlying assumptions, such as economic growth, composition of trade and future comparative advantages of countries. Further, the uncertainty of projections increases as we move further into the future.
The baseline projection for the freight volumes of the Central Asian region is derived from underlying global trade projections. In the baseline, international freight tonnage will increase over 60% by 2030 and 220% by 2050 from their 2015 levels. The trade flows between Europe and China will increase two times by 2030 and almost five times by 2050.
At the network level, freight flows are projected to increase at three Central Asian corridors in particular: the already intense Mongolian corridor; the corridor going from the southeast of Kazakhstan to Astana and further up to the northwest; and a corridor going through Uzbekistan to the Caspian Sea. The maps do not show any substantial flow going through Afghanistan because of the unstable political situation there; however, if the situation stabilises, the flow pattern in the south of Central Asia will likely change, with some traffic diverted to the closest sea ports and to southern land routes.
Figure 14–16 show freight flows (in tonnes) that passed through the region in 2015 as well as projected flows for 2030 and 2050. The largest flows, as could be expected, originate in China and head to Europe.
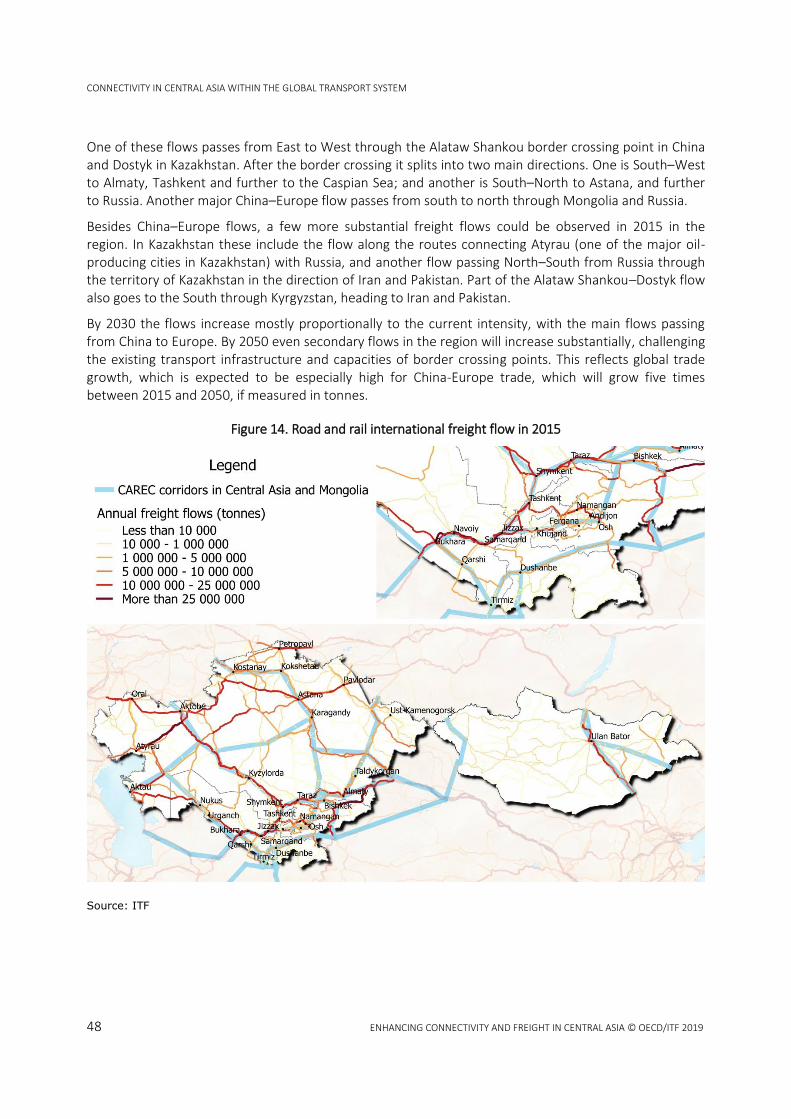
CONNECTIVITY IN CENTRAL ASIA WITHIN THE GLOBAL TRANSPORT SYSTEM
48 ENHANCING CONNECTIVITY AND FREIGHT IN CENTRAL ASIA © OECD/ITF 2019
One of these flows passes from East to West through the Alataw Shankou border crossing point in China and Dostyk in Kazakhstan. After the border crossing it splits into two main directions. One is South–West to Almaty, Tashkent and further to the Caspian Sea; and another is South–North to Astana, and further to Russia. Another major China–Europe flow passes from south to north through Mongolia and Russia.
Besides China–Europe flows, a few more substantial freight flows could be observed in 2015 in the region. In Kazakhstan these include the flow along the routes connecting Atyrau (one of the major oil-producing cities in Kazakhstan) with Russia, and another flow passing North–South from Russia through the territory of Kazakhstan in the direction of Iran and Pakistan. Part of the Alataw Shankou–Dostyk flow also goes to the South through Kyrgyzstan, heading to Iran and Pakistan.
By 2030 the flows increase mostly proportionally to the current intensity, with the main flows passing from China to Europe. By 2050 even secondary flows in the region will increase substantially, challenging the existing transport infrastructure and capacities of border crossing points. This reflects global trade growth, which is expected to be especially high for China-Europe trade, which will grow five times between 2015 and 2050, if measured in tonnes.
Figure 14. Road and rail international freight flow in 2015
Source: ITF

CONNECTIVITY IN CENTRAL ASIA WITHIN THE GLOBAL TRANSPORT SYSTEM
ENHANCING CONNECTIVITY AND FREIGHT IN CENTRAL ASIA © OECD/ITF 2019 49
Figure 15. Road and rail international freight flow by 2030
Source: ITF
Figure 16. Road and rail international freight flow by 2050
Source: ITF

CONNECTIVITY IN CENTRAL ASIA WITHIN THE GLOBAL TRANSPORT SYSTEM
50 ENHANCING CONNECTIVITY AND FREIGHT IN CENTRAL ASIA © OECD/ITF 2019
If the current trends hold, the transit traffic in Central Asia will increase by 6% per year until 2050. Figure 17 displays the share of transit traffic for road and rail freight. The term ‘transit’ here means any traffic whose origin and destination lie outside the five considered countries. Kyrgyzstan and Tajikistan’s current share of rail transit is nearly zero, but in 2050 they will gain some share due to the new links (these links are shown in green in Figure 17. Uzbekistan’s share of rail transit increases in 2030 due to the new link, but in 2050 it drops, which is likely due to construction of new links in Kyrgyzstan and Tajikistan and partial diversion of the traffic flow to these new links. The road transit share of Tajikistan decreases because part of the current traffic will go to the new railway lines.
Figure 17. Transit share of freight traffic
Alternative freight growth scenario: maritime transport cost increase
To illustrate some of the uncertainties, an alternative freight scenario was developed. This scenario assumes that the implementation of CO2 mitigation measures for maritime transport would increase transport costs for international shipping due to higher fuel costs and the increased capital expenditures required to retrofit the ships and install other low-carbon technologies. Furthermore, it assumes that slow-steaming measures are applied extensively, causing transport costs to increase further due to longer shipping times, which escalate time-related costs. More specifically, the scenario assumes that the sea transport cost will increase from 0.0016 USD/tonne-km to 0.0024 USD/tonne-km and a corresponding speed reduction on the sea transport mode is applied. In this scenario, shippers might consider other modes that offer lower travel times and transport costs to be more attractive, especially for highly time-sensitive goods (such as fashion, electronics or car parts) and perishable goods (such as food).
The global analysis shows that a maritime cost increase of 50% will not lead to significant changes in trade and traffic volumes and modal shares on the global level, yet it can affect certain countries more considerably, especially for rail transport. China–Europe trade represents one of the major global trade flows which could potentially see a shift in its mode share if sea transport becomes more expensive. Table 3 presents the modal share of China–Europe transport by 2050 under three scenarios: the current case represented by year 2015, baseline, and increased-cost scenarios. The baseline scenario is the scenario which includes the planned infrastructure and the border crossing time reduction, which is necessary to reach the level of performance of Latvia. The third scenario is the baseline one, with a 50% maritime cost increase globally. The result shows that a 50% increase in sea transport cost causes a slight reduction in the mode share of maritime transport (0.35%) but impacts drastically the total freight
0%
10%
20%
30%
40%
50%
60%
70%
80%
KAZ KGZ MNG TJK UZB
Road
0%
10%
20%
30%
40%
50%
60%
70%
80%
KAZ KGZ MNG TJK UZB
Rail
2015
2030
2050

CONNECTIVITY IN CENTRAL ASIA WITHIN THE GLOBAL TRANSPORT SYSTEM
ENHANCING CONNECTIVITY AND FREIGHT IN CENTRAL ASIA © OECD/ITF 2019 51
movements (-8%). This reduction results in a loss or transfer of 104 M-tonnes of sea freight volume, being only 7 M-tonnes captured as additional road or rail freight volume. Approximately half of this volume is estimated to shift to rail transport, which is projected to see an increase of 0.16% in its share. Although the reduction in share of maritime transport is relatively small, the shift to rail mode represents a roughly 8% increase in the total volume of rail transport.
Table 3. Impact of increased sea transport cost on modal share of China–Europe transport
Scenario Trade
(USD billions) Freight Volume (million tonnes)
Air % Rail % Road % Sea %
2015, current maritime cost 586 261 0.9% 2.2% 1.3% 95.7%
2050, current maritime cost 2 376 1 345 0.9% 2.2% 1.4% 95.6%
2050, 50% maritime cost increase 2 376 1 240 0.9% 2.3% 1.5% 95.2%
Results may vary across the countries depending on their geographical location and infrastructure, and the maritime scenario aims to determine the corresponding changes and their effect on connectivity for each of the Central Asian countries. The following sections present the results of testing the maritime cost increase scenario, as well as infrastructure scenarios for years 2030 and 2050, and a scenario with border crossing time reduction.
Results from freight connectivity analysis for Central Asia
The connectivity gap between Central Asian countries and the most developed
economies is high and driven by multiple factors
Figure 18 illustrates the high cost of being landlocked for several countries. Generally, landlocked countries have a level of connectivity (measured in terms of access to global GDP) that is nearly half that of the most developed economies. Partly this is driven by their distance from the global economic concentration, but it is also partly due to their lack of access to markets through effective and low-cost maritime connections. While many developing economies are landlocked, their access to world markets depends not only on the physical distance but also on transport costs and, more widely, on the availability of a trade corridors and transit systems.
The connectivity gap of Central Asian countries is around 50% of that of Germany (Figure 19), which is one of the best performers. This affects countries’ ability to integrate into global value chains. Since the indicator also takes into account domestic production and location of consumption centres, countries such as those of Central Asia, which have large territories and low population density, have lower connectivity.

CONNECTIVITY IN CENTRAL ASIA WITHIN THE GLOBAL TRANSPORT SYSTEM
52 ENHANCING CONNECTIVITY AND FREIGHT IN CENTRAL ASIA © OECD/ITF 2019
Figure 18. Global connectivity; access to global GDP
Source: ITF
Figure 19. Connectivity gap compared with Germany
Source: ITF
For the Central Asian countries, the distance to global economic centres is huge. The typical length of interregional corridors is in the same range as the typical route on the African continent (Rastogi and Arvis, 2014).
A manufacturer in Germany or United States can reach 20% of the global GDP within a 2 000-kilometre distance (Figure 20). For a Kazakh manufacturer, the average distance for the same 20% is over 4 000 kilometres. This distance is already a major obstacle for trade. In terms of cost, the distance is even larger between developed economies and Central Asian countries. The cost of reaching 20% of world GDP is nearly USD 300 per tonne for Kazakhstan, whereas for Germany and the United Sates it is around USD 50 per tonne. Annex 2 presents the corresponding graphs for the five focus countries.
Distance and the transport cost (including border crossing and handling costs) each account for around one-third of the explanatory component of the connectivity gap. Drivers of the connectivity gap differ
Per
cen
tage
of
Ger
man
y’s
con
nec
tivi
ty in
dex
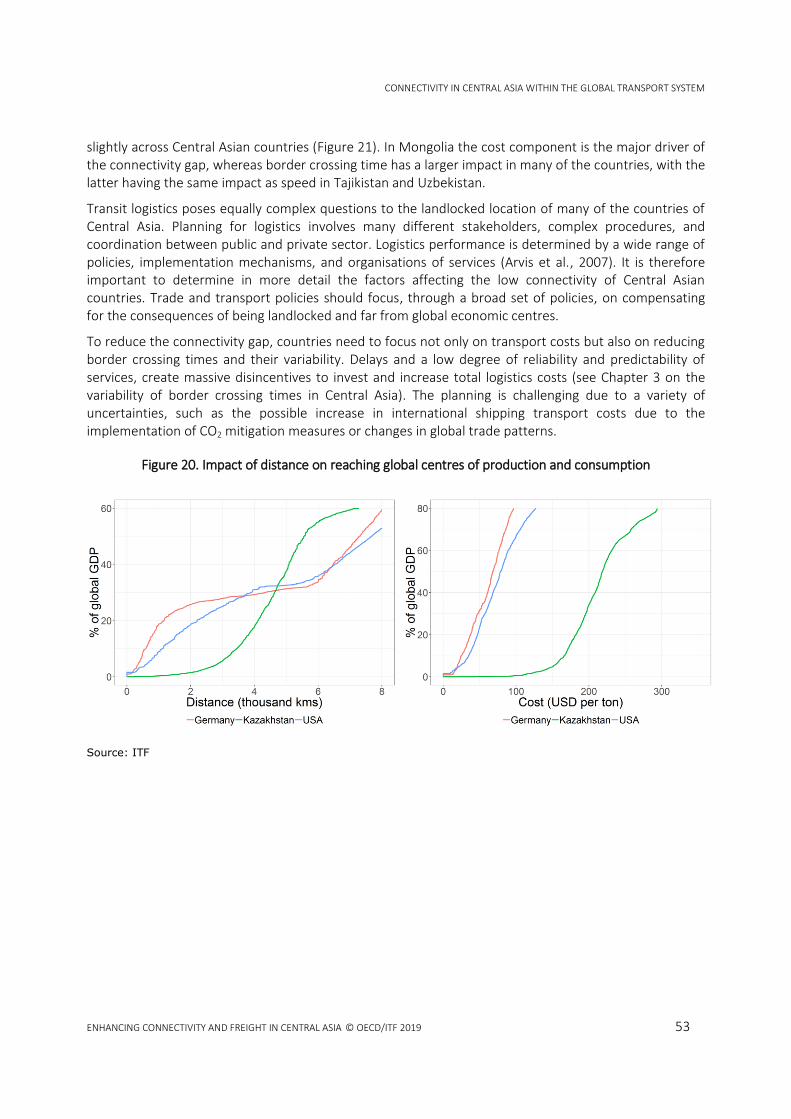
CONNECTIVITY IN CENTRAL ASIA WITHIN THE GLOBAL TRANSPORT SYSTEM
ENHANCING CONNECTIVITY AND FREIGHT IN CENTRAL ASIA © OECD/ITF 2019 53
slightly across Central Asian countries (Figure 21). In Mongolia the cost component is the major driver of the connectivity gap, whereas border crossing time has a larger impact in many of the countries, with the latter having the same impact as speed in Tajikistan and Uzbekistan.
Transit logistics poses equally complex questions to the landlocked location of many of the countries of Central Asia. Planning for logistics involves many different stakeholders, complex procedures, and coordination between public and private sector. Logistics performance is determined by a wide range of policies, implementation mechanisms, and organisations of services (Arvis et al., 2007). It is therefore important to determine in more detail the factors affecting the low connectivity of Central Asian countries. Trade and transport policies should focus, through a broad set of policies, on compensating for the consequences of being landlocked and far from global economic centres.
To reduce the connectivity gap, countries need to focus not only on transport costs but also on reducing border crossing times and their variability. Delays and a low degree of reliability and predictability of services, create massive disincentives to invest and increase total logistics costs (see Chapter 3 on the variability of border crossing times in Central Asia). The planning is challenging due to a variety of uncertainties, such as the possible increase in international shipping transport costs due to the implementation of CO2 mitigation measures or changes in global trade patterns.
Figure 20. Impact of distance on reaching global centres of production and consumption
Source: ITF

CONNECTIVITY IN CENTRAL ASIA WITHIN THE GLOBAL TRANSPORT SYSTEM
54 ENHANCING CONNECTIVITY AND FREIGHT IN CENTRAL ASIA © OECD/ITF 2019
Figure 21. Composition of the connectivity gap
The sections below present the results of testing infrastructure scenarios for the years 2015, 2030 and 2050, as well as a scenario with border crossing time reduction across the countries and a scenario where maritime costs increase by 50% globally. The impact of the scenarios on the transport flows in Central Asia is assessed by calculating the needs for infrastructure, changes in the connectivity indicators, and changes in transit flows.
Current investment plans will reduce the connectivity gap but are insufficient to
meet future demand
Several plans exist to expand or construct new road and rail. These plans are included in the scenarios assessing whether new infrastructure will improve connectivity and are sufficient to accommodate future growth.
Current infrastructure investment plans in Central Asia will reduce the connectivity gap with countries that are leaders in transport and logistics, such as Germany (Figure 22). The connectivity improvement is strongest for Kazakhstan and Kyrgyzstan. Compared with the current situation, the region will be able to reduce the connectivity gap with Germany – with a slightly smaller improvement in 2030–2050 than in 2015–2030, due mainly to minor additions to infrastructure after 2030.

CONNECTIVITY IN CENTRAL ASIA WITHIN THE GLOBAL TRANSPORT SYSTEM
ENHANCING CONNECTIVITY AND FREIGHT IN CENTRAL ASIA © OECD/ITF 2019 55
Figure 22. Connectivity gap compared with Germany, depending on the infrastructure plans and time horizon, %
The results also suggest that investments currently in the pipeline will be insufficient to accommodate all the future growth. Table 4 shows the capacity needed to maintain the baseline performance of the land transportation network. To meet the projected growth in freight and to maintain the current level of network performance by 2030, substantial road capacity increase is required in Central Asian countries, varying from 84% In Mongolia to almost 500% in Uzbekistan. The additional capacity needs for rail are less significant, and the existing plans are close to sufficient to meet future demand. For Mongolia the estimated additional capacity of rail is 65% – mainly for the corridor connecting Russia and China, which is already a congested railway link and is projected to carry substantially increased flows in the future. For Kyrgyzstan and Tajikistan, the corresponding values are around zero due to a very low current share of railway.
In the longer term, capacity needs are even greater if the region is to accommodate the future growth of freight volumes. As Table 4 shows, in 2050, given the flow projections assigned to the planned infrastructure, the capacity gap increases for both railway and roads. The largest increase in road capacity will be required in Uzbekistan, followed by Kyrgyzstan, as the two countries will attract large volumes of freight (Figure 16). Uzbekistan would require an expansion of its road and railway capacity most by 2050 to maintain the same level of network performance as today.

CONNECTIVITY IN CENTRAL ASIA WITHIN THE GLOBAL TRANSPORT SYSTEM
56 ENHANCING CONNECTIVITY AND FREIGHT IN CENTRAL ASIA © OECD/ITF 2019
Table 4. Infrastructure capacity required to maintain network performance, 2030 and 2050 (in volume-capacity ratios)
2030 2050
Country Road Rail Road Rail
Kazakhstan 151% 45% 350% 138%
Kyrgyzstan 251% 5% 984% 10%
Mongolia 84% 65% 284% 306%
Tajikistan 191% 0% 516% 3%
Uzbekistan 486% 13% 1365% 459%
It is important to emphasise that the capacity-needs indicator does not automatically translate to actual infrastructure investment needs and does not mean that the countries need to try to achieve such a level. This is because doing so would require significant investments (especially in the case of roads in Uzbekistan and Kyrgyzstan, as the table shows) which will not necessarily pay off in future given the relatively low population density of the countries and their GDP. Different measures beyond infrastructure improvements can help to reduce the capacity needs in order to maintain or achieve certain levels of network performance. The capacity needs are measured in terms of maintaining or reaching a certain level of the volume-to-capacity ratio in the network. Therefore, measures that improve volume-per-unit indicators will have a positive impact on this indicator. While this includes actual improvement of the infrastructure (construction and renovation of the existing lanes, increasing their capacity, better pavement), additionally, the volume-per-unit indicators can be improved through efficiency improvements – which might include bigger shipments, use of ‘mega-trucks’, and autonomous vehicles with platooning systems.
While the CAREC corridors demand an increase in infrastructure capacity, other roads that connect the main corridors should also be improved substantially. Figure 23 and Figure 24 show the exact links and routes where, according to our projected scenarios, bottlenecks will be observed in 2030 and 2050. The figures show a capacity increase beyond the capacity provided by the projects currently planned until 2050. The routes along the CAREC corridors will require a major capacity increase. This could be expected despite the planned investments because most of the CAREC road projects in Central Asia are designed to improve existing road quality rather than increase of the number of lanes. This strategy is reasonable given the low population density and relatively low traffic in the region, as well as the quite substantial room currently left for improving the road network quality. In this case, rehabilitating existing roads still will increase the volume-to-capacity ratio; however, if the traffic volume increases in future as projected, the countries might need to consider increasing the number of lanes of certain roads as well.

CONNECTIVITY IN CENTRAL ASIA WITHIN THE GLOBAL TRANSPORT SYSTEM
ENHANCING CONNECTIVITY AND FREIGHT IN CENTRAL ASIA © OECD/ITF 2019 57
Figure 23. Capacity needs in percentage of increase of the current capacity, 2030
Source: ITF
Figure 24. Capacity needs in percentage of increase of the current capacity, 2050
Source: ITF
CONNECTIVITY IN CENTRAL ASIA WITHIN THE GLOBAL TRANSPORT SYSTEM
58 ENHANCING CONNECTIVITY AND FREIGHT IN CENTRAL ASIA © OECD/ITF 2019
Several routes outside of CAREC corridors will likely need a significant increase in capacity as well. Most of these routes are located in Kazakhstan; they include routes connecting Pavlodar with Astana, Karagandy, Ust-Kamenogorsk and the Chinese border and several routes in the North connecting Atyrau, Aktobe, Oral, Kostanay, Astana and Petropavlovsk.
In addition, several routes outside of the CAREC corridors (connecting countries within the region) will need a capacity increase, such as Samarkand–Dushanbe, Kyzylorda–Urganch, and Tashkent–Khujand. Routes that are not considered parts of international corridors should not be overlooked, as they often provide local connectivity for cities and industrial sites of the region.
For countries or areas with low population density and long distances, such as Mongolia, this is especially challenging since connecting small towns might require substantial infrastructure investments. Here, finding optimal local solutions in terms of connectivity benefits and costs of construction and maintenance is of the greatest importance.
Improving border crossings can bring larger connectivity benefits when combined
with enhanced infrastructure
The Central Asian countries have made substantial efforts, including financial investments, to reduce border crossing times, with significant improvements over the last years (see also Chapter 3). However, the border crossing process is still relatively long, with high variations compared to the average world figures, mostly due to queuing at the borders (CAREC, 2016).
A scenario where border crossing times are reduced allows for estimation of its effect on traffic flows passing through the countries and through exact border crossing points, as well as the potential impact on connectivity. For this scenario the border crossing time of the five studied countries was reduced to that of Latvia, where border crossing times are good on a global level of comparison.
A comparison with the current situation (Figure 25 and Figure 26) shows that for all of the countries, a connectivity improvement resulting from improved border crossings is comparable to one resulting from new infrastructure. While this analysis does not include assessment of the impact of other logistics operations on connectivity, the results highlight the importance of soft measures.

CONNECTIVITY IN CENTRAL ASIA WITHIN THE GLOBAL TRANSPORT SYSTEM
ENHANCING CONNECTIVITY AND FREIGHT IN CENTRAL ASIA © OECD/ITF 2019 59
Figure 25. Connectivity gap compared with Germany depending on the infrastructure plans and border crossing, 2015 and 2050 (%)
The overall traffic flow passing through the region will increase by 11% for road and 2% for rail by 2050 due to the improvement in border crossing time, resulting in more capacity requirements to accommodate all the growth. Table 5 shows the capacity needed to maintain the performance of the land transportation network in year 2050 for both roads and railways, and the expected increase in transit flows due to the border crossing time reduction. Most of the countries will need more capacity – especially Tajikistan, for which the border crossing time reduction attracts substantial additional rail flow. (The rail capacity need for Tajikistan is also large due to the small size of its current railway network.) Kazakhstan and Uzbekistan, by contrast, might lose some of their rail flow due to a loss of mode share to road and to a redistribution of the flows along different routes.
Transit flow changes are more significant than the changes in the overall flow of trade. All of the countries will gain more road transit traffic if border crossing times are reduced, especially Kyrgyzstan. Transit traffic in Tajikistan’s rail sector will increase 95%, while in the rest of the countries the rail traffic will increase only slightly.
Table 5. Border crossing reduction effect on countries' needs for infrastructure increase, transit flow and total flow, 2050 (% of change)
Capacity needs Transit flow change
Country Road Rail Road Rail
Kazakhstan 2% -2% 10% 5%
Kyrgyzstan 28% 1% 32% 8%
Mongolia 0% 3% 1% 4%
Tajikistan 28% 278% 9% 95%
Uzbekistan 0% -5% -1% 4%
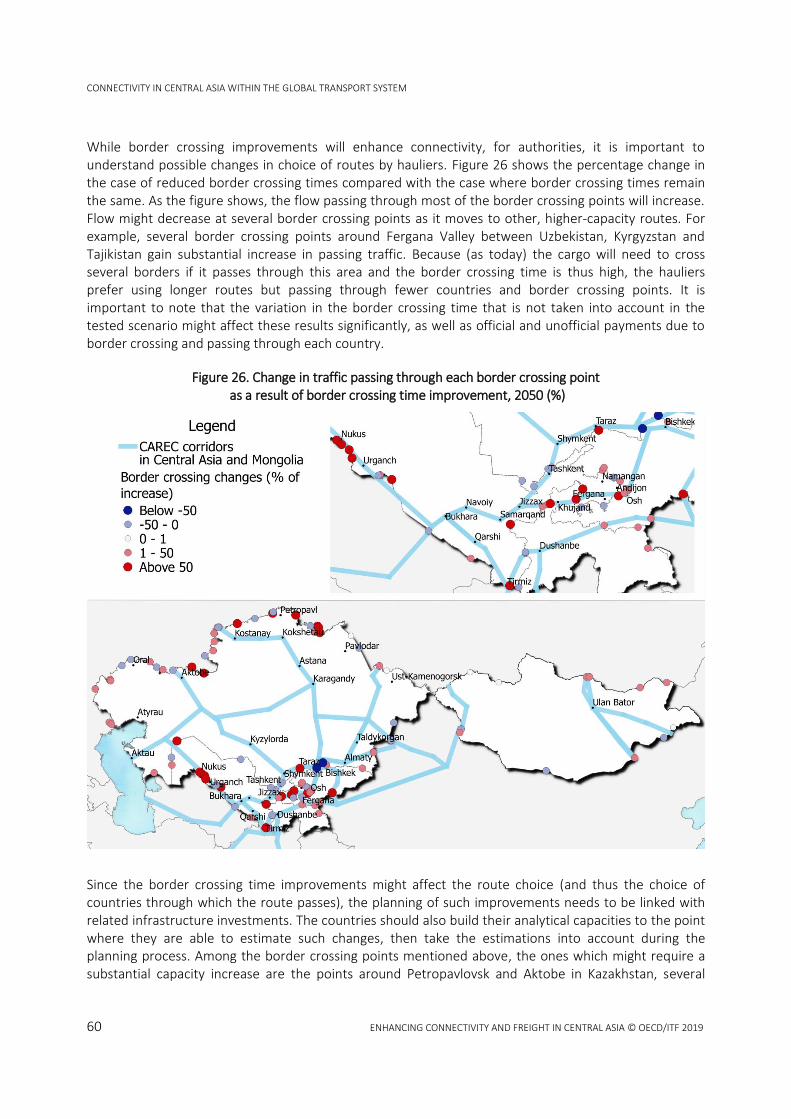
CONNECTIVITY IN CENTRAL ASIA WITHIN THE GLOBAL TRANSPORT SYSTEM
60 ENHANCING CONNECTIVITY AND FREIGHT IN CENTRAL ASIA © OECD/ITF 2019
While border crossing improvements will enhance connectivity, for authorities, it is important to understand possible changes in choice of routes by hauliers. Figure 26 shows the percentage change in the case of reduced border crossing times compared with the case where border crossing times remain the same. As the figure shows, the flow passing through most of the border crossing points will increase. Flow might decrease at several border crossing points as it moves to other, higher-capacity routes. For example, several border crossing points around Fergana Valley between Uzbekistan, Kyrgyzstan and Tajikistan gain substantial increase in passing traffic. Because (as today) the cargo will need to cross several borders if it passes through this area and the border crossing time is thus high, the hauliers prefer using longer routes but passing through fewer countries and border crossing points. It is important to note that the variation in the border crossing time that is not taken into account in the tested scenario might affect these results significantly, as well as official and unofficial payments due to border crossing and passing through each country.
Figure 26. Change in traffic passing through each border crossing point as a result of border crossing time improvement, 2050 (%)
Since the border crossing time improvements might affect the route choice (and thus the choice of countries through which the route passes), the planning of such improvements needs to be linked with related infrastructure investments. The countries should also build their analytical capacities to the point where they are able to estimate such changes, then take the estimations into account during the planning process. Among the border crossing points mentioned above, the ones which might require a substantial capacity increase are the points around Petropavlovsk and Aktobe in Kazakhstan, several
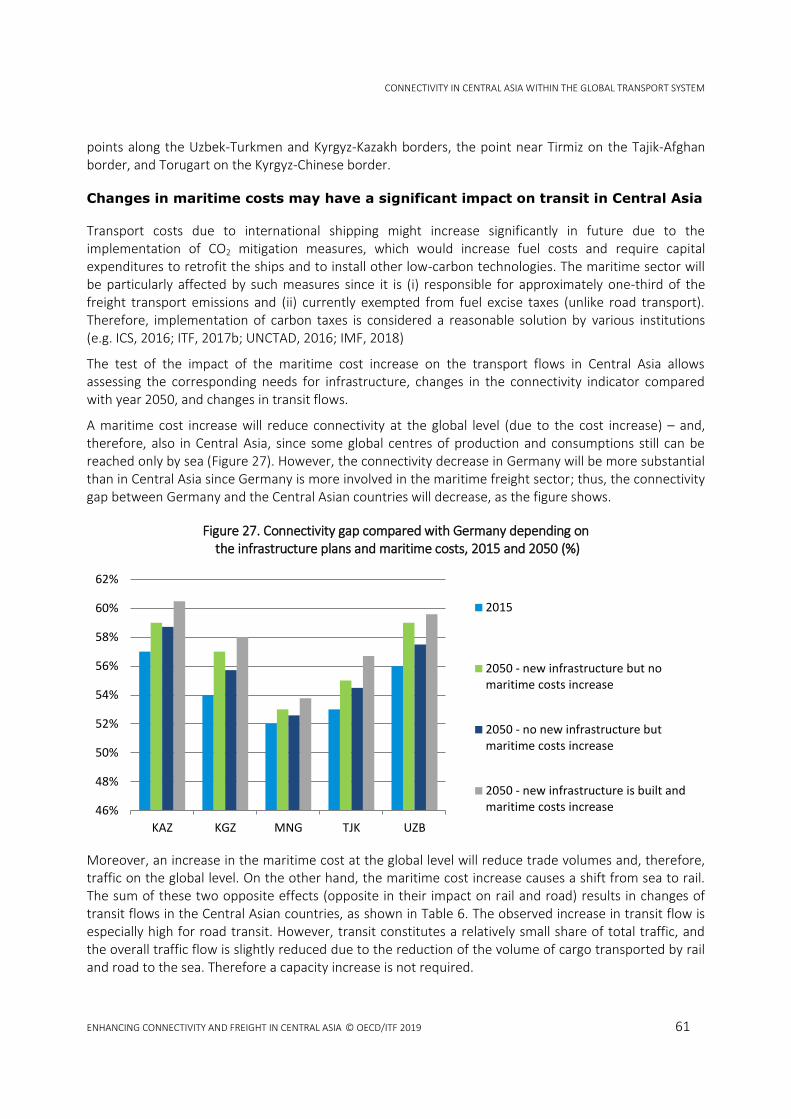
CONNECTIVITY IN CENTRAL ASIA WITHIN THE GLOBAL TRANSPORT SYSTEM
ENHANCING CONNECTIVITY AND FREIGHT IN CENTRAL ASIA © OECD/ITF 2019 61
points along the Uzbek-Turkmen and Kyrgyz-Kazakh borders, the point near Tirmiz on the Tajik-Afghan border, and Torugart on the Kyrgyz-Chinese border.
Changes in maritime costs may have a significant impact on transit in Central Asia
Transport costs due to international shipping might increase significantly in future due to the implementation of CO2 mitigation measures, which would increase fuel costs and require capital expenditures to retrofit the ships and to install other low-carbon technologies. The maritime sector will be particularly affected by such measures since it is (i) responsible for approximately one-third of the freight transport emissions and (ii) currently exempted from fuel excise taxes (unlike road transport). Therefore, implementation of carbon taxes is considered a reasonable solution by various institutions (e.g. ICS, 2016; ITF, 2017b; UNCTAD, 2016; IMF, 2018)
The test of the impact of the maritime cost increase on the transport flows in Central Asia allows assessing the corresponding needs for infrastructure, changes in the connectivity indicator compared with year 2050, and changes in transit flows.
A maritime cost increase will reduce connectivity at the global level (due to the cost increase) – and, therefore, also in Central Asia, since some global centres of production and consumptions still can be reached only by sea (Figure 27). However, the connectivity decrease in Germany will be more substantial than in Central Asia since Germany is more involved in the maritime freight sector; thus, the connectivity gap between Germany and the Central Asian countries will decrease, as the figure shows.
Figure 27. Connectivity gap compared with Germany depending on the infrastructure plans and maritime costs, 2015 and 2050 (%)
Moreover, an increase in the maritime cost at the global level will reduce trade volumes and, therefore, traffic on the global level. On the other hand, the maritime cost increase causes a shift from sea to rail. The sum of these two opposite effects (opposite in their impact on rail and road) results in changes of transit flows in the Central Asian countries, as shown in Table 6. The observed increase in transit flow is especially high for road transit. However, transit constitutes a relatively small share of total traffic, and the overall traffic flow is slightly reduced due to the reduction of the volume of cargo transported by rail and road to the sea. Therefore a capacity increase is not required.
46%
48%
50%
52%
54%
56%
58%
60%
62%
KAZ KGZ MNG TJK UZB
2015
2050 - new infrastructure but nomaritime costs increase
2050 - no new infrastructure butmaritime costs increase
2050 - new infrastructure is built andmaritime costs increase

CONNECTIVITY IN CENTRAL ASIA WITHIN THE GLOBAL TRANSPORT SYSTEM
62 ENHANCING CONNECTIVITY AND FREIGHT IN CENTRAL ASIA © OECD/ITF 2019
The observed changes in traffic flow and the corresponding capacity needs can be explained by the high cost of rail and road haulage compared with the cost of transportation by sea. Although the model shows that, at the global level, road and rail flows in some countries might increase by several times because of the maritime cost increase, in the Central Asian countries the difference between the maritime and land transport cost still would not be sufficient to boost a major mode shift.
Table 6. Effect of a global 50% maritime cost increase on countries' needs for an infrastructure increase, and traffic flow increase, % of the increase, 2050
Capacity needs Transit flow change
Country Road Rail Road Rail
Kazakhstan 0% 4% 12% 2%
Kyrgyzstan -1% -1% 35% 6%
Mongolia -1% -3% 0% 1%
Tajikistan 2% -1% 36% 134%
Uzbekistan -3% -1% 20% 1%
Overall, the scenario analysis results showed that the impact of an increase in the cost of maritime shipping will have a significantly smaller impact on infrastructure needs than trade growth. Therefore, the countries should marginally account for this future growth in their investment and policy planning. As noted above, the desired performance level of the transport network can be achieved not only by expanding physical infrastructure, but also by improving transportation efficiency.
Moving forward: cost and travel time reduction is the key
For Central Asian countries, the factors of distance and landlocked status can never be fully eliminated. However, as this chapter shows, they can be compensated through appropriate policy measures aimed at reducing costs and travel times. The direct monetary costs include tariffs, licenses, insurance, border crossing fees, etc. The time component consists of travel time as well as border crossing time, including queuing, etc. Reducing the cost and time of long-distance connectivity is crucial, and rail corridors form a reliable complement to sea – and a backbone of long-distance connectivity. Road transport has a great advantage because it is flexible and, for carrying goods and people over short distances, faster and more economic; it therefore can provide good access to the other modes or serve as the main mode for shorter trips.
The results show that current infrastructure investment plans in Central Asia will reduce the connectivity gap, but the investments in the pipeline are not sufficient to accommodate all the future growth. The main corridors identified by international programs such as CAREC and BRI are not sufficient and need to be complemented with intra-regional connectivity. These routes outside of the main corridors, which are expected to sustain a substantial flow increase as early as 2030, are those in the north of Kazakhstan, as well intra-regional routes such as Samarkand–Dushanbe, Kyzylorda–Urganch, and Tashkent–Khujand.
Various measures beyond the construction of new infrastructure can help to reduce the capacity needs to maintain or achieve certain levels of network performance. These measures include both infrastructure improvements (e.g. building and renovating existing road lanes, increasing their capacity, using better pavement) and efficiency improvements (e.g. use of bigger shipments and ‘mega-trucks’). As
CONNECTIVITY IN CENTRAL ASIA WITHIN THE GLOBAL TRANSPORT SYSTEM
ENHANCING CONNECTIVITY AND FREIGHT IN CENTRAL ASIA © OECD/ITF 2019 63
a technical speed limit has been reached in recent decades, opportunities for further reducing shipment times are mostly associated with intermodal and transmodal operations, with containerisation being the fundamental factor.
The Central Asian countries should also develop or continue developing national and regional logistics strategies. The main goals of the strategy should be to identify, upgrade and interconnect the assets that contribute to trade competitiveness. The priorities already highlighted in this chapter include addressing last-mile connectivity issues and providing better intermodal links between the national transport networks connecting regions to the rest of the world. The following chapters present more details on possible developments of the national and regional logistics strategies.
Improving border crossing can further increase connectivity in Central Asia. It can affect the route and mode choices of the hauliers, however, with variations occurring within the same country, or among different countries and transport modes. The most substantial changes due to border crossing time reduction will likely happen in the area of the Fergana Valley, where the borders of Kyrgyzstan, Tajikistan and Kyrgyzstan intersect. In this area the amount of traffic passing through the border crossing points will likely increase by more than 50% if border crossing times are reduced to those currently prevailing in Latvia. It is important for the authorities to understand possible changes in these choices and to link planned improvements at border crossing points with related infrastructure investments.
A maritime cost increase would not significantly affect traffic flow through the Central Asian countries and would require very minor infrastructure changes compared with the changes that would be needed to accommodate trade growth over the years. However, the maritime cost increase is just one of the plausible scenarios in the rapidly changing modern world, and the countries should strengthen their analytical capacities so they are able to estimate the effects of their investment plans under various plausible scenarios.
The uncertainty related to costs and travel times stems from both endogenous and exogenous factors. The former refers to government actions such as setting tariffs, improving physical and soft infrastructure for faster connections, etc.; exogenous factors include changes in global oil prices and CO2 taxes, the political and economic situation of other countries, technological disruptions, etc.
Sufficient institutional capacity will be necessary to be able to plan under conditions of uncertainty, and it is important that the Central Asian countries develop tools to adapt to these uncertainties – including detailed national transport models to improve the precision of projections. Their ability to adapt to uncertainties is best served by adopting flexible planning procedures within long-term strategic planning frameworks. In addition, it is critical for the Central Asian countries to integrate the concepts of resilience and vulnerability. Transport assets that integrate such considerations systemically can reduce potential uncertainties around supply shocks and the temporary unavailability of infrastructure.
Because Central Asia is a part of the global transport network, various exogenous factors, besides the possibility of a maritime cost increase, might affect regional trade and traffic flows. To remove such barriers, strong international and intra-regional cooperation is necessary.
Enhancing connectivity does not automatically lead to economic
benefits
Enhancing connectivity can generate both short- and long-term economic growth. Improving trade infrastructures, fostering the efficiency of logistics services, and improving the speed and predictability of custom procedures will ultimately lead to faster, more reliable and cheaper freight transport. In the short

CONNECTIVITY IN CENTRAL ASIA WITHIN THE GLOBAL TRANSPORT SYSTEM
64 ENHANCING CONNECTIVITY AND FREIGHT IN CENTRAL ASIA © OECD/ITF 2019
run, this means that businesses have a better connection with potential suppliers, which enables them to access higher-quality or lower-cost inputs; but also with customers, which enables them to supply new markets. In the long run, improved connectivity will lead to broader socio-economic outcomes through agglomeration effects and the integration of domestic companies into global value chains (OECD, 2015).
However, the growth potential associated with increased connectivity is neither unlimited nor automatic; rather, it varies with the local context. Numerous empirical studies show how the effect of transport infrastructure on economic growth varies in different regions of the world. The elasticity of GDP to the transport infrastructure endowment ranges from 0.03 to 0.3. It is stronger for smaller, flatter, and less-developed countries, suggesting that economic integration is a key mechanism (Melecky et al., 2018, Elburz et al., 2017). More generally, triggering the benefits of enhanced connectivity will require progress in addressing other structural reform challenges, particularly in terms of strengthening competition, entrepreneurship and private-sector development (for an overview in the Central Asian region, see OECD, 2018).
The economic impact of enhanced connectivity is both context- and project-specific. It varies by sector and by type of transport infrastructure. Cantos et al. (2005) showed that road stock significantly impacts all economic sectors except construction, with a much higher elasticity in agriculture (0.124) followed by industry (0.067) and services (0.013). The impact of road infrastructure also varies depending on investment type. For instance, according to the results estimated from regional-level models in Maryland (Zhang and Kastoruni, 2014), in the short run, increasing highway mileage by 1% creates less economic growth than improving the overall quality of the existing highway system by 1%; in the long run, however, the effect of highway construction is larger than that of highway maintenance.
The potential for growth ranges between 1% and 11%
Large investments projects planned in Central Asia, as well as foreseeable improvements in border custom procedures, have the potential to increase connectivity to foreign market by 5% to 11%. This will result in both higher trade volumes and, through the specialisation and agglomeration of economies, higher productivity. This report estimates that the potential for growth ranges between 1% and 11%.
The estimation proposed in this report is based on a simple but robust approach. Let us start with a caveat: Assessing the economic impact of large investment projects and policy reforms pertaining to connectivity is beyond the scope of this study. In fact, the relationship between transport system performance and the economy is still under debate in the scientific community. An advanced approach requires spatial general equilibrium models (Melecky at al., 2018); however, although conceptually these tools can provide rich insights into the direct and indirect effects of a corridor intervention, they remain complex, expensive to set, and arguably unreliable (ITF, 2017b). For this reason, we have retained a simplified approach.
The assessment methodology consists of two steps. First, we estimate the trade increase from the connectivity indicator, assuming an elasticity of one. Indeed, our indicator derives directly from the classic gravity model of international trade (Walter, 1954), where trade is proportional to connectivity. Second, the trade increase is assumed to lead to an increase of GDP per capita, with an elasticity of 0.9 (Frankel and Romer, 1999).
The results estimated using the connectivity indicator (Figure 28) suggest that the contributions of new infrastructure and improved border crossing times will have a positive effect on economic growth, varying from nearly 1% to 11%, between 2015 and 2050. The contribution to growth will be especially

CONNECTIVITY IN CENTRAL ASIA WITHIN THE GLOBAL TRANSPORT SYSTEM
ENHANCING CONNECTIVITY AND FREIGHT IN CENTRAL ASIA © OECD/ITF 2019 65
high for Kyrgyzstan (11%), assuming the country both builds the planned infrastructure and improves the border crossing times.
Figure 28. Potential growth of GDP as a result of transport policy measures, from 2015 to 2050 (percentage change)
The observed economic growth is quite modest, given the 35-year time period. However, three remarks must be made. First, these are aggregated estimates; the actual impact will vary significantly across countries’ regions (e.g. in rural and urban areas, or depending on the proximity to the main corridors). Second, the measured effect can be amplified with appropriate supporting policy measures, in particular by focusing on regional connectivity. Third, this benefit must be compared with the investments required. Some measures – the improvement of border crossing procedures, for example – might require little investment while fostering connectivity significantly.
Quantify connectivity to focus on investments that offer the best value for money
One of the main benefits of ongoing international infrastructure projects is the improved connection of Central Asia to foreign markets. Currently, however, when projects are appraised, their impact on connectivity is rarely quantified. Instead, the assessments focus on immediate and short-term outcomes, such as savings in travel time and vehicle operating costs.
Appraisal methods should be expanded in the countries so that the connectivity impact becomes the main criterion of project prioritisation. This would require conducting studies using geographic economy methodologies to understand how, and to what extent, better connectivity will benefit national economies. Such studies can also reveal whether and where international infrastructure projects may foster investments on main corridors. In short, for every large project the connectivity gains should be quantified and monetized. Even if assigning a value to connectivity is difficult from a scientific perspective, it is important to choose a reference value to ensure that decisions are consistently made.
0.0%
2.0%
4.0%
6.0%
8.0%
10.0%
12.0%
KAZ KGZ MNG TJK UZB
2050 - new infrastructurebut no border crossingimprovement
2050 - no newinfrastructure but bordercrossing improves
2050 - both newinfrastructure is built andborder crossing isimproved

CONNECTIVITY IN CENTRAL ASIA WITHIN THE GLOBAL TRANSPORT SYSTEM
66 ENHANCING CONNECTIVITY AND FREIGHT IN CENTRAL ASIA © OECD/ITF 2019
References
Cantos, P., M. Gumbau‐Albert, J. Maudos (2005). “Transport infrastructures, spillover effects and regional growth: evidence of the Spanish case.” Transport Reviews, 25(1), 25–50.
CAREC (2016). CAREC CPMM Corridor Performance and Measurement Monitoring. Annual report.
Chateau, J., R. Dellink, E. Lanzi (2014). An Overview of the OECD ENV-Linkages Model. OECD: Paris, France.
Deloitte (2018). Embracing the BRI ecosystem in 2018. Navigating pitfalls and seizing opportunities. Available on: https://www2.deloitte.com/insights/us/en/economy/asia-pacific/china-belt-and-road-initiative.html . Accessed on the 20th of November 2018.
Elburz, Z., P. Nijkamp, E. Pels (2017). “Public infrastructure and regional growth: Lessons from meta-analysis”. Journal of Transport Geography, 58, 1–8.
European Commission (2018). Available on: https://ec.europa.eu/transport/themes/infrastructure/about-ten-t_en . Accessed on the 20th of November 2018.
Fontagné, L. and J. Fouré (2013). "Opening a Pandora’s Box: Modelling World Trade Patterns at the 2035 Horizon", CEPII Working Paper No. 22. Paris: CEPII Research Center.
Frankel, J. A., and D.H. Romer (1999). “Does trade cause growth?” American Economic Review, 89(3), 379-399.
ITF (2016). Capacity to Grow. Corporate Partnership Board Report.
ITF (2017a). Public Private Partnerships for Transport Infrastructure: Renegotiation and Economic Outcomes. ITF Roundtable Report No. 161. Paris: OECD Publishing. http://dx.doi.org/10.1787/9789282108130-en
ITF (2017b). Quantifying the Socio-economic Benefits of Transport. https://doi.org/10.1787/9789282108093-2-en
Lobyrev, V., A. Tikhomirov, T. Tsukarev, and E. Vinokurov (2018). Belt and Road Transport Corridors: Barriers and Investments. Eurasian Development Bank, Institute of Economy and Transport Development.
Martinez, L., J. Kauppila, M. Castaing (2014). “International Freight and Related CO2 Emissions by 2050: A New Modelling Tool”. Discussion Paper No. 2014-21, International Transport Forum.
OECD (2015). The Metropolitan Century: Understanding Urbanisation and its Consequences. Paris: OECD Publishing. http://dx.doi.org/10.1787/9789264228733-en.
OECD (2016). “Cardiac Arrest of Dizzy Spell: Why is World Trade so Weak and What Can Policy Do About It?”, OECD Economic Policy Paper, September 2016, No. 18.
OECD/ITF (2017). ITF Transport Outlook 2017. Paris: OECD Publishing. http://dx.doi.org/10.1787/0789282108000-en
OECD (2018), Global Material Resources Outlook to 2060: Economic Drivers and Environmental Consequences. Paris: OECD Publishing.

CONNECTIVITY IN CENTRAL ASIA WITHIN THE GLOBAL TRANSPORT SYSTEM
ENHANCING CONNECTIVITY AND FREIGHT IN CENTRAL ASIA © OECD/ITF 2019 67
United Nations (2014). World urbanization prospects: The 2014 Revision. New York: United Nations Publications.
UN Comtrade Database (2018). Available online on https://comtrade.un.org/, accessed on the 15.07.2018.
Zhang, L. and E. Kastrouni (2014). Economic impact of investment on highway construction and highway maintenance. Summary of the 8th University Transportation Centers Spotlight Conference.
Walter, I (1954). "Location Theory and Trade Theory: Short-Run Analysis", Quarterly Journal of Economics, 68 (2): 305–320.

BENCHMARKING NATIONAL FREIGHT SYSTEMS
68 ENHANCING CONNECTIVITY AND FREIGHT IN CENTRAL ASIA © OECD/ITF 2019
3. Benchmarking national freight systems
The performance of transport infrastructure and markets is critical to the competitiveness of the Central Asian economies. Well-functioning logistics systems facilitate trade by lowering the cost of access to international markets and improving the competitiveness of domestic firms (Arvis et al., 2018). High-quality transport infrastructure underpins both the success of firms operating in international markets and an economy’s attractiveness to foreign investors (Yeaple and Golub, 2007).
This chapter focuses on national freight policies and on how to improve their efficiency. The analysis follows ITF’s standard practices in assessing the performance of transport systems (for previous work, see ITF, 2015, and OECD, 2017). It employs a set of key performance indicators (KPIs) that, by focusing on various dimensions of freight systems, allow for the benchmarking of the region against ITF countries’ best practices. The chapter focusses on three specific dimensions:
1. The quality of trade and transport infrastructure
2. The efficiency of transport and logistics services
3. The speed, simplicity and predictability of customs procedures
Transport infrastructure in Central Asia
Physical infrastructure is foundational in transportation. Transport infrastructure is known to have a significant impact on the productivity and cost structure of an economy (Haughwout, 2001). Poor transport infrastructure implies not only longer and less-reliable travel times, but also increased vehicle maintenance costs.
The perception of transport infrastructure by international freight forwarders is
improving
A first approach to assessing infrastructure quality is to analyse some of the available international benchmarking tools. This sub-section looks at two in particular: the World Bank’s Logistic Performance Index (LPI) and the World Economic Forum’s Global Competitiveness Index (WCI).
The LPI is a multi-dimensional assessment of logistics performance. It is based on surveys of port operators, shippers and freight forwarders, producing a composite index reflecting responses to the questionnaire. Because of the nature of those surveyed, the LPI is oriented towards assessing the transport of manufactured goods rather than bulk commodities, and it is more applicable to higher-value goods. It is divided into six main dimensions for the International LPI and four for the Domestic LPI, each associated with an indicator. The LPI’s infrastructure indicator, used below, represents the overall quality of trade- and transport-related infrastructure.
The WCI rests on unique data drawn from the Executive Opinion Survey, which surveys top business executives in all countries covered. Infrastructure is one of 12 competitiveness “pillars” covered by the index. In particular, it gives an assessment of the perceived quality of rail and road networks.
These two indicators generally show that the quality of transport infrastructure is still to be improved. As of 2018 the LPI infrastructure index was between 2.5 (Uzbekistan and Kazakhstan) and 2 (Mongolia and Tajikistan), while out of 160 countries, 90% have a score over 2; the region performs lower than middle-
BENCHMARKING NATIONAL FREIGHT SYSTEMS
ENHANCING CONNECTIVITY AND FREIGHT IN CENTRAL ASIA © OECD/ITF 2019 69
income countries on average (Figure 29). The WCI infrastructure index paints a slightly better picture of transport infrastructure in the region: scores are comparable to the world average, which was 2.6 in 2017 (Figure 30). However, while neighbouring countries such as China and India rank high in the WCI infrastructure index, Kyrgyzstan, Mongolia and Tajikistan are lagging behind.
Although there is no pattern of growth in the LPI infrastructure index, more detailed indicators show that the rail and road networks are improving. The WCI indicates that quality of trunk roads in Mongolia is increasing. It also records significant progress in Tajikistan, for both rail and road. In surveys conducted as part of the LPI, over 70% of the international freight forwarders states that infrastructure improved in Kazakhstan.
There is still much to be done to improve nodal infrastructure such as logistical centres and route-side facilities. The discrepancy between the LPI and WCI scores can be explained by the difference in methodological approach. As the LPI covers all forms of infrastructure and tend to focus on high-value goods, it also gives a broader view in which nodal infrastructures play a crucial role. Local interviews have shown that logistics facilities for warehousing, multimodal transfer or cross-docking are rare and inefficient. In Tajikistan, roadside infrastructure – such as fuel stations, health centres or motels – is lacking, especially in the road section near the Kulma pass, the country’s only direct border-crossing point to China.

BENCHMARKING NATIONAL FREIGHT SYSTEMS
70 ENHANCING CONNECTIVITY AND FREIGHT IN CENTRAL ASIA © OECD/ITF 2019
Figure 29. LPI infrastructure score, 2007–2018
Note: The green area depicts the inter-decile range.
Source: Arvis et al. (2018).
Figure 30. WCI infrastructure score, 2007–2017
Note: No data is available for Uzbekistan.
Source: WEF (2017).

BENCHMARKING NATIONAL FREIGHT SYSTEMS
ENHANCING CONNECTIVITY AND FREIGHT IN CENTRAL ASIA © OECD/ITF 2019 71
The road and rail networks are slowly recovering from years of insufficient
maintenance
Transport infrastructure density in Central Asia is low, reflecting both the geographically dispersed nature of the region’s cities and its large, sparsely populated geographies. Road network density, for example, is about ten times lower than in other middle-income countries. Although this observation is widely reported, it does not necessarily reflect an infrastructure gap; rather, it is the consequence of the geographical specificities of the region, which features large, unpopulated areas such as high-plateau or desert regions. Other sparsely populated countries, such as Chile, Australia and Canada, also have road densities of approximately 0.1 km of road per km2. Similarly, the percentage of unpaved roads is high in Tajikistan, Kyrgyzstan and Mongolia, where gravel and improved-earth roads are common. Yet given the low traffic levels, it is generally economically justified. Even in high-income and low-density countries, it is not uncommon to have a high share of unpaved roads (Table 7). The economic logic is the following: for road users, unpaved roads mean higher operating costs and lower speeds. The traffic volumes on the road need to be high enough so that the aggregate benefits outweigh the upfront investment costs and the yearly maintenance costs (World Bank, 1988). Applications to various developing countries of the Highway Development and Management standards, developed by the World Road Association (PIARC, 2019), have shown that the economic traffic threshold for paving roads is between 100 and 400 vehicles a day. In countries such as Mongolia, Kyrgyzstan and Tajikistan, such traffic levels are not achieved on a large share of the road network.
Table 7. Transport infrastructure provision in Central Asian countries and comparators
Countries Road density (km per km
2)
% of which unpaved
Rail Density (m per km
2)
% of which electrified
Kazakhstan 0.04 25% 5 27%
Kyrgyzstan 0.17 70% 2 ~0
Mongolia 0.03 91% 1 ~0
Tajikistan 0.19 83% 4 ~0
Uzbekistan 0.18 13% 10 29%
Upper-middle-income countries 1.5 38% 31 31%
Chile 0.10 60% 0.43
Australia 0.12 57% 0.53
Sweden 0.53 70% 2.38
Source: Open Street Maps, CAREC (2017).

BENCHMARKING NATIONAL FREIGHT SYSTEMS
72 ENHANCING CONNECTIVITY AND FREIGHT IN CENTRAL ASIA © OECD/ITF 2019
Table 8. Road design in Central Asian core national networks
Countries Trunk road network (thousand kilometres)
% of roads with motorway standards
% of two-lane roads with international design standards
% of two-lane roads with low design standards
Kazakhstan 13.3 3% 89% 52%
Kyrgyzstan 1.8 0% 17% 83%
Mongolia 4.3 0% 6% 94%
Tajikistan 1.9 0% 52% 48%
Uzbekistan 10 26% 59% 10%
Source: Asian Highway database, UNESCAP (2016).
There are only few transport links with high capacity and high design standards, even on core national networks. Only Kazakhstan and Uzbekistan have motorways corresponding to international standards, i.e. access-controlled roads with two lanes separated by a median strip. Their geometric design (lane width, maximal curve and inclination) allow vehicles to drive safely at higher speeds, typically 120 km/h. The main motorways are the M39 between Tashkent and Samarkand and various routes connecting Almaty to the important cities along the Kazak-Kyrgyz border. By contrast, most of the trunk network has low design standards, with double bituminous surfaces rather than asphalt concrete or cement concrete surfaces. These types of pavements are usually recommended for medium-traffic rural roads and are not suited for important routes. They impose low driving speeds and are easily damaged by heavy freight traffic or overloaded vehicles.
During the last decade, there have been significant efforts to rehabilitate international transport corridors. As international transport corridors tend to overlap with core national networks (see Figure 12 and Figure 13), this means that roads connecting the main national economic centres (typically oblast capitals) are now in a good shape. The Asian Highway database reports that more than 70% of the core national network is in good condition (UNESCAP, 2016). This is the result of major investments after 2005. Most of national roads were built in the 1970s and have not gone through any major reconstruction since.
Local roads, however, are in poor condition. For years the underfunding of maintenance work has produced roads in a state of disrepair. Furthermore, the road infrastructure is regularly affected by extreme climate events. In Kazakhstan, available data show that only 18% of oblast roads and 10% of urban roads are in good condition, whereas roads in urgent need of repair were 26% and 47%, respectively (ADB, 2016). In Tajikistan, up to 80% of the road network is considered as being in poor or very poor condition (ADB, 2011). Although a quantitative assessment of the road network state is not available for every country, local interviews reveal that better road maintenance is needed throughout all Central Asian countries.
Insufficient maintenance has been costly for Central Asian governments. It has led to an important asset loss, constraining national integration and access in remote areas. The maintenance backlog has reached considerable value, which could have been avoided by adequate maintenance strategies. Because rehabilitation costs can be five to ten times higher than the cost of periodic maintenance, no road should be allowed to deteriorate to a level of poor condition, unless there has been a decision to abandon it. In Mongolia, rough estimates show that rehabilitating the (paved) road network to good conditions would cost USD 260 million (Hasnain et al., 2013). In Uzbekistan there is a sizeable backlog of deferred maintenance, estimated at USD 1 billion (PADECO, 2014). More generally, if the lack of maintenance

BENCHMARKING NATIONAL FREIGHT SYSTEMS
ENHANCING CONNECTIVITY AND FREIGHT IN CENTRAL ASIA © OECD/ITF 2019 73
persists, the roads that are now in good condition or were recently rehabilitated with external or internal funding could require more investment for rehabilitation.
Insufficient maintenance has also been costly to society. Because the cost of operating vehicles rises as the roads deteriorate, inaction likely has translated into higher transport costs. This, in turn, has contributed to the very poor quality of access to remote regions and to the high costs of basic commodities, particularly outside the main regions. In classic transport economics, USD 1 unspent on road maintenance translates into about USD 4 of loss to the society, most of which is felt long afterwards.
Spending on infrastructure has increased
Historically, regional spending on infrastructure has been low. In the 1990s and most of the 2000s, infrastructure spending was typically less than 0.5% of GDP, which is significantly under international standards, especially for rapidly growing countries. Obviously the Russian and Asian financial crises partly explain this situation, but the lack of existing funding mechanisms has also resulted in very volatile budgets over years.
During the last decade, expenditure on road and rail has increased steadily, and it is now almost in line with international levels. Investment in road infrastructure is today around 1% of GDP in most countries of the region. For rail investment, spending is still low (between 0.3% and 0.5% of GDP), but the volume of planned infrastructures suggests that it is increasing. This is linked with countries’ efforts to improve transport planning and funding. Uzbekistan set up a Republican Road Fund (RRF) in 2003 (although it was not fully operational until 2006) which is responsible for transport planning and financial management of road construction and maintenance. The RRF is funded through earmarked profit and turnover taxes. Under the auspices of the RFF, road budgets doubled between 2007 and 2012.
Figure 31. Spending on infrastructure
(% of national GDP)
Note: Latest year available
Source: ITF computations based on data requested from national administration and various ADB
sectorial reports. Kyrgyzstan data was unavailable. ITF data for middle-income countries
However, maintenance budgets remain small. While the condition of the region’s infrastructure would seem to require higher-than-usual maintenance spending, it is in fact significantly lower than

BENCHMARKING NATIONAL FREIGHT SYSTEMS
74 ENHANCING CONNECTIVITY AND FREIGHT IN CENTRAL ASIA © OECD/ITF 2019
international levels. It is likely that the focus on capital expenditures has adversely affected funding for periodic and routine maintenance. For instance, Mongolia spends only 0.15% of its GDP on road maintenance, while maintenance in middle-income countries averages 0.75% of GDP.
Recommendations for improving transport infrastructure
Improve road maintenance funding and efficiency
There is a clear need for stable funding flows dedicated to road maintenance. Given the network’s current state of disrepair, a fund with earmarked resources is a reasonable option. The fund should be financed by road user charges set to cover the marginal cost of using roads, rather than through general taxation. This ensures stable funding flows that allow for long-term resource planning, with documented benefits in terms of performance. For example, studies in Latin America showed that the insecurity of the funding for fuel and salaries led to low equipment utilisation rates and a low number of kilometres maintained per employee (Gwilliam and Shalizi, 1999).
Although several road funds already exist in Central Asian countries they would need to be restructured. Experiences in developing countries have shown that road fund can be a useful tool if following some guiding principles. Road funds should have a strong legal basis, act as an independent executive authorities and have in-house technical capacity (Gwilliam and Kumar, 2003). Additionally, investment and maintenance should not be allocated through separate budgets, as there is ample evidence of a systematic bias against maintenance. Existing road funds do not follow these principles. The Republican Road Fund in Uzbekistan is funded from general taxation, depends directly on the Financial Ministry, and lacks technical expertise, which remains in the national road agency, Uzatoyul. The Mongolian Road Fund relies on a fixed share of a fuel tax surcharge that is not indexed to construction costs; as a result, the funding gap has increased over the years.
Although the collection of user charges through road charges on large international corridors is an option, it might not be suited for all countries of the region. By 2020, in Kazakhstan, 6 500 km of roads will be charged and should generate USD 90 million in revenue per year; this is expected to cover more than 50% of the maintenance needs for national roads. While this seems to be a good approach for Kazakhstan, it is not adapted to every situation. For instance, given the low traffic volumes, the collection costs of road tolls in Mongolia are 80% (ADB, 2014). In these cases, other forms of collection should be considered. In New Zealand, facing a similar situation, the government settled on a road user charge for heavy vehicles (See Box 7).
Modernising road asset management is required to improve its efficiency. Even with larger budgets, maintenance quality will not necessarily improve if there is no change in the way maintenance is undertaken. A systematic approach to prioritising road maintenance interventions would help governments better assess the real need for road maintenance and development. Although ad hoc surveys are undertaken, there is in general no network condition database for rural and local roads. This is urgently required. Only with comprehensive data can a prioritised remedial maintenance program be developed. Road Asset Management Systems (RAMS) are currently being developed in all Central Asian countries with the assistance of the Asian Development Bank. It is urgent that Central Asian countries finalise their implementation and use them to design their maintenance strategies.

BENCHMARKING NATIONAL FREIGHT SYSTEMS
ENHANCING CONNECTIVITY AND FREIGHT IN CENTRAL ASIA © OECD/ITF 2019 75
Box 7. Road user charging in New Zealand
The road user charge (RUC) was introduced in New Zealand in 1978 as a means of more efficiently charging for road use by heavy vehicles and to provide a level playing field for rail and road freight competition. It replaced a fuel excise duty on diesel and applies to both heavy vehicles over 3.5 tonnes and light-duty diesel vehicles. The RUC is distance-based: Drivers are required to buy and display a distance licence, and the charge is enforced by requiring vehicles subject to the RUC to be fitted with a distance recorder.
A cost allocation model is used to distribute road-wear and common costs between categories of vehicles with regard to space use, vehicle weight and distance travelled. The model is regularly run when changes to the RUC are considered, and the model itself is updated periodically; it was last updated in 2015. The RUC is one of the main revenue sources of the National Land Transport Fund (NLTF) in New Zealand, accounting for around 40% of its revenue. Other key funding sources include a fuel excise duty for petrol- and gas-powered vehicles (around 54%) and motor vehicle registration and licensing fees (around 6%). The NLTF funds road improvements and maintenance, road safety, public transport, walking and cycling. Local authorities also contribute just under half of the total cost of improving and maintaining local roads and public transport.
Source: Adapted from ITF (2018).
Table 9. Implementation of Road Asset Management systems
Kazakhstan Kyrgyzstan Mongolia Tajikistan Uzbekistan
RAMS status Pilot Pilot Pilot Pilot Pilot
Data collection Starting Starting Annual Starting Starting
Influence planning No No No No No
Dedicated funding for maintenance
No No Yes No No
Source: Adapted from CAREC (2018).
Invest where impact is maximal
The region has conflicting needs in terms of infrastructure, and this makes it difficult to set investment priorities. The demand for infrastructure is high around growth poles, near large mining areas and on international transport corridors, while at the same time most remote areas are poorly connected. Road freight is playing an increasingly important role in the region, but rail freight has to be developed to serve transit between China and Europe. In such a context, it is important to ensure that investments are carefully chosen to maximise their impacts and are consistent with policy objectives in terms of industrial and territorial development.
Today this is not necessarily the case. Between 2007 and 2010, 70% of Mongolian road investments were targeted at lagging regions, while growth poles represent over two-thirds of the population and are fuelling national economic growth. This is not to say that connecting rural areas is not a valid policy objective, but there might be more efficient ways of achieving it. A World Bank (2013) report pointed out that low-cost improvements in rural transport connectivity are feasible given that Mongolia’s terrain allows for relatively good driving conditions on gravel roads. Currently this unpaved network is
BENCHMARKING NATIONAL FREIGHT SYSTEMS
76 ENHANCING CONNECTIVITY AND FREIGHT IN CENTRAL ASIA © OECD/ITF 2019
periodically disrupted due to bad weather conditions, but it could be made all-weather through a focused programme of spot improvements, such as new bridges or culverts.
Improving investment decisions would require an appraisal framework for pre-feasibility studies. The OECD countries, and other upper-middle-income countries such as Chile, have fairly sophisticated systems of appraisal in place based on the principles of social cost-benefit analysis. Note that these systems have a level of sophistication that has gradually evolved over time, and which cannot realistically be transplanted to Central Asia given the region’s current level of institutional capacity (see Chapter 4 for recommendations on institutional capacity).
Box 8. Chile’s National Public Investment System (SNIP)
In Chile, all central and regional public bodies willing to undertake an investment project, including but not limited to the transport sector, must apply to the National Public Investment System (SNIP) for funding. This system plays a major role in the social appraisal of publicly funded projects and programmes. The Planning Ministry (Mideplan) applies a system of checks aimed to verify, first, the formal admissibility of the project and, second, its contribution to a positive welfare change.
A key feature of the project appraisal procedure is the institutional separation between the entity promoting the project and Mideplan, the institution in charge of taking the funding decision, as well as of both ex-ante and ex-post project evaluations. This institution is responsible for regulating the procedures for appraising projects that seek public funding, developing and managing an information system for investment initiatives, developing project preparation and appraisal methodologies and training public officials. Project appraisal is carried out according to a multistage assessment, with different filters depending on the phase of the project implementation as well as the complexity of the project. Finally, a strong emphasis is put on standardisation of criteria and formats for the information presented, facilitating project comparison and ranking. The methodology, standards and norms are widely disseminated and systematically taught to public officials at all levels of government, which has contributed to an appraisal culture permeating the Chilean public sector.
Source: Gómez-Lobo (2012).
Transport services and logistics in Central Asia
There is more to transport than just physical infrastructure. The quality of transport and logistics services is essential to provide fast and competitive shipments.
High logistics costs have a negative impact on regional economic development
Central Asian countries rank low on the LPI’s logistics indicator, which measures the quality of logistics services such as trucking, forwarding, and customs brokerage. In 2018, countries of the region ranked between 90th (Kazakhstan) and 140th (Mongolia) out of 160 countries. This is only partly explained by the lower economic development in the region compared with the rest of the world. Compared to their peers, Central Asian countries have an average performance, but there is clearly room for improvement. Among the lower-middle-income countries, some emerging economies perform much better, such as Vietnam (34th with a score of 3.39) and Côte d’Ivoire (37th with a score of 3.22). The LPI’s top performers have usually implemented ambitious policies targeting the logistics sector and created
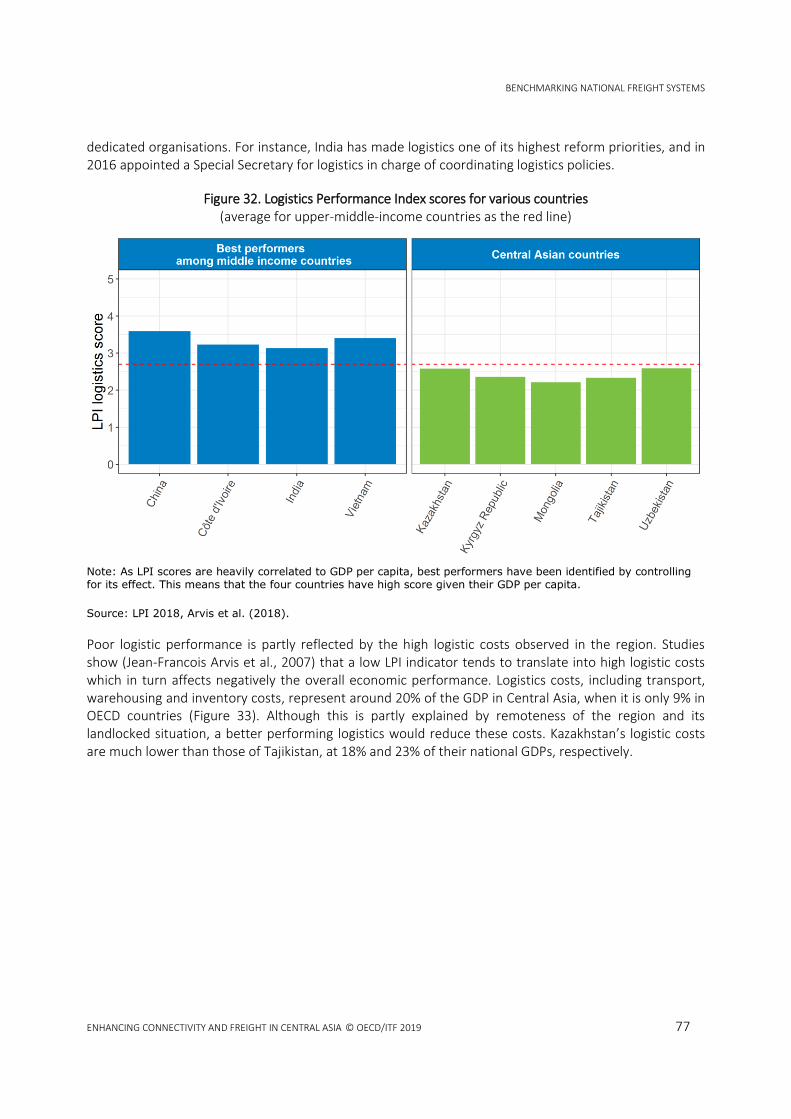
BENCHMARKING NATIONAL FREIGHT SYSTEMS
ENHANCING CONNECTIVITY AND FREIGHT IN CENTRAL ASIA © OECD/ITF 2019 77
dedicated organisations. For instance, India has made logistics one of its highest reform priorities, and in 2016 appointed a Special Secretary for logistics in charge of coordinating logistics policies.
Figure 32. Logistics Performance Index scores for various countries (average for upper-middle-income countries as the red line)
Note: As LPI scores are heavily correlated to GDP per capita, best performers have been identified by controlling for its effect. This means that the four countries have high score given their GDP per capita.
Source: LPI 2018, Arvis et al. (2018).
Poor logistic performance is partly reflected by the high logistic costs observed in the region. Studies show (Jean-Francois Arvis et al., 2007) that a low LPI indicator tends to translate into high logistic costs which in turn affects negatively the overall economic performance. Logistics costs, including transport, warehousing and inventory costs, represent around 20% of the GDP in Central Asia, when it is only 9% in OECD countries (Figure 33). Although this is partly explained by remoteness of the region and its landlocked situation, a better performing logistics would reduce these costs. Kazakhstan’s logistic costs are much lower than those of Tajikistan, at 18% and 23% of their national GDPs, respectively.

BENCHMARKING NATIONAL FREIGHT SYSTEMS
78 ENHANCING CONNECTIVITY AND FREIGHT IN CENTRAL ASIA © OECD/ITF 2019
Figure 33. Logistic costs in selected countries
Source: Adapted from Rantasila and Ojala (2012). These figures should be treated with caution as methods for calculating logistics costs differ.
The productivity of the road freight industry can be improved
Road transport prices are relatively high given the labour costs and the value of the goods carried. Local interviews conducted by ITF staff during field trips reveal that the trucking costs for long-haul services, defined here as over 100 km, are about five cents per tonne-kilometre. This is comparable to costs observed in Western Europe but higher than for Eastern European truck companies.
The cost structure of the industry differs from that of European countries. Figure 34 presents an estimation of the current situation in Central Asia based on local interviews conducted by ITF staff, together with the situation in France and Poland. Central Asia has lower capital costs but higher fuel and maintenance costs, this principally being due to companies working with older vehicles. Even companies operating in international markets typically buy second-hand trucks in Europe at the end of the initial three-year leasing period (250 000–300 000 km) and use them for three to six years. Many trucks operated by domestic companies are much older (10–15 years). Their high fuel consumption is due to usage, age, and vehicle fleet condition. Local sources report that fuel consumption can rise to 50 litres per 100 km, as opposed to 20 to 30 litres in normal operational conditions. Maintenance costs are high due to vehicle age, road conditions, and overloading. Tire usage can be up to three times higher than in the EU. Finally, labour costs appear surprisingly high; this is explained by low productivity due to low speeds and empty runs.
0
5
10
15
20
25
30
Arg
entin
a (2
004)
Bra
zil (
2004
)
Taj
ikis
tan
Col
ombi
a (2
004)
Mor
occo
(20
05)
Mex
ico
(200
4)
Kyr
gyz
Rep
ublic
Tha
iland
(20
08)
Kaz
akhs
tan
Chi
na (
2007
)
Chi
le (
2004
)
Chi
na (
2009
)
Nor
way
(20
07)
Bal
tic r
egio
n (2
006)
Sou
th-A
fric
a (2
010)
Kor
ea (
2007
)
Fin
land
(20
09)
Sw
eden
(20
05)
US
A (
2004
)
OE
CD
(20
04)
Japa
n (2
007)
Uni
ted
Sta
tes
(201
0)
Uni
ted
Sta
tes
(200
8)
Net
herla
nds
(200
8)
Eur
ope
(200
7)
Sw
itzer
land
(20
09)
Eur
ope
(200
8)
% o
f G
DP
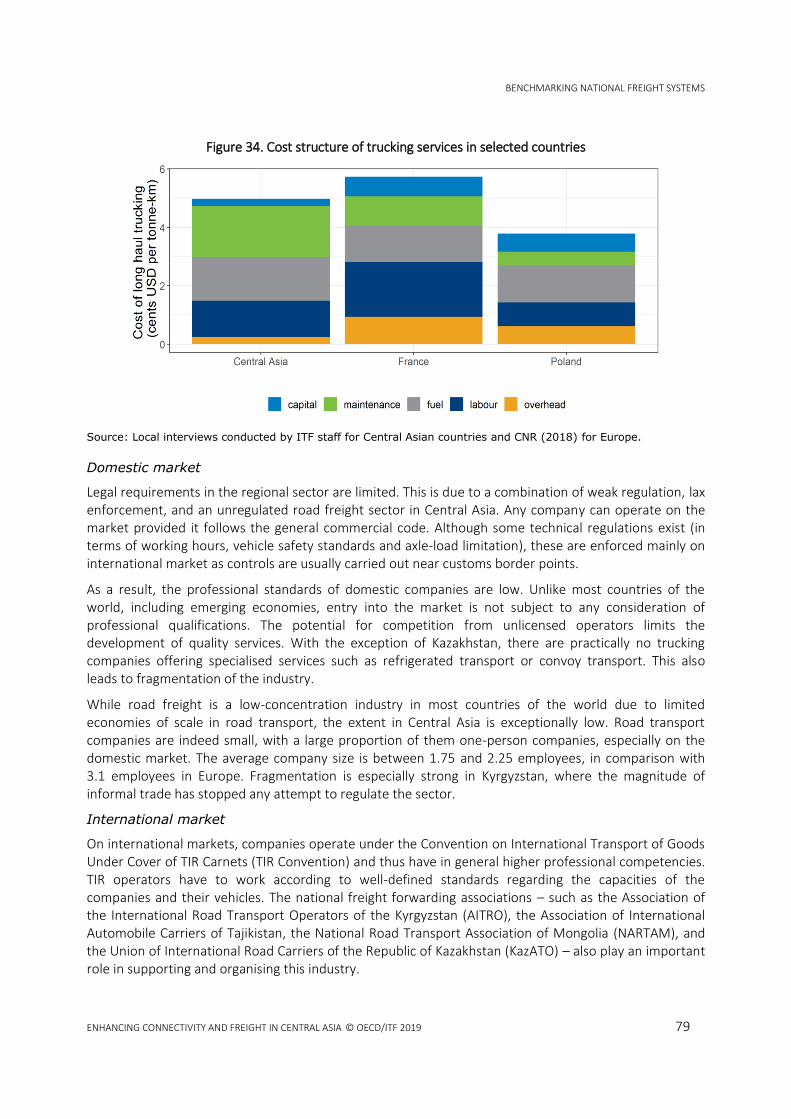
BENCHMARKING NATIONAL FREIGHT SYSTEMS
ENHANCING CONNECTIVITY AND FREIGHT IN CENTRAL ASIA © OECD/ITF 2019 79
Figure 34. Cost structure of trucking services in selected countries
Source: Local interviews conducted by ITF staff for Central Asian countries and CNR (2018) for Europe.
Domestic market
Legal requirements in the regional sector are limited. This is due to a combination of weak regulation, lax enforcement, and an unregulated road freight sector in Central Asia. Any company can operate on the market provided it follows the general commercial code. Although some technical regulations exist (in terms of working hours, vehicle safety standards and axle-load limitation), these are enforced mainly on international market as controls are usually carried out near customs border points.
As a result, the professional standards of domestic companies are low. Unlike most countries of the world, including emerging economies, entry into the market is not subject to any consideration of professional qualifications. The potential for competition from unlicensed operators limits the development of quality services. With the exception of Kazakhstan, there are practically no trucking companies offering specialised services such as refrigerated transport or convoy transport. This also leads to fragmentation of the industry.
While road freight is a low-concentration industry in most countries of the world due to limited economies of scale in road transport, the extent in Central Asia is exceptionally low. Road transport companies are indeed small, with a large proportion of them one-person companies, especially on the domestic market. The average company size is between 1.75 and 2.25 employees, in comparison with 3.1 employees in Europe. Fragmentation is especially strong in Kyrgyzstan, where the magnitude of informal trade has stopped any attempt to regulate the sector.
International market
On international markets, companies operate under the Convention on International Transport of Goods Under Cover of TIR Carnets (TIR Convention) and thus have in general higher professional competencies. TIR operators have to work according to well-defined standards regarding the capacities of the companies and their vehicles. The national freight forwarding associations – such as the Association of the International Road Transport Operators of the Kyrgyzstan (AITRO), the Association of International Automobile Carriers of Tajikistan, the National Road Transport Association of Mongolia (NARTAM), and the Union of International Road Carriers of the Republic of Kazakhstan (KazATO) – also play an important role in supporting and organising this industry.

BENCHMARKING NATIONAL FREIGHT SYSTEMS
80 ENHANCING CONNECTIVITY AND FREIGHT IN CENTRAL ASIA © OECD/ITF 2019
There are potential productivity gains in the railways
Railways in the region have been operating under enormous challenges, and in that context they are performing rather well. The network was designed with the needs of the former Soviet Union in mind, so the current borders were ignored. There are several cases where important domestic rail lines have to cross borders: from northern to southern Tajikistan, through Uzbekistan; between several regions of northern Kazakhstan though Russia; between Northern and Southern Kyrgyzstan through Uzbekistan and Kazakhstan. After the collapse of the Soviet Union, companies were re-built from the Soviet Railways. In the case of the Kyrgyzstan and of Tajikistan this was partly done from scratch as they were left with only branches of Soviet companies. The newly created railways have responded to the transition period by reducing costs, reforming pricing policies and creating marketing departments.
However, there are some signs of potential productivity gains. To illustrate this, Figure 35 and Figure 36 present key indicators illustrating the performance of Central Asian railways compared to selected countries in the world. The results need to be treated with caution, however. The railways business is not a simple one and the comparison of different cases is not straightforward. Railways come in all shapes and sizes: vertically integrated, vertically separated, public and private, passenger- or freight-dominated or mixed, supported by subsidies or fully self-reliant. Proper railway benchmarking requires a set of key performance indicators (KPIs) based on data that are much more advanced than what is currently available in Central Asian countries.
Still, the results suggest that railway assets could be better used: Central Asian countries have reasonable track utilisation but could improve the use of their rolling stock. Given the capital-intensive nature of this industry, with high fixed maintenance and depreciation of costs, efficient asset utilisation is indeed essential. As depicted in Figure 35, Central Asian countries have an average track utilisation level (here measured by the ratio between train-km and the length of the network) comparable to other sparsely populated countries such as Australia. In Kazakhstan it is even relatively high. However, train utilisation – that is, the average load of a train – is low compared to what is observed in other emerging economies. This suggests that better management of train operations might be needed. Note that although European countries have lower train loads, this is mainly the consequence of subsidised train services.
Labour productivity is also low. Given the size of their network and the traffic they are dealing with, the workforce of the regional railways is too large (Figure 36). It is expected that medium-income countries have more labour-intensive industries, but the productivity gap remains high when comparing to emerging economies such India. Furthermore, Chinese railways are known to suffer from inefficient personnel allocations (Beck et al., 2013).

BENCHMARKING NATIONAL FREIGHT SYSTEMS
ENHANCING CONNECTIVITY AND FREIGHT IN CENTRAL ASIA © OECD/ITF 2019 81
Figure 35. Railway asset utilisations in selected countries
Source: UIC data, latest year available.
Figure 36. Staff productivity in selected countries
Source: UIC data, latest year available.

BENCHMARKING NATIONAL FREIGHT SYSTEMS
82 ENHANCING CONNECTIVITY AND FREIGHT IN CENTRAL ASIA © OECD/ITF 2019
The region’s railways operate with overaged rolling stock, lack modern information technology systems, and still have to improve their commercial capacities. However, there are levers available to enhance railway productivity in Central Asia:
Railway companies are starting to renew their rolling stock, much of which is obsolete. Local interviews have revealed that many delays are due to unreliable equipment.
Many studies have documented the importance of information technology in efforts to improve railway operations. Recent innovations include: on-board locomotive computers to minimise fuel consumption and wear; railway infrastructure monitoring by drones; and better information sharing capabilities. As Central Asian railways have not yet started their digital transformation, they should move in this direction.
Shippers have difficulties in conducting commercial transactions, especially for international shipments (CAREC, 2014). Such arrangements require dealing with multiple railways, balancing freight-wagon and container flows, and arranging last-mile deliveries. It would be beneficial for Central Asian railways to offer integrated freight-forwarding and logistics services across the region.
Recommendation to move to intermodal transport: consolidating logistics
terminals
Historically, railways in Central Asia have been developed to support block-train and single-wagon operations. Practically, this means they are organised around a significant number of terminals – which, in turn, are connected to warehouses within the urban railway network. Moving a single wagon typically requires a long series of logistics operations. The wagon is first loaded at a warehouse connected to the railways. It is then sent to the main terminal of its city to be consolidated into a freight train. It might then go through successive marshalling before reaching the terminal of destination. Finally, it is marshalled to the warehouse of destination. This type of organisation implies a large number of both terminals and marshalling yards, resulting in significant costs and potentially significant delays. It is particularly unsuited for container traffic.
Modern railways increasingly rely on intermodal container transport. Railways are organised around a limited number of large intermodal terminals where containers are moved between trains and trucks using large handling equipment, typically cranes. Train services are usually scheduled and use a small number of stops for loading and unloading. In Western Europe, intermodal freight is a rapidly growing market, unlike block trains and single-wagon services.
Implementing efficient intermodal transport would require concentrating loading/unloading operations at a limited number of logistic terminals. Kazakhstan alone has about 30 container terminals, all handling a small number of containers. About ten terminals are in the Almaty area alone, the biggest handling a volume of about 30 000 twenty-foot equivalent units (TEUs) per year, or about a train a day. This is low given the cost of handling equipment. Modern installations typically require 100 000 TEU to operate efficiently. Moreover, the successive marshalling of wagons to build a full train is a source of costs and delays.
Consolidation would allow greater economy of scale, but this does not mean that low-traffic lines are bound to be closed. Such an organisation implies a focus on the core railway network, while local, low-profit lines are closed. On the one hand, this improves the profitability of railways and allows them to offer competitive services. On the other hand, this limits the railways’ geographic coverage, which might be harmful for local economic systems. Most OECD countries have been facing this challenge. One well-
BENCHMARKING NATIONAL FREIGHT SYSTEMS
ENHANCING CONNECTIVITY AND FREIGHT IN CENTRAL ASIA © OECD/ITF 2019 83
established best practice is to authorise the creation of “shortliners”. Shortline railroad companies are small companies that operate local networks, possibly under the supervision of the local authorities, and that act as feeders of the truck network. Because of their small size, they tend to be more flexible than national operators and are aware of local companies’ needs. In the USA, Canada and Germany, shortliners represents one-fourth of total activities. Other European countries, such as France, are moving forward in that direction (Box 9).
Box 9. Supporting the creation of shortliners in France: Les opérateurs ferroviaires de proximité
In 2005, the French government launched an important reorganisation of the freight activity of its national railway operator, SNCF. It was pursuing higher productivity and economic efficiency through higher volumes and decided to stop any form of cross-subsidisation between lines. A strong reduction of SNCF single-wagon activity was decided as it was in heavy deficit. This created much discontent among small rail shippers, for which connection to railways was essential.
It was subsequently decided to facilitate the development of local freight operators – opérateurs ferroviaires de proximité (OFP) – that would work in tandem with long-haul companies. Regulation was adapted to allow for the creation of OFP operation with a sufficient degrees of freedom. While the national network remains a state monopoly, OFP are allowed to operate their own networks following safety rules adapted to low-traffic sections, which gives them more flexibility. Support and training are provided by the national state, while several local authorities offer financial aid.
After 10 years of experiments, there are 15 OFP in operation, most operating in very specific markets. Four connect medium-to-large ports to core networks. Some have specialised in serving low-density areas with strong agricultural sectors, while others connect major industrial clusters to the main network. They have managed to form sustainable businesses where the private and public national operators had failed. The key to their success is that they offer service packages tailored to local companies’ needs.
Source: Adapted from Direction générale des infrastructures, des transports et de la mer (2006).
The logistics sector is still at an early stage of development
There is more to logistics than just transporting goods. More-complex logistic services include freight forwarding, which involves the coordination of multiple carriers to move goods in an optimal manner. In Central Asia, an important component is also the provision of assistance in the process of customs documentation (customs broking). In OECD countries, a large part of logistics is now outsourced to third-party logistics (3PL) providers. 3PLs provide more-sophisticated logistic services such as warehousing, conditioning and inventory management. 3PLs allow small and medium-sized enterprises to insert themselves into the global value chain by managing their supply chains.
The results of surveys carried out as part of the LPI suggests that the quality of logistics services is low compared to other middle-income countries (Table 10). Despite the shortcomings presented previously, local professionals are more satisfied with their local trucking and railways services than their peers in middle-income countries. This is not the case for warehousing, freight forwarding, custom broking and services.
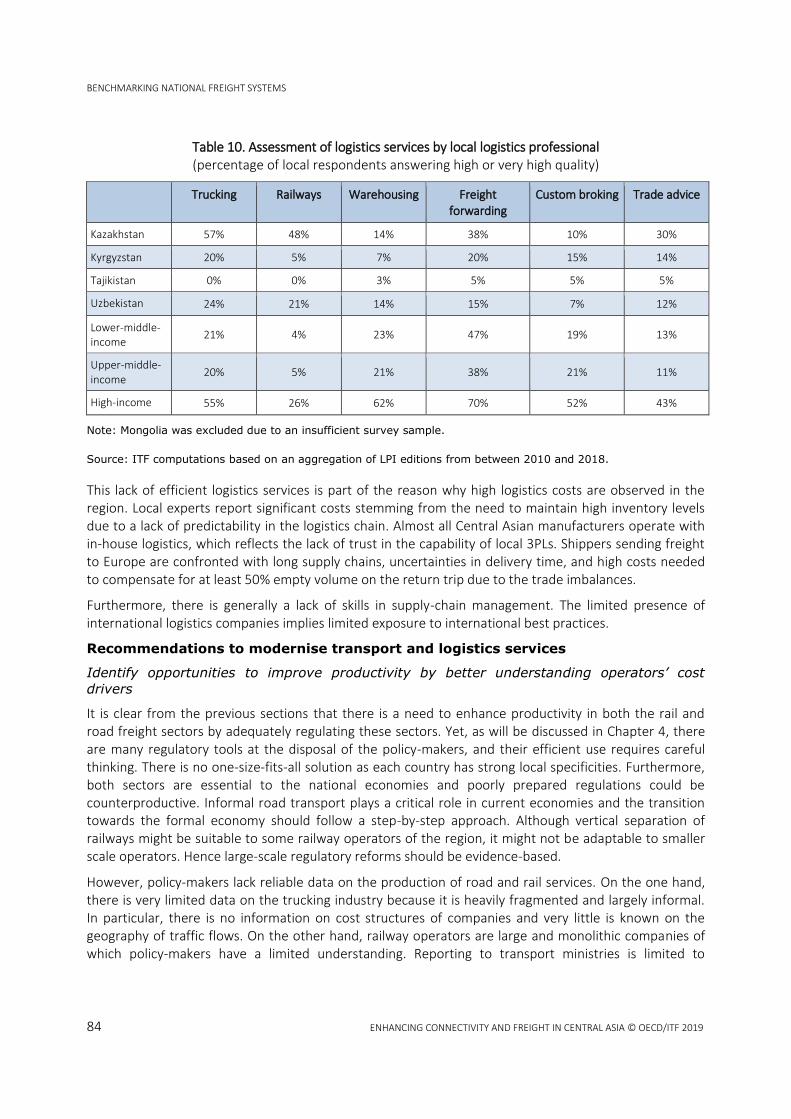
BENCHMARKING NATIONAL FREIGHT SYSTEMS
84 ENHANCING CONNECTIVITY AND FREIGHT IN CENTRAL ASIA © OECD/ITF 2019
Table 10. Assessment of logistics services by local logistics professional (percentage of local respondents answering high or very high quality)
Trucking Railways Warehousing Freight forwarding
Custom broking Trade advice
Kazakhstan 57% 48% 14% 38% 10% 30%
Kyrgyzstan 20% 5% 7% 20% 15% 14%
Tajikistan 0% 0% 3% 5% 5% 5%
Uzbekistan 24% 21% 14% 15% 7% 12%
Lower-middle-income
21% 4% 23% 47% 19% 13%
Upper-middle-income
20% 5% 21% 38% 21% 11%
High-income 55% 26% 62% 70% 52% 43%
Note: Mongolia was excluded due to an insufficient survey sample.
Source: ITF computations based on an aggregation of LPI editions from between 2010 and 2018.
This lack of efficient logistics services is part of the reason why high logistics costs are observed in the region. Local experts report significant costs stemming from the need to maintain high inventory levels due to a lack of predictability in the logistics chain. Almost all Central Asian manufacturers operate with in-house logistics, which reflects the lack of trust in the capability of local 3PLs. Shippers sending freight to Europe are confronted with long supply chains, uncertainties in delivery time, and high costs needed to compensate for at least 50% empty volume on the return trip due to the trade imbalances.
Furthermore, there is generally a lack of skills in supply-chain management. The limited presence of international logistics companies implies limited exposure to international best practices.
Recommendations to modernise transport and logistics services
Identify opportunities to improve productivity by better understanding operators’ cost
drivers
It is clear from the previous sections that there is a need to enhance productivity in both the rail and road freight sectors by adequately regulating these sectors. Yet, as will be discussed in Chapter 4, there are many regulatory tools at the disposal of the policy-makers, and their efficient use requires careful thinking. There is no one-size-fits-all solution as each country has strong local specificities. Furthermore, both sectors are essential to the national economies and poorly prepared regulations could be counterproductive. Informal road transport plays a critical role in current economies and the transition towards the formal economy should follow a step-by-step approach. Although vertical separation of railways might be suitable to some railway operators of the region, it might not be adaptable to smaller scale operators. Hence large-scale regulatory reforms should be evidence-based.
However, policy-makers lack reliable data on the production of road and rail services. On the one hand, there is very limited data on the trucking industry because it is heavily fragmented and largely informal. In particular, there is no information on cost structures of companies and very little is known on the geography of traffic flows. On the other hand, railway operators are large and monolithic companies of which policy-makers have a limited understanding. Reporting to transport ministries is limited to

BENCHMARKING NATIONAL FREIGHT SYSTEMS
ENHANCING CONNECTIVITY AND FREIGHT IN CENTRAL ASIA © OECD/ITF 2019 85
aggregated figures, and the practice of cross-subsidisation makes it difficult to assess the competitiveness of specific lines.
Chapter 4 presents various options available to decision-makers to improve existing knowledge regarding the transport sector, including in particular the implementation of transport and logistics observatories.
Support the creation of a modern logistics sector
As mentioned earlier, the logistics sector is particularly undeveloped in Central Asia. Logistics skills are scarce and most companies manage their logistics in-house using basic approaches. Policy-makers need to foster the development of the logistics sector. This would typically require:
Incentives to support professional training and higher education in areas of logistics andtransport. The most immediate requirement for skill development is at the technical and middle-management levels (see Box 17 in Chapter 4 for an example of the Dutch Institute for AdvancedLogistics, or Dinalog).
The involvement of the private sector in the design of national logistics policies. The chambers ofcommerce and industry as well as industry associations could take active roles in thedevelopment of the sector and the improvement of service quality.
Facilitating the integration of the local industry with global logistics. For instance, Rastogi andArvis (2014) note that freight forwarders typically operate under contracts with the railways, forwhich they act like agents; thus they have very limited connection to international logisticscompanies. Redefining the role of freight forwarders with respect to railway companies wouldease their integration within global logistics. Furthermore, barriers to market entry could bereduced to attract leading international firms specialised in logistics.
Customs policies in Central Asia
Given the economic geography of the region, the efficiency of Central Asian customs is essential. The population and agricultural heartland of Central Asia is split between Kyrgyzstan, Uzbekistan and Tajikistan. Some cities have tight economic connections despite being on different sides of the border. ADB (2014) shows that Bishkek and Almaty work as twin cities and that their economies are complementary in many respects. For instance, there are significant flows of people going from one city to another for medical care. Almaty specialises in sophisticated capital-intensive services (e.g. radiology), while Bishkek offers affordable alternatives for some specialities (e.g. dental care).
Yet border management has a difficult history in Central Asia. At the beginning of the 21st century, a number of disputes were hampering cross-border cooperation, and the customs services of the Central Asian republics still followed processes inherited from the Soviet era that did not encouraging cross-border trade. Until recently, import quotas, licensing, complex administrative procedures and over-specified sanitary norms were common.
Significant measures have been taken over recent years
Areas of improvement in customs and border management have been identified for many years. For nearly two decades, Central Asian countries have benefited from a number of international programmes designed to reform the region’s border control practices. Since 2003, the Border Management Program for Central Asia (BOMCA), funded by the European Union and implemented by United Nations

BENCHMARKING NATIONAL FREIGHT SYSTEMS
86 ENHANCING CONNECTIVITY AND FREIGHT IN CENTRAL ASIA © OECD/ITF 2019
Development Program (UNDP), has trained border guards and provided technology and infrastructure at border crossings. Numerous reports have analysed the situation and made recommendations.
The main recommendations involve coordination between the different government agencies, the reduction of red tape and the migration to a paperless environment (UNESCE, 2014). The lack of coordination between border agencies is frequently mentioned. Rastogi and Arvis (2014) recommended the interconnection of the transit information systems in the regional countries. Making information on exporters from other countries available would facilitate the detection of fraud and smuggling. Finally, restrictive policies on transit should be denounced.
The Central Asian countries have actively implemented at least part of those recommendations. Rastogi and Arvis (2014) report that between 2008 and 2014 Kazakhstan’s custom agency reduced the duration of inspections by 90%. Uzbekistan has largely alleviated its restrictive policies towards transit. All the countries are moving towards single submission points for all required documentation by implementing single-window systems, and they are increasingly offering the possibility of declaring customs declaration online.
Border crossing times are still long and highly unpredictable
From the transport perspective, border crossing times and costs are the main indicators of successful custom policies. Their careful monitoring is essential. In this regard, the region benefits from a valuable tool, Corridor Performance Measurement and Monitoring (CPMM), which is conducted on a yearly basis by CAREC (ADB, 2014). CPMM is based on a survey of international shipments carried by road or rail. Each year a sample of over 2 500 shipments is collected with relevant information on travel time and on border crossing time and costs.
Figure 37 presents CPMM data for selected border crossing points and yields several insights. First, border crossing times vary widely depending on location. On the Chinese side of Irkeshtam, it takes up to 19 hours to cross the border towards Kyrgyzstan. It is barely one hour in Khayagt, on the border between Russia and Mongolia.
Second, the dynamics in time are also extremely variable. Travel times have decreased in Khorgos, subsequent to significant investments such as the construction of warehouses and separate vehicle inspection zones to facilitate border crossing. They have increased sharply, however, in Shirkhan Bandar (Afghanistan), as Tajik customs agencies increased their inspections due to a suspicion of increased narcotics smuggling. In 2016, the Shirkhan Bandar–Nizhni Pianj crossing could take as long as 60 hours.
Finally, waiting in the queue is the most import cause of delay at borders. The border crossing points of the region seem to have difficulties in handling the increasing traffic.

Figure 37. Crossing times for road freight at selected borders
Source: ITF estimates based on CPMM data.
BEN
CH
MA
RK
ING
NA
TION
AL FR
EIGH
T SYSTEMS
ENHANCING CONNECTIVITY AND FREIGHT IN CENTRAL ASIA © OECD/ITF 2019 85 ENHANCING CONNECTIVITY AND FREIGHT IN CENTRAL ASIA © OECD/ITF 2019 85 EN
HA
NC
ING
CO
NN
ECTIV
ITY AN
D FR
EIGH
T IN C
ENTR
AL A
SIA © O
ECD
/ITF 20
19
87

BENCHMARKING NATIONAL FREIGHT SYSTEMS
88 ENHANCING CONNECTIVITY AND FREIGHT IN CENTRAL ASIA © OECD/ITF 2019
On average, border crossing time has increased for road freight. Figure 38 presents the average border crossing costs and times along CAREC corridors. It shows that crossing time is increasing. A detailed analysis reveals that this is due to a limited number of border points, in particular those between Pakistan and Afghanistan and between Afghanistan and Tajikistan. Moreover, the variability of border crossing times is increasing. This is of particular importance as shippers tend to value consistency in crossing times more than the overall travel time (OECD/ITF, 2009). Indeed, high transport time variability usually complicates greatly inventory management.
Figure 38. Border crossing costs (top) and times (bottom) along CAREC corridors
Source: ITF estimations based on CPMM data
By contrast, border crossing costs have decreased. Costs include the various official payments, the potential unofficial payments, and the price charged by the transporter to the shipper for the immobilisation of the driver and the truck. When expressed in US dollars, costs tend to decrease, although this is partly due to the devaluation of local currencies.
Border crossing times are even higher for rail transport, but the situation has improved in recent years. In 2016, it took 26 hours for a train to go through a border along CAREC corridors. The major delays are caused by technical issues rather than inspections: marshalling of wagons, queueing at loading terminals while waiting to be loaded and unloaded or waiting for high-priority trains to pass. The change of gauge from China to Central Asia is also an important source of time loss: it takes around five hours in Dostyk. One of the main problems is the unavailability of wagons, which accounts for up to one-third of the delay. This problem is well known and results from an imbalanced trade structure between Central Asia

BENCHMARKING NATIONAL FREIGHT SYSTEMS
ENHANCING CONNECTIVITY AND FREIGHT IN CENTRAL ASIA © OECD/ITF 2019 89
and China, as well as from inefficiencies in the management of the wagon fleet. In local interviews, the wagon shortage was reported as especially severe on the Mongolian-Chinese and Kazak-Chinese orders. To deal with this issue, Kazakhstan has authorised private ownership of freight wagons to attract private investment to the sector.
Organisation for Economic Co-operation and Development Trade Facilitation
Indicators reveal four areas of improvements
The performance of Central Asian customs is still far below expectations. The rise in cross-border traffic is such that just maintaining the current level of service is already challenging for customs agencies. It might also be that recent measures are not yet paying off. In some cases, partial implementation might have been counterproductive. For instance, the Kyrgyzstan requires electronic declaration of goods to be received by the customs agency two hours before truck arrival at the border. This facilitates customs clearance within 30 minutes upon arrival of the shipment, provided there are no errors in the documentation. In practice, 70% of the declarations sent by customs brokers do not comply with the two-hour window. Hence, data are manually entered, often causing delays.
For Central Asian governments, this situation can be an opportunity to take stock of where they are and identify areas for action. The OECD’s Trade Facilitation Indicators constitute a framework covering the full spectrum of border procedures. The framework has been applied to 163 countries, including Central Asian countries, with the latest update in 2017 (OECD, 2018). The results of the latest edition show that the region is lagging behind in four main areas and could improve them by implementing well-established best practices. This is illustrated by Figure 39, where the Central Asian countries are benchmarked against South Africa, one of the top performers among middle-income countries. In order to advance, the countries could improve the following aspects:
Automation: Customs agencies do not rely on risk management systems to determine the various levels of risks associated with trade movement. Instead, they rely on 100% physical inspections. In an increasing number of countries, data are gathered and analysed to estimate the high-risk movements that should be controlled.
Procedures: In theory, a system of authorised operators – i.e. regular traders that will receive expedient treatment provided they comply with certain requirements – is implemented by the Central Asian countries. In practice, it is not very developed due to the complexity and length of the procedures.
External co-operation: The importance of data exchange has already been discussed. As the Central Asian countries already have computerised trade systems, protocols for exchange of information could easily be implemented and would help to manage cross-border traffic.
Internal co-operation: Although there are some forms of coordination – e.g. in Kazakhstan, regular meetings are held to improve co-operation – examples are limited. There is neither formalised exchange of data nor coordinated timing established for the physical inspections by the various agencies.

BENCHMARKING NATIONAL FREIGHT SYSTEMS
90 ENHANCING CONNECTIVITY AND FREIGHT IN CENTRAL ASIA © OECD/ITF 2019
Figure 39. Trade Facilitation Indicators for Central Asian countries, benchmarked against South Africa, 2017 (red dotted line)
Source: OECD
Recommendations to improve border crossing: use performance measures to set
objectives for customs agencies
Local interviews revealed that custom agencies’ main concern was the reduction of custom clearance time, while little attention was given to queuing time, phytosanitary inspections and other forms of delay. This means that actions are not necessarily well prioritised to reduce the true costs incurred by traders.
A comprehensive dataset like the CPMM is a valuable tool for assessing the actual efficiency of border procedures. It should be used by policy-makers to monitor the efficiency of border crossing procedures and to set targets for customs agencies in terms of reducing border crossing times and costs while increasing predictability. That said, more-complex KPIs could be built. For instance, by surveying international freight forwarders, the CPMM offers a ready-to-use analytical product that should be further exploited.
To complement this approach, a general benchmark of current border procedures against OECD best practices would help to identify key areas of improvement. ITF experts recommend a more detailed analysis of the Trade Facilitation Indicators in Central Asia to assess which measures would yield the biggest benefits.

BENCHMARKING NATIONAL FREIGHT SYSTEMS
ENHANCING CONNECTIVITY AND FREIGHT IN CENTRAL ASIA © OECD/ITF 2019 91
References
ADB (2016), Managing for Development Results in the Transport Sector of Kazakhstan,
ADB (2014), "Central Asia Regional Economic Cooperation Corridor Performance Measurement and Monitoring: A Forward-Looking Retrospective", , https://doi.org/https://www.adb.org/sites/default/files/publication/148731/carec-cpmm-forward-looking-retrospective.pdf
ADB (2011), Developing Tajikistan’s Transport Sector: Transport Sector Master Plan, , https://doi.org/https://www.adb.org/sites/default/files/publication/28979/transport-taj.pdf
Arvis, J.-F., M. A. Mustra, L. Ojala, B. Shepherd and D. Saslavsky (2007), "Connecting to compete: trade logistics in the global economy-The Logistics performance index and its indicators. World Bank", Washington, DC,
Arvis, J.-F., L. Ojala and C. Wiederer (2018), Connecting to Compete 2018, World Bank Report, World Bank, https://doi.org/10.1596/29971
Beck, A., H. Bente and M. Schilling (2013), "Railway Efficiency", ITF Discussion Paper , Vol. 12
CAREC (2018), Compendium of best practices in road asset management, , https://doi.org/https://www.carecprogram.org/uploads/Compendium-of-Best-Practices-in-RAM.pdf
Gómez-Lobo Echeñique, A. (2012), "The ups and downs of a public transport reform: the case of Transantiago", Serie Documentos de Trabajo,
Gwilliam, K. and A. Kumar (2003), "How Effective Are Second-Generation Road Funds? A Preliminary Appraisal", The World Bank Research Observer, Vol. 18/1, pp. 113–128
Gwilliam, K. and Z. Shalizi (1999), "Road funds, user charges, and taxes", The World Bank Research Observer, Vol. 14/2, pp. 159–186
Hasnain, Z., M. Narmandakh, A. Sacks and M. Hanush (2013), "Mongolia: Improving public investments to meet the challenge of scaling up infrastructure", PREM East Asia and Pacific Report, Vol. 74944
ITF (2015), "Drivers of Logistics Performance. A Case Study of Turkey Corporate Partnership Board Report", ITF Corporate Partnership Board Report, pp. 53
OECD (2017), "Gaps and Governance Standards of Public Infrastructure in Chile", OECD Publishing, , https://doi.org/10.1787/9789264278875-en
OECD/ITF (2009), "Improving reliability on surface transport network", ITF Roundtable. Summary Document.,
PADECO (2014), Road Asset Management System: Final Report. (Asian Development Bank Loan No. 2635-UZB),
PIARC (2019), "Highway Development and Management", , https://www.piarc.org/en/knowledge-base/road-assets-management/HDM-4-Software/ (accessed February 2, 2019)
Rantasila, K. and L. Ojala (2012), "Measurement of national-level logistics costs and performance", International Transport Forum Discussion Paper

BENCHMARKING NATIONAL FREIGHT SYSTEMS
92 ENHANCING CONNECTIVITY AND FREIGHT IN CENTRAL ASIA © OECD/ITF 2019
Rastogi, C. and J.-F. Arvis (2014), The Eurasian Connection Supply-Chain Efficiency along the Modern Silk Route through Central Asia Trade, , https://doi.org/http://documents.worldbank.org/curated/en/730031468030581540/pdf/888910PUB0Box300EPI199120June122014.pdf
UNESCAP (2016), "Asian Highway Database", , https://www.unescap.org/our-work/transport/asian-highway/database (accessed
World Bank (1988), "Road Deterioration in Developing Countries", World Bank Policy Studies,
Yeaple, S. R. and S. S. Golub (2007), "International Productivity Differences, Infrastructure, and Comparative Advantage", Review of International Economics, Vol. 15/2, pp. 223–242, https://doi.org/10.1111/j.1467-9396.2007.00667.x

TRANSPORT PLANNING AND GOVERNANCE FOR BETTER CONNECTIVITY
ENHANCING CONNECTIVITY AND FREIGHT IN CENTRAL ASIA © OECD/ITF 2019 93
4. Transport planning and governance
for better connectivity
Because institutional capacity is at the core of improving connectivity, improving capacity must be central to any strategy to increase the connectivity of Central Asia. It is especially important for the region to improve transport planning and governance given such challenging factors as being landlocked, relatively low GDP and, in some areas, low population density. Because most large infrastructure projects imply an increase in national debt, project assessment and selection should be especially carefully addressed and optimised. In recent years the Central Asian countries have shown significant progress at all levels of transport planning and governance, and have developed and adopted related strategies and policy frameworks at the regional and the national levels, with some room for improvements still remaining. This chapter provides a performance assessment of the policy setting, strategies, and processes, as well as institutional planning and governance, in Kazakhstan, Kyrgyzstan, Mongolia, Tajikistan and Uzbekistan and provides recommendations for further improvements. The chapter focuses on three essential dimensions that contribute to overall transport performance. The first dimension, planning, measures the extent to which an orderly, coherent, consistent and transparent process is in place for developing transport policy and infrastructure. The second, governance and regulation, determines how well transport infrastructure and networks are regulated and operated, with a focus on rail and roads. The final dimension, sustainability, measures progress towards resource efficiency, environmental protection, reduction of health impacts and increased road safety. The chapter includes suggestions for enhancing policies in each of these dimensions, in order to improve transport performance and in turn foster the competitiveness of these economies.
The ITF transport policy and performance assessment framework used for this study relies on a sequence of key steps in policy development and implementation, as well as on a number of key constituencies and best practices for each step (for previous applications of the framework, see for example OECD, 2018a). For the assessment, qualitative indicators were collected during five fact-finding missions to the project countries and from local stakeholders using a questionnaire. The indicators are scored in ascending order on a scale of 0 to 5. On this scale, level 0 is assigned when a specific policy or framework does not exist or is obsolete, while level 5 represents in most cases an ideal scenario. The ideal scenario is rarely attained by ITF member countries and, therefore, provides ambitious targets.
In a comprehensive policy framework (Figure 40) all strategies and the policies have a common structure and rely on a similar sequence of steps to maximise their efficiency in moving towards the set of goals and objectives. The policy framework should state clearly those measurable goals and objectives and they should comply with the national vision. The framework should also contain strategies for achieving the goals and action plans for reaching the objectives. The action plans, in turn, should state what to do, who will perform the actions and what the time frame is.
To ensure ongoing learning and adjustment of the planning process, there needs to be a feedback mechanism built-in, including monitoring, performance evaluation and impact assessment. For the monitoring step, proper data need to be collected and made publicly available to promote transparency and easier integration among stakeholders. The data should contain or allow calculation of indicators in order to verify whether objectives have been met. The impact assessment analyses the effects of the policy framework on social, economic and environmental development. Finally, based on the performance evaluation and the impact assessment results, the policy framework should be revised and
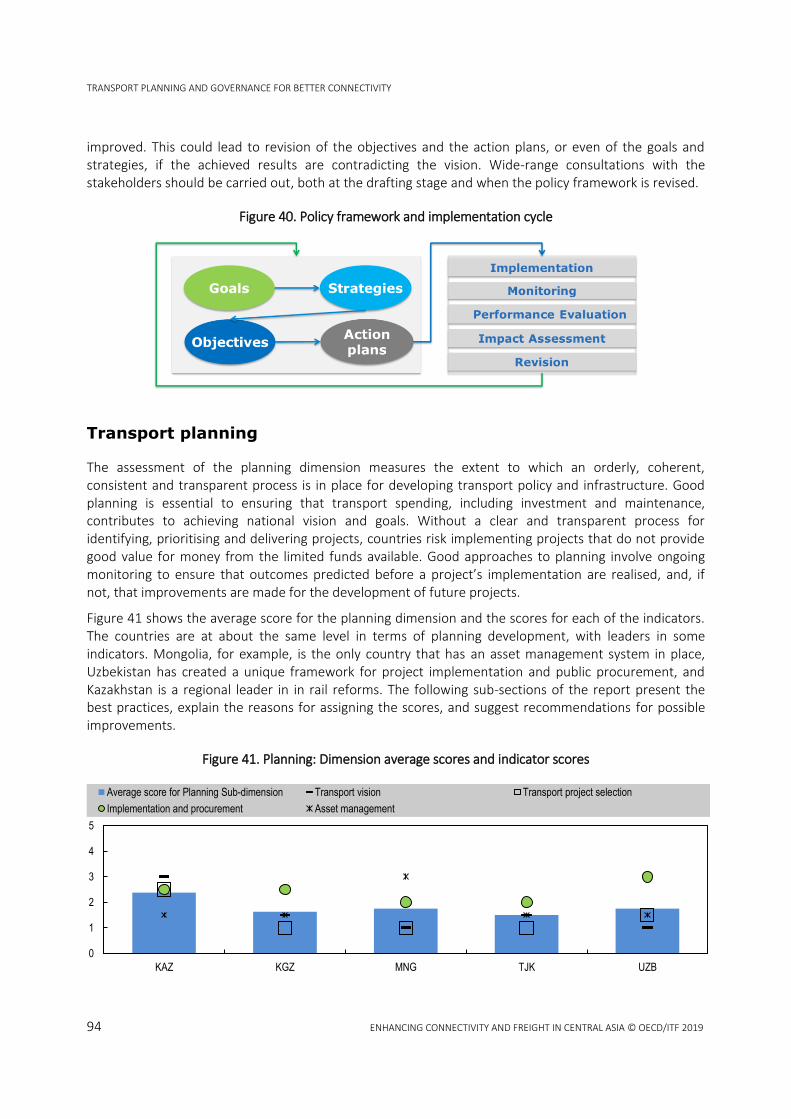
TRANSPORT PLANNING AND GOVERNANCE FOR BETTER CONNECTIVITY
94 ENHANCING CONNECTIVITY AND FREIGHT IN CENTRAL ASIA © OECD/ITF 2019
improved. This could lead to revision of the objectives and the action plans, or even of the goals and strategies, if the achieved results are contradicting the vision. Wide-range consultations with the stakeholders should be carried out, both at the drafting stage and when the policy framework is revised.
Figure 40. Policy framework and implementation cycle
Transport planning
The assessment of the planning dimension measures the extent to which an orderly, coherent, consistent and transparent process is in place for developing transport policy and infrastructure. Good planning is essential to ensuring that transport spending, including investment and maintenance, contributes to achieving national vision and goals. Without a clear and transparent process for identifying, prioritising and delivering projects, countries risk implementing projects that do not provide good value for money from the limited funds available. Good approaches to planning involve ongoing monitoring to ensure that outcomes predicted before a project’s implementation are realised, and, if not, that improvements are made for the development of future projects.
Figure 41 shows the average score for the planning dimension and the scores for each of the indicators. The countries are at about the same level in terms of planning development, with leaders in some indicators. Mongolia, for example, is the only country that has an asset management system in place, Uzbekistan has created a unique framework for project implementation and public procurement, and Kazakhstan is a regional leader in in rail reforms. The following sub-sections of the report present the best practices, explain the reasons for assigning the scores, and suggest recommendations for possible improvements.
Figure 41. Planning: Dimension average scores and indicator scores
0
1
2
3
4
5
KAZ KGZ MNG TJK UZB
Average score for Planning Sub-dimension Transport vision Transport project selection
Implementation and procurement Asset management

TRANSPORT PLANNING AND GOVERNANCE FOR BETTER CONNECTIVITY
ENHANCING CONNECTIVITY AND FREIGHT IN CENTRAL ASIA © OECD/ITF 2019 95
Transport vision and national strategy are essential for transport sector
development
An assessment of transport vision and national strategies will allow each Central Asian country to measure its progress towards a clear and coherent transport planning framework, thus ensuring that the transport strategy is aligned with the national vision. A national transport strategy provides governmental bodies, stakeholders and citizens with information on the government’s goals, plans and guiding principles for the sector in the medium and long term. It also guides policy-makers by defining which goals and objectives to move toward, which concrete actions to take when implementing the strategies, and how to measure progress.
In order to be useful in such ways, a national transport strategy should contain certain fundamental features. Some features apply to any national strategy, while others are specific to the transport sector. To be comprehensive, in general a national strategy should include:
Measurable objectives
Set of principles to guide the actions to reach the objectives
Action plans
Roles and responsibilities
Budgets.
The development and implementation of a national strategy should also follow a policy framework, as described above, including implementation and corresponding data collection, monitoring, performance evaluation, impact assessment and revision via a feedback loop.
In a national transport strategy, special attention should be paid to intermodal interfaces (road-rail, road-port and rail-port) within a network-wide planning approach. A study conducted by Shepherd et al. (2011) using a gravity model showed that by improving multimodal connectivity by 5%, Asian-pacific countries would increase exports by around 4%, or between 2% and 6% per member economy.
National transport strategies in Central Asia
Only Kazakhstan and Tajikistan have a specific transport development strategy. However, some form of a global strategy document defines strategies for the transport sector in a number of other countries (Table 11). In some countries, strategic plans exist for specific modes of transport or areas of development (for instance, there are strategies for developing the railway sector in Kazakhstan, Mongolia and Uzbekistan). However, most of the modal strategies only cover physical infrastructure. Almost all strategies mention multimodal transportation and include plans to develop countries’ transit potential.
Some countries are currently developing a transport strategy. For example, in Mongolia the previous “National Transport Strategy”, which was in place until 2016, has been replaced by a new policy and deployment plan called “Intelligent Transport Systems Development for Mongolia”. The plan will incorporate state-of-the-art ITS concepts and infrastructure over 2017–2037, with technology choices over 2017–2022.
In general, most of the strategies start one after another, sometimes with a break of a few years. Further, most of the countries lack a coherent strategy portfolio, which would include different planning horizons (i.e. long-term global strategy up to 2050 and a more detailed one such as a five-year plan).

TRANSPORT PLANNING AND GOVERNANCE FOR BETTER CONNECTIVITY
96 ENHANCING CONNECTIVITY AND FREIGHT IN CENTRAL ASIA © OECD/ITF 2019
Table 11. National strategies for transportation development
Country Strategy or related document End year
Kazakhstan
State Program for the Development and Integration of the Infrastructure of the Transport System of the Republic of Kazakhstan
2020
The state program of infrastructure development ‘Nurly Zhol’ 2019
Strategy – 2050 2050
State Program “Digital Kazakhstan” 2022
Kyrgyzstan
National strategy for sustainable development 2017
National strategy for sustainable development (project) 2040
Main directions of rail transport development 2020
Main directions of road transport development (project) 2021
Main directions of road sector 2025
Program of development of the civil aviation 2020
Mongolia
National Development Strategy 2021
The Action Plan of the Government of Mongolia 2020
General Plan for Roads 2020
Mongolia Sustainable Development Vision 2030
Strategic Development Plan JSC ‘Ulan Bator Railway’ 2020
State policy on civil aviation 2020
National intelligent transport systems policy and deployment plan (project) 2037
Tajikistan
State task program of the Republic of Tajikistan transport complex development 2025
National development strategy 2030
Strategy and development plan for the transport sector (project) 2050
Uzbekistan
Action strategy on five priority directions of development 2021
Strategy for the development of the national railway operator 2019
Decree 'On measures to improve transport infrastructure and diversify foreign trade routes for cargo transportation’
2022
National Development Strategy 2021
Source: ITF
Figure 41 shows the results for the Transport vision indicator. Kazakhstan and Tajikistan have a dedicated transport strategy and are scored 3 and 1.5, respectively. The other countries in which the transport strategy is under development or is a part of a much broader strategy with no specified measurable objectives receive a score of 1. Almost all transport strategies and mode-specific strategies have missing elements such as related budget, clear roles and responsibilities or guiding principles linked to the strategy. Further, some of the strategies are relatively abstract and lack real, measurable objectives. All countries monitor progress in implementation of the strategy at least once a year, but not all consistently revise the strategies based on the intermediate monitoring results. None of the countries performs an impact assessment of the strategy. Furthermore, none of the countries accounts for uncertainty or has a national transport model to rely on in the planning process.

TRANSPORT PLANNING AND GOVERNANCE FOR BETTER CONNECTIVITY
ENHANCING CONNECTIVITY AND FREIGHT IN CENTRAL ASIA © OECD/ITF 2019 97
National transport related strategies in Kazakhstan
In Kazakhstan the State program of infrastructure development for 2015–2019, "Nurly Zhol", was developed by The Ministry of National Economy of the Republic of Kazakhstan. The goal is ‘to form a single economic market by integrating macro-regions of the country on the basis of building an effective infrastructure hub principle for long-term economic growth in Kazakhstan, as well as the implementation of anti-crisis measures to support specific sectors of the economy in the event of the simultaneous deterioration of external markets’. The program also contains 13 more-specific objectives, one of which is directly related to transport: the establishment of efficient transport-logistics infrastructure based on a ‘ray’ principle. Each objective in the program has a few quantitative indicators defining whether the objective has been met. For freight transport, this includes a 37% decrease in the average travel time between major hub-cities; reaching certain levels of freight flows on the Borzhakty–Ersai railway line and in port Kuryk; and reaching certain capacities on the Almaty–Shu route.
The program begins with an analysis of the situation in 2014, then defines major issues and possible directions of corresponding measures. The program defines the sources and volume of its financing. The amount of planned investments includes around USD 8.97 billion from international institutions and Tenge 241.4 billion (which corresponded to approximately USD 12.5 million in the beginning of 2015) from local business and national development institutions. The program states that the central and local government authorities are responsible for implementation. It relies on population projections until 2020 but no different scenarios are considered. The program does not address multimodality directly; however, the Borzhakty–Ersai railway line project implies a connection of the Caspian port Kuryk with the railway network.
Among completed projects within “Nurly Zhol”, about 2.4 thousand km of roads have been built or reconstructed, a new Zhezkazgan–Beyneu railway line was developed (along with corresponding logistics infrastructure), and the main transport corridor from Western Europe to Western China was launched.
Additionally, in 2014 the Ministry of Investment and Infrastructure Development of the Republic of Kazakhstan set up the State Program for Transport Infrastructure Development 2020, the main goal of which is the establishment of modern transport infrastructure in Kazakhstan, as well as ensuring its integration into the international transport system and unlocking the transit potential. The program contains four main objectives: (i) creating a modern transport and logistics system that ensures high and efficient transport connectivity within the country, an increase in cargo traffic through the territory of Kazakhstan and coordination of all types of land, sea and air transport; (ii) providing villages and small cities with high-quality transport links; (iii) developing local transport infrastructure in the regions; and (iv) ensuring the integration of the transport infrastructure of Kazakhstan into the international transport system. The program sets out four indicators corresponding to the objectives and defines the budget. The latter accounts for the state financing at different levels, own and borrowed funds of the national railway operator Kazakhstan Temir Zholy (KTZ) and Aktau International Sea Trade Port, borrowed funds of national maritime operator Kazmortransflot, as well as funding from public-private partnerships, private investments and fees collected from toll roads.
The program contains sections devoted to each of the transport modes, including rail, road, aviation and sea. For each mode the current situation and challenges are described, the mode specific objectives are set out and several quantitative indicators are suggested to measure whether the objectives have been met. A separate section is dedicated to development of the country’s transport and logistics system and its integration into the international transport system. The measures suggested by the program include not only infrastructure-related ones but also policies, improvements in the logistics sector and in
TRANSPORT PLANNING AND GOVERNANCE FOR BETTER CONNECTIVITY
98 ENHANCING CONNECTIVITY AND FREIGHT IN CENTRAL ASIA © OECD/ITF 2019
technical and legal standards, the establishment of an asset management system, and conceptual changes in financing the transport sector, capacity building, etc.
The program mentions the importance of enhancing multimodal transportation, taking into account the optimal schemes of interaction between involved structures, the distribution of functions and responsibilities, the development of regulations for contractual production and structural relationships between participants including carrier, multimodal transport operator, consignors and consignees. The program suggests that KTZ act as a multimodal operator, interacting with international partners and ensuring the unification of tariffs for all types of transport and the optimisation of costs for freight transit and customs clearance.
The program’s implementation plan is divided into two periods: 2014–2016 and 2017–2020. For the first period, a detailed results assessment was conducted and released to the public (The Ministry of National Economy of Republic of Kazakhstan, 2016). The assessment analyses whether the desired values of the indicators for each objective were achieved. The review shows progress in most dimensions; however, it mentions that there are no planned values for a number of target indicators and some indicators are not broken down by year, which makes it difficult to assess the degree of their achievement. The review also lists reasons why some of the objectives were not achieved. The reasons include external factors such as reduced purchasing power in Central Asia due to devaluation of national currencies, sanctions between Russia and the European Union, and a reduction of transit from Uzbekistan and Tajikistan due to a shift in flows and reduced demand. This shows the importance of setting various future scenarios and conducting an uncertainty analysis, which is currently missing in both programs.
National transport related strategies in Tajikistan
Tajikistan should be acknowledged for an exceptional National Development Strategy (NDS) that is in line with best practices and includes all the essential elements (measurable objectives, guiding principles, action plans, roles and responsibilities, budgets). Most of the NDS’s stated objectives are measurable, such as generating GDP growth of at least three times or the reduction of the export concentration index for the three main products from 83% to 58%. The strategy is based on three principles: preventive measures (reducing the vulnerability of future development), industrialism (increasing the efficiency of using national resources) and innovativeness (development based on innovations in all sectors). The strategy was developed taking into account three scenarios: inertial, industrial, and industrial-innovative. The strategy contains clear action plans for three time periods (until 2020, 2025 and 2030) and defines a monitoring framework. The strategy also clearly defines the roles and responsibilities of the governmental bodies in terms of control, monitoring and data collection. The strategy outlines the total budget and the amounts of forecasted funds for a 15-year period from the private sector, the state budget, and development partner contributions.
The NDS of Tajikistan covers the transportation sector only briefly. The main goals in the transport sector are: the construction and reconstruction of transport infrastructure; the creation of transit transport corridors; the development of the transport sector, aimed at creating new jobs and improving the efficiency of the national sectors of economy and the quality of life; ensuring the efficient operation of transport and transport infrastructure that contributes to the socio-economic development of various regions of the country; preservation and development of a network of local airports, including small and medium-sized aviation to ensure air transport affordability for people of all regions; ensuring the affordability of public transport for people with disabilities; and minimisation of the transportation industry’s negative impact on environment and human health.
A separate strategy dedicated to transport, State Task Program of the Republic of Tajikistan Transport Complex Development until 2025, was first developed in 2007 and is updated every two-three years. It

TRANSPORT PLANNING AND GOVERNANCE FOR BETTER CONNECTIVITY
ENHANCING CONNECTIVITY AND FREIGHT IN CENTRAL ASIA © OECD/ITF 2019 99
includes sections dedicated to the development of public transport, civil aviation, the road and rail network, and multimodal shipments, as well as a program of enhancing environmental sustainability and digitalisation of the transport system. The program is based on four principles: (i) coherence among allocated resources, competence and responsibilities; (ii) efficient use of resources, based on managing market mechanisms; (iii) opportunities for co-financing the projects; and (iv) the leading role of the state in creating the legal, informational and other conditions necessary for transport system development.
The program defines objectives, action plans, and the cost of each action, and defines sources of investment depending on the transport mode. Many infrastructure projects announced in the program have been already implemented (90% for the short-term part), including construction of the road from Dushanbe to the Uzbekistan border, the international terminal ‘Dushanbe Airport’, and the Vahdat–Yavan railway line.
While the program covers the most important topics and many projects have been already implemented, there is a room for potential improvements. The roles and responsibilities of the governmental bodies can be also incorporated into the program, as well as information on the corresponding data collection, monitoring frequency and procedures, and impact assessment. Similarly to the NDS of Tajikistan, objectives, when possible, should have attributed indicators that would help to define if the objectives are met and to what extent. The program should reflect all the transportation related goals stated in the NDS.
Recommendations on national transport strategies
Summing up for all the countries, to move forward in developing their national transport visions, the countries are recommended to ensure that the transport strategy:
Is adopted and contains measurable objectives, guiding principles, action plans, roles and responsibilities and related budgets. The set of measurable objectives allows defining if the goals are achieved and to what extent. For example, an objective related to travel time reduction goal is the decrease of the border crossing time to a certain time by 2020. There are usually various ways to achieve an objective, and the choice of a certain way should rely on the policy principles defined by the government. These principles depend on the willingness of the government to open the market; the degree to which the government is ready to involve the private sector in financing, management and operation, and to subsidise certain actions and projects; commitments to international agreements; vision of the role of transport; etc. Based on the guiding principles, action plans should be defined to state what to do, who will perform the actions and what the time frame is. “What to do” includes institutional measures; planning and investment measures; operational, regulatory and licensing measures; and pricing, cost recovery, taxation and subsidy measures. The roles and responsibilities of the governmental bodies should be defined (stating who will perform the actions), and the budget should be allocated to ensure that the state is capable of following the strategy.
Takes transport systems perspective and reflects the national vision and goals. The system perspective means that the strategy contains not only infrastructure-related plans but also strategies for wider, non-physical infrastructure. Examples of national goals that should be reflected in the transport strategy are improved connectivity and accessibility, economic growth or creating new jobs.
Kyrgyzstan, Mongolia and Uzbekistan are recommended to develop national transport strategies as transportation is an increasingly important sector in Central Asia and deserves its strategic vision to be set out.

TRANSPORT PLANNING AND GOVERNANCE FOR BETTER CONNECTIVITY
100 ENHANCING CONNECTIVITY AND FREIGHT IN CENTRAL ASIA © OECD/ITF 2019
Tajikistan should consider including in their national transport strategy indicators to measure whether objectives have been met and defining explicitly in the program the roles and responsibilities of the governmental bodies responsible for the program implementation. The program should reflect all the transportation-related goals stated in the NDS.
To improve their strategies even further, all five countries should consider:
Developing a national transport model to assess needs. The model should be used as the basis for strategic planning, scheme appraisal and policy evaluation by government bodies, local authorities and researchers. Such a model estimates the demand and matches it with the existing or planned supply, providing estimates of current and future traffic flows. Most choices for freight movement are based on travel time and cost minimisation under some constraints depending on the commodity type, such as storage costs, implications of delays, etc. In the case of regional and international studies, different layers driving the freight movements should be taken into account, with a focus on trade flows, mode and route choice (Ortúzar and Willumsen, 2011).
Supporting multimodal solutions. As suggested in the benchmarking section, the best strategies focus on intermodal interfaces. Road-rail solutions are of the most importance for landlocked countries but, access to foreign ports can also be a solution – in which case the strategy should address road-port and rail-port interfaces. Intermodal connectivity means all the transport modes are working together seamlessly. To achieve this, infrastructure and regulatory bottlenecks should be identified and analysed first. The corresponding policy measures should include either removal of these bottlenecks or handling them. Usually the removal of a bottleneck is a question of sufficient investments in infrastructure, new equipment for facilitating the transfer, and coordination among the supply chain members. Sometimes, however, a removal is not economically feasible and managing the bottleneck through, for example, peak-load pricing could be a more efficient solution. Collaboration of the supply chain members and coordination of their actions with the aim to increase mutual benefits can increase the efficiency of the intermodal solutions and remove or decrease bottlenecks (Prentice, 2003). Collecting and sharing information becomes crucial in this case.
Relying on a network-wide planning approach with horizontal co-ordination across planning bodies. Horizontal governance approaches have been developed in the last two decades in order to connect different parts of the public sector in pursuing of policy goals. Co-ordination can take various forms, such as consultations among departments in a process of decision-making, or agreements mitigating conflicts of competencies. The balanced distribution of financial resources and responsibilities is crucial for successful co-ordination and cooperation across the planning bodies.
Suggesting robust plans for various future scenarios, relying on a rigorously collected data, economic and transport models, and consultations with stakeholders. The main purpose of embracing uncertainty while developing a national strategy is to demonstrate that each suggested decision will move developments towards the national vision, irrespective of how the contextual future unfolds. That is, handling uncertainty is a matter of helping the decision maker to make a decision that is robust in the face of various future states. For this, different scenarios should be defined, and the strategies and planned measures should be tested against them. This is an especially complex task because both the decision maker and exogenous factors can affect the future (Lyons, 2018). Since the strategy deals with the future, to be robust, it should take into account possible uncertainties. Wide-ranging consultations with

TRANSPORT PLANNING AND GOVERNANCE FOR BETTER CONNECTIVITY
ENHANCING CONNECTIVITY AND FREIGHT IN CENTRAL ASIA © OECD/ITF 2019 101
stakeholders should be carried out when possible future scenarios are being defined, at the strategy drafting stage, and when the policy framework is revised. Engagement of as many informed views from different perspectives as possible leads to a better-informed position in decision making (Box 10).
Finally, ensuring that a regular impact assessment of the strategy – and consequent revisions based on the performance evaluation and impact assessment results – is part of all strategies. An impact assessment helps to ensure that a strategy maximises the contribution that it makes to sustainable development along economic, environmental and social dimensions, while minimising potential adverse impacts. The impact assessment process might integrate appraisals of the social, environmental and economic effects of the policy measures.
Box 10. The National Transport Strategy and Strategic Transport Projects Review of Scotland
The National Transport Strategy (NTS) of Scotland in 2006 set out a vision for 2026, with the main goal being to increase sustainable economic growth. The NTS focuses upon five high-level objectives including improved journey times and connections; reduced emissions; and improved quality, accessibility and affordability of transport services. In 2008, the NTS was complemented by the Strategic Transport Projects Review (STPR), which became a major action plan for delivering the NTS. It identified 29 rail and trunk-road investment priorities over the period to 2032.
In 2016 the Scottish government announced a full review of the NTS with the main purpose of providing a vision for Scotland’s transport system for the next 20 years, suggesting ways to achieve it, and providing a base for an update of the STPR. The review (NTS2) aims to be collaborative, engaging and evidence-based. This implies working with key stakeholder organisations through functional and thematic working groups, reaching out to the wider stakeholder community via an online survey and consultation on a draft of NTS2. NTS2 in draft is expected to go out for consultation in early 2019, with the finalised NTS2 expected to be adopted in mid-2019. In December 2016 an early engagement survey was undertaken. A total of 614 responses were submitted, of which 76 were from groups or organisations, including 18 private sector representatives, and 538 from individual members of the public. At that point the programs barely mentioned uncertainty and did not consider various future scenarios.
In June 2018, the UK Department for Transport published a consultation document for its transport appraisal and modelling strategy. The document set out five priorities, one of which is reflecting uncertainty over the future of travel. Responding to this call, Transport Scotland started developing a scenario planning tool and process so as “to be able to consider candidate policies in the face of uncertainty over the future in order to support robust decision making that can set a direction of travel towards achieving the NTS2 outcomes”.
The tool translates combinations of selected values of drivers of change into output measure values, so that the combinations constitute future scenarios. The tool can be used to produce multiple scenarios, and it helps to identify the extent to which policies are likely to achieve the NTS2 targets given the uncertainty faced.
Development of the scenario planning tool and process involves an ongoing interaction between the study team, Transport Scotland and the wider group of NTS review stakeholders. Two familiarisation and brainstorming meetings with stakeholders took place to introduce the concept and one, the key event, to address the input drivers of change and output measures for the scenario planning tool.

TRANSPORT PLANNING AND GOVERNANCE FOR BETTER CONNECTIVITY
102 ENHANCING CONNECTIVITY AND FREIGHT IN CENTRAL ASIA © OECD/ITF 2019
Eight main drivers and thirty four future scenarios were produced; these were then reduced to a manageable set of eight plausible futures representing the uncertainty space against which policies can be tested. The work group is currently developing a tool using a quantitative, elasticities-based model. The tool will allow the team to translate a set of input driver values into a set of output measure values, helping to assess and compare different future states of the world in relation to alignment or not with NTS2. Therefore, the tool will help decision-makers assess each policy’s effectiveness depending on how the future unfolds.
Source: Lyons et al. (2018).
Transport project selection should rely on quantitative models and decision-
making tools, and it should account for risks and uncertainties
Transport project selection is extremely important for the countries as all of them rely, at least partially, on foreign aid. A study published by the Center for Global Development (Hurley et al., 2018) analysed the debt implications of the Belt and Road Initiative from a policy perspective for the participating countries. It determined that several countries can significantly suffer from debt distress, among them Kyrgyzstan, Mongolia and Tajikistan. China is the largest single creditor of Kyrgyzstan and Tajikistan. From 1992 to 2018, Kyrgyzstan received more than USD 9.8 billion in foreign grants and loans. Of this, 24.9% went to transportation projects. The Kyrgyz economy relies heavily on foreign aid, with a significant amount of state debt (4.4 billion USD), of which 85.6% is external. The government expects to spend 28 billion Soms (approx. 400 million USD) on servicing the national debt in 2019, up from the 23.7 billion Soms spent for the purposes in 2018. Tajikistan’s debt to China accounts for almost 80% of the total increase in Tajikistan’s external debt over the 2007-2016 period. Despite this, the country is planning to increase its external debt, both at concessional and non-concessional rates, to pay for infrastructure investments in the energy and transportation sectors, including elements of the BRI. Mongolia is highly dependent on large infrastructure investments in the transport and energy sectors. China is planning to transfer to Mongolia around USD 30 billion in credit for BRI-related projects over the next years, which will increase Mongolia’s debt substantially and might even lead to the country’s default (Hurley et al., 2018). Therefore, the countries should develop their own capacity to evaluate and prioritise projects to be able to choose only the essential ones.
As Figure 41 shows, countries score relatively low on the Transport project selection. Only Kazakhstan and Uzbekistan have a clear methodology for project selection that includes explicitly defined selection criteria. In the case of Kazakhstan, order No. 129 of the Minister of National Economy, December 5, 2014 – “On approving the rules for developing or adjusting, conducting the required examinations of the investment proposal of a state investment project, and planning, analysis, selecting, monitoring and performance evaluation of budget investments and determining the feasibility of budget lending” – provides such a framework. The document provides guidelines on cost and benefits assessment, risk and uncertainty analysis, and organising a discussion with stakeholders. The main criteria are the presence of long-term cargo (the transportation of which will be most advantageous in terms of speed and cost of delivery) and the congestion of existing transport hubs. In Uzbekistan the project selection is regulated by a decree about the national program of development (projects approvals, coupled with the regional development) and criteria for project choice based on priority ranking, compliance with the national and regional development goals, and financial sources.
In Mongolia the project selection process is regulated by Budget Law 28. The National Development Agency assesses infrastructure and development investment projects with a value of more than 30
TRANSPORT PLANNING AND GOVERNANCE FOR BETTER CONNECTIVITY
ENHANCING CONNECTIVITY AND FREIGHT IN CENTRAL ASIA © OECD/ITF 2019 103
billion Mongolian Tugriks. The economic benefits and social significance of each project require approval by the Ministry of Finance. There is no document defining clear standards for project prioritising, sources of funding, procedures, and project assessment criteria.
Box 11. Chile investment and project appraisal system
In Chile, all central and regional public bodies willing to undertake an investment project, including but not limited to the transport sector, must apply to the National Public Investment System (SNIP) for funding. Chile’s system gives a major role to the social appraisal of publicly funded projects and programmes. The Planning Ministry (Mideplan) applies a system of checks aimed to verify, first, the formal admissibility of the project and, second, its contribution to a positive welfare change.
A key feature of the project appraisal procedure is the institutional separation between the entity promoting the project and Mideplan, the institution in charge of taking the funding decision, as well as of both ex-ante and ex-post project evaluation. This institution is responsible for regulating the procedures for appraising projects that seek public funding, developing and managing an information system for investment initiatives, developing project preparation and appraisal methodologies and training public officials. Project appraisal is carried out according to a multistage assessment, with different filters depending on the phase of the project implementation as well as the complexity of the project. Finally, a strong emphasis is put on standardisation of criteria and formats for the information presented, facilitating project comparison and ranking. The methodology, standards and norms are widely disseminated and systematically taught to public officials at all levels of government, which has contributed to an appraisal culture permeating the Chilean public sector.
Source: Gómez-Lobo (2012).
Most of the countries take into account the affordability of transport projects and their budgetary coherence, and pay attention to compliance with the national strategies and vision. Most countries also take into account the use of information and communication technologies, the need for physical and 'soft' infrastructure for each project, and the results of discussions with the stakeholders. Few countries rely for project selection on simple transport models; on long-term forecasts in economics, trade and industrial production; and on public opinion.
Data are collected in different formats by different agencies and are often not publicly available. For example, rail data are usually collected by the national railway operator and can be requested by the coordinating ministry or public authority but often are not openly accessible.
For rail, the countries collect data on railway sector investments and revenues, passenger and freight turnover, and technical characteristics such as network length, maximum speed, electrification, etc. For the road sector, the countries collect data on total turnover, road conditions, public investments in road construction and maintenance, as well as statistics on road accidents. The data on domestic road freight is usually quite poor due to difficulties in its collection, as it would require surveys of shippers, freight forwarders and truck drivers.
With the exception of Kazakhstan, publicly available transport and transport-related data collected in the countries are usually aggregated. Kazakhstan collects and publishes statistical data on transport showing specified shares of import, export, and transit, disaggregated by commodity type. It also has detailed data on international road freight, which include the number of permissions given to foreign companies,

TRANSPORT PLANNING AND GOVERNANCE FOR BETTER CONNECTIVITY
104 ENHANCING CONNECTIVITY AND FREIGHT IN CENTRAL ASIA © OECD/ITF 2019
revenues from cabotage, etc. The rest of the countries do not publish transport data disaggregated by commodity types or by a trade partner. Tajikistan does not publish any data on GDP contributions by each of its administrative regions, while GDP could be used as a proxy for modelling transport generation and attraction. Development partners such as the ADB, the World Bank and GIZ collect data in the region and perform surveys on border crossing, infrastructure quality, trade, etc. However, none of the five countries perform transport surveys with private respondents, shippers, freight forwarders or truck drivers; therefore, the data essential for building a national transport model are not available.
Most of the countries apply cost-effectiveness analyses, but cost-benefit analysis (CBA) and multiple criteria analysis (MCA) are rarely used. The consistent implementation of risk and uncertainty analysis frameworks across different projects is also missing.
Recommendations on project selection
Central Asian countries need to develop their internal capacity to assess and select projects which comply with the national vision and strategies. Key steps in this direction include:
First and foremost, make sure that the project selection framework exists and is transparent, evidence-based and objectives-led. The framework should contain clear selection criteria and minimise the risk of developing inconsistent standards. It is important that transport projects are proposed and assessed consistently, realistically and rigorously to make the best use of the limited funds available. The first step in the process of selecting viable projects is the generation of alternative options to address the problems or needs identified (e.g. physical, non-physical, information and communication technologies). A consistent framework for transport options generation should include a clear methodology for decision-making, such as socio-economic analysis resulting in a cost-benefit analysis (CBA) of each option. Based on this assessment, portfolios of priority projects should be developed. Once the project is implemented, the assessment cycle does not stop – rather, monitoring and evaluation are foreseen to ensure that the expected outcomes are achieved.
Ensure that projects are linked to the overall transport vision and that they fulfil national objectives. In addition to CBAs, indicators for informing decision making are required to reflect the potential benefits of projects in meeting the goals of national policy towards reducing social and regional inequality.
In the longer term, the countries are recommended to:
Collect, update and share regularly data on freight and logistics. For decision making on freight connectivity, data are crucial. Freight data could be classified by mode of travel, commodity type, distance covered and tonne-kilometres transported, jurisdictional and administrative unites crossed, etc. The data may be obtained from direct and indirect sources. The indirect sources are often government entities that deal with trade, tax, and customs. The direct sources of information are the stakeholders involved in freight, and the information can be obtained by surveying them or using automated methods of data collection and information and communications technologies. However, although the indirect data are relatively easy to obtain, they do not provide all the necessary information since they usually miss the domestic freight flows. Vehicle-mounted, GPS-based automatic data, automatic number-plate recognition, and other reporting systems can offer continuous information on shipments. The whole process being automated allows reducing the data collection costs in the long run. The challenge, however, is to build the trust between the government and the data generators so that an automated system of data retrieval can be implemented. Surveys of shippers, freight

TRANSPORT PLANNING AND GOVERNANCE FOR BETTER CONNECTIVITY
ENHANCING CONNECTIVITY AND FREIGHT IN CENTRAL ASIA © OECD/ITF 2019 105
forwarders and drivers can complement the other sources of data, as well as additional information from waybills and other instruments that accompany consignments, if available. Data sharing, at least within government agencies, leads to cost savings as it helps to prevent duplication in data collection efforts (Haider et al., 2008).
Develop and use for project selection mathematical models of freight flows. Freight traffic models are an especially important tool for performing quantitative assessments of transport projects. They model demand and match it with the existing or planned supply, providing estimates of current and future traffic flows.
Apply tools and models supporting decision making for project selection. Tools and models supporting decision making for project selection include: (i) strategic planning tools to assess long-term needs and effects; (ii) carrier and shippers cost and performance analysis tools that estimate the operational performance and costs; (iii) benefit/cost analysis systems; (iv) economic models measuring economic impacts, responsive demographic, and economic changes over time; and (v) financial impact accounting tools assessing financial streams.
Identify, analyse and treat risks and uncertainties. While models provide valuable data that inform the decision-makers, the forecasted values can significantly deviate from the actual ones. Also, transport project outcomes are subject to risks and uncertainties related to overruns; unknown future trade volumes; economic, political and institutional changes; and disruptive technologies that can affect the viability of the projects. Given that the freight transport projects can have significant socio-economic and environmental effects at local, regional and national levels, dealing with uncertainty and risk is especially important and should be an integrated part of the project selection process to support more informed decision-making. ‘Dealing’ means that risk and uncertainties should be identified, analysed and treated. Box 12 presents some risk management tools applied in Europe.
Box 12. Risk management tools applied Europe
Working with its partners, SNCF Réseau, an establishment within the French National Railways Company, has developed tools to support project management. The first tool is a risk matrix. The method calls for identifying the project constraints and their potential impacts on the costs, implementation and global performance of the project over its lifecycle. Risks are weighted depending on their potential impacts and probability. If a risk is unacceptable, it should be (i) reduced by acting on its causes or consequences; (ii) transferred to an insurance company or via a contract; or (iii) covered by a financial provision. Due to a lack of sufficient statistical data the risks are usually identified, assessed and treated based on experts’ opinions. This systemic approach results in a reduction of the overall cost and affects positively completion and quality. This method is used by public and private clients in addition to other kinds of analysis such as outline proposals, impact assessment, public debate, public enquiry, final design, etc. The second tool is a context assessment whereby a territorial analysis is carried in order to better understand the socio-economic context and the players in the sectors concerned by the rail route. This analysis particularly consists in listing the stakeholders and their positions regarding the project. This allows identifying potential risks of controversy around the project, its territorial impacts or risk of delay. The client then tries to optimise its infrastructure project by integrating demands or explaining to residents and other concerned parties why these cannot be taken into account.

TRANSPORT PLANNING AND GOVERNANCE FOR BETTER CONNECTIVITY
106 ENHANCING CONNECTIVITY AND FREIGHT IN CENTRAL ASIA © OECD/ITF 2019
Source: Zembri-Mary (2017).
A few European countries have applied a recently developed ‘reference class forecasting’ method that aims to reduce risks related to human bias, which includes psychological and political-economic factors. A psychological factor manifests itself in an optimism bias, whereby most people judge future events more positively than the actual experience suggests. Political-economic factor, or strategic misrepresentation, is the intentional overestimation of the project’s benefits and underestimation of its costs with the purpose of increasing the probability of the project being approved and funded. The ‘reference class forecasting’ method allows tackling both these factors, as well as any other kind of human bias. The method consists of three steps: (i) identifying a statistically meaningful reference class of past projects similar to the planned one; (ii) establishing a probability distribution for the outcomes of the selected reference class; and (iii) comparing the planned project with the reference class distribution, to identify the most probable outcome of the project. This method requires good empirical data for finding the probability distributions. The method has been successfully applied to several transportation projects including Edinburgh Tram and London’s £15 billion Crossrail project.
Source: Flyvbjerg (2008).
Implementation and procurement requires maximum transparency and efficiency
in engaging the private sector
This indicator measures the rigour of the process for implementing transport projects. A robust process for decision-making in the implementation of transport projects is fundamental to ensure that planned outcomes are met and that public funds are spent efficiently. In the absence of rigorous processes, risks linked to partial implementation of projects, unclear responsibilities across government bodies, corruption and diversion of funds can arise.
The main challenges faced in public procurement are associated with corruption, cost inefficiencies and uncertainties leading to risk of budget overruns, lower quality and project delays.
Although involving private investments in project implementation brings benefits, at the same time it can create new pitfalls. Public-private partnerships (PPPs), which are the most common form of private participation in transport infrastructure projects, can improve cost efficiency but cannot push the government’s long-term borrowing constraints or improve allocative efficiency (that is, to prevent building bridges or roads ‘to nowhere’). PPPs can help solve the problem of financing but not of funding. Therefore, the governments should pursue private investments for cost efficiency only.
There is a need for an adequate competition for bids and also throughout the duration of the contract so that the PPPs deliver value for money. Lack of sufficient competition for major infrastructure projects (not only for PPPs) leads to more costly projects than necessary. Even where there is an adequate competition for bids, bidders still face lack of information to assess risks and, therefore, tend to overestimate risk. Consecutively, investors will ask higher than necessary returns and suppliers will demand more contingencies.
Some of the countries, such as Uzbekistan and Kazakhstan, have established a framework for project implementation and public procurement, while all countries have adopted laws regulating the procurement process. The implementation process is mostly decided at an individual project level.
In all Central Asian countries, tenders are performed through a single public website, which also contains legal and practical information for the bidders. While in some countries all tenders must be performed
TRANSPORT PLANNING AND GOVERNANCE FOR BETTER CONNECTIVITY
ENHANCING CONNECTIVITY AND FREIGHT IN CENTRAL ASIA © OECD/ITF 2019 107
through the official website (e.g. Mongolia), in other countries it does not apply to all tenders (e.g. Tajikistan plans to digitalise all public procurement trades in 2019). In Kyrgyzstan, new clauses were recently added to the law “On Government Procurement” to increase transparency and efficiency. An electronic portal has been created and public procurement classifiers have been developed, including classifiers for transport equipment and other transport-related products such as vehicles and spare parts, locomotives and rolling stock, airplanes, tools, etc. In Mongolia a Provisional Working Group was organised to reduce corruption in public procurement by the Independent Authority against Corruption in Mongolia, an independent government body established to carry out various anti-corruption activities in the country.
Kazakhstan has recently advanced its procurement process to fight corruption and optimise the process. The new law of 2016 on Public Procurement relies on the principles of equality, free competition, non-discrimination and the independence of the supplier vis-à-vis the public buyer. The law contains a section aimed at helping to enhance transparency and procedural fairness. The government also updated the appeal mechanisms for the oversight of the procurement process and introduced a monitoring mechanism to foster integrity. However, state-owned enterprises are often exempted from requirements imposed by the law and can organise purchases according to their own rules (OECD, 2017a).
Tajikistan adopted in 2018 a new law “On Public Procurement” and joined the World Trade Organisation (WTO) Agreement on public procurement. It has also created and maintains a database of companies linked to corruption in the past. Mongolia and Kazakhstan are members of the International Federation of Consulting Engineers, or FIDIC (an international standards organisation best known for the FIDIC family of contract templates). In 2017, Uzbekistan established the National Project Management Agency under the President with the mission of increasing the efficiency and securing the transparency of national and regional programs and investment projects throughout the country, and of managing a single information space for public procurement. The creation of such an agency helps in the harmonisation of the corresponding regulations across the sectors (see Box 13 for more details on the agency).
Some of the countries already have experience in brining private investments via public-private partnerships. For example, Kazakhstan used the PPP format in the construction of a network of traffic cameras in Astana. The PPP agreement was signed between the Akimat of Astana, the local police service and a consortium of Kazakhstani companies. In Mongolia, the Erdenet–Ovoot railway project was started in 2015 as build-operate-transfer concession. Under the PPP concession agreement with the Mongolian government, at least 30% of subcontract work must be carried out by Mongolian companies. In Kyrgyzstan the law on PPP was adopted a few years ago, although it has not yet been applied in the transport sector.
Most of the countries monitor project implementation and conduct ex-post assessment. In Kazakhstan the government checks the effectiveness of the implementation of allocated public funds and provides a detailed report on the results of project implementation every year. These results are used in the implementation of new projects. In Tajikistan the implementation of transport projects is carried out by the centres for the implementation of projects, which are created by a government decision for each project or a group of similar projects. The Ministry of Transport and the centre for the implementation of projects in the field of transport review and finalise the project tasks during the project implementation. For example, in the project of rehabilitation of the Dushanbe-Uzbekistan border pedestrian crossings were not taken into account in some settlements. During the project implementation, the Ministry and the centre made changes in the project increasing pedestrian crossings. The governmental bodies performed similar reviews for the rehabilitation projects of the Dushanbe-Chanak and other roads.

TRANSPORT PLANNING AND GOVERNANCE FOR BETTER CONNECTIVITY
108 ENHANCING CONNECTIVITY AND FREIGHT IN CENTRAL ASIA © OECD/ITF 2019
Recommendations on implementation framework and procurement
To summarise, most countries have an implementation framework for transport projects which considers alternative procurement. To improve this dimension further, the Central Asian countries need to:
Make sure these frameworks are transparent and assign clearly roles and responsibilities. Appeal and monitoring mechanisms should be in place and the number of exceptions should be minimal, aimed at reducing practices when the state-owned enterprises organise purchases according to their own rules.
Harmonise the procurement and implementation frameworks across different transport modes and sectors. The most advanced processes for implementation consider a variety of procurement methods and tailor the choice of procurement based on project characteristics and financial considerations. Rigorous processes to guide these choices have some common guiding principles such as value-for-money, coordination of investment, administrative capacity, and long-term financial sustainability.
To improve the framework on a longer term, the countries are recommended to:
Pursue private investments for cost efficiency. Private finance needs to be pursued on the right merits to avoid political unsustainability of private investment in infrastructure. PPPs, which are the most common form of private participation in transport infrastructure projects, can improve cost efficiency but cannot extend the government’s long-term borrowing constraints or improve allocative efficiency (that is, to prevent building bridges or roads ‘to nowhere’). PPPs can help to solve the problem of financing but not of funding. Therefore, the governments should pursue private investments for cost efficiency only.
Ensure governmental control over the entire term of the PPP contract. Continuous pressure on efficiency and prices is necessary throughout the contract. Even when there is an adequate competition, bidders still lack the information necessary to assess risks and, therefore, tend to overestimate risk. Consecutively, investors will ask for higher-than-necessary returns and suppliers will demand more contingencies unless continuous pressure exists. For example, in the case of sea and air ports, the competitive pressure often comes from other ports or from strong user reactions to changes in service levels.
In areas where continuous pressure for efficiency is lacking, use alternative financing models. In such areas there is a concern that PPPs may not lead to value for money. An alternative to the PPP in the absence of continuous pressure for efficiency is a “regulatory asset base” (RAB) model. In the RAB model an independent regulator collects information about the regulated firm’s performance and sets periodic efficiency incentives. The RAB offers a solution for a sustainable involvement of private investment in public infrastructure such as motorways. Nevertheless, the application of RAB requires strong institutional maturity and credibility (the assurance of a true independence of the regulator), which may need yet to be developed in many developing countries.
Aim to reduce uncertainties for investors and suppliers during the bidding phase in order to make projects substantially cheaper. For example, various measures can help to reduce uncertainties related to the construction: preparing a fully costed reference design before the tendering and not only an outline design; giving some freedom in the reference design in places

TRANSPORT PLANNING AND GOVERNANCE FOR BETTER CONNECTIVITY
ENHANCING CONNECTIVITY AND FREIGHT IN CENTRAL ASIA © OECD/ITF 2019 109
where the private sector could innovate; building a risk register before tendering, and run it as a joint risk register with bidders during tendering.
To prevent corruption and maximise the value for money of investments, the countries should consider adopting international standards like the OECD Anti-Bribery Convention, as well as following international guidelines such as the OECD Guidelines for Fighting Bid Rigging in Public Procurement, the G20/OECD Principles of Corporate Governance and the OECD Guidelines for Multilateral Enterprises, which make up a toolkit that allows countries to manage the risks and get the most out of foreign infrastructure investment. These instruments are detailed within the OECD Business and Finance Outlook and are available to OECD members and non-members alike (OECD, 2018c). To maximise the value for money of private investments the Public Sector Accounting Standards (IPSAS 32) can be also adopted.
To increase projects’ efficiency, innovations should be stimulated through strategic alliances. For the Central Asian countries, which have had a market economy only for three decades, it is especially important to increase transparency in procurement as well as develop and apply anti-corruption mechanisms.
Box 13. The National Project Management Agency under the President of the Republic of Uzbekistan
The National Project Management Agency under the President of the Republic of Uzbekistan is a public institution set up in accordance with presidential decree PD-3150, “On the Establishment of the National Project Management Agency under the President of the Republic of Uzbekistan”, signed on 27 July 2017. The Agency:
Organises and coordinates the realisation of national and regional (local) programs and investment projects;
Scrutinises and monitors investment programs;
Conducts comprehensive technical and economic analysis of projects, looking for signs of corruption, cartels, and illegal agreements;
Issues conclusions on the investment programs of Uzbekistan;
Introduces leading information and communication technologies in government bodies and other public organisations, thus ensuring the operation of the Integrated National Information System of Project Management of the Republic of Uzbekistan;
Promotes competitiveness and the creation of a favourable business environment; and
Facilitates training and professional development for specialists in project management (it provides complex expertise and acts as an accreditation centre).
Through its mission, the Agency boosts the efficiency and secures transparency of national and regional (local) programs as well as investment projects throughout the country, and a single information space for public procurement is being established. The Agency is open for communication with the business community and government bodies to improve project/design works and perfect the investment climate in Uzbekistan.
Criteria applied by the Agency for project choice include:
Priority ranking;

TRANSPORT PLANNING AND GOVERNANCE FOR BETTER CONNECTIVITY
110 ENHANCING CONNECTIVITY AND FREIGHT IN CENTRAL ASIA © OECD/ITF 2019
Compliance with the national and regional development goals; and
Financial sources.
The agency hired professionals from the best local and international institutions, and also attracted partners from other countries who had advanced similar projects, such as Georgia. The agency achieved success making the project selection, implementation and public procurement procedures more transparent and reducing possibilities for corruption.
Source: https://napm.uz/en/about/info/ (last accessed 19.10.2018)
National asset management systems need to be developed and institutionalised
Transport infrastructure networks represent one of the principal asset systems held by national and regional governments. When budgets are tight, funding for road maintenance is often postponed on the expectation that a lack of maintenance will not necessarily lead to immediate asset failure and network disruption. The cumulative impact of deferred maintenance, however, increases asset and network vulnerability to local or systemic disruptions. The state of the network, future impact on the user, and necessary funding to correct the condition will be made transparent by an asset management system. As Chapter 3 shows, the road and rail networks are slowly recovering from years of insufficient maintenance, and the issue of effective management of transport assets is still highly relevant for Central Asia.
The overall aim of asset management is to optimise the service level delivered by infrastructure over its life-cycle or at acceptable cost. The focus of management should be on value to users or customers and not solely, nor even primarily, on cost or asset replacement cost perceived by the infrastructure provider.
The maintenance needs of a road network can be predicted from a set of structural characteristics, including age, traffic, design standards, construction quality and subsequent maintenance, taking into account climate conditions. Maintenance required for paved and unpaved roads is usually different. For paved roads, there is a trade-off between higher investment costs at the time of paving and lower maintenance costs. Unpaved roads, such as gravel roads, cost much less than paved surfaces to build but require more frequent maintenance, especially in areas with extreme weather conditions such as heavy precipitation or large variation in temperature (OECD, 2017a). The latter is especially relevant for Central Asia.
Currently, only Mongolia has an asset management system in place; the data are collected annually and data management, control and analysis are performed. However, the asset management system is not yet integrated into decision-making procedures, and is mainly used for monitoring (ADB, 2018). In the rest of the countries, road asset management system frameworks are under development with the help of the multilateral development banks and as part of the Central Asia Regional Economic Cooperation (CAREC) program. The development partners also help to organise data collection processes in the countries.
While the countries are focused on data collection, the other essential parts of the asset management system and institutionalisation of the system are missing. Additionally, as the previous chapter shows, all five countries manage their road assets with insufficient budgets, which often means deferred maintenance of roads or maintenance of only trunk roads. Kazakhstan recently started applying results-

TRANSPORT PLANNING AND GOVERNANCE FOR BETTER CONNECTIVITY
ENHANCING CONNECTIVITY AND FREIGHT IN CENTRAL ASIA © OECD/ITF 2019 111
based budgeting, which allows defining appropriate targets based on the available budget and monitoring achievement of the targets.
Several examples can show how the countries are advancing their asset management system development. The Ministry of Transport and Communications of Kyrgyzstan, together with the State Property Fund, plans to develop statistical classifiers of machines and equipment (transport, information, computer, telecommunication and other related equipment) to form the state statistical classifier of assets. In addition, the state has approved regulation on an inter-departmental automated information system called the “Unified Register of State Property of the Kyrgyzstan”, which allows for effective accounting and management of public assets. Uzbekistan has partially separated the responsibilities of planning and managing road maintenance and repair investments from the actual implementation of maintenance and repair; since 2017 the current road agency (the State Committee for Roads) has performed mostly the former function while the implementation is performed by newly formed unitary enterprises under the Committee’s Directorate for Construction and Reconstruction of Public Roads (ADB, 2018).
Recommendations for asset management systems
To move forward, the countries are recommended to:
Finalise the design of their asset management system frameworks. Strategic asset management should have a link to long-term financial planning, as the existence of sustainable funding sources is a key to maintaining performance. Introducing an asset management approach to road network management and specifying explicit links to strategic budgets are essential for transport authorities to be able to arbitrate among needs, vulnerabilities and trade-offs (Crist et al., 2013).
Make sure the framework includes performance measures that help to identify required outcomes and assign explicit roles and responsibilities. Government bodies responsible for the asset management maintenance, repair and construction should be defined, with separation between implementation and planning.
Make sure that the data is regularly collected, checked for quality, analysed, shared across the agencies, and used for decision making, both financial and strategic. The asset management system should cover the following tasks: monitoring of the conditions of assets and their environment; data collection and database development; performance assessment using the data; calculation of cost and effectiveness of possible actions; use of decision-making tools such as cost-benefit analysis, life-cycle assessment and multiple criteria analysis; uncertainty and risk analysis; and estimates of necessary funding, optimisation and prioritisation.
Box 14 presents the findings of an international scan of the asset management practices in transportation, carried out by the United States’ Federal Highway Administration (FHWA).
Box 14. Features of developed highway asset management systems
In 2005 the United States’ Federal Highway Administration (FHWA) carried out an international review of several sites in Australia, New Zealand, Canada, and the United Kingdom to observe the asset

TRANSPORT PLANNING AND GOVERNANCE FOR BETTER CONNECTIVITY
112 ENHANCING CONNECTIVITY AND FREIGHT IN CENTRAL ASIA © OECD/ITF 2019
management practices of the visited highway agencies.
Most of the agencies had top-level agency commitment to asset management. This implies establishing a management position or an office for bringing together agency resources and capabilities for undertaking asset management and creating an asset management culture, and for providing guidance and information for the stakeholders.
High-quality data on infrastructure needs are essential to support decisions in asset management and require additional funding. The asset management systems of the visited agencies had in common the following features in data collection and analysis:
Application of life-cycle cost analysis, with appropriate data identified and collected for this analysis;
Locational referencing systems supporting the asset management database;
High-quality data with periodic re-sampling;
Data sharing among the agencies;
Risk assessment applied at different stages of the decision making.
The main challenge was the institutionalisation of the asset management, which changes the organisational culture. To achieve this, the states adopted new legislation to support the asset management system introduction, and educated public officials and other stakeholders. In the beginning of these reforms, the countries found it difficult to find qualified candidates. In response, the countries developed manuals and best-practice procedures, organised training courses, and established professional associations and user groups.
Other features of the asset management systems of the surveyed countries include incorporation of asset management principles into agency planning and policy documents and into public–private partnership agreements. The legislation provides also links to environmental policy and to improvement of quality of life of the local communities.
Source: Federal Highway Administration, FHWA (2007).
Governance and regulation
The dimension of transport governance and regulation measures how well transport infrastructure and networks are regulated and operated, with a focus on rail, aviation and road markets. Good governance in transport is critical to sustain the competitiveness of the sector and, in turn, economic growth. Stable and transparent governance frameworks provide the certainty necessary to attract investment and implement strategies and visions. Appropriate regulatory intervention ensures that transport markets operate efficiently and safely. This report focuses on the rail and road markets as these are the main transport modes for freight in the Central Asian countries.
Figure 42 displays the average score for the governance and regulation dimension and the scores for rail and road regulations. Kazakhstan is the regional leader in this dimension due to its advanced road and, especially, rail reforms. The following two sub-sections of the report summarise the best practices in rail and road regulations, explain the reasons for assigning the scores, and recommend possible improvements.

TRANSPORT PLANNING AND GOVERNANCE FOR BETTER CONNECTIVITY
ENHANCING CONNECTIVITY AND FREIGHT IN CENTRAL ASIA © OECD/ITF 2019 113
Figure 42. Governance and regulation: Sub-dimension average scores and indicator scores
Rail regulation should aim at gradual market opening and efficiency
This indicator measures the progress made in implementing strategies for rail reforms – mainly rail policies such as harmonisation of rules and market liberalisation, as this is crucial for creating the preconditions to establish and join the market. Even if the legislation exists, it is not always well implemented. Better implementation would ensure that existing technical and regulatory barriers for cross-border rail transport are removed.
Railway transport should become more attractive for shippers with facilitated procedures for shipments, payments, and border crossings; this is especially relevant for the Central Asian countries which have shifted from command economies to market ones. The attractiveness for the customers can be increased through terminal improvements, communications facilitation, increases in operational efficiency, and harmonisation of service and related procedures across corridors and the countries in the region.
The countries should consider vertical separation (between the infrastructure and operation services) and horizontal separation (between different services of each type) of the rail industry. This would allow the train operators and service providers to compete against each other and, therefore, potentially lead to improved efficiency in the sector – which in turn could lower prices and promote innovation. Lower prices and reduced shipment time can attract more shippers to the railways, both domestic and international. However, the effects of the separation are still debatable because the corresponding reforms are quite recent in most countries of the world.
Currently, only Kazakhstan and Mongolia have ongoing railway reforms. Kazakhstan was first among the five countries in the region to start a railway reform in 1997. Kazakhstan, Kyrgyzstan, Mongolia and Uzbekistan have separate strategies developing their railway sectors. All the strategies have in common the objective of increasing rail transit. The missing elements identified in all the strategies are measures for cost reduction and towards sustainable development. While Kazakhstan has already carried out some separation in its railway sector, none of the remaining countries is currently planning either horizontal or vertical separation.
Kyrgyzstan’s main policy for rail transport development up to 2020 aims at increasing the transit potential of the national railway. The corresponding measures include the commissioning of new
0
1
2
3
4
5
KAZ KGZ MNG TJK UZB
Average score for Governance and regulation Sub-dimension Rail regulation Road market regulation

TRANSPORT PLANNING AND GOVERNANCE FOR BETTER CONNECTIVITY
114 ENHANCING CONNECTIVITY AND FREIGHT IN CENTRAL ASIA © OECD/ITF 2019
wagons, diesel locomotives, infrastructure facilities, and new railways. A high priority is the construction of the North-South railway connecting the north and south of Kyrgyzstan.
The purpose of the strategy for the development of the national railway operator of Uzbekistan is to continue the development of the railway industry as an integral part of the economy of the Republic of Uzbekistan, to increase the country's transport and transit potential, create new jobs, maintain a coordinated transport and technical regulation policy increasing the level of comfort and reliability of train movement, increasing the investment attractiveness of railway transport. The planned measures include modernisation of the existing railway lines and rolling stock, as well as service quality improvement.
Oversight bodies are assigned in some of the countries (Kazakhstan, Mongolia) but they have limited functions. In the other countries (Uzbekistan) such bodies are missing or not completely independent.
The Central Asian countries are also members of different customs and railway unions – e.g. the Eurasian Customs Union, the Organisation for Cooperation between Railways (OSJD), the European Agreement concerning the Work of Crews of Vehicles Engaged in International Road Transport (AETR). This sometimes hinders harmonisation and simplification of procedures for the clients.
Railway reforms in Kazakhstan
Kazakhstan started its rail sector reform in 1997 by merging three railway departments (Almaty, West Kazakhstan, and Tselinia railway administrations) into an integrated national operator, Kazakhstan Temir Zholy (KTZ). The next step of the reforms was the separation of social services such as schools, hospitals, farms, and resorts with the aim of improving the efficiency and effectiveness of railway operations at the national level. The reforms also included internal reorganisations that consolidated operations and departmental functions.
The government continued the reforms by issuing a new strategy in 2001, aiming at (i) adaptation of the sector to a market economy while maintaining government control and ownership of the infrastructure network; (ii) stimulation of competition in rail transport and supporting services to provide railway services which are more accessible, efficient, safe, and high quality; (iii) creation of an institutional environment attracting private investment and initiative; and (iv) development of a domestic railway supply industry.
From 2002 to 2004 the national railway organisation was converted into a joint stock company (NC KTZ JSC), which in 2006 issued its first Euro Bond financing. Both vertical and horizontal separation of the railway services was initiated. New tariff reforms stimulated privatisation of freight wagons and private operation of some passenger services. The state separated policy and regulatory functions from commercial functions, and assigned passenger and freight activities to separate enterprises (CAREC Secretariat, 2018).
In March 2018 the NC KTZ JSC gave a briefing on a new “Digital Railway” information technology development strategy. The strategy addresses freight, passenger, multimodal transportation, logistics and projects implemented at railway infrastructure facilities, as well as in corporate areas. In freight, the program aims at the introduction and operation of information systems in cargo movement in order to increase efficiency of the transportation processes. This includes the introduction of automated systems in operational management, integrated route processing, planning and forecasting of train-wagon traffic, control of consumption of diesel fuel, and electricity by locomotives. The strategy also implies further expansion of the existing “single electronic window” used in the planning, organisation and implementation of transportation and electronic payment for services related to freight transportation.

TRANSPORT PLANNING AND GOVERNANCE FOR BETTER CONNECTIVITY
ENHANCING CONNECTIVITY AND FREIGHT IN CENTRAL ASIA © OECD/ITF 2019 115
Box 15. Costs and benefits of separation in the railway industry
By allowing train operators and service providers to compete against each other, separation potentially leads to improved efficiency in the sector. This in turn can lower prices and promote innovation. Lower prices and reduced shipment time can attract more shippers to the railways, both domestic and international. However, the effects of the separation are still debatable because the corresponding reforms are quite recent in most countries of the world.
The benefits of the vertical separation are in general higher for industries with (1) higher share of potentially competitive elements; (2) great potential for productivity improvements; (3) denser markets; and (4) greater institutional capacity of the industry regulation. While in rail often the competitive element is quite small, the economy of density is high, especially in rail freight (Abbot et al., 2017).
Besides the benefits, the vertical separation has its costs that might overweight the benefits. The costs are associated with development and execution of new legislation and standards, with resolving conflicts, and maintaining interoperability between different services. The costs are likely to be even higher in the case of network capacity constraints and other technical constraints (Drew, 2009). Several international cases show that vertical separation might create additional costs. To outweigh all these additional costs, the separation must create enough competition that significant efficiency increases result from it. Therefore, if before separation a vertically integrated operator is large and inefficient, the potential gains can be higher than in the case where a vertically integrated operator is already facing strong competition with other railways or other transport modes. This possibly explains why vertical separation in European railways brought more efficiency gains than in the United States (Abbot et al., 2017). Additionally, if vertical separation is not conducted along with horizontal separation, the potential efficiency and productivity benefits can be very limited (Cantos, Pastor & Serrano, 2010).
An analysis of studies on efficiency due to vertical separation carried by Abbot et al. (2017) showed that in the case of freight rail transport, the benefits of separation can be higher. The extent of the benefits will depend on the freight task and type of infrastructure. Vertical separation can increase costs on dense networks and high-frequency bulk freight as these factors require very close and efficient coordination between operation and maintenance. Especially if the track is used only by large bulk carriers and not used for passenger, container or any other traffic, the vertical separation will likely bring more costs than benefits as it will unlikely lead to significant competition but will make the coordination and alignment processes more complicated. By contrast, separation – in the case of low-density, long-distance freight, with tracks used for different purposes – can potentially lead to greater efficiency. Currently, however, the amount of studies proving this is very limited (Mizutani and Uranishi, 2012; Abbot et al., 2017).
Recommendations on rail reform
Summing up for all the five countries, to move forward with the rail reforms the main recommendation is to make sure that the rail reform:
Implies establishing an oversight independent body with defined roles and responsibilities (regardless of countries’ plans on vertical and horizontal separation, it is important that independent rail market regulatory authorities are established to oversee the implementation of the railway reforms and strategies); and

TRANSPORT PLANNING AND GOVERNANCE FOR BETTER CONNECTIVITY
116 ENHANCING CONNECTIVITY AND FREIGHT IN CENTRAL ASIA © OECD/ITF 2019
Includes policy measures towards improved sustainability, safety, access, and quality of service as well as cost reduction.
In the longer term:
The countries need to make sure that the reforms plan for horizontal and vertical separation in order to improve efficiency in the sector. Exceptions from this are countries with a small railway network (Tajikistan and Kyrgyzstan). In the Central Asian countries, the economy of density is not always high even in freight, and the institutional capacity might be insufficient, which creates additional challenges for maximising the benefits of vertical separation.
Reforms should suggest measures for better investment planning, improvements in financial management and involvement of private sector. Because multimodal road-rail solutions are especially important for the Central Asian countries, the reforms should include development of such solutions. Regular data collection and making the data public should be incorporated into the railway reforms and put into practice.
Road market regulation should promote common rules in the region
Various policy goals contribute to the integration of road freight into the international transport system, and are best attained through the promotion of common economic, social and environmental rules. Market opening being a long-term goal, it is important that regulations focus on the harmonisation of these rules. Possible measures include: improved effectiveness of controls, including at borders; harmonisation of employment conditions in the road transport profession; cabotage rules to guarantee equal market access opportunities and reduce empty runs; introduction and modulation of road user charges; social and safety legislation; involvement of professional associations; licensing and price regulations; and simplification of rules and procedures.
Road market regulation in Central Asia
In all the countries, legislation in the area of employment conditions in the road transport profession has been adopted and implemented. However, the legislation does not always ensure safety, health, fairness, efficiency and social accountability. Similarly, laws guaranteeing the safety of cargo for the freight shippers and reduction of the grey/ black market in freight forwarding have been adopted but do not always work efficiently.
In most of the countries, legislation regulating road user charges is in place but has not yet been applied. In Kazakhstan the first toll road was introduced in 2013, and since then the budget revenues from the toll have increased and toll roads are now profitable. Uzbekistan plans to introduce toll roads by 2020. These will be new alternative roads parallel to the existing ones.
Although the countries are currently focused on developing physical infrastructure, some have also developed indicators to measure the performance of the road network. Tajikistan has developed indicators in cooperation with private and public organisations during working groups and other types of meetings. The indicators allow authorities to assess the operational performance of the existing network; the evenness of pavements; the degree of compliance of transport and operational indicators with the requirements for consumer properties of roads and identifying the causes of this discrepancy; pavement roughness and its influence on roads’ operational characteristics; the resistance of pavements (according to the intensity of use); and the durability of coatings. These indicators apply according to the established state standards, and also depending on the season and climatic conditions.

TRANSPORT PLANNING AND GOVERNANCE FOR BETTER CONNECTIVITY
ENHANCING CONNECTIVITY AND FREIGHT IN CENTRAL ASIA © OECD/ITF 2019 117
In most of the countries, cabotage for foreign shippers is prohibited. As Kazakhstan and Kyrgyzstan are in the Eurasian Economic Union (EAEU), road carriers of these countries can carry out international freight transportation according to the rules of the Union. International road transport of goods performed by carriers registered in the territory of one of the EAEU member states does not need authorisation in the following cases: (i) between the member state in whose territory the carriers are registered and another member state; (ii) transit through the territories of other member states; (iii) between other member states. Permits are not required for bilateral, transit and transportation to or from third countries between member states of the Union (for example: Astana-Moscow, operated by a Kyrgyz carrier).
Member States of the EAEU also implement a program of phased liberalisation from 2016 to 2025 for carriers registered in one of the member states and performing road transport of goods between points located in another member state. The program of phased liberalisation of cabotage transportation within the Union seeks to (i) create a common market for road transport services within the Union and (ii) facilitate access for carriers of the member states to the provision of freight road transport services throughout the union, regardless of citizenship and state of registration.
Transport control in terms of compliance with weight and dimensional parameters, as well as with the national legislation of the countries through which the route passes, will be carried out by the internal stationary and mobile posts of transport control of the EAEU member states. Upon entry and exit to or from the territory of the EAEU at transport control points, registration tickets are issued to transport companies by the transport control authorities of the EAEU member states for further movement within the territory of the EAEU. The Program aims to reduce the share and length of empty runs and the transport costs of consumers of freight road-transport services, increase the efficiency of using vehicles in international freight traffic, and define common conditions and rules for providing freight road transport services within the EAEU.
All of the five countries are members of the TIR Convention, which helps to facilitate haulage. However, the prices of a TIR Carnet permission (a document issued to traverse TIR member countries without undergoing customs inspection until reaching the destination country) vary across the countries significantly even within the region (e.g. in 2017, a six-volet TIR Carnet cost USD 81 in Kazakhstan, USD 180 in Kyrgyzstan and USD 43 in Russia (UNICE, 2018). This variation affects the competition between the carriers from different countries, and makes it almost impossible for smaller carriers to participate in the system. Additionally, the TIR regulations have very vague recommendations on the application of the rules for the countries that are members of a customs union, which in the case of EAEU members requires elaboration of additional agreements to regulate the haulage. The agreements have not been reached up until now. Moreover, sanctions between Russia and the European countries affect the Central Asian countries when the cargo has to cross Russia. Finally, the situation with international haulage in the region is complicated by the substantial border crossing time between the countries, which is especially long due to queuing (see Chapter 3).
Another problem in the countries is difficulties of finding legal and practical information for the carriers. For example, the carriers often are not aware that their own country or a neighbour country has introduced or cancelled temporary import bans for some goods. Information on border-crossing, insurance, shipment, and other rules is scattered across different web resources.
Some issues are more specific to smaller countries in the region that have weak road market regulations, resulting in competition with unlicensed operators. As a result, freight carriers from countries such as Kyrgyzstan have only one or two vehicles per company and face challenges in competing against larger companies in the international road market. The small size of the carriers and low professional standards also leads to black market schemes when shipments are agreed between the shipper and the carrier via
TRANSPORT PLANNING AND GOVERNANCE FOR BETTER CONNECTIVITY
118 ENHANCING CONNECTIVITY AND FREIGHT IN CENTRAL ASIA © OECD/ITF 2019
messengers. This implies tax evasion and no guarantee for cargo safety. Furthermore, the small size of the companies impedes fleet upgrades, which, in turn, has a negative impact on environment performance and on the working conditions of the drivers.
In all five countries, the domestic road market has no regulation that distinguishes between commercial and own-account (of one’s own merchandise) trucking. Such a distinction could bring more efficiency through specialisation and, therefore, enhance competition and sector development (Rastogi and Arvis, 2014).
Most of the countries collect statistical data related to road market such as: (i) data on the structure of the market (the number of companies in the freight market and their size, the number of employees in the sector, the average weight of goods transported and the distance per unit of time, etc.); (ii) freight flows between different cities, regions and countries (in money and weight units); and (iii) safety and enforcement actions (number of traffic accidents, etc.). At the same time, in most of the countries the efficiency of the road market regulation is not evaluated and an impact assessment is not conducted.
Recommendations on road market regulations
To move forward, the countries are recommended to:
Make sure that the road market regulations guarantee safety of cargo and a reduction of the grey/ black market, and ensure employment conditions related to safety, health, efficiency, social justice and social responsibility in the road transport profession; and
Collect detailed statistics and make these publicly available.
On the longer term, the countries should make sure that:
The regulation brings efficient and fast cross-border control, introduction and management of road user charges, cabotage market, and minimisation of empty runs. The path of the road market opening and integration can be started from the harmonisation of the terms of competition both between road hauliers from different countries and between modes of transport.
The countries should move towards developing and adopting professional standards for domestic drivers, consistent with international standards. Commercial and own-account transportation should be separated on a legal basis and supported by governments with information and technical assistance.
The countries in which the carriers are very small and weakly regulated should encourage company consolidation and install a proper licensing system. The countries also should develop and apply measures to reduce tax evasion, such as facilitation of the tax payment procedures, increasing control, providing subsidies and tax discounts for the carriers operating legally and for the shippers using the services of the legal carriers, etc.
Digital technologies can increase the efficiency of the policy measures. For example, portals containing information for road market participants can help them to obtain legal, tariff, and other related information, increasing their efficiency. This can attract newcomers to the market and increase competition. Portals showing the performance of the border crossing points online in real time can help the carriers plan their routes and the government to monitor customs performance. Box 16 shows an example of such service on the website of the United States Customs and Border Protection Agency.

TRANSPORT PLANNING AND GOVERNANCE FOR BETTER CONNECTIVITY
ENHANCING CONNECTIVITY AND FREIGHT IN CENTRAL ASIA © OECD/ITF 2019 119
Box 16. Border wait times displayed online in real time
The website of the United States Customs and Border Protection Agency contains information on the border crossing points at the Mexican and Canadian borders. This includes the name of the border crossing point, the number of lanes, current delays, wait time collection method, and opening hours.
Real-time information display
A symbol displayed below a border crossing indicates the type of methodology used for wait-time estimation.
The Bluetooth orange symbol indicates wait-time measures for the crossing are being calculated using Bluetooth®-based technology. Bluetooth® readers capture wireless signals emitted from a traveller’s Bluetooth® device (e.g. mobile phone, tablet, laptop) as the vehicle approaches the border. The Bluetooth® signals are then used to determine an estimated wait time.
The green RFID symbol indicates that commercial wait-time measures for the crossing are being calculated using Radio Frequency Identification (RFID) technology. RFID measures travel times between RFID readers installed at major points of the commercial border crossing process by detecting the vehicle’s transponder number. As the vehicle passes under the RFID reader a time stamp is created which is used to determine an estimated wait time. NOTE – All other crossings use a manual wait time collection method such as line of sight and/or driver surveys.
Source: https://bwt.cbp.gov/index.html (last accessed 19.10.2018)
Cooperation between the countries in road market regulation
Cooperation between countries in road market regulation is very important for road freight liberalisation and connectivity improvement. Forms of cooperation can vary from gradual liberalisation to open market.
The gradual liberalisation can be started by joining various international transport systems such as the Transports Internationaux Routiers (TIR) Convention and quota systems such as the European Conference of Ministers of Transport (ECMT, which evolved into the ITF in 2006), or even by establishing a regional quota system.

TRANSPORT PLANNING AND GOVERNANCE FOR BETTER CONNECTIVITY
120 ENHANCING CONNECTIVITY AND FREIGHT IN CENTRAL ASIA © OECD/ITF 2019
The TIR Convention is a multilateral treaty that establishes an international customs transit system. It facilitates cargo movements by reducing border crossing times while providing customs authorities with security and guarantees.
The ITF Multilateral Quota is a system of transport licenses that enable hauliers to undertake an unlimited number of multilateral freight operations in the member countries participating in the system. The Multilateral Quota is managed by ITF’s Road Transport Group (RTG), which allocates licenses to the member countries of the system and publishes a User Guide. The Quota introduces standards regarding noise and emissions; promotes the use of environmentally friendly and safe vehicles; and establishes qualification standards for companies, managers and drivers.
Examples of open markets are the European Union (EU), the Eurasian Economic Union and the Eurasian Customs Union. The goal of EU policy is to create a European Single Transport Area where road hauliers from different Member States are free to access the transport profession in different countries and to undertake transport operations across the EU. The strategy relies on (i) a well-functioning internal market, (ii) fair competition and workers’ rights, (iii) decarbonisation, and (iv) digitalisation.
Each of these options brings risks and challenges for the countries, and each would require a certain level of regional integration and cooperation on a political level, especially for a complete market opening. For example, the intended establishment of the internal road transport market in the EU is still not fully completed. Varying implementation of the current rules by Member States (due to the additional national requirements that are not always in line with EU regulations) impedes the integration. The Member States with a relatively high number of cabotage operations (and therefore a protectionist nature) are the ones whose national regulations diverge most from the EU ones. Another issue is that transport companies set up so-called ‘letterbox’ companies in lower-wage EU countries without operating there with the intention of minimising the costs.
Sustainability
The dimension on transport sustainability measures progress towards resource efficiency, environmental protection, reduction of health impacts and increased transport safety. Road transport in Central Asia is growing while the share of inland rail transport is relatively low and is even slightly decreasing, as Chapter 3 shows. While initially increasing road transport allows considerable productivity gains, in the long run the negative externalities – for example in terms of local pollution, noise or CO2 emissions – are high. Electrified railway transport is a mode characterised by lowest emissions and, therefore, increasing railway share improves environmental sustainability. Transport safety also belongs in this sub-dimension as transport infrastructure can only be sustainable if it reduces negative health impacts. The sub-dimension also includes logistics, as well-functioning logistics both domestically and internationally is a necessary precondition of national competitiveness and improves the efficiency of the freight sector.
Figure 43 displays the average score for the sustainability dimension and the scores for road safety and environmental sustainability and logistics strategies. Kazakhstan is the leader in this dimension due to its advanced road and, especially, rail reforms. The following two sub-sections of the report summarise the best practices in rail and road regulations enhancing sustainability, explain the reasons for assigning the scores, and recommend possible improvements

TRANSPORT PLANNING AND GOVERNANCE FOR BETTER CONNECTIVITY
ENHANCING CONNECTIVITY AND FREIGHT IN CENTRAL ASIA © OECD/ITF 2019 121
Figure 43. Sustainability: Sub-dimension average scores and indicator scores
Road safety and environmental sustainability strategies should be developed and
adopted
Road safety should be a priority of transport policy, including a harmonisation of road safety technology, improved road worthiness tests, a comprehensive strategy of action on road injuries and emergency services, promotion of the use of safety equipment, etc. Another key strategy is a sustainable strategy that aims to develop and introduce measures to reduce energy consumption in transport services; including introducing natural gas in commercial road and waterborne transport and increasing the share of electrified rail transport. Other potential measures include shipping larger volumes of freight or people jointly to their destination and using individual transport only for the last kilometres. More specifically, the environment strategy may address the following issues: modal shift from road to other modes of transport; standards for energy efficiency; vehicle labelling for emissions and fuel efficiency; the introduction of carbon footprint calculators; co-modality in transport; eco-driving and speed limits; standards for noise emission; the reduction of greenhouse gas emissions; and the use of ITS applications.
The indicator presented in this sub-section measures whether or not countries have in place a comprehensive strategy for road safety and a strategy for greening transport activities and infrastructure, and the quality and implementation of these strategies.
In all five countries, a dedicated road safety strategy is currently under development. There is also a regional road safety strategy for 2017-30 prepared by the Asian Development Bank for the CAREC countries. The strategy aims to provide a framework for the member countries to effectively implement CAREC’s commitment to road safety. The strategy’s vision is to “make CAREC international road corridors safe, efficient, and attractive for all road users.” The strategy aims to reduce the number of fatalities on CAREC road corridors by 50% by 2030, compared to 2010, to save 23 000 lives annually, and to prevent 250 000 serious injuries, with the estimated economic savings totalling approximately USD 16 billion per year (CAREC, 2018). The World Bank also supports a few projects related to road safety in the region.
The year 2018 was announced as the year of traffic safety by the Minister of Roads and Transportation of Mongolia. A road safety committee has been established, eight international standards implemented and 26 regulations introduced. Following international standards, Kazakhstan has increased fines for breaking the road safety rules.
0
1
2
3
4
5
KAZ KGZ MNG TJK UZB
Average score for Sustainability Sub-dimension Road safety and sustainability strategies Logistics strategy

TRANSPORT PLANNING AND GOVERNANCE FOR BETTER CONNECTIVITY
122 ENHANCING CONNECTIVITY AND FREIGHT IN CENTRAL ASIA © OECD/ITF 2019
A dedicated sustainability strategy is currently approved only in Mongolia (Mongolia Sustainable Development Vision 2030). In the Kyrgyzstan the previous national strategy of sustainable development had a planning horizon until 2017 and the new strategy for up until 2040 is currently under development. In other countries the sustainability strategy is either under development or is a part of a broader state strategy.
There is the Sustainable Development Strategy of Central Asia, which has been developed by the United Nation’s Environment Program (UNEP) and covers Kazakhstan, Kyrgyzstan, Tajikistan, Turkmenistan and Uzbekistan. The strategy presents directions and general approaches for establishing favourable legislative, institutional, economical, informational and other conditions for achieving sustainable development goals in the region. The strategy suggests long-term objectives for the three dimensions of sustainability (economic, social and environmental), creation of mechanisms for energy security, conservation of natural and cultural heritage and promotion of effective management. The plans related to transport include reduction of operative expenses and providing support for transit, and establishment of an effective transport infrastructure. Improvements of infrastructure are to be achieved through attracting of financial resources for maintenance, repair and development of existing transport networks and communications systems, improvement of legislation and regulation practices in the transport sector, including attracting private sector funding (UNEP, 2009).
Most of the sustainability strategies consider a modal shift from road to other modes of transport and development of co-modality solutions. Some strategies include standards for noise emissions and targets to reduce greenhouse gas emissions. None of the countries, at least to date and to the authors’ knowledge, cover in their programmes standards for energy efficiency or introduction of carbon footprint calculators.
Data on road safety accidents and other indicators are collected in all countries, though some of the countries started such data collection only recently. Data related to the sustainability indicators are either not collected or are collected irregularly, and, if collected, not always publicly available.
Recommendations on road safety
To move forward, Central Asian countries are recommended to:
Enforce the collection and regular update of data on road safety and environmental sustainability indicators. Data are essential to design a policy to improve road safety. It is recommended that road safety data is collected at three levels. The first level is the final outcome data, including the number of persons killed and injured, broken down by type of road users, location and time. The second level is data on road safety performance indicators (SPIs), focusing on the safety performance of vehicles, road infrastructure and post-crash care and road user behaviours. A minimum set of SPIs includes speed; seatbelt wearing and use of child restraint systems; helmet wearing by users of powered two-wheelers; and drinking and driving. The third level is contextual data, including risk exposure data such as: population, motorisation, traffic volume by type of road users and road types, and personal mobility by means of transport, as well as background cultural information (ITF, 2018c).
Make sure that the road safety and the environmental sustainability strategies are developed and approved by the government or parliament. The countries should also ensure that legislation, education and construction efforts towards greater road safety and sustainability are joined together. This could include developing targeted safety standards and an action plan for reaching them.

TRANSPORT PLANNING AND GOVERNANCE FOR BETTER CONNECTIVITY
ENHANCING CONNECTIVITY AND FREIGHT IN CENTRAL ASIA © OECD/ITF 2019 123
In the longer term, countries should make sure that data are made publicly available and that the countries participate in international collaboration to benefit from international good practices. Besides co-modality, standards for noise, emissions, and targets to reduce greenhouse gas emissions, countries may consider including standards for energy efficiency and introduction of carbon footprint calculators in their programs.
Logistics strategies should promote regional cooperation and account for new
technologies
Well-functioning logistics both domestically and internationally is a precondition of national competitiveness. The ADB surveyed a sample of medium-sized and large firms in Kazakhstan to estimate the impact of efficiency gains in the transport and logistics sector on firm-level productivity growth. The results showed that a 10% increase in the efficiency of transport infrastructure generates an increase in firm-level productivity of 0.9% on average (ADB, 2018a).
The indicator of this sub-section measures whether the Central Asian countries have a strategy or action plan or initiative in place on how, when and where to improve and support the development of integrated logistics investment strategies that promote a corridor approach and efficient intermodal solutions.
National logistics strategies do not yet exist in any of the Central Asian countries. These are under development or are parts of other more general strategies.
In Kazakhstan, the State Program for the Development and Integration of the Infrastructure of the Transport System contains objectives related to development of the logistics sector. Those include optimisation of export, import and transit operations; improving the efficiency of logistics; creation of an internal and external terminal network; ensuring a unified system of legal regulation of transit cargo on the country’s territory; and institutional reform of the transport and logistics industry. A more-comprehensive logistics strategy and development road map has been suggested by Samruk Kazyna but has not yet been adopted. The road map includes sections on communication and cooperation with governmental bodies of Kazakhstan; improvement of infrastructure; automation of processes and implementation of new projects and standards in logistics; development of additional services, including financial and insurance services and applications with information for shippers and carriers; and capacity building.
Mongolia has a logistics strategy project developed by the Asian Development Bank. In Kyrgyzstan the strategy is a part of a new road transport codex, which is also under development. Similarly, in Tajikistan there is a codex of road transport under development, which has a chapter devoted to logistics.
Recommendations on logistics strategy
To advance in logistics strategy development the countries are recommended to:
Adopt a logistics strategy, either as a standalone or as a part of a bigger strategy. The strategy, similarly to any policy framework, should contain measurable objectives and a set of actions to achieve the objectives, define roles and responsibilities, and specify budgets.
Make sure that the strategy suggests measures to improve customer service and to reduce the service cost. The corresponding objectives could be to develop co-modal solutions and identify corridors, to decrease transportation costs, to facilitate border crossing, to improve the quality of trade-related infrastructure, to increase the competence and quality of logistics services and timeliness of shipments, etc.

TRANSPORT PLANNING AND GOVERNANCE FOR BETTER CONNECTIVITY
124 ENHANCING CONNECTIVITY AND FREIGHT IN CENTRAL ASIA © OECD/ITF 2019
Collect corresponding data to be able to measure progress. To enhance regional cooperation in logistics, the governments should support the emergence of open standards for data sharing, the establishment of common platforms for information sharing and collaboration, and single entry points for administrative services (Single Windows). The governments also should ensure interoperability between public and private systems for the exchange of logistics information and enable faster cross-border interactions.
Incorporate into the strategy plans to develop and improve skills and qualifications in the logistics sector and to align them with international standards. This include plans to improve the education system for the industry, learning from international experience and standards, introducing professional accreditation, attracting foreign teachers and managers to fill in current gaps in expertise.
In the longer term,
Consider establishing a national or/and regional ’logistics observatory’ for data collection, processing and sharing. Different types of logistics observatories exist around the world today performing a variety of functions, from monitoring logistics performance and building reliable indicators to platforms for knowledge dissemination and supporting training and research in logistics. In terms of their governance and responsibilities, some countries have multiple observatories focusing on specific sub-sectors, some housed by government, others by industry. Examples of recent observatories include Chile and Mexico, where freight data collected at the urban, regional, provincial, and international levels are stored within the same repository to be used by the freight modellers and planners to support decision-making (see ITF, 2016a (Chile); ITF, 2016b (Mexico)), as well as Box 17).
Promote open standards and open platforms for the involved stakeholders. Including road maps to apply innovations could be another step in advancing the logistics strategy.
The national logistics strategies should take into account emerging innovative trends such as mass-individualisation of products and services, digitalisation and automation of vehicles and processes. These innovations will bring to logistics new opportunities and challenges. Automation will reduce the labour input to logistics processes, while wide application of information systems and digitalisation will lead to creation of a ‘sense-and-respond’ logistics system with significant gains result from reduced capital stocks through smart contracts. The transition to the new logistics systems will be impeded by non-technical barriers that include need for re-design of business models and changes in relations among stakeholders (ITF, 2018b). Digitalisation and implementation of cutting-edge technologies can potentially concentrate market power and constrain the users to a limited number of solutions. Therefore, governments should monitor such solutions and stimulate competition by, for example, supporting open standards and open platforms. Governments also should set cyber security standards for logistics organisations and raise awareness to ensure the resilience of the logistics and supply-chain systems to cyber-attacks.

TRANSPORT PLANNING AND GOVERNANCE FOR BETTER CONNECTIVITY
ENHANCING CONNECTIVITY AND FREIGHT IN CENTRAL ASIA © OECD/ITF 2019 125
Box 17. Examples of different types of logistics observatories
In the Netherlands, the government established in 2009 the non-profit Dutch Institute for Advanced Logistics, or Dinalog (http://www.dinalog.nl/en/about_us/). This is a public-private partnership with a focus on training and collaborative projects between businesses, government, universities and other institutions for innovation in logistics. It is supported by EUR 12 million in grant funding yearly from the government and co-financed to the same amount by industry and knowledge institutions. Its goals are:
To be the premier European institute for applied research and executive post-experience education in logistics and supply chain management;
To act as a catalyst for the retention and attraction of innovative business activities in the area of supply chain control, concentrated on the Supply Chain Campus Breda;
To develop scientific knowledge on advanced logistics with worldwide acknowledgement, in both the academic and business community;
To create an environment that attracts world-class researchers and where innovative companies base their key professionals to work on improving supply chain and logistics management;
To provide interaction with world-class international researchers;
To develop, organise and create markets for post-experience education in supply chain management and logistics, closely cooperating with its partner network.
Dinalog’s work on the scientific advancement of logistics is acknowledged by international academic and business communities. It has created an environment that attracts world-class international researchers and innovative companies to work on improving supply-chain and logistics management.
France has multiple observatories focusing on specific sub-sectors:
The National Road Freight Transport Economics Observatory, focusing on information on costs, prices and taxes in the sector (http://www.cnr.fr/);
Regional transport and logistics observatories, for example for Alsace, covering transport and/or logistics sectors in many of France’s regions (http://www.ortal.eu/);
The French-Italian transport observatory, focusing on cross-border transport and development of infrastructure between the two countries (http://osservatoriotrasporti.eu/fr/observatoire-destransports-franco-italien/); and
The Observatory of Transport Policy and Strategy in Europe, housed in the Ministry of Transport, covering all modes and both freight and passenger transport, with the mission to set analysis of transport systems and policies in an international, and in particular a European Union, framework (http://www.developpement-durable.gouv.fr/Presentation-de-l-OPSTE.html).
While the United States does not have a specific logistics observatory, the US Department of Transportation’s Bureau of Transportation Statistics and Federal Highway Administration cooperate to produce an annual report called Freight Facts and Figures. Underpinned by the statistical resources and expertise of the two agencies, this provides a comprehensive set of data on the physical characteristics of the national freight transport system and the freight moved, with selected indicators of congestion, environmental impacts, performance in relation to safety and contribution of the sector to the economy.

TRANSPORT PLANNING AND GOVERNANCE FOR BETTER CONNECTIVITY
126 ENHANCING CONNECTIVITY AND FREIGHT IN CENTRAL ASIA © OECD/ITF 2019
Towards better planning and governance: recommendations across
the three dimensions
Institutional capacity is at the core of the region’s efforts to improve connectivity. In recent years the Central Asian countries have shown significant progress at all levels of transport planning, governance and regulation, and sustainability (Figure 44). They have developed and adopted strategies and policy frameworks along the three dimensions of the ITF qualitative policy assessment framework (planning, governance and regulation, sustainability).
Figure 44. Scores for the three dimensions of transport planning and regulation
Source: ITF
Kazakhstan performs especially well in the regulation dimension due to its advanced railway sector reforms and the introduction of road user charges and corresponding regulations. Uzbekistan has expended significant efforts in fighting corruption and increasing transparency, especially in project selection and public procurement (according to the Fourth Round of Monitoring of the Istanbul Anti-Corruption Action Plan for Uzbekistan (OECD, 2018b), the country has significantly progressed in terms of political will to fight corruption and anti-corruption policy, anti-corruption education and awareness raising, public participation, investigation and criminal prosecution of corruption, administrative procedures and state financial control and audit). Mongolia has developed statistical data collection and is the first country in the region to introduce an asset management system. Kyrgyzstan and Tajikistan have made significant advances in planning, developing and adopting transport strategies and related policies and legislation aimed at improved efficiency, regional co-operation, safety and sustainability. Besides the national strategies, international development partners such as Asian Development Bank via CAREC, the World Bank, and the United Nations (UN) support countries in developing regional strategies to improve road safety, logistics, sustainability, railway regulations and asset management, among others.
There is also room for improvement. Frameworks and strategies often miss measurable objectives or budgets. Performance assessments are carried out irregularly and with no clear feedback to the revision of the strategy. Impact assessments are rare, while strategies may have gaps between years.
0
1
2
3
4
5
KAZ KGZ MNG TJK UZB
Average score for Transport Dimension Planning Governance and regulation Sustainability

TRANSPORT PLANNING AND GOVERNANCE FOR BETTER CONNECTIVITY
ENHANCING CONNECTIVITY AND FREIGHT IN CENTRAL ASIA © OECD/ITF 2019 127
Further, the countries rely little on quantitative models in planning, project selection, and asset management. Data are collected in different formats and are often not publicly available. Most of the countries apply cost-effectiveness analyses, but cost-benefit analysis (CBA) and multiple criteria analysis (MCA) are rarely used. Some countries develop scenarios and take them into account in their strategic planning. However, the consistent implementation of risk and uncertainty analysis frameworks across different dimensions of planning and governance or across different projects is currently missing.
The countries have shown progress with respect to digitalisation and the application of new technologies to increase the efficiency of the transport sector. At the same time, some traditional dimensions – such as reducing corruption and tax evasion, increasing transparency, supplying relevant legal information to the market – are often overlooked.
This section provides general recommendations relevant to all three dimensions of transport planning and governance.
Focus on institutionalising best practices in transport planning and governance
To improve on existing strategies, the Central Asian countries should ensure that each framework includes measurable objectives, action plans, roles and responsibilities, and detailed budgets. Each framework or strategy should imply regular monitoring of its performance and a regular revision based on an impact assessment. Finally, these strategies or frameworks should provide action plans pertaining to different time horizons, with more strategic planning in the long run and more concrete planning in the short run.
The countries receive substantial assistance from international institutions and development partners in undertaking planning and governance activities. Although this support is crucial, it is also costly. In the interest of financial sustainability, the countries should therefore develop their own institutional capacity in order to assess and prioritise projects that pursue their national goals.
Incorporating capacity building and the institutionalisation of best practices into national organisational cultures is challenging, especially at initial stages, due to insufficient human capital. To overcome the challenge of finding qualified candidates, authorities could organise training courses, develop manuals and best-practice procedures and establish professional associations. Establishing information portals for the stakeholders can help to accelerate capacity building. States can work in close collaboration with research institutions and learn from the international experience when designing new legislation and policies.
Countries could first aim to improve the basic aspects of planning and governance, without which the adoption of advanced and sophisticated practices might bring more costs than actual benefits. The use of modern technologies and automation can help improve the quality and efficiency of planning and governance by reducing bias and providing more transparency to the public and all stakeholders involved. The automatic measurement of border crossing times, and displaying this information in real time on a dedicated web-page, is an example of such an improvement.
Support decision-making with quantitative and qualitative tools and models
A lack of data prevents effective planning in Central Asia. To support more informed decision-making, countries should introduce standards for data collection and ensure continued data collection, updates and sharing between relevant actors. Logistics observatories established at national and regional levels can serve as data collection and processing centres. Their key activities could include data collection, analysis, dissemination and benchmarking for policy support. This will foster confidence in the data and
TRANSPORT PLANNING AND GOVERNANCE FOR BETTER CONNECTIVITY
128 ENHANCING CONNECTIVITY AND FREIGHT IN CENTRAL ASIA © OECD/ITF 2019
produced analysis and promote dialogue among stakeholders. In the longer term, observatories could broaden their activities to include information pooling and synthesis, publication of flagship reports, research and the organisation of public events
Quantitative models should be used for forecasting traffic. The forecasts generated by these models should be taken into account in transport planning, project selection, asset management and other sub-dimensions of planning and regulation. Countries should enhance their collaboration with research institutes and support them in building their own capacity and learning from international best practices.
Cost-benefit analysis (CBA) and multiple-criteria analysis (MCA) should be widely applied to support more informed decision-making. These tools bring structure, rationality, and transparency to the project selection and prioritisation process and, therefore, to strategic policy choices. In order to maximise its potential value, CBA and MCA should include external costs (e.g. local pollution, congestion, road safety) and, in the case of very large projects, wider economic benefits such as agglomeration impacts. In the case of large transportation projects, analyses should be complemented by an assessment of the nature and magnitude of expected economic impacts.
Strategies and other planning frameworks should also account for risks and uncertainties. This includes the identification, assessment and treatment of risks and uncertainties. Building and testing plausible scenarios should help to design more robust policies and to prepare for the uncertain future and growth. To reduce the risk of policies and regulations not being accepted by public and concerned stakeholders, the opinions of those should be collected and taken into account while developing the strategies. The ability to adapt to uncertainties is enabled by flexible planning procedures within long-term strategic planning frameworks. In addition, it is critical for Central Asian countries to integrate the concepts of resilience and vulnerability into their planning processes. Transport assets that systematically integrate such considerations can reduce potential uncertainties around supply shocks and the temporary unavailability of infrastructure.
Stimulate co-operation among national bodies and involve the private sector and
general public
Insufficient co-operation and coordination between various authorities, as well as between the public and private sectors at the national level, is also an issue. There is evidence of a lack of trust and reticence to share information. Road and railway agencies do not work closely together, and no administrative body in charge of multimodal transport planning exists. The lack of common frameworks for project selection and implementation means that the strategies of different sectors are not always aligned with each other and with national objectives.
Countries are developing co-operation between the public and private sector through public-private partnerships (PPP), joint capacity building, and working groups on regulation and planning. For example, Kazakhstan used the PPP format to build a network of traffic cameras in Astana. In Mongolia, the Erdenet–Ovoot railway project was started in 2015 with a build-operate-transfer PPP concession agreement. In Kyrgyzstan a law regarding PPP was adopted a few years ago, although it has yet to be applied in the transport sector. All five countries organise working groups, with stakeholders including the private sector, when discussing new policy frameworks and strategies. However, representatives of the logistics sector, shippers and forwarders are often missing in such meetings.
Establishing common frameworks across different agencies within the transport sector and outside of it can optimise the policy-making process and make it more transparent. For example, Uzbekistan has advanced significantly in developing common (across different sectors) frameworks for project selection,

TRANSPORT PLANNING AND GOVERNANCE FOR BETTER CONNECTIVITY
ENHANCING CONNECTIVITY AND FREIGHT IN CENTRAL ASIA © OECD/ITF 2019 129
implementation and public procurement by establishing the National Project Management Agency under the President. The mission of this public institution is to boost the efficiency and secure transparency of national and regional programs as well as investment projects throughout the country. The other countries of the region are recommended to consider establishing a similar body or, at least, developing and adopting a common framework for project selection and implementation across different sectors.
Governments should explore benefits and make use of public-private partnerships when they make economic sense. The main advantage of PPP over traditional procurement procedures is cost efficiency. However, PPPs are successful only if there is a constant pressure for efficiency. Therefore, governments should make sure that private companies engaged in PPPs will be subject to sufficient competition throughout the entire project lifespan. Central Asian countries should consider adopting the International Public Sector Accounting Standards (IPSAS 32) to maximise the value for money of private investments. Strategic alliances could serve to further stimulate innovations in the efficiency of infrastructure projects.

TRANSPORT PLANNING AND GOVERNANCE FOR BETTER CONNECTIVITY
130 ENHANCING CONNECTIVITY AND FREIGHT IN CENTRAL ASIA © OECD/ITF 2019
References
Abbott, M., and Cohen, B. (2017). “Vertical integration, separation in the rail industry: a survey of empirical studies on efficiency.” European Journal of Transport and Infrastructure Research, 17(2).
ADB (2018a). Kazakhstan accelerating economic diversification.
ADB (2018b). Compendium of Best practices in road asset management.
Flyvbjerg, B. (2008). Curbing Optimism Bias and Strategic Misrepresentation in Planning: Reference Class Forecasting in Practice. European Planning Studies, 16:1, 3-21, Doi: 10.1080/09654310701747936
Cantos, P., Pastor, J.M., and Serrano, L. (2010). “Vertical and horizontal separation in the European railway sector and its effects on productivity.” Journal of Transport Economics and Policy, 44(2), 139–160.
Lyons, G., MacDonald, M., Cragg, S., Neil, M. (2018). “Embracing uncertainty and shaping transport for Scotland’s future.” European Transport Conference 2018. Available on: https://aetransport.org/en-gb/past-etc-papers/conference-papers-2018?abstractId=5915&state=b.
Drew, J. (2009). “The benefits for rail freight customers of vertical separation and open access.” Transport Reviews, 29(2), 223-237.
Gómez-Lobo Echeñique, A. (2012), The ups and downs of a public transport reform: the case of Transantiago, Serie Documentos de Trabajo.
Federal Highway Administration, FHWA (2007). "Asset Management Overview".
Flyvbjerg, B., Bruzelius, N., Rothengatter, W. (2008). Megaprojects and Risks: An Anatomy of Ambition. University Press, Cambridge.
Hurley, John, Scott Morris, and Gailyn Portelance. Examining the debt implications of the Belt and Road Initiative from a policy perspective. CGD Policy Paper 121 (2018).
Lyons, G. (2018). “Handling uncertainty in transport planning and decision making - Report of a roundtable discussion held in London on 20 July 2018.” Project Report. UWE Bristol. Available from: http://eprints.uwe.ac.uk/37926
Haider, M., Ewing, G., Patterson, Z. (2008). “Freight data collection methods, a review of existing methods.” Available on: http://citeseerx.ist.psu.edu/viewdoc/download?doi=10.1.1.494.2189&rep=rep1&type=pdf
ITF (2016a). Logistics Observatory for Chile: Strengthening Policies for Competitiveness.
ITF (2016a). Logistics Strategy and Performance Measurement Mexico’s National Observatory for Transport and Logistics.
ITF (2018a). Private Transport Infrastructure Investment: Dealing with Uncertainty in Contracts.
ITF (2018b). Innovation and Technology in Multimodal Supply Chains.
ITF (2018c). Road Safety. Annual Report.
TRANSPORT PLANNING AND GOVERNANCE FOR BETTER CONNECTIVITY
ENHANCING CONNECTIVITY AND FREIGHT IN CENTRAL ASIA © OECD/ITF 2019 131
Mizutani, F., Uranishi, S. (2012). “Does vertical separation reduce cost? An empirical Analysis of the rail industry in European and East Asian OECD Countries.” Journal of Regulatory Economics, 43, 31-59.
OECD (2017a), "Investment promotion and facilitation in Kazakhstan", in OECD Investment Policy Reviews: Kazakhstan 2017, OECD Publishing, Paris, https://doi.org/10.1787/9789264269606-10-en.
OECD (2017b). Gaps and governance standards of public infrastructure in Chile. OECD Publishing, Paris
OECD (2018a). “Transport policy and performance in South East Europe”, in Competitiveness in South East Europe: A Policy Outlook 2018, OECD Publishing, Paris. Doi: https://doi.org/10.1787/9789264298576-16-en
OECD (2018b). The Fourth Round of Monitoring of the Istanbul Anti-Corruption Action Plan for Uzbekistan. АCN, Anti-Corruption Network for Eastern Europe and Central Asia. Available on: https://www.oecd.org/corruption/acn/OECD-ACN-Uzbekistan-Progress-Update-2018-ENG.pdf
OECD (2018c), OECD Business and Finance Outlook 2018, OECD Publishing, Paris, https://doi.org/10.1787/9789264298828-en
de Dios Ortuzar, J. and Willumsen, L.G., (2011). Modelling transport. John Wiley & Sons.
Prentice, B. E. (2003). “Importance of intermodal connectivity and bottleneck elimination." Crossing Borders: Travel, Trade, Security and Communication (Traverser les frontieres: voyage, commerce, securite et communication), Canadian Transportation Research Forum, Proceedings of the 38th Annual Conference Canadian Transport Research Forum.
Rastogi, C. and Arvis, J.-F. (2014). The Eurasian Connection Supply-Chain Efficiency along the Modern Silk Route through Central Asia. The World Bank, Washington DC.
Shepherd, B., Serafica, R. B., Bayhaqi, A., & Jing, H. (2011). “The trade impact of enhanced multimodal connectivity in the Asia-Pacific Region.” Journal of Economic Integration, 624-650.
UNEP (2009). Sub-regional sustainable development strategy for Central Asia.
UNICE (2018). TIR Carnet Prices. Available on: https://www.unece.org/tir/tircarnetprices.html
The Ministry of National Economy of the Republic of Kazakhstan (2016). Evaluation of the State Program for the Development and Integration of the Infrastructure of the Transport System of the Republic of Kazakhstan until 2020. Available on: http://economy.gov.kz/sites/default/files/pages/ocenka_gosudarstvennoy_programmy_razvitiya_i_integracii_infrastruktury_transportnoy_sistemy_respubliki_kazahstan_do_2020_goda.docx
Zembri-Mary, G. (2017.) “Planning transport infrastructures in an uncertain context. Analysis and limits to contemporary planning in France.” European Transport Research Review 9:51. https://doi.org/10.1007/s12544-017-0266-4
KEY RECOMMENDATIONS
ENHANCING CONNECTIVITY AND FREIGHT IN CENTRAL ASIA © OECD/ITF 2019 132
5. Key recommendations
Most of the recommendations presented in the previous chapters can be applied to all or most of the five focus countries. However, the countries are different in terms of their economic capacity, landscape, geography, history, and other characteristics. Kazakhstan is currently the regional leader with respect to economic and technological development. Rich in natural resources, it has a vast territory and a relatively small population with sporadic settlements. Uzbekistan is a state with high density of population, steadily growing. The country is opening up, with major reforms being undertaken in all sectors, including transport. Tajikistan and Kyrgyzstan have suffered from civil war (Tajikistan) and political unrest (Kyrgyzstan) and have challenging landscapes with mountainous terrain. Mongolia has a large territory with the least dense population, with almost half of it living in the capital; the country was strongly connected with the former Soviet Union, yet, unlike the others, it does not share a common history in terms of being part of the same country and of having an integrated transport network.
These geographical and historical distinctions have strongly influenced the existing transport infrastructure and countries’ ability to develop it, financing capacity for rehabilitation and maintenance, and ability to attract and effectively use investments. Therefore, in addition to general recommendations that apply to all countries, this chapter also provides country-specific recommendations. The chapter also summarizes recommendations for the countries on regional and international cooperation; as such cooperation is essential for maximising the benefits of infrastructure development and soft policy measures.
Strengthening international and regional co-operation to enhance
connectivity
The Central Asian countries have been strengthening their international co-operation at different levels over recent years. All except Uzbekistan are members of the World Trade Organisation (WTO), and Uzbekistan is an observer and intends to join it. The countries are also members of transport- and customs-related international organisations and agreements such as the International Road Transport Union (IRU) and its TIR-Cornet systems for road transport, the Organization for Co-operation of Railways (OSJD), the Eurasian Customs Union (Kazakhstan and Kyrgyzstan), the European Agreement concerning the Work of Crews of Vehicles Engaged in International Road Transport (AETR), and the ITF (Kazakhstan). Further, countries are members of development programs such as CAREC and international organisations including the UN and the Organization for Security and Co-operation in Europe (OSCE). All countries except Mongolia are members of the Organisation of Islamic Co-operation (OIC), the Commonwealth of Independent States (CIS) and the Shanghai Co-operation Organisation (SCO), where Mongolia is an observer. Finally, Kazakhstan and Kyrgyzstan are members of the Eurasian Economic Union (EAEU), which implies special agreements regarding trade, transport and border crossing.
Despite progress in regional and international co-operation, barriers and challenges remain at different levels: among trade partners and on the global level, among countries in the region, among the public and private sector, and among governmental bodies within each country.
Partly due to lack of co-operation within the region, the share of intra-regional trade is only around 5% of total trade. Typical of the co-operation and harmonisation problems in the region is that countries have

KEY RECOMMENDATIONS
ENHANCING CONNECTIVITY AND FREIGHT IN CENTRAL ASIA © OECD/ITF 2019 133
not only different standards for the maximum weight and axle loads of heavy goods vehicles, but also different formal procedures and rules for entering and crossing the country. The situation is complicated by the substantial border crossing time, which is especially long due to queuing. Some borders still do not have official demarcation (e.g. between Kyrgyzstan and Tajikistan). Currently, transit by road through the territory of Kyrgyzstan is prohibited for Tajik vehicles. Additionally, lack of timely and easily accessible information for shippers, hauliers, and government representatives on changes in shipment regulations, tariffs and temporary bans for certain commodities makes the regional actors vulnerable to market fluctuations and less competitive at the international level.
Improving connectivity only inside the region is not sufficient. Because Central Asian countries are on the route between China and Europe, and between Russia and the South, issues along the entire route can negatively impact connectivity across the entire region. Issues include the imbalance between the cargo volumes transported in each direction, bottlenecks in infrastructure and at border-crossing points, technical problems, and administrative and legal barriers created by differences in countries’ legal systems and insufficient co-operation. Europe ships by road and rail to China almost two times less than comes in the opposite direction (ITF International Freight Model). Currently the Belarus-Poland border crossing point is the narrowest bottleneck on the China-Europe railway routes, with the Polish side being unable to process sufficient number of trains per day due to infrastructure and fleet constraints (Lobyrev et al., 2018). While Poland and the European Union are currently investing into the expansion of the border crossing point, with the constantly growing traffic full elimination of the bottleneck might be challenging. Technical barriers such as different railway gauges across the countries and differences in the maximum allowed length of trains (whereby the maximum allowed train length in China, Central Asia, Russia and Belarus is longer than in the EU) serve to reduce railway connectivity as it delays movements of the trains.
On the international level, a lack of harmonisation of standards and legislation, the insufficient enforcement of some agreements by national authorities, political and economic sanctions between countries, and political instability in some neighbour countries (such as Afghanistan) are challenges which impede the development of trade and connectivity and contribute to future uncertainty.
While the countries are members of numerous international agreements and unions related to transport, not all the agreements are implemented and enforced. Some of the agreements obsolete and others bring confusion when applied together. There is no strong mechanism for overseeing the implementation of the conditions and requirements of international agreements and conventions, except for the TIR Convention.
Governments should continue to harmonise freight-related standards (e.g. maximum weight and axle loads for heavy vehicles, train length) and related legislation. Common standards should also apply to data collection and sharing as well as to administrative procedures related to road and rail haulage. Countries should also consider sharing long-term railway and road traffic forecasts for corridors in order to improve the assessment of policy needs for better connectivity.
The countries should continue developing regional agreements aimed at formalising the regional rail, road and dry ports networks as parts of an integrated network. Countries should also ensure the enforcement of international agreements at the national level. International agreements may not be specific enough to enable their enforcement and direct application at the country level. When this is the case, governments should develop legislation or regulations to clarify the rights and obligations of different actors with respect to the implementation of international agreements. Executive bodies should also receive detailed directives allowing them to enforce the agreement. Finally, the countries should consider establishing oversight bodies and adopting corresponding mechanisms to ensure

KEY RECOMMENDATIONS
134 ENHANCING CONNECTIVITY AND FREIGHT IN CENTRAL ASIA © OECD/ITF 2019
intergovernmental supervision of the implementation and application of the agreements and related guarantees. In order to ensure transparency for the participating countries and public, adoption of a mechanism of reporting to an intergovernmental oversight body should be considered.
In the cases of cabotage and transit, sometimes it may be difficult for a country to apply agreements and to control their enforcement due to contradicting bilateral agreements. Efforts should be made to either bring the bilateral agreements in compliance with each other, or to sign multilateral agreements. Outdated agreements should also be updated and re-ratified if the countries continue to have an interest in enforcing them.
Kyrgyzstan and Tajikistan should consider working on bilateral agreements to agree the border demarcation, as well as cabotage and transit rules and standards.
Key recommendations for Tajikistan
There is a need for greater strategic prioritisation of infrastructure funds
Supporting facts
Tajikistan has significantly increased the amount of funding dedicated to transport infrastructure and has set ambitious investment targets for the 2016-2030 period. There may, however, be a need for greater strategic prioritisation of these funds.
The financial effort required to fulfil this infrastructure plan might be unsustainable. In its State task program of the Republic of Tajikistan transport complex development until 2025 (the country’s transport masterplan), Tajikistan’s Ministry of Transport is considering an investment program of over USD 9 billion over a 15-year period, including road, railways and airport infrastructure investments. This amounts to more than 15% of the country’s annual GDP and greatly exceeds the current level of spending (2%), as well as spending levels observed in similar countries (averaging 2.5% in the developing world).
Furthermore, the transport strategy does not provide any ranking or assessment that could be used to prioritize projects. The contribution of infrastructure projects to key transport policy goals, their value for money (measured in terms of the net present value of a project’s benefits and costs), as well as their alignment with other strategic documents, such as the National Development Strategy, are not explicitly assessed. It is therefore difficult to evaluate how well infrastructure projects will serve the country’s current and future economic needs. Perhaps as a result of this, the global portfolio of national projects seems to be unbalanced. For instance, over 60% of total investment is devoted to railways, despite the fact that road traffic is growing at a rapid pace and the modal share of rail is falling. The number of truck-kilometres travelled in the country has been increasing by 6% per year over the last decade. The modal share of rail has fallen from 30% in 2006 to 6% in 2016. Given that diversifying the economy is high on the Tajik political agenda, the demand for road freight transport is likely to grow further in the coming years.
Despite ambitious investment plans, maintenance budgets remain low. Although the road conditions in the country would necessitate greater-than-average spending on road maintenance, foreseeable road maintenance spending is in fact significantly lower than international levels. While middle-income countries spend on average 0.75% of their GDP per year on road maintenance, Tajikistan spends less than 0.5%. There is also a significant backlog of maintenance on the road network. The Asian Development Bank (ADB, 2011) estimated that 80% of the roads in Tajikistan are in very bad condition, with much of the road network beyond repair. Insufficient maintenance has proved especially costly for

KEY RECOMMENDATIONS
ENHANCING CONNECTIVITY AND FREIGHT IN CENTRAL ASIA © OECD/ITF 2019 135
Tajik government. About USD 1 billion worth of road assets were lost between 1990 and 2010. Insufficient maintenance has also been costly for the Tajik economy. Over 50% of the road network is rated at an average international roughness index (IRI) of over 7 m per km, which results in lower travel speeds, increased fuel consumption, and higher vehicle operating costs.
Possible measures to implement
Update the transport masterplan by:
Using robust analytical tools, such as computerized transport models built on reliable data, to identify capacity improvement needs;
Establishing a prioritized pipeline for project preparation based on technical and economic criteria rather than political agendas;
Reconsidering the balance between investment and maintenance spending.
These measures could be accomplished through the use of an advanced project selection methodology. This methodology should take into account a project’s likely impact on domestic and international traffic, the benefits it will bring to different regions and companies, and how costs and benefits will be distributed among relevant stakeholders. The selection procedure would ideally include data collection, the use of a mathematical model representing transport demand and supply, and cost-benefit analysis.
Create a road fund.
There is a need for stable funding flows dedicated to road maintenance that advocate for the creation of a road fund. Experiences in developing countries have shown that a road fund can be a useful tool if following some guiding principles. A road fund should have a strong legal basis, act as an independent authority and have in-house technical capacity. Additionally, investment and maintenance should be allocated on separate budgets, as there is ample evidence of a systematic bias against maintenance. The fund should be covered by road user charges that reflect the marginal cost of road use rather than through general taxation.
Improve the connection to China via the Kulma pass
Supporting facts
Although it falls outside of international transport corridors and in particular outside of the CAREC program, the road connecting Duchanbe to the Kulma Pass is heavily used for international road freight. The connection could be improved through infrastructure upgrades and the provision of new road facilities.
The Kulma pass is the only border crossing point between Tajikistan and China. At an elevation of over 3 700 meters, it is a remote location characterised by extreme weather. In winter, the border crossing point typically operates three days per week despite the fact that it constitutes the most direct road link between Tajikistan and the Xinjiang Autonomous Region of China. Tajik trucks that do not cross at this point must access China through Kyrgyzstan, which entails additional border crossings, delays and costs.
The road currently connecting Dushanbe and the Kulma pass is 850 km long, two-thirds of which traverses mountainous terrain. The road is in poor condition overall, which slows driving speeds. The average truck speed between the Kulma Pass and Darvoz is less than 25 km/h (ITF computations based on CPMM data (ADB, 2014)). Local interviews also revealed safety concerns. Most road sections are characterized by a gravel surface that is not suited for heavy duty trucks or for driving in snowy conditions. The geometry of the road needs to be better adapted for international traffic. Currently the
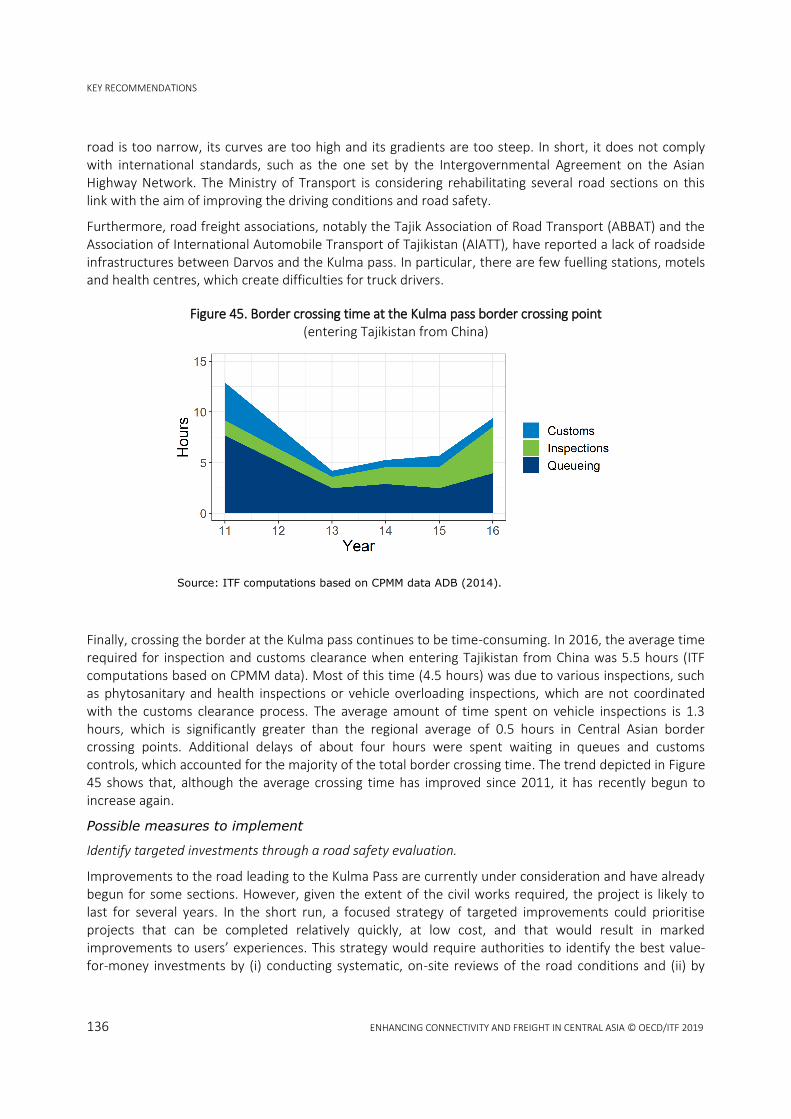
KEY RECOMMENDATIONS
136 ENHANCING CONNECTIVITY AND FREIGHT IN CENTRAL ASIA © OECD/ITF 2019
road is too narrow, its curves are too high and its gradients are too steep. In short, it does not comply with international standards, such as the one set by the Intergovernmental Agreement on the Asian Highway Network. The Ministry of Transport is considering rehabilitating several road sections on this link with the aim of improving the driving conditions and road safety.
Furthermore, road freight associations, notably the Tajik Association of Road Transport (ABBAT) and the Association of International Automobile Transport of Tajikistan (AIATT), have reported a lack of roadside infrastructures between Darvos and the Kulma pass. In particular, there are few fuelling stations, motels and health centres, which create difficulties for truck drivers.
Figure 45. Border crossing time at the Kulma pass border crossing point (entering Tajikistan from China)
Source: ITF computations based on CPMM data ADB (2014).
Finally, crossing the border at the Kulma pass continues to be time-consuming. In 2016, the average time required for inspection and customs clearance when entering Tajikistan from China was 5.5 hours (ITF computations based on CPMM data). Most of this time (4.5 hours) was due to various inspections, such as phytosanitary and health inspections or vehicle overloading inspections, which are not coordinated with the customs clearance process. The average amount of time spent on vehicle inspections is 1.3 hours, which is significantly greater than the regional average of 0.5 hours in Central Asian border crossing points. Additional delays of about four hours were spent waiting in queues and customs controls, which accounted for the majority of the total border crossing time. The trend depicted in Figure 45 shows that, although the average crossing time has improved since 2011, it has recently begun to increase again.
Possible measures to implement
Identify targeted investments through a road safety evaluation.
Improvements to the road leading to the Kulma Pass are currently under consideration and have already begun for some sections. However, given the extent of the civil works required, the project is likely to last for several years. In the short run, a focused strategy of targeted improvements could prioritise projects that can be completed relatively quickly, at low cost, and that would result in marked improvements to users’ experiences. This strategy would require authorities to identify the best value-for-money investments by (i) conducting systematic, on-site reviews of the road conditions and (ii) by
KEY RECOMMENDATIONS
ENHANCING CONNECTIVITY AND FREIGHT IN CENTRAL ASIA © OECD/ITF 2019 137
identifying and analysing black spots, i.e. locations where a high number of accidents occur. The typical practice of road safety inspections is common in many OECD countries and is gradually being applied in developing countries. Several best-practices guides have been produced by international organisations, such as the World Road Association (PIARC, 2012).
Key recommendations for Kyrgyzstan
There is a need to improve the efficiency and quality of road transport companies
operating in the domestic market
Supporting facts
The road freight sector is essential for the Kyrgyz economy. The Kyrgyzstan has developed a significant economy around large bazaars, in particular the Dordoi market in Bishkek and the Karasu market near Osh. These Bazaars are mainly wholesale markets that serve as re-export platforms that consolidate goods from China and send them to other Central Asian countries. This generates significant, yet partly informal, logistics activities. Although the global weight of the Bazaar economy is unknown, it represents 10% of the labour force in Bishkek (Saumya Mitra et al. 2009). The bazaar economy heavily depends on shuttle trading through unlicensed operators using light-duty vehicles.
The road sector in Kyrgyzstan is loosely regulated. Any company can operate on the market provided it follows the general commercial code. Unlike most countries around the world, including emerging economies, market entry is not subject to any considerations of professional qualifications. Although some technical regulations exist (with respect to working hours, vehicle safety standards and axle-load limitations), these are enforced mainly on the international market as inspections are only usually carried out near customs border points. Authorities report that domestic trucks are often overloaded, which accelerates road deterioration. Local interviews have also indicated that companies operating on the domestic market do not always comply with international standards regarding safety, operational efficiency and environmental impacts.
This gap in regulation has given unlicensed domestic operators an unfair competitive advantage over international operators, which has hindered the development of higher-quality services in the domestic market. Very few trucking companies have developed specialised services such as refrigerated transport. Road transport companies tend to be small (a large proportion are one-person operations) and operate with old vehicles. Although no official figure is available, local interviews indicate that there are usually 2 employees per company, versus 3.5 in Eastern European companies. Limited company size means there is little room for the optimisation of operations through shipment consolidation. The average truck is over 10 years old, which implies higher fuel and maintenance costs.

KEY RECOMMENDATIONS
138 ENHANCING CONNECTIVITY AND FREIGHT IN CENTRAL ASIA © OECD/ITF 2019
Figure 46. Heavy duty truck age and number of employees per road transport company in Kyrgyzstan
Finally, policy-makers need a better understanding of the road sector to identify productivity gains and design appropriate regulations. There is very limited data on the trucking industry because it is heavily fragmented and largely informal. In particular there is no information on the cost structures of companies, and very little is known about the geography of traffic flows.
Possible measures to implement
More regulation and enforcement are needed for the road freight sector. Given the essential role it plays in the Kyrgyz economy, a step-by-step approach is recommended. The Kyrgyz government should work in close relationship with all industry stakeholders. The following measures could be considered:
Progressively implement a licensing system for domestic trucks – subject to professional qualification, the stability of the commercial activity, a good business reputation and an appropriate financial standing – inspired by existing regulations in Europe.
Increase enforcement, especially for weight regulations. This could be achieved by (i) acquiring ‘weigh-in-motion’ equipment and implementing periodic anti-overloading campaigns and (ii) increasing the penalties for overloaded trucks and repeat offenders.
Develop and implement training programmes for road transport companies as well as for third-party logistics providers.
Key recommendations for Uzbekistan
The central administration has limited institutional capacity
Supporting facts
Transport infrastructure in Uzbekistan is currently owned and maintained directly by two joint-stock companies. The State Committee for Roads (SCR) (former Uzatoyul) manages 40 000 km of national and regional roads, which constitutes about 20% of the total network (the rest being under the responsibility
KEY RECOMMENDATIONS
ENHANCING CONNECTIVITY AND FREIGHT IN CENTRAL ASIA © OECD/ITF 2019 139
of local authorities). Uzbekistan Temir Yollar (UTY) manages the country’s railway system and is also the national rail carrier. Both companies are large monolithic organisations that lack transparency and are poorly understood by policy-makers.
In the road sector, the Republican Road Fund (RRF), created in 2003 and hosted by the Treasury of Uzbekistan, is responsible for planning regarding road investments, implementing projects, and managing the finances of road construction and maintenance activities (Decree of the President UP-3292). The RRF works under the Cabinet of Ministers and is responsible for allocating budgets to the SCR. It also acts as a client for major road works on international and national roads. In practice, the RRF possesses limited resources in term of staff, employing around 60 people in 2016. It has difficulty in carrying out its responsibilities as the client of large construction projects, and it possesses limited in-house civil engineering expertise. In this respect, the RRF tends to rely on the SCR, which remains the more technically competent body (ADB, 2015). According to the ADB, this unclear separation of roles has created friction between the organisation and helps to explain why the road asset management system is not fully operational. In 2017 Uzbekistan separated the two functions between the agencies, leaving the road maintenance planning function to the CSR and the actual implementation of road maintenance and repair to the newly formed unitary enterprises under the Committee’s Directorate for Construction and the RRF. However, the project planning and contracting has not been fully separated.
Finally, a multimodal vision for the transport sector has yet to be developed. Coordination between CSR and UTY and between these companies and the central administration is limited. Neither a dedicated long-term transport strategy nor an administrative body in charge of multimodal transport planning exists today. Until recently the sector was coordinated directly by the Cabinet of Ministers. A Ministry of Transport was created in Uzbekistan in February 2019 with the aim of transforming the administration and regulation of transport and the roads. The Ministry oversees the development and regulation of civil aviation and air transport, railroads, river, rail and land transport. It also regulates policies to strengthen country’s connectivity. It groups several existing institutions: the Road Committee; the Agency on Civil Aviation (CAA); the Inspectorate on safety of the railroads; the Inspectorate on the quality of roads construction; the River transport register; and Uzairnavigation Centre.
Recommendations
Strengthen the capacity of the government to strategically guide the transport sector.
The creation of the new Ministry for transport is a unique opportunity for Uzbekistan to:
Create a proper planning body responsible for all modes of transport and for the development of a long-term planning transport strategy;
Increase its control over the SCR and UTY by creating a dedicated unit in charge of their oversight and auditing, either directly in the newly created ministry or in an independent entity; and
Reorganise road network management by separating the planning and funding functions from the project contracting functions. Project contracting could be handled directly by the SCR, which would then become a full-fledged road agency.
Efficiency gains could be achieved through railway reform
Supporting facts
Uzbekistan Temir Yollar (UTY) has maintained solid technical and operational expertise. The company is profitable, does not rely on subsidies for operation, and is able to fund part of the investments necessary

KEY RECOMMENDATIONS
140 ENHANCING CONNECTIVITY AND FREIGHT IN CENTRAL ASIA © OECD/ITF 2019
to preserve the current infrastructure and modernize its rolling stock (ADB, 2012). It has also successfully managed to build and operate a high-speed train system between Samarkand and Tashkent.
Nevertheless, potential exists for improved productivity. Given the size of their network and the volume of traffic they are dealing with, the workforce of the Uzbek railways is too large. The labour productivity is currently 500–600 thousand traffic units per employee. This is 20% lower than that of neighbouring Turkmenistan Railways and much lower than productivity in Kazakhstan, where there are 3.2 million traffic units per operating employee. It is also considerably lower than the labour productivity observed in Russia, China and India (see Chapter 3, Figure 36). The rolling stock in the country is also ageing. According to ADB, a large proportion of the wagon fleet (nearly 90%) will need to be replaced in the coming decade.
The accountability of the company should also be improved. The reporting provided to the finance ministry is limited to aggregated figures and the practice of cross-subsidisation makes it difficult to assess the competitiveness of specific activities. In practice UTY is subject to limited oversight from the government, which has no unit dedicated to supervising the activities undertaken by UTY and providing strategic guidance.
Recommendations
Consider railway reform to unbundle the sector. It could include:
The outsourcing of non-core activities (in particular social services) and the separation of core activities into separately managed units.
The establishment of more transparent reporting rules. International best practice is followed using the R-1 form of the U.S. Surface Transportation Board (STB), which is filed by every Class I (large) U.S. freight railway (STB, 2018). The R-1 form requests a wide range of financial information as well as employment, wage and salary, tariff, commodity and operational indicators.
The opening of the market to private railway operators to increase the capacity of railways and enhance productivity. This will require the creation of a regulator to ensure non-discriminatory access to rail facilities for private operators.
Key recommendations for Mongolia
There is a need for more transport investments in growing Aimags
Supporting facts
In Mongolia, most of the population and economic growth occurs in three areas: the capital city of Ulaanbaatar, the mining regions located in the south Gobi Desert, and in the north. The population is increasingly migrating to these regions in search of employment. ITF computations based on GIS data from (Kummu et al., 2018) indicate that only three Aimags and the capital city accounted for approximately 70% of the total GDP in 2015. Between 2010 and 2015, the average population and economic growth rates in these regions ranged between 9.7% and 7% per year respectively.
This trend could prove to be beneficial for the country. The concentration of people and firms in a few key areas has the potential to generate significant economic growth through agglomeration economies. Alone, however, this will not be sufficient. Economic research suggests that only well-managed and well-connected cities are able to support sustained economic growth, as they allow a country to enjoy

KEY RECOMMENDATIONS
ENHANCING CONNECTIVITY AND FREIGHT IN CENTRAL ASIA © OECD/ITF 2019 141
agglomeration economies while mitigating the associated costs (OECD, 2016). In particular it requires significant investments in urban transport infrastructure within cities to tackle congestion problems, as well as an efficient inter-urban transport network connecting major cities.
Figure 47. Investments in roads by location in Mongolia (%)
Figure 48. Aimags’ GDP between 1995 and 2015
However, transport investments in Mongolia do not reflect the importance of urban and inter-urban networks. Between 2007 and 2011, over 60% of Mongolian road investments targeted regions outside of the main centres of economic activity as part of a national policy to connect aimags with paved roads. Major hubs of economic activity, meanwhile, suffer from an inadequate supply of infrastructure, which hampers their economic development. Ulaanbaatar’s heavy traffic congestion, comparable to that of Mexico, reflects this under-provision. An analysis conducted by the ITF ranked Ulaanbaatar as one the

KEY RECOMMENDATIONS
142 ENHANCING CONNECTIVITY AND FREIGHT IN CENTRAL ASIA © OECD/ITF 2019
most congested cities in the world (OECD/ITF, 2017) with a congestion index of nearly 1. This means that at the peak hour, travel times are nearly doubled due to congestion. This is high, especially for a city of this size (1.4 million people). In OECD countries, cities of 1 to 2 million inhabitants have an average congestion index of 0.5. Note that several solutions are under examination to deal with the Ulaanbaatar city’s heavy traffic, such as the transfer of logistics terminals to a location outside the city or the development of mass transit public transport.
Recommendations
Invest more in economic centres and focus on best value-for-money investment in other regions.
While connecting rural areas is a valid policy objective, there may be more efficient ways of achieving this connectivity. International reports (for example, World Bank, 2013) point out that low-cost improvements in rural transport connectivity are feasible given that Mongolia’s terrain allows for relatively good driving conditions on gravel roads. Although this unpaved network is periodically disrupted due to bad weather conditions, it could be made passable in all weather conditions by targeting certain improvement priorities such as new bridges or culverts.
Note that the “Action Plan of the Government of Mongolia for 2016-2020” recognises the importance of developing the road network consistently with social needs and demand. Yet the practical consequences on processes to plan infrastructure needs be implemented.
Key messages for Kazakhstan
Planned investments will improve connectivity, but increased transit flows will be
a challenge
Supporting facts
Kazakhstan has made strides in improving its overall connectivity. Significant infrastructure investments have already been undertaken. The Khrogos dry port located on the border between China and Kazakhstan – a large logistic centre equipped to trans-ship containers because of the change in gauge – is alone an investment of over USD 3 billion. Transport infrastructures on international corridors have been largely upgraded. Several successful reforms have been conducted on the railways and on the road sector (see Chapter 4).
Yet there is still a significant disparity in connectivity levels between Kazakhstan and the most logistically-advanced countries, partly due to its landlocked situation. Because of higher transport costs to the main markets, Kazakhstan can access 50% less economic opportunities, as measured in terms of world GDP, than Germany, for example (see Chapter 2). This gap is partly explained by the remoteness of Kazakhstan from main economic centres. However, low-quality infrastructure, high transport costs and long border crossing times explain more than 60% of the gap. These characteristics affect the country’s ability to effectively integrate into global value chains.
Significant additional investments to foster connectivity are planned. Current investment plans will reduce the existing connectivity gap. They will foster connection with foreign markets and increase the economic opportunities accessible to local companies by 7%.
Kazakhstan has prioritised attracting transit traffic as an objective. Increased transit, however, will bring challenges along with benefits. By 2050, on international corridors, traffic could triple due to growing flows from China to Europe transiting through Kazakhstan. Dealing with such volumes, especially on

KEY RECOMMENDATIONS
ENHANCING CONNECTIVITY AND FREIGHT IN CENTRAL ASIA © OECD/ITF 2019 143
roads, will considerably increase maintenance costs. The increased financing required for transport infrastructure projects risks raising the country’s debts to unsustainable levels. Transit traffic will also be accompanied by negative consequences in terms of local pollution, congestion and road safety, issues that are already faced by Kazakhstan.
Recommendations
Select projects that foster connectivity rather than transit.
The main benefit of ongoing international infrastructure projects is to better connect Central Asia to foreign markets – not to attract transit traffic. When projects are appraised, however, their impact on connectivity is rarely quantified, whereas transit is always valued as a benefit. Appraisal methods should be expanded so that the connectivity impact becomes the main criterion of prioritisation. This would require conducting studies using geographic economy methodologies to understand how and to what extend lowering transports costs and time will benefit national economies. Such studies can also reveal whether and where international infrastructure projects may foster investments on main corridors.
Transit should cover its costs.
Although transport infrastructures are usually priced at the marginal costs of usage in order to maximise efficiency, here it is recommended that the full range of costs associated with this activity is taken into account. In particular investment, rather than just maintenance, should be covered. External costs, including road safety, local pollution and CO2 emissions, should be also accounted for. Aligning road and railway pricing with actual costs will require collecting new data and developing accurate cost models.
Consider what should be the role of private finance in infrastructure
Supporting facts
There is a growing interest in Kazakhstan for private financing through public-private partnerships (PPPs). Although the concession law, adopted in July 2006, only led to localised small-scale PPPs, the law on PPPs adopted in 2015, amended twice in 2016 and 2017, significantly increased the scope of PPPs. Three large-scale PPPs are currently under way: the Alamaty Ring road project (signed in 2018 for a total of USD 670 million), Almaty’s light-rail transit project (in bidding process at the time of writing; costs estimated at USD 240 million), and Alamaty railways bypass (under development at the time of writing; estimated cost at USD 297 million). Currently, although Kazakhstan has little experience in running large-scale PPPs, it has created the Kazakhstan Public-Private Partnership Centre, a national centre of research and expertise on the development of PPPs. It has a unified team of experts with knowledge and practical experience in the field of PPPs and focuses on research, examination and evaluation of the implementation of investment projects in the field of PPPs.
Recommendations
Value for Money should be the primary motive for involving private finance in transport infrastructure and operations.
Pursuing private finance with the purpose of obscuring the true public debt (the public debt accounting motive) risks side-lining the objective of increased efficiency. Ultimately this may lead to the political unsustainability of pursuing private finance in transport (and more generally). Introducing an accounting standard (like IPSAS32) neutralises the public debt accounting motive and allows one to pursue private finance on the merit only of improved value for money.
The use of PPP model should be targeted.

KEY RECOMMENDATIONS
144 ENHANCING CONNECTIVITY AND FREIGHT IN CENTRAL ASIA © OECD/ITF 2019
Policy makers were long unclear about the circumstances in which a PPP actually delivers value for money. ITF (2018) recently completed a major body of work that provides clear policy guidance on how to involve private finance in transport infrastructure and operations. The work, based on contributions by over 30 experts from OECD countries, has determined that for a PPP to deliver value for money it needs to be subject to continuous pressure for efficiency. This only occurs when the private partner bears the demand risk and the users can react strongly to service quality (i.e. are not captive). The basic case where this occurs is when there is competition between different providers or alternatives. An example for transport is airports which serve the same catchment area. The Public-Private Partnership Centre could be instrumental in setting national guidelines to assess whether a PPP is the appropriate methods to deliver a given project rather than traditional procurement.
Last-mile connectivity is a growing challenge
Supporting facts
National road networks that work as a feeder and distributor to international corridors should receive more attention. Road capacity will have to be increased substantially on links connecting oblast capitals with international corridors. ITF simulations show that several of them will not be able to cope with future traffic otherwise. For example, the growth in traffic around Astana and Pavlodar may require twice the infrastructure capacity currently available by 2050. Although additional studies would be required to conclude on actual investments needs, this illustrates the importance of domestic connectivity in the country.
Additionally, roads outside international corridors are poorly maintained, even on the national network. To address this issue, Kazakhstan is currently implementing a Road Asset Management System (RAMS). Kazakhstan road agency intends to perform regular data collection on the majority of its network, to set proper data management and control in place, and to carry out regular analysis. This has the potential to improve the efficiency of maintenance operations and ultimately the state of the network. However, it is important that the newly created RAMS is not treated as a stand-alone tool but is truly integrated into the decision-making process.
While rail transport provides the backbone for international freight transport, releasing its full potential requires intermodality between rail and road. An efficient connection of railway terminals to local businesses is crucial and will ultimately depend on the capacity of grouping shipments transported by trucks into full trains. Yet intermodality could be further developed by grouping logistics terminals. The historical development of railways in the country has encouraged substantial fragmentation of terminals: Kazakhstan has about 30 container terminals, all handling a small number of containers. Around 10 terminals are in the Almaty area, each handling at most 30 thousand twenty-foot equivalent units (TEUs) per year – corresponding to a train a day (Rastogi and Arvis, 2014). This is low by international comparison and given the cost of handling equipment. Consolidation would lower handling costs and facilitate the concentration of logistics services around terminals.
Recommendations
Set up a consistent and transparent process for project selection.
With increasing infrastructure needs and constrained public budgets, Kazakhstan needs to maximise the value for money of its transport investments. Improving the project selection, would allow the targeting of investments where they are most needed from a national perspective. A systematic appraisal process should be conducted to ensure that the project is financially viable and that it demonstrates value for money. In particular, cost-benefit analysis (CBA) should be conducted systematically for investments
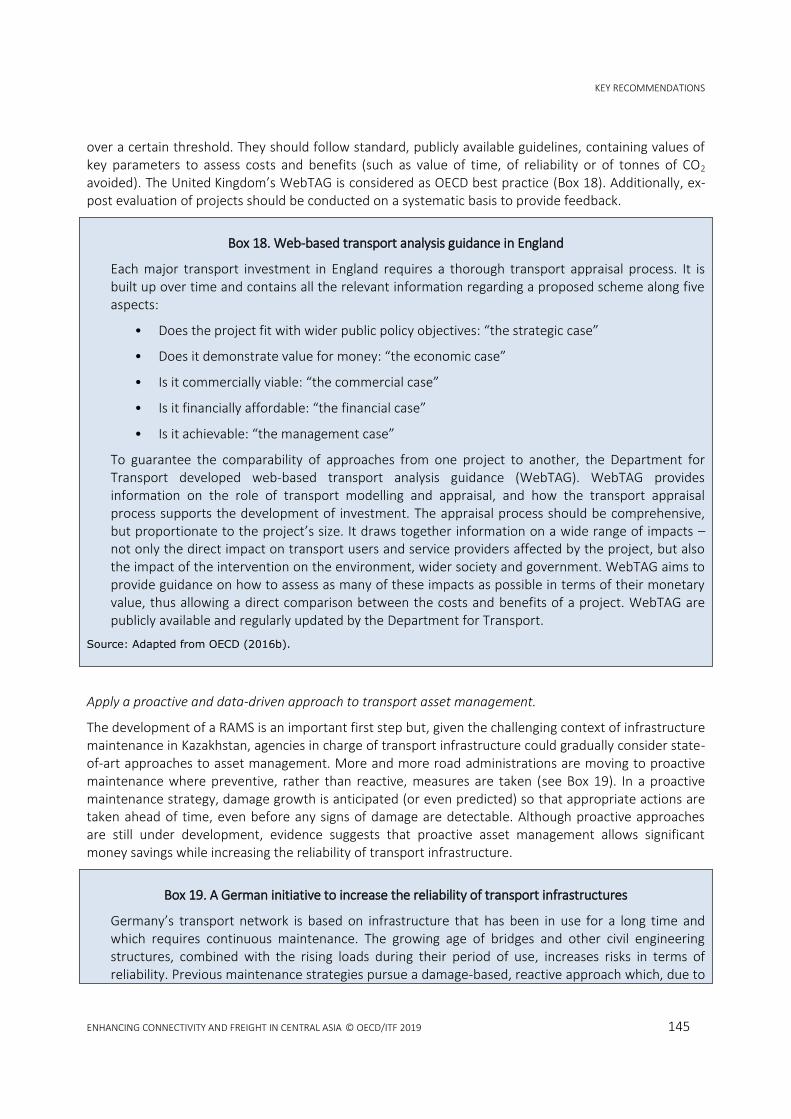
KEY RECOMMENDATIONS
ENHANCING CONNECTIVITY AND FREIGHT IN CENTRAL ASIA © OECD/ITF 2019 145
over a certain threshold. They should follow standard, publicly available guidelines, containing values of key parameters to assess costs and benefits (such as value of time, of reliability or of tonnes of CO2 avoided). The United Kingdom’s WebTAG is considered as OECD best practice (Box 18). Additionally, ex-post evaluation of projects should be conducted on a systematic basis to provide feedback.
Box 18. Web-based transport analysis guidance in England
Each major transport investment in England requires a thorough transport appraisal process. It is built up over time and contains all the relevant information regarding a proposed scheme along five aspects:
• Does the project fit with wider public policy objectives: “the strategic case”
• Does it demonstrate value for money: “the economic case”
• Is it commercially viable: “the commercial case”
• Is it financially affordable: “the financial case”
• Is it achievable: “the management case”
To guarantee the comparability of approaches from one project to another, the Department for Transport developed web-based transport analysis guidance (WebTAG). WebTAG provides information on the role of transport modelling and appraisal, and how the transport appraisal process supports the development of investment. The appraisal process should be comprehensive, but proportionate to the project’s size. It draws together information on a wide range of impacts – not only the direct impact on transport users and service providers affected by the project, but also the impact of the intervention on the environment, wider society and government. WebTAG aims to provide guidance on how to assess as many of these impacts as possible in terms of their monetary value, thus allowing a direct comparison between the costs and benefits of a project. WebTAG are publicly available and regularly updated by the Department for Transport.
Source: Adapted from OECD (2016b).
Apply a proactive and data-driven approach to transport asset management.
The development of a RAMS is an important first step but, given the challenging context of infrastructure maintenance in Kazakhstan, agencies in charge of transport infrastructure could gradually consider state-of-art approaches to asset management. More and more road administrations are moving to proactive maintenance where preventive, rather than reactive, measures are taken (see Box 19). In a proactive maintenance strategy, damage growth is anticipated (or even predicted) so that appropriate actions are taken ahead of time, even before any signs of damage are detectable. Although proactive approaches are still under development, evidence suggests that proactive asset management allows significant money savings while increasing the reliability of transport infrastructure.
Box 19. A German initiative to increase the reliability of transport infrastructures
Germany’s transport network is based on infrastructure that has been in use for a long time and which requires continuous maintenance. The growing age of bridges and other civil engineering structures, combined with the rising loads during their period of use, increases risks in terms of reliability. Previous maintenance strategies pursue a damage-based, reactive approach which, due to

KEY RECOMMENDATIONS
146 ENHANCING CONNECTIVITY AND FREIGHT IN CENTRAL ASIA © OECD/ITF 2019
the size of the problem, is no longer able to guarantee the availability of transport infrastructures to the required extent on a long-term basis. The Federal Ministry of Transport and Digital Infrastructure (BMVI) is therefore seeking to supplement it with risk-based procedures and behaviour models, which also incorporate the damage that is not (yet) visible.
In 2016, seven departmental research facilities and executive agencies of the BMVI formed a Network of Experts. Its focus is on forming a holistic view over the entire life cycle that takes into account specific aspects of the structure, such as load-bearing capacity (utilisation level), usability, planned residual service life, possible changes of use (including adjusted traffic load models) as well as vulnerabilities at network and structural levels. This is the basis for evaluating infrastructures comprehensively, by developing and implementing the best maintenance strategies. This proactive approach should give road authorities access to well-founded, information-based statements on the reliability of the transport infrastructure, combined with an optimised utilisation of the service life.
Source: Adapted from ITF (2018).
Create efficiency incentives for public infrastructure managers and educate the market.
In Kazakhstan, as in many advanced economies, the road infrastructure functions are embedded in a public corporation, which plans and manages, but (partly) outsources infrastructure construction and maintenance through performance-based contracts. OECD experience has shown such institutions need to be subject to incentive-based regulation (the utility regulation model), where competition is not an option (e.g. motorway infrastructure and possibly railways). Furthermore, the infrastructure managers should also invest in building the capacity of the market to accept advanced formats of contracting (information sessions, training seminars, guidance, etc.). Efforts such as these will be beneficial in of themselves and, if private finance is at some point included in these structures, the outcomes of those arrangements would benefit as well.
Develop intermodality by grouping terminals.
Kazakhstan needs a strategy for developing intermodality with a focus on improving the last-mile connection for international shipments. This would involve the creation of one or two large-scale intermodal terminals, possibly by consolidating smaller ones, that would serve as national hubs. The scale of such terminals (typically 200 000 TEUs per year) would allow the scheduling of regular block trains to Europe and Asia at a high frequency. It would also stimulate the creation of specialised logistics services that are likely to cluster around the terminal.
Better knowledge of the transport sector would improve the design of transport
policies
Supporting facts
Reliable data is available on the transport sector, but important gaps remain that prevent a good overview of the sector. In particular, the geography of transport flows is unknown at a disaggregated scale; there are no systematic surveys on the cost structure of trucking companies; and little data is available on the characteristics of shippers and shipments. Furthermore, to ITF’s knowledge, there is no traffic forecast model based on a detailed description of transport supply and demand. Such a tool would allow for a better assessment of transport infrastructure and related policies.

KEY RECOMMENDATIONS
ENHANCING CONNECTIVITY AND FREIGHT IN CENTRAL ASIA © OECD/ITF 2019 147
Recommendations
Create a transport observatory.
Key activities of the observatory could include data collection, analysis, dissemination and benchmarking for policy support. This would help to create trust in the data and analysis produced and would further promote dialogue among stakeholders. In the longer term, the observatory could broaden its activities to include information pooling and synthesis, publication of flagship reports, and research and organisation of public events. Guidelines for creating a transport observatory can be found in ITF (2016).

KEY RECOMMENDATIONS
148 ENHANCING CONNECTIVITY AND FREIGHT IN CENTRAL ASIA © OECD/ITF 2019
References
ADB (2015), "SECTOR ASSESSMENT: TRANSPORT (NONURBAN)"
ADB (2014), "CENTRAL ASIA REGIONAL ECONOMIC COOPERATION CORRIDOR PERFORMANCE MEASUREMENT AND MONITORING: A Forward-Looking Retrospective", https://www.adb.org/sites/default/files/publication/148731/carec-cpmm-forward-looking-retrospective.pdf
ADB (2012), Resettlement Planning Document, Republic of Kazakhstan: Astana Light Rail Transit Project, Astana LRT LLP for Asian Development Bank
ADB (2011), Developing Tajikistan’s Transport Sector: Transport Sector Master Plan, , https://www.adb.org/sites/default/files/publication/28979/transport-taj.pdf
ITF (2016), "Logistics Observatory for Chile Strengthening Policies for Competitiveness", Case-Specific Policy Analysis
Kummu, M., M. Taka and J. Guillaume (2018), Data from: Gridded global datasets for Gross Domestic Product and Human Development Index over 1990-2015, Dryad Digital Repository
OECD (2016), "Regional Outlook 2016. Productive Regions for Inclusive Societies", OECD Publishings, https://doi.org/10.1787/9789264260245-en
OECD/ITF (2017), "Mobility in cities", in ITF Transport Outlook 2017, https://doi.org/10.1787/9789282108000-en
PIARC (2012), "Road safety inspection guidelines for safety checks of existing roads", Technical Committee 3.1 Road Safety
Rastogi, C. and J.-F. Arvis (2014), The Eurasian Connection Supply-Chain Efficiency along the Modern Silk Route through Central Asia Trade, , http://documents.worldbank.org/curated/en/730031468030581540/pdf/888910PUB0Box300EPI199120June122014.pdf
Saumya Mitra, Bartlomiej Kaminski and Matin Kholmatov (2009), Bazaars and Trade Integration in CAREC Countries

ANNEX 1
ENHANCING CONNECTIVITY AND FREIGHT IN CENTRAL ASIA © OECD/ITF 2019 149
Annex 1. The International Transport Forum’s
International Freight Model
The International Transport Forum’s (ITF) International Freight Model projects international freight transport activity and related CO2 emissions up to 2050 based on global trade projections. The model includes six main components, each feeding into the subsequent calculation:
The OECD’s trade projection is produced using a Computable General Equilibrium (CGE) model called the ENV-Linkages model. The model is designed to estimate the dynamic evolution of international trade, in terms of both spatial patterns and commodity composition due to the changes in the global production and consumption of commodities. It is calibrated based on the macroeconomic trends of the OECD@100’s baseline scenario for the period 2013–2060 at sectorial and regional levels. As such, it projects international trade flows in values (USD) for 26 regions and 25 commodities until 2060. A global freight transport network model is based on 2010 data.
The final outputs of the model are freight tonne-kilometres by transport corridor by mode and related CO2 emissions. Each of the model components is described in more detail below.
Trade Disaggregation Model
The underlying trade projections are disaggregated into 26 world regions. This level of resolution does not allow estimating transport flows with precision as it does not allow a proper discretisation of the travel path used for different types of products. Therefore, we disaggregate the regional origin–destination (OD) trade flows into a larger number of production/consumption centroids. These centroids were calculated using an adapted p-median procedure for all the cities around the world classified by United Nations in 2010 relative to their population (2539 cities). The objective function for this aggregation is based on the minimisation of a distance function which includes two components: GDP density and geographical distance. The selection was also constrained by allowing one centroid within a 500 km radius in a country. This resulted in 333 centroids globally, with spatially balanced results also for all continents.
Todky =TVLk
y GDPoy
∑ GDPkyV
v=1
GDPdy
∑ GDPlyL
l=1
(1)
In Equation (1),
Todky = trade values from centroid o to centroid d in year y for commodity k,
TVLky = trade values from origin region V to destination region L,
o, d = origin and destination centroids, k = commodity k, y = year of analysis, k = centroid that belongs to the origin region V, l = centroid that belongs to the destination region L.

ANNEX 1
150 ENHANCING CONNECTIVITY AND FREIGHT IN CENTRAL ASIA © OECD/ITF 2019
Transport network model
The model consolidates and integrates all freight transport networks based on open GIS data for different transport modes. Seaports and airports are physically connected to road and rail networks with data on intermodal dwelling times. Travel times by type of infrastructure and dwelling times between transport modes are estimated using average speeds based on available information by region. The model then computes the shortest paths between each production/consumption centroid for each transport mode (for the modes available for each link), generating two main inputs:
The average travel time and distance by mode for each origin destination pair (for countries with multiple centroids, a weighted average of all centroid pairs is used);
The shortest path between each centroid for each transport mode.
Centroids
The underlying trade projections are done with a regional aggregation of 26 zones. This introduces significant uncertainties from a transport perspective as it does not allow a proper discretisation of the travel path used for different types of product. Therefore, we disaggregate the regional origin-destination (OD) trade flows into a larger number of production/consumption centroids. The centroids were identified using an adapted p-median procedure for all the cities around the world classified by the United Nations in 2010 relative to their population (2 539 cities). The objective function for this aggregation is based on the minimisation of a distance function which includes two components: GDP density and geographical distance. The selection was also constrained by allowing one centroid within a 500 km radius in a country. This general optimisation procedure was then refined to ensure that all regional capitals of the study area were represented as a centroid. This resulted in 404 centroids globally, with spatially balanced results for all continents. Each centroid presents an estimation of GDP and population, based on available raster data at 1 km resolution for the whole world.
Transport cost estimation
The routing alternatives generated from the transport network incorporate a distance-based cost plus a time-based cost added to the handling cost estimated for each world port given the stated capacity and congestion level. The distance-based unit costs are a function of the mode of the links in the path (i.e. road, rail, waterways or sea) that is differentiated by continent in their inland component. The time component is estimated by multiplying the value of time for the estimated route time. The formal definition of the maritime cost model, which presents more components, is delineated as follows:
𝐶𝑟 = ∑ 𝐴𝑝
𝑝∈𝑟
+ ∑ 𝑐𝑙
𝑙∈𝑟
+ 𝛼 (∑ 𝑇𝑝
𝑝∈𝑟
+ ∑ 𝑡𝑙
𝑙∈𝑟
) (2)
In Equation 2): Cr = unit cost of route r from origin centroid to destination centroid (USD/Twenty-equivalent unit, TEU), p = ports used by the route, l = links used by the route, Ap = unit cost of transhipment at port p (USD/TEU), cl = unit cost of transportation over link l (USD/TEU),

ANNEX 1
ENHANCING CONNECTIVITY AND FREIGHT IN CENTRAL ASIA © OECD/ITF 2019 151
Tp = time spent during transhipment at port p (days/TEU), tl = time spent during transportation over link l (days/TEU), α = value of transport time (USD/day).
The used value of time (in common for all commodity types) is 0.196 USD/hours per tonne.
Weight/value model
We used a Poisson regression model to estimate the rate of conversion of value units (dollars) into weight units of cargo (tonnes) by mode, calibrated using datasets from Eurostat and the Economic Commission for Latin America and the Caribbean (ECLAC) on value/weight ratios for different commodities.
We use the natural logarithm of the trade value in millions of dollars as the offset variable, with panel terms by commodity, a transport cost proxy variable (logsum calculation for maritime, road, rail, and air transport costs per tonne between each pair of centroids), and geographical and cultural variables: binary variables for trade agreements and land borders used above and a binary variable identifying if two countries have the same official language. Moreover, economic profile variables were included to describe the trade relation between countries with different types of production sophistication and scale of trade intensity. We validate the output of the value-to-weight model using the UN Comtrade database that provides values and weights of all commodities traded between any countries worldwide.
wodky =Todk
y ersodky
(3)
rsodky =a+b1 egdp%o
y
+b2 egdp%dy
+b3 egdpc%oy
+ b4 egdpc%dy
+b5ln (gdpco
y
gdpcd
y ) + b6 contigod+ b7 langod+b8 rtaod
+lgske‐logsum(costod)
(4)
In Equations (1) and 2),
wodky
wodky
= weight of commodity k that is traded between origin o and destination d for year y (in
tonnes),
Todky = value of trade for commodity k between origin o and destination d for year y (in USD),
rsodky rsodk
y = value-to-weight conversion factor for commodity k, between origin o and destination d
for year y (in tonnes/USD),
gdp%oy gdp%o
y = GDP percentile of origin in year y,
gdp%dy gdp%d
ygdp%d
y = GDP percentile of destination in year y,
gdpc%o
y gdp_c%oy
= GDP per capita percentile of origin in year y,
gdpc%d
y gdp_c%dy
= GDP per capita percentile of destination in year y,
ln (gdpco
y
gdpcdy) = natural logarithm of the ratio between GDP per capita of origin and GDP per capita of
destination in year y, contigodcontigod = land contiguity between origin o and destination d, contig = (0, 1),
langod = shared language between origin o and destination d, lang = (0, 1), rtaod = trade agreement between origin o and destination d, rta = (0,1), logsum(costod)logsum(costod) = logsum variable of transport costs using different modes between
origin o and destination d,d

ANNEX 1
152 ENHANCING CONNECTIVITY AND FREIGHT IN CENTRAL ASIA © OECD/ITF 2019
lgsk = logsum coefficient/panel term for commodity k.
Freight mode choice model
The mode share model (in weight) for international freight flows assigns the transport mode used for trade between any origin–destination pair of centroids. The mode attributed to each trade connection represents the longest transport section. All freight will require intermodal transport both at the origin and destination. This domestic component of international freight is usually not accounted for in the literature, but is included in our model. The model is estimated using a standard multinomial logit estimator including commodity type panel terms on travel times and cost. Both Eurostat and ECLAC datasets are used as sources of observation data for the volume of commodities and its mode of transport. Transport costs and travel times are estimated using the network model and observed data whenever available. Two geographical and economic context binary variables are added, one describing if the OD pair has a trade agreement and the other for the existence of a land border between trading partners. The mode choice model is validated by ensuring the mode share of the volume of goods transported is similar to the observed mode share for international transport in 2011 by weight. Additionally, the total tonne-kilometres for all four major modes of transport (air, road, rail, sea) are also validated against the observed data. These observed data are obtained from reports of various organisations such as the International Maritime Organization (IMO), the International Civil Aviation Organization (ICAO), and the World Bank.
uodkm =ascm+CFk TC
odm +TFk TT
odm +Ctm contigod+Rt rtaod (5)
Pm=
euodkm
∑ euodkmM
m=1
(6)
In Equations (4) and (5), Pm = the choice probability of mode m, uodk
m uodkm = the choice utility of mode m for commodity k between origin o and destination d,
ascmascm = alternative specific constant for mode m, CFkCFk = transport cost coefficient for commodity k,
TCodm TCod
m = transport cost for mode m between origin o and destination d,
TFkTFk = travel time coefficient for commodity k, CtmCtm = contiguity coefficient for mode m, contigodcontigod = contiguity variable between origin o and destination d, contig = (0, 1), Rt = trade agreement coefficient, rtaodrtaod = trade agreement variable between origin o and destination d, rta = (0, 1).
Freight flow assignment
The model is formulated as an equilibrium assignment with a shortest path optimisation for each iteration for all transport modes except maritime routes and a path size logit model in combination with a path generation method to assign the volume of freight transport across all possible international shipping routes between all origins and destinations. The model iterates until convergence (no variation of the set of paths selected). The model does this using a shortest path algorithm and choice set creation algorithm to identify the sub-segments of the complete shortest route for each port-to-port segment of
m
odTC

ANNEX 1
ENHANCING CONNECTIVITY AND FREIGHT IN CENTRAL ASIA © OECD/ITF 2019 153
a shipping line. The model accounts both for maritime connections between two countries and for overland connections between the centroids. The route and port choice algorithms use a path size logit model which takes overlaps between the alternative routes into account and distinguishes the transport costs associated with these alternatives properly. The basis of this model can be found in (Ben Akiva and Lerman, 1985). The model is calibrated by minimising the difference between observed and modelled port throughputs for more than 400 major ports in the world. A detailed description on the model can be found in (Halim et al., 2016).
The model accounts both for maritime connections between two countries and for overland connections between these countries. The route and port choice algorithms use a path size logit model which takes overlaps between the alternative routes into account and distinguishes the transport costs associated with these alternatives properly. The basis of this model can be found in (Halim et al., 2016). The following is the formal definition of the route choice model. The route probabilities are given by
Pr=
e‐μ (Cr+ ln Sr)
∑ e‐μ (Ch+ ln Sh)H h=1
(7)
while the path size overlap variable S is defined as
Sr= ∑Za
Zr
1
Naha ∈ LKr
(8)
In Equations (7) and (8): Pr = the choice probability of route r, Cr = generalised costs of route r, Ch = generalised costs of route h within the choice set, CS = the choice set with multiple routes, h = path indicator/index, ℎ ∈ 𝐶𝑆, μ = logit scale parameter, a = link in route r, Sr = degree of path overlap, Lkr = set of links in route r, Za = length of link a, Zr = length of route r, Nah = number of times link a is found in alternative routes.
Generation of the model outputs
The model components result with the value, weight and distance travelled (with path specification) between 2010 and 2050, for each centroid pair, mode, type of commodity and year, stemming from international trade. The tonne-kilometres are then combined with information on related CO2 intensities and technology pathways by mode, obtained from the International Energy Agency’s MoMo model (IEA, 2014) and the International Maritime Organisation (IMO, 2009). In case of road and rail, these coefficients and pathways are geographically dependent, while the maritime and air CO2 efficiencies are considered to be uniform worldwide.
For technical details of the model, as well as some validation results, see Martinez et al. (2014).
ANNEX 1
154 ENHANCING CONNECTIVITY AND FREIGHT IN CENTRAL ASIA © OECD/ITF 2019
Freight transport network: A detailed representation
Assessing potential capacity constraints with precision is made possible within our modelling framework through the inclusion of a detailed global freight transport network based on data from Geographic Information Systems (GIS). This allows the model, although global, to describe network conditions at a detailed scale. Our main contribution is the consolidation and integration of all different modal networks into a single, routable freight network, and the association of capacity constraints to links and nodes.

ANNEX 1
ENHANCING CONNECTIVITY AND FREIGHT IN CENTRAL ASIA © OECD/ITF 2019 155
References
Ben-Akiva, M., Lerman, S.R., (1985). Discrete Choice Analysis. MIT Press, Cambridge, Massachusetts.
Halim, R.; Kwakkel, J.; Tavasszy, L.A. (2016). “A scenario discovery study of the impact of uncertainties in the global container transport system on European ports”. Futures, 81, 148–160.
IEA (2014), International Energy Agency, Momo ETP 2014, IEA Energy Technology Policy Division, 2014.
IMO (2009), Second IMO GHG Study 2009, International Maritime Organization, 2009.
Martinez, L., J. Kauppila and M. Castaing Gachassin (2014), International Freight and Related CO2 Emissions by 2050: A New Modelling Tool, International Transport Forum Discussion Papers, 2014/21, OECD Publishing, Paris. http://dx.doi.org/10.1787/5jrw1kslrm9t-en
UN Comtrade Database (2018). Available online on https://comtrade.un.org/, accessed on the 15.07.2018.

ANNEX 2
ENHANCING CONNECTIVITY AND FREIGHT IN CENTRAL ASIA © OECD/ITF 2019
Annex 2. Impact of distance on reaching global
centres of production and consumption
156

ANNEX 2
ENHANCING CONNECTIVITY AND FREIGHT IN CENTRAL ASIA © OECD/ITF 2019 157
Source: ITF

Publ
ishe
d: 0
5/20
19 |
Phot
o cr
edit:
Tem
uule
n.B/
Shut
ters
tock
This report assesses freight connectivity in Central Asia, focusing on Kazakhstan, Kyrgyzstan, Mongolia, Tajikistan and Uzbekistan. It provides recommendations for improving connectivity and the policy processes required to achieve this. The report also offers advice on how regional co-ordination can improve freight efficiency and connectivity. The analysis, both qualitative and quantitative, covers questions related to hard infrastructure, policies and regulatory frameworks.
International Transport Forum2 rue André PascalF-75775 Paris Cedex 16+33 (0)1 73 31 25 [email protected]
Enhancing Connectivity and Freight in Central Asia
Funded by the government of Kazakhstan