Embed Size (px)
Citation preview

Enhancers regulate progression of developmentin mammalian cellsAnna-Lena Kranz1,2, Roland Eils1,2,* and Rainer Konig1,2,*
1Department of Bioinformatics and Functional Genomics, Institute of Pharmacy and Molecular Biotechnology,and Bioquant, University of Heidelberg, INF 267, 69120 Heidelberg and 2Theoretical Bioinformatics, GermanCancer Research Center, INF 580, 69121 Heidelberg, Germany
Received January 19, 2011; Revised June 17, 2011; Accepted July 6, 2011
ABSTRACT
During development and differentiation of an organ-ism, accurate gene regulation is central for cells tomaintain and balance their differentiation processes.Transcriptional interactions between cis-acting DNAelements such as promoters and enhancers are thebasis for precise and balanced transcriptional regu-lation. We identified modules of combinations ofbinding sites in proximal and distal regulatoryregions upstream of all transcription start sites(TSSs) in silico and applied these modules to geneexpression time-series of mouse embryonic devel-opment and differentiation of human stem cells. Inaddition to tissue-specific regulation controlled bycombinations of transcription factors (TFs) bindingat promoters, we observed that in particular thecombination of TFs binding at promoters togetherwith TFs binding at the respective enhancers regu-late highly specifically temporal progression duringdevelopment: whereas 40% of TFs were specific fortime intervals, 79% of TF pairs and even 97% ofpromoter–enhancer modules showed specificity forsingle time intervals of the human stem cells.Predominantly SP1 and E2F contributed to temporalspecificity at promoters and the forkhead (FOX)family of TFs at enhancer regions. Altogether, wecharacterized three classes of TFs: with bindingsites being enriched at the TSS (like SP1), depletedat the TSS (like FOX), and rather uniformlydistributed.
INTRODUCTION
Transcription factors (TFs) cooperate with other regula-tory co-factors and the complex combinations of multiplecooperative interactions give the necessary specificity for
spatio-temporal transcriptional regulation (1). Sets of TFsbinding in a defined DNA region are called cis-regulatorymodules (CRMs). CRMs direct the expression of develop-mental genes and signaling molecules during development(2) and the combinatorial and temporal binding of CRMsis crucial for metazoan development (3) and for the estab-lishment of tissue specific gene expression (4). Specificallyin higher organisms, proximal versus distal regulationneeds to be well balanced (5). Whereas promoters areproximal to transcription start sites (TSSs), enhancers canbe quite distant from their target genes. Enhancer regionshave been suggested to consist of densely clustered TFbinding sites (6) and stimulate transcription irrespectivelyof their position or orientation with respect to the TSS (7).TFs bound at an enhancer interact with co-activators andTFs bound at the promoter. Hence, they increase the con-centration of activators at promoters. The large distancebetween long-range enhancers and proximal promoterscan be overcome by chromatin loops, bringing these elem-ents in close proximity (8,9). Thus, enhancers can increasethe activity of a promoter considerably, even when locatedseveral kilo bases away. For example, deleting theenhancer for immunoglobulin heavy chain (IgH) resultedin loss of gene expression for IgH (10) and deletion of theT-lymphocyte-specific enhancer (E4p) needed for CD4 ex-pression yielded cell populations of which the majority didnot show any CD4 expression in T lymphocytes (11).In addition, enhancers can recruit chromatin modifica-
tion enzymes (e.g. a histone acetyltransferase) and chro-matin remodeling complexes that put up an adequateenvironment for transcription. Promoter–enhancer inter-actions depend on regulatory factors binding at promoter-proximal regions, e.g. Kruppel-like factor 1 (erythroid)(KLF1) was suggested to induce the switch between theexpression of fetal gamma-globin to adult beta-globin bymediating an interaction between the beta-globin genepromoter and a distal regulatory element (12). In turn,these factors may recruit specific distal enhancers (13,14)depending on the combination of regulatory factors at the
*To whom correspondence should be addressed. Tel: +6221 423600; Fax: +6221 423620; Email: [email protected] may also be addressed to Roland Eils. Email: [email protected]
Published online 23 July 2011 Nucleic Acids Research, 2011, Vol. 39, No. 20 8689–8702doi:10.1093/nar/gkr602
� The Author(s) 2011. Published by Oxford University Press.This is an Open Access article distributed under the terms of the Creative Commons Attribution Non-Commercial License (http://creativecommons.org/licenses/by-nc/3.0), which permits unrestricted non-commercial use, distribution, and reproduction in any medium, provided the original work is properly cited.
Dow
nloaded from https://academ
ic.oup.com/nar/article/39/20/8689/2409562 by guest on 27 N
ovember 2021
proximal promoter (15). Levine and Tjian (15) suggestedthat a combination of different complexes is needed for atemporal- and tissue-specific regulation of cis-DNAelements allowing a vast variety of distinct gene expressionpatterns.There exist various examples reporting the involvement
of enhancers in the regulation of development forwell-studied genes, mainly for invertebrates (16,17) butalso for human and mouse in which e.g. conserved distalregulatory regions associated with developmental geneshave been identified as enhancers (6,18–21).We were interested in immanent differences of enhan-
cers and promoters affecting the regulation of genesduring critical developmental stages of different tissuesand cell types. For this, we set up a statistical analysis.Genes being differentially expressed at specific time inter-vals of the development of each analyzed tissue (before,during and after its formation) were associated to theirregulating TFs. TFs were considered to be temporal-specific if their regulated genes mainly occurred in notmore than one time interval. Similarly, we analyzedtissue specificity and considered a TF as tissue-specific ifits regulated genes occurred predominantly in one tissueonly. In this manner, we systematically comparedtemporal and tissue specificity of TFs, combinations ofTFs binding at promoters, combinations of TFs binding
at enhancers, and combinations of TFs binding at pro-moters and TFs binding at enhancers. Our results notonly support tissue specificity of TF pairs [which hasbeen reported previously (4)] but we also show that thecombination of TFs in promoter regions together withcombinations of TFs in enhancer regions determinestemporal specificity.
MATERIALS AND METHODS
Identifying TFs, combinations of TFs, and promoter–enhancer modules
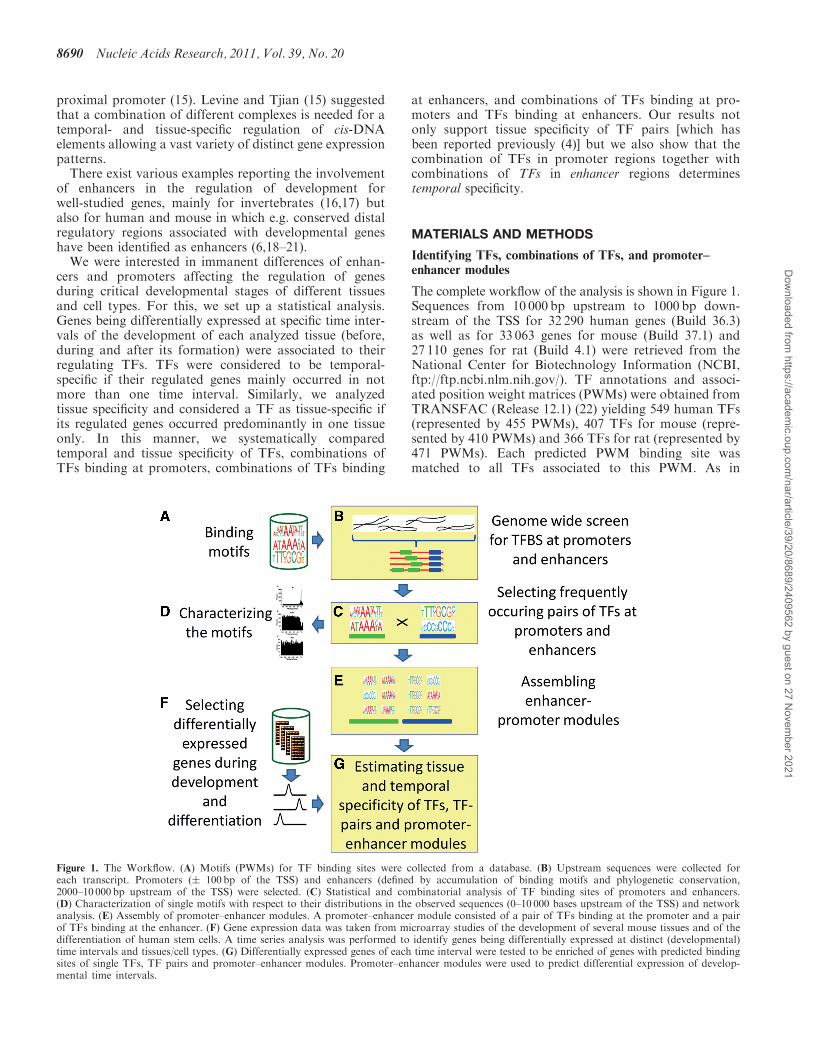
The complete workflow of the analysis is shown in Figure 1.Sequences from 10 000 bp upstream to 1000 bp down-stream of the TSS for 32 290 human genes (Build 36.3)as well as for 33 063 genes for mouse (Build 37.1) and27 110 genes for rat (Build 4.1) were retrieved from theNational Center for Biotechnology Information (NCBI,ftp://ftp.ncbi.nlm.nih.gov/). TF annotations and associ-ated position weight matrices (PWMs) were obtained fromTRANSFAC (Release 12.1) (22) yielding 549 human TFs(represented by 455 PWMs), 407 TFs for mouse (repre-sented by 410 PWMs) and 366 TFs for rat (represented by471 PWMs). Each predicted PWM binding site wasmatched to all TFs associated to this PWM. As in
Figure 1. The Workflow. (A) Motifs (PWMs) for TF binding sites were collected from a database. (B) Upstream sequences were collected foreach transcript. Promoters (� 100 bp of the TSS) and enhancers (defined by accumulation of binding motifs and phylogenetic conservation,2000–10 000 bp upstream of the TSS) were selected. (C) Statistical and combinatorial analysis of TF binding sites of promoters and enhancers.(D) Characterization of single motifs with respect to their distributions in the observed sequences (0–10 000 bases upstream of the TSS) and networkanalysis. (E) Assembly of promoter–enhancer modules. A promoter–enhancer module consisted of a pair of TFs binding at the promoter and a pairof TFs binding at the enhancer. (F) Gene expression data was taken from microarray studies of the development of several mouse tissues and of thedifferentiation of human stem cells. A time series analysis was performed to identify genes being differentially expressed at distinct (developmental)time intervals and tissues/cell types. (G) Differentially expressed genes of each time interval were tested to be enriched of genes with predicted bindingsites of single TFs, TF pairs and promoter–enhancer modules. Promoter–enhancer modules were used to predict differential expression of develop-mental time intervals.
8690 Nucleic Acids Research, 2011, Vol. 39, No. 20
Dow
nloaded from https://academ
ic.oup.com/nar/article/39/20/8689/2409562 by guest on 27 N
ovember 2021
TRANSFAC a TF can be associated to several PWMsand vice versa, TFs associated to the same PWM weregrouped together and only one representative of such aTF-group was used in the analysis. For example, FOXA1,FOXA2 and FOXA3 were associated to the same PWMand FOXA1 was used as the representative of thisTF-group. The grouping resulted in 152 TF-groups forhuman (Supplementary Table S1A), 139 for mouse(Supplementary Table S1B), and 141 TF-groups for ratwhich were used for further analysis. The detection ofTF binding sites based on the respective PWMs was per-formed with the software package R (www.r-project.org)as described previously (23,24). Predicted binding siteswith a P> 0.05 were discarded. The computation of theP-value is described in (23). Briefly, a significance valuewas determined by comparing the obtained score to ascore distribution of the motif determined in random se-quences generated by a background distribution followingthe base distribution of the whole genome. It is to notethat we treated this value as a parameter to determine acut-off and not for any significance test. Hence no multipletesting correction was needed. Predicted binding sites forSP1 and FOXA were compared to experimentally identi-fied binding sites. Binding sites for SP1 were compared tochromatin immunoprecipitation sequencing (ChIP-Seq)data from the ENCODE project (25) from a study bythe laboratory of Richard M. Myers at the HudsonAlpha Institute for Biotechnology. The data was down-loaded from UCSC (26). Binding sites of FOXA werecompared to several ChIP-Seq (27–29) and ChIP-chip(30) data sets. Genome coordinates of peak hits werecompared to gene annotations (NCBI Build 36.3) andtarget genes were determined using the same settings asfor the in silico promoter screen. Binding sites occurringwithin a range of �10 kb and+1kb of the annotated TSSof a gene were included in the analysis. The determinedgenes were then compared to the list of predicted SP1 orFOXA target genes. A Fisher’s exact test was conductedto assess the enrichment of experimentally identifiedbinding sites in predicted binding sites. Predicted TFbinding sites were combined into pairs of TFs andpromoter–enhancer modules. Regions 100 bp upstreamand downstream of the TSS were used as promoters,and regions starting 2000 bp and ending 10 000 bpupstream of the TSS were used as potential enhancerregions. The enhancer region was chosen this way asHeintzman et al. (31) demonstrated that the majority ofpredicted enhancers are located >2.5 kb from known TSS.In addition, Blanchette et al. (32) identified CRMs andfound that the density of modules is lowest in regionsstarting from 10 kb from the TSS. Combinations of TFsfor promoters were obtained by pairing non-overlappingTF binding sites co-occurring in the promoter region of agene using a sliding window of 20 bp. Only pairs occurringin at least 10 genes were taken into further consideration.To decrease false positives of predicted TF binding sites,only conserved binding sites were analyzed in enhancerregions which increased specificity. To determine the con-servation of human, mouse and rat binding sites, we ana-lyzed pair-wise alignments between human and chimp,mouse and rat, and rat and mouse, respectively. Chained
and netted pair-wise alignments of human (UCSC versionhg18) and chimp (UCSC version panTro2), of mouse(UCSC version mm9) and rat (UCSC version rn4), andof rat (UCSC version rn4) and mouse (UCSC versionmm9) were downloaded from UCSC (33) in the axtNetformat (ftp://hgdownload.cse.ucsc.edu/). Conservedregions between human and chimp, mouse and rat, andrat and mouse were determined by the given alignedregions in the alignment files. Predicted binding siteswere compared to the identified conserved regions andtaken if binding sites occurred in these conservedregions. Pairs of non-overlapping co-occurring TFs in en-hancer regions were determined using a sliding window of20 bp (same size as for promoter regions). To analyzeenhancer regions with a comparable size to promoterregions, we regarded sequences of a 200 bp sliding window.Regions in which at least 10 binding sites occurred wereconsidered as enhancer regions and TF pairs occurring inat least 10 genes were considered further. Promoter–enhancer modules were constructed by combining twoTF pairs occurring at the respective promoter andenhancer regions of a gene. Promoter–enhancer modulesoccurring in at least 10 genes were taken for furtheranalysis. Hence, promoter–enhancer modules consistedof a combination of a pair of co-occurring TFs at the pro-moter and a pair of co-occurring TFs at the enhancerregion. We also constructed promoter–enhancer moduleswith different sets of parameters. For this, we defined thepromoter region 500 bp upstream and downstream of theTSS, used a sliding window of 50 bp, and TF pairs andpromoter–enhancer modules had to occur in at least fivegenes. To show that combinations of TF pairs of enhan-cers and promoters show better specificity than combiningonly TF pairs binding at the promoter, we also con-structed the latter combinations. For this, two pairs ofco-occurring TFs in the promoter region were combinedfor each gene and taken for further analyses if thepromoter–enhancer module occurred in at least 10 genes.
Gene expression analyses
Gene expression data of mouse embryonic developmentand differentiation of human stem cells were retrievedfrom the Gene Expression Omnibus (http://www.ncbi.nlm.nih.gov/geo/). For mouse embryonic development,gene expression data was analyzed comprising earlycardiac development (GSE1479), the developing prefront-al cortex (GSE4675), facial prominences (GSE7759), earlydevelopment of the brain (GSE8091), development of theliver (GSE13149), ovary development (GSE5334), and de-velopment of testis (GSE4818). Quality was assessed bymanual inspection of probe intensity distributions of eacharray and discarded if the MA plots showed abnormaldistributions. We discarded three samples from thedataset of early brain development, four samples fromovary development, and one sample from testis develop-ment. For differentiation of human stem cells, we analyzedgene expression data of cardiomyocytes (GSE13834),chondrogenic differentiation (GSE10315), myoblast dif-ferentiation (GSE3780), myelopoiesis (GSE12837), andneural differentiation (GSE9940). Similar to the datasets
Nucleic Acids Research, 2011, Vol. 39, No. 20 8691
Dow
nloaded from https://academ
ic.oup.com/nar/article/39/20/8689/2409562 by guest on 27 N
ovember 2021

for mouse, we discarded data with low quality. We dis-carded one sample from the cardiomyocytes, four samplesfrom differentiation of chondrogenesis, 24 samples fromdifferentiation of myoblasts, 11 samples from myelop-oiesis, and four samples from neural differentiation. Thedata was analyzed using the affymetrix package (34) of R(www.r-project.org) and normalized with VSN normaliza-tion (35). For better comparability, for each gene expres-sion study, time points were grouped into three timeintervals: early, mid and late expression, e.g. in thehuman myelopoiesis data set (GSE12837), the haemato-poietic stem/progenitor cells (HSC) were grouped at theearly time interval, myeloid precursors at the mid-timeinterval and terminally differentiated cells at the latetime interval. Each data set was tested for differentiallyexpressed genes between the different time intervals usingthe Rank Product Test (36). Significant genes weredetermined using a cutoff for percentage of false positives(pfp) <5%. Pfp is an estimate of the false discovery rate,which is determined by a permutation-based procedure ofdetermining the observed value in permutated gene ex-pression values for each sample (36).
Estimating tissue and time specificity for TFs,combinations of TFs and promoter–enhancer modules
For the identified TFs, pairs of TFs at promoter andenhancer regions, and promoter–enhancer modules, wedetermined if their set of regulated genes was enriched indifferentially regulated genes per time interval and tissue.The procedure is explained exemplarily for TFs. For eachTF we determined genes with binding sites for the TFidentified by our PWM-scans and regarded them as po-tentially regulated by the specific TF. Using Fisher’s exacttests, we tested if these regulated genes were significantlyenriched in the list of differentially expressed genes of eachtime interval for each gene expression study (tissue). Wedefined this TF to be tissue-specific if such an enrichmentoccurred only for one tissue (number of tissues=one),otherwise we specified this TF to regulate two or moretissues (number of tissues >1). Similarly, we defined theTF to be time interval-specific if we determined an enrich-ment of its genes in the list of differentially expressed genesof a tissue at one time interval (number of time inter-vals=1), and more than one time interval otherwise(number of time intervals> 1). This enrichment analysiswas performed for all TFs. The results were summarizedfor all TFs and the percentage of TFs per time interval andtissue identified, yielding the results shown in Figure 2Aand Supplementary Figure S1A. The same procedurewas conducted for pairs of TFs at promoters (Figure 2Band Supplementary Figure S1B), pairs of TFs at enhan-cers (Figure 2C and Supplementary Figure S1C), andpromoter–enhancer modules (Figure 2D andSupplementary Figure S1D). As predicted target genesin differentially expressed genes could differ betweenpromoter–enhancer modules and TF pairs at promotersor enhancers, a promoter–enhancer module could show anenrichment of differentially expressed genes in severaltissues even though its containing TF pairs did not getsignificant enrichments in these tissues. To assess the
significance of temporal specificity of promoter–enhancermodules, a Fisher’s exact test was performed to test if thenumber of promoter–enhancer modules specific for asingle time interval was enriched compared to thenumber of TFs, TF pairs at promoters or TF pairs atenhancers specific at a single time interval. In addition,we determined the percentage of genes per promoter–enhancer module that were specific for a single time inter-val and compared it to the percentage of genes per TF pairat promoters being specific for a single time interval. Tovalidate our results, we also employed permutation testswith 10 000 permutations of randomly assigned differen-tially regulated genes per tissue and time interval. Inaddition, we also conducted permutation tests with10 000 permutations of genes chosen randomly as beingregulated by promoter–enhancer modules. We then deter-mined the number of temporal-specific promoter–enhancer modules per permutation using the approachdescribed above. The number of actual temporal-specificpermutation-enhancer modules was compared to the dis-tribution of temporal specific promoter–enhancer modulesdetermined by the permutation analyses. In addition,we incorporated binding site predictions including pos-itional preferences of the different TFs (37) into our ana-lysis. Binding site predictions were downloaded fromSwissRegulon (38) and genes of promoter–enhancermodules were restricted to predicted genes of theFANTOM study within the promoter region. Thedescribed enrichment analysis was then repeated for therestricted promoter–enhancer modules to assess theirtemporal specificity. We also correlated the expression ofeach promoter–enhancer module to the expression of itsregulated genes per tissue. For this, we calculated the ex-pression profile for each module from the median expres-sion of all four TFs involved. We calculated Pearson’scorrelation coefficients of this profile and each gene ofthe predicted regulated gene list (containing the motifsof the TFs from the module). Similarly, we also calculatedthe correlation to all other genes of the arrays. To test ifthe predicted regulated gene list correlated significantlybetter than the rest of the genes, we performed aStudent’s t-test with the absolute values of both distribu-tions (correlations of the predicted gene list versus allother genes).
Predicting time intervals using promoter–enhancermodules
To further estimate the quality of the identified promoter–enhancer modules, we set up a machine learning systemthat was trained with the identified modules to predicttemporal expression of genes. Additionally, this enabledto select promoter–enhancer modules with a higher pre-dictive value for temporal regulation of gene expressionduring development and differentiation and to estimatetheir potential power to regulate distinct gene groups forthe progression of development. We employed the methodof random forests as a machine learning method (classi-fier). For training, we chose genes whose expression wasassociated with a distinct time interval. This way, weselected genes which were differentially expressed at only
8692 Nucleic Acids Research, 2011, Vol. 39, No. 20
Dow
nloaded from https://academ
ic.oup.com/nar/article/39/20/8689/2409562 by guest on 27 N
ovember 2021

a single time interval in all tissues and determined the setof promoter–enhancer modules associated to these genes.We set up a classification task for two classes. As littledata were available for the mid-time interval (n=7) andto simplify classification, we used only two time intervals(early and late). The early time interval constituted thefirst class and the late time interval the second class. Theclassifiers were trained to predict the correct time intervalfor each gene, using only the information which specificpromoter–enhancer modules were regulating the respect-ive gene (promoter–enhancer modules served as featuresfor the classifier). We trained 10 000 decision trees yieldingan ensemble classifier (random forest) using the packagerandomForest (39) (http://cran.r-project.org/web/packages/randomForest) in R (www.r-project.org). To identifypromoter–enhancer modules with the best discriminativebehavior (best separation performance), we applied thegini criterion which minimizes the impurity of thechildren nodes at each split in the tree (40). To focus onthe best discriminators, we used the top 5% of theseselected features for classification. A 10 times 10-foldcross-validation was applied to determine the performanceof the classifier (yielding accuracy, sensitivity and specifi-city for the classifier). For comparison, we also trained arandom forest using pairs of co-occurring TFs at
promoters as features with the same parameters as forpromoter–enhancer modules. Similar to promoter–enhancer modules, the best discriminating pairs of TFsat promoters were identified according to the gini criter-ion. The top 5% of the features were used for predictionsand the performance of the classifier was determined em-ploying a 10 times 10-fold cross-validation.
Defining TFs with TSS-enriched, TSS-depleted, anduniformly distributed binding sites
For each TF, the distribution of binding sites wasdetermined with respect to the annotated TSS for allgenes. TFs were grouped into three categories: TFs withbinding sites predominantly around the TSS (TSS-enriched-BS), TFs with a depletion of binding sites atthe TSS (TSS-depleted-BS), and TFs showing a uniformdistribution of binding sites (uniformly distributed-BS).For this grouping, a Wilcoxon signed-rank test was con-ducted for each TF to test if the distribution of bindingsites at the TSS (�100 bp around TSS) follows the distri-bution of the remaining binding sites. To correct formultiple testing, a Benjamini–Hochberg correction (41)was applied. TFs with P< 0.05 and a difference of the me-dians of the distributions of at least 4 bp were classified asTFs preferentially binding at the TSS (TSS-enriched-BS)
Figure 2. Tissue and temporal specificity for each regulatory element during differentiation of human stem cells. The number of tissues versus thenumber of time intervals is plotted for (A) TFs, (B) pairs of co-occurring TFs in promoter regions, (C) pairs of co-occurring TFs in enhancer regionsand (D) promoter–enhancer modules. The percentage of the different regulatory elements is indicated at each entry in the grid (i.e. 9% of TFs arespecific for a single tissue and a single time interval). The total number of regulatory elements is given in brackets.
Nucleic Acids Research, 2011, Vol. 39, No. 20 8693
Dow
nloaded from https://academ
ic.oup.com/nar/article/39/20/8689/2409562 by guest on 27 N
ovember 2021

or as TFs with binding sites depleted around the TSS(TSS-depleted-BS) depending on the sign of the differenceof the medians of the distributions. All other TFs weretermed TFs with a uniform distribution of binding sites(uniformly distributed-BS).
Constructing the networks
Using the identified co-occurring TF pairs as links (see‘Identifying combinations of TFs and promoter–enhancer modules’ section), two networks were con-structed, one for promoters and one for enhancers. Toassess if pairs of TFs of the same group (TSS-enriched-BS, TSS-depleted-BS, uniformly distributed-BS) occurredmore often than expected by chance, we performed a per-mutation test with 10 000 permutations of the class labels.Connectivity and betweenness centrality were determinedfor each node in the network and their maxima wereidentified for both networks for TFs of the categoriesTSS-enriched-BS and TSS-depleted-BS. In addition, aprotein–protein interaction network of TFs was con-structed using physical binding information from apublic repository [BIND (42)] and each TF was associatedto its corresponding protein in the network. This networkwas analyzed for the same properties as the describedpromoter and enhancer networks.
RESULTS
Identifying promoter–enhancer modules
To identify promoter–enhancer modules we performed agenome-wide screen for TF binding sites using positionweight matrices (PWMs) for all annotated human genesand TFs (23,24). To validate our predictions, wecompared TF binding predictions to experimentallyidentified binding sites for two central TFs, SP1 andFOXA. Both TFs showed a significantly high overlapbetween predicted and experimentally identified bindingsites. We predicted 9796 genes correctly out of 11 877genes with experimentally identified binding sites(P< 2.2E-16, false positive rate: 0.35) for SP1 and 4954genes correctly out of 5732 genes with experimentallyidentified binding sites (P=0.002, false positive rate:0.7) for FOXA. Figure 1 depicts the workflow of themethod. The sequence upstream and downstream(�100 bp) of the annotated TSS was termed promoterregion, whereas the studied enhancer region was furtherupstream of the TSS (2000–10 000 bp upstream). Toidentify interacting TFs at promoters and enhancers, we
selected pairs of co-occurring TF binding sites in a definedwindow at the promoter and enhancer region for eachgene, respectively. We then combined identified pairs ofco-occurring TFs at the promoter and enhancer region foreach gene to analyze combinations of promoter andenhancer interactions. These combinations were termedpromoter–enhancer modules. After filtering (‘Materials andMethods’ section), we identified 129 promoter–enhancermodules binding at 340 genes. To generalize our investi-gations, we repeated the analysis and identified promoter–enhancer modules also for mouse and rat. Promoter–enhancer modules for mouse and rat showed similarresults when applying the same settings as for human(Table 1).
Identified promoter–enhancer modules regulatespatio-temporal gene expression in development
To investigate time- and tissue-specific regulatory roles ofthe identified promoter–enhancer modules in develop-ment, we analyzed time series of gene expression profilesof embryonic development in mouse and embryonic stemcell differentiation in human cells. We selected gene ex-pression studies from a broad range of different embryon-ic mouse tissues and human stem cells of different origin.Each study was regarded as tissue-specific. For bettercomparison among the different studies, we groupedtime points for each gene expression study into threedistinct time intervals we termed early, mid and late ex-pression. For each gene expression study, we identifieddifferentially expressed genes at these time intervals anddetermined their respective regulation by TFs, pairs ofco-occurring TFs, and promoter–enhancer modules em-ploying enrichment analyses (‘Materials and Methods’section). Differentially expressed genes and significantpromoter–enhancer modules per tissue and time intervalfor human stem cell differentiation and mouse embryonicdevelopment are presented in Supplementary Table S2.We compared the number of enriched tissues and timeintervals for single TFs, pairs of co-occurring TFs,and promoter–enhancer modules. Strikingly, promoter–enhancer modules showed the highest tissue andtemporal specificity. Figure 2 shows the results forhuman stem cells. Only 16% of TFs were specific for asingle tissue whereas 76% of pairs of co-occurring TFs inpromoter regions, 77% of pairs of co-occurring TFs inenhancer regions, and 79% of promoter–enhancermodules showed specificity for a single tissue. Temporalspecificity was even more distinctive. Whereas only 40%
Table 1. Overview of the number of identified transcriptional regulators for different organisms
Human Mouse Rat
Regulatoryelements
Genes Regulatoryelements
Genes Regulatoryelements
Genes
TFs 132 32 121 123 33 033 132 27 110TF pairs at promoters 111 3007 77 1931 74 1891TF pairs at enhancers 579 11 172 418 10 985 585 8326Promoter–enhancer modules 129 340 113 311 28 134
8694 Nucleic Acids Research, 2011, Vol. 39, No. 20
Dow
nloaded from https://academ
ic.oup.com/nar/article/39/20/8689/2409562 by guest on 27 N
ovember 2021
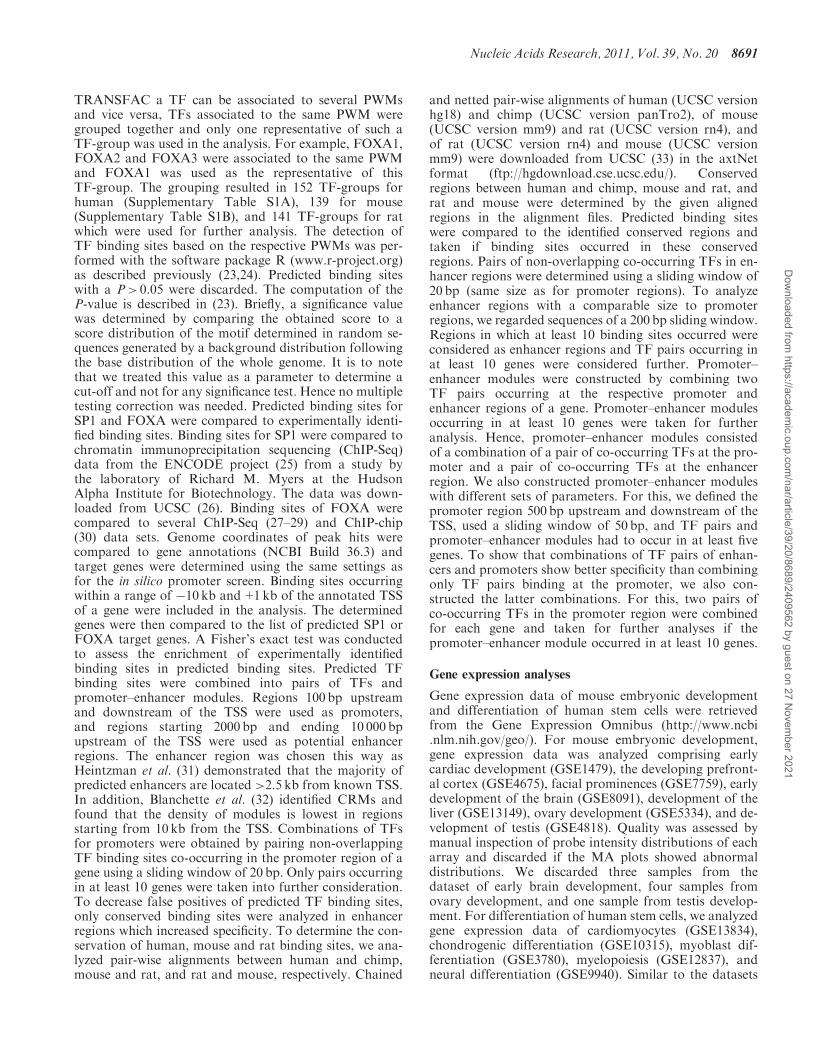
of the studied TFs were specific for a single time interval,79% of pairs of co-occurring TFs in promoter regions,and 85% in enhancer regions and even 97% of thepromoter–enhancer modules showed specificity for asingle time interval in the data sets of human stem cells(Figure 3). Ravasi et al. (4) showed that pairs of TFsrather than single TFs determine tissue specificity.Surprisingly, the additional temporal specificity ofpromoter–enhancer modules is obtained by pairs ofco-occurring TFs at enhancers (97% for promoter–enhancer modules versus 79% for pairs of co-occurringTFs at promoters, significance of the difference:P=0.01, 85% for pairs of co-occurring TFs at enhancers,significance of the difference to promoter–enhancermodules: P=0.02 and 40% for TFs, significance of thedifference to promoter–enhancer modules: P=2.56E-14).In addition, differentially expressed genes regulated by theidentified promoter–enhancer modules were also specificfor a single time interval (74% for promoter–enhancermodules versus 55% for pairs of co-occurring TFs).Temporal specificity could not be increased whenincluding binding site prediction incorporating positionalpreferences of TFs of the study by the FANTOMConsortium (37) (80% of promoter–enhancer moduleswere specific for a single time interval). The expressionof each promoter–enhancer module correlated to the
expression of its regulated genes in half of the tissues(Supplementary Table S3 lists the results for all tissues).Similar results were obtained for mouse embryonic devel-opment (Supplementary Figures S1 and S2). Whereas34% of the TFs were specific for a single time intervaland 11% for a single tissue, 77% and 52% of pairs ofco-occurring TFs at promoters, 79% and 58% of pairsat enhancers and 89% and 69% of promoter–enhancermodules showed specificity for a single time interval andtissue, respectively. As seen for both mouse embryonicdevelopment and human stem cell differentiation, thecombinations of regulatory factors at promoters and en-hancers resulted in higher specificity of tissue dependentand temporal regulation during development and differ-entiation. Concluding, TFs binding at promoterscontributed significantly to tissue-specific regulation,whereas regulatory factors at enhancers rather accountedfor temporal specificity.To cross-check the specificity of these promoter–
enhancer modules, we constructed promoter modules con-sisting of combinations of pairs of co-occurring TFs atpromoters only and repeated the analysis. Using thesame parameter settings, we identified a limited numberof promoter modules (n=12) that did not allow any con-clusion about tissue and temporal specificity. Evenincreasing the promoter region by a factor of 10 (which
Figure 3. Frequency distribution of the number of time intervals for human stem cell differentiation. The histograms show the frequency distributionof the number of time intervals for (A) TFs, (B) pairs of co-occurring TFs in promoter regions, (C) pairs of co-occurring TFs in enhancer regions,and (D) promoter–enhancer modules.
Nucleic Acids Research, 2011, Vol. 39, No. 20 8695
Dow
nloaded from https://academ
ic.oup.com/nar/article/39/20/8689/2409562 by guest on 27 N
ovember 2021
resulted in a sufficient number of promoter modules)revealed 83% of promoter modules as tissue-specific butonly 61% as time-specific. To further validate the incr-eased specificity, we also employed permutation tests.For this, differentially expressed genes were randomlyassigned for each tissue and time interval. In a secondtest, randomly chosen genes were assigned to be regulatedby a promoter–enhancer module. These permutation testsdemonstrated a highly significant temporal regulation ofthe identified promoter–enhancer modules (P=0.0285 forpermuted gene expression and P=0.0057 for permutedgenes regulated by promoter–enhancer modules). Inaddition, we constructed promoter–enhancer modulesusing different sets of parameters with similar results(Supplementary Table S4). Discarding conservation ofTF binding sites slightly reduced temporal specificity ofthe resulting promoter–enhancer modules (94%compared to 97% using conserved binding sites). Theseresults further support the fact that the combinations ofpromoter–enhancer interactions establish temporal speci-ficity of gene expression.For these analyses, we tested a variety of different rea-
sonable parameter settings to select genes with significantmotifs and motif combinations. We found quite similarresults for these different settings and a setting waschosen for which we got a good temporal precision forall compared sets (single TFs, combinations of TFs,and promoter–enhancer modules; number of geneswith binding site for regulatory element �10, sliding win-dow=20bp, promoter region � 100 bp of TSS, see‘Identified promoter–enhancer modules regulatespatio-temporal gene expression in development’
section). The results for all parameter settings are givenin the Supplementary Data (Supplementary Table S4). Itis to note that promoter–enhancer modules out-performedTF pairs for all parameter settings.
Promoter–enhancer modules predict temporal geneexpression in development
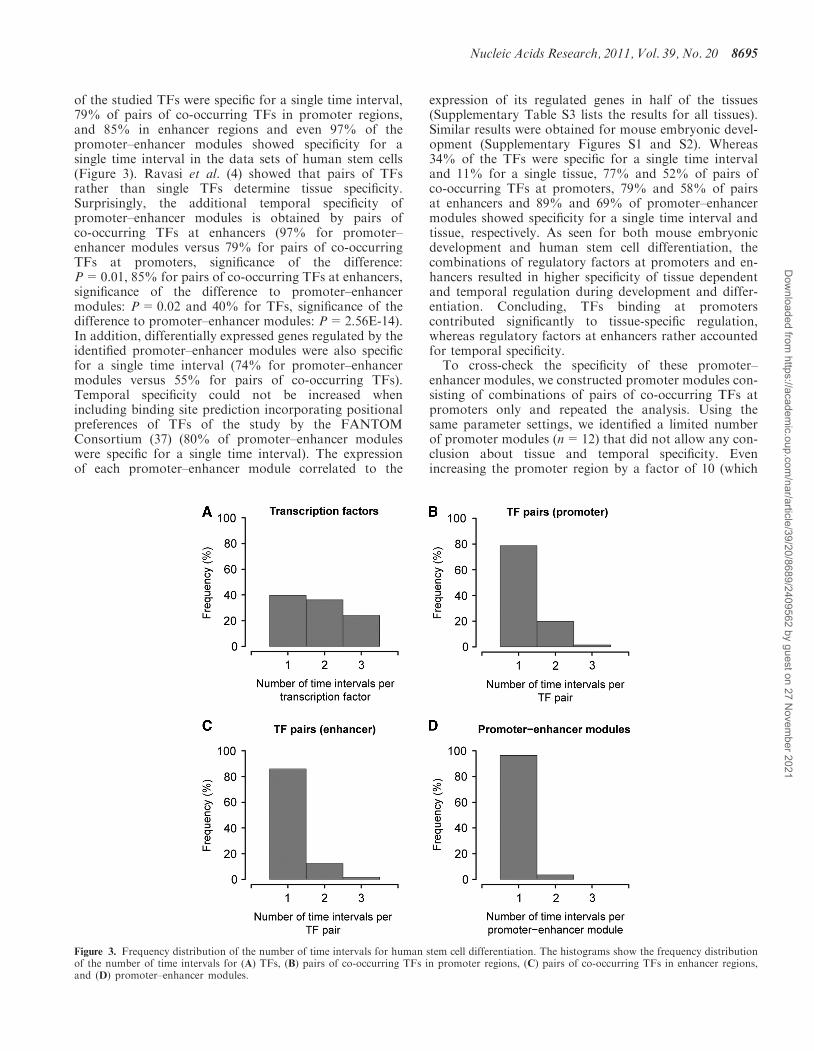
To identify promoter–enhancer modules (combinations ofTFs) that predict gene expression at a specific timeinterval, we further analyzed the active promoter–enhancer modules during human stem cell differentiation.We learned a classifier (of a random forest) to predict thetime interval (now simplified for two categories, early andlate) of temporal differential expression for each genebased on its promoter–enhancer modules. This way, wewere able to predict temporal differential expression of agene based on the profile of its promoter–enhancermodules. Specifically, with this we yielded the combin-ation of pairs of co-occurring TFs in promoter andenhancer regions represented by the promoter–enhancermodules, which determine the temporal regulationobserved during development. The top 10 promoter–enhancer modules explaining best temporal specificityare shown in Table 2. TF-groups SP1 (Sp1 TF), EGR1(early growth response 1) and E2F1 (E2F TF 1) were themost observed TFs occurring in promoter regions,whereas members of the forkhead box family of TFs(FOXI1, FOXJ1, FOXD3, FOXF1, FOXL1 andFOXA1) and CDX1 (caudal type homeobox 1) weremostly found at enhancer regions. To validate ourresults, we performed a stratified 10 times 10-foldcross-validation and trained with the top 5% of
Table 2. Top 10 of the list of identified promoter–enhancer modules explaining temporal specificity for the differentiation of human
stem cells
Promoter–enhancer modulesa Additional members of the TF-group Binding preferenceb
SP1 SP1 - FOXI1 FOXJ1 SP2, SP3, SP4 (SP1) TSS-enriched-BS (SP1)FOXD3, FOXF1, FOXF2 (FOXJ1) TSS-depleted-BS (FOXI1,FOXJ1)
SP1 SP1 - FOXJ1 FOXJ1 SP2, SP3, SP4 (SP1) TSS-enriched-BS (SP1)FOXD3, FOXF1, FOXF2 (FOXJ1) TSS-depleted-BS (FOXJ1)
SP1 SP1 – CDX1 FOXA1 SP2, SP3, SP4 (SP1) TSS-enriched-BS (SP1)CDX2 (CDX1) TSS-depleted-BS (CDX1,FOXA1)FOXA2, FOXA3 (FOXA1)
SP1 SP1 - FOXI1 FOXA1 SP2, SP3, SP4 (SP1) TSS-enriched-BS (SP1)FOXA2, FOXA3 (FOXA1) TSS-depleted-BS (FOXI1,FOXA1)
EGR1 SP1 - FOXI1 FOXA1 EGR2, EGR3, EGR4 (EGR1) TSS-enriched-BS (EGR1,SP1)SP2, SP3, SP4 (SP1)FOXA2, FOXA3 (FOXA1) TSS-depleted-BS (FOXI1,FOXA1)
SP1 SP1 - FOXJ1 FOXJ2 SP2, SP3, SP4 (SP1) TSS-enriched-BS (SP1)FOXD3, FOXF1, FOXF2 (FOXJ1) TSS-depleted-BS (FOXJ1,FOXJ2)
SP1 SP1 - FOXL1 FOXL1 SP2, SP3, SP4 (SP1) TSS-enriched-BS (SP1)TSS-depleted-BS (FOXL1)
E2F1 E2F1 - FOXL1 FOXA1 E2F2, E2F3, E2F4, E2F5, E2F7, TFDP1 (E2F1) TSS-enriched-BS (E2F1)FOXA2, FOXA3 (FOXA1) TSS-depleted-BS (FOXL1,FOXA1)
E2F1 EGR1 - FOXJ2 FOXL1 E2F2, E2F3, E2F4, E2F5, E2F7, TFDP1 (E2F1) TSS-enriched-BS (E2F1,EGR1)EGR2, EGR3, EGR4 (EGR1) TSS-depleted-BS (FOXJ1,FOXL1)
EGR1 SP1 - CDX1 FOXI1 EGR2, EGR3, EGR4 (EGR1) TSS-enriched-BS (EGR1,SP1)SP2, SP3, SP4 (SP1)CDX2 (CDX1) TSS-depleted-BS (CDX1,FOXI1)
aThe first two TFs were identified at promoters, the last two at enhancers.bTSS-enriched-BS, TFs with binding sites predominantly around the TSS; TSS-depleted-BS, TFs with a depletion of binding sitesat the TSS.
8696 Nucleic Acids Research, 2011, Vol. 39, No. 20
Dow
nloaded from https://academ
ic.oup.com/nar/article/39/20/8689/2409562 by guest on 27 N
ovember 2021

promoter–enhancer modules yielding a considerably goodprediction performance (70% accuracy, 73% sensitivity,69% specificity). In comparison, pairs of co-occurringTFs at promoters were not sufficient to predict temporalgene expression and failed to detect differences betweenthe time intervals (43% accuracy, 21% sensitivity, 76%specificity). These results support the specificity of theidentified promoter–enhancer modules for temporal geneexpression.
TFs show distinct binding site distributions for promoterand enhancer regions
To identify differences among TFs binding preferentiallyeither at promoter or enhancer regions of the identifiedpromoter–enhancer modules, we analyzed the distribu-tions of binding sites for all TFs with respect to theannotated TSS. Interestingly, we identified three differentbinding site distributions for the analyzed TFs. Figure 4shows exemplarily the distributions for the TF-groupsSP1, FOXA1 and TP53 (tumor protein p53). The distri-bution of SP1 showed an enrichment of binding sites closeto the TSS (Figure 4A). Binding sites with these distribu-tions were termed TSS-enriched-BS, whereas FOXA1 ex-hibited a depletion of binding sites at the TSS (TSS-depleted-BS, Figure 4B). We also observed ratheruniform distributions, e.g. TP53 (uniformly distributed-BS, Figure 4C). Binding preferences for all analyzed TFsare shown in Supplementary Table S5. We investigated themotifs of these three groups and found that TFs withTSS-enriched-BS had binding sites with a higher GCcontent compared to the other TFs (P=8.22E-14). Thisis consistent with reports that sequences at TSS are oftenGC rich (5,43,44). All TFs occurring at promoters of theidentified promoter–enhancer modules had TSS-enriched-BS, and 91% of the TFs at enhancers had TSS-depleted-BS (Supplementary Figure S4 for additional analysis).Notably, this tendency was even stronger for the pro-moter–enhancer modules selected by the classificationalgorithm (100% TSS-enriched-BS for the promoter pairsand 100% TSS-depleted-BS for the enhancer pairs ofpromoter–enhancer modules). When applying the analysisto all TFs analyzed, the majority of TFs (53%) showed auniform distribution of binding sites with no preferentialbinding position (uniformly distributed-BS). 21% of TFswere determined to preferentially bind close to the TSS(TSS-enriched-BS), whereas 26% TFs showed a depletionof binding sites around the TSS (TSS-depleted-BS).Comparing identified TFs with TSS-enriched-BS to previ-ously determined TFs with enrichments of binding sitesclose to the TSS (45,46) revealed a high overlap (e.g.SP1, NF-Y, YY1, TBP, REST, NRF-1, ELK-1, ATF3,SREBP-1, MAZ, CREBP). It is to note that althoughprevious studies identified TFs with preferential bindingclose to the TSS (5,44–48), TFs showing a depletion ofbinding sites around the TSS or a uniform binding sitedistribution have been noted (44) but have not beenquantified so far.
To further analyze characteristics of TFs with differentbinding site distributions in promoter and enhancerregions, we constructed two networks. The topological
structure of a network can reveal significant biologicalproperties (49). A link in the networks was set for eachpair of co-occurring TFs identified at promoters for thepromoter network and enhancer regions for the enhancernetwork. Interestingly, in both networks, the majority ofTFs with TSS-enriched-BS was adjacent to TFs of thesame entity (TSS-enriched-BS) [significant (P=0.002)for the promoter network and tendency (P=0.1) for theenhancer network]. Similarly, TFs with TSS-depleted-BS
Figure 4. Distribution of binding sites for different groups of TFs. Fordifferent groups of TFs the distribution of binding sites with respect tothe TSS is shown exemplarily for the TFs SP1, FOXA1, and TP53: (A)The distribution for SP1 which represents the distribution of bindingsites for TFs preferentially binding at the TSS (TSS-enriched-BS), (B)the distribution of FOXA1 which represents the distribution of bindingsites for TFs with a depletion of binding sites at the TSS(TSS-depleted-BS), and (C) the distribution for TP53 representing uni-formly distributed binding sites (uniformly distributed-BS).
Nucleic Acids Research, 2011, Vol. 39, No. 20 8697
Dow
nloaded from https://academ
ic.oup.com/nar/article/39/20/8689/2409562 by guest on 27 N
ovember 2021

were preferentially adjacent to TFs with TSS-depleted-BS(P=0.002 for the promoter network and P=0.001 forthe enhancer network). Figure 5 shows the networks andSupplementary Figures S3 and S4 the distributions of TFsin the promoter and enhancer networks. As shown inTable 3, most TFs in the promoter network hadTSS-enriched-BS (65%) whereas only 24% of TFs hadTSS-depleted-BS. To further characterize distinct rolesfor TFs with different binding site distributions and toestimate their functional importance in the network, wedetermined connectivity and betweenness centrality foreach node in the networks (Table 3). Whereas betweennesscentrality measures the traffic load through a node, con-nectivity indicates the significance of a node in thenetwork as essential nodes are often so called hubs in anetwork (49–54). The TF SP1 with TSS-enriched-BS hadthe highest connectivity and highest centrality in thepromoter network with a connectivity of 50 and between-ness centrality of 351.5. In contrast, the highest
connectivity of a TF with TSS-depleted-BS was 12 andthe betweenness centrality was zero for all TFs withTSS-depleted-BS. These results supported the fact thatTFs with TSS-enriched-BS played a central role in the pro-moter network. These TFs constituted the main compo-nent of the network (Figure 5A) while TFs withTSS-depleted-BS formed a rather small and separatedcomponent. In contrast, TFs with TSS-depleted-BSplayed a central role in the enhancer network. TheseTFs constituted the core of the enhancer network(Figure 5B) with other TFs at its periphery. Only 44%of the TFs in the enhancer network had TSS-depleted-BS whereas only 29% of the TFs had TSS-enriched-BS.The fork head TF FOXA1 (forkhead box A1) withTSS-depleted-BS had the highest connectivity (124) andcentrality (1062.4) in the enhancer network. In contrast,the highest connectivity of a TF with TSS-enriched-BSwas 64 and the highest betweenness centrality was 349.4.In addition, we constructed a network of known TF
Figure 5. Networks of TF pairs (human). The network of pairs of co-occurring TFs are shown for (A) the promoter regions and (B) the enhancerregions. (C) A network of TFs mapped onto a PPI network (42). TFs showing preferential binding around the TSS (TSS-enriched-BS) are marked inred, TFs with a depletion of binding sites around the TSS (TSS-depleted-BS) in blue (dark) and TFs showing no preferential binding (uniformlydistributed-BS) in green (light).
8698 Nucleic Acids Research, 2011, Vol. 39, No. 20
Dow
nloaded from https://academ
ic.oup.com/nar/article/39/20/8689/2409562 by guest on 27 N
ovember 2021

interactions [physical binding of pairs of TFs, obtainedfrom a public repository (42)]. Interestingly, the numberof TFs with TSS-enriched-BS and TSS-depleted-BS wasbalanced (both 23%) and these TFs were located ratherat the core of the network (Figure 5C). TBP (TATA boxbinding protein) with TSS-enriched-BS showed the highestconnectivity (62) and betweenness centrality (2055.2) inthe network compared to TFs with TSS-depleted-BSwhich had a maximum connectivity of 20 and amaximum centrality of 401.3.
DISCUSSION
It was suggested previously that combinations of differentcomplexes of TFs offer a plethora of specific gene expres-sion profiles (15). Here, we identified in silico promoter–enhancer modules consisting of combinations of TFsbinding at promoters and enhancers that determinespecific tissue dependent and temporal regulation ofgene expression during development and differentiation.In addition to tissue-specific regulation established bypairs of TFs as shown previously (4), we now also showthat promoter–enhancer modules consisting of pairs ofTFs at promoters and enhancers regulate the progressionof gene expression patterns during development and dif-ferentiation. Furthermore, we found that these enhancersites were rather depleted of Guanin–Cytosin (CpG). Itwas shown recently, that methylation-modifications ofCpG-regions are a major regulation mechanism duringdevelopment (55–57). Enhancer regions therefore maycontribute to a more constitutive regulation programduring development which is rather independent fromthese methylation-modifications. To systematicallyanalyze which TFs might be employed for such a mech-anism, we analyzed the distributions of putative bindingsites from 100 bp downstream to 10 000 bp upstream of theTSS for every family of TF binding sites. Indeed, weidentified three classes comprising binding sites beingenriched at the TSS, depleted at the TSS, and rather uni-formly distributed. The first class is in line with previousstudies identifying TFs with preferential binding close tothe TSS (5,44,48). In addition to this, we found TFsshowing a depletion of binding sites around the TSS andTFs with a uniform binding site distribution which havebeen noted (44) but have not been quantified so far.
Analyzing the identified promoter–enhancer modulesrevealed a number of TFs binding preferentially either at
promoters or at enhancers. For human stem cell differen-tiation, we identified SP1 to preferentially bind at pro-moters. Although SP1 is ubiquitously expressed andregulates gene expression of many constitutively expressedgenes (58,59), its expression was shown to change at dif-ferent developmental stages and in different cell types,suggesting specific roles in distinct developmentalprocesses (60). As SP1-null mice died prenatal, SP1 wasshown to be essential for mouse embryonic development(61). In contrast, members of the FOX (forkhead box)family of TFs had binding sites preferentially located atenhancers of the identified promoter–enhancer modulesproviding temporal specificity during human stem cell dif-ferentiation. FOX TFs have been identified to bind at en-hancers in a number of studies (62–67). FOX proteins aresubstantial in a variety of cellular processes including de-velopment, differentiation, proliferation, apoptosis, andmigration (68). As FOX proteins are regulators for amultitude of biological processes, their deregulation cancontribute significantly to tumorigenesis and cancer pro-gression (68). Various members of this family have beenidentified previously to be implicated in development(69–81). It is to note that we analyzed motif distributionsand statistics for families of TFs sharing the same bindingpreferences. For example, the family of forkhead TFsFOXA1, FOXA2 and FOXA3 share the same bindingmotif even though they can exhibit quite distinct rolesduring developmental processes. It was shown that specif-ically FOXA3 differs from FOXA1 and FOXA2 in severaldevelopmental processes (70). In the data we analyzed, wealso found a rather unalike gene expression pattern forFOXA3 in comparison to FOXA1 and FOXA2 (e.g. incardiomyocytes Pearson’s correlation: FOXA1-FOXA2:0.78, FOXA1-FOXA3: 0.15, FOXA2-FOXA3: 0.63,Supplementary Table S6 shows the median expression ofthese TFs for all tissues). For future projects, it seemsworthwhile studying such abundances of the particularfamily members in more detail employing gene and evenbetter protein expression and phosphorylation data.The CDX family was another group of TFs we
identified at enhancers of our promoter–enhancermodules. cdx genes are closely related to genes of theHox family and are expressed during embryonic develop-ment and gut morphogenesis (82). CDX2 is specificallyrequired during early development and CDX2-null miceare nonviable as the blastocyst fails to implant into theuterus (83). It is to note that our results lack of TFs pre-viously associated to differentiation and development suchas the HOX family of TFs, Oct, Sox or Nanog. This canbe explained by either lack of binding motifs (Nanog) orrather unspecific binding motifs (Hox, Sox, Oct). Due tounspecific motifs, these TFs were omitted by our stringentfiltering settings. Further improvements of existingbinding motifs will allow the identification of these TFsin promoter–enhancer modules when applying ourmethod.We used the identified promoter–enhancer modules to
predict temporal expression of genes during human stemcell differentiation and achieved considerably good predic-tion accuracy (70%). Zinsen et al. (3) used binding sites offive TFs determined by ChIP-on-chip assays at
Table 3. Overview of network properties
Promoternetwork
Enhancernetwork
PPInetwork
TSS-enriched
TSS-depleted
TSS-enriched
TSS-depleted
TSS-enriched
TSS-depleted
Quantity 17 8 23 34 19 19Connectivitya 50 12 124 64 62 20Betweenness
centralitya351.5 0 349.4 1062.4 2055.2 401.3
aFor each TF group, the maximum is shown.
Nucleic Acids Research, 2011, Vol. 39, No. 20 8699
Dow
nloaded from https://academ
ic.oup.com/nar/article/39/20/8689/2409562 by guest on 27 N
ovember 2021

consecutive time points during Drosophila mesodermdevelopment to predict temporal expression of CRMsusing SVMs and achieved a similar good accuracy of71.4%. In contrast, we analyzed the regulation of humancells and used the prediction of TF pairs at promoterand enhancer regions to predict temporal expression ofgenes.Chromatin loops can overcome large distances between
long-range enhancers and proximal promoters and maylead to false positive hits at promoter regions whenscreening promoters with ChIP-chip assays (8,9). So far,most ChiP sequencing studies neglect to assess indirectbinding of TFs. However, it was shown for hepatocytenuclear factor 4, alpha (HNF4A) that identified bindingsites at the promoter occurred mainly at distal regulatoryelements (84). Our results support the fact that key TFsbind preferentially at either promoters or enhancers andthat the interactions between those elements are crucial forspecific gene regulation. Therefore, indirect binding is acentral issue that cannot be neglected in prospective TFbinding site analyses and specifically when analyzingChIP-chip and ChIP-Seq experiments.Time- and tissue-specific regulation of gene expression
is central not only during development but also in allprocesses of a cell in an organism. Here, we identifiedpromoter–enhancer modules that determined specific generegulation during development and revealed distinctbinding site distributions for TFs binding preferentiallyat promoter or enhancer regions. The in silico identifica-tion of combinations of TFs binding at promoters andenhancers yielded generic insights into the temporal regu-lation of gene expression and improved our understandingof enhancer function.
SUPPLEMENTARY DATA
Supplementary Data are available at NAR Online.
ACKNOWLEDGEMENTS
The authors thank Rolf Kabbe and Karlheinz Groß for ITsupport, and Thomas Wolf for fruitful discussions on thestatistical analysis.
FUNDING
Helmholtz Alliance on Systems Biology (SB Cancer,D.141100/07.997); BMBF-FORSYS consortiumViroquant (#0313923); the Nationales Genom-Forschungs-Netz (NGFN+) for the neuroblastomaproject, ENGINE (#01GS0898). The funders had norole in study design, data collection and analysis,decision to publish or preparation of the article.Funding for open access charge: Helmholtz Alliance onSystems Biology.
Conflict of interest statement. None declared.
REFERENCES
1. Makeev,V.J., Lifanov,A.P., Nazina,A.G. and Papatsenko,D.A.(2003) Distance preferences in the arrangement ofbinding motifs and hierarchical levels in organization oftranscription regulatory information. Nucleic Acids Res., 31,6016–6026.
2. Howard,M.L. and Davidson,E.H. (2004) cis-Regulatory controlcircuits in development. Dev. Biol., 271, 109–118.
3. Zinzen,R.P., Girardot,C., Gagneur,J., Braun,M. and Furlong,E.E.(2009) Combinatorial binding predicts spatio-temporalcis-regulatory activity. Nature, 462, 65–70.
4. Ravasi,T., Suzuki,H., Cannistraci,C.V., Katayama,S., Bajic,V.B.,Tan,K., Akalin,A., Schmeier,S., Kanamori-Katayama,M.,Bertin,N. et al. (2010) An atlas of combinatorial transcriptionalregulation in mouse and man. Cell, 140, 744–752.
5. Koudritsky,M. and Domany,E. (2008) Positional distribution ofhuman transcription factor binding sites. Nucleic Acids Res., 36,6795–6805.
6. Woolfe,A., Goodson,M., Goode,D.K., Snell,P., McEwen,G.K.,Vavouri,T., Smith,S.F., North,P., Callaway,H., Kelly,K. et al.(2005) Highly conserved non-coding sequences are associated withvertebrate development. PLoS Biol., 3, e7.
7. Banerji,J., Rusconi,S. and Schaffner,W. (1981) Expression of abeta-globin gene is enhanced by remote SV40 DNA sequences.Cell, 27, 299–308.
8. Horike,S., Cai,S., Miyano,M., Cheng,J.F. and Kohwi-Shigematsu,T. (2005) Loss of silent-chromatin looping andimpaired imprinting of DLX5 in Rett syndrome. Nat. Genet., 37,31–40.
9. Murrell,A., Heeson,S. and Reik,W. (2004) Interaction betweendifferentially methylated regions partitions the imprinted genesIgf2 and H19 into parent-specific chromatin loops. Nat. Genet.,36, 889–893.
10. Grosschedl,R. and Marx,M. (1988) Stable propagationof the active transcriptional state of an immunoglobulinmu gene requires continuous enhancer function. Cell, 55,645–654.
11. Chong,M.M., Simpson,N., Ciofani,M., Chen,G., Collins,A. andLittman,D.R. (2010) Epigenetic propagation of CD4 expressionis established by the Cd4 proximal enhancer in helper T cells.Genes Dev., 24, 659–669.
12. Perkins,A.C., Gaensler,K.M. and Orkin,S.H. (1996) Silencing ofhuman fetal globin expression is impaired in the absence ofthe adult beta-globin gene activator protein EKLF.Proc. Natl Acad. Sci. USA, 93, 12267–12271.
13. Calhoun,V.C., Stathopoulos,A. and Levine,M. (2002)Promoter-proximal tethering elements regulate enhancer-promoterspecificity in the Drosophila Antennapedia complex.Proc. Natl Acad. Sci. USA, 99, 9243–9247.
14. Su,W., Jackson,S., Tjian,R. and Echols,H. (1991) DNA loopingbetween sites for transcriptional activation: self-association ofDNA-bound Sp1. Genes Dev., 5, 820–826.
15. Levine,M. and Tjian,R. (2003) Transcription regulation andanimal diversity. Nature, 424, 147–151.
16. Davidson,E.H., Rast,J.P., Oliveri,P., Ransick,A., Calestani,C.,Yuh,C.H., Minokawa,T., Amore,G., Hinman,V., Arenas-Mena,C.et al. (2002) A genomic regulatory network for development.Science, 295, 1669–1678.
17. Oliveri,P. and Davidson,E.H. (2004) Gene regulatory networkcontrolling embryonic specification in the sea urchin.Curr. Opin. Genet. Dev., 14, 351–360.
18. Bejerano,G., Pheasant,M., Makunin,I., Stephen,S., Kent,W.J.,Mattick,J.S. and Haussler,D. (2004) Ultraconserved elements inthe human genome. Science, 304, 1321–1325.
19. Visel,A., Prabhakar,S., Akiyama,J.A., Shoukry,M., Lewis,K.D.,Holt,A., Plajzer-Frick,I., Afzal,V., Rubin,E.M. andPennacchio,L.A. (2008) Ultraconservation identifies a small subsetof extremely constrained developmental enhancers. Nat. Genet.,40, 158–160.
20. Pennacchio,L.A., Ahituv,N., Moses,A.M., Prabhakar,S.,Nobrega,M.A., Shoukry,M., Minovitsky,S., Dubchak,I., Holt,A.,Lewis,K.D. et al. (2006) In vivo enhancer analysis of humanconserved non-coding sequences. Nature, 444, 499–502.
8700 Nucleic Acids Research, 2011, Vol. 39, No. 20
Dow
nloaded from https://academ
ic.oup.com/nar/article/39/20/8689/2409562 by guest on 27 N
ovember 2021

21. Nobrega,M.A., Ovcharenko,I., Afzal,V. and Rubin,E.M. (2003)Scanning human gene deserts for long-range enhancers. Science,302, 413.
22. Matys,V., Kel-Margoulis,O.V., Fricke,E., Liebich,I., Land,S.,Barre-Dirrie,A., Reuter,I., Chekmenev,D., Krull,M.,Hornischer,K. et al. (2006) TRANSFAC and its moduleTRANSCompel: transcriptional gene regulation in eukaryotes.Nucleic Acids Res., 34, D108–D110.
23. Rahmann,S., Muller,T. and Vingron,M. (2003) On the powerof profiles for transcription factor binding site detection.Stat. Appl. Genet. Mol. Biol., 2, Article7.
24. Westermann,F., Muth,D., Benner,A., Bauer,T., Henrich,K.O.,Oberthuer,A., Brors,B., Beissbarth,T., Vandesompele,J., Pattyn,F.et al. (2008) Distinct transcriptional MYCN/c-MYC activities areassociated with spontaneous regression or malignant progressionin neuroblastomas. Genome Biol., 9, R150.
25. Birney,E., Stamatoyannopoulos,J.A., Dutta,A., Guigo,R.,Gingeras,T.R., Margulies,E.H., Weng,Z., Snyder,M.,Dermitzakis,E.T., Thurman,R.E. et al. (2007) Identification andanalysis of functional elements in 1% of the human genome bythe ENCODE pilot project. Nature, 447, 799–816.
26. Rosenbloom,K.R., Dreszer,T.R., Pheasant,M., Barber,G.P.,Meyer,L.R., Pohl,A., Raney,B.J., Wang,T., Hinrichs,A.S.,Zweig,A.S. et al. (2010) ENCODE whole-genome data in theUCSC Genome Browser. Nucleic Acids Res., 38, D620–D625.
27. Wallerman,O., Motallebipour,M., Enroth,S., Patra,K.,Bysani,M.S., Komorowski,J. and Wadelius,C. (2009) Molecularinteractions between HNF4a, FOXA2 and GABP identified atregulatory DNA elements through ChIP-sequencing.Nucleic Acids Res., 37, 7498–7508.
28. Wederell,E.D., Bilenky,M., Cullum,R., Thiessen,N., Dagpinar,M.,Delaney,A., Varhol,R., Zhao,Y., Zeng,T., Bernier,B. et al. (2008)Global analysis of in vivo Foxa2-binding sites in mouse adultliver using massively parallel sequencing. Nucleic Acids Res., 36,4549–4564.
29. Motallebipour,M., Ameur,A., Reddy Bysani,M.S., Patra,K.,Wallerman,O., Mangion,J., Barker,M.A., McKernan,K.J.,Komorowski,J. and Wadelius,C. (2009) Differential binding andco-binding pattern of FOXA1 and FOXA3 and their relation toH3K4me3 in HepG2 cells revealed by ChIP-seq. Genome Biol.,10, R129.
30. Lupien,M., Eeckhoute,J., Meyer,C.A., Wang,Q., Zhang,Y., Li,W.,Carroll,J.S., Liu,X.S. and Brown,M. (2008) FoxA1 translatesepigenetic signatures into enhancer-driven lineage-specifictranscription. Cell, 132, 958–970.
31. Heintzman,N.D., Stuart,R.K., Hon,G., Fu,Y., Ching,C.W.,Hawkins,R.D., Barrera,L.O., Van Calcar,S., Qu,C., Ching,K.A.et al. (2007) Distinct and predictive chromatin signatures oftranscriptional promoters and enhancers in the human genome.Nat. Genet., 39, 311–318.
32. Blanchette,M., Bataille,A.R., Chen,X., Poitras,C., Laganiere,J.,Lefebvre,C., Deblois,G., Giguere,V., Ferretti,V., Bergeron,D.et al. (2006) Genome-wide computational prediction oftranscriptional regulatory modules reveals new insights intohuman gene expression. Genome Res., 16, 656–668.
33. Rhead,B., Karolchik,D., Kuhn,R.M., Hinrichs,A.S., Zweig,A.S.,Fujita,P.A., Diekhans,M., Smith,K.E., Rosenbloom,K.R.,Raney,B.J. et al. (2010) The UCSC Genome Browser database:update 2010. Nucleic Acids Res., 38, D613–D619.
34. Gautier,L., Cope,L., Bolstad,B.M. and Irizarry,R.A. (2004) Affy–analysis of Affymetrix GeneChip data at the probe level.Bioinformatics, 20, 307–315.
35. Huber,W., von Heydebreck,A., Sultmann,H., Poustka,A. andVingron,M. (2002) Variance stabilization applied to microarraydata calibration and to the quantification of differentialexpression. Bioinformatics, 18(Suppl. 1), S96–S104.
36. Breitling,R. and Herzyk,P. (2005) Rank-based methods as anon-parametric alternative of the T-statistic for the analysis ofbiological microarray data. J. Bioinform. Comput. Biol., 3,1171–1189.
37. Suzuki,H., Forrest,A.R., van Nimwegen,E., Daub,C.O.,Balwierz,P.J., Irvine,K.M., Lassmann,T., Ravasi,T., Hasegawa,Y.,de Hoon,M.J. et al. (2009) The transcriptional network that
controls growth arrest and differentiation in a human myeloidleukemia cell line. Nat. Genet., 41, 553–562.
38. Pachkov,M., Erb,I., Molina,N. and van Nimwegen,E. (2007)SwissRegulon: a database of genome-wide annotations ofregulatory sites. Nucleic Acids Res., 35, D127–D131.
39. Liaw,A. and Wiener,M. (2002) Classification and Regression byrandomForest. R News, 2, 18–22.
40. Breiman,L. (1996) Technical note: Some properties of splittingcriteria. Mach. Learn, 24, 41–47.
41. Benjamini,Y. and Hochberg,Y. (1995) Controlling the FalseDiscovery Rate: A Practical and Powerful Approach to MultipleTesting. J. R. Stat. Soc. B, 57, 289–300.
42. Bader,G.D., Betel,D. and Hogue,C.W. (2003) BIND: theBiomolecular Interaction Network Database. Nucleic Acids Res.,31, 248–250.
43. Heintzman,N.D. and Ren,B. (2007) The gateway to transcription:identifying, characterizing and understanding promoters in theeukaryotic genome. Cell Mol. Life Sci., 64, 386–400.
44. FitzGerald,P.C., Shlyakhtenko,A., Mir,A.A. and Vinson,C. (2004)Clustering of DNA sequences in human promoters. Genome Res.,14, 1562–1574.
45. Xie,X., Lu,J., Kulbokas,E.J., Golub,T.R., Mootha,V., Lindblad-Toh,K., Lander,E.S. and Kellis,M. (2005) Systematic discovery ofregulatory motifs in human promoters and 3’ UTRs bycomparison of several mammals. Nature, 434, 338–345.
46. Yokoyama,K.D., Ohler,U. and Wray,G.A. (2009) Measuringspatial preferences at fine-scale resolution identifies known andnovel cis-regulatory element candidates and functional motif-pairrelationships. Nucleic Acids Res., 37, e92.
47. Vardhanabhuti,S., Wang,J. and Hannenhalli,S. (2007) Positionand distance specificity are important determinants ofcis-regulatory motifs in addition to evolutionary conservation.Nucleic Acids Res., 35, 3203–3213.
48. Tharakaraman,K., Bodenreider,O., Landsman,D., Spouge,J.L. andMarino-Ramirez,L. (2008) The biological function of some humantranscription factor binding motifs varies with position relative tothe transcription start site. Nucleic Acids Res., 36, 2777–2786.
49. Zhu,X., Gerstein,M. and Snyder,M. (2007) Getting connected:analysis and principles of biological networks. Genes Dev., 21,1010–1024.
50. Estrada,E. (2006) Virtual identification of essential proteins withinthe protein interaction network of yeast. Proteomics, 6, 35–40.
51. Hahn,M.W. and Kern,A.D. (2005) Comparative genomics ofcentrality and essentiality in three eukaryotic protein-interactionnetworks. Mol. Biol. Evol., 22, 803–806.
52. Plaimas,K., Eils,R. and Konig,R. (2010) Identifying essentialgenes in bacterial metabolic networks with machine learningmethods. BMC Syst. Biol., 4, 56.
53. Plaimas,K., Mallm,J.P., Oswald,M., Svara,F., Sourjik,V., Eils,R.and Konig,R. (2008) Machine learning based analyses onmetabolic networks supports high-throughput knockout screens.BMC Syst. Biol., 2, 67.
54. Rahman,S.A. and Schomburg,D. (2006) Observing local andglobal properties of metabolic pathways: ‘load points’ and ‘chokepoints’ in the metabolic networks. Bioinformatics, 22, 1767–1774.
55. Lei,H., Oh,S.P., Okano,M., Juttermann,R., Goss,K.A.,Jaenisch,R. and Li,E. (1996) De novo DNA cytosinemethyltransferase activities in mouse embryonic stem cells.Development, 122, 3195–3205.
56. Okano,M., Bell,D.W., Haber,D.A. and Li,E. (1999) DNAmethyltransferases Dnmt3a and Dnmt3b are essential forde novo methylation and mammalian development. Cell, 99,247–257.
57. Borgel,J., Guibert,S., Li,Y., Chiba,H., Schubeler,D., Sasaki,H.,Forne,T. and Weber,M. (2010) Targets and dynamics of promoterDNA methylation during early mouse development. Nat. Genet.,42, 1093–1100.
58. Imataka,H., Sogawa,K., Yasumoto,K., Kikuchi,Y., Sasano,K.,Kobayashi,A., Hayami,M. and Fujii-Kuriyama,Y. (1992) Tworegulatory proteins that bind to the basic transcription element(BTE), a GC box sequence in the promoter region of the ratP-4501A1 gene. EMBO J., 11, 3663–3671.
59. Gidoni,D., Kadonaga,J.T., Barrera-Saldana,H., Takahashi,K.,Chambon,P. and Tjian,R. (1985) Bidirectional SV40 transcription
Nucleic Acids Research, 2011, Vol. 39, No. 20 8701
Dow
nloaded from https://academ
ic.oup.com/nar/article/39/20/8689/2409562 by guest on 27 N
ovember 2021

mediated by tandem Sp1 binding interactions. Science, 230,511–517.
60. Saffer,J.D., Jackson,S.P. and Annarella,M.B. (1991)Developmental expression of Sp1 in the mouse. Mol. Cell. Biol.,11, 2189–2199.
61. Marin,M., Karis,A., Visser,P., Grosveld,F. and Philipsen,S. (1997)Transcription factor Sp1 is essential for early embryonicdevelopment but dispensable for cell growth and differentiation.Cell, 89, 619–628.
62. De Val,S., Chi,N.C., Meadows,S.M., Minovitsky,S.,Anderson,J.P., Harris,I.S., Ehlers,M.L., Agarwal,P., Visel,A.,Xu,S.M. et al. (2008) Combinatorial regulation of endothelialgene expression by ets and forkhead transcription factors. Cell,135, 1053–1064.
63. Yamagishi,H., Maeda,J., Hu,T., McAnally,J., Conway,S.J.,Kume,T., Meyers,E.N., Yamagishi,C. and Srivastava,D. (2003)Tbx1 is regulated by tissue-specific forkhead proteins through acommon Sonic hedgehog-responsive enhancer. Genes Dev., 17,269–281.
64. Cirillo,L.A., Lin,F.R., Cuesta,I., Friedman,D., Jarnik,M. andZaret,K.S. (2002) Opening of compacted chromatin by earlydevelopmental transcription factors HNF3 (FoxA) and GATA-4.Mol. Cell, 9, 279–289.
65. Chaya,D., Hayamizu,T., Bustin,M. and Zaret,K.S. (2001)Transcription factor FoxA (HNF3) on a nucleosome at anenhancer complex in liver chromatin. J. Biol. Chem., 276,44385–44389.
66. Gualdi,R., Bossard,P., Zheng,M., Hamada,Y., Coleman,J.R. andZaret,K.S. (1996) Hepatic specification of the gut endodermin vitro: cell signaling and transcriptional control. Genes Dev., 10,1670–1682.
67. McPherson,C.E., Shim,E.Y., Friedman,D.S. and Zaret,K.S. (1993)An active tissue-specific enhancer and bound transcription factorsexisting in a precisely positioned nucleosomal array. Cell, 75,387–398.
68. Myatt,S.S. and Lam,E.W. (2007) The emerging roles of forkheadbox (Fox) proteins in cancer. Nat. Rev. Cancer, 7, 847–859.
69. Perreault,N., Katz,J.P., Sackett,S.D. and Kaestner,K.H. (2001)Foxl1 controls the Wnt/beta-catenin pathway by modulating theexpression of proteoglycans in the gut. J. Biol. Chem., 276,43328–43333.
70. Friedman,J.R. and Kaestner,K.H. (2006) The Foxa family oftranscription factors in development and metabolism.Cell Mol. Life Sci., 63, 2317–2328.
71. Lee,C.S., Friedman,J.R., Fulmer,J.T. and Kaestner,K.H. (2005)The initiation of liver development is dependent on Foxatranscription factors. Nature, 435, 944–947.
72. Wan,H., Dingle,S., Xu,Y., Besnard,V., Kaestner,K.H., Ang,S.L.,Wert,S., Stahlman,M.T. and Whitsett,J.A. (2005) Compensatoryroles of Foxa1 and Foxa2 during lung morphogenesis.J. Biol. Chem., 280, 13809–13816.
73. Lai,E., Prezioso,V.R., Tao,W.F., Chen,W.S. and Darnell,J.E. Jr(1991) Hepatocyte nuclear factor 3 alpha belongs to a genefamily in mammals that is homologous to the Drosophilahomeotic gene fork head. Genes Dev., 5, 416–427.
74. Ang,S.L. and Rossant,J. (1994) HNF-3 beta is essential for nodeand notochord formation in mouse development. Cell, 78,561–574.
75. Weinstein,D.C., Ruiz i Altaba,A., Chen,W.S., Hoodless,P.,Prezioso,V.R., Jessell,T.M. and Darnell,J.E. Jr (1994) Thewinged-helix transcription factor HNF-3 beta is required fornotochord development in the mouse embryo. Cell, 78, 575–588.
76. Besnard,V., Wert,S.E., Kaestner,K.H. and Whitsett,J.A. (2005)Stage-specific regulation of respiratory epithelial celldifferentiation by Foxa1. Am. J. Physiol., 289, L750–L759.
77. Hulander,M., Wurst,W., Carlsson,P. and Enerback,S. (1998) Thewinged helix transcription factor Fkh10 is required for normaldevelopment of the inner ear. Nat. Genet., 20, 374–376.
78. Labosky,P.A. and Kaestner,K.H. (1998) The winged helixtranscription factor Hfh2 is expressed in neural crest and spinalcord during mouse development. Mech. Dev., 76, 185–190.
79. Brody,S.L., Yan,X.H., Wuerffel,M.K., Song,S.K. andShapiro,S.D. (2000) Ciliogenesis and left-right axis defects inforkhead factor HFH-4-null mice. Am. J. Resp. Cell Mol. Biol.,23, 45–51.
80. Chen,J., Knowles,H.J., Hebert,J.L. and Hackett,B.P. (1998)Mutation of the mouse hepatocyte nuclear factor/forkheadhomologue 4 gene results in an absence of cilia and randomleft-right asymmetry. J. Clin. Invest., 102, 1077–1082.
81. Tuteja,G. and Kaestner,K.H. (2007) SnapShot: forkheadtranscription factors I. Cell, 130, 1160.
82. Beck,F. and Stringer,E.J. The role of Cdx genes in the gut and inaxial development. Biochem. Soc. Trans., 38, 353–357.
83. Strumpf,D., Mao,C.A., Yamanaka,Y., Ralston,A.,Chawengsaksophak,K., Beck,F. and Rossant,J. (2005) Cdx2 isrequired for correct cell fate specification and differentiation oftrophectoderm in the mouse blastocyst. Development, 132,2093–2102.
84. Rada-Iglesias,A., Wallerman,O., Koch,C., Ameur,A., Enroth,S.,Clelland,G., Wester,K., Wilcox,S., Dovey,O.M., Ellis,P.D. et al.(2005) Binding sites for metabolic disease related transcriptionfactors inferred at base pair resolution by chromatinimmunoprecipitation and genomic microarrays. Hum. Mol. Genet.,14, 3435–3447.
8702 Nucleic Acids Research, 2011, Vol. 39, No. 20
Dow
nloaded from https://academ
ic.oup.com/nar/article/39/20/8689/2409562 by guest on 27 N
ovember 2021