Embed Size (px)
Citation preview
Enhanced versus Passive Mutual Fund Indexing: Has DFA Outperformed Vanguard by Enough to Justify its Advisor and Transaction Fees? 2008 draft. A revision of this paper is forthcoming in the Journal of Investing, with an expected publication date of winter 2009. Edward Tower & Cheng-Ying Yang Edward Tower is a professor at Duke University in Durham, NC. [email protected]. Cheng-Ying Yang is a PhD candidate in economics at the University of Wisconsin, Madison. [email protected] Abstract
Passive and enhanced index funds are two important options for investors. Vanguard is the largest provider of passive indexed funds, and DFA is one of the major providers of enhanced indexed funds, with uniquely close ties to academic financial research and an illustrious board of directors. Vanguard has low fees and investors can buy Vanguard funds directly. DFA’s fees are higher and one can invest in DFA funds only through an advisor, who charges for the service. Moreover, one must pay transactions fees to a custodian. We ask whether DFA has outperformed Vanguard by enough to justify the additional fees.
Passive and enhanced index funds are two important options for investors. It is
worthwhile to compare the performance of the two, and such a comparison is best
between particularly reputable fund families offering these instruments. Vanguard is the
largest provider of passive indexed funds and it has low fees. DFA is one of the major
providers of enhanced indexed funds (using stock screens which are unique to them),
with uniquely close ties to academic financial research and an illustrious board of
directors (including Eugene Fama, Kenneth French, Roger Ibbotson, Robert Merton and
Myron Scholes). Thus a comparison between the two families is instructive.
Investors can buy Vanguard funds directly. DFA’s fees are higher and one can
invest in DFA funds only through an advisor, who charges for the service. Moreover,
2
with DFA one must pay transactions fees to a custodian for periodic rebalancing. We ask
whether DFA has outperformed Vanguard by enough to justify the additional fees.
HOW BIG ARE ADVISOR AND TRANSACTIONS FEES FOR DFA?
The “Retire Early” home page characterizes itself as “The Online Magazine for
people who used to work for a living.” Its (2007) guide to “low-cost, fixed fee, DFA
investment advisors” lists nine advisors. Its (2008) discussion of different prices that
different DFA advisors charge discusses the nature of the different services available.
John Conrath reports that SimplyDFA charges $100 a month regardless of account size.
Buckingham and Halcyon charge on a sliding scale. Larry Swedroe reports that
Buckingham charges $40,000/year for a portfolio of $10 million and the web site reports
that Halcyon charges $50,000 for a portfolio of $10 million. The site estimates an annual
transaction fee with TD Ameritrade for portfolios with 15 DFA funds, rebalanced once
each year, of $465 for a $100K account and the smaller $360 for a larger $10 million
account.
This means that an investor with a $100K portfolio who rebalances once per year
could conceivably pay in advisor and transaction fees as little as
[$1200+$465]/$100K=1.665% per year. An investor with $10 million could pay as little
as [$1200+$360]/$10 million = 0.0156% or as much as [$50K+$360]/$10 million =
0.504%. Thus, it is likely that DFA accounts over $100K incur between 1.665%/year and
0.0156%/year in advisor and transactions costs that Vanguard accounts avoid, although
some advisors provide additional services.2
HAS DFA OUTPERFORMED VANGUARD BEFORE STYLE ADJUSTMENT?
We start by asking whether Vanguard’s portfolio of indexed equity mutual funds has
beaten DFA’s on the bases of risk and return. Our data is from the Center for Research in
Securities Prices (CRSP) online database, and all of our returns are adjusted for inflation,
where our inflation figures are changes in the U.S. consumer price index, recorded on
Morningstar Principia Pro disks.

3
Our returns are real geometric average returns, continuously compounded. We report
these as opposed to annualized rates because of their desirable adding-up quality, namely
that the geometric average return for a long period is the average of the geometric
average returns for the shorter periods.
A second reason is that we can subtract the advisor and transactions fees (say 1% per
year) from the continuously compounded rate of return (say 8%) and get the net rate of
return (say 7%), which is what the investor would have netted if 1/250th of this (1%) fee
had been collected on each business day (a good approximation to collecting fees
quarterly). Had we used annualized rates, calculating the net rate of return would have
been more complex. We use real returns, because return risk measures, like the standard
deviation of return, are only sensible when return is real.
Our periods run from the beginning of 1999 through the end of 2006. We choose the
starting date to enable us to have a large number of Vanguard index funds to work with,
as three of the funds we wished to work with were introduced in 1998. Exhibit 1 lists the
Vanguard index funds we work with, their inception dates, and the indexes they currently
track (these indexes have changed over time for some of the funds). Some are not true
index funds: Mid cap growth, International explorer (an international small cap fund),
International growth, and International value are all actively managed funds.3 However,
Vanguard has no index funds in these categories, and these are categories which we
wanted to have represented, so for our study we refer to these as Vanguard index funds.
The essential characteristics of index funds are low turnover, low cost, and constant style.
All the Vanguard funds we consider have those characteristics. Since the Admiral funds
were established after the beginning of 1999, we exclude them and work with the
investor class.
We used all 28 DFA equity funds that were not institutional or tax managed or sector
funds (like real estate) or funds of funds (which are represented by their component
funds). Some of these were not in existence during the entire 8 year period. Here is the
list of the codes. DEMSX DFALX DFAVX DFBMX DFCSX DFCVX DFELX DFEMX
DFETX DFEVX DFFVX DFHBX DFISX DFIVX DFJSX DFLCX DFLVX DFRSX
DFSCX DFSTX DFSVX DFUKX DFUSX DFUVX DFVFX DFVIX DISVX DIVTX.

4
Morningstar classifies these as index funds. For more precision, we call them enhanced
index funds.
In Exhibit 2 we report the real continuously compounded returns for both the DFA
stock portfolio and the Vanguard index portfolio. We use the monthly portfolio figures
showing total assets under management provided in CRSP to weight the portfolio at the
beginning of each month. Thus our Vanguard returns are the returns received by
Vanguard index investors (in the index funds considered) on average.
Over the entire period DFA beat Vanguard. DFA’s geometric average, continuously
compounded return is 8.86% per year higher than Vanguard’s and DFA’s standard
deviation of return is slightly higher.
The difference is significant. Using Microsoft Excel’s “t test paired two sample for
means” test the t is 3.17, and luck could have accounted for a better performance by DFA
with only a 0.051% probability.
Does this mean that investors should forsake Vanguard funds in favor of DFA funds?
HAS DFA OUTPERFORMED VANGUARD’S STYLE-MIMICKING
PORTFOLIOS?
DFA may have outperformed Vanguard because DFA funds were focused on the
right styles. The DFA portfolios are heavily weighted with small and value stocks. Thus
to compare the DFA portfolios with the Vanguard index portfolios is unfair when the
styles that DFA favors have done relatively well (unless one is interested in the efficacy
of style choice). This point was made convincingly by Kizer [2005] in evaluating Reinker
and Tower [2004]. Also, see Malkiel [2007, p. 265], who shows that from 1937 through
1968 value dramatically underperformed growth, while from 1969 through May 2006,
the reverse was true, so over the entire period the value and the growth portfolios with
dividends reinvested both returned 10.6%/year. To address this issue, we find the
portfolio of Vanguard index funds which best mimics the style of the DFA portfolio. To
do that we use a method of Sharpe [1992], which is also described and used in Rodriguez
and Tower [2008].
We describe the monthly real return of the DFA portfolio as the real monthly return
of a comparison basket of Vanguard index funds plus a constant term. The constant term

5
reflects what is special about DFA funds relative to Vanguard funds. If it is positive it
might reflect lower published expenses, lower brokerage costs, inexpensive block trades,
the return from lending securities, better stock picking, or better screens used in selecting
stocks for DFA. Since we use monthly data, we assume that the Vanguard basket is
rebalanced monthly. We want to select the Vanguard basket that as nearly as possible is
made up of the same types of securities as in the DFA portfolio. Since we don’t observe
the securities we pick the basket which generates a set of returns which, apart from the
constant term, most closely follows the DFA returns. More precisely, we select the
weights on the Vanguard index funds and the constant term which minimizes the
variance of the difference in the returns of the DFA portfolio and the Vanguard
mimicking index.
The method of calculation is the following. We use Microsoft Excel’s solver add-in.
This easy-to-use add-in allows one to select portfolio weights to minimize a variable
subject to constraints. We program solver to select the weights on the returns of the
Vanguard funds and the constant term which minimize the variance of the return
differential between the DFA portfolio and the Vanguard basket augmented by the
constant term such that no weight is negative (signifying that no Vanguard fund is sold
short) and the weights add to one (signifying that the various Vanguard funds in the
Vanguard portfolio comprise the entire portfolio, so their proportions in the portfolio sum
to one).
The outperformance of the DFA portfolio is the geometric average real return
continuously compounded of the DFA portfolio minus the same for the Vanguard
portfolio. It is close to the constant term from the regression, but since the regression uses
monthly real return (not continuously compounded) it is a little bit different.4 The
software we use is different from that used in Rodriguez and Tower [2008], but the
technique is the same, and this simpler software is easier to use. The program is available
from us upon request.
Exhibits 3 and 4 present the results of these simulations. The leftmost column of
Exhibit 3 shows the real continuously-compounded return differential favoring DFA for
each of the 8 years. The average is 3.81%/year. The subsequent columns show the same
calculation for the same period broken into 4 two-year sub periods, 2 four-year sub

6
periods and a single period. For the single 8-year period the differential is 2.57%/year,
and using the same test as in the previous section, the probability that DFA’s
outperformance could be explained by luck is 0.552%, with a t value of 2.59.
We see that the average real DFA returns are between 1.00% per year and 3.81% per
year higher than Vanguard’s style-mimicking returns, with the average depending on how
many periods we break the eight year span into. These differentials are measures of how
much, on the grounds of the return differential associated with DFA funds, it is worth
paying an advisor and a custodian. The net differential return from investing in DFA
funds is the differential we calculate minus the advisor and transaction fee. Obviously, to
the extent that advisors provide other services it is worth paying advisors more. As Eric
Haas has stressed to us, such services include prudent tax-loss harvesting, asset
allocation, and avoiding various temptations like market timing and investing in hot
funds or sectors.
Exhibit 4 shows the portfolio weights for each of the simulations. Notice the high
weights on small and value stocks that characterize DFA portfolios.5
DFA outreturns Vanguard in 1999 and 2000, but underreturns in the two year period
1999-2000. This is not a mistake. For 1999 and for 2000 we have 12 observations and 10
funds in the style mimicking index, so we don’t have much confidence that we got the
style mimicking index right in calculations involving a single year. For short period
analysis it would be better to use daily or weekly data from Yahoo. The two year
differentials vary considerably, and this indicates how reliable our averages are. Each of
our simulations benchmarks DFA against a different continuously rebalanced Vanguard
portfolio, so differences are to be expected.
The last column of Exhibit 3 shows the differential between the standard deviations
of monthly continuously compounded real returns over the entire 8 years. We see that
DFA has a standard deviation that is 6 hundredths of a percentage point higher. Using the
Modigliani & Modigliani [1997] technique to risk adjust the portfolios brings the return
differential down by 0.1% . 6
HAS THE DFA PORTFOLIO OUTPERFORMED A VANGUARD PORTFOLIO
WITH THE SAME FAMA-FRENCH FACTOR LOADS?

7
It is worthwhile to check the robustness of our work by linking it to the Fama-French
approach to predicting stock returns, and it is essential here since Fama and French’s
work informs the construction of DFA funds and the selection of DFA portfolios. One
possible reason for our result that DFA outperforms is that over the period, value funds
have outperformed growth funds, small cap funds have outperformed large cap funds,
and the DFA portfolio is more heavily weighted toward small and value styles than are
any of the Vanguard portfolios.
the regression method
To test this we performed the Fama-French [1992] regression. We followed FF in
using monthly nominal returns of all variables for the 8 year period: 1999 through 2006.
(In all other sections we used real returns.) We regressed the DFA portfolio return net of
the FF risk-free return on the FF market return net of the risk-free return, the return of the
FF small company portfolio minus that of the FF big company portfolio (SMB), and the
return of the FF value portfolio [high book value relative to the market valuation] minus
that of the FF growth portfolio [low book value relative to the market valuation] (HML).
All of these FF variables are available on French’s up-to-date web site. We term the
regression coefficients the FF loads, and the individual coefficients are termed the loads
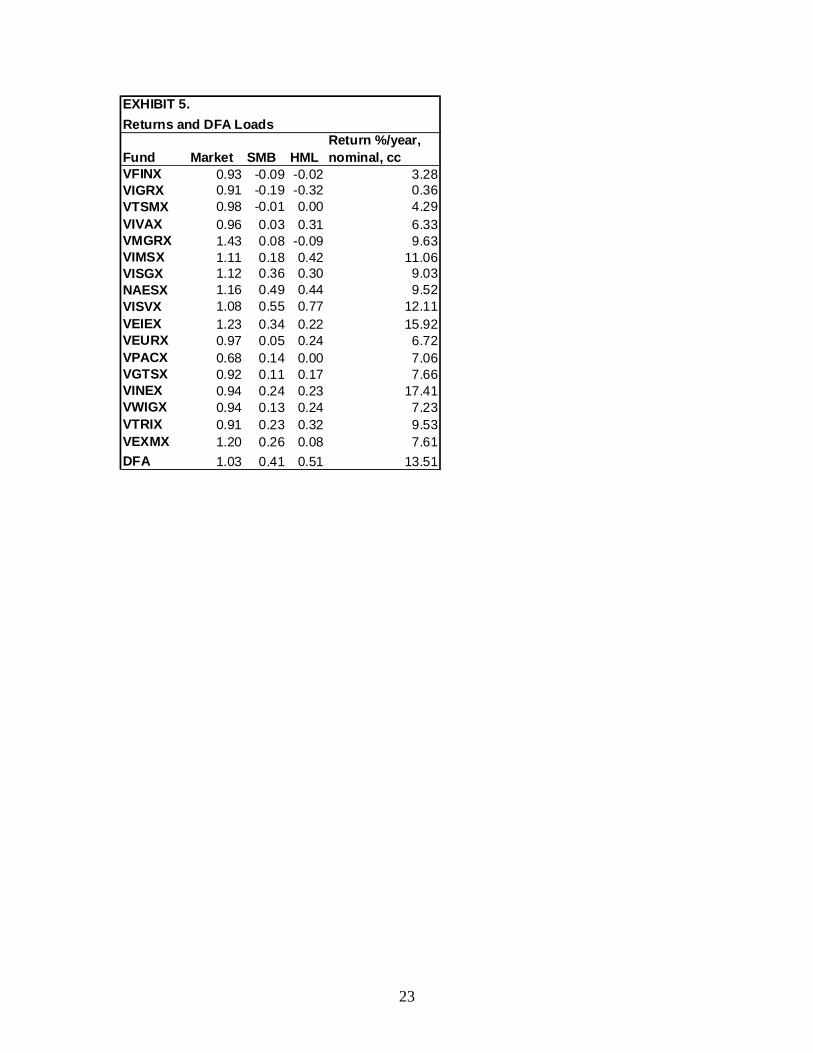
for “the market,” “SMB” and “HML.” We performed the same regression for VISVX,
Vanguard’s small company value index. The weights on both SMB and HML turned out
to be higher for VISVX (0.546 and 0.774) than for DFA (0.415 and 0.514). Thus DFA’s
outperformance over the style mimicking Vanguard funds is not due to lack of Vanguard
funds with adequate small or value weights. Surprisingly, VISVX underperforms the
DFA portfolio (12.11 %/year versus 13.51%/year nominal and continuously
compounded) by 1.40%/year.
The FF loads for DFA and all 17 Vanguard funds are shown in Exhibit 5. Small
company funds have large SMB’s and Value funds have large HML’s.
Next we regressed the geometric average nominal returns (continuously
compounded) of the 17 Vanguard index funds on their FF weights. This equation is the
return of the representative Vanguard fund expressed as a linear function of a constant
and the three FF weights. We asked what return is predicted by this equation when we
plug the FF loads for the DFA portfolio into this equation. We call this the return of the

8
Vanguard FF load-mimicking portfolio. It turns out to be 12.14%/year nominal and
continuously compounded. That is 1.37% less than the 13.51% return of the DFA
portfolio. The differential is right in the middle of the four estimates in Exhibit 3.
the simulation method
At the risk of boring the reader we used yet another method of answering the
same question. This has the advantage of showing how much DFA outperforms a specific
Vanguard portfolio. It has the disadvantage of focusing on just a few Vanguard funds. A
portfolio of Vanguard mutual funds will have the same FF coefficients as the FF
coefficients of the individual funds multiplied by the portfolio weights.
To see an example of how this holds, the reader can regress Y1 on X1, X2, and
X3 where the X’s are observations on three variables over time. Now regress Y2 on the
same three variables. Then regress .5*Y1+.5*Y2 on the same three variables. The
coefficients of the last regression will equal the average of the corresponding coefficients
of the first two regressions. If we interpret the Y1 and Y2 as monthly returns on two
Vanguard funds net of the risk free return, and the X’s as monthly observations on the
three FF factors, we conclude that a portfolio consisting of equal amounts of mutual
funds Y1 and Y2, rebalanced monthly, will have the same FF loads as the average of the
funds Y1 and Y2.
We tell the solver to find the mix of Vanguard funds to make a portfolio that
matches the three FF factors, while tracking the DFA portfolio as closely as possible.
Thus we use the Sharpe method as in the rest of the paper with the additional constraints
that the FF loads must be replicated. As in the earlier part of this section we use nominal
returns, and we work with nominal portfolio returns minus the nominal risk free returns,
to replicate the FF analysis.
The Vanguard portfolio which best tracks the DFA portfolio is made up of 42%
VISVX, 28% NAESX, 14% VTRIX, 6% VIVAX, and 10% VPACX. Not surprisingly it
is a portfolio weighted toward smallness and value. The continuously compounded
nominal geometric return of this portfolio is 7.89% per year, 3.02% less than the DFA
return of 10.91%, and the DFA portfolio has a standard deviation of monthly return
which is 0.09% pts /year lower. The return differential lies within the differentials of

9
Exhibit 3. The calculations in this section establish that DFA outperforms Vanguard in a
way that is not captured by the FF loads.
HAVE CONSTANT-STYLE DFA PORTFOLIOS OUTPERFORMED STYLE-
MIMICKING VANGUARD PORTFOLIOS?
The outperformance of the DFA portfolios above reflect both the quality of the DFA
funds and the quality of the advisors who steered their clients to particular funds. Is it
possible to strip out the influence of the advisors? Yes, and to do this we compare the
performance of constant-style DFA portfolios with their style-mimicking Vanguard
counterparts. We examine the differential returns over the period covering the span of 8
years and ending December 31, 2006. We perform the simulation for the portfolio
weights at the beginning of the period and the weights at the end of the period. The
results are presented in Exhibit 6.
The constant-style DFA portfolio beat its Vanguard counterpart by 2.7%/year using
portfolio weights at the start of 1999 and 2.8%/year using portfolio weights at the end of
2006. These are within the extremes of the four calculations for the average over
performance of the actual DFA portfolio, shown in Exhibit 3. This makes us question
whether DFA advisors and clients made prescient adjustments.
Over the entire period, the DFA standard deviation of monthly return is six or seven
hundredths of one percent higher than that of its Vanguard counterpart. The correlations
between the monthly returns are 98% in both cases. The fact that we work with real
returns means that these correlations are lower than they would be if we worked with
nominal returns.
The DFA return is higher when we use end of period weights (11.5%/year) than when
we use start of period weights. (10.8%/year). This is what we expect, since appreciated
funds subsequently account for larger shares of market portfolios.
The return differential favoring DFA is slightly higher, when we use end of period
weights than when we use start of period weights. The reason the differential is not
substantially higher when we use end period weights is because the return of the style-
mimicking portfolio is also higher using end period weights. In fact, we did not expect
the differential to be any higher at all using end period weights.

10
This is an important methodological issue. Barron’s in its annual ranking of
mutual fund families weights last year’s returns by current assets which makes mutual
fund families with large differences in the returns of its various mutual funds look better
than they should look. The problem is limited by the fact that Barron’s publishes only
rankings, and not returns, although we think it would be better to publish returns. For one
of Barron’s rankings see Strauss [2005] and for criticism of it, see Reinker, Tower and
Zheng [2005].
HAVE DFA ADVISORS BEEN PRESCIENT STYLE PICKERS?
Did DFA advisors earn their fees? Advisors provide a range of services. Here we test
for one. Were they prescient style pickers? To test this we compare how DFA investors
did with how they would have done if they had consulted CRSP and each month invested
with the portfolio weights that DFA investors in the aggregate used 12 months
previously. The analysis is shown in Exhibit 7. We find that over the entire 8 year period,
the actual return beat the return with stale weights by 23 hundredths of one percentage
point per year, but it was slightly riskier with an annual standard deviation of return of 41
hundredths of one percent per year higher. The probability that luck explains the excess
return is 19.7%, according to Excel’s paired t test. Two financial advisors who
commented on a previous version of this paper argued that it is not the job of the advisor
to make prescient style choices, but they may be doing it anyway.
SUPPOSE BIG WERE TO BEAT SMALL AND GROWTH WERE TO BEAT
VALUE
GMO [2008] predicts that for the U.S. stock market over the next seven years large
company stocks are likely to out-return small ones by 0.5%/year, and growth stocks are
likely to outperform value by 2.1%/year, and Tower [2008] finds that GMO’s predictions
have been useful guides. What would the realization of GMO’s predictions do for
Vanguard’s returns relative to DFA’s? To answer this we regressed the differential in
favor of the DFA portfolio relative to the 8-year Vanguard style-mimicking portfolio
(where the DFA and Vanguard returns are real and continuously compounded) on SMB
and HML. The mean differential is 2.57%/year, as indicated in Exhibit 3. If we assume
that SMB and HML had been both zero, using the estimated regression equation we

11
calculate the mean differential return to fall to 1.70%/year. If both SMB and HML are -
2% /year, reflecting GMO’s fears, the differential return falls to 1.44%/year.
Finally we use the same regression to ask what underperformance by both small and
value would be required to have brought the Vanguard’s raw (non-style mimicking)
portfolio’s return into equality with DFA’s. If both value and growth had underperformed
by 0.304% per month, roughly 3.71% per year, the two portfolios would have had
identical returns.
DO THE CONCLUSIONS CARRY OVER TO THE WHOLE HISTORY OF DFA?
Two readers wondered whether our conclusions carried over to a longer time period.
Here we attempt to answer them. DFA established its first fund in 1981, DFA U.S. Micro
Cap, (DFSCX), and did not establish its second until after the start of 1982. At that time
Vanguard had no Value or Small Value funds. It did have the Vanguard small Cap Equity
Fund (NAESX), which is the most comparable fund. We compare the monthly returns of
the two funds from the start of 1982 through the end of 2006. We regressed the
differential in favor of DFSCX (where the returns are real and continuously compounded)
on SMB and HML. The mean differential is 2.73% /year. If SMB and HML had been
both zero, we calculate the mean differential would have fallen to 1.80%/year. If both
SMB and HML had been -2%/year, the differential return would have fallen to 1.13% per
year. The longer time period does not markedly change the conclusion that DFA out-
returned Vanguard. Also, In neither this section nor the preceeding one does the sign of
the differential change in response to a weaker performance of small and value relative to
large and growth.
WHAT HAPPENS WHEN WE BREAK THE DFA PORTFOLIO INTO
DOMESTIC AND FOREIGN FUNDS?
To see if the return differential was markedly different for foreign and domestic
funds, we replicated the analysis for split portfolios. Over the 8 year period, the DFA
portfolio of domestic funds beat the style adjusted portfolio of Vanguard domestic funds
by 2.61 %/year continuously compounded. The corresponding differential for the
international funds was 3.59 %/year continuously compounded. Both exceed Exhibit 3’s
12
2.57% calculated for the portfolio as a whole. In this calculation we did not use the DFA
funds which invested both in the US and abroad.
We also asked whether the DFA domestic portfolio outperformed the Vanguard
domestic portfolio with the same Fama-French loads. Using the regression approach
discussed above, DFA’s outperformance was 2.72%/year continuously compounded and
using the simulation method it was again possible to replicate DFA’s factor load with a
Vanguard portfolio of domestic funds and DFA’s outperformance was 3.90%/year. The
corresponding numbers for the whole DFA portfolio, as previously discussed, were
1.37%/year and 3.02%/year respectively.
Thus, breaking the portfolio into domestic and international components made
DFA look better relative to Vanguard.
TAXES
How do taxes affect the cost of using an advisor? If the funds are not in a tax
advantaged account, the fees charged by advisors are classified as miscellaneous
expenses on one’s 1040. You lose the first 2% of your adjusted gross income in
deductions (i.e. On a $100K income, with $3K in advisor fees, and no other
miscellaneous expenses, you can only deduct $1K). And if you don't itemize, or if you
are subject to alternative minimum tax, you may not get any deduction for those fees at
all. The net effect of this is that for many/most individuals, if you pay an advisor 1%, it's
an after-tax 1%. For investors with a combined federal and state tax burden of perhaps
40%, that's a significant issue. You divide 1% by (1-.40) for a cost equivalent to 1.67%.
This raises the threshold by which DFA must outperform, perhaps quite significantly.
Throughout the paper we have ignored tax issues, assuming that investments are in a
tax-deferred account and advisor fees are paid out of that account. We justify this by
suggesting that if one believes in market efficiency, non-systematic risk is your friend. A
sensible strategy for non-tax advantaged investments is to invest in individual stocks
instead of mutual funds, and when one needs cash sell off the losers for capital losses,
thereby postponing capital gains tax on the winners or eliminating that tax altogether by
bequeathing appreciated securities to heirs.

13
SUMMARY
We conclude that DFA’s performance relative to Vanguard’s, before advisor fees are
subtracted, has been impressive. Specifically, during the period encompassing 1999
through 2006, before advisor fees:
a. Before style adjustment DFA outperformed Vanguard by 8.9 percent per year.
b. The DFA portfolio outperformed Vanguard’s style-mimicking portfolio by 2.57
percent per year. This reflects the quality of DFA funds relative to Vanguard’s as
well as the choices that DFA advisors and their clients make. It, like the rest of
our calculations, assumes that Vanguard’s portfolios are rebalanced every month.
c. The DFA portfolio outperformed Vanguard’s Fama-French load-mimicking
portfolio by 1.4 or 3.0 percentage points per year, depending on the method of
analysis.
d. The DFA constant-style portfolio over the entire 8 year period (using beginning
period weights) outperformed the style-mimicking Vanguard portfolio by 2.7
percent per year. This reflects the quality of the DFA funds relative to
Vanguard’s.
e. Using end-period weights DFA’s performance is higher (11.5%/year as opposed
to 10.8%/year for start period weights). This illustrates the general principle that
using later period weights, as Barron’s does in their annual studies of mutual fund
families, overstates portfolio performance, because the proportion of the market
portfolio rises in funds that have appreciated, although in Barron’s defence,
Barron’s publishes only rankings, not absolute performance, but this makes its
studies less worthwhile.
f. The DFA portfolio outreturned the DFA portfolio using portfolio weights that are
a year old by 0.23 percent per year, with a higher standard deviation of real return
of 0.41 percent per year. Thus, DFA clients and their advisors outreturned what
they would have done if they had selected their portfolios as the portfolios that
DFA investors used a year ago.
g. DFA outperformed by 1.44%/year the style-mimicking Vanguard portfolio in a
simulation which assumed that value under-returned growth and small under-

14
returned large by 2% per year. The positive sign occurred in spite of DFA’s
orientation toward small and value stocks.
h. Breaking the portfolios into a domestic and a foreign component improves the
margin by which DFA beats Vanguard. Over the 8 year period, the DFA portfolio
of domestic funds beat the style adjusted portfolio of Vanguard domestic funds by
2.61 %/year continuously compounded. The corresponding differential for the
international funds was 3.59 %/year continuously compounded.
CONCLUSION
Focusing on all our results, DFA’s equity portfolio has substantially outperformed
Vanguard’s index portfolio from the beginning of 1999 through the end of 2006. But
much of that is due to DFA’s emphasis on small and value stocks. Still, even after
adjusting the Vanguard portfolio to achieve comparable style, DFA outperformed.
We do find that advisors performed a service in generating higher returns for
investors than could be achieved by replicating past portfolios, but the differential does
not pass a standard significance test.
Our major result is that over the eight year period: 1999-2006, the DFA portfolio
outperformed the Vanguard portfolio which mimicked its style by 2.57%/ year. The result
was bracketed for the average annual outperformance, where we adjusted the Vanguard
comparison index annually and every two years: 3.81%/year and 1.00%/year. An
investor with $100K could pay as little as 1.265% per year in advisor and transaction
fees, which would have left him with a 1.165% surplus from making the switch. Taking
the middle number, an investor with $10Million could pay as little as 0.0116%/year
which would have left her with a 2.42% surplus. Risk adjusting these differentials
reduces them by 0.1%/year. Thus, the enhanced indexing strategy of DFA has, over the
period considered, outperformed the passive indexing strategy of Vanguard.
We wonder whether a portion of the DFA outperformance may reflect its indexation
of parts of the market which were previously unindexed, which pushed up the returns to
these market segments during the period when these new indexes were coming to market.
If that is the case then one would not expect to see such outperformance replicated in the
future. However, we do not see evidence of a shrinking performance differential.

15
Perhaps some of screens used by DFA could be fruitfully employed by Vanguard.
Perhaps Vanguard could fruitfully offer a total DFA stock portfolio, which would be a
single mutual fund which consists of all DFA funds with the asset weights determined by
those of the aggregate of DFA clients. This asset would piggyback on the advice that
DFA advisors give their clients, without collecting an explicit fee for advisors, beyond
what Vanguard would charge for including the fund in its portfolio.

16
REFERENCES Fama, E. F. and K. R. French. “The Cross-Section of Expected Stock Returns.” Journal of Finance, 47 (2) June 1992), pp. 427-465. French, K. R. Data Library. 2007. Benchmarks, Fama/French Factors, http:mba.tuck.dartmouth.edu/pages/faculty/ken.french/data_library.html #BookEquity. (2007). GMO. GMO’s 7-Year Equity Forcasts as of December 31, 2007. https://www.gmo.com. (January 2008). Kizer, J. “Index Fundamentalism Revisited: Redux.” The Journal of Portfolio Management, 31 (1) (Winter 2005), pp. 112-119. Malkiel, Burton G. A Random Walk Down Wall Street. New York: Norton 2007. Modigliani, F. and L. Modigliani. “Risk-Adjusted Performance.” The Journal of Portfolio Management. 23 (2) (Winter 1997), pp. 45-54. Reinker, K. S., and E. Tower. “Index Fundamentalism Revisited.” The Journal of Portfolio Management, 30 (4) (Summer 2004), pp. 37-50. Reinker, K. S., E. Tower and W. Zheng. “Ranking Realities.” Barron’s, 84 (11) (Mar 14, 2005), p.38. Rodriguez, A. and E. Tower. “Do Vanguard’s Managed Funds Beat Its Index Funds? Looking for Prescient Stock and Style Selection. ” Journal of Indexes, 11 (1) (March 2008), pp. 26-35. Sharpe, William F. “Asset Allocation: Management Style and performance Measurement.” Journal of Portfolio Management, (Winter 1992), 18 (1) pp. 7-19. Strauss, L.“Family Matters.” Barron’s, 84 (6) February 7, 2005. The Retire Early home page. “Low-cost, fixed-fee DFA investment advisors.” http://www.retireearlyhomepage.com/dfaadv.html. July 1, 2007. The Retire Early home page. “Analyzing he ‘high-fee’ DFA-approved advisor’s sales pitch.” http://www.retireearlyhomepage.com/low_fee_dfa.html. 2008. Tower, E. “Are GMO’s predictions prescient? Using Them to Predict Vanguard’s Mutual Fund Returns.” Duke Economics Working Paper. http://www.econ.duke.edu/Papers/PDF/GMO_Predictions1.pdf (2008).
17
ENDNOTES
This paper is drawn from Yang’s master’s thesis, which was advised by Tower. Thanks go to
Charles Becker, William J. Bernstein, John Bogle, Karl Boulware, Ed Burmeister, Cooper Davidson, Rick Ferri, David Garver, Eric E. Haas, John Greaney, Trey Hanna, John Justice, Jared Kaizer, Kevin Laughlin, Mel Lindauer, Eric Nels, Karl Pfleger, David Porter, Allen Sleeman, Phil Steinmeyer, Larry Swedroe, Jeffrey C. Troutner, Lauren Vignec, and the Vanguard Diehards web discussion group, without implying their approval.
1 The DFA web page is a useful source, and the discussions of DFA on the Vanguard Diehards web page indicates how important the issue is to many investors. 2 The link to Ameritrade's fee schedule is https://www.advisorclient.com/Announce/TDA_FeeSchedule.pdf Ameritrade charges a higher fee for each transaction for accounts under $500,000 in value. That's why a client pays $465 for 15 transactions in a $100,000 account and only $360 for 15 transactions in a $10 million account. Some advisors are able to negotiate a discount to the standard fee schedule if they can bring a large book of business to the custodian, but Ameritrade considers the size of the discount to be proprietary and doesn’t advertise it. Larry Swedroe commented on an earlier version of this paper: It is important to understand “what services are offered. For example we [Buckingham] provide estate and tax and risk management (insurance advice) in one integrated plan--the low cost advisors typically do none of these things. We also rebalance and Tax manage throughout the year, they do not typically. This is important especially for tax management. We also manage separate account fixed income assets and charge no manager fee while other firms use mutual funds and have those expenses. So take example of 50% equity allocation and 50% bond allocation and expenses of bond fund of say 20bp then that saves 10bp on the whole portfolio and you get other benefits like loss harvesting at individual security level and also tailoring muni portfolios to specific states. And then of course there are skill issues, which impossible to quantify.” 3Vanguard adopted International Explorer only in July 2002, but we use it in all of our calculations. Its expense ratio was 1.50% prior to its adoption, compared to 0.55% afterwards, with a fall in turnover of 34%age points. This illustrates Vanguard’s commitment to low cost and low turnover. Our treatment of this fund biases our results against Vanguard as does our use of Vanguard’s investor class rather than Admiral shares. This overestimates the expense ratio that Vanguard’s larger investors suffer by about 0.1%/year. 4 The regression coefficient is the average arithmetic return differential. This difference reflects continuous compounding in calculating the geometric average return and that when the return varies, the geometric average return is always less than the average arithmetic return. 5 We compare the entire DFA portfolio with style-adjusted constant-portfolio-weight Vanguard portfolios in order to ask: could a bundle of Vanguard funds replicate (after advisor and transactions fees) what DFA does? If not, then an investor with the preferences of the average investor in DFA funds should invest with DFA, and as we discuss in the conclusion, in this case Vanguard would serve this investor by offering a fund that duplicates the aggregate DFA performance.
We could have asked whether a constant-portfolio-weight DFA portfolio could replicate the Vanguard portfolio. However, many DFA funds have similar return patterns, and there are more relevant DFA funds than there are relevant Vanguard funds. Consequently, such a calculation would be tedious. Also, DFA’s offerings have changed over the sample period, so we can’t perform that analysis without excluding more recently founded DFA funds.
We could have performed the analysis for individual DFA funds, but nonsystematic risk is an issue with individual funds, although not with entire portfolios as non-systematic risk cancels out. Thus to determine risk-return tradeoffs it is better to work with entire portfolios. Also, since DFA advises advisors that sell its funds, we presume that the DFA portfolio reflects what DFA believes are choices that put

18
investors on the efficient frontier. Finally, we know of one advisor who himself picks the portfolio of DFA funds for his clients, so it would not be useful for them to have information on individual DFA funds.
We chose Vanguard index funds over ETF’s, because ETF’s have not been around long enough to provide an adequate series, and the DFA funds are not ETF’s. We looked for index funds from a fund family that a large number of informed investors who value low expenses would be likely to consider as an alternative to DFA.
6 In the exhibits, we do not risk adjust the returns. To see how important this failure is, following Modigliani and Modigliani [1997] we add enough of a low-risk asset to the DFA portfolio to bring its standard deviation of real return down to that of the Vanguard portfolio. Our risk adjusted DFA portfolio consists of 1.27% of the Vanguard short-term investment grade bond fund and 98.73% of the DFA portfolio, This adjustment shrinks the return differential in favor of DFA from 2.57%/year to 2.47%/year. So one tenth of one percent of the return differential is accounted for by the additional risk of the DFA portfolio.

19
EXHIBIT 1 Vanguard Funds
Symbol Fund nameinception date index tracked
1 NAESX small cap index 1960 MSCI U.S. small cap 17502 VDMIX developed markets index 2000 MSCI EAFE 3 VEIEX emerging markets index 1994 Select emerging markets free 4 VEURX european stock index 1990 MSCI europe5 VEXMX extended market index 1987 S&P completion index (all U.S. stocks
except those in the S&P500 index)6 VFINX 500 index 1976 S&P 5007 VGTSX total international stock index 1996 VEURX,VPACX & VEIEX combined.8 VIGRX growth index 1992 MSCI U.S. prime market growth 9 VIMSX mid cap index 1998 MSCI US mid cap 450 index
10 VINEX international explorer 1996 small international11 VISGX small cap growth index 1998 MSCI U.S. small cap growth12 VISVX small cap value index 1998 MSCI U.S. small cap value13 VIVAX value index 1992 MSCI U.S. prime market value14 VLACX large cap index 2004 MSCI U.S. prime market 75015 VMGRX mid cap growth fund 1997 mid cap with best growth prospects16 VPACX pacific stock index 1990 MSCI pacific17 VTRIX international value 1983 non-U.S. value18 VTSMX total stock market index 1992 MSCI U.S. broad market19 VWIGX international growth 1981 non-U.S. growth

20
EXHIBIT 2
YearDFA
average real return
Vanguard average
real return
Differential: DFA minus
Vanguard
1999 14.27 18.34 -4.072000 -3.47 -17.02 13.542001 4.15 -14.28 18.422002 -14.61 -25.79 11.182003 40.01 25.56 14.442004 18.01 9.37 8.642005 9.26 3.98 5.282006 19.64 12.86 6.78
Average 10.91 2.05 8.86
SD 4.39 4.30 0.09In all exhibits, except 5, returns are continuously compounded, real geometric average returns in %/year; SD is the standard deviation of these monthly returns expressed as %/month.
Did DFA Beat Vanguard When We Don't Adjust for Style?

21
EXHIBIT 3DID DFA OUTPERFORM VANGUARD’S STYLE-MIMICKING PORTFOLIOS?
Conclude: DFA generally outreturns. Over the entire periodDFA's standard deviation of return is higher.
1.00
3.295.54
4average
2.886.15
8 2 11
4.054.05
1.29 0.062
2.57
2.573.81
SD diff: DFA-Vg (%/mo)
Return differential: DFA-Vg (%/yr)
0.062
-3.92
4.32
2.23
1.39
4.85-0.29
year
19992000200120022003
# of periods
0.96
1.62200420052006

22
EXHIBIT 4Vanguard Portfolio Weights for EXHIBIT 3's Style-Mimicking Simulations (%)
Smal
l
Em
ergi
ng
Euro
pe
Extd
Mkt
SP50
0
Tot I
ntl
Gro
wth
Mid
cap
Intl
Expl
r
Sm
all g
row
Smal
l val
ue
Valu
e
Paci
fic
Intl
Valu
e
Intl
grow
th
NAE
SX
VEI
EX
VEU
RX
VEXM
X
VFI
NX
VGTS
X
VIG
RX
VIM
SX
VIN
EX
VISG
X
VIS
VX
VIV
AX
VPAC
X
VTRI
X
VWIG
X
1 1999 9 0 0 0 0 0 0 0 7 0 46 24 0 3 11 1002 2000 23 15 6 0 0 0 0 5 5 0 0 24 11 0 10 1003 2001 33 12 2 0 0 0 0 0 31 0 15 5 1 0 0 1004 2002 33 12 2 0 0 0 0 0 31 0 15 5 1 0 0 1005 2003 39 11 0 0 0 0 0 0 12 0 0 22 0 15 0 1006 2004 52 0 0 7 0 0 0 0 31 0 10 0 0 0 0 1007 2005 40 17 0 4 0 0 0 0 16 0 0 15 0 7 0 1008 2006 0 11 0 0 15 0 0 0 18 34 0 4 19 0 0 1009 99-'00 23 0 5 0 0 0 4 0 12 0 23 21 5 6 0 100
10 01-'02 30 10 1 0 0 0 0 0 21 0 20 8 2 8 0 10011 03-'04 50 4 0 0 0 11 0 0 19 0 0 3 0 12 0 10012 05-'06 0 7 0 11 9 0 0 0 24 30 13 0 0 0 6 10013 99-'02 19 6 8 0 0 0 3 0 8 0 33 15 6 2 0 10014 03-'06 47 5 0 1 0 11 0 0 22 2 0 4 0 8 0 10015 99-'06 24 4 2 0 0 0 0 0 10 0 28 16 5 12 0 100
Conclude: Vanguard's tracking indexes vary but they are largely small and value.VDMIX,VLAC and VTSMX were awarded zero weights in all cases, so they don't appear.
Sim
ulat
ion
Year
s
SUM
23
EXHIBIT 5.Returns and DFA Loads
Fund Market SMB HMLReturn %/year, nominal, cc
VFINX 0.93 -0.09 -0.02 3.28VIGRX 0.91 -0.19 -0.32 0.36VTSMX 0.98 -0.01 0.00 4.29VIVAX 0.96 0.03 0.31 6.33VMGRX 1.43 0.08 -0.09 9.63VIMSX 1.11 0.18 0.42 11.06VISGX 1.12 0.36 0.30 9.03NAESX 1.16 0.49 0.44 9.52VISVX 1.08 0.55 0.77 12.11VEIEX 1.23 0.34 0.22 15.92VEURX 0.97 0.05 0.24 6.72VPACX 0.68 0.14 0.00 7.06VGTSX 0.92 0.11 0.17 7.66VINEX 0.94 0.24 0.23 17.41VWIGX 0.94 0.13 0.24 7.23VTRIX 0.91 0.23 0.32 9.53VEXMX 1.20 0.26 0.08 7.61DFA 1.03 0.41 0.51 13.51

24
EXHIBIT 6po
rtfol
io
wei
ghts Ret'n:
DFA (%/yr)
Ret'n diff: DFA-Vg (%/yr)
SD diff: DFA-Vg (%/mo)
correlation between DFA & Vg N
AESX
VEIE
XVE
XMX
VIG
RX
VIN
EXVI
SVX
VIVA
XVP
ACX
VTR
IX
SUM
start 10.79 2.72 0.066 0.98 22 0 2 1 10 33 15 5 12 100end 11.48 2.80 0.056 0.98 8 10 4 0 11 29 15 7 15 100
All returns are real and continuously compounded.
Did DFA's constant style portfolios beat Vanguard's style mimicking portfolios (1999-2006)?
DFA's constant style portfolios beat Vanguard's style mimicking portfolios by 2.72 & 2.80%/year
Conclude: DFA's return is higher and its return differential is slightly higher using end period weights. These resutls reflect higher market shares of appreciated styles.

25
EXHIBIT 7Were DFA Advisors Prescient Style Pickers?
Year
DFA average real return (a) (%/yr)
DFA average real return with 12 month earlier weights (b) (%/yr)
Differential: (a-b). Advantage of current portfolio weights (%/yr)
1999 14.27 13.91 0.362000 -3.47 -0.88 -2.592001 4.15 3.42 0.732002 -14.61 -14.64 0.032003 40.01 39.61 0.402004 18.01 17.37 0.642005 9.26 8.00 1.252006 19.64 18.66 0.98
Average 10.91 10.68 0.23SD 15.37 14.96 0.41Conclude: Over whole period DFA with current weightsbeat DFA with stale weights by 23 hundredths of a percentper year, but with a higher standard deviation of return of41 hundredths of a percent/year.The probability that luck explains the excess return is 19.7%.


![KELLOGG SCHOOL OF MANAGEMENT, NORTHWESTERN …faculty.haas.berkeley.edu/vissing/vissing_nberma_article.pdftherein]), (2) the small firm effect (small stocks have outperformed large](https://img.dokumen.tips/doc/110x75/5e7477a72bf99b0a2431a76e/kellogg-school-of-management-northwestern-therein-2-the-small-irm-effect.jpg)