Embed Size (px)
Citation preview
Enhanced Target and Clutter Separation by Sensor and Data Fusion
By Abraham Lesnik
Northrop Grumman Corp., Rolling Meadows IL
Introduction
In developing systems whose purpose it is to protect aircraft from missile attack, an importantproblem is the detection and tracking of small missiles, where the missiles approach the aircraftat high speed, and in a high clutter environment. The goals are to: (1) detect the presence of amissile, (2) correctly identify the missile (and in particular not mistake a missile for clutter), and(3) track and jam the missile effectively.
This paper discusses goal (2), describing improvements in the ability to separate IR targets fromclutter, due to employment of sensor and data fusion. These techniques are utilized inconjunction with more standard techniques which are specific to individual sensors, includingmatched filtering (spatial or spectral), windowing, gating, integration, and adaptive thresholding.
Fusion Benefit
The expectation of potential benefit with this approach is based on the utilization of multiplesensors and characteristics. The sensors employed may span regions in space, time, or spectrumthat are disparate or that overlap in whole or in part. The sensor’s measurement characteristicsmay also differ for parameters such as field of view, field of regard, sampling rate, frequencyresolution, angular resolution, quantization accuracy.
An example of the potential benefit of sensor and data fusion may be in fusing data from IR andUV sensors. In this case, the fact that the frequency response peaks of IR and UV sensors occurat different wavelengths may be exploited by utilizing information from both sensors todifferentiate among and classify, sources which radiate primarily in the IR, or the UV, or in bothdomains. Sensor fusion also allows improved track confirmation and continuity. For example,one sensor type can maintain a track that might otherwise be lost by a different sensor type duefor example to effects such as atmospheric obscuration. These factors result in higher confidenceprobability of detection, improved suppression of false alarms, and thus enhanced survivability
Approach
Approved for public release; distribution is unlimited.

Form SF298 Citation Data
Report Date("DD MON YYYY") 00001999
Report TypeN/A
Dates Covered (from... to)("DD MON YYYY")
Title and Subtitle Enhanced Target and Clutter Separation by Sensor and Data Fusion
Contract or Grant Number
Program Element Number
Authors Lesnik, Abraham
Project Number
Task Number
Work Unit Number
Performing Organization Name(s) and Address(es) Northrop Grumman Corp. Rolling Meadows, IL
Performing Organization Number(s)
Sponsoring/Monitoring Agency Name(s) and Address(es) Monitoring Agency Acronym
Monitoring Agency Report Number(s)
Distribution/Availability Statement Approved for public release, distribution unlimited
Supplementary Notes
Abstract
Subject Terms
Document Classification unclassified
Classification of SF298 unclassified
Classification of Abstract unclassified
Limitation of Abstract unlimited
Number of Pages 12
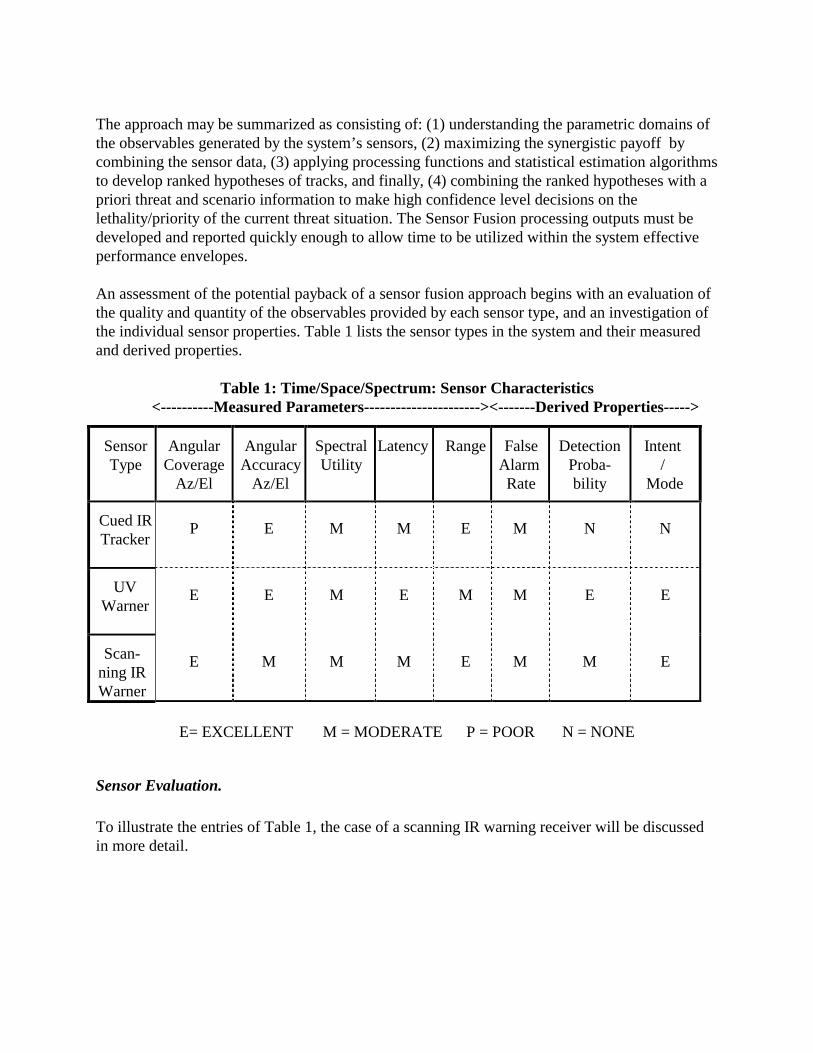
The approach may be summarized as consisting of: (1) understanding the parametric domains ofthe observables generated by the system’s sensors, (2) maximizing the synergistic payoff bycombining the sensor data, (3) applying processing functions and statistical estimation algorithmsto develop ranked hypotheses of tracks, and finally, (4) combining the ranked hypotheses with apriori threat and scenario information to make high confidence level decisions on thelethality/priority of the current threat situation. The Sensor Fusion processing outputs must bedeveloped and reported quickly enough to allow time to be utilized within the system effectiveperformance envelopes.
An assessment of the potential payback of a sensor fusion approach begins with an evaluation ofthe quality and quantity of the observables provided by each sensor type, and an investigation ofthe individual sensor properties. Table 1 lists the sensor types in the system and their measuredand derived properties.
Table 1: Time/Space/Spectrum: Sensor Characteristics <----------Measured Parameters----------------------><-------Derived Properties----->
SensorType
AngularCoverage
Az/El
AngularAccuracy
Az/El
SpectralUtility
Latency Range False Alarm Rate
DetectionProba-bility
Intent/
Mode
Cued IRTracker
P E M M E M N N
UVWarner
E E M E M M E E
Scan-ning IRWarner
E M M M E M M E
E= EXCELLENT M = MODERATE P = POOR N = NONE
Sensor Evaluation.
To illustrate the entries of Table 1, the case of a scanning IR warning receiver will be discussedin more detail.
The IR receiver is a scanning sensor which has large angular coverage (e. g., a quadrant) inintervals of the order of tenths of a second. Angular accuracies in azimuth and elevation are onthe order of a fraction of a degree. A standard method of reducing false alarm rate is to integratethe observations over time. For example, a valid detection may require observation of the signalover two or three consecutive scans. With regard to latency, as the enforcement of threatvalidation criteria becomes more stringent, the latency time between observations tends toincrease. Derived (or computed) information such as threat intent, or time to intercept, may beobtained on the basis of consecutive observations. Rough range of the observed object may becomputed on the basis of intensity of the object, if the type of the object has been identified (e. g.,by other means). The IR sensor also addresses attributes such as burn time and engine thrust,which may be utilized to discriminate between aircraft and missiles.
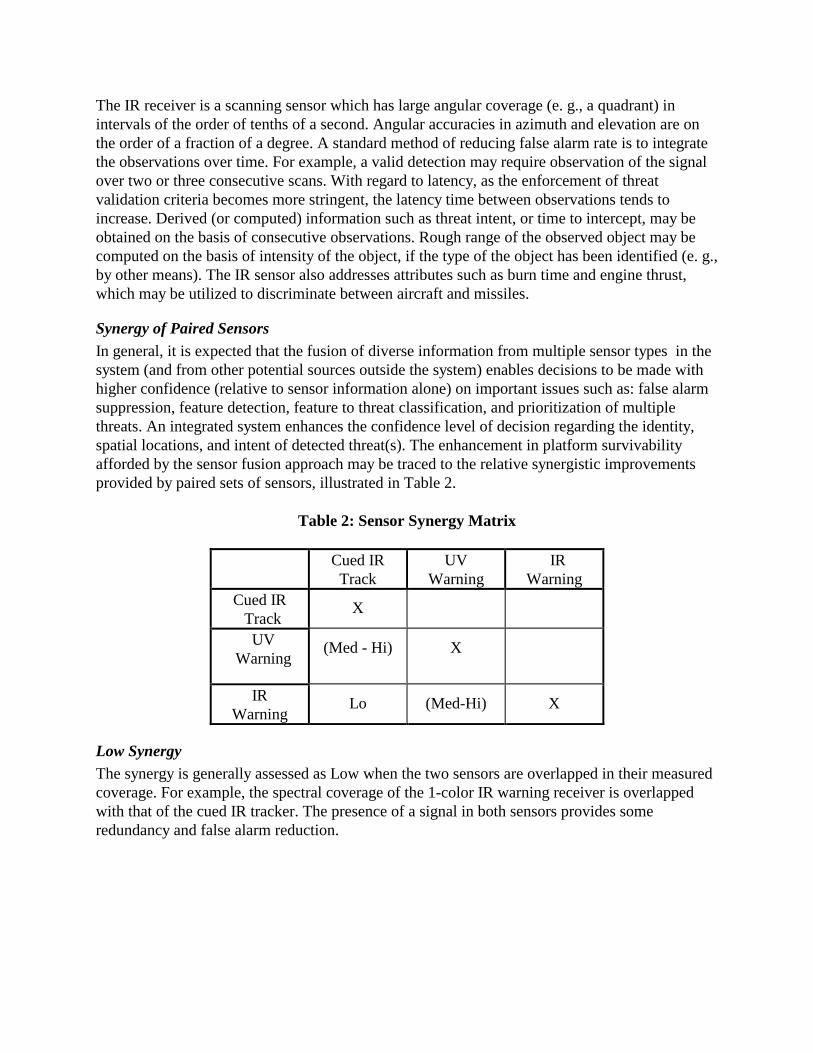
Synergy of Paired SensorsIn general, it is expected that the fusion of diverse information from multiple sensor types in thesystem (and from other potential sources outside the system) enables decisions to be made withhigher confidence (relative to sensor information alone) on important issues such as: false alarmsuppression, feature detection, feature to threat classification, and prioritization of multiplethreats. An integrated system enhances the confidence level of decision regarding the identity,spatial locations, and intent of detected threat(s). The enhancement in platform survivabilityafforded by the sensor fusion approach may be traced to the relative synergistic improvementsprovided by paired sets of sensors, illustrated in Table 2.
Table 2: Sensor Synergy Matrix
Cued IRTrack
UVWarning
IRWarning
Cued IRTrack
X
UVWarning
(Med - Hi) X
IRWarning
Lo (Med-Hi) X
Low SynergyThe synergy is generally assessed as Low when the two sensors are overlapped in their measuredcoverage. For example, the spectral coverage of the 1-color IR warning receiver is overlappedwith that of the cued IR tracker. The presence of a signal in both sensors provides someredundancy and false alarm reduction.

Medium-High SynergyMedium-high synergy is assessed when paired sensors are employed such that (1) the sensorshave disparate spectral coverages, and (2) the sensors differ substantially in resolution. Forexample, the cued IR sensor has high angular resolution and thus capability for following angularrate of change. Hence the presence of a signal in both the cued IR and the cued UV warningsensors, particularly if it has persistence, is judged as med-high synergy. This means a medium-high confidence that the system will make the correct decision on whether an observation is athreat or a false alarm.
As the overlap in parametric coverage increases, the synergy tends to decrease. For example,there is more spectral overlap between 2-color IR and 1-color IR sensors than there is betweeneither of these and a UV sensor. Hence the cued IR track synergy with the 2-color IR warningsensor is assessed as medium.
Fundamental Assumption
The fundamental assumption of the present approach is that there are systematic differencesbetween missiles and clutter, as regards a number of observables (or discriminants), as measuredby various sensors. For example, the IR signature of a missile in flight certainly differs from thatof most IR background clutter, most of the time. The intensity is not, however, the only measuredquantity which is useful as a discriminant in separating targets from clutter. We have selectedseven such quantities: (1) Intensity (2) Intensity Rate (3) Increasing Intensity Trend (5)Decreasing Intensity Trend (5) Line of Sight (LOS) Rate (6) Feature Size (pixels) (7) Rate ofChange of Size (pixels per second).
Systematics of Missile and Clutter Differences
The systematics of the differences between missile and clutter are obtained by operating onmissile live-fire test data, and on clutter measurement data. This data is processed and reducedstatistically, resulting in characteristic curves representing the probability of occurrence of eachof the seven parameters above.
Typically the processing consists of operating on missile and clutter time profiles. These arefitted with smooth curves, and then utilized to generated occurence histograms, to yield forexample the probability of occurrence of a given interval of intensity. The missile probability isthen obtained by calculating the percentage of time a given intensity interval occurred formissiles, as compared to all occurrences including clutter.
System OperationDuring system operation, the observables flow in from the different sensors systems to the targetrecognition processing at a given rate, coming either directly from the sensor or derived from thesensor report. False alarm recognition processing proceeds as follows:
1. Read the observed or derived observables.

2. Find the probability of occurrence of each observable by table look up in the pre-storedchararacterization tables.
3. Compute the aggregate missile confidence factor obtaining the average probability ofoccurrence of all participating observables.
4. Classify the tracked object as a missile or false alarm by testing the average confidenceagainst a threshold. The threshold will be based on the mean and standard deviation of theconfidence factor distribution (a Gaussian, by the Central Limit Theorem).
A diagram illustrating the target recognition processing for the Intensity and LOS rate is shownin Figure 1. The red and blue curves represent the characterization data for missiles and clutter,respectively. The dashed lines indicate how a particular observation is utilized to look up themissile and clutter probability, which are then used to calculate the aggregate confidence factoraverage.
Figure 1, Fusion Model Scoring Decision
1. Enter Database with data item value2. Look Up Corresponding Probability for Missile and Clutter3. Compute Factor: wi = (Pmi )/(Pci )4. Compute confidence: C = Σ i (w i ⋅ P mi ) / (Σ i w i )
1
1. Hall, D.L., Mathematical Techniques in Multisensor Data Fusion, Artech 1992
Need For Multiple Discriminants
In order to maintain good separation between missile and clutter over different operationalconditions, including different types of clutter and types of missiles, multiple discriminants areemployed. The need for this may be demonstrated by Figure 2 and 3, showing missiles in an urbanclutter background. Figure 3 shows only the pixels whose intensity exceeds a maximum thresholdvalue. Note that even in this case there is clutter which persists, potentially impacting the missileclutter separation efficiency.

Figure 2: Missile in (a) Urban and (b) Desert Clutter
Figure 3: Missile in (a) Urban, (b) Desert Clutter - Thresholded at Maximum Intensity
The reason for the contamination may be seen in Figure 4a, showing histograms of the IRintensities of missile and clutter. While the missile intensities are, as expected, much higher thanthe clutter, there is a tail in the clutter histogram that extends to high intensity. (The tail may bemore clearly seen in Figure 4b, which plots the histograms of Figure 4a on a log scale). This shows
(a)
Missile
FuelFragments
(b)
(b)
Missile
(a)

that the thresholding cannot eliminate the clutter, based on intensity alone. In addition, limiteddynamic range may result in saturation of the missile intensity, which has the effect of bringing themissile and clutter intensities closer together, making their separation more difficult.
10 20 30 40 50 60 700
2000
4000
6000
Figure 4a & b Histogram of Missile and Clutter Intensity
MissileUrban Clutter
0 10 20 30 40 50 60 70 800
1
2
3
4
Intensity Bin
# Occurrences
Figures 5 and 6 are additional examples of high clutter intensities leaking into the data, showingthis effect for different clutter (jet engines and fires) and missile types.
Figure 5 Missile Against (a) Jet Engine and (b) Fire Background

Figure 6 Missile Against (a) Jet Engine and (b) Fire Background (Thresholded For MaximumIntensity)
Characteristic Curves
(a) (b)
Missile
Fires
(b)Missile Jet
Engine(2)
(a)

Data was taken on more than a dozen missile shots utilizing two sensor types, (1) a high resolutionIR imaging camera, and (2) a UV sensor system. Similar measurement equipment was utilized togather clutter data, as part of a clutter measurement program designed to gather data spanning arange of environmental conditions, from “benign” to “high stress” clutter. The two sensor systemsof course covered different spectral regions, and both measured aspect angle, LOS rate, size, andsize rate. This data was analyzed as was previously described, and was utilized to generatecharacteristic curves, one for each of the seven discriminants, each of which yielded the missileprobability versus a the discriminant.
The seven characteristic curves (or tables) are the essential ingredient for achieving the “enhancedseparation of missile and target” referred to in the title. The separation is accomplished by simplylooking up the missile probability for (up to) seven discriminants, where the discriminants areobtained from the reports coming from the sensor data; they are utilized as indices into thecharacteristic curves. Finally, the overall missile probability is obtained by averaging the individualprobabilities, including possible utilization of weighting factors.
This procedure is “front loaded” in that nearly all the work goes into the generation of thecharacteristic curves, which is done ahead of mission time. The product of this, the curves ortables, are then stored on-board. The final answer the question of interest: “Is it a missile?”, is amatter of (up to) 7 table look-ups, a weighted average calculation, and a threshold comparison.These tasks consume very little processing time.
Plots of Missile/Clutter Differences and Probability
Plots of the differences between missile and clutter for each of the 7 discriminants are presentedbelow, shown on the left. Plots of the corresponding missile probability for each discriminant arepresented below, shown on the right.
Intensity 00Intensity Rate
0 1 2 3 4 5
x 10-8
10-2
10-1
100
101
Watts/cm2
Intensity @90% RH
% Occurrences
MissilesClutter
0 0.5 1 1.5 2 2.5 3 3.5 4 4.5
x 10-8
0
0.2
0.4
0.6
0.8
1
Probability of Missile Intensity (90% Rel Hum)
Watts/cm2
Prob
abilit
y
MissileSmoothed Data
0 0.5 1 1.5 2 2.5 3 3.5
x 10-9
0.1
0.2
0.3
0.4
0.5
0.6
0.7
0.8
0.9
1
Watts/cm2/sec
Intensity Rate Magnitude @90% RH
Prob
abilit
y MissileSmoothed
-1 -0.5 0 0.5 1
x 10-8
10-2
10-1
100
Watts/cm2/sec
% O
ccur
renc
es
Intensity Rate @90% RH
MissileAppx2
Increasing and Decreasing Intensity Trend
Line of Sight (LOS) Rate
0 1 2 3 4 5 6 70
10
20
30
40
50Intens ity Trend
Time (sec )
% In
reas
ing
Inte
nsity
MissileClutter
0 1 2 3 4 5 6 70
10
20
30
40
Time (sec )
% D
ecre
asin
g In
tens
ity
0 1 2 3 4 5 6 70
0.1
0.2
0.3
0.4
0.5
0.6
0.7
0.8
0.9
1
Intensity Trend
Time (sec)
Prob
of I
ncre
asin
g/D
ecre
asin
g In
tens
ity
IncreasingDecreasing
5 10 15 20 25 30 35 40 45 50 55
10-2
10-1
100
101
LOS Rate (Degrees/sec)
% O
ccur
renc
es
Line Of Sight Rate
MissileClutter
0 5 10 15 20 25 300
0.2
0.4
0.6
0.8
1
M issile Probability Vs. LOS Rate
LOS Rate (Degrees/sec)
Probability
0 Deg Az30 Deg Az90 Deg Az(500 ft. AGL)

Size
Size Rate
Preliminary Laboratory Test Results
0 5 10 15 20 25 30 35 40 45 500
0.2
0.4
0.6
0.8
1
Probability of Missile in Clutter
Size (Pixels)Pr
obab
ility
0 5 10 15 20 25 30 35 40 45 500
1
2
3
4
5
6
7
8
9
10
Size (Pixels)
% O
ccur
renc
es
Object Size in Pixels
Missile (Mean Size - 34.1 Pixels)Clutter1 (Mean Size - 3.61 Pixels)
0 5 10 15 20 25 30 350
0.2
0.4
0.6
0.8
1
Probability of Missile Vs. Size Rate of Change
Size Rate (Pixels/Second)
Prob
abilit
y
Missile DataSmoothed
-50 -40 -30 -20 -10 0 10 20 30 40 50
0.5
1
1.5
2
2.5
3Rate of Change of Size
Size Rate (Pixels/Second)
% Occurrences
MissilesClutter
Preliminary laboratory test data has been collected where simulated missile and clutter inputs aregenerated. These are then operated on according to the procedure described above, resulting in theoutput: missile probability as a function of time. Figure 7 shows a preliminary laboratory test plot ofthe missile probability for a simulated missile and simulated clutter. Differences between the twoare evident, which was expected. There are also cases of probability overlap. It is expected that asthe lab testing proceeds, including implementation of planned upgrades in the lab simulations, thedifferences will be clearer and more pronounced and the occurrences of overlap greatly reduced.
Conclusion
A method has been described by which missile targets may be separated from background IR clutterwith enhanced efficacy, based on utilization of sensor and data fusion techniques. The method takesadvantage of regularities in empirical data on missile and clutter observations. The method has beenapplied to simulated data and laboratory data with good results.
0 0.5 1 1.5 2 2.5 3 3.5 4
0.4
0.45
0.5
0.55
0.6
Figure 7: Missile Confidence Factor (Multiple Flyouts)
Simulated Clutter
Simulated Missiles End of Engagement
Engagement Time (Seconds)