Embed Size (px)
Citation preview

Enhanced Oil Recovery by
Alkaline-Surfactant-Alternated-Gas/CO2 Flooding
Thesis submitted in partial fulfillment of the
requirements for the degree of
DOCTOR OF PHILOSOPHY
by
RANJAN PHUKAN
Department of Chemical Engineering
Indian Institute of Technology Guwahati
Guwahati – 781039
Assam, India
May 2020
TH-2437_126107015

TH-2437_126107015

Enhanced Oil Recovery by
Alkaline-Surfactant-Alternated-Gas/CO2 Flooding
Thesis submitted in partial fulfillment of the
requirements for the degree of
DOCTOR OF PHILOSOPHY
by
Ranjan Phukan
Department of Chemical Engineering
Indian Institute of Technology Guwahati
Guwahati – 781039
Assam, India
May 2020
TH-2437_126107015

TH-2437_126107015
Enhanced Oil Recovery by
Alkaline-Surfactant-Alternated-Gas/CO2 Flooding
Ranjan Phukan
TH-2437_126107015

TH-2437_126107015

DEPARTMENT OF CHEMICAL ENGINEERING
INDIAN INSTITUTE OF TECHNOLOGY GUWAHATI
I do hereby declare that the contents embodied in this thesis entitled “Enhanced
Oil Recovery by Alkaline-Surfactant-Alternated-Gas/CO2 Flooding” are the results of
the investigations carried out by me at Department of Chemical Engineering, Indian
Institute of Technology, Guwahati, India, and Department of Petroleum Technology,
Dibrugarh University, India under the guidance of Dr. Pankaj Tiwari and Dr. Subrata
Borgohain Gogoi. In keeping with the general practice of reporting scientific observations,
due acknowledgements have been made wherever the work described was based on the
findings of other investigators.
Date: May 2020 Ranjan Phukan
STATEMENT
TH-2437_126107015

TH-2437_126107015

DEPARTMENT OF CHEMICAL ENGINEERING
INDIAN INSTITUTE OF TECHNOLOGY GUWAHATI
This is to certify that the thesis entitled “Enhanced Oil Recovery by Alkaline-
Surfactant-Alternated-Gas/CO2 Flooding” submitted by Mr. Ranjan Phukan (Roll
No.: 126107015) for the award of the degree of Doctor of Philosophy has been carried out
under our supervision and guidance. The work documented in this thesis has not been
submitted to any other University or Institute for the award of any degree.
(Dr. Pankaj Tiwari) (Dr. Subrata Borgohain Gogoi)
Associate Professor Professor
Department of Chemical Engineering Department of Petroleum Technology
Indian Institute of Technology, Guwahati Dibrugarh University
Guwahati – 781039, India Dibrugarh – 786004, India
CERTIFICATE
TH-2437_126107015

TH-2437_126107015

Dedicated to
My Parents, Family, & Supervisors.
TH-2437_126107015

TH-2437_126107015

Acknowledgements
i
Acknowledgements
I would like to express my deep sense of gratitude to everyone who directly or
indirectly helped me in different ways in completing this research work. Foremost, I would
like to express my gratitude to my supervisors, Dr. Pankaj Tiwari and Dr. Subrata
Borgohain Gogoi for giving me continuous guidance and encouragement during the
course of this work. I am indebted to both of them for their constant inspiration and useful
suggestions throughout the entire period.
I am grateful to Dr. Pankaj Tiwari for his invaluable support, continuous
motivation, and insightful discussions throughout this research. I appreciate his critical
comments while performing the experiments, analyzing the experimental data and writing
the thesis. His uncompromised approach to complete the experiments, data analysis,
writing manuscripts as well as thesis within a fixed time immensely helped me in
completing the works in time. He guided me to write and improve the quality of
manuscripts for journals as well as the thesis. It has been a great experience working with
him.
I would like to express my profound gratitude to Dr. Subrata Borgohain Gogoi
for providing me motivation and valuable guidance during this research work. She has
been my source of inspiration and supporter throughout my research work. Her
supervision, useful suggestions, and invaluable contribution enabled me to complete my
work successfully. I have been greatly benefited by the useful advice given by her from
time to time with regard to writing manuscript and thesis. Her knowledge and enthusiasm
have provided an invaluable contribution to this research.
I must also thank my doctoral committee members Dr. Ramgopal V. S. Uppaluri,
Dr. Pallab Ghosh, Department of Chemical Engineering, Dr. Lalit Mohan Pandey,
TH-2437_126107015

Acknowledgements
ii
Biosciences and Bioengineering, Department for their valuable suggestions and
contributions towards my research work.
I must also thank the faculty members of the Department of Chemical Engineering
for their kind cooperation during my stay in the department. I am also thankful to all the
staff members and scientific officers of the Chemical Engineering Department for their
genuine help during my entire research period. I am thankful to all faculty and staff
members of the Department of Petroleum Technology, Dibrugarh University for their kind
help and cooperation during the course of my research work.
I also extend my special thanks to my mates Dr. Rahul Saha, Mr. Bhargava Baruah,
Dr. Pallab Das, Dr. Bhaskarjyoti Medhi, Mr. Pankaj Baruah, and Mr. Sombir Pannu for
their cooperation and assistance in my research work.
Last but not least, I would like to express my deep sense of gratitude to parents and
family members. Their constant inspiration, care, and love kept me focused and motivated.
I appreciate the courage, understanding and dedicated support shown by all of them despite
many testing times at their end.
TH-2437_126107015
Abstract
iii
Abstract
CO2-water alternating gas (CO2-WAG) injection is the most widely used technique
for controlling the mobility and conformance control issues of CO2 flooding. To achieve
better performance through the synergic combination of gas and chemicals, the WAG
process was modified by injecting chemical solutions (instead of just water) alternately
with gas. The technique is called alkaline-surfactant-alternated-gas/CO2 (ASAG) flooding
when gas and alkali-surfactant slugs are alternately injected into the reservoir. The ASAG
flooding is a relatively new technique and limited experimental works have been reported.
In the present work, the potential of the ASAG flooding for enhanced oil recovery (EOR)
was investigated by lab-scale core flooding experiments, using reservoir cores and crude
oil of an oil field of Upper Assam Basin, India. Additionally, to design the ASAG process
rationally, the key parameters that affect the oil recovery performance were studied and
fine-tuned for optimal performance.
Characterization of reservoir rock and fluids is necessary to make a preliminary
assessment of the effectiveness of any EOR process. Therefore, initial work focused on the
analysis of reservoir rock, crude oil and formation water of the oilfield based on which
application of ASAG flooding was judged. Routine core analysis was conducted for the
measurement of porosities & permeabilities of the core plugs. The porosities of the core
plugs were related to the depth of the formation from where the cores were obtained.
Moreover, more porous core plugs were found to be more permeable. Further
characterization of the rock was done to evaluate its mineralogy and clay content through
X-ray diffraction (XRD) and field emission scanning electron microscope (FESEM)
studies. The experimental results indicated the presence of quartz as the dominant mineral
along with clays in the rock matrix. Additionally, the characterization of crude oil was
done in detail to determine the important physicochemical properties affecting the process
TH-2437_126107015
Abstract
iv
of oil recovery, including API gravity, viscosity, pour point, resin and asphaltene content,
wax content, and acid number. The crude oil was found to be of medium gravity, acidic
nature and with enough of resin-content for asphaltene stabilization. These preliminary
investigations of the crude oil properties indicated that the crude oil considered in this
study was suitable for ASAG flooding. The formation water was also analyzed to
determine its pH, ionic composition, and TDS. It was observed that formation water
collected from the oilfield is of low salinity and contains divalent ions in small amounts.
To recover the best possible incremental oil, this work also stressed on designing
optimal chemical formulations for ASAG flooding based on the foam stability, phase
behavior, interfacial tension (IFT) measurement, and adsorption studies. The experimental
investigations were targeted to evaluate the optimum concentrations of surfactants and
alkali, and to indentify the optimal brine salinity. The objective was to design chemical
slugs that will generate stable foams, achieve ultra-low oil-water IFTs and reduce
surfactant loss due to adsorption onto rock surfaces. Amongst the surfactants considered in
this study, sodium dodecyl sulfate (SDS) at 0.3 wt% and alpha olefin sulphonate (AOS) at
0.5 wt% provided the most stable CO2-foam. Likewise, amongst the alkalis considered in
this study, Na2CO3 was the preferred choice as the oil-water IFT values achieved were the
minimum (0.0068 mN/m and 0.0087 mN/m respectively) with this alkali when combined
with the optimum surfactant concentrations. Additionally, the optimal brine salinity was
found at 70% of formation salinity (2400 ppm) which corresponded to the occurrence of
maximum type III microemulsion and lowest IFT value. Further, it was evaluated that
preflushing with black liquor (BL) can reduce the adsorption of surfactants by core plugs
and the optimum concentration of BL for preflushing was found as its CMC value.
The current work finally addresses the potential of ASAG flooding for EOR by
performing a series of lab-scale core flooding experiments on core plugs under different
TH-2437_126107015
Abstract
v
operating conditions. The performance of different core flooding experiments was
evaluated on the basis of oil recovery and the extent of mobility control. The mobility
reduction factor (MRF) or average pressure drop was determined to ascertain the extent of
mobility control during the flooding process. While ASAG flooding was of particular
concern, other EOR processes such as tertiary continuous gas injection (CGI), CO2-water
alternating gas (WAG), surfactant alternated gas (SAG), and alkali-surfactant (AS)
flooding have also been studied for comparative assessment purpose. It was observed that
due to the synergic effect of in-situ foam generation and ultra-low IFT conditions during
ASAG flooding, the oil recovery efficiency was the highest among all the EOR processes
considered in the study.
The last section of the thesis was devoted to study the effect of key operational
parameters on the performance of ASAG flooding. The critical parameters investigated
were slug ratio, slug size, injection scheme, gas injection rate, total fluid volume injected,
and tapering of slug. It was evaluated that selective mobility reduction effect could be
exhibited by foam generated in the reservoir rock by ASAG injection. This was supported
by the core flooding results indicating higher oil recovery due to stronger foam formation
in higher porosity/permeability core plugs than in the lower porosity/permeability core
plugs. Additionally, the effect of change in brine salinity during ASAG flooding was also
investigated. The experimental results indicated that the application of salinity gradient
during ASAG flooding resulted in better oil recovery due to the lowest oil-water IFT
environment and generation of the most stable foam. The experimental investigations were
also targeted to evaluate the use of a less costly natural surfactant black liquor (BL) for
preflushing prior to ASAG injection. It was observed that preflushing can improve
displacement efficiency by minimizing surfactant adsorption and better foam stability. The
TH-2437_126107015

Abstract
vi
results indicated that by combining all the favorable operating parameters, oil recovery up
to 31 %OOIP could be obtained by the immiscible ASAG flooding.
Thus, the present work highlighted that the synergic combination of alkali,
surfactant, and CO2 gas injection in the form of ASAG flooding has the potential to
improve oil recovery in sandstone oil reservoirs producing medium gravity crude oil. The
laboratory approach adopted for designing the optimal chemical slug may help screening
chemicals suitable for candidate oilfields. Additionally, the key operational parameters
influencing the ASAG flooding process efficiency are defined and optimum conditions are
determined for assisting successful implementation at pilot and field scale.
TH-2437_126107015

Table of Contents
vii
Table of Contents
Acknowledgement i-ii
Abstract iii-vi
Table of Contents vii-x
List of Tables xi-xii
List of Figures xiii-xvii
Acronyms and Nomenclature xix-xxi
Chapter 1: Introduction and Literature Review 1 - 35
1.1 Introduction 1
1.2 Concepts of EOR Processes 4
1.3 CO2 Flooding 6
1.4 Problems Associated with CO2 Flooding 11
1.5 Different Types of WAG Flooding 14
1.6 Alkaline-Surfactant-Alternated-Gas/CO2 (ASAG) Flooding 18
1.7 Oil Recovery Mechanisms of Other EOR Methods 19
1.7.1 Alkaline Flooding 19
1.7.2 Surfactant Flooding 21
1.8 Foams Concepts 23
1.9 Foam Stability 25
1.9.1 Gravity and Capillary Drainage 25
1.9.2 Marangoni Effect 26
1.9.3 Disjoining Pressure 26
1.9.4 Gas Diffusion 27
1.10 Literature Review of ASAG Process 27
TH-2437_126107015

Table of Contents
viii
1.11 Techno-economic Feasibility, Challenges, and Screening Criteria of ASAG
flooding 33
1.12 Importance and Objectives of the Research 35
1.13 Organization of the Thesis 37
Chapter 2: Materials and Methods 39 - 60
2.1 Materials 39
2.2 Experimental Procedures 43
2.2.1 Core Plug Preparation 43
2.2.2 Determination of Porosity 43
2.2.3 Determination of Permeability 44
2.2.4 XRD and FESEM Study 46
2.2.5 Characterization of Crude Oil 46
2.2.6 Characterization of Formation Water 49
2.2.7 Evaluation of Foam Stability 50
2.2.8 Interfacial Tension Measurements 52
2.2.9 Phase Behavior Study 52
2.2.10 Adsorption Study 53
2.2.11 Core Flooding Experiments 55
Chapter 3: Reservoir Rock and Fluid Analyses 61 - 78
3.1 Core Analysis 61
3.1.1 Determination of Porosity 63
3.1.2 Determination of Permeability 65
3.2 Characterization of Reservoir Rocks 69
3.3 Characterization of Crude Oil 71
TH-2437_126107015

Table of Contents
ix
3.3.1 API Gravity 71
3.3.2 Dead Oil Viscosity 72
3.3.3 Pour Point 73
3.3.4 Resin, Asphaltene, and Wax Content 73
3.3.5 Acid Number 74
3.3 Characterization of Formation Water 76
3.4 Summary 77
Chapter 4: Optimum Formulation of Chemical Slug for ASAG Flooding 79 - 107
4.1 Chemical Slug for ASAG Flooding 79
4.2. Surface Tension and Interfacial Properties of Different Surfactants 80
4.3 Evaluation of Foam Stability 81
4.3.2 Foam Stability of Different Surfactants 82
4.3.2 CO2-Foam Stability of Different Surfactants 86
4.3.3 Effect of Temperature on CO2-Foam Stability 87
4.3.4 Effect of Surfactant Concentration 89
4.4 Equilibrium IFT Measurements 92
4.5 Phase Behavior Study 95
4.6 Adsorption Study 97
4.7 Summary 107
Chapter 5: Enhanced Oil Recovery by ASAG Flooding 109 - 125
5.1 Core Flooding Experiments 109
5.2 Comparison of Various EOR Injection Schemes 110
5.2.1 Tertiary Continuous Gas Injection (CGI) 111
5.2.2 CO2-Water Alternating Gas (CO2-WAG) Flooding 112
5.2.3 Surfactant Alternating Gas (SAG) Flooding 114
TH-2437_126107015

Table of Contents
x
5.2.4 Alkaline-Surfactant (AS) Flooding 117
5.2.5 Alkaline-Surfactant-Alternated-Gas (ASAG) Flooding 119
5.3 Summary 125
Chapter 6: Key Parameters Influencing ASAG Flooding 127 - 160
6.1 Introduction 127
6.2 Effect of ASAG Slug Ratio 128
6.3 Effect of ASAG Slug Size 132
6.4 Effect of Injection Scheme 133
6.5 Effect of Gas Injection Rate 1366
6.6 Effect of Total Fluid Volume Injected 138
6.7 Effect of Tapering 139
6.8 Effect of Porosity/Permeability of Core Plug 146
6.9 Effect of Salinity Gradient during ASAG Flooding 151
6.10 Use of Preflush in ASAG Flooding 154
6.11 Combined ASAG Flooding 155
6.11 Summary 157
Chapter 7: Overall Conclusions and Future Work 161 - 164
7.1 Conclusions 161
7.2 Future Work 164
Appendix 165 - 174
List of Publications 175- 176
References 177
TH-2437_126107015

List of Tables
xi
List of Tables
Chapter 2
Table 2. 1: Surfactants considered in the present study 41
Table 2. 2: Alkalis considered in the present study 42
Table 2. 3: Other chemicals considered in the present study 42
Chapter 3
Table 3.1: Porosity measurement of core plugs from different depths 64
Table 3. 2: Porosity and permeability values of core plugs as a function of depth 65
Table 3. 3: Liquid permeability measurement of core plugs 66
Table 3. 4: Gas permeability measurement of core plugs 67
Table 3. 5: Physical and chemical properties of crude oil 75
Table 3. 6: Physical and chemical properties of formation water 77
Chapter 4
Table 4. 1: CO2-foam stability of different surfactants at room (28 oC) and reservoir
temperature (70 oC) 90
Table 4. 2:Parameters of different adsorption isotherm model fitting 104
Table 4. 3: Summary to core flooding experiments performed to study the dynamic
adsorption of surfactant on to core plugs 106
Chapter 5
Table 5. 1: Summary of core flooding experiments performed with various EOR injection
schemes 124
TH-2437_126107015

List of Tables
xii
Chapter 6
Table 6. 1: Summary of core flooding experiments evaluating the effects of ASAG slug
ratio, slug size, and injection scheme 131
Table 6.2: Summary of core flooding experiments evaluating the effects of gas injection
rate and total injection volume 140
Table 6.3: Summary of core flooding experiments evaluating the effect of tapering during
ASAG flooding 147
Table 6.4: Summary of core flooding experiments evaluating the effect of rock
porosity/permeability on ASAG flooding 150
Table 6.5: Summary of core flooding experiments evaluating the effects of salinity
gradient, preflushing, and combined effect 153
Appendix
Table A. 1: Helium porosimeter calibration data 165
Table A. 2: Core plug dimensions 165
Table A. 3: Core plug porosity measurement 166
Table B. 1: Kinematic and dynamic viscosity measurements of crude oil 167
Table B. 2: Asphaltene content determination of crude oil 168
Table B. 3: Resin content determination of crude oil 168
Table B. 4: Wax content determination of crude oil 168
Table C. 1: Cl- ion concentration in formation water 170
Table E. 1: Analysis of formation water using methyl orange indicator 173
TH-2437_126107015
List of Figures
xiii
List of Figures
Chapter 1
Fig. 1.1: Schematic representation of continuous CO2 flooding showing early injection gas
breakthrough 7
Fig. 1.2: CO2 solubility in crude oils with respect to (a) Saturation pressure, (b) Viscosity,
and (c) Swelling factor 10
Fig. 1. 3: Schematic representation of CO2-WAG flooding showing the alternated CO2 and
water injection cycles 13
Fig. 1.4: Schematic representation of the displacement process in CGI, WAG, SAG, and
ASAG injection scheme 17
Fig. 1.5: Schematic representation of ASAG flooding showing the alternate injection of
alkali-surfactant (AS) slug and CO2 gas injection 19
Fig. 1.6: Schematic diagram of alkaline flooding mechanism illustrating the reaction
between alkali (NaOH) and acid component of crude oil 21
Fig. 1.7: Mechanism of oil recovery by surfactant flooding illustrating the effect of low
IFT on residual oil 22
Fig. 1.8: Schematic representation of a general foam system showing the lamella and
plateau borders 23
Chapter 2
Fig. 2.1: Schematic diagram of foam column test setup 51
Fig. 2.2: UV-Vis adsorption spectra of the surfactants: (a) SDS and (b) AOS 566
Fig. 2.3: Calibration curves of the surfactants: (a) SDS and (b) AOS 57
TH-2437_126107015

List of Figures
xiv
Fig. 2.4: Schematic representation of core flooding apparatus 59
Chapter 3
Fig. 3.1: Schematic representation of conventional cores and core plugs 62
Fig. 3.2: Gas permeabilities and estimated liquid permeabilities of core plugs in the depth
range: (a) 2480 – 2486 m; (b) 2925 – 2943 m; (c) 3940 – 3947 m 68
Fig. 3.3: (a) XRD patterns, and (b) FESEM micrographs of rock samples showing the
presence of quartz and clay minerals 70
Fig. 3.4: Crude oil viscosity as a function of temperature 73
Fig. 3.5: FTIR spectra of crude oil sample 75
Chapter 4
Fig. 4. 1: (a) Surface tension versus surfactant concentration; and (b) Oil-water interfacial
tension versus surfactant concentration 81
Fig. 4. 2: Snapshots of foam generated with different surfactants at 0.5 wt% concentration
(a) in the absence of crude oil, and (b) in the presence of crude oil (at 10 vol%) 83
Fig. 4. 3: Gas holdup values of different surfactants at 0.5 wt% concentration with and
without crude oil 84
Fig. 4. 4: Foam volume as a function of time of surfactants (at 0.5 wt%) (a) without crude
oil, and (b) with crude oil; (c) Half decay times of surfactants (t1/2) without and with
crude oil 85
Fig. 4. 5: Foamability as a function of the concentration of surfactants in the presence of
crude oil 86
TH-2437_126107015

List of Figures
xv
Fig. 4. 6: CO2-foam stability curves of surfactants in the presence of crude oil at room
temperature (28 oC). Concentration of surfactants fixed at 0.5 wt% and crude oil was
10 vol% 88
Fig. 4. 7: CO2-foam stability curves of SDS and AOS at room (28 oC) and reservoir
temperature (70 oC) in the presence of crude oil. Concentration of surfactants fixed at
0.5 wt% and crude oil was 10 vol% 89
Fig. 4. 8: CO2- foam stability curves at different concentrations of the surfactants (a) SDS
and (b) AOS in the presence of crude oil at 70 oC 91
Fig. 4. 9: Equilibrium oil-water IFT of alkali-surfactant (AS) formulations 93
Fig. 4. 10: Effect of formation brine salinity on the equilibrium oil-water IFT of AS
formulation 94
Fig. 4. 11: Aqueous stability at different salinities of AS formulations: (a) 0.3 wt% SDS +
1 wt% Na2CO3 and (b) 0.5 wt% AOS + 0.75 wt% Na2CO3 95
Fig. 4. 12: Snapshot of phase behavior of AS formulation (0.5 wt% AOS + 0.75 wt%
Na2CO3) and crude oil (Salinity of formation brine ranging from 0 to 4000 ppm) 96
Fig. 4. 13: Solubilization data of phase behavior test of (0.5 wt% AOS + 0.75 wt%
Na2CO3) and crude oil at 70 oC. 97
Fig. 4. 14: Static adsorption isotherms of surfactants: (a) SDS and (b) AOS onto reservoir
rock at 28 oC with and without Na2CO3 alkali 101
Fig. 4. 15: Adsorption Isothermal model fitting of SDS on reservoir rock samples (a)
Linear isotherm model (b) Langmuir isotherm model (c) Freundlich isotherm model
and (d) Temkin isotherm model. 102
TH-2437_126107015

List of Figures
xvi
Fig. 4. 16: Adsorption isothermal model fitting of AOS on reservoir rock samples (a)
Linear isotherm model (b) Langmuir isotherm model (c) Freundlich isotherm model
and (d) Temkin isotherm model. 103
Fig. 4. 17: Surfactant concentration as a function of the pore volume of the fluid injected in
dynamic adsorption experiments performed at 70 oC 105
Fig. 4. 18: Surface tension versus black liquor concentration curve for determining CMC
105
Chapter 5
Fig. 5. 1: CO2 phase diagram 110
Fig. 5.2: Cumulative oil recovery and pressure drop versus pore volume of fluid injected in
tertiary CGI 112
Fig. 5.3: Cumulative oil recovery and pressure drop versus pore volume of fluid injected in
CO2 - WAG flooding 114
Fig. 5.4: Cumulative oil recovery and pressure drop versus pore volume of fluid injected in
immiscible SAG flooding with chemical slug: (a) 0.3 wt% SDS, and
(b) 0.5 wt% AOS 116
Fig. 5.5: Cumulative oil recovery and pressure drop versus pore volume of fluid injected in
tertiary AS flooding performed with chemical slugs: (a) 0.3 wt% SDS + 1 wt%
Na2CO3, and (b) 0.5 wt% AOS + 0.75 wt% Na2CO3 118
Fig. 5.6: Cumulative oil recovery and pressure drop versus pore volume of fluid injected in
immiscible ASAG flooding performed with chemical slugs: (a) 0.3 wt% SDS + 1
wt% Na2CO3, and (b) 0.5 wt% AOS + 0.75 wt% Na2CO3 122
TH-2437_126107015

List of Figures
xvii
Fig. 5.7: Water-cut and cumulative oil recovery versus pore volume of fluid injected in
ASAG flooding performed with the chemical slug: 0.3 wt% SDS + 1 wt% Na2CO3
123
Chapter 6
Fig. 6.1: Cumulative oil recovery and pressure drop versus pore volume of fluid injected in
ASAG flooding with slug ratio: 130
Fig. 6.2: Cumulative oil recovery and pressure drop versus pore volume of fluid injected in
ASAG flooding with slug size of (a) 0.33 PV; (b) 0.5 PV; and (c) 1 PV 134
Fig. 6.3: Cumulative oil recovery and pressure drop versus pore volume of fluid injected in
chemical alternated gas (CAG) ASAG injection scheme 135
Fig. 6.4: Cumulative oil recovery versus pore volume of fluid injected in ASAG flooding
with different gas injection rates 137
Fig. 6.5: Pressure drop versus pore volume of fluid injected in ASAG flooding with low
and high gas injection rates 137
Fig. 6.6: Effect of total injected fluid volume on cumulative oil recovery in ASAG
flooding 139
Fig. 6.7: Cumulative oil recovery and pressure drop versus pore volume of fluid injected in
ASAG flooding with (a) Liquid tapering up, and (b) Liquid tapering down 144
Fig. 6.8: Cumulative oil recovery and pressure drop versus pore volume of fluid injected in
ASAG flooding with (a) Gas tapering down, and (b) Gas tapering up 145
Fig. 6.9: Cumulative oil recovery and pressure drop versus pore volume of fluid injected in
ASAG flooding with combined liquid tapering up and gas tapering down 146
TH-2437_126107015
List of Figures
xviii
Fig. 6.10: Cumulative oil recovery and pressure drop versus pore volume of fluid injected
in ASAG flooding with (a) Low porosity/permeability core plug; (b) High
porosity/permeability core plug 149
Fig. 6.11: Cumulative oil recovery and pressure drop versus pore volume of fluid injected
during ASAG flooding with the application of salinity gradient 152
Fig. 6.12: Cumulative oil recovery and pressure drop versus pore volume of fluid injected
in ASAG flooding with black liquor preflushing 155
Fig. 6. 13: Cumulative oil recovery and pressure drop versus pore volume of fluid injected
in the combined ASAG flooding 156
TH-2437_126107015

Nomenclature
xix
Acronyms and Nomenclature
Porosity, %
µ Viscosity, cP
AN Acid number, mg KOH/g
AOS Apha olefin sulphonate
API American petroleum institute
AS Alkaline surfactant
ASAG Alkaline-surfactant-alternated-gas/CO2
ASP Alkaline surfactant polymer
ASTM American society for testing and materials
B Temkin constant
BL Black liquor
BV Bulk volume
CAG Chemical alternated gas
Ce Equilibrium concentrations of surfactants, mg/l
CGI Continuous gas injection
CMC Critical micelle concentration
Co Initial concentrations of surfactants, mg/l
Edo Microscopic displacement efficiency
EOR Enhanced oil recovery
Ero Oil recovery efficiency
Evo Volumetric sweep efficiency
EWF Extended water flooding
FESEM Field emission scanning electron microscope
FTIR Fourier transform infra-red spectrometry
FW Formation water
TH-2437_126107015
Nomenclature
xx
GAC Gas alternated chemical
GV Grain volume
IFT Interfacial tension
K Permeability
Kabs Absolute permeability, md
Ke Effective permeability, md
KH Linear isothermal model constant
KL Langmuir constant
KT Temkin constant
M Mobility ratio
MFC Mass flow controller
MMP Minimum miscibility pressure
MRF Mobility reduction factor
Ncap Capillary number
n Freundlich constant
OOIP Original oil in place
PV Pore volume
q Flow rate, ml/min
qe Adsorption at equilibrium time (μg/g)
qmax Langmuir adsorption capacity (μg/g)
R/A Resin/asphaltene
RL Non-dimensional Langmuir constant
R2
Regression coefficient
ROIP Residual oil in place
SAG Surfactant alternating gas
SDBS Sodium dodecyl benzene sulfonate
TH-2437_126107015

Nomenclature
xxi
SDS Sodium dodecyl sulfate
SFB Synthetic formation brine
SMR Selective mobility reduction
Soi Initial oil saturation
Sor Residual oil saturation
Swc Connate water saturation
t1/2 Half-decay time
TDS Total dissolved solids
TX-100 Triton X-100
Vfoam Volume of foam, ml
WAG Water alternating gas
WF Water flooding
XRD X-ray diffraction
γ Kinematic viscosity, cSt
ΔP Pressure drop, psi
Δρ Density difference between the oleic and aqueous phases, g/cm3
λ Interfacial tension, mN/m
ω Angular velocity, rad/s
TH-2437_126107015

TH-2437_126107015

CHAPTER 1
Introduction and Literature Review
Enhanced oil recovery
CO2 flooding
Different forms of WAG injection
ASAG flooding
Objectives
Thesis organization
-
Enhanced Oil
Recovery
CO2
floodingOil
Viscous
fingering
Water Water
CO2 CO2
Mixing
zone Oil
bank
Injector Producer
WAG flooding
Drive water CO2 AS CO2 Foam Oil bank
ASAG flooding
Technology of choice for
mobility control
Better mobility control
Foam formation
Higher oil recovery
TH-2437_126107015

TH-2437_126107015

Chapter 1 Introduction and Literature Review
1
Chapter 1
Introduction and Literature Review
This chapter presents a brief summary of the gas injection-based enhanced oil recovery
(EOR) methods and with special reference to CO2 flooding. The problems associated with
CO2 flooding and the techniques employed to overcome the CO2 mobility and conformance
control issues have been discussed briefly. It describes the water-alternating-gas (WAG)
and alkaline-surfactant-alternated-gas/CO2 (ASAG) flooding processes. It also presents
the literature review on the methods related to ASAG flooding. The importance and
objectives of the present work are also highlighted. Finally, the organization of the thesis
has been presented.
1.1 Introduction
Energy is an essential element in our everyday life and a prerequisite for economic
development. The main source of energy comes from fossil fuels. As per the report of
ExxonMobil 2017, oil would continue to remain as the world’s most consumed energy
source [1]. With population and economic growth, the demand for oil is rising steeply and
will continue to do so in the future. The global crude oil demand has already crossed the
symbolic figure of 100 million barrels per day (mbd) and is expected to rise to about 110
mbd by in the mid-2030s [2, 3]. According to the International Energy Agency (IEA,
2018), the total oil production worldwide in 2018 was averaged 80 mbd. Thus, the global
oil supply lag demand and the gap is expected to further widen after 2020 unless new
projects are implemented. Moreover, there has been an appreciable decline in hydrocarbon
reservoirs discovery in the past few decades [4]. So, in order to meet the increasing crude
TH-2437_126107015

Chapter 1 Introduction and Literature Review
2
oil demand focused efforts are required to recover remaining oil from known reservoirs. In
this regard, enhanced oil recovery (EOR) methods are becoming increasingly important as
a means of maximizing the recovery of oil in place.
Basically, the recovery of crude oil starts with the primary recovery which uses the
natural energy of the reservoir to produce about 5 -10 % original oil in place (OOIP). As
the reservoir pressure depletes, water and/or natural gas are injected to boost the reservoir
pressure and displace the oil during the secondary recovery. Producing this way, an
additional 15 to 20 %OOIP can be recovered. The average recovery factor after the
conventional primary and secondary recovery methods is reported to be around 35% OOIP
[5-8]. Thus, a significant portion of the oil is left behind in the reservoir and is still waiting
for extraction when conventional methods become uneconomical. This residual oil is the
target of the EOR methods [9]. Depending on the type of fluid injected and injection
schemes adopted, the EOR methods may be thermal process, chemical flooding, gas
injection, microbial methods or their combinations.
Thermal EOR methods involve adding heat to the reservoir to recover the oil by
reducing the oil viscosity. This EOR method is most suitable for heavy oil reservoirs and
includes: (a) Steam drive which involves continuous injection of steam through injection
wells, driving the oil towards the producing wells; (b) Huff ‘n’ Puff, which involves
alternate steam injection and oil production from the same well; (c) In-situ combustion,
which involves partial combustion of oil in place to reduce the oil viscosity and sometimes
followed by the injection of water to recover the heat from the rock behind the front.
Chemical methods are based on the injection of water containing chemical
additives. This category includes: (a) Polymer flooding where polymers are added to water
to increase water viscosity and to reduce mobility ratio; (b) Surfactant flooding where
surfactant solutions are injected to mobilize the residual oil through reduction of the
TH-2437_126107015

Chapter 1 Introduction and Literature Review
3
interfacial tension (IFT) between oil and water; (c) Alkaline flooding where alkaline
solutions are injected to enhance the recovery factor through several mechanisms such as
IFT reduction, emulsification, and wettability alteration. However, alkaline-surfactant-
polymer (ASP) is considered as the most promising chemical method because it integrates
the advantages of alkali, surfactant, and polymer. Due to the synergy, ASP has the ability
to improve microscopic displacement as well as the volumetric sweep efficiencies during
the displacement process [10].
Gas Injection is the second most widely used EOR process, only next to thermal
processes. In gas injection, the displacement of oil is achieved by non-aqueous injection of
hydrocarbon solvents, lean hydrocarbon gases or high-pressure non-hydrocarbon gases like
CO2, N2 or flue gases. However, CO2 injection is preferred over other gases because it is
cheaper, has higher density, and offers environmental benefits by providing for CO2
sequestration in the reservoir [11, 12].
Other EOR methods include the microbial-based EOR by in-situ and ex-situ
methods. The in-situ MEOR utilizes microbial growth and metabolism inside the reservoir,
while ex-situ scheme involves direct injection of desired active products produced by
microbes on the surface [13]. Lazar et al. [14] reported oil recovery up to 50% of residual
oil through the application of microbial EOR methods. The hybrid EOR methods which are
combinations of two or more EOR methods are also developed to increase oil recovery,
lower operational costs, and overcome challenges [15]. One of the hybrid EOR methods
that is gaining popularity recently is the low salinity water flooding (LSW). LSW changes
the brine salinity or ionic composition of the injected water for improving oil recovery.
The mechanism of oil recovery by LSW depends on a number of factors that are related to
the composition of brine injected like fine clay mineral migration, alteration of wettability,
formation of emulsion, pH control, and reduction of IFT [16]. The addition of other
TH-2437_126107015

Chapter 1 Introduction and Literature Review
4
materials like nanoparticles, polymer, surfactant, gas in LSW has also shown promising
results for EOR.
1.2 Concepts of EOR Processes
The main aim of the EOR processes is to improve the overall oil recovery
efficiency (Ero), which is product of the macroscopic or volumetric sweep efficiency (Evo)
and the microscopic displacement efficiency (Edo):
ro vo do a v doE = E E = E E E (1.1)
where Ea and Ev are the areal sweep efficiency and vertical invasion efficiency respectively
[17]. Ea is the fraction of the total pattern area that is swept by the displacing fluid and Ev
the fraction of the pay zone’s vertical section that is swept by injected fluids. Both Ea and
Ev are influenced by fluid mobilities, reservoir heterogeneity, and total volume of fluid
injected [18]. Microscopic displacement efficiency (Edo) is defined as the fraction of oil
displaced in the pores within the volume of the reservoir that has been flooded. It can be
expressed as
oi or
do
oi
S - SE =
S (1.2)
where Soi is the initial oil saturation, and Sor is the remaining oil saturation. The Edo
depends on fluid viscosity, reservoir dip, capillary pressures, rock wettability, and IFT
value. Experiences have shown that it is not possible to produce all the oil from the swept
region of the reservoir due to the trapping of the oil droplets by capillary forces caused by
the high IFT value between oil and water. The displacement efficiency can be increased
by reducing capillary forces or IFT value as is done in miscible gas flooding and chemical
flooding, or by decreasing oil viscosity as in thermal flooding or gas flooding. Both,
TH-2437_126107015

Chapter 1 Introduction and Literature Review
5
microscopic displacement and macroscopic sweep efficiencies are strongly dependent on
the mobility ratio (M).
Mobility ratio (M) is defined as the ratio of the mobility of the displacing fluid to
the mobility of the displaced fluid.
rdisplacing displacing
rdisplaced displaced
K μMobility of the displacing fluidM = =
Mobility of the displaced fluid K μ (1.3)
where ‘Kr’ represents the relative permeability and ‘µ’ the viscosity. Both Edo and Evo
values increase as the M decreases. Thus, for efficient displacement, mobility of the
displacing fluid should be less than the mobility of the displaced fluid i.e. M < 1 which is
considered to be favorable, while M > 1 is unfavorable. A large viscosity difference
between the displacing and displaced fluid makes the M unfavorable promoting viscous
fingering to reduce oil recovery. M < 1 can be achieved by increasing the viscosity of
displacing fluid, decreasing the µ of the displaced fluid, and by improving the Kr of the
displaced fluid (oil).
Oil recovery efficiency is greatly influenced by the capillary forces which are
responsible for trapping residual oil in the small pore spaces of the reservoir rock. A very
important parameter considered in EOR is the capillary number. This is a dimensionless
parameter and defined as the ratio of viscous to interfacial forces, neglecting the
gravitational forces. The viscous forces help to mobilize oil, while the capillary forces
cause oil retention [19].
cap
Viscous forces μvN = =
Interfacial forces λ Cosθ (1.4)
where v is the displacing fluid pore flow velocity, µ is the viscosity of the displacing fluid,
λ is the IFT between the displaced and displacing phase fluids and θ is the angle of contact.
TH-2437_126107015
Chapter 1 Introduction and Literature Review
6
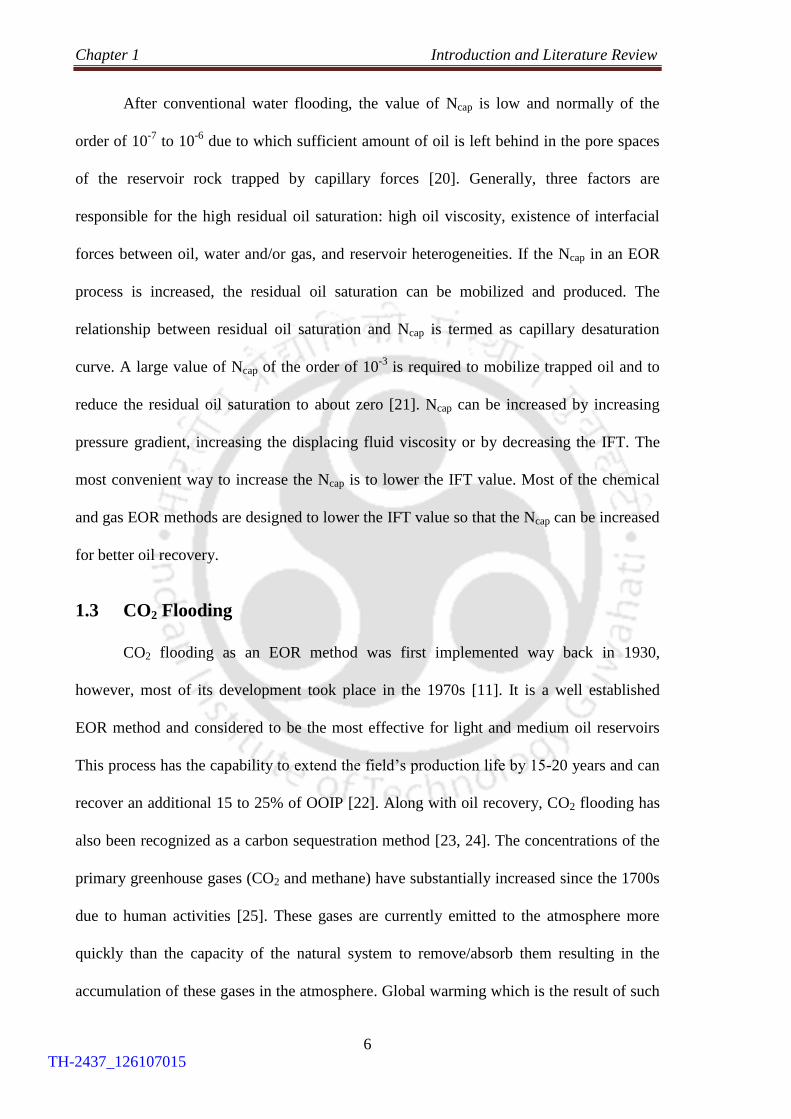
After conventional water flooding, the value of Ncap is low and normally of the
order of 10-7
to 10-6
due to which sufficient amount of oil is left behind in the pore spaces
of the reservoir rock trapped by capillary forces [20]. Generally, three factors are
responsible for the high residual oil saturation: high oil viscosity, existence of interfacial
forces between oil, water and/or gas, and reservoir heterogeneities. If the Ncap in an EOR
process is increased, the residual oil saturation can be mobilized and produced. The
relationship between residual oil saturation and Ncap is termed as capillary desaturation
curve. A large value of Ncap of the order of 10-3
is required to mobilize trapped oil and to
reduce the residual oil saturation to about zero [21]. Ncap can be increased by increasing
pressure gradient, increasing the displacing fluid viscosity or by decreasing the IFT. The
most convenient way to increase the Ncap is to lower the IFT value. Most of the chemical
and gas EOR methods are designed to lower the IFT value so that the Ncap can be increased
for better oil recovery.
1.3 CO2 Flooding
CO2 flooding as an EOR method was first implemented way back in 1930,
however, most of its development took place in the 1970s [11]. It is a well established
EOR method and considered to be the most effective for light and medium oil reservoirs
This process has the capability to extend the field’s production life by 15-20 years and can
recover an additional 15 to 25% of OOIP [22]. Along with oil recovery, CO2 flooding has
also been recognized as a carbon sequestration method [23, 24]. The concentrations of the
primary greenhouse gases (CO2 and methane) have substantially increased since the 1700s
due to human activities [25]. These gases are currently emitted to the atmosphere more
quickly than the capacity of the natural system to remove/absorb them resulting in the
accumulation of these gases in the atmosphere. Global warming which is the result of such
TH-2437_126107015
Chapter 1 Introduction and Literature Review
7
accumulation adversely affects the ecosystem and climate. By injecting CO2 gas into the
underground reservoir for oil recovery, the sequestration of CO2 takes place reducing the
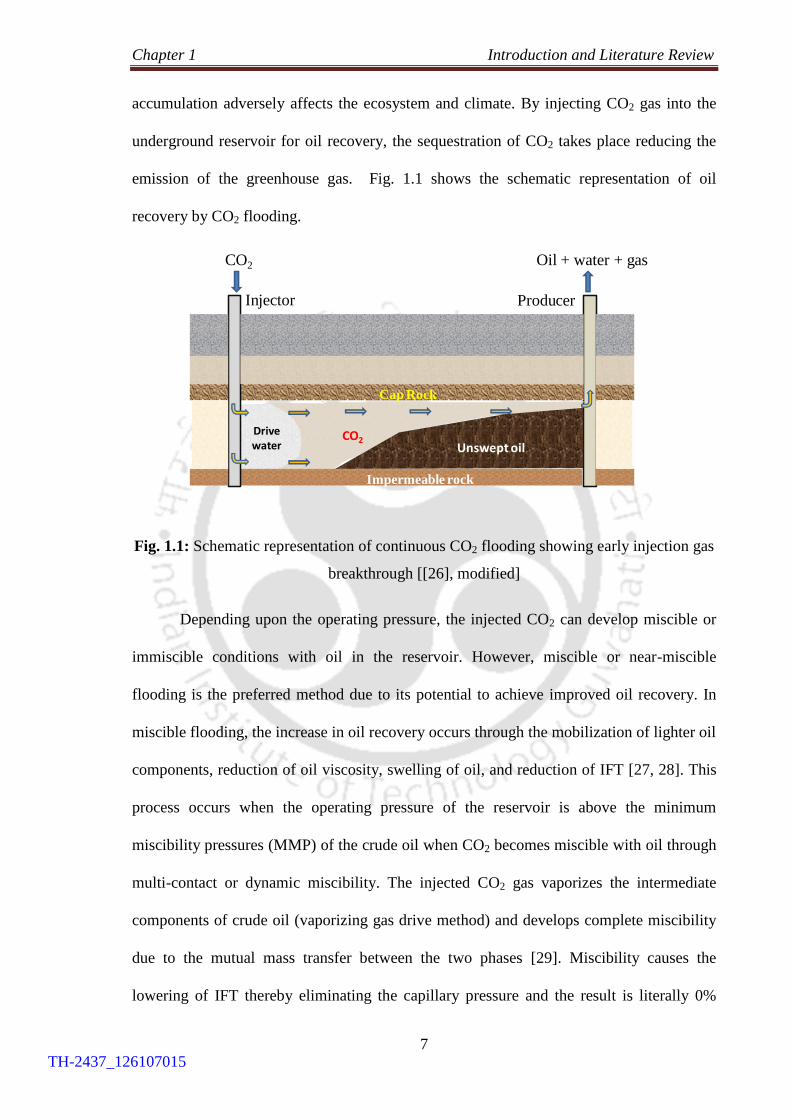
emission of the greenhouse gas. Fig. 1.1 shows the schematic representation of oil
recovery by CO2 flooding.
Fig. 1.1: Schematic representation of continuous CO2 flooding showing early injection gas
breakthrough [[26], modified]
Depending upon the operating pressure, the injected CO2 can develop miscible or
immiscible conditions with oil in the reservoir. However, miscible or near-miscible
flooding is the preferred method due to its potential to achieve improved oil recovery. In
miscible flooding, the increase in oil recovery occurs through the mobilization of lighter oil
components, reduction of oil viscosity, swelling of oil, and reduction of IFT [27, 28]. This
process occurs when the operating pressure of the reservoir is above the minimum
miscibility pressures (MMP) of the crude oil when CO2 becomes miscible with oil through
multi-contact or dynamic miscibility. The injected CO2 gas vaporizes the intermediate
components of crude oil (vaporizing gas drive method) and develops complete miscibility
due to the mutual mass transfer between the two phases [29]. Miscibility causes the
lowering of IFT thereby eliminating the capillary pressure and the result is literally 0%
Drive water
Impermeable rock
Cap Rock
Impermeable rock
Injector Producer
CO2Unswept oil
CO2 Oil + water + gas
TH-2437_126107015

Chapter 1 Introduction and Literature Review
8
residual oil saturation [30]. Although the miscible process is more efficient for EOR,
achieving miscibility is not always possible under various reservoir conditions and fluids
properties due to technical and safety considerations. Conversely, in immiscible
displacement the operating pressures is below the MMP, so less mutual interchange of
components takes place between the injected gas and the crude oil. The main driving
mechanisms of immiscible CO2 flooding are oil swelling, oil viscosity reduction, solution
gas drive, and reduction of IFT or a combination of these mechanisms which assists in
mobilizing a part of the residual oil to improve oil recovery [31].
In the immiscible flooding method, CO2 gas is injected at subcritical pressures
which not only provides energy to the reservoir to assist the flow of oil but also produces
additional oil [32]. Injected CO2 dissolves in the crude oil to reduce oil viscosity which in
turn improves the mobility ratio resulting in better EV. Moreover, CO2 gas upon contact
with crude oil causes oil swelling by a process of dissolution. Swelling causes the
discontinuous residual oil droplets to combine with the flowing oil phase, and the result is
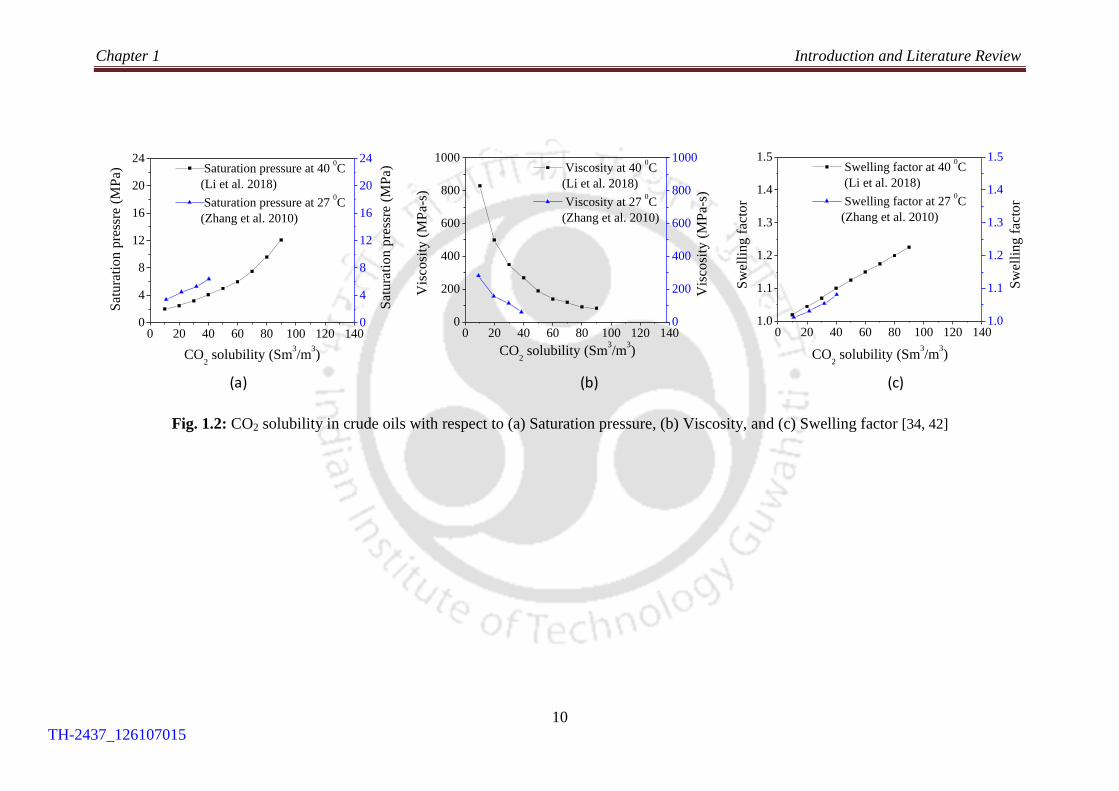
a lower residual oil saturation [33]. Fig. 1.2 illustrates the saturation pressure, oil viscosity
and swelling factor dependence on CO2 solubility in crude oil. Saturation pressure
increases as CO2 solubility increases, as shown in Fig 1.2 (a) which can be explained by
the fact that higher pressure is required to gasify oil with higher fraction of dissolved CO2
gas [34]. Fig. 1.2 (b) shows that the viscosity of crude oil decreases with an increase in
CO2 solubility in crude oil. This is the primary mechanism of heavy oil recovery by CO2
flooding as the viscosity of heavy oil can be reduced considerably by CO2 dissolution as a
lower pressure [35]. Swelling factor is also observed to increase with CO2 dissolution as
depicted in Fig 1.2 (c). Although miscibility between crude oil and CO2 is not significant
in immiscible flooding, still CO2 will dissolve in the oil phase to cause a reduction of IFT
and improve the oil relative permeability. Additionally, the oil is displaced towards the
TH-2437_126107015

Chapter 1 Introduction and Literature Review
9
production well by the injected CO2 gas. However, oil swelling and viscosity reduction are
the prominent effects of the immiscible CO2 EOR process contributing towards additional
remaining oil recovery from the reservoir. Literature reports that CO2 immiscible flooding
could recover an additional 4.7 to 12.5 %OOIP [36].
According to the IEA, the total numbers of worldwide CO2-EOR projects were 166
in 2017 with more number of miscible CO2-EOR projects compared to the immiscible
projects. The largest miscible CO2 flooding in the world was developed in 1972 in Texas
by Chevon in the SACROC (Scurry Area Canyon Reef Operators Committee) unit of the
Permian Basin, which was also the first miscible CO2 flooding project. CO2 is recovered
from flues gas of four gas plants and after dehydration is transported 220 miles to
SACROC for injection [37]. The Bati Raman project in Turkey is acknowledged as the
world’s largest application of the immiscible CO2-EOR project [38]. Started in 1986 after
successful lab tests added by the availability of a large amount of CO2 gas in a neighboring
field about 55 miles away, the project is producing 7,000 bpd [39]. CO2 required for
injection can be obtained from either natural or anthropogenic sources. In the U.S, the
principal source of CO2 comes from natural CO2 reservoirs. CO2 gas from these sources is
mainly injected in the Permian Basin CO2-EOR projects [40]. Nonetheless, CO2 from
anthropogenic sources is steadily gaining importance due to the benefit derived from CO2
sequestration. One of the biggest global CO2-EOR projects using anthropogenic CO2 was
reported to be the Weyburn project in Canada [41]. The source of the CO2 gas was the
large gasification plant situated in North Dakota from where the gas is transported. About
1,600 x 103 ton/year of CO2 is sequestered which was equivalent to 67% of injected gas
amount.
TH-2437_126107015
Chapter 1 Introduction and Literature Review
10
Fig. 1.2: CO2 solubility in crude oils with respect to (a) Saturation pressure, (b) Viscosity, and (c) Swelling factor [34, 42]
0 20 40 60 80 100 120 1400
4
8
12
16
20
24
Saturation pressure at 40 0C
(Li et al. 2018)
Saturation pressure at 27 0C
(Zhang et al. 2010)
CO2 solubility (Sm
3/m
3)
Sat
ura
tio
n p
ress
re (
MP
a)
0
4
8
12
16
20
24
Sat
ura
tio
n p
ress
re (
MP
a)
0 20 40 60 80 100 120 1400
200
400
600
800
1000
Viscosity at 40 0C
(Li et al. 2018)
Viscosity at 27 0C
(Zhang et al. 2010)
CO2 solubility (Sm
3/m
3)
Vis
cosi
ty (
MP
a-s)
0
200
400
600
800
1000
Vis
cosi
ty (
MP
a-s)
0 20 40 60 80 100 120 1401.0
1.1
1.2
1.3
1.4
1.5
Swelling factor at 40 0C
(Li et al. 2018)
Swelling factor at 27 0C
(Zhang et al. 2010)
CO2 solubility (Sm
3/m
3)
Sw
elli
ng
fac
tor
1.0
1.1
1.2
1.3
1.4
1.5
Sw
elli
ng
fac
tor
(a) (b) (c)
TH-2437_126107015

Chapter 1 Introduction and Literature Review
11
As far as India is concerned, Oil and Natural Gas Corporation (ONGC) is
mainly involved in studying the feasibility of CO2-EOR application in Indian oilfields.
One CO2-EOR pilot project was planned in the Ankleshwar oil field of Western India,
where experimental and modeling studies had given encouraging results. These studies
indicated that CO2-EOR is technically feasible in this field and recovery could be
expected to improve by approximately 4% in the project life of 35 years. The
anthropogenic CO2 for injection would be supplied from an adjacent gas processing
plant in Hazira. The CO2 gas of the plant is being vented to the atmosphere and by
injecting into the oilfield it is expected to sequester 5 to 10 million tons of CO2 [43, 44].
1.4 Problems Associated with CO2 Flooding
Although CO2 flooding is considered a successful EOR technique, a large part
(35%–65%) of the oil in place remains unrecovered even after a sufficient volume of
CO2 injection. Miscible CO2 flooding typically recovers 10%–20% OOIP through the
injection of dense CO2 equivalent to nearly 80% of the hydrocarbon pore volume
(HCPV), while immiscible CO2 flooding can recover only 5%–10% OOIP because of
the non-zero IFT between the CO2 and crude oil [45]. The primary reason for the lower
oil recovery of CO2 flooding is related to its density and viscosity. The low density
relative to oil leads to gravity overriding/segregation, a situation where CO2 migrates
toward the upper part of the pay zone. As a result, the lower portions of the formation
remain unswept by CO2 lowering Evo and consequently significant amount of oil is left
behind. Moreover, mobility ratio in CO2 flooding is unfavorable due to the much lower
viscosity of the injected CO2 gas compared to crude oil under reservoir conditions. The
high mobility ratio promotes viscous fingering and excessive flow in high permeability
TH-2437_126107015

Chapter 1 Introduction and Literature Review
12
layers. The resultant effect is early gas breakthrough, reduced Evo, and high residual oil
saturation.
The other problems associated with CO2 flooding that reduce the process-
efficiency are corrosion and asphaltene precipitation. When CO2 reacts with formation
water carbonic acid form making the formation water acidic. The acidic environment
may corrode the downhole tubular and production equipment increasing the risk of
leaks. Moreover, the acidic water may dissolve harmful elements affecting drinking
water sources. Another dominant problem that may occur during CO2 flooding is the
possibility of asphaltene precipitation. Asphaltenes tend to remain in solution under
reservoir temperature and pressure conditions stabilized by resins adsorbed on their
surface. Asphaltenes may start to precipitate if the stability of crude oil is destabilized
due to changes in temperature and/or pressure during primary depletion. Asphaltenes
may also become unstable as a result of the mixing of fluids as well as during gas
injection for EOR operations [46]. During CO2 flooding, the interaction of the CO2 and
crude oil may cause the asphaltene-to-resin ratio of crude oil to altered leading to
asphaltene precipitation and thereby its deposition [47]. In the reservoir, the
precipitation may obscure the movement of CO2 into the portions of the reservoir
containing residual oil and thereby lower Evo. Resins have the effect of keeping
asphaltenes in solution. A high resin to asphaltene ratio (R/A) indicates that asphaltenes
are less likely to come out of solution [48]. Leontaritis and Mansoori [49] presented a
condition for asphaltene stability as follows: R/A > 3.0 as steady-state, 2.0 < R/A < 3.0
as meta-steady state and R/A < 2.0 as unsteady state. However, among all the
complications of CO2 flooding, unfavorable mobility ratio and conformance issues are
considered the most dominant ones affecting the process.
TH-2437_126107015

Chapter 1 Introduction and Literature Review
13
The techniques commonly employed to overcome CO2 mobility and
conformance control problems are summarized below:
(a) Water-alternating-gas (WAG): This is the technology of choice for CO2
mobility control where instead of continuous injection, CO2 is alternately injected with
water into the reservoir as short slugs so as to provide better Evo and reduce CO2
consumption. This technique lowers the relative permeability to CO2 through increased
water saturation and lower CO2 gas saturation in the pore spaces of the reservoir rock.
The mobility of gas is controlled and early gas breakthrough is alleviated through WAG
injection which improves the displacement efficiency of the process [50, 51]. The first
reported WAG field application was a pilot study in the North Pembina oil field in
Alberta, Canada in 1957 [52, 53]. The obvious advantage of WAG lies in the fact that
both the injected fluids are available in large volumes and so less costly. The schematic
representation of the CO2-WAG process is shown in Fig. 1.3.
Fig. 1. 3: Schematic representation of CO2-WAG flooding showing the alternated CO2
and water injection cycles[[54], modified]
Impermeable rock
Cap Rock
Injector Producer
Injected Fluids Oil + water + gas
Drive water
CO2 CO2Mixing zone
Oil Bank
Extraoil
recovery
water CO2water
Injected CO2 encounters
residual oil
CO2 mixes
with oil
Oil swelling, viscosity
reduction, gas drive
mobilizes oil
TH-2437_126107015

Chapter 1 Introduction and Literature Review
14
(b) Direct Thickener: The use of direct thickeners like soluble polymers that
significantly increase CO2 viscosity is sometimes used for mobility control during CO2
flooding. The thickened CO2 gas injected without water improves the displacement
efficiency without the water blocking problems and corrosion issues associated with
WAG.
(c) CO2-foams: Foam has been used to control gas mobility and improve oil
recovery during gas EOR processes. Foam exhibits various favorable attributes which
makes it an attractive method for improving oil recovery. Foam reduces the apparent
viscosity of the gas and lowers the relative permeability of the liquid, making the
mobility ratio favorable. Additionally, foam reduces CO2 mobility by a greater fraction
in high-permeability cores than in lower-permeability cores [55, 56]. This unique
property of foam is termed as selective mobility reduction which assists in smoothening
heterogeneities [57]. The stronger foam generated in the high-permeability zones
behaves like a more viscous fluid which diverts fluid to low-permeability zones of the
reservoir, thus providing better mobility control to improve Evo [58]. The presence of
surfactant during foam flooding, on the other hand, helps to mobilize residual oil by
lowering the oil-water IFT value.
1.5 Different Types of WAG Flooding
Although WAG is the most widely used technique for mobility control in
CO2 flooding, the process still leaves behind about 33% to 67% of the oil unrecovered
by secondary water flooding. The improvement of oil recovery by WAG injection is
around 10 % OOIP [52, 59, 60]. This low recovery is primarily due to the water
blocking effect. Water blocking occurs when the injected water separates the residual
oil from coming into contact with the CO2 gas. Water itself cannot remove the capillary
TH-2437_126107015

Chapter 1 Introduction and Literature Review
15
held residual oil due to the high oil-water IFT and consequently, the microscopic
displacement efficiency is low. Moreover, in the case of viscous oil reservoirs due to
the unfavorable mobility ratio, viscous fingering of injected water and early injection
gas breakthrough occurs. Thus, major areas of the reservoir with residual oil remain
unswept by the injected fluids resulting in low oil recovery [61]. Other concerns
associated with CO2-WAG injection are difficulty in controlling gas/CO2 breakthrough
as the WAG process matures, huge volumes of water injection delay the project
duration, corrosion, and water injectivity loss.
Various studies to improve the performance of CO2-WAG and overcome its
limitations have led to the development of the chemically-enhanced-water alternated
gas (CEWAG) method. This method combines the benefits of both gas and chemical
EOR methods. Different types of chemicals like surfactants, alkalis, co-surfactants,
salts, polymers, co-solvents, and nanoparticles are used based on the specific
application [57, 62]. The mechanism is referred to as surfactant-alternated-gas (SAG)
flooding when surfactants are added to water during the WAG injection process
resulting in foam formation in the pore spaces of the reservoir rock [63, 64]. Previous
studies have reported improvement in Evo and significant increase in oil recovery by
SAG flooding compared to continuous CO2 injection and CO2-WAG injection [65-68].
The higher oil recovery obtained by SAG injection can be attributed to a number of
factors like the reduction of oil-water IFT due to the presence of surfactants, better
mobility control due to foam formation, and mutual mass transfer between the fluids.
Foam increases the apparent viscosity of CO2 gas thereby reducing its mobility. Thus
channeling and viscous fingering problems are alleviated significantly. Additionally,
foam also decreases the permeability to water due to the higher trapped gas saturation in
pore spaces of the reservoir rock [69]. Although foam can be formed in the reservoir by
TH-2437_126107015

Chapter 1 Introduction and Literature Review
16
the co-injection or alternate injection of gas and surfactant solutions, the alternate
method is preferred over co-injection due to its characteristic advantages [66, 70, 71].
SAG minimizes contact between the water and gas/CO2 in the surface facilities and
pipelines reducing corrosion. SAG injection also increases gas injectivity due to
changing saturation near the well-bore [72]. Additionally, SAG injection can reduce
gravity override problems without increasing injection well pressures that cannot be
done with continuous co-injection method [73].
However. surfactants injected with CO2 during the SAG process are susceptible
to be adsorbed by the clay minerals in the rock matrix which reduces the efficiency of
the foam process [74]. Traditionally, alkali has been used to decrease the adsorption of
anionic surfactants onto the reservoir rock. Alkali acts as a sacrificial agent for anionic
surfactants by fixing the surface charge to negative values. The negative charge of the
surface causes electrostatic repulsion between the rock surface and the surfactant,
leading to a significant decrease in adsorption of surfactant [75]. Adding alkali also
assists in converting the naturally occurring naphthenic acids in crude oils to produce in
situ surfactant (soaps). The combination of injected surfactants and in-situ soaps
generated helps to form microemulsion, which exhibits ultra-low oil-water IFT (<0.01
mN/m) thereby mobilizing capillary held residual oil for increasing oil recovery. In
association with the CO2 gas, the alkali-surfactant (AS) combination in the chemical
slug results in the formation of strong/ stable in-situ foam in the reservoir. This process
of alternate injection of gas/CO2 and AS slug is variably referred to as alkaline-
surfactant-foam (ASF) flooding, low tension gas (LTG) process, alkali surfactant gas
(ASG) injection and alkaline-surfactant-alternated-gas/CO2 (ASAG) flooding in the
literature [76-81]. Fig. 1.4 shows a schematic representation of the displacement
process in continuous gas injection (CGI), WAG, SAG, and ASAG flooding.
TH-2437_126107015

Chapter 1 Introduction and Literature Review
17
CO2 Flooding WAG Flooding SAG Flooding ASAG Flooding
Poor Evo Better Evo Improved Evo Best Evo
Viscous fingering Lower mobility ratio Foam formation Stronger foam
Gravity overriding Affected by gravity Gravity segregation low Ultra-low IFT
Poor mobility control segregation and Heterogeneities smoothen Better Edo
Early gas breakthrough heterogeneity Higher Ero Highest Ero
Heterogeneity effects
Fig. 1.4: Schematic representation of the displacement process in CGI, WAG, SAG, and ASAG injection scheme [[82], modified]
CO2 Oil Water/CO2 Oil Surfactant/CO2 Oil
Alkali-Surfactant
/CO2 Oil
TH-2437_126107015

Chapter 1 Introduction and Literature Review
18
1.6 Alkaline-Surfactant-Alternated-Gas/CO2 (ASAG) Flooding
ASAG flooding is, in essence, a modification of the CO2-WAG process designed to
overcome the limitations associated with WAG. This is a relatively new EOR method
compared to alkali surfactant polymer (ASP) and gas flooding, and only limited
experimental works have been reported. ASAG flooding involves the alternate injection of
AS slug and gas/CO2 in the reservoir leading to the formation of in-situ foam, due to the
alternating imbibition/drainage cycles, which helps to control the gas mobility (Fig. 1.5).
The combination of alkali-surfactant in the chemical slug assists in the attainment of ultra-
low oil-water IFT, which in turn increases the Ncap high enough to mobilize the residual oil
held by capillary forces [81]. Studies have reported that the displacement efficiencies
obtained from ASAG flooding are comparable to those of ASP flooding for core flooding
experiments carried out under similar conditions [78, 83]. In fact, ASAG flooding is
reported to be an attractive alternative solution to ASP for reservoir under harsh conditions
like high salinity, high temperature, and also for tight rock [79, 84]. Currently, ASP
flooding is the most promising chemical EOR method but the use of polymers carries
various limitations. Polymers, for example, may cause plugging of low permeability rocks,
can be unstable under high salinity and high reservoir temperatures and maybe
mechanically degraded due to high flow rate [85]. For these harsh salinity and reservoir
conditions, polymers in ASP can be successfully replaced by gas/CO2 as in ASAG
flooding. Foam formation during ASAG flooding provides the required mobility control
through an increase in the apparent viscosity of gas and reduction of the relative
permeability of the aqueous phase. The result is the improvement of both the Evo as well as
the Edo during ASAG flooding. With these favorable attributes, ASAG flooding is
considered to be a viable EOR method and as a potential alternative to ASP flooding for
oilfield applications.
TH-2437_126107015

Chapter 1 Introduction and Literature Review
19
Fig. 1.5: Schematic representation of ASAG flooding showing the alternate injection of
alkali-surfactant (AS) slug and gas/CO2 injection
1.7 Oil Recovery Mechanisms of Other EOR Methods
ASAG process was designed to integrate the favorable attributes of chemical (alkaline and
surfactant) and gas /CO2 flooding, which in turn makes the oil recovery mechanism quite
complex. The oil recovery mechanisms of alkaline and surfactant chemical EOR processes
are summarized below:
1.7.1 Alkaline Flooding
In this EOR method, alkaline solutions are injected into an oil reservoir during or
post waterflooding. The oil recovery mechanisms of alkaline flooding primarily include
reduction of oil-water IFT, wettability reversal, and emulsification with entrapment of oil
[6, 86-90]. Depending on the nature of the crude oil and the reservoir rock, each of the
mechanisms may play more or less important roles when alkaline solutions are injected
under different reservoir conditions. Alkaline flooding is not recommended for carbonate
reservoirs because the alkali solution reacts with calcium ions causing hydroxide
precipitation which leads to formation damage [91].
Crude oils with acid number greater than 0.5mg KOH/g in crude oil are known as
acidic crudes are suitable for alkaline EOR [92]. The mechanism of alkali-crude oil
Drive water
CO2 AS CO2 FoamOil
Bank
Extraoil
recovery
AS CO2
Impermeable rock
Cap Rock
Impermeable rock
Injector Producer
Injected fluids Oil + water +gas
TH-2437_126107015

Chapter 1 Introduction and Literature Review
20
reaction in alkaline flooding is shown in Fig. 1.6. Sheng [93] reported that a highly oil-
soluble single pseudo-acid component (HA) is assumed to be present in oil. This pseudo-
acid component partitions into the aqueous phases upon contact with water i.e.
o wHA HA (1.4)
where HAo and HAw are the acid species, A is long organic chain and subscript ‘o’ and ‘w’
represents oleic and aqueous phase respectively. HAw dissociates into its components as:
+ -
wHA H + A (1.5)
Further, upon alkali (Na2CO3) hydrolysis OH- ions are produced which react with HAw to
form oil soaps NaA (which acts as a soluble anionic surfactant). The overall reaction is:
w 2 3 2HA + Na CO NaA + H O (1.6)
Another important oil recovery mechanism of alkaline flooding is wettability
reversal. In oil-wet reservoirs, the addition of alkali increases the pH of injected water
which causes the rock wettability reversal from oil-wet to water-wet. As a result, the water-
oil relative permeability ratio and the water-oil mobility ratio are reduced, that improves
the oil displacement efficiency [94, 95]. In the case of water-wet reservoirs, the non-
wetting residual oil in discontinuous form can be converted to a continuous wetting phase
through wettability reversal under specific conditions of pH, salinity and reservoir
temperature. Moreover, water droplets in the continuous oil phase increase the pressure
gradient of the flow. Thus, the capillary held residual oil is mobilized and higher recovery
is obtained [86].
The commonly used alkalis are NaOH, Na2CO3, Na4O4Si, BNaO, (NH4)2CO3, and
NH4OH. Na2CO3 has been reported to be a better candidate for alkaline flooding. Alkali
consumption during flooding can be reduced by the use of Na2CO3 and breakthrough times
are also minimized. With Na2CO3, the mineral dissolution and ion exchange are also
considerably lower compared with NaOH and Na4O4Si [96]. Cheng [97] reported that
TH-2437_126107015

Chapter 1 Introduction and Literature Review
21
formation damage by precipitates of CO3 is less severe due to their smaller sizes compared
to SiO4 and OH precipitates. Moreover, Na2CO3 has also been found to be less corrosive
when compared to NaOH and Na4O4Si for sandstone reservoirs [98].
Fig. 1.6: Schematic diagram of alkaline flooding mechanism illustrating the reaction
between alkali (NaOH) and acid component of crude oil [99]
1.7.2 Surfactant Flooding
In surfactant flooding, solutions containing surface-active agents are injected into
the reservoir for the purpose of mobilizing trapped residual oil [100]. The primary oil
recovery mechanism of surfactant flooding are lowering of oil-water IFT due to the
adsorption of surfactants on the liquid-liquid interface and changing the reservoir rock
wettability [101]. IFT reduction plays a very important role in surfactant flooding and is
affected by many factors like the type of surfactants and their concentrations, solvents,
salinity, composition of crude oil and reservoir conditions [102]. A correctly designed
surfactant system interacts with brine and crude oil to form microemulsions at the interface
of oil and water reducing IFT to ultra-low value [103]. In this respect, the phase behavior
study of microemulsion is very important in surfactant-based EOR application to evaluate
surfactant formulations and as an indicator of ultra-low IFT. Microemulsion phase
ROCK
H2O
OIL
HAo
A-
Na+
OH-
NaOH
H
M
HAw A- + H+
HAo H2O
TH-2437_126107015

Chapter 1 Introduction and Literature Review
22
behavior can be described by Winsor type I, type II, and type III. A change in the phase
behavior can be brought about by changing the variable such as salinity, surfactant
structure, temperature, and pressure [104]. For an ionic surfactant, microemulsion phase
behavior is particularly affected by the salinity or concentration of electrolyte [87].
At low salinity, type I or oil-in-water microemulsions occur and are characterized
by coexistence with nearly pure excess oil phase. Whereas, at very high salinity, type II or
water-in-oil microemulsions are formed, which are characterized by coexistence with an
excess brine phase. In between the type I and type II regions, a narrow intermediate
salinity range exists in which oil and water microemulsions are formed as a middle phase
and coexist with both excess oil and excess water phases. These are referred to as type III
microemulsions and the salinity as optimal salinity. Type III microemulsion and optimal
salinity are of great importance in surfactant flooding because of the existence of ultra-low
IFT [105, 106]. With low IFT, the residual oil droplets are able to easily flow through the
pore throats as the capillary trapping is reduced (Fig. 1.7). These oil droplets travel forward
and merge with the oil down the stream leading to the formation of the oil bank [102].
Additionally, surfactant solutions also cause the altering of reservoir rock wettability to
more water-wet condition by increasing the spontaneous imbibition of water into matrix
blocks, which helps to increase the oil recovery [107]. The wettability mechanism is more
prominent in carbonate reservoirs which are likely to be oil-wet.
Fig. 1.7: Mechanism of oil recovery by surfactant flooding illustrating the effect of low
IFT on residual oil [[108], modified]
Trapped
oil
Trapped
oil produced
IFT reduced due to
surfactant flooding
Oil is trapped Trapped oil is produced
Rock
surface
Rock
surface
Rock
surface
Rock
surface
TH-2437_126107015

Chapter 1 Introduction and Literature Review
23
1.8 Foams Concepts
Foams are dispersions of gas in liquid where liquid containing surfactant forms the
external or continuous phase, whereas gas forms the internal or discontinuous phase
separated by thin liquid films called lamellae [57]. The role of the surfactant is to stabilize
the lamellae against rapture thus providing stability to foam. The border where the lamellae
join or meet a solid surface is known as the plateau border. In wet foam, the liquid exists
mainly in the plateau borders. A 2-D view of foams in general is shown in Fig. 1.8.
Fig. 1.8: Schematic representation of a general foam system showing the lamella and
plateau borders [109]
Foam has a wide range of applications in the oil industry. During drilling, foams
can be used to carry the rock cuttings to the surface. In well-stimulation treatments, foams
can cause diversion of acids to improve the acid-injection profile. In EOR, foams are
popularly used for gas mobility control. Broadly, foams can be grouped as bulk foam and
foam in reservoir rock. Foam with bubble sizes much smaller than the pores or volume of
the container is termed as bulk foam. On the other hand, foam in reservoir rock has bubble
size larger than the pore size so that energy is required to force the bubbles through the
. . . . . . . . . . . . . . . . . . . . . . . . . . . . . . . . .
. . . . . . . . . . . . . . . . . . . . . . . . . . . . . . . . .
. . . . . . . . . . . . . . . . . . . . . . . . . . . . . . . . .
. . . . . . . . . . . . . . . . . . . . . . . . . . . . . . . . .
. . . . . . . . . . . . . . . . . . . . . . . . . . . . . . . . .
. .. . . . . . . . . . . . . . . . . . . . . . . . . . . . . . .
.. . . . . . . . . . . . . . . . . . . . . . . . . . . . . . . .
. . . . . .. . . . . . . . . . . . . . . . . . . . . . . . . . .
. . . . . . . . . . . . . . . . . . . . . . . . . . . . . . . . .
. . . . . . . . . . . . . . . .. . . . . . . . . . .
. . . . . . . . . . . . . . . . . . . . . . . . . . . . . . . . .
. . . . . . . . .. . . . . . . . . . . . . . . . . . . . . . . . .
. . . . . . … . . . . . . . .. . . . . . . . . . . . . . . . . .
. . . . . . . . . . . . . . . .. .. . . . . . . . . .. . . . . .
. … . . . . .. . . . . . . . .. . .. . .. . . . . .. . . . .
. . . . . . . .. . . . . .. . . . . .. . . . .. .. . . .. . .
.. . . . . . . .. . . . . . . . . .. . . . .. . . . . .. . . .
.. . . .. . . .. . . . . . .. . . . . . . . . . . . . .. . . . .
. . . . . .. . . . . . . . . . . . . . . . . . . . . . . . . . . . . . . . . . . .
. . . . . . . . . . . . . . . . . . . . . . . . . . . . . . . . . . . . . . . . .
. . .. . . . . . . . . . . .. . . . . . . . . . . . . . . . . . . . . . . . . .
.. . . . . . . . . . . . . . . . . . . . . . . . . . . . . . . .. . . . . .. . . .
. . . .. . . . . . . . . . . . . . . . . .. . . . . . .. . . . . .. . . . . . . .
.. .. . . . . . . . . . .. . . . . . . .. . . . . . . . .. . . . .. . . . . .
.. . . . .. . . . . . . . .. . . . .. . . . . . . . . . . . . . . .. . . .. .
. . . . . . .. . . . . . . .. . . . . . . . . . . . . . . . . . . . . .. . . . ..
. . . . . .. . . . . .. . . . . . . .. .. . . . . . .. . . . . .. . . . . . .
.. . . . . . . . .. . . . . . . .. . . . . .. . . . . . . . . .. . .. . . . . .
.
…. . . . . . . . . . . . . . . . . . . . . . . . . . . . . . .
…. . . . . . . . . . . . . . . . . . . . . . . . . . . . . . .
…. . . . . . . . . . . . . . . . . . . . . . . . . . . . . . . …. . . . . . . . . . . . . . . . . . . . . . . . . . . . . . . Lamella Plateau border Gas
Foam
Bulk liquid
Gas
phase
Thin film region
(liquid phase)Interface
(2-D Surface Phase)
120˚
TH-2437_126107015

Chapter 1 Introduction and Literature Review
24
pore constriction [110]. The behavior of foam in reservoir rock is influenced by pore size
and pore throat distribution. Foam in porous media does not exist as continuous
interconnected gas bubbles but as discrete gas bubbles separated by liquid lamellae. These
gas bubbles are in contact with the pore walls through the wetting phase fluid. Foam
travels as bubble train in porous media with each bubble separated from the next by liquid
lamellae film.
When foam flow through reservoir rocks, gas can exist as trapped gas, continuous
gas, or discontinuous but moving gas. The continuous gas flows in interconnected channels
without any lamellae. Discontinuous but moving gas is separated by lamellae. The moving
lamellae senses drag force while moving along the pore walls. Thus, the moving gas
experiences resistance to flow which is like the effect of increasing gas viscosity. The
actual gas viscosity is not increased by foam but gas experiences increased resistance to
flow due to lamellae presence, so foam is said to increase apparent gas viscosity.
Discontinuous foams are stronger foam, which are formed when gas and surfactant are co-
injected or alternately injected under proper conditions. Trapped gases that are not mobile
reduces the pore volume available for flow and changes gas flow paths. This causes a
reduction in the effective permeability of gas flowing through the porous rocks [111].
Foam thus reduces gas mobility by increasing the apparent viscosity of gas and decreasing
the gas effective permeability. Reducing gas mobility in the porous rock increases gas
saturation and consequently decreases the liquid saturation. The lower value of liquid
saturation, in turn, decreases the liquid relative permeability.
During the flow of foam through the pore spaces of the reservoir rock, the lamellae
creation and decaying takes place continuously during the flooding process. But the rate of
lamellae creation should be greater than or equal to the rate of decaying for better mobility
control. There are three generally accepted mechanisms of foam generation: leave-behind,
TH-2437_126107015

Chapter 1 Introduction and Literature Review
25
lamella division, and snap-off. When gas enters liquid saturated reservoir rock, lamellae is
left behind in the pore throats between the pore spaces. Foam generated by the leave
behind mechanism is considered weak. The lamella formed can get transported and
multiply by lamella division mechanism. Lamella division occurs by subdivision of pre-
existing lamellae in the reservoir rock when the pressure gradient is sufficient to move the
lamellae through the pore throats. Snap-off is an important mechanism of foam generation
in the reservoir rock. This is a mechanical process where the liquid wetting phase forms
collars in the pore throat that snaps off the gas bubble as it moves through the pore throat.
For snap-off to occur the pore throat to pore body ratio should be 1:2.67. Both lamellae
division and snap-off mechanisms generate discontinuous gas foams which are considered
as strong foam [112].
1.9 Foam Stability
Foams are not thermodynamically stable and ultimately collapse in due course of
time. Foam stability is dependent on many factors concerning the bulk solution and
interfacial properties such as gravity drainage, capillary drainage, surface elasticity,
disjoining pressure, and gas diffusion.
1.9.1 Gravity and Capillary Drainage
Foam stability depends on the liquid drainage from the inside of lamellae which
causes film thinning and eventually rapture. Foam drainage is driven by two forces: gravity
and capillarity. Gravity causes the liquid in the lamellae to drain causing the gas bubbles to
collide and collapse unless the liquid film is thick. Liquid drainage due to capillary
pressure occurs when the lamella is thin. Capillary pressure is measured as the difference
of pressure between the gas and the liquid phase. As shown in Fig. 1.8, gas-liquid interface
along the thin-film regions are flat or larger radii, while at the plateau borders are curved or
smaller radii. Since capillary pressure is inversely proportional to the interface-radius (as
TH-2437_126107015

Chapter 1 Introduction and Literature Review
26
per the Young-Laplace equation), there exists a difference of pressure between the thin-
regions and plateau borders. This pressure difference causes the liquid out of the lamella
towards the plateau borders, thus reducing film thickness and eventually rapture [113].
1.9.2 Marangoni Effect
For foam to be stable, the thin films should be elastic to withstand deformations
without collapsing. If the liquid film in the foam system undergoes a sudden expansion, the
adsorbed surfactant concentration decreases in the expanded area of the film. This causes
an increase in the local surface tension gradient. As a result, liquid flow into the film takes
place from the low-tension area to the high-tension area. The liquid flow opposes the
thinning of liquid film which helps to stabilize the foam system. When equilibrium
surfactant concentration is reached, the liquid flow stops. This effect is known as surface
elasticity or Marangoni effect [109].
1.9.3 Disjoining Pressure
The disjoining pressure arises from the overlap of molecular interactions between
interfacial layers and is the total effect of forces which are of different nature. It is the
difference of pressure between the gas and the liquid phases within a film, and is
dependent on the film’s thickness. There are three components of the disjoining pressure:
attractive Van der Waals force, repulsive electrostatic potentials, and steric/hydration
forces. The Van der Waals force results from the interactions of neutral molecules across
the film and results in film thinning. This is because these forces are present when
surfactant is absent making disjoining pressure negative and so lamellae rapture quickly.
When the ionic surfactant is added, the surfactant molecules are adsorbed on the gas-liquid
interface creating an electrical double-layer, which is the source of the repulsive forces that
stabilize the lamella. Thus, the ionic strength of the aqueous solution also determines the
TH-2437_126107015
Chapter 1 Introduction and Literature Review
27
degree of lamella stabilization [114]. The steric forces which are repulsive in nature also
prevent lamella thinning [85].
1.9.4 Gas Diffusion
In a foam system, the gas bubbles do not have a uniform size distribution. The
smaller gas bubbles are at a higher pressure than the larger bubbles. This gives rise to a
chemical potential difference, which causes diffusion of gas through the liquid from the
smaller to larger bubbles. The result is smaller bubbles shrinks while the larger bubbles
grow by coalescence [105].
1.10 Literature Review of ASAG Process
The use of foam to reduce the mobility of gas-phase was proposed as early as in the
late 1950s when Bond and Holbrook [115] patented the alternate injection of surfactants
solutions (1 wt% sodium dioctylsulfosuccinate) with foaming properties and gas in sand
packed glass tubes. Their experiments showed that the SAG process could recover 70%
OOIP compared to 40% OOIP by WAG flooding which demonstrated the usefulness of
employing surfactant solutions in conjunction with gas-drive. The formation of foam front
at the interface of the injected gas and surfactant solution increased the displacement of the
gas drive and improved oil recovery.
Kamal and Marsden [116] experimentally studied the displacement process of foam
in glass tubes packed with sands. The 0.05 and 0.1 PV micellar slug was used to displace
the crude oil in secondary and tertiary recovery mode. Foam was formed in a foam
generator from 0.2 wt% Triton X-100 and was used to displace a micellar slug. Similar
experiments were carried out with polymer thickened water (500 ppm polyacrylamide) in
place of foam to compare the results. Their results demonstrated that additional oil
recovery can be obtained by injecting micellar slug followed by foam drive. Foam could
effectively displace micellar slugs to obtain oil recovery. Although ultimate oil recoveries
TH-2437_126107015

Chapter 1 Introduction and Literature Review
28
by micellar slug displaced by foam and polymer solution were comparable, much lesser
amount foaming agent than polymer was required. Consequently, foam displacement
process was shown to be more cost-effective than polymer.
Bernard et al. [117] reported experimental works to enhance the performance of
CO2 flooding by controlling gas mobility through alternated CO2 and surfactant solution
injection into the reservoir. They performed these tests on Berea sandstones and carbonate
cores and with all three types of surfactants namely anionic, non-ionic and cationic. The
results of their study indicated that the efficiency of the WAG injection increased when
surfactant was added to the water due to the reduction of CO2 mobility by about 50%. With
the increase in surfactant concentration from 0.1 to 1 wt%, the CO2 mobility could be
reduced from 60 to 5 md/cp. Foams generated reduced CO2 flow through cores and a lesser
amount of CO2 was required for the same oil recovery. Moreover, surfactant slug followed
by continuous CO2 injection resulted in the same oil recovery as alternated CO2 and
surfactant slug injection.
Julio and Emanuel [118] performed core flooding experiments on unconsolidated
sandstone cores using heavy California oil (14 0API) to tested the mobility-control ability
of foam during immiscible CO2 flooding. Foam formed by the co-injection of CO2 and 0.5
wt% surfactant solution (Chevron’s CRSO 85/66) was able to recover an extra 33.6 %
OOIP compared to waterflooding and WAG flooding. The increase in oil recovery was a
result of mobility control and diversion of CO2 to lower permeability zones unswept by
waterflooding and WAG.
Lawson and Reisberg [119] studied a technique for mobility control during
chemical flooding by injecting alternate slugs of inert gas (N2) and surfactant solution on
Berea sandstone, Ottawa sand packs, and Indiana limestone. They observed that foam
formation could successfully provide mobility control, which was comparable with
TH-2437_126107015

Chapter 1 Introduction and Literature Review
29
mobility control by water-soluble polymers. Their experimental results also indicated that
the use of alkali (borax) in the chemical slug and preflood could reduce surfactant
adsorption in carbonate rocks.
Demin et al. [120] reported the first field pilot test of ASP foam (ASPF) carried out
in the northern part of Daqing oilfield, China by adding natural gas to the ASP slug . The
chemical slug comprising of 0.3 wt% surfactant, 1.2 wt% NaOH and 1200 mg/l PAM was
coinjected with natural gas. ASPF flooding increased oil recovery by 30% and 10% OOIP
beyond water flooding and ASP flooding respectively. Higher recovery was attributed to
improvement in the volumetric sweep efficiency due to foam formation.
Srivastava et al. [83] used foam as a gas/CO2 mobility control agent, formed by co-
injecting and alternate injecting of gas/CO2 and chemical slug in Berea sandstone and
Silurian dolomite cores. The process was termed as alkaline-surfactant-gas (ASG)
injection. The ASG slug consisted of high-performance chemicals (surfactants, alkali, co-
solvents having the ability to lower oil-water IFT to ultra-low) and gas/CO2. The ASG
drive which followed the ASG slug consisted of aqueous phase of low surfactant
concentration and gas. The authors observed an increase in oil recovery during ASG
flooding due to the synergic effect of ultra-low IFT conditions and foam generation. ASG
process could successfully recover incremental oil up to a maximum of 90 % of remaining
oil after waterflood. Alkali presence increased the efficiency of the ASG flooding due to
in-situ soap generation and surfactant adsorption reduction. Comparable oil recoveries and
pressure responses were observed both for ASG and ASP flooding performed under similar
experimental conditions.
Zhang et al. [42] studied the chemical alternating gas (CAG) process in cores
packed with Ottawa sands. The ASP slug was followed CO2 or flue gas (70% N2 in the
CO2 stream) and finally extended water flooding. They observed that CO2 dissolved easily
TH-2437_126107015

Chapter 1 Introduction and Literature Review
30
into Saskatchewan heavy oil at moderate pressures (3.4–6.4MPa), causing viscosity
reduction (45–88%) and oil swelling (1.2–8.1%). Their core flooding results indicated that
higher oil recovery could be obtained by CO2-CAG compared to CO2-WAG (27.43%
versus 9.43% OOIP).
Srivastava et al. [121] investigated the feasibility of immiscible alkaline-surfactant-
alternate-gas (ASAG) injection at a laboratory scale performed with crude oil Limbodara
oilfield India with Berea core sandstone core. The authors reported that displacement
efficiencies of ASAG core flooding experiments were comparable to ASP experiments
carried out under similar conditions. The incremental oil recovery obtained beyond
waterflooding with a single ASAG cycle and two ASAG cycles were 27.79% OOIP and
29.01% OOIP respectively indicating the potential of the ASAG injection for EOR.
Pei et al. [122] studied the foam flooding for heavy oil of Shengli oilfield by co-
injecting alkali-surfactant solutions with N2 gas in cores and sand packs. They observed
that tertiary oil recovery by polymer-enhanced foam flooding was 11% higher than that of
ASP flooding. The results showed that tertiary oil recovery by foam flooding improved
with the increase in gas-liquid ratio and slug size.
Guo et al. [123] investigated the alkaline/surfactant/foam (ASF) process by
coinjection AS slug (1.0 wt% Na2CO3 + 0.5 wt% IOS ) and N2 gas in Bentheimer
sandstone cores with or without AS preflush. The designed AS slug had well-defined
optimum salinity which reduced the IFT to ultra-low value and also displayed good
mobility control. Oil recovery by AS flooding and ASF flooding without AS preflush were
43% and 47% residual oil in place (ROIP) respectively. ASF with AS preflush was far
better with the recovery.
Cottin et al. [79] studied the effect of gas co-injected with AS slug in Middle East
carbonate core under harsh salinity and temperature conditions. They reported cumulative
TH-2437_126107015
Chapter 1 Introduction and Literature Review
31
oil recovery of 48% OOIP and 76% OOIP from surfactant-gas (SG) and ASG flooding
respectively. Addition of alkali (Na2CO3 at 10000 ppm) to the chemical slug was able to
increase the pH of the slug before injection from 7.5 to 11 and thus reduce surfactant
adsorption by changing the charge on the rock surface.
Luo et al. [124] evaluated the effectiveness of the chemical-augmented WAG
process through an integrated process comprising of IFT and rheology measurements,
phase behavior studies, and core flooding experiments on sand packs. The authors
observed that reservoir oil viscosity reduced by 89% when 40.39 mol% CO2 was dissolved
at saturation pressure. Oil recovery by CO2 injection was more than flue gas of (30% CO2
+ 70% N2) injection in the WAG mode. Immiscible WAG with CO2 gas could favorably
recover residual oil from heavy oil reservoirs. Chemically enhanced WAG could increase
oil recovery by almost 3 times than CO2-WAG.
Zhang et al. [125] developed a foaming agent through the combination of 0.3%
Cocoamido propyl betaine + 0.2% coconut diethanol amide + 1600 ppm HPAM + N2,
which displayed good foaming ability and could lower IFT to ultra-low value. The
operating parameters of foam injection like co-injection, direct injection, WAG and gas-
liquid ratio were studied through core flooding experiments performed on cores of Shengli
oilfield. The authors observed that ultralow IFT foam flooding could recover 21.55% more
heavy oil than the conventional direct foam injection indicating its effectiveness in heavy
oil recovery. The ultra-low IFT foam flooding had a stronger blocking effect in high
permeability zones of heterogeneous reservoirs which resulted in better sweep efficiency
and higher oil recovery.
Majidaie et al. [61] investigated the chemically enhanced water alternating gas
(CWAG) injection process through the injection of three WAG cycles followed by ASP
slug and finally followed by two more WAG cycles. The core flooding results performed
TH-2437_126107015
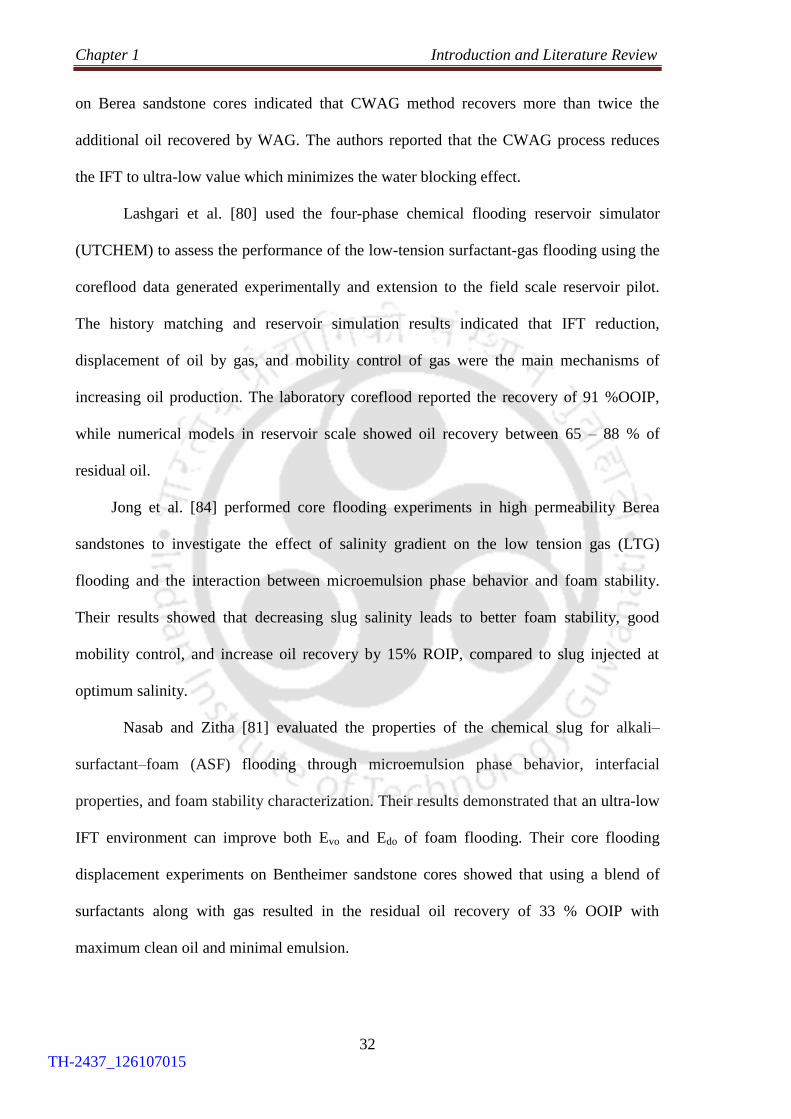
Chapter 1 Introduction and Literature Review
32
on Berea sandstone cores indicated that CWAG method recovers more than twice the
additional oil recovered by WAG. The authors reported that the CWAG process reduces
the IFT to ultra-low value which minimizes the water blocking effect.
Lashgari et al. [80] used the four-phase chemical flooding reservoir simulator
(UTCHEM) to assess the performance of the low-tension surfactant-gas flooding using the
coreflood data generated experimentally and extension to the field scale reservoir pilot.
The history matching and reservoir simulation results indicated that IFT reduction,
displacement of oil by gas, and mobility control of gas were the main mechanisms of
increasing oil production. The laboratory coreflood reported the recovery of 91 %OOIP,
while numerical models in reservoir scale showed oil recovery between 65 – 88 % of
residual oil.
Jong et al. [84] performed core flooding experiments in high permeability Berea
sandstones to investigate the effect of salinity gradient on the low tension gas (LTG)
flooding and the interaction between microemulsion phase behavior and foam stability.
Their results showed that decreasing slug salinity leads to better foam stability, good
mobility control, and increase oil recovery by 15% ROIP, compared to slug injected at
optimum salinity.
Nasab and Zitha [81] evaluated the properties of the chemical slug for alkali–
surfactant–foam (ASF) flooding through microemulsion phase behavior, interfacial
properties, and foam stability characterization. Their results demonstrated that an ultra-low
IFT environment can improve both Evo and Edo of foam flooding. Their core flooding
displacement experiments on Bentheimer sandstone cores showed that using a blend of
surfactants along with gas resulted in the residual oil recovery of 33 % OOIP with
maximum clean oil and minimal emulsion.
TH-2437_126107015

Chapter 1 Introduction and Literature Review
33
1.11 Techno-economic Feasibility, Challenges, and Screening Criteria of
ASAG flooding
Previous studies have established the potential of combined chemical-gas flooding
for EOR and confirmed that the process can lead to higher residual oil recovery compared
to the individual processes [122, 126-128]. However, the successful planning of the EOR
project requires careful consideration of all aspects involved in the process, with the most
important one being the economics of the project. The economic evaluation of the project
encompasses the operating expenses, price of injection fluids, capital expenditures,
cumulative oil production, and other related financial matters. The economic feasibility of
an EOR process is sensitive to the crude oil price, project lifetime, discount rate, and tax
policy. The techno-economical advantage of ASAG flooding arises due to the alternate
injection of chemicals and gas/CO2 in short slugs into the reservoir instead of only gas
flooding or chemical flooding. For an EOR process like ASAG flooding, the financial
feasibility of application in a particular reservoir for enhancing oil recovery will depend
greatly on the availability, transportation, injection, and separation costs of CO2 gas.
Furthermore, the proper selection of chemical slug that reduces the retention and increases
the efficiency of the injected chemicals can undoubtedly better the techno-economical
aspect of the ASAG process. The economics of the process can also be improved through
accurate screening of candidate reservoirs and sound reservoir management. High oil
prices, short project life-time, low CO2 cost, low tax policy, and extra incentives can
significantly increase the net income and encourage enterprises to employ ASAG flooding
projects. Along with EOR, the ASAG flooding has the added benefit of carbon dioxide
sequestration in the underground oil reservoirs reducing the greenhouse gas effect.
However, for utilizing the anthropogenic CO2 to increase oil recovery more advanced
technologies are required for CO2 capture and transportation to the oil fields.
TH-2437_126107015
Chapter 1 Introduction and Literature Review
34
Although there are many advantages associated with ASAG flooding, the process
still has some major concerns. Due to the presence of both CO2 and water containing
chemicals in the injection side carbonic acid forms creating an acidic environment that
may corrode pipelines, tubing, and other surface or sub-surface equipment. The remedial
measures include the use of corrosion inhibitors, protective coatings, high-quality
materials, and adequate corrosion monitoring. Another serious concern that may arise
during ASAG flooding is the likelihood of hydrate formation and asphaltene precipitation
that leads to possible deposition and consequently production delays. Hydrate formation
may occur in the well when the near well temperature drops causing blockage of the
injection well. In order to control hydrate formation, chemicals like alcohols (methanol,
ethanol, and glycol) and salts are injected into the fluid stream [129]. However, alcohols
are expensive and pollute the effluents making their recovery difficult. The deposition of
asphaltene, on the other hand, causes formation damage and prevents the flow of injected
fluids into the zones containing residual oil. Asphaltene problem can be solved by solvent
washes and treatment with dispersant agents. Of these methods, the use of aromatic
solvents is the most effective but is a costly method [130]. Application of ASAG flooding
also produces a significant amount of water that may contain a large number of salts,
chemicals, and toxic heavy metals. The oilfield produced water should be properly
disposed of by injecting back into the underground formation to prevent contamination of
drinking water source, agriculture and the environment. Apart from these major issues,
some other operational challenges of ASAG flooding are premature breakthrough, tubular
failures, gas transportation and storage problems, downhole pump malfunctioning, high
cost of chemicals, foam propagation issues, and sudden drop in oil price.
Screening criteria of different EOR methods are reported in the literature by various
authors [131-134]. Screening criteria are used in many field applications, laboratory and
TH-2437_126107015

Chapter 1 Introduction and Literature Review
35
simulation studies to choose the best and most feasible EOR method for any candidate
reservoir before implementation of any EOR projects [135]. Aladasani [136] updated the
EOR criteria published by Taber et al. [131] including new EOR categories considering
projects reported between 1998 to 2010. Immiscible CO2 flooding, WAG, hydrocarbon-
WAG, surfactant-polymer/alkali were among the newly added EOR categories. Manrique
et al. [137] suggested screening criteria for WAG projects on the basis of rock and fluid
properties. They proposed the best candidates for WAG injection should have oil viscosity
less than 2 cP, oil APIo gravity 30-45, viscosity ratio 1-30, net formation thickness less
than 100, and average permeability less than 100. Reservoir depth, temperature and
formation type were not considered to be critical for WAG flooding. Sheng [138] proposed
screening criteria for AS flooding based on the criteria for both alkaline flooding and
surfactant flooding. Typically, the minimum acid number for the crude to be effective for
alkaline and AS flooding is 0.3 mg KOH/gm of oil [139]. Moreover surfactant systems are
sensitive to high temperatures, so to prevent degradation of surfactants reservoir
temperatures requires to be typically less than 200 °F [140]. But, in CO2 flooding
possibility of viscous fingering of the injected gas increases with increases of oil viscosity
and consequently CO2 flooding has been applied mainly in reservoirs having oil viscosity
less than or equal to 3 [141]. As ASAG technique is a combination of immiscible CO2-
WAG and chemical (alkali-surfactant) methods, the suggested screening criteria should
suit both AS flooding, CO2 flooding, and WAG injection. However, the synergetic effect
should also be contemplated in the suggested criteria of ASAG flooding.
1.12 Importance and Objectives of the Research
Despite its potential as a viable EOR process, the immiscible ASAG flooding has
not been extensively studied and only a few investigations have been reported in the
literature. So far, ASAG flooding was studied using Berea/Bentheimer cores and sand
TH-2437_126107015

Chapter 1 Introduction and Literature Review
36
packs. The oil recovery potential of immiscible ASAG flooding using real reservoir cores
under reservoir conditions has not been reported so far. Thus, a systematic study needs to
be conducted to evaluate the performance of ASAG flooding under reservoir conditions to
simulate the real field situation. This would facilitate achieving results and conclusions
which are more realistic and more field-like. Further, designing the ASAG process requires
studying the key parameters affecting the oil recovery process and fine-tuning them for
optimal performance. Studying the effects of these operating variables on the performance
of ASAG flooding is essential for the rational design of the EOR process. A critical review
of the literature suggests that the key operational parameters influencing the performance
of ASAG flooding are not available and require investigation.
The desired utilization of the ASAG flooding for improving oil recovery from an
oil reservoir requires the usage of the appropriate chemical formulations. For the consistent
performance of these formulations, two primary requirements are to be met: lowering the
oil-water IFT to ultra-low value and ensuring good mobility control through proper
foaming in the reservoir rock. Thus, a systematic approach for formulating the optimal
chemical slug for ASAG flooding needs to be followed. Moreover, designing the chemical
slug and success of ASAG flooding will also depend on the reservoir rock and fluid
properties which usually vary from reservoir to reservoir. Thus, characterizing the
reservoir rock and the fluids is an essential prerequisite before embarking on the EOR
process.
Based on the existing gaps in the literature, the present research work was
undertaken with the following objectives to be fulfilled:
Characterization of the reservoir rock and fluids:
i. Routine core analysis of core plugs.
TH-2437_126107015

Chapter 1 Introduction and Literature Review
37
ii. Characterization of the reservoir rock to evaluate its mineralogy and clay
content.
iii. Determination of physico-chemical properties of the crude oil for suitability
of chemical and gas flooding.
iv. Evaluating the physico-chemical properties of the formation water and
preparation of synthetic formation brine (SFB).
Formulating the optimum chemical slug: This objective refers to the screening of
chemicals for the design of optimum chemical formulations for ASAG flooding
based foam stability, phase behavior study, IFT measurements, and adsorption
study.
Evaluating the potential of ASAG flooding for EOR through lab-scale core
flooding experiments and comparative assessment with other related EOR
techniques.
Investigating the effects of key operational parameters on the performance of
ASAG flooding. Thereby, the emphasis will be towards identifying the most
suitable operating parameters in order to optimize the ASAG flooding for
improving the process efficiency.
1.13 Organization of the Thesis
The contents of the thesis are organized in seven chapters.
Chapter 1 presents a brief introduction to CO2 flooding for EOR along with its associated
problems. It also describes the CO2-WAG injection and ASAG injection processes. In
TH-2437_126107015
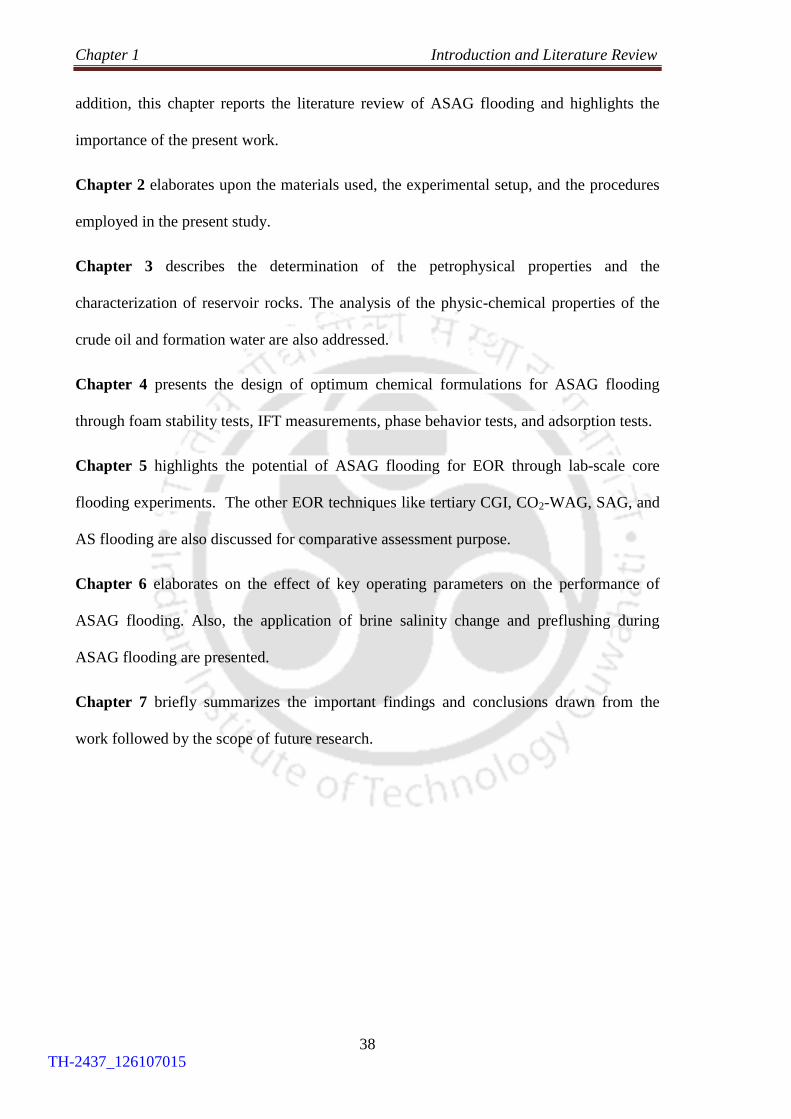
Chapter 1 Introduction and Literature Review
38
addition, this chapter reports the literature review of ASAG flooding and highlights the
importance of the present work.
Chapter 2 elaborates upon the materials used, the experimental setup, and the procedures
employed in the present study.
Chapter 3 describes the determination of the petrophysical properties and the
characterization of reservoir rocks. The analysis of the physic-chemical properties of the
crude oil and formation water are also addressed.
Chapter 4 presents the design of optimum chemical formulations for ASAG flooding
through foam stability tests, IFT measurements, phase behavior tests, and adsorption tests.
Chapter 5 highlights the potential of ASAG flooding for EOR through lab-scale core
flooding experiments. The other EOR techniques like tertiary CGI, CO2-WAG, SAG, and
AS flooding are also discussed for comparative assessment purpose.
Chapter 6 elaborates on the effect of key operating parameters on the performance of
ASAG flooding. Also, the application of brine salinity change and preflushing during
ASAG flooding are presented.
Chapter 7 briefly summarizes the important findings and conclusions drawn from the
work followed by the scope of future research.
TH-2437_126107015

CHAPTER 2
Materials and Methods
Materials
Methods
Experimental procedures
Core analysis
Characterization
of crude oil
Characterization
of formation water
Core flooding
experiments
WAG flooding SAG floodingASAG flooding
Effects of key parameters
Evaluation of
foam stability
Phase behavior
study
IFT
measurements
Adsorption
study
Oil recovery
Pressure drop
Result analysis
TH-2437_126107015

TH-2437_126107015

Chapter 2 Materials and Methods
39
Chapter 2
Materials and Methods
This chapter consists of two sections. The first section presents the details of the
chemicals, crude oil, reservoir rocks and formation water used to perform the
experiments. The second section summarizes the details of the experimental setup and
the procedures adopted for performing the experiments related to the study.
2.1 Materials
The oil field chosen for this study is one of the main crude oil producers of
Upper Assam Basin in India, covering an area of about 25 sq km. The oilfield was
discovered in the late 1960s and commercial production started from the mid-1970s.
The oil-producing zones have been identified as Tipam Sand, Barail Coal Sand, and
Barail Main Sand. The Tipam sand is sub-divided into six zones from where the
majority of oil production takes place. The sediments are mainly sandstone together
with clays and shales. The driving mechanism of the oilfield is mostly depletion drive
and the reservoirs were developed through water injection. The reservoir selected for
the study is the most salient and extensive one in the oilfield. The reservoir pressure
initially was around 3400 psia at a depth of around 3000 meters and the formation
temperature is about 70 oC. However, the present pressure has declined to
approximately 1800 psia and is lower than the saturation pressure (2500 psia) of the
crude oil.
Oil samples
The crude oil collected from the oilfield was chosen for the study to mimic the
reservoir conditions and obtain representative results. The crude oil was separated from
TH-2437_126107015

Chapter 2 Materials and Methods
40
water using separating funnel at a temperature of 35 oC and centrifuged before carrying
out the detailed analysis.
Core samples
Core plugs (3.75 cm diameter and approximately 7 cm length), used for core
analysis and core flooding, were cut parallel to bedding plane from conventional core
obtained from different depths of the oilfield ranging from (2480-2486), (2925-2943)
and (3940 – 3947) m. Prior to core analysis, the core plugs were completely cleaned of
impurities followed by drying.
Formation water
Formation water of the same oilfield was also collected and thoroughly
analyzed. Synthetic formation brine (SFB) was prepared based on the compositional
analysis of the formation water.
Surfactants
As the reservoir rocks were sandstones, anionic and non-ionic categories of
surfactants were selected for this study. The surfactants used are shown in Table 2.1.
The surfactants SDS, AOS, SDBS and TX-100 were of industrial purity and used
without any further treatment. Black liquor (BL) is an anionic water-soluble surfactant
whose main constituent is sodium lignosulfonate and effluent of a paper mill of Assam,
India. The detailed composition of BL is described in a previous study [142]. BL is
used as a secondary (preflushing) surfactant in this study.
Alkali
The alkalis considered for preparing chemical slug along with the surfactants in
this work were sodium carbonate, sodium hydroxide, and borax. The details of the
alkalis are shown in Table 2.2:
TH-2437_126107015
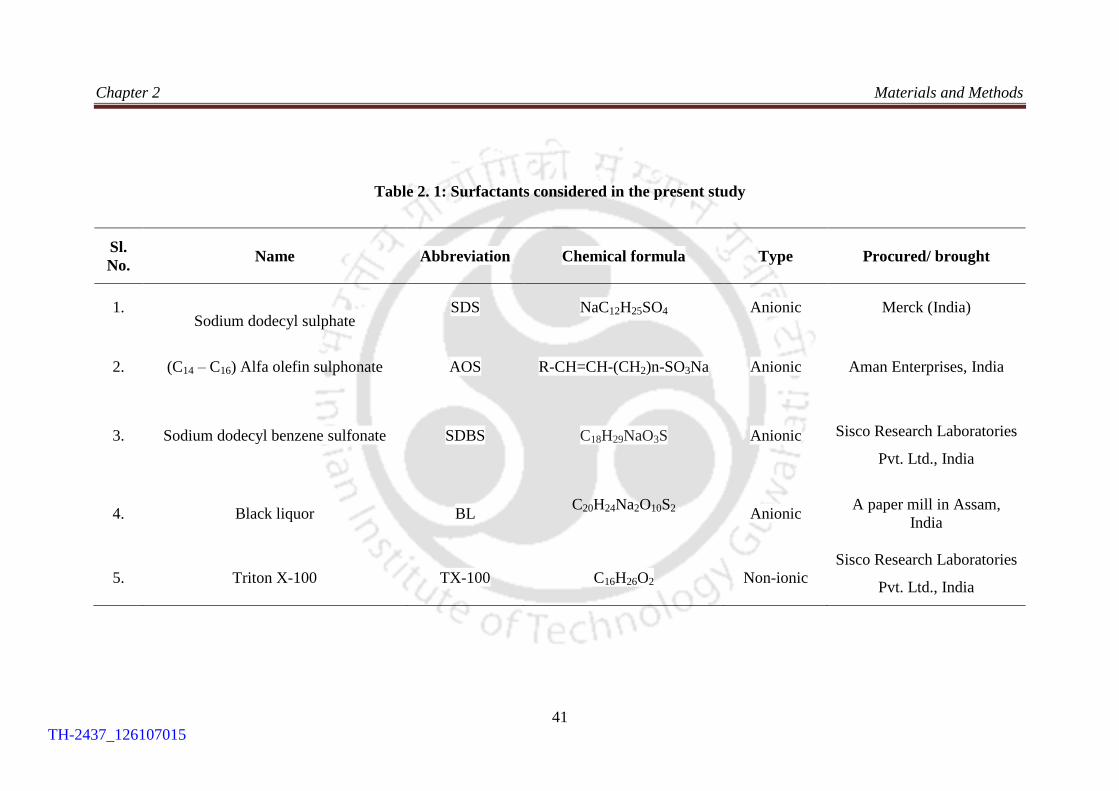
Chapter 2 Materials and Methods
41
Table 2. 1: Surfactants considered in the present study
Sl.
No.
Name
Abbreviation
Chemical formula Type Procured/ brought
1.
Sodium dodecyl sulphate SDS NaC12H25SO4 Anionic Merck (India)
2.
(C14 – C16) Alfa olefin sulphonate
AOS R-CH=CH-(CH2)n-SO3Na Anionic Aman Enterprises, India
3. Sodium dodecyl benzene sulfonate SDBS C18H29NaO3S Anionic
Sisco Research Laboratories
Pvt. Ltd., India
4. Black liquor BL C20H24Na2O10S2
Anionic
A paper mill in Assam,
India
5. Triton X-100 TX-100 C16H26O2 Non-ionic
Sisco Research Laboratories
Pvt. Ltd., India
TH-2437_126107015

Chapter 2 Materials and Methods
42
Table 2. 2: Alkalis considered in the present study
Sl.
No.
Name
Chemical formula Purity (%) Procured
1. Sodium carbonate Na2CO3 99
Merck (India) &
Renkem
2. Sodium hydroxide NaOH 97
3. Borax Na2B4O7.10H2O 99
Other materials
To perform the characterization of samples and other studies various analytical
grade chemicals were used which are listed in Table 2.3.
Table 2. 3: Other chemicals considered in the present study
Sl.
No.
Name
Chemical
Formula/
Abbreviation
Purity
(%)
Procured /
Make & Model
1. Sodium bicarbonate NaHCO3 99
Merck Specialities
Pvt Ltd., India
2. Sodium hydroxide NaOH 99.5
3. Calcium chloride CaCl2 98
4. Magnesium chloride MgCl2 98
5. Sodium chloride NaCl 99
6. Potassium bromide KBr 99.5
7. Toluene C6H5CH3 99.5
8. Xylene C6H4 .2CH3 99.5
9. Methanol CH3OH 99
10. Ethyl alcohol C2H5OH 99
11. n-Heptane C7H16 99
12. Potassium hydroxide pellets KOH 99
13. Ethylenediaminetetraacetic acid EDTA 99
14. Phenolphthalein C20H14O4 99
15. Silica gel Si 99
16. Methyl ethyl ketone C2H5COCH3 99.5
TH-2437_126107015

Chapter 2 Materials and Methods
43
2.2 Experimental Procedures
2.2.1 Core Plug Preparation
The core plugs were cut from the conventional cores with the help of the Core
Cutting machine and the Core Plugging machine. Thereafter, they were end faced using the
End Facing machine to obtain core plugs that were exactly uniform right angle cylinders.
The core plugs were required to be thoroughly cleaned of all interstitial fluids and dried
before the determination of their petrophysical properties.
The cleaning of the core plugs was done in the Soxhlet apparatus for about 40
working hours. The solvents used to dissolve and extract oil/brine from the core plugs were
a mixture of 50% CH3OH + 50% C6H4 .2CH3. The sample’s cleanliness was determined
from the color of the solvent that siphoned intermittently from the extractor. After cleaning
in the Soxhlet apparatus, the core plugs were again cleaned in ultrasonic cleaner for 10
min, by submerging the samples in acetone solution. The core plugs are then dried at 60 oC
to remove any moisture present in the pore spaces. Drying times varied for core plugs but
usually took from 30 to 50 working hours. The plugs were weighed after a definite interval
of time (every 4 hours ) till a constant weight was achieved, indicating that the plugs were
completely dried.
2.2.2 Determination of Porosity
The bulk volume (BV), grain volume (GV), and pore volume (PV) determination
are prerequisites for the laboratory determination of porosity. The BV can be measured
with the help of calipers or the Archimedes (buoyancy) principle. The pore volume can be
measured by the liquid saturation method or Boyle’s Law single-cell method. The grain
volume can be measured from the dry weight of core plugs and sand-grain density, or by
the Boyle’s Law Double-Cell Method [143]. In this study, the BV of the core plugs was
measured with the help of calipers and GV was determined with a Helium Porosimeter
TH-2437_126107015

Chapter 2 Materials and Methods
44
(Make: Coretest Systems, Inc, USA; model: TPI-219) which is based on the Boyle’s law
double cell method. In this system, gas was allowed to flow into the reference cell of
known volume (Vr) at a predetermined reference pressure (100 to 200 psig). The reference
cell gas was then admitted into a connected chamber of known volume containing the core
plug. The GV was calculated applying by Boyle’s law using the following equation:
1g c r
2
PV =V - V -1
P
(2.1)
where Vg = GV of the core plug,
Vc = Sample chamber volume
Vr = Reference chamber volume
P1 = Initial reference volume pressure
P2 = Final lower equilibrium pressure
2.2.3 Determination of Permeability
Permeability is measured, using Darcy’s equation, by passing a fluid of known
viscosity through a core plug while measuring the flow rate and the pressure drop across
the core plug. Darcy’s equation can be expressed as [18]:
q μ L
K=A ΔP
(2.2)
where K = permeability of the rock (Darcy)
q = Volumetric flow rate (cm3/sec)
A = Total cross-sectional of the core sample (cm2)
L = Length of core sample (cm)
μ = Fluid viscosity (cP)
ΔP = P1 – P2 = Pressure differential across core (atm).
TH-2437_126107015

Chapter 2 Materials and Methods
45
The permeability measured at 100% saturation of a single-phase (liquid) is called
the absolute permeability of the rock. Frequently dry gas is used in permeability
determination, because its small molecules rapidly penetrate the microscopic pores, has
minimum fluid-rock reaction, has high diffusivity and is convenient. However, the
measurement of the permeability is mainly done in the low (laminar/viscous) flow rate
region, where the pressure is proportional to the flow rate [18]. Applying the ideal gas law
and Darcy’s law, the gas flow equation can be expressed as:
g b sc
g 2 2
1 2
2000 μ L P qK =
A P -P (2.3)
where Kg = Gas permeability (mD)
μg = Gas viscosity (cp)
Pb = Base pressure (atm)
P1 = Inlet pressure (atm)
P2 = Outlet pressure (atm)
qsc = Gas flow rate at standard conditions (cm3/sec).
The permeability measured by flowing gas is observed to be greater than the
permeability obtained by flowing a liquid. Klinkenberg [144] postulated that the higher
value was because of the greater flow rate of gas at a given ΔP and gas slippage at the sand
grain surface. It was observed that for a given core plug the mean pressure (Pm) could be
used to calculate the permeability.
1 2m
P + PP =
2 (2.4)
If measured permeability is plotted versus 1/Pm and extrapolated to the point where 1/Pm =
0 (Pm = infinity), the corresponding permeability would be approximately equal to the
liquid permeability. In this work, liquid and gas permeabilities of core plugs were
measured experimentally and the results were correlated. The liquid permeabilities were
TH-2437_126107015

Chapter 2 Materials and Methods
46
measured with the Liquid Permeameter (Make: Vinci Technologies, France; Model:
LiquidPerm) and the gas permeabilities with Gas Permeameter (Make: Coretest Systems,
Inc., USA, Model: TKA-209). The measured gas permeability values were used to
determine the liquid permeability applying the Klinkenberg principle.
2.2.4 XRD and FESEM Study
X-ray diffraction (XRD): Powder X-ray diffraction of the rock sample was
conducted in a Bucker X-ray D8 advance diffractometer. Clean core samples were
grounded to fine powder and X-ray diffractogram were collected for a range of Bragg
angle 2θ (7o to 90
o) with 0.03 step size and 1
o/min scanning speed. Zeiss Sigma Field
Emission Scanning Electron Microscope (FESEM) was used identification of clay minerals
in rock sample. The sample was prepared by gently breaking the core plug. The sample
was then attached to a specimen plug and coated with gold to obtain a clear image of the
rock sample. The FESEM images were obtained and compared with standard images to
identify clay minerals.
2.2.5 Characterization of Crude Oil
The laboratory analysis of crude oil is necessary for characterizing a particular
reservoir fluid sample and also to make a preliminary assessment of the effectiveness of
EOR schemes. In this study, the crude oil was analyzed for API gravity, viscosity,
asphaltene-resin content, wax content, pour point, and acid number.
Density is the mass of liquid per unit volume, while specific gravity is the ratio of
the mass of a given volume of liquid at 15.50C to the mass of an equal volume of pure
water at the same temperature. The ASTM D1298-67 [IP 150/68] hydrometer method was
followed for the determination of the density of crude oil samples. The hydrometer is made
of glass, graduated in units of density. The API gravity was calculated from the specific
gravity by using the following equation:
TH-2437_126107015

Chapter 2 Materials and Methods
47
0 0
0 141.5 - 131.5
Sp.gr. at15.6 C/15.6 CAPI gravity = (2.5)
The dead oil viscosity of the oil samples was measured following the ASTM D445-
65 method using U-tube reverse flow viscometer (type: BS/IP/RF). The selected
viscometer was charged with crude oil and allowed to remain in the bath long enough to
reach the test temperature. Suction pressure was used to adjust the head level of the oil
sample to the first timing mark of the capillary arm of the viscometer. Allowing the sample
to flow freely, the time (in sec) required for the meniscus to pass from the first timing mark
to the second was recorded. The kinematic viscosity was calculated as follows:
Kinematic viscosity (cSt) = Ct (2.6)
where C = Calibration constant of the viscometer (cSt/sec),
t = Flow time (sec).
From the kinematic viscosity, the dynamic viscosity was calculated as follows:
Dynamic viscosity (cP) = ργ (2.7)
where ρ = Density at the same temperature as kinematic viscosity,
γ = Kinematic viscosity (cSt).
The experiments were repeated for three times and the average values are considered.
As per standard test method IP 15/67, the pour point is the lowest temperature,
expressed as a multiple of 3, at which crude oil is observed to flow when cooled and
examined under prescribed conditions. The oil sample was poured into a cylindrical test jar
(25 mm OD and 60 mm in height). The oil was initially slightly heated in a hot water bath
to ensure it flowed into test jar. The temperature of the cooling bath was maintained at 0 to
2 o
C. The specimen was first examined at 30 oC. The test jar was tilted just enough to
ascertain if there was movement of the specimen. If movement was noticed, the test jar
was replaced in the jacket and the test repeated again at 30C lower. This was continued
TH-2437_126107015
Chapter 2 Materials and Methods
48
until the point when the specimen showed no movement when the test jar was held in a
horizontal position for 5 sec. The reading observed in the test thermometer was recorded.
As per the method, 3 oC was to be added to the temperature recorded, which gives the pour
point of the crude oil [145].
The asphaltene content of oil samples was measured by asphaltene precipitation
with n-heptane (ASTM D2007-80) as reported by Bon [146]. 5 gm of the crude oil was
mixed with 150 ml of n-heptane. The mixture was agitated with a stirrer for 1 hour and
filtered through preweighted 125 mm No.42 Whatmann filter paper. The filtrate was used
for the determination of resin content. The filter paper with solids was dried in an oven at a
temperature of 60 0C until a constant weight was obtained. The solids from the filter were
re-dissolved with toluene and filtered again through a new filter paper. The filter paper
with solids was again dried in the oven at a temperature of 60 oC until constant weight
obtained. From the measured change in weight of the filter paper, asphaltene content of the
crude oil was determined accordingly. To estimate the resin content, the filtrate was mixed
with 200 g of silica gel and the mixture was continuously stirred with heating for 1 hour so
that the resins were adsorbed to the silica gel. After cooling for one overnight, the liquid
portion was filtered. The silica gel was placed in the thimble of the soxhlet apparatus and
extracted with toluene: methanol (90:10) solvent until the silica gel becomes free from
resin. The solvent was evaporated in the water bath followed by drying in the oven, and
eventually, the weight of the resin was determined [147].
The filtrate after removing asphaltene and resin was concentrated to about 50 ml on
the water bath. The concentrate was mixed with 200 ml of methyl ethyl ketone (MEK) and
cooled in a deep freezer. The mixture was kept overnight in the freezer to allow for
possible wax precipitation. Finally, the mixture was filtered with Whatmann filter paper
(size 42), dried in ambient temperature and weighted to determine the wax content [148].
TH-2437_126107015

Chapter 2 Materials and Methods
49
To measure the acid number of crude oil, 1 ml of the phenolphthalein solution was
added to 50 ml of C2H5OH in a conical flask and the mixture was heated to 40-50 oC. The
mixture was neutralized with standard 0.1 N KOH solution. The neutralized alcohol was
added to 10 gm of crude oil in a 250 ml conical flask and the mixture was heated to boiling
for 5 min with agitation. Further 1 ml of phenolphthalein solution was added to the mixture
and cooled to 45 oC. Finally, the solution was titrated quickly with the KOH solution. The
acid number of the oil was calculated using the formula [145]:
NVAN = 56.1
W (2.8)
where, AN = Acid number in mg KOH/g of sample
V = Volume of KOH solution in ml
N = Normality of the KOH solution
W = Weight of the sample in gm.
The crude oil was also analyzed with FTIR spectrophotometer to determine the
functional groups present mainly the existence of carboxylic acids. For the analysis,
analytical grade potassium bromide (KBr) pellets were prepared and a small drop of the
crude oil was added to the prepared KBr disc.
2.2.6 Characterization of Formation Water
The pH and total dissolved solids (TDS) values of the formation water were
measured with Water Analyser (Make: Systronics; Model: 371). The density was measured
with a pycnometer and viscosity using U-tube viscometer. The positive ionic compositions
like Na+, Ca
++ and K
+ were measured with Flame Photometer (Make: Systronics, Model:
128), whereas Mg++
was measured by titration with EDTA. For the negative ionic
compositions like Cl- and HCO3
-, titrations were performed with AgNO3 solution and HCl
acid respectively.
TH-2437_126107015

Chapter 2 Materials and Methods
50
2.2.7 Evaluation of Foam Stability
Foamability and foam stability are two important properties of foam that influence
its generation and propagation through the reservoir rocks during foam-based EOR
applications. Foamability is defined as the capability of the surfactants to form foam, and
foam stability is described by the changes in foam volume with respect to time, following
foam generation [149]. In foam stability tests, surfactants were tested for their ability to
form stable foam and to provide suitable concentration for preparation of formulation. In
this work, the foam stability of different surfactants was studied to screen them and to
select optimum surfactant concentrations. These optimal surfactant solutions displaying the
best foaming behavior are expected to provide better mobility control during the core
flooding experiments.
The foam stability tests were initially performed based on the standard shaking
method [150] to determine the ability of surfactants to form strong/stable foam. A fixed
amount (5 ml) of aqueous solution of surfactant was taken in test tubes and shaken in a
rotary mixer (for 6 hours at a constant speed of 50 rpm) which resulted in the formation of
foam above the liquid column. The foam volume was recorded by visual observation at a
regular interval of time as the foam decayed at room temperature. The time taken for the
foam to decay to half of the initial value was particularly noted with care. This time is
taken as the half-decay time (t1/2) which signifies foam stability. A stronger foam
formation and consequently better surfactant performance are indicated by a longer half-
decay time [151]. For the tests involving the presence of crude oil, 0.5 ml of crude oil (at
10 vol%) was added to the top of the 5 ml surfactant solution before the test tubes were
shaken for foam generation. Particular care was taken to ensure that experimental
TH-2437_126107015

Chapter 2 Materials and Methods
51
conditions were identical. All the experiments were performed a minimum of three times
and the average values are noted.
The foam stability tests were performed with CO2 gas in a foam column test setup
(Fig. 2.1), which consisted of a visual column of toughened glass, where the 20 ml of
surfactant solution along with 2 ml of crude oil (10 vol%) was placed. The visual glass
column was housed inside a hot air oven where the temperature was set to reservoir
temperature (70 0C). The column filled with surfactant solution and crude oil was allowed
to stand inside the oven for a sufficient period of time (1 hour) so that the contents of the
column attain the set temperature. Thereafter, a constant volume of CO2 gas was injected
below the surfactant solution for 5 min from a CO2 cylinder connected to the column via a
mass flow controller (MFC). This resulted in the formation of foam in the glass column.
The foam volume above the liquid level with respect to time was regularly monitored and
recorded. Special care was taken to record the t1/2. Selected tests were repeated to assess
the consistency of the results.
Fig. 2.1: Schematic diagram of foam column test setup [[151], modified]
Valve
Compressed CO2 cylinderMass flow
controller
Glass
foam column
Graduated
scale (ml)
Gas regulator with heater
Hot Air Oven
TH-2437_126107015

Chapter 2 Materials and Methods
52
2.2.8 Interfacial Tension Measurements
A spinning drop tensiometer (Make: Grace; Model: M6500) was used to measure
the equilibrium IFT between crude oil (oleic phase) and AS solutions (aqueous phase) at
reservoir temperature (70 oC). To achieve the required oil droplet length to diameter (L/D)
ratio greater than 4, a fixed rotational speed of 6500 rpm was maintained in the
experiments. From the image captured, the oil droplet diameter was measured with the
Motic Images Plus 2.0 software. Finally, the equilibrium IFT was calculated by using
Vonnegut’s equation [152]:
23Δρ ω
λ= r4
(2.9)
where λ = IFT, mN/m
Δρ = Density difference between the oleic and aqueous phases, g/cm3
ω = Angular velocity, rad/s
r = Radius of the oil drop in the sample tube, cm.
2.2.9 Phase Behavior Study
Aqueous stability tests were performed to investigate the solubility and stability of
chemicals in electrolyte solution. In this test, appropriate amounts of surfactants, alkali,
and brine are intimately mixed together without adding oil and allowed to settle for 48
hours at reservoir temperature, to observe if any deposition, separation or cloudiness
occurs.
Microemulsions are thermodynamically stable dispersion of water and oil
containing a significant amount of both the phases and stabilized by a surfactant [153].
Based on the continuous and dispersed phases, microemulsions can be either water-in-oil
(W/O) or oil-in-water (O/W). The phase behavior of microemulsion for oil, surfactant, and
brine was first described by Winsor in 1954. Microemulsion phase behavior is a function
of salinity, temperature, nature of the oil, type of the surfactant and the cosurfactant, and
the water-oil ratio (WOR). In particular, brine salinity greatly influences the phase
TH-2437_126107015
Chapter 2 Materials and Methods
53
behavior of surfactant solutions [154]. As the salinity of brine is increased, three types of
microemulsions form: type I or O/W microemulsions, type II or W/O microemulsion, and
type III or bicontinuous middle phase microemulsion [155]. Normally, phase behavior tests
are done to determine the optimal brine salinity of surfactant solutions that have high oil
and water solubilization ratios. Higher solubilization ratios will achieve ultra-low IFT (10-2
to 10-3
mN/m) as per Huh’s equation [156], thus leading to higher oil recovery. In this
study, solutions containing the selected concentrations of surfactant and alkali were
prepared at different SFB salinities. The solution and crude oil were then mixed in small
test tubes in the water-oil ratio of 2:1 and were agitated in rotary mixer at 50 rpm for 6
hours for proper mixing. Further, the test tubes were arranged in order of salinity in racks
and kept in the oven (at 70 oC) to equilibrate. The fluid interfaces in the test tubes were
inspected at regular intervals of 12 hours for a month to observe for Winsor type III
microemulsions formation.
2.2.10 Adsorption Study
The surfactants injected during ASAG flooding are susceptible to be adsorbed due
to their interaction with reservoir rocks causing the loss of valuable surfactant/foaming
agent. Thus, the ability of the surfactant solutions to lower the oil-water IFT is reduced.
Additionally, the generation and propagation of foam through the reservoir rock is also
affected by surfactant adsorption. So, minimizing the surfactant loss during the ASAG
process should be considered for economic reasons. It is mainly the solution and the solid
surface properties that influence the surfactant adsorption. Both static adsorption and
dynamic adsorption studies were performed to study surfactant adsorption onto the
reservoir rock. Static adsorption test was done based on the depletion method [157]. In this
method, the change in the surfactant concentration (depletion) after contact with crushed
rock samples was measured and assumed to be adsorbed. 1 g of the rock sample (60 – 70
mesh size) was mixed with 10 ml of surfactant solution at various concentrations. The
mixtures were mixed for 8 hours in a rotary mixer followed by decantation. The samples
were then centrifuged at 5000 rpm for 30 minutes and then filtered by filter paper. The
TH-2437_126107015

Chapter 2 Materials and Methods
54
UV-Vis Spectrophotometer (Make: Labman; Model: LMSP – UV 1900) was used to
determine the equilibrium concentrations of the surfactant solutions. The sample
preparation of the SDS surfactant was done by the method described in the literature [66,
158]. Equal volumes of SDS solution and methylene blue reagent (250 mg methylene blue,
50 gm Na2SO4, and 10 ml of H2SO4 per liter of distilled water) were mixed. The mixture
was extracted with ethyl acetate which resulted in the formation of two phases. The upper
liquid phase was taken and analyzed by the UV-Vis spectrophotometer after dilution. The
adsorption spectra of SDS and AOS [Figure 2.2 (a) – (b)] showed the maximum adsorption
(λmax) at wavelengths of 655 nm and 216 nm respectively. The calibration curves of
surfactants were obtained by plotting absorbance versus concentration and fitting the best
straight line through the points. The standard calibration curves of SDS and AOS are
shown in Fig. 2.3 (a) – (b) respectively. The amount of surfactant adsorbed on the rock
sample (in mg/g) was calculated by the following relation [157]
(2.10)
where Co and Ce are the initial and equilibrium concentrations of surfactants (mg/l)
respectively, V is the volume of the surfactant solution (l), and m is the weight of the rock
samples (g). The adsorption isotherms were determined at a constant temperature from the
relationship between the amount of surfactant adsorbed per unit mass and the equilibrium
surfactant concentration. The dynamic adsorption of surfactant (AOS) onto the core plug
was performed in a core flooding apparatus at reservoir temperature (70 oC). Before
placing in the Hassler core holder, the core plug was saturated with SFB. Thereafter,
several pore volume (PV) of SFB was injected at constant pressure until equilibrium
conditions were achieved. This was followed by 10 PV of surfactant solution (at 0.5 wt%
concentration) injection through the core plug at a constant pressure. The injection of 10
PVs was sufficient to achieve an equilibrium state. The effluents produced from the core
plug outlet were collected in measuring cylinders for every PV, and their concentrations
were analyzed [159]. The amount of surfactant adsorbed was determined as follows [160]
Amount of surfactant adsorbed = o e
VC C
m
TH-2437_126107015

Chapter 2 Materials and Methods
55
1 in outC - C x V
Adsorption (mg/g)W
N
i i (2.11)
where Cin is the concentration of surfactant injected (mg/g), Cout is the concentration of
surfactant solution coming out of the core plug at each PV (mg/g), N is the number of the
PV of surfactant solution injected, Vi is the total volume of surfactant solution injected,
and W is the dry weight of the core plug (g).
2.2.11 Core Flooding Experiments
A lab-scale core flooding apparatus was used to perform the core flooding
experiments (Fig. 2.4). Core plugs were thoroughly cleaned (using the procedure described
in Section 2.2.1) and dried prior to placing in the core holder. Three hydraulic pumps were
used to displace brine, crude oil, and chemical solution. Another hydraulic pump was
connected to the Hassler core holder for supplying the confining pressure, which was
always maintained 500 – 700 psi higher than the upstream injection pressure. CO2 gas was
supplied from a cylinder connected with regulator-preheater assembly and MFC. In the
downstream side of the core holder, a back pressure regulator (BPR) was used to maintain
a constant back pressure of 300 psi [122]. A hot air blower was used to heat the chamber
housing the core holder and maintain a constant reservoir temperature (70 oC). The
temperature inside the core holder was monitored using Pt100 RTD temperature sensor.
The probe end of the sensor was terminated in a connection head located on the end plug
of the core holder. To read the temperature, the RTD element was connected to the digital
temperature controller installed in the scanner where the output temperature reading was
displayed. The inlet, outlet and confining pressures of the core holder were measured by
using pressure transducer and stored automatically in a computer at regular time intervals.
The presetting of the time interval was done through the control panel of the core flooding
apparatus. Additionally, a 3-way Tee joint connecting gas cylinder, pumps and upstream
end of the core holder, facilitated the alternate injection of liquids and gas.
TH-2437_126107015
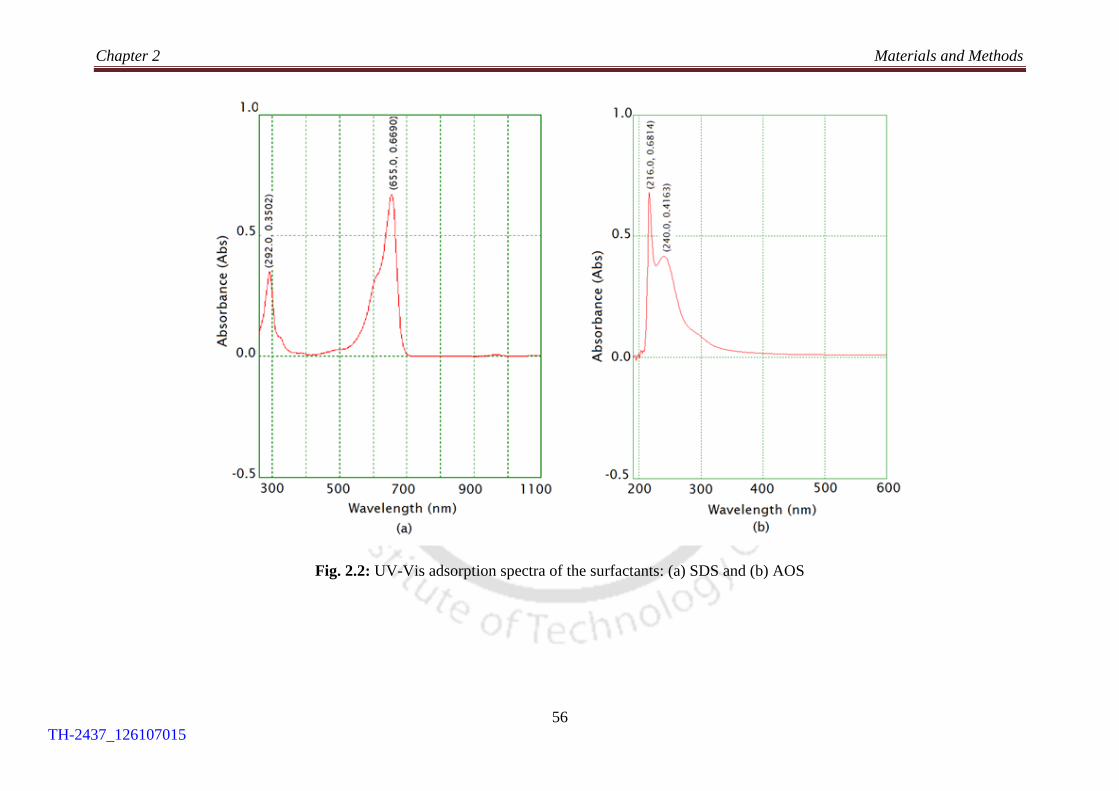
Chapter 2 Materials and Methods
56
Fig. 2.2: UV-Vis adsorption spectra of the surfactants: (a) SDS and (b) AOS
TH-2437_126107015

Chapter 2 Materials and Methods
57
Fig. 2.3: Calibration curves of the surfactants: (a) SDS and (b) AOS
0 20 40 60 80 100 120 1400.0
0.2
0.4
0.6
0.8
1.0(a) SDS
Ab
sorb
ance
Concentration (g/gm)
0 20 40 60 80 100 120 1400.0
0.1
0.2
0.3
0.4
0.5
Ab
sorb
ance
Concentration (g/gm)
(b) AOS
TH-2437_126107015

Chapter 2 Materials and Methods
58
In the first step, air was removed from the core plug and flow lines by flushing CO2
for 30 minutes. Then, CO2 was removed from the system by vacuuming for 6 hours. Brine
saturation was done by injecting several PVs of SFB at a constant rate to fully saturate the
core plug at room temperature (28 oC) and to achieve steady-state flow conditions. After
that, they were flooded in the core holder (as shown in figure 1) by formation brine at
various pore volumes to ensure that all pores were fully saturated with the brine.
The absolute permeability (Kabs) of the core plug to SFB was calculated by
applying the standard Darcy’s equation by injecting SFB at different pressures. In the next
step, crude oil was injected at constant pressure through the brine-saturated core plug until
pressure drop (ΔP) was stable and no more water was produced. This indicated that
connate water saturation was reached. The irreducible water saturation (Swc) and original
oil in place (OOIP) were calculated considering the water produced and the net change in
weight of the core plug. Thereafter, the oil-saturated core plug was kept in the oven at 70
oC for 24 hours for allowing the system to equilibrate. During secondary water flooding,
SFB was injected at a constant pressure to recover the crude oil from the core plug at
reservoir temperature (70 oC). The water flooding was stopped after 4 PVs of SFB
injection when no more oil was recovered, and only water was produced. Subsequent to
secondary water flooding, the residual oil in the core plug was recovered by applying
different EOR injection schemes. During WAG injection, liquids and gas/CO2 were
alternately injected in small slugs with a total fluid injection of 2 PV. The liquid was
injected at constant pressure (~ 500 psi) and the volumetric injection rate of gas was
maintained constant (0.2 ml/min) through the mass flow controller (MFC). The EOR
scheme was followed by the extended water flooding (EWF) where 4 PVs of SFB were
further injected to produce any remaining residual oil in the core plug. The produced fluids
were collected in measuring cylinders every 0.25 PV and then centrifuged for separating
the oil and the water phases.
TH-2437_126107015

Chapter 2 Materials and Methods
59
Fig. 2.4: Schematic representation of core flooding apparatus
Mass flow
controller
(MFC) Pressure
Transducer
Confining pressure
hydraulic pump
Computer
Control
panel
Pressure
Transducer
Pressure
Transducer
Oven
Hassler core holder
3-way joint
Valves
Inlet Outlet
Brine
pump
Crude oil
pump
Measuring
cylinder
CO2 cylinder Back pressure
regulator (BPR)
Chemical
pump
TH-2437_126107015

60
TH-2437_126107015

CHAPTER 3
Reservoir Rock and Fluid Analyses
Porosity and permeability of core plugs
Type of crude oil
Synthetic formation brine
Core Analysis
K
Analysis of crude oil
API
gravity
Resin-
Asphaltene
content
Acid
number
Dead oil
viscosity
Pour
point
Analysis of formation water
TDSIonic
compositionSalinitypH
10 20 30 40 50 60 70
0
100
200
300
Co
un
ts
2 Theta (Degree)
XRD FESEM
Mineralogy
TH-2437_126107015

TH-2437_126107015

Chapter 3 Reservoir Rock and Fluid Analyses
61
Chapter 3
Reservoir Rock and Fluid Analyses
This chapter consists of three sections. The first section describes the core analysis which
includes the core plug preparation along with the determination of porosity and
permeability. The reservoir rock characterization with XRD and FESEM analysis also
forms part of this section. The second section presents the analysis of the physical and
chemical properties of crude oil. The last section summarizes the physical and chemical
analysis of the formation water.
3.1 Core Analysis
Core analysis of reservoir rocks samples provides a direct and quantitative
evaluation of important reservoir properties. These properties assist in accurately
describing the reservoir rocks, total fluid contents, fluid distribution, and flow behavior.
The static and dynamic reservoir models can also be designed based on formation
evaluation done with core analysis [161]. For core analysis, a whole core is acquired from
a particular depth of the producing formation through coring operation. Coring operation
involves lowering the drilling string, with the core cutting bit at the end, to the desired
depth of the formation and retrieving the whole core inside the core barrel. A typical
conventional core is 7 – 13 cm in diameter and 900 – 1700 cm in length. The other type of
cores are the sidewall cores. They are much smaller than the conventional cores, 2.3 cm in
diameter and 5 cm in length. As it is not possible to use whole/conventional cores in the
laboratory for core analysis, short representative core plugs (2.54 – 3.81 cm in diameter)
from the large conventional cores are selected. The core plugs are cut from the
conventional cores parallel to the bedding plane, so that measurements of horizontal
TH-2437_126107015

Chapter 3 Reservoir Rock and Fluid Analyses
62
permeability may be made (Fig. 3.1). The core plugs used in this work were 3.75 cm in
diameter and 6 – 8 cm in length.
There are basically two main types of core analysis performed on core plugs.
Conventional/routine core analysis which includes measurements of petrophysical
properties of core plugs like porosity, permeability, and fluid saturation together with the
evaluation of grain density, rock texture, and lithology. Special core analyses are
conducted for measuring specific properties including capillary pressure, relative
permeability test, wettability test, electrical properties, formation damage, and recovery
factors. These special tests are also conducted to characterize reservoirs for EOR and to
study the fluid-rock interactions. Both the routine and special core analyses were
performed in this study. The routine core analysis for the measurement of porosity &
permeability of core plugs is reported in this chapter and special core analysis (core
flooding) in later chapters. Prior to core analysis, the core plugs were required to be
cleaned and dried. The detailed process of cleaning and drying requires about 80 working
hours as described in Section 2.2 and Subsection 2.2.1 .
Fig. 3.1: Schematic representation of conventional cores and core plugs
Conventional
core
8.89 cm
90
0–
17
00
cm
Core
plug
3.75 cm
7 – 9 cm
TH-2437_126107015
Chapter 3 Reservoir Rock and Fluid Analyses
63
3.1.1 Determination of Porosity
One of the most important reservoir rock properties is porosity, which is a measure
of the space available for the storage of hydrocarbons. There are two distinct types of
porosity of reservoir rock: absolute porosity, which is the ratio of the total pore space in
the rock to that of the bulk volume; and effective porosity, which is the percentage of
interconnected pore space with respect to the bulk volume. It is the effective porosity that
is important in most reservoir engineering calculations as it represents the pore space that
are interconnected and containing the recoverable crude oil.
Pore volume Bulk volume - Grain volume
Porosity, = = Bulk volume Bulk volume
(3.1)
The grain volume of the core plugs was measured with the Helium Porosimeter and
the porosities were calculated using Eq. (3.1). The grain volume measurements were
repeated and the average of three values was taken to calculate the porosity of each core
plug. The results of the porosity measurements are presented in Table 3.1 and the sample
calculations are summarized in Appendix A. As can be seen, the values of porosities of the
core plugs vary from 25 – 28% at a shallower depth, 19 – 21% at intermediate depths, and
11 – 13% at deeper depths. Similar values of porosity of the Upper Assam oilfield core
samples were reported earlier [162]. The porosity/depth data of the core plugs are
summarized in Table 3.2. The low porosity values were observed with core plugs obtained
from deeper depth (3940 – 3947 m), while relatively high porosity for core plugs from
depths of 2480 – 2486 m. Thus, the porosities of the core plugs were found to decrease
with the depth of the formation from where the conventional cores were collected. This is
consistent with the known fact that porosity bears an inverse correlation with depth. The
porosity-depth correlation is influenced by many factors but the most obvious reason for
this inverse relation is owing to the combined effects of compaction and cementation
TH-2437_126107015

Chapter 3 Reservoir Rock and Fluid Analyses
64
[163]. An increase in the depth of progressive burial increase the overburden pressure or
compaction resulting in the reduction of porosity. As the effective stress and temperature
increase with the burial depth, the porosity depth correlations are also dependent on
effective stress. The other factors which influence porosity profiles are subsidence history,
oil/gas saturation, and mineralogy. However, it is difficult to isolate the effect of any single
factor or process responsible for the observed relation [164].
Table 3.1: Porosity measurement of core plugs from different depths
Core
Plug
ID
Depth
(m)
Diameter
(cm)
Length
(cm)
Bulk
volume
(cm3)
Weight
(g)
Grain
Volume
(cm3)
Porosity
(%)
CP1
2480 -
2486
3.75
7.75
85.61
195.74
63.45
25.69
CP2 3.75 7.02 77.54 161.15 56.16 27.57
CP3 3.75 6.81 75.02 156.11 54.65 27.15
CP4
2925 -
2943
3.75 8.11 89.58 199.34 71.28 20.44
CP5 3.75 7.43 82.07 186.28 65.52 20.14
CP6 3.75 6.90 76.22 159.61 61.03 19.96
CP7 3.75 6.95 76.77 160.27 60.81 20.76
CP8 3.75 7.50 82.85 188.82 65.91 20.49
CP9 3.75 7.61 84.06 190.36 66.37 21.04
CP10 3.75 6.75 74.56 154.72 59.95 19.57
CP11 3.75 7.55 83.40 189.83 65.50 21.46
CP12 3.75 7.00 77.32 158.54 61.81 20.09
CP13 3.75 6.89 76.11 159.34 60.44 20.52
CP14 3.75 7.48 82.63 187.86 65.76 20.39
CP15 3.75 7.53 83.18 188.65 65.41 21.35
CP16 3.75 6.97 76.99 162.32 61.04 20.73
CP17 3.75 7.60 83.95 189.69 66.09 21.27
CP18
3940 -
3947
3.75 7.58 83.73 188.16 73.49 12.23
CP19 3.75 6.88 76.00 156.97 67.15 11.64
CP20 3.75 7.50 82.85 188.56 73.36 11.45
TH-2437_126107015

Chapter 3 Reservoir Rock and Fluid Analyses
65
Table 3. 2: Porosity and permeability values of core plugs as a function of depth
Depth (m) 2480 - 2486 2925 - 2943 3940 - 3947
Porosity range (%) 25 - 28 19 - 21 11 – 13
Measured liquid
permeability (mD) 27.21 6.32
3.25
Estimated liquid
permeability (mD) 31 - 39 7 - 10
4 – 7
3.1.2 Determination of Permeability
The permeability of the core plugs was determined using the procedure described
in Section 2.2.3. The liquid permeability experimental results of all the core plugs are
summarized in Table 3.3, while Table 3.4 presents the gas permeability measurement
results of three core plugs of different depths. The values of the liquid permeability of the
core plugs ranged from 3 – 30 mD, while the gas permeability varied from 16 – 47 mD.
The measured range of permeability of the core plugs classifies the Upper Assam
formation as fair to moderate permeability reservoirs [165]. The permeability measured by
flowing gas (N2) was observed to be greater than the permeability value obtained by
flowing liquid (formation brine). The observed difference between liquid and gas
permeability values of the core plugs was due to the Klinkenberg effect (discussed earlier).
The porosity and permeability of the core plugs were directly related as more porous ones
were found to be more permeable and vice-versa (Table 3.2). However, the effects of a
number of parameters like grain size, compaction, packing, and diagenetic processes
related to development influences the porosity-permeability of a particular formation
[166]. Nind [167] reported that there is no direct correlation for porosity and permeability,
however, permeability generally increases with porosity for sandstones reservoirs formed
under similar depositional environment.
TH-2437_126107015

Chapter 3 Reservoir Rock and Fluid Analyses
66
Table 3. 3: Liquid permeability measurement of core plugs
Confining pressure: 380 psi Temperature: 28 oC Liquid viscosity (µ):1 cP
Core
plug
ID
Diamter
(cm)
Length
(cm)
Fluid
Collect
(cm3)
Time
(sec)
Δp
(atm)
Area
(cm2)
Q
(cm3/sec)
K
(mD)
Kavg
(mD)
CP1
3.75
7.75 10.00 204.00 1.35 11.05 0.05 25.50
CP2 7.02 10.00 188.00 1.14 11.05 0.05 29.61 27.21
CP3 6.81 10.00 195.00 1.19 11.05 0.05 26.53
CP4
3.75
8.11 10.00 420.00 2.47 11.05 0.02 7.09
CP5 7.43 10.00 480.00 2.62 11.05 0.02 5.36
CP6 6.90 10.00 489.00 1.99 11.05 0.02 6.40
CP7 6.95 10.00 514.00 2.33 11.05 0.02 5.26
CP8 7.50 10.00 476.00 2.01 11.05 0.02 7.11
CP9 7.61 10.00 415.00 2.07 11.05 0.02 8.02
CP10 6.75 10.00 585.00 2.30 11.05 0.02 4.54 6.32
CP11 7.55 10.00 482.00 2.39 11.05 0.02 5.92
CP12 7.00 10.00 465.00 2.07 11.05 0.02 6.58
CP13 6.89 10.00 497.00 2.27 11.05 0.02 5.52
CP14 7.48 10.00 465.00 2.23 11.05 0.02 6.53
CP15 7.53 10.00 480.00 2.33 11.05 0.02 6.08
CP16 6.97 10.00 500.00 2.47 11.05 0.02 5.12
CP17 7.60 10.00 385.00 2.00 11.05 0.03 8.93
CP18
3.75
7.58 10.00 600.00 3.01 11.05 0.02 3.79
CP19 6.88 10.00 650.00 3.15 11.05 0.02 3.04 3.25
CP20 7.50 10.00 689.00 3.38 11.05 0.01 2.91
TH-2437_126107015

Chapter 3 Reservoir Rock and Fluid Analyses
67
Table 3. 4: Gas permeability measurement of core plugs
Temperature: 28 oC Gas/N2 viscosity (µ): 0.02 cP
Fig. 3.2 shows the permeability to gas (N2) of three core plugs of different depths
plotted against the inverse of the mean pressure (Pm) based on the Klinkenberg principle
[144]. The gas permeability linearly increased with an increase in 1/Pm and extrapolating
to the point where 1/Pm = 0, the liquid permeability was estimated. From Table 3.2, it can
be seen that the estimated liquid permeability and measured liquid permeability to brine
are in good agreement. Although the estimated permeability was found to be slightly
greater than measured liquid permeability, this difference is much smaller compared to the
variation of the permeability values of the core plugs to liquid and gas.
Core
Plug
ID
Diameter
(cm)
Length
(cm)
P1
(atm)
P2
(atm)
Pm
(atm) 1/Pm
Gas
Flow
(Q)
(cm3/s)
Permeabi
lity
(K)
(mD)
CP1 3.75
2.02 1.00 1.51 0.66 5.01 46.32
2.36 1.00 1.68 0.6 7.23 45.02
7.75 2.70 1.00 1.85 0.54 9.70 43.86
3.04 1.00 2.02 0.49 12.23 42.22
3.38 1.00 2.19 0.46 15.33 41.83
1.34 1.00 1.17 0.85 0.98 31.30
1.60 1.00 1.34 0.75 2.00 27.79
CP6 3.75 6.90 2.02 1.00 1.51 0.66 3.23 26.58
2.36 1.00 1.68 0.6 4.25 23.55
2.70 1.00 1.85 0.54 5.72 23.01
1.34 1.00 1.17 0.88 0.68 21.82
1.55 1.00 1.27 0.79 1.12 20.31
CP19 3.75 6.88 1.82 1.00 1.41 0.71 1.67 18.35
2.09 1.00 1.54 0.65 2.40 18.08
2.36 1.00 1.68 0.6 2.88 15.92
TH-2437_126107015

Chapter 3 Reservoir Rock and Fluid Analyses
68
Fig. 3.2: Gas permeabilities and estimated liquid permeabilities of core plugs in the depth range: (a) 2480 – 2486 m; (b) 2925 – 2943 m;
(c) 3940 – 3947 m
0.0 0.2 0.4 0.6 0.8 1.00
10
20
30
40
50
1/Pm (1/atm)
Gas
Per
mea
bil
ity
, K
g (
mD
)
(a)
0.0 0.2 0.4 0.6 0.8 1.00
10
20
30
40
50(b)
1/Pm (1/atm)
Gas
Per
mea
bil
ity
, K
g (
mD
)
0.0 0.2 0.4 0.6 0.8 1.00
10
20
30
40
50(c)
Gas
Per
mea
bil
ity
, K
g (
mD
)
1/Pm (1/atm)
TH-2437_126107015

Chapter 3 Reservoir Rock and Fluid Analyses
69
3.2 Characterization of Reservoir Rocks
The characterization of the reservoir rock was performed to evaluate its mineralogy
and clay content using XRD and FESEM respectively. XRD is known to be an important
tool to identify the mineralogical of reservoir rock [168]. Fig. 3.3(a) presents the XRD
pattern of the powdered core sample with characteristics peaks at 8.960, 12.59
0, 20.96
0,
26.720, and 28.07
0. This peak information and analysis with MATCH! 3 indicated the
presence of silica (quartz) as the dominant mineral. The large and abundant quartz peaks in
the XRD diffractogram support the observation. The occurrence of other minerals like
feldspar and clays (kaolinite and illite) is also indicated by the XRD spectra. Since silica
carries a negative charge at normal formation water pH [169], the reservoir rock was found
to be of anionic nature.
FESEM study of the rock samples was conducted for the identification of clay
minerals. FESEM micrograph of the rock sample is shown in Fig. 3.3 (b). Based on the
analysis of the image using established literature [170], the presence of smectite group of
clays was indicated as a thin, webby crust in the matrix of the core sample. The minerals
normally present in sandstone reservoirs are quartz, feldspar and clay minerals. The
common types of clay minerals present are montmorillonite, smectite, illite, chlorite, and
kaolinite, depending upon the depositional environment [171, 172]. The presence of these
clay minerals makes the surfactants injected for the purpose of EOR susceptible to be
adsorbed onto the reservoir rocks [173].
TH-2437_126107015

Chapter 3 Reservoir Rock and Fluid Analyses
70
(a)
(b)
Fig. 3.3: (a) XRD patterns, and (b) FESEM micrographs of rock samples showing the
presence of quartz and clay minerals
10 20 30 40 50 60 700
100
200
300
QQQ
F
Q
KQ
K
Co
un
ts
2 Theta (Degree)
I
Q Q = Quartz, 53.1%
K = Kaolinite, 16.8%
F = Feldspar, 14.4%
I = Illite, 12.8%
TH-2437_126107015

Chapter 3 Reservoir Rock and Fluid Analyses
71
3.3 Characterization of Crude Oil
The important physicochemical properties of crude oil affecting the process of
recovery include API gravity, viscosity, pour point, resin-asphaltene content, and acid
number. The knowledge of these properties is essential before embarking on any EOR
process and for selecting the most appropriate method based on the crude oil properties.
The results of the crude oil analyses are discussed below and summarized in Table 3.5.
3.3.1 API Gravity
In the oil industry, it is customary to express the density of crude oil in oAPI. With
water having an API gravity of 10, the liquids lighter than water have API gravity greater
than 10. On this scale, gasoline has a gravity of 60 oAPI, while crude oils may have a
typical value of around 35 oAPI [174]. The density of crude oil measured with hydrometers
was found to be 863 ± 3 kg/m3 at an room temperature of 28
oC. The corresponding density
value at 15.56 oC or 60
oF was 871 kg/cm
3 after applying the necessary correction factor
(of 0.9908) obtained from Table 53A of the Petroleum Measurements Tables [175]. The
API gravity of the crude calculated using Eq. 2.5 was obtained as 31oAPI. Crude oils are
generally classified based on its measured API gravity as light, medium, or heavy [176]:
(a) Light crude oils : > 31.1 °API
(b) Medium crude oils: 22.3 - 31.1 °API
(c) Heavy crude oils: < 22.3 °API
As per this classification, the crude oil of the Upper Assam oilfield used in this
study falls under the category of medium oil. CO2 flooding being the leading EOR
technique for light and medium oil reservoirs, this preliminary information suggested that
the crude oil under study was suitable for CO2-EOR application.
TH-2437_126107015
Chapter 3 Reservoir Rock and Fluid Analyses
72
3.3.2 Dead Oil Viscosity
Viscosity is an important physical property of crude oil that controls the rate of
flow and recovery of crude oil from reservoirs. Crude oil viscosity is a strong function of
the temperature, pressure, oil gravity and gas solubility. An increase in temperature causes
a decrease in crude oil viscosity, while an increase in pressure increases oil viscosity,
provided the only effect of pressure is to compress the liquid. Additionally, a decrease in
the solution gas also increases crude oil viscosity. The viscosity of crude oils based on
pressure can be classified as [18]:
(a) Dead-oil viscosity, which is the viscosity of crude oil at atmospheric pressure
with no gas in solution and at system temperature.
(b) Saturated-oil viscosity, which is the viscosity of the crude oil at saturation
pressure and reservoir temperature.
(c) Undersaturated-oil viscosity, represents the viscosity of the crude oil at pressure
more the bubble-point and reservoir temperature.
Fig. 3.4 shows the plot of the dynamic viscosity of the crude oil sample as a
function of temperature. The experimental results of viscosity measurements are presented
in Appendix B. As expected the dynamic viscosity decreased with the increase of
temperature from a value of 10.21 ± 0.3 cP at room temperature (28 oC) to 4.46 ± 0.5 cP at
reservoir temperature (70 oC). This value of the crude oil viscosity less than 100 cp
classified the crude oil as light to medium [177]. Based on the screening criteria given in
the literature [132, 138], the viscosity value of the crude oil indicates its suitability for
alkaline-surfactant (AS) and CO2 flooding.
TH-2437_126107015

Chapter 3 Reservoir Rock and Fluid Analyses
73
Fig. 3.4: Crude oil viscosity as a function of temperature
3.3.3 Pour Point
The pour point of crude oil is the temperature at which it becomes semi-solid and
ceases to flow. For the crude oil used in the study, the pour point was found to be 24 ± 3
oC
and consequently a high pour point crude. This was based on the rule of thumb that high-
pour-point crude oils generally have pour points in the range of 15 to 52 oC, and may be
solid at room temperature. It has been observed that high pour point is generally associated
with crude oils with high paraffin content and lower pour point with crudes of more
aromatic nature [178]. Assam crude oil, in general, has been reported to have higher pour
points (30 oC) and higher wax content (11 wt %) [179].
3.3.4 Resin, Asphaltene, and Wax Content
The asphaltene content of the crude oil was found to be 1.4 ± 0.2 wt% and resin
content 16.73 ± 0.5 wt%. The R/A ratio for the crude oil was found to be greater than 3, so
based on the Leontaritis criterion [49], there are enough amounts of resins for asphaltene
stabilization. So, the possibility of asphaltene precipitation from the crude oil during CO2
0 20 40 60 80 1000
3
6
9
12
15
Cru
de o
il v
isco
sity
(cP
)
Temperature (oC)
TH-2437_126107015

Chapter 3 Reservoir Rock and Fluid Analyses
74
flooding is less. The wax content of the crude oil was fairly high at 12.47 ± 0.70%. A
similar observation on the wax content of Assam crude oil was made by Kandwal et al.
[179]. The experimental results of resin, asphaltene and wax content determination are
presented in Appendix B.
3.3.5 Acid Number
Acid number is a measure of the amount of acidic components present in crude oil.
It is expressed as the milligrams of KOH that is required to neutralize 1 gm of oil sample.
For a reservoir to be a good candidate for alkaline flooding, the acid number of crude oil
should be at least 0.5 mg/g. Crude oils with an acid number greater than 0.5 mg KOH/g of
crude oil are known as acidic crudes [180]. The acid number of the present crude oil was
estimated as 1.2 ± 0.2 mg KOH/g of crude oil. Thus, the crude oil considered in this study
is acidic and suitable for alkaline flooding.
FTIR spectra of the crude oil was recorded between 400 and 4000 cm-1
to study the
presence of major functional groups present. The dominant spectra of crude oils normally
include the absorption bands of aliphatic C-H bonds along with other additional bands of
groups containing oxygen, aromatics, nitrogen, and sulfur. The FTIR spectrum of the crude
oil is shown in Fig. 3.5. The peak at 2932 cm-1
indicated the presence of single bond
alkanes, while the peaks at 1724 cm-1
, 1603 cm-1
, 1454 cm-1
, and 1377 cm-1
account for
carboxylic acids, aromatics, -CH2 and -CH3 functional groups respectively. Other peak at
745 cm-1
indicates the existence of long-chain alkyl groups [181, 182]. Thus the presence
of acidic groups in the crude oil was identified by the FTIR analysis and support the acid
number measurement.
TH-2437_126107015

Chapter 3 Reservoir Rock and Fluid Analyses
75
Fig. 3.5: FTIR spectra of crude oil sample
Table 3. 5: Physical and chemical properties of crude oil
Sl.
No. Properties Value Remarks
1 Density (kg/m
3) at 15.6
oC 871
Medium gravity oil
2 API gravity (oAPI) 31
3
Dynamic viscosity (cP)
(at reservoir temperature,
70 oC)
4.46 ± 0.5 Decreases with temperature
4 Pour point (oC) 24
± 3
Pour point was high indicating
high paraffin content
5 Asphaltene content (wt%) 1.4 ± 0.2 High R/A indicating
asphaltene stabilization 6 Resin content (wt%) 16.73 ± 0.5
7 Wax content (wt%) 12.47 ± 0.70 Waxy crude
8 Acid number
(mg KOH/g of crude oil) 1.2 ± 0.2 Acidic crude
4000 3500 3000 2500 2000 1500 1000 5000
20
40
60
80
100
11
69
81
2
16
03
Tra
nsm
itta
nce
(%
)
Wavelength (cm-1)
29
32
17
24
14
54
13
77
10
32
74
5
TH-2437_126107015
Chapter 3 Reservoir Rock and Fluid Analyses
76
3.3 Characterization of Formation Water
The water that naturally exists along with oil and gas in the reservoir is called
reservoir/formation water. The pH value of formation water is typically between 4 and 9.
The pH value below and above this range is not desirable because of the tendency of
corrosion and scaling respectively [183]. Formation water almost invariably contains
dissolved salts and the chemical analyses have indicated a wide variation in the type and
amount of the dissolved ions. The commonly present cations and anions are Na+, K
+, Ca
+,
Mg++
, Ba++
, Cl-, SO4
--, HCO3
-, and CO3
-- [184]. The total salinity of formation water can be
calculated by summing up the cationic and anionic concentrations [183]. Table 3.6 lists the
physical and chemical properties of the formation water considered in the study. The
sample calculations of the titration methods for Cl- ion, Mg
++ ion, and alkalinity
determination of formation water are presented in Appendix C, D, and E respectively. The
presence of divalent ions (Ca++
and Mg++
) in the formation water was observed although in
small amounts. The total salinity of the water sample was 3458 mg/L. Synthetic formation
brine (SFB) at this salinity was prepared to mimic the formation water and used for the
preparation of solution. The SFB was diluted with distilled water to varying degrees to
obtain SFB of different salinities for phase behavior studies and core flooding experiments.
TH-2437_126107015

Chapter 3 Reservoir Rock and Fluid Analyses
77
Table 3. 6: Physical and chemical properties of formation water
Property Measured value
Density, kg/m3 (at 28
oC) 1012
Viscosity, cP (at 28 oC) 0.93
pH (at 28 oC) 8.23
Total dissolved solids (ppm) 3516
Major components (ppm)
Sodium (Na+) 1555
Calcium (Ca++
) 82
Potassium (K+) 12
Magnesium (Mg++
) 17
Chloride (Cl-) 724
Bicarbonate (HCO3-) 1068
Salinity (mg/L) 3458
3.4 Summary
The analyses of crude oil, core samples and formation water of the Upper Assam
oilfield were presented in this chapter. The routine core analysis was done for the
measurement of porosity and permeability of core samples. The porosities of the core plugs
ranged from 11- 28% and were found to bear an inverse correlation with the depth of the
formation. The values of the liquid and gas permeability of the core plugs ranged from 3 –
30 mD and 16 – 47 mD respectively, which classifies the oilfield formation as fair to
moderate permeability reservoirs. Further, the XRD and FESEM analysis of rock samples
indicated the presence of silica (quartz) as the dominanat mineral, along with the presence
of clays minerals.
TH-2437_126107015

Chapter 3 Reservoir Rock and Fluid Analyses
78
The experimental investigation of the crude oil confirmed that the crude oil was
medium gravity (API gravity 31o), with dead oil viscosity of 4.46 cP (at 70
oC). The pour
point of the crude oil was high (24 ± 3
oC) which indicated the paraffinic nature of the
crude oil. The wax content was also fairly high at 12.47 ± 0.70 %. The resin to asphaltene
ratio of the crude oil was high enough for asphaltene stabilization. The analyses also
marked the crude as acidic and suitable for alkaline flooding. The formation water analysis
showed the presence of different types of dissolved cations and anions with total salinity of
3458 ppm.
TH-2437_126107015
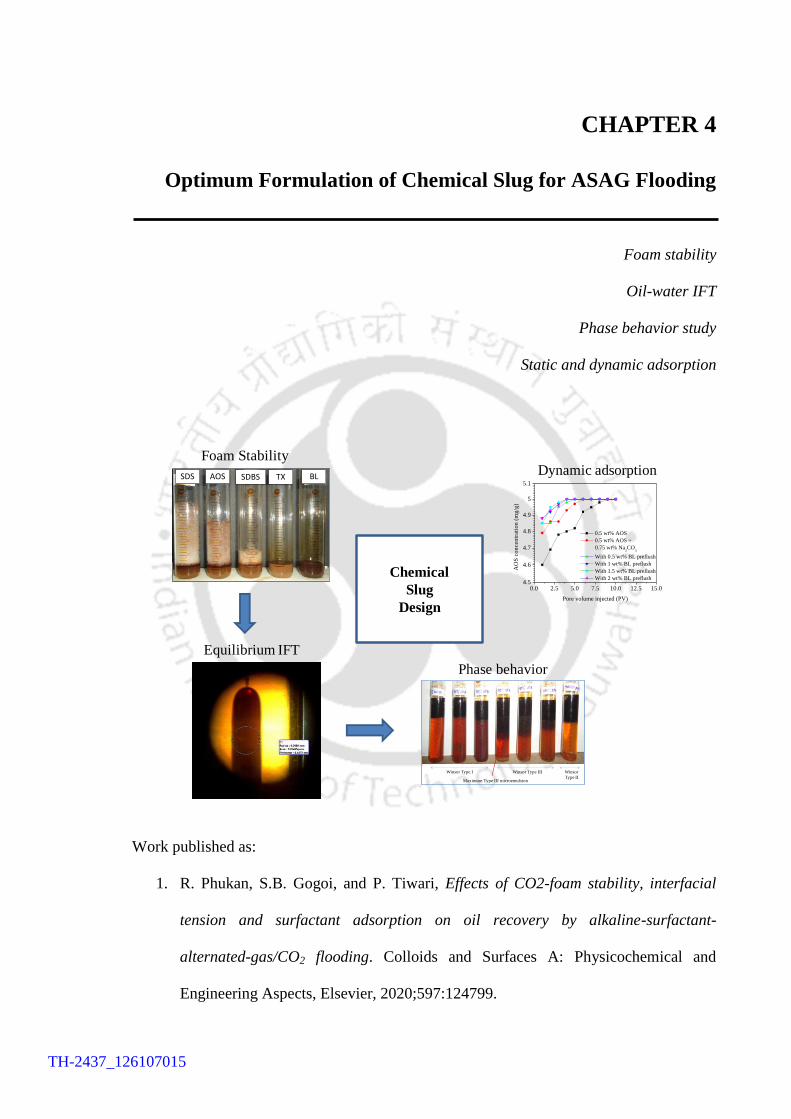
CHAPTER 4
Optimum Formulation of Chemical Slug for ASAG Flooding
Foam stability
Oil-water IFT
Phase behavior study
Static and dynamic adsorption
Work published as:
1. R. Phukan, S.B. Gogoi, and P. Tiwari, Effects of CO2-foam stability, interfacial
tension and surfactant adsorption on oil recovery by alkaline-surfactant-
alternated-gas/CO2 flooding. Colloids and Surfaces A: Physicochemical and
Engineering Aspects, Elsevier, 2020;597:124799.
0.0 2.5 5.0 7.5 10.0 12.5 15.04.5
4.6
4.7
4.8
4.9
5
5.1
AO
S c
on
cen
trati
on
(m
g/g
)
Pore volume injected (PV)
0.5 wt% AOS
0.5 wt% AOS +
0.75 wt% Na2CO
3
With 0.5 wt% BL preflush
With 1 wt% BL preflush
With 1.5 wt% BL preflush
With 2 wt% BL preflush
Dynamic adsorption
Phase behavior
Winsor Type I Winsor Type III
Maximum Type III microemulsion
Winsor
Type II
Foam Stability
SDS AOS SDBS TX BL
Chemical
Slug
Design
Equilibrium IFT
TH-2437_126107015

TH-2437_126107015
Chapter 4 Optimum Formulation of Chemical Slug for ASAG Flooding
79
Chapter 4
Optimum Formulation of Chemical Slug for ASAG Flooding
This chapter presents the screening of chemicals for the design of optimum chemical
formulations for ASAG flooding. The first section focuses on the foam stability study
conducted to screen different types and concentrations of surfactants with optimized
foaming behavior. In the second section, the equilibrium IFT measurements were
performed to select suitable alkalis and their optimum concentrations for preparing AS
formulations are presented. The third section summarizes the results of phase behavior
study of the alkaline-surfactant (AS) formulation to identify the optimal salinity region.
Finally, the last section presents the adsorption studies where the roles played by alkali
and black liquor(BL) (as preflushing agent) in reducing surfactant adsorption are
discussed.
4.1 Chemical Slug for ASAG Flooding
The successful application of the ASAG process for improving oil recovery from
an oil reservoir requires the usage of an appropriate chemical slug. Therefore, it is
desirable to screen optimal chemical formulations that would fulfill the two basic
requirements of a chemical slug for ASAG flooding; lowering the oil-water IFT to ultra-
low value and ensuring good mobility control through proper foaming in the reservoir
rock. Experiments were performed to screen chemical slugs for ASAG flooding through
foam stability study, IFT measurements, phase behavior study, and adsorption study. Both
anionic surfactants (AOS, SDS, and BL) and non-ionic surfactants (TX-100) were
evaluated for their ability to form stable foam in the presence of crude oil. The CO2-foam
TH-2437_126107015

Chapter 4 Optimum Formulation of Chemical Slug for ASAG Flooding
80
stability of the aqueous solutions of surfactants at reservoir temperature (70 oC) in the
presence of crude oil was tested to identify the optimum concentrations of surfactants.
Three types of alkalis including Na2CO3, NaOH, and Na2B4O7.10H2O were considered in
this study to formulate the AS slug with surfactants in synthetic formation brine (SFB) as
the aqueous phase. The equilibrium oil-water IFT measurements were performed to select
suitable alkalis and their concentrations for preparing AS formulations. Phase behavior
study was conducted to confirm the optimal salinity of AS formulation. Further, static and
dynamic adsorption studies were performed to evaluate the adsorption behavior of the
surfactants onto reservoir rocks and to select appropriate concentrations of BL, used as a
secondary surfactant, for preflushing operations.
4.2. Surface Tension and Interfacial Properties of Different Surfactants
The surface tensions of the different surfactants (SDS, AOS, SDBS, and TX-100)
in synthetic formation brine were measured and plotted as function of concentration as
shown in Fig. 4.1(a). The surface tension decreased with increasing surfactant
concentration, as the surfactant molecules gets adsorbed on the liquid-gas interface, until it
reached a minimum at the CMC value [190]. The CMC is defined as the lowest
concentration at which the monomers cluster to form micelles. Beyond the CMC, the
surface tension values almost remain constant as further increase in the surfactant
concentration only increases the micelle concentration and hardly change the monomer
concentration. The lowest surface tension value was achieved by SDS (27.8 mN/m) which
is sufficiently lower than the surface tension of water (~ 66 mN/m). The CMC values of
surfactants were 0.15 wt%, 0.2 wt%, 0.25 wt%, and 0.03 wt% for SDBS, SDS, AOS, and
TX-100 respectively. The equilibrium oil-water IFT of all the surfactants were measured at
reservoir temperature (70 oC) for different surfactant concentrations and plotted as shown
in the Fig. 4.1(b). The concentration of each surfactant was varied from 0.08 to 1 wt%. The
TH-2437_126107015

Chapter 4 Optimum Formulation of Chemical Slug for ASAG Flooding
81
IFT measurements below 0.08 wt% could not be performed as the required oil droplet
shape (L/D ratio > 4) was not formed. For all the anionic surfactants, with an initial
increase in the surfactant concentration a little reduction in IFT was observed due to
increase in the adsorption capacity of the surfactant molecules at the oil-water interface.
However, with further increase in surfactant concentration negligible reduction in IFT
values were observed due to adsorption saturation. The lowest IFT values obtained were
0.31 mN/m, 0.19 mN/m, 0.34 mN/m, and 0.14 mN/m for SDBS, SDS, AOS, and TX-100
respectively.
Fig. 4. 1: (a) Surface tension versus surfactant concentration; and (b) Oil-water interfacial
tension versus surfactant concentration
4.3 Evaluation of Foam Stability
The effectiveness of the foam-based EOR process is greatly influenced by the
ability of the foaming agents to form strong/stable foam under reservoir conditions. The
selection of these foaming agents/surfactants is normally done on the basis of their
foamability and foam stability [185]. Both these properties of foam are interrelated and, in
most cases, greater the foamability more stable are the foam films. A method commonly
used to quantify foam stability is the half-decay time [186]. Of the different factors
controlling foam stability, the anti-foaming effect of oil is considered to be the most
0.01 0.1 120
30
40
50
60
70(a)
CMC
Su
rfac
e te
nsi
on
(m
N/m
)
Surfactant concentration (wt%)
SDBS
SDS
AOS
TX-100
CMC
0.0 0.2 0.4 0.6 0.8 1.0
0.1
1
10
SDBS
SDS
AOS
TX-100
Inte
rfac
ial
ten
sio
n (
mN
/m)
Surfactant concentration (wt%)
(b)
TH-2437_126107015
Chapter 4 Optimum Formulation of Chemical Slug for ASAG Flooding
82
crucial. Some literature reported that the presence of oil destabilizes the foam generated
and others observed that foam stability in contact with oil can be maintained by the use of
certain foaming agents [187-189]. In fact, foam stability in the presence of oil is a major
challenge for the successful implementation of foam-based EOR methods.
4.3.2 Foam Stability of Different Surfactants
Initially, foamability and foam stability of the surfactants were tested using the
standard shaking method as explained in Section 2.2.7. Fig. 4.2(a) and (b) show the
snapshots of the foam formed, immediately following its generation, by different
surfactants at 0.5 wt% concentration in the absence and presence of crude oil respectively.
The foaminess was obtained by visual measurements using the volume expansion method
[191]. The foaminess is defined as:
foam liquid
foam
V - VFoaminess =
V (4.1)
where Vfoam is the volume of foam formed immediately after shaking (in ml)
Vliquid the volume of liquid placed in the test tube (in ml).
Fig. 4.3 shows the foaminess values of different surfactants at 0.5 wt% concentration with
and without crude oil. Foaminess was found to be maximum for SDS followed by AOS,
SDBS, TX-100, and BL without and with crude oil. Xu [192] observed that the foamability
of non-ionic surfactants (TX-100) was much less compared to anionic surfactants (AOS,
SDS) and amphoteric surfactants.
Fig. 4.4 (a) and (b) shows the changes in the foam volume as a function of time for
all the surfactants considered (at 0.5 wt%), with and without crude oil. In Fig. 4.4 (c) the
half-decay times (t1/2) of the surfactants without and with crude oil are shown. Under
similar experimental conditions, it was observed that anionic surfactants (except BL) have
better foamability and longer t1/2 compared to the non-ionic surfactant, TX-100. SDS
TH-2437_126107015

Chapter 4 Optimum Formulation of Chemical Slug for ASAG Flooding
83
exhibited the highest foamability and also generated the most stable foam with t1/2 of
approximately 240 min, followed by AOS and SDBS. BL displayed the weakest foaming
behavior amongst the surfactants considered indicating its poor foaming ability. The
presence of crude oil (at 10 vol%) lowered the foamability and t1/2 of all the surfactants
indicating the destabilizing effect of oil. When oil droplets accumulate at the plateau
borders and lamellas, surfactant molecules are transferred from the gas-water interface to
the oil-water interface which weakens the foam film strength and decreases the Marangoni
effect leading to decrease in foam performance [189, 193]. The foam stability of TX-100
totally diminished in the presence of crude oil. In fact, TX-100 foam with crude oil
decayed in less than 5 min. The electrostatic double layer effect resulting from charge
interactions at the film interface is suppressed in non-ionic surfactants, and for this reason,
the stability of TX-100 was very low [114].
Fig. 4. 2: Snapshots of foam generated with different surfactants at 0.5 wt% concentration
(a) in the absence of crude oil, and (b) in the presence of crude oil (at 10 vol%)
(a) (b)
SDS AOS SDBS TX BL SDS AOS SDBS TX BL
TH-2437_126107015

Chapter 4 Optimum Formulation of Chemical Slug for ASAG Flooding
84
Fig. 4. 3: Gas holdup values of different surfactants at 0.5 wt% concentration with and
without crude oil
[SDS: sodium dodecyl sulphate; AOS: alpha olefin sulphate; SDBS: sodium dodecyl
benzene sulphonate; TX-100: triton X-100; BL: black liquor]
0.860.83 0.82
0.750.69
0.810.76
0.54
0.01 0.01
SDS AOS SDBS TX-100 BL0.0
0.2
0.4
0.6
0.8
1.0
1.2
Fo
amin
ess
Surfactants
Without crude oil
With crude oil
TH-2437_126107015

Chapter 4 Optimum Formulation of Chemical Slug for ASAG Flooding
85
Fig. 4. 4: Foam volume as a function of time of surfactants (at 0.5 wt%) (a) without crude oil, and (b) with crude oil; (c) Half decay times of
surfactants (t1/2) without and with crude oil
0 100 200 300 400 500 6000
10
20
30
40(a) Without oil
Fo
am V
olu
me
(ml)
Time (min)
SDS
AOS
SDBS
TX-100
BL
0 100 200 300 400 500 6000
10
20
30
40(b) With crude oil
Fo
am V
olu
me
(ml)
Time (min)
SDS
AOS
SDBS
TX-100
BL
300
180150
60
10
240
150
60
4 3
SDS AOS SDBS TX-100 BL0
100
200
300
400
Hal
f d
ecay
tim
e (m
in)
Surfactants
Without oil
With oil
(c)
TH-2437_126107015
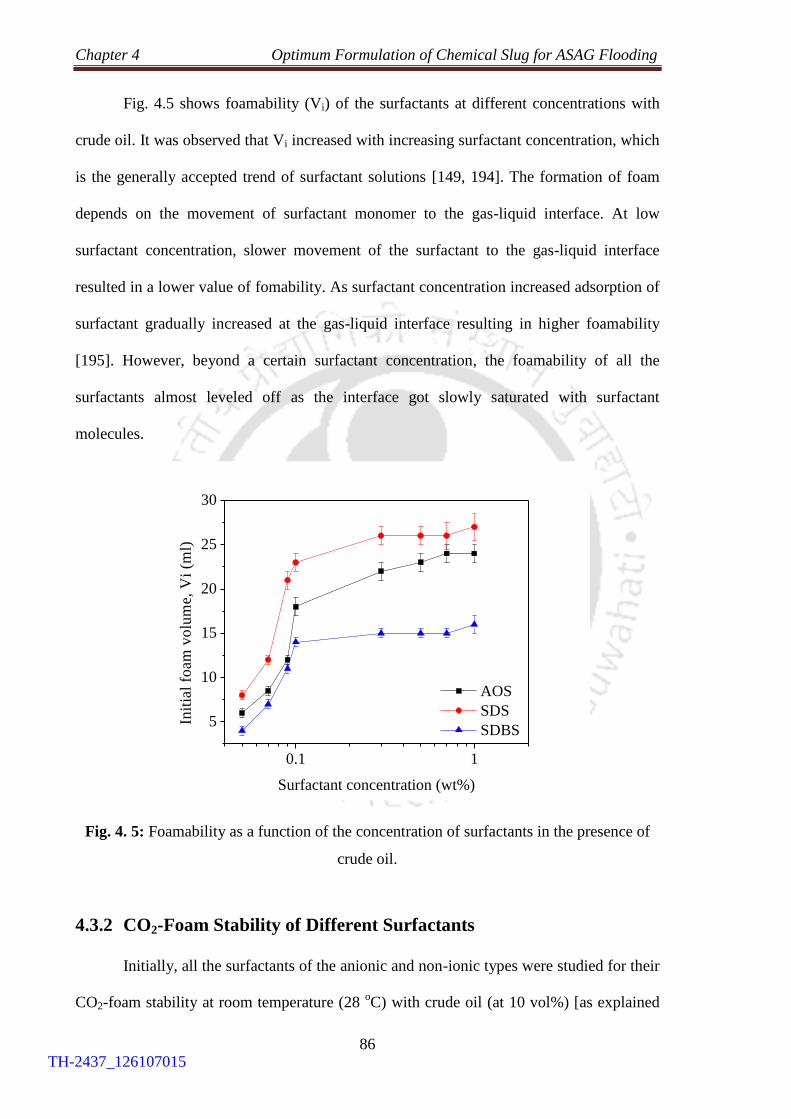
Chapter 4 Optimum Formulation of Chemical Slug for ASAG Flooding
86
Fig. 4.5 shows foamability (Vi) of the surfactants at different concentrations with
crude oil. It was observed that Vi increased with increasing surfactant concentration, which
is the generally accepted trend of surfactant solutions [149, 194]. The formation of foam
depends on the movement of surfactant monomer to the gas-liquid interface. At low
surfactant concentration, slower movement of the surfactant to the gas-liquid interface
resulted in a lower value of fomability. As surfactant concentration increased adsorption of
surfactant gradually increased at the gas-liquid interface resulting in higher foamability
[195]. However, beyond a certain surfactant concentration, the foamability of all the
surfactants almost leveled off as the interface got slowly saturated with surfactant
molecules.
Fig. 4. 5: Foamability as a function of the concentration of surfactants in the presence of
crude oil.
4.3.2 CO2-Foam Stability of Different Surfactants
Initially, all the surfactants of the anionic and non-ionic types were studied for their
CO2-foam stability at room temperature (28 oC) with crude oil (at 10 vol%) [as explained
0.1 1
5
10
15
20
25
30
Init
ial
foam
vo
lum
e,
Vi
(ml)
Surfactant concentration (wt%)
AOS
SDS
SDBS
TH-2437_126107015
Chapter 4 Optimum Formulation of Chemical Slug for ASAG Flooding
87
in Section 2.2.7] with the objective of selecting suitable surfactants that will generate the
most stable CO2-foam. For comparison, the concentration of the surfactants was fixed at
0.5 wt% and the volume foam generated, by passing CO2 gas through the surfactant
solution, was observed with respect to time for determining the t1/2 value. The foam
stability curves of the surfactants are shown in Fig. 4.6. The non-ionic surfactant (TX-100)
displayed the lowest foam stability with t1/2 value of 4.5 min. On the other hand, the
anionic surfactants namely SDS, AOS, and SDBS generated foams having higher foam
stability with t1/2 values of 40 ± 2, 31 ± 2 and 25 min respectively at room temperature
(Table 4.1).
Thus, SDS and AOS displayed comparatively better CO2-foam stability with the
crude oil under similar experimental conditions. Earlier studies have also demonstrated that
foam-stability depends on the type of surfactants used for foam generation. Simjoo et al.
[189] reported that AOS was the most stable surfactant compared to other anionic and
amphoteric surfactants in the presence of oil while in absence of oil the amphoteric
surfactant was the most stable. Similarly, Farzaneh and Sohrabi [151] observed that non-
anionic surfactants have lower foam stability than the anionic surfactants under similar
experimental conditions. Azdarpour et al. [196] ranked the surfactants on the basis of foam
stability in presence of paraffin oil as SDS > AOS > SDBS > TX-100 with t1/2 values of 17,
14, 13, and 12 min respectively.
4.3.3 Effect of Temperature on CO2-Foam Stability
As the highest t1/2 values were observed for SDS followed by AOS at ambient
temperature, so CO2-foam stability of the SDS and AOS was also studied at a temperature
of 70 oC, which is the reservoir temperature. Foam generated in the glass column above the
liquid level was regularly monitored and recorded with respect to time at reservoir
TH-2437_126107015
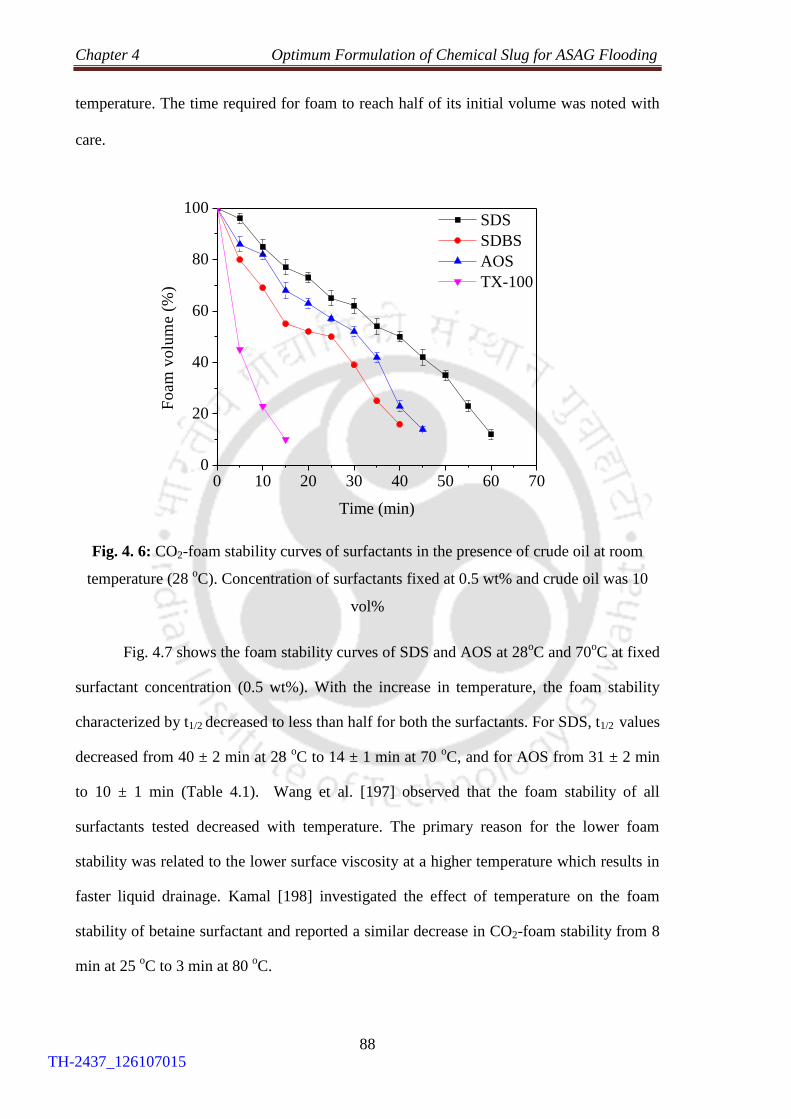
Chapter 4 Optimum Formulation of Chemical Slug for ASAG Flooding
88
temperature. The time required for foam to reach half of its initial volume was noted with
care.
Fig. 4. 6: CO2-foam stability curves of surfactants in the presence of crude oil at room
temperature (28 oC). Concentration of surfactants fixed at 0.5 wt% and crude oil was 10
vol%
Fig. 4.7 shows the foam stability curves of SDS and AOS at 28oC and 70
oC at fixed
surfactant concentration (0.5 wt%). With the increase in temperature, the foam stability
characterized by t1/2 decreased to less than half for both the surfactants. For SDS, t1/2 values
decreased from 40 ± 2 min at 28 oC to 14 ± 1 min at 70
oC, and for AOS from 31 ± 2 min
to 10 ± 1 min (Table 4.1). Wang et al. [197] observed that the foam stability of all
surfactants tested decreased with temperature. The primary reason for the lower foam
stability was related to the lower surface viscosity at a higher temperature which results in
faster liquid drainage. Kamal [198] investigated the effect of temperature on the foam
stability of betaine surfactant and reported a similar decrease in CO2-foam stability from 8
min at 25 oC to 3 min at 80
oC.
0 10 20 30 40 50 60 700
20
40
60
80
100 SDS
SDBS
AOS
TX-100
Fo
am
vo
lum
e (
%)
Time (min)
TH-2437_126107015

Chapter 4 Optimum Formulation of Chemical Slug for ASAG Flooding
89
Fig. 4. 7: CO2-foam stability curves of SDS and AOS at room (28 oC) and reservoir
temperature (70 oC) in the presence of crude oil. Concentration of surfactants fixed at 0.5
wt% and crude oil was 10 vol%
4.3.4 Effect of Surfactant Concentration
To observe the effect of surfactant concentration on CO2 foam stability and to
select suitable concentrations for preparing chemical slug, similar experiments at reservoir
temperature were conducted with SDS and AOS surfactants. These two surfactants were
selected on the basis of their better CO2-foam stability at room and reservoir temperature.
Fig. 4.8 shows the foam stability curves of SDS and AOS as a function of their
concentrations. The obtained results show that foam stability improved with increasing
surfactant concentration up to a certain concentration, beyond which no further
improvement was observed even if the surfactant concentrations were increased. The
observed trend was due to the formation of a monolayer at the gas-liquid interface with
increasing surfactant concentration which in turn caused better foam stability. However, at
a certain concentration, the surface of the interface gets saturated with molecules and
0 10 20 30 40 50 60 700
20
40
60
80
100 SDS at 28
oC
SDS at 70 oC
AOS at 28 oC
AOS at 70 oC
Fo
am
vo
lum
e (
%)
Time (min)
TH-2437_126107015

Chapter 4 Optimum Formulation of Chemical Slug for ASAG Flooding
90
further increasing the surfactant concentration had little or no effect on foam stability.
Previous studies investigating the effect of surfactant concentration on foam stability have
reported similar observations [149, 151, 193]. Thus, it can be concluded that maximum
CO2-foam stability (with the highest value of t1/2) for a particular surfactant occurred at a
certain specific surfactant concentration. The maximum CO2 foam stability was obtained at
0.3 wt% SDS and 0.5 wt% AOS concentrations which were selected as the optimum values
for further studies. The t1/2 values of SDS and AOS at these optimum concentrations were
found to be 16 ± 1 min and 10 ± 1 min respectively (Table 4.1).
Table 4. 1: CO2-foam stability of different surfactants at room (28 oC) and reservoir
temperature (70 oC)
Sl.
No.
Surfactant Temperature
(oC)
CO2-foam
stability (t1/2)
(min) Name Type
Concentration
(wt%)
1 SDS Anionic 0.5
28
40 ± 2
2 AOS Anionic 0.5 31 ± 2
3 SDBS Anionic 0.5 25
4 TX-100 Non-ionic 0.5 4.5
5
SDS
0.05
70
4 ± 0.5
6 0.07 6 ± 0.5
7 Anionic
0.1 11 ± 0.5
8 0.3 16 ± 1
9 0.5 14 ± 1
10 1 13.5 ± 1
11
AOS
0.05
70
4 ± 0.5
12 0.07 5 ± 0.5
13 Anionic
0.1 6 ± 0.5
14 0.3 8 ± 0.5
15 0.5 10 ± 1
16 1 9 ± 0.5
TH-2437_126107015

Chapter 4 Optimum Formulation of Chemical Slug for ASAG Flooding
91
Fig. 4. 8: CO2- foam stability curves at different concentrations of the surfactants (a) SDS and (b) AOS in the presence of crude oil at 70 oC
0 10 20 30 400
20
40
60
80
100(a) SDS 0.05 wt%
0.07 wt%
0.1 wt%
0.3 wt%
0.5 wt%
1 wt%
Fo
am v
olu
me
(%)
Time (min)
0 5 10 15 20 25 300
20
40
60
80
100 0.05 wt%
0.07 wt%
0.1 wt%
0.3 wt%
0.5 wt%
1 wt%
(b) AOS
Fo
am v
olu
me
(%)
Time (min)
TH-2437_126107015

Chapter 4 Optimum Formulation of Chemical Slug for ASAG Flooding
92
4.4 Equilibrium IFT Measurements
After screening the surfactants based on the CO2-foam stability, suitable alkalis and
their optimum concentrations for preparing AS formulations were identified by performing
IFT measurements. Fig. 4.9 shows the variation in the equilibrium oil-water IFT values of
the optimum SDS and AOS formulations at different concentrations of the alkalis namely
Na2CO3, NaOH, and Na2B4O7.10H2O at reservoir temperature (70 oC). The results show
that for the surfactants, the equilibrium oil-water IFT value decreased with the increase in
alkali concentration up to a certain concentration and then the value was either constant or
slightly increased. The IFT value decreased due to the generation of in-situ surfactant
caused by the interaction of alkali and acidic components of crude oil. As the concentration
of alkali increased, the production of in-situ surfactant increased thus lowering the oil-
water IFT further [199]. However, after reaching a minimum value at a particular alkali
concentration, the IFT value no longer decreases because the amount of the acidic
components in crude oil is limited. It can be observed from Fig. 4.8 that, with 0.3 wt%
SDS the minimum IFT values of 0.0068 mN/m, 0.0092 mN/m, and 0.016 mN/m were
obtained at 1 wt% Na2CO3, 0.75 wt% NaOH, and 1.25 wt% Na2B4O7.10H2O respectively.
Similarly, with 0.5 wt% AOS the minimum IFT values were found to be 0.0087 mN/m,
0.0098 mN/m, and 0.019 mN/m when mixed with 0.75 wt% Na2CO3, 0.75 wt% NaOH,
and 1.25 wt% Na2B4O7.10H2O respectively. Thus, both Na2CO3 and NaOH were found to
be efficient in reducing the oil-water IFT values to the ultra-low range (< 0.01 mN/m)
when combined with SDS and AOS in appropriate proportion. However, Na2CO3 can be
the preferred selection as the IFT values were the lowest. Additionally, the use of Na2CO3
has certain advantages like it is cheaper, less corrosive, reduce retention, lower mineral
dissolution, and lower formation damage [97, 98]. The Na2CO3 concentrations (1 wt% and
0.75 wt%) at which the minimum IFT values were achieved when combined with 0.3 wt%
TH-2437_126107015

Chapter 4 Optimum Formulation of Chemical Slug for ASAG Flooding
93
SDS and 0.5 wt% AOS respectively, were considered as the optimum alkali
concentrations. Kumar and Mandal [7] also reported ultra-low IFT value (0.0032 mN/m)
for SDS (at CMC value) + 0.2 wt% Na2CO3 formulation with crude oil of Ankleswar
oilfield, India.
Fig. 4. 9: Equilibrium oil-water IFT of alkali-surfactant (AS) formulations
The AS formulations designed based on foam stability study and IFT
measurements were used for performing the ASAG core flooding experiments as described
in Chapters 5 and 6. Further, in order to investigate the effect of salinity gradient
application during ASAG flooding (as described in Chapter 6), experiments were done to
identify the optimal salinity of the AS formulation containing 0.5 wt% AOS + 0.75 wt%
Na2CO3 through IFT measurements and phase behavior study. To identify the optimal
salinity, the equilibrium IFT of the AS formulation at different SFB salinities ranging from
0% (0 ppm) to 100% salinity (3458 ppm) were measured. Fig. 4.10 shows the plot of the
equilibrium oil-water IFT values of the formulation as a function of formation brine
salinities. It was observed that as the salinity of SFB increased from 0% to 100%, the
0.0 0.2 0.4 0.6 0.8 1.0 1.2 1.4 1.6
0.01
0.1
Inte
rfacia
l te
nsi
on
(m
N/m
)
Alkali concentration (wt%)
0.3 wt% SDS + Na2CO
3
0.5 wt% AOS + Na2CO
3
0.3 wt% SDS + NaOH
0.5 wt% AOS + NaOH
0.3 wt% SDS + Borax
0.5 wt% AOS + Borax
TH-2437_126107015

Chapter 4 Optimum Formulation of Chemical Slug for ASAG Flooding
94
equilibrium IFT values decreased from 0.024 mN/m to 0.0087 mN/m. With the increase of
salinity, surfactant molecules adsorb more firmly at the water-oil interface which causes
the IFT to decrease [200, 201]. Fig. 4.9 shows that the IFT values at first decreased with an
increase in salinity reached the lowest value (at 70% of SFB salinity, 2400 ppm) and then
slightly increased when the SFB salinity reached 100% (3458 ppm). The 70% SFB salinity
with the lowest IFT value (0.0066 mN/m) was considered as the optimal salinity of SFB
for the above formulations. Kumar and Mandal [7] reported that the decreasing trend of
IFT with salinity was due to the combined effect of salt and surfactant mixtures. With
increase in salinity, the surface energy of crude oil in the presence of surfactant solutions is
lowered and so the IFT decreases. Similarly, Ruckenstein and Rao [202] observed that IFT
decreased with increasing salinity and became reduced to zero at higher salt
concentrations.
Fig. 4. 10: Effect of formation brine salinity on the equilibrium oil-water IFT of AS
formulation
0 20 40 60 80 100 120
0.01
0.1
Inte
rfacia
l T
en
sio
n (
mN
/m)
Formation brine salinity (% of total salinity)
0.5 wt% AOS + 0.75 wt% Na2CO
3
TH-2437_126107015
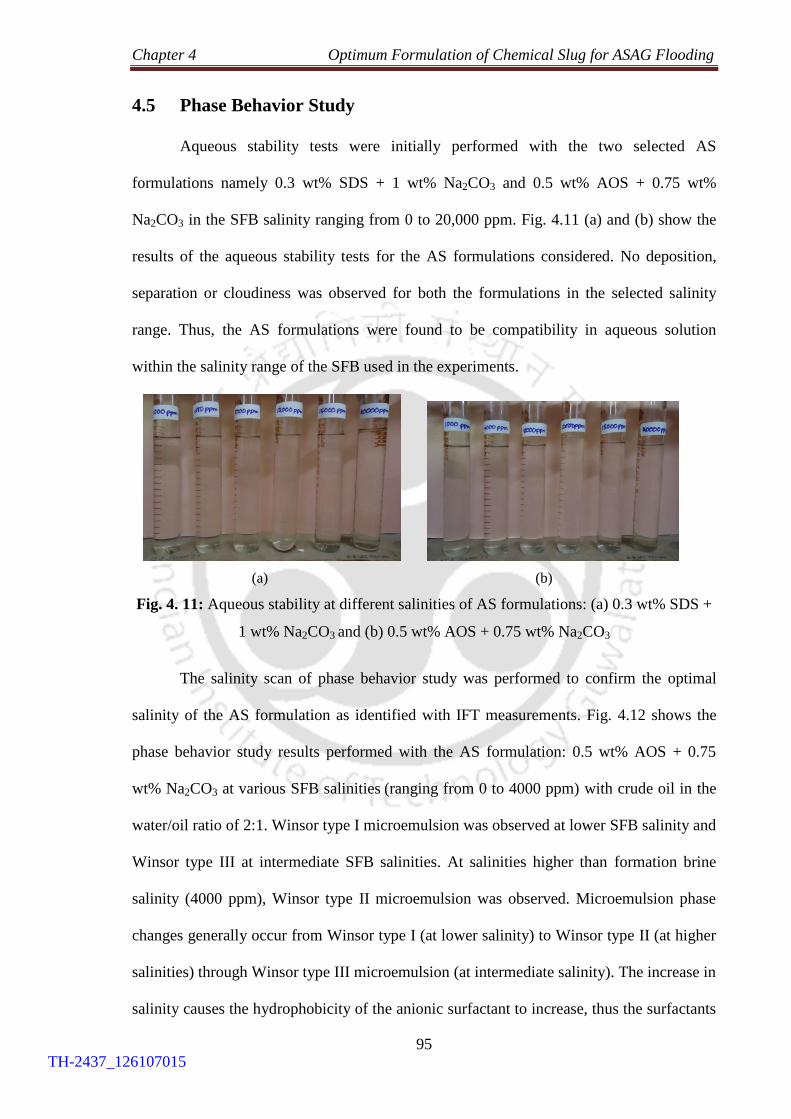
Chapter 4 Optimum Formulation of Chemical Slug for ASAG Flooding
95
4.5 Phase Behavior Study
Aqueous stability tests were initially performed with the two selected AS
formulations namely 0.3 wt% SDS + 1 wt% Na2CO3 and 0.5 wt% AOS + 0.75 wt%
Na2CO3 in the SFB salinity ranging from 0 to 20,000 ppm. Fig. 4.11 (a) and (b) show the
results of the aqueous stability tests for the AS formulations considered. No deposition,
separation or cloudiness was observed for both the formulations in the selected salinity
range. Thus, the AS formulations were found to be compatibility in aqueous solution
within the salinity range of the SFB used in the experiments.
(a) (b)
Fig. 4. 11: Aqueous stability at different salinities of AS formulations: (a) 0.3 wt% SDS +
1 wt% Na2CO3 and (b) 0.5 wt% AOS + 0.75 wt% Na2CO3
The salinity scan of phase behavior study was performed to confirm the optimal
salinity of the AS formulation as identified with IFT measurements. Fig. 4.12 shows the
phase behavior study results performed with the AS formulation: 0.5 wt% AOS + 0.75
wt% Na2CO3 at various SFB salinities (ranging from 0 to 4000 ppm) with crude oil in the
water/oil ratio of 2:1. Winsor type I microemulsion was observed at lower SFB salinity and
Winsor type III at intermediate SFB salinities. At salinities higher than formation brine
salinity (4000 ppm), Winsor type II microemulsion was observed. Microemulsion phase
changes generally occur from Winsor type I (at lower salinity) to Winsor type II (at higher
salinities) through Winsor type III microemulsion (at intermediate salinity). The increase in
salinity causes the hydrophobicity of the anionic surfactant to increase, thus the surfactants
TH-2437_126107015

Chapter 4 Optimum Formulation of Chemical Slug for ASAG Flooding
96
are driven out of the brine to form middle (Type III) or upper phase (Type II)
microemulsions [203]. The maximum Type III microemulsion volume was observed at
2400 ppm (70% of SFB salinity). Sheng [10] reported that maximum type III
microemulsion volume occurs at optimal salinity. It is at this optimal salinity that oil-water
IFT is the lowest and consequently the point of maximum oil recovery. Thus, 70% of SFB
salinity (2400 ppm) was considered as the optimum brine salinity.
Fig. 4. 12: Snapshot of phase behavior of AS formulation (0.5 wt% AOS + 0.75 wt%
Na2CO3) and crude oil (Salinity of formation brine ranging from 0 to 4000 ppm)
Healy and Reed [204] defined the solubilization parameters (Vo/Vs and Vw/Vs) for
phase behavior test. Vo/Vs is defined as the volumetric ratio of solubilized oil to surfactant,
and Vw/Vs is water to surfactant in the microemulsion phase. Vo/Vs increases with salinity,
while Vw/Vs decreases with salinity. The amount of oil and brine solubilized in the
surfactant phase are approximately equal at optimum salinity and the corresponding ratio is
called the optimum solubilization ratio. Huh [156] derived a theoretical relationship
between IFT and optimal solubilization ratio known as the Huh equation:
2
*
C
(4.2)
Winsor Type I Winsor Type III
Maximum Type III microemulsion
Winsor
Type II
TH-2437_126107015

Chapter 4 Optimum Formulation of Chemical Slug for ASAG Flooding
97
where λ is the IFT, σ* is the optimal solubilization ratio & C is around 0.3 mN/m.
Estimating the IFT from the Huh’s equation is much quicker than direct measurement (e.g.
with spinning drop tensiometer) and sufficiently accurate. Fig. 4.13 represents the
solubilization data of the phase behavior test. An optimal solubilisation ratio of 6.2 was
obtained at an optimum salinity of 2300 ppm. The corresponding IFT value calculated
from Hun’s equation was 0.0078 mN/m. These optimum salinity and IFT values agreed
well with experimental values obtained from the phase behavior test and the IFT measured
with spinning drop tensiometer respectively.
Fig. 4. 13: Solubilization data of phase behavior test of (0.5 wt% AOS + 0.75 wt%
Na2CO3) and crude oil at 70 oC.
4.6 Adsorption Study
In order to investigate the effects of adding alkali (Na2CO3) and preflushing with
BL on the adsorption behavior of the surfactants onto reservoir rocks, the static and
dynamic adsorption studies were carried out. Fig. 4.14 shows the static adsorption
0 1000 2000 3000 4000 50000
2
4
6
8
10
12
14
16
Oil solubilization ratio
Water solubilization ratio
Brine salinity (ppm)
Oil
so
lub
iliz
ati
on
rati
o (
ml/
ml)
0
2
4
6
8
10
12
14
16
Wate
r so
lub
iliz
ati
on
rati
o (
ml/
ml)
TH-2437_126107015

Chapter 4 Optimum Formulation of Chemical Slug for ASAG Flooding
98
isotherms of SDS and AOS onto the reservoir rock grains for a range of surfactant
concentrations. It can be observed that initially, the adsorption isotherm increased with the
increase in surfactant concentration due to the electrostatic interaction between the charged
sites on the rock grain surfaces and the head groups of the surfactant. Additionally,
adsorption also occurs due to the formation of surfactant molecule aggregates on the
surface of rock grains as a result of lateral interaction between hydrocarbon chains [205].
Fig. 4.14 also shows the adsorption isotherm of the two surfactants on to the reservoir rock
in the presence of Na2CO3. The addition of Na2CO3 to SDS and AOS solutions
considerably decreased the surfactant adsorption. This effect of alkali on surfactant
adsorption has been reported earlier [206, 207]. Alkali increases the solution pH making
the sand surface more negative and thus the electrostatic repulsive forces decrease the
adsorption of the negatively charged surfactant [208].
The plots of fitting the adsorption equilibrium data for the two surfactants SDS and
AOS into Linear, Langmuir, Freundlich, and Temkin models are shown in the Fig. 4.15
and Fig.4.16 respectively. The corresponding equations, correlations, regression coefficient
(R2) and other parameters for all the adsorption isotherms are presented in Table 4.2. For
both the surfactants Langmuir model was the best fitting plot with maximum R2 values.
The nondimensional Langmuir constant (RL) was evaluated which varied between 0.322 –
0.877 and 0.562 – 0.9551 for SDS and AOS respectively. This indicated that adsorption of
the surfactants onto the reservoir rocks was favorable [157]. The results indicated
monolayer adsorption on homogenous surface of finite number of identical sites with no
interaction between adsorbed molecules. Ahmadi and Shadizadeh [160] also reported
similar observation while investigating the adsorption of natural surfactant on shale-
sandstone reservoir rocks.
TH-2437_126107015

Chapter 4 Optimum Formulation of Chemical Slug for ASAG Flooding
99
The dynamic adsorption method can better simulate the adsorption of surfactant by
reservoir rocks. Thus, the results are more realistic and field-like. Fig. 4.17 shows the
dynamic adsorption curves of 0.5 wt% AOS solutions with and without the addition of
Na2CO3 (at 0.75 wt%), and with BL preflush. An equilibrium state during the surfactant
injection process was obtained when the surfactant concentration in the effluent was almost
equal to the injected surfactant concentration. This was the condition when surfactants are
no longer adsorbed by the core plug and breakthrough occurred. A longer equilibrium time
implied greater adsorption of surfactants onto the core plug, while a shorter equilibrium
time meant lower or reduction of adsorption [209]. From Fig. 4.17 and Table 4.2, it can be
observed that the addition of alkali to the surfactant shifted the equilibrium state from 9 PV
to 6 PV. The surfactant (AOS) adsorption was reduced by more than half from 1.41 mg/g
to 0.52 mg/g by 0.75 wt% Na2CO3 addition to surfactant solution. Ahmadi and Shadizadeh
[160] performed core flooding experiments (at temperature = 90 oC and pressure = 2500
psi) for dynamic adsorption of natural surfactant onto the surface of shale-sandstone core
plugs obtained adsorption values of 3.32 mg/g and 6.89 mg/g respectively. Lv et al. [205]
reported the dynamic adsorption study of alkyl benzene sulfonate and betaine solutions
injected through sand pack containing kaolinite. Their results indicated reduction of alkyl
benzene sulfonate and betaine adsorption from 1.676 and 3.206 mg/g to 0.355 and 0.686
mg/g respectively with the addition of Na2CO3 alkali.
During the preflushing with BL, the SFB used for initial injection was mixed with
BL (at various concentrations) followed by the injection of AS solution. This was done to
investigate the ability of BL to act as sacrificial adsorbate for reducing the loss of primary
surfactant by adsorption and also to find the appropriate concentration of BL for
preflushing. The results show that preflushing with BL could further reduce adsorption
from 0.52 mg/g (without preflushing) to 0.37 and 0.21 mg/g by increasing the BL
preflushing concentration from 0.5 to 1 wt% respectively. It has been reported that
TH-2437_126107015

Chapter 4 Optimum Formulation of Chemical Slug for ASAG Flooding
100
preflushing with lignosulphonate causes the strongly-ionized sulphonate groups to pre-
adsorb on the potential adsorption sites of the reservoir rock by means of electrostatic
attraction or hydrogen bonding. Thus the negative charge of the reservoir rock surfaces is
increased in such a way that rock grain surfaces has little or no affinity for the primary
surfactant, reducing its adsorption loss [210-213]. Lignosulphonate, the main constituent of
BL, was thus instrumental in reducing surfactant (AOS) adsorption when used for the
preflushing prior to surfactant injection. The adsorption results indicated that increasing
the BL concentration in the preflush to 1.5 and 2 wt% could not further reduce the
adsorption below 0.21 mg/g. This was due to the characteristic property of surfactant
adsorption onto solid surfaces of reaching a limiting adsorption value at the critical micelle
concentration (CMC) value [214]. The CMC of BL in formation brine (SFB) was
determined by plotting surface tension versus the surfactant concentration. The CMC
concentration corresponds to the point of first lowest surface tension and after the CMC,
the surface tension remains fairly constant. Fig. 4.18 shows the plot of surface tension as a
function of BL concentration and the CMC value of BL as 1 wt%. Thus, based on the
dynamic adsorption study it was observed that the CMC value of BL could be considered
as the most suitable concentration for preflushing operation.
TH-2437_126107015

Chapter 4 Optimum Formulation of Chemical Slug for ASAG Flooding
101
Fig. 4. 14: Static adsorption isotherms of surfactants: (a) SDS and (b) AOS onto reservoir rock at 28 oC with and without Na2CO3 alkali
0 20 40 60 80 100 120 1400
150
300
450
600
Am
ou
nt
adso
rbed
(µ
g/g
)
Equilibrium concentration (µg/g)
SDS
SDS + 1 wt% Na2CO
3
(a)
0 40 80 120 160 2000
100
200
300
400(b)
Am
ou
nt
adso
rbed
(
g/g
)
Equilibrium concentration (g/g)
AOS
AOS + 0.75 wt% Na2CO
3
TH-2437_126107015

Chapter 4 Optimum Formulation of Chemical Slug for ASAG Flooding
102
Fig. 4. 15: Adsorption Isothermal model fitting of SDS on reservoir rock samples (a) Linear isotherm model (b) Langmuir isotherm model (c)
Freundlich isotherm model and (d) Temkin isotherm model.
0.8 1.0 1.2 1.4 1.6 1.8 2.00.8
1.2
1.6
2.0
2.4
2.8
3.2
log qe = 1.9571 log C
e - 0.9696
R2 = 0.9658
(c) SDS: Freundlich isotherm model
log
qe
log Ce
0 20 40 60 80 100 120 1400
150
300
450
600
qe (
µg
/g)
Ce (µg/g)
(a) SDS: Linear isotherm model
qe = 8.0415 C
e - 119.3790
R2 = 0.9422
0.00 0.02 0.04 0.06 0.08 0.10 0.12
0.00
0.02
0.04
0.06
0.08
0.10
0.12
1/qe = 1.0254/C
e - 0.0143
R2 = 0.9945
(b) SDS: Langmuir isotherm model
1/q
e (
g/µ
g)
1/Ce (g/µg)
Equation y = a + b*x
Weight No Weighting
Residual Sum of Squares
3.63093E-5
Pearson's r 0.9977
Adj. R-Square 0.99448
Value Standard Error
Amount adsorb Intercept -0.01426 0.0015
Amount adsorb Slope 1.02541 0.03118
2.0 2.5 3.0 3.5 4.0 4.5 5.0 5.5 6.0
0
100
200
300
400
500
600
qe (
µg
/g)
ln Ce
(d) SDS: Temkin isotherm model
qe = 243.5553 ln C
e - 630.8747
R2 = 0.9422
TH-2437_126107015

Chapter 4 Optimum Formulation of Chemical Slug for ASAG Flooding
103
Fig. 4. 16: Adsorption isothermal model fitting of AOS on reservoir rock samples (a) Linear isotherm model (b) Langmuir isotherm model (c)
Freundlich isotherm model and (d) Temkin isotherm model.
1.2 1.4 1.6 1.8 2.0 2.2 2.40.8
1.0
1.2
1.4
1.6
1.8
2.0
2.2
2.4
2.6
log
qe
log Ce
(c) AOS: Freundlich isotherm model
log qe = 1.6740 log C
e - 1.2691
R2 = 0.9411
0 40 80 120 160 200 2400
100
200
300
400
qe = 2.0071 C
e - 59.8317
R2 = 0.8981
(a) AOS: Linear isotherm model
qe (
µg
/g)
Ce (µg/g)
0.00 0.01 0.02 0.03 0.04 0.05 0.06
0.00
0.02
0.04
0.06
0.08
0.10
0.12
1/q
e (
g/µ
g)
1/Ce (g/µg)
(b) AOS: Langmuir isotherm model
1/qe = 2.169/C
e - 0.0114
R2 = 0.9797
0 20 40 60 80 100 120 140 160 180
0
50
100
150
200
250
300
qe (
µg
/g)
ln Ce
(d) AOS: Temkin isotherm model
qe = 1.1938 ln C
e+ 77.7094
R2 = 0.3727
TH-2437_126107015

Chapter 4 Optimum Formulation of Chemical Slug for ASAG Flooding
104
Table 4. 2 Parameters of different adsorption isotherm model fitting
Isotherm
model Equation Surfactant Correlations Parameters R
2
Linear
isotherm e H eq = K C
SDS e eq = 8.0145C - 119.3790 KH=8.0145 C=-119.3790 0.9422
AOS e eq = 2.0071 C - 59.8317 KH=2.0071 C=-59.8317 0.8981
Langmuir max L e
e
L e
q K Cq =
1 + K C
SDS e e1/ q 1.025/C - 0.0143 qmax= 69.93 KL=0.014 0.9945
AOS e e1/q = 2.1690/C - 0.0114 qmax= 87.72 KL=0.0052 0.9797
Freundlich 1/
e Fq = K C n
e
SDS e elog q = 1.9571 log C - 0.9696 n=0.5109 KF=0.1073 0.9658
AOS e elog q = 1.6740 log C - 1.2691 n=0.5974 KF=0.0538 0.9411
Temkin e T eq = B ln K + B ln C SDS e eq = 243.5553 ln C - 630.8747 KT=0.075 B=243.5553 0.9422
AOS e eq = 1.1938 ln C + 77.7094 KT=1.86e28
B = 1.8619 0.3727
Ce = equilibrium concentration (μg/g); qe = Adsorption at equilibrium time (μg/g); KH = Linear isothermal model constant;
KL = Langmuir constant; qmax = Langmuir adsorption capacity (μg/g); n = Freundlich constant;
B = Temkin constant. KT = Temkin constant
TH-2437_126107015

Chapter 4 Optimum Formulation of Chemical Slug for ASAG Flooding
105
Fig. 4. 17: Surfactant concentration as a function of the pore volume of the fluid injected in
dynamic adsorption experiments performed at 70 oC
Fig. 4. 18: Surface tension versus black liquor concentration curve for determining CMC
0.0 2.5 5.0 7.5 10.0 12.5 15.04.5
4.6
4.7
4.8
4.9
5
5.1
Su
rfacta
nt
co
ncen
trati
on
(m
g/g
)
Fluid injected (PV)
0.5 wt% AOS
0.5 wt% AOS +
0.75 wt% Na2CO
3
With 0.5 wt% BL preflush
With 1 wt% BL preflush
With 1.5 wt% BL preflush
With 2 wt% BL preflush
0.1 1 1030
40
50
60
Su
rface t
en
sio
n (
mN
/m)
Black liquor concentration (wt%)
CMC
TH-2437_126107015

Chapter 4 Optimum Formulation of Chemical Slug for ASAG Flooding
106
Table 4. 3: Summary to core flood experiments performed to study the dynamic adsorption of surfactant on to core plugs
Sl.
No.
PV
of core plug
(ml)
Dry weight
of core plug
(g)
Preflush by BL
(wt%)
Injected chemical
formulation Equilibrium
time
(PV)
Adsorption
(mg/g) AOS
(wt%)
Na2CO3
(wt%)
1 18.31 199.34 0 0.5 0 9 1.41
2 16.52 186.28 0 0.5 0.75 6 0.52
3 15.94 160.27 0.5 0.5 0.75 5 0.37
4 16.98 188.82 1 0.5 0.75 4 0.21
5 15.53 158.54 1.5 0.5 0.75 4 0.22
6 16.85 187.86 2 0.5 0.75 4 0.21
TH-2437_126107015

Chapter 4 Optimum Formulation of Chemical Slug for ASAG Flooding
107
4.7 Summary
The optimum chemical formulations for ASAG flooding were designed to fulfill
two objectives which are lowering oil-water IFT to ultra-low value and providing good
mobility control. The presence of crude oil was found to have a destabilizing effect
lowering both the foamability and foam stability of the foaming agents/surfactants. CO2-
foam stability of the surfactant solutions was found to be lower at reservoir temperature
(70 oC) compared to room temperature (28
oC). The maximum CO2-foam stability in the
presence of crude oil at reservoir temperature occurred at 0.3 wt% SDS and 0.5 wt% AOS.
The equilibrium IFT measurements showed that when combined with the optimum SDS
and AOS formulations, both the alkalis Na2CO3 and NaOH could reduce the oil-water IFT
values to the ultra-low range. However, Na2CO3 was chosen as the IFT values were the
lowest. The phase behavior study indicated that 70% of SFB salinity (2400 ppm)
corresponded to the optimal salinity where Winsor type III microemulsion volume was
maximum. The IFT measurements confirmed that the oil-water IFT value at optimal
salinity was the lowest. Further, the addition of alkali was found to considerably decreased
the surfactant adsorption onto the reservoir rocks. Additionally, dynamic adsorption studies
showed that alkali addition could reduce surfactant (AOS) adsorption by core plug by more
than half from 1.41 mg/g to 0.52 mg/g. Preflushing with BL reduced the surfactant loss due
to adsorption and the optimum concentration of BL for preflushing was its CMC value.
TH-2437_126107015

108
TH-2437_126107015

CHAPTER 5
Enhanced Oil Recovery by ASAG Flooding
Continuous gas injection
Water alternated gas flooding
Surfactant alternated gas flooding
Alkali-surfactant-alternated-gas/CO2 flooding
Work published as:
1. R. Phukan, S.B. Gogoi, and P. Tiwari, Enhanced oil recovery by
alkaline‑surfactant‑alternated‑gas/CO2 flooding. Journal of Petroleum Exploration
and Production Technology, Springer, 2019. 9: p. 247-260.
Enhanced oil recovery
Drive water
CO2 AS CO2 FoamOil
Bank
Extraoil
recovery
AS CO2
Impermeable rock
Cap Rock
Impermeable rock
ASAG core flooding
TH-2437_126107015

TH-2437_126107015

Chapter 5 Enhanced Oil Recovery by ASAG Flooding
109
Chapter 5
Enhanced Oil Recovery by ASAG flooding
This chapter elaborates upon the potential of ASAG flooding for EOR through lab-scale
core flooding experiments. A comparative assessment of the additional oil recovering
ability of the other EOR techniques like tertiary CGI, CO2-WAG, SAG, AS, and ASAG
flooding is also presented.
5.1 Core Flooding Experiments
The core flooding experiments were performed in a lab-scale core flooding
apparatus on sandstone reservoir core plugs using crude oil to evaluate the oil recovery
potential of the different EOR injection schemes. After the initial crude oil saturation as
described in Section 2.2.11, synthetic formation brine (SFB) was injected at constant
pressure with the temperature maintained at 70 oC during the secondary waterflooding
process. Thereafter, fluids were injected under different injection schemes depending on
the tertiary EOR process. The injection of liquid was maintained at constant pressure
(around 500 psi), while the volumetric gas injection rate was fixed at 0.2 ml/min in most of
the experiments. In this study, the potential of the tertiary WAG, SAG and ASAG flooding
for EOR was evaluated under immiscible conditions. According to the concept of
immiscible flooding, CO2 is injection at subcritical conditions (critical pressure of CO2 is
1071 psi) [215]. From the CO2 phase diagram (shown in Fig. 5.1), it is observed that CO2
will be in the gaseous state under the experimental conditions (subcritical pressure and
reservoir temperature of 70oC). Although the core flooding experiments were conducted
under similar experimental conditions, they were not similar entirely. Some core plugs
were reused after complete cleaning and drying following its previous flooding operation.
TH-2437_126107015
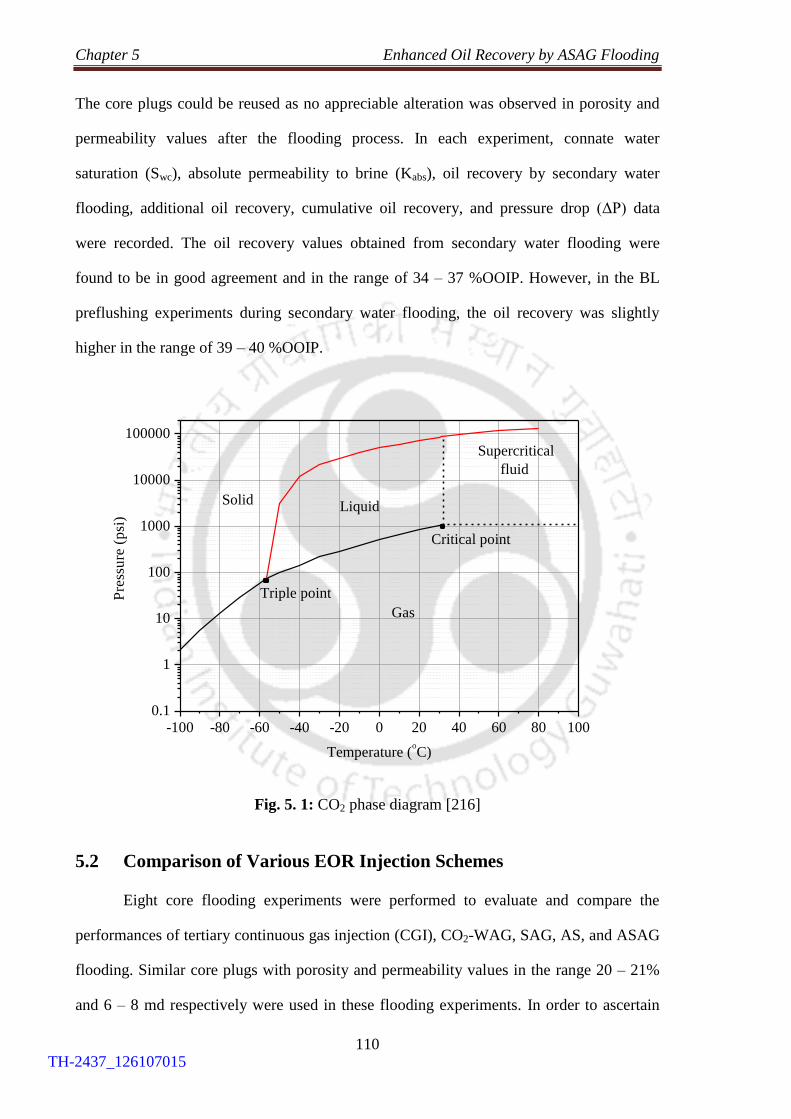
Chapter 5 Enhanced Oil Recovery by ASAG Flooding
110
The core plugs could be reused as no appreciable alteration was observed in porosity and
permeability values after the flooding process. In each experiment, connate water
saturation (Swc), absolute permeability to brine (Kabs), oil recovery by secondary water
flooding, additional oil recovery, cumulative oil recovery, and pressure drop (ΔP) data
were recorded. The oil recovery values obtained from secondary water flooding were
found to be in good agreement and in the range of 34 – 37 %OOIP. However, in the BL
preflushing experiments during secondary water flooding, the oil recovery was slightly
higher in the range of 39 – 40 %OOIP.
Fig. 5. 1: CO2 phase diagram [216]
5.2 Comparison of Various EOR Injection Schemes
Eight core flooding experiments were performed to evaluate and compare the
performances of tertiary continuous gas injection (CGI), CO2-WAG, SAG, AS, and ASAG
flooding. Similar core plugs with porosity and permeability values in the range 20 – 21%
and 6 – 8 md respectively were used in these flooding experiments. In order to ascertain
-100 -80 -60 -40 -20 0 20 40 60 80 100
0.1
1
10
100
1000
10000
100000
Gas
Critical point
Supercritical
fluid
Triple point
Solid
Pre
ssu
re (
psi
)
Temperature (oC)
Liquid
TH-2437_126107015

Chapter 5 Enhanced Oil Recovery by ASAG Flooding
111
whether foam was formed in the core plugs during SAG and ASAG flooding, the ΔP data
were used to calculate the mobility reduction factor (MRF). MRF is a factor used to
characterize the strength of foam generated and is defined as the pressure drop across the
core with and without foam [217, 218].
foam
no foam
ΔPMRF =
ΔP (5.1)
where ΔPfoam = average pressure drop across the core plug in the presence of foam.
ΔPno foam = average pressure drop across the core plug in the absence of foam.
An MRF value > 1 is an indication of foam formation, and an increase in the value of
MRF takes place when stronger foam is formed [217]. The experimental details and results
of the eight core flooding experiments are summarized in Table 5.1. The oil recoveries by
secondary water flooding were identical, implying that the residual oil saturation in the
core plugs was similar prior to the injection of tertiary injection schemes.
5.2.1 Tertiary Continuous Gas Injection (CGI)
In tertiary CGI, gas/CO2 was continuously injected into the core plug at the
constant volume injection rate of 0.2 ml/min under immiscible conditions after secondary
water flooding at reservoir temperature (70 oC). CO2 injection was terminated after 3 PV
was injected and when no more oil was produced. Fig. 5.2 shows the cumulative oil
recovery and ΔP versus the PV of fluid injected. The secondary water flooding resulted in
an oil recovery of 36.88 %OOIP. The oil recovery by tertiary CGI was 3.46 %OOIP. The
residual oil was produced from the core plug due to the CO2 invasion into pores which
were inaccessible by water flooding [12]. Upon its dissolution with the residual oil, the
CO2 become instrumental in reducing oil viscosity and causing oil swelling in the pores
spaces which contribute towards improving the oil recovery from the core plug. However,
the recovery was low probably due to the water shielding effect caused by brine injected
TH-2437_126107015

Chapter 5 Enhanced Oil Recovery by ASAG Flooding
112
during secondary waterflooding, and early injection gas breakthrough. Due to the initial
high water saturation after water flooding, the injected gas/CO2 could not contact a large
part of the residual oil in the core plug and had to first displace the water to reach the oil.
Additionally, high gas mobility also resulted in poor volumetric sweep efficiency (Evo).
The ΔP during CGI was initially around 50 psi but dropped rapidly indicating injection gas
breakthrough. Kulkarni and Rao [60] studying the tertiary immiscible CGI with n-decane
and Berea core had also reported recovering 4 - 22 %OOIP in their core flooding
experiments.
Fig. 5.2: Cumulative oil recovery and pressure drop versus pore volume of fluid injected in
tertiary CGI
5.2.2 CO2-Water Alternating Gas (CO2-WAG) Flooding
In this experiment, the oil-saturated core plug was subjected to secondary water
flooding until no more oil was produced. The oil recovery after injection of 4 PV of SFB
was 36.17 %OOIP. The core plug with residual oil was then subjected to immiscible CO2-
WAG flooding during which four cycles of WAG were injected with each cycle consisting
of 0.25 PV of CO2 and 0.25 PV of SFB. Thus the total volume of fluid injected during the
0 2 4 6 8 100
25
50
75
100
125
150
Pressure drop
Cumulative oil
recovery
Fluid injected (PV)
Pre
ssu
re d
rop
(p
si)
Water flooding Continuous gas injection
0
20
40
60
80
Cu
mu
lati
ve o
il r
eco
very
(%
OO
IP)
TH-2437_126107015

Chapter 5 Enhanced Oil Recovery by ASAG Flooding
113
CO2-WAG process was 2 PV. WAG injection was followed by the drive in the form of 4
PV of extended water flooding (EWF). Fig. 5.3 shows the cumulative recovery and ΔP
versus PV of fluid injected in CO2-WAG flooding. The oil recovery post water flooding
increased to 7.96 %OOIP. This amounted to a cumulative oil recovery of 44.13 % OOIP.
The improvement in oil recovery by CO2-WAG was 4.5 %OOIP over tertiary CGI. The
combination of CO2 and water in the WAG process reduced gas/CO2 mobility due to the
increased water saturation in core plugs [82]. The result was an improved frontal
displacement of the residual oil and consequently higher oil recovery. As CO2 and water
were injected in short alternate slugs, the early breakthrough of the gas/CO2 was prevented
that improved the sweep efficiency. Thus, additional oil was mobilized by the injected
gas/CO2 and consequently higher oil recovery resulted. The drastic decline in the ΔP was
not observed in WAG flooding unlike the CGI process. This clearly indicated that the gas
mobility was effectively controlled. A cyclic trend of ΔP was observed throughout the
WAG cycle as the injected fluid switched between CO2 and brine. After oil bank
breakthrough and production of residual oil, the ΔP across the core plug stabilized during
the EWF period. The average ΔP during the WAG process was 51.63 psi. The oil recovery
by CO2-WAG injection was in good agreement with data reported in the literature.
Kulkarni and Rao [60] while conducting immiscible CO2-WAG core flooding on Berea
cores with n-decane as the oil phase obtained oil recovery of 8.3 %OOIP, which was much
lower than miscible WAG recovery (35 %OOIP). The field incremental oil recovery by
CO2-WAG is also reported to be low and in the range of 5 to 10 %OOIP [59, 61, 219].
TH-2437_126107015
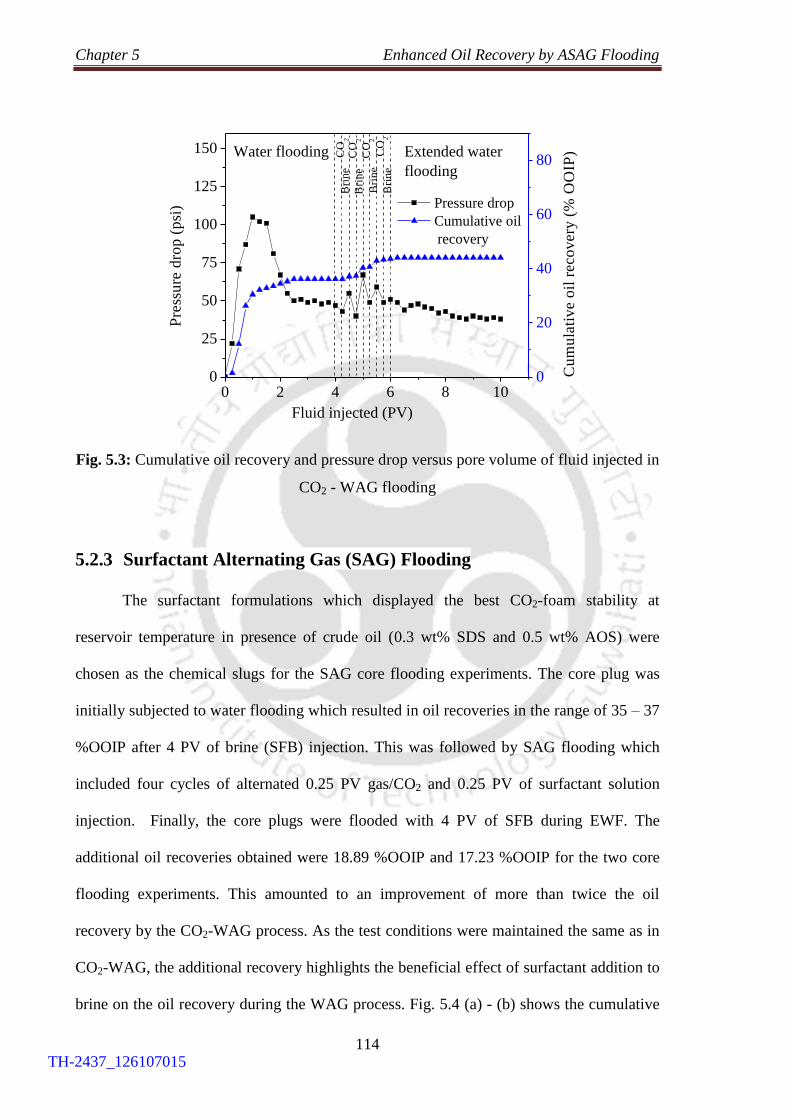
Chapter 5 Enhanced Oil Recovery by ASAG Flooding
114
Fig. 5.3: Cumulative oil recovery and pressure drop versus pore volume of fluid injected in
CO2 - WAG flooding
5.2.3 Surfactant Alternating Gas (SAG) Flooding
The surfactant formulations which displayed the best CO2-foam stability at
reservoir temperature in presence of crude oil (0.3 wt% SDS and 0.5 wt% AOS) were
chosen as the chemical slugs for the SAG core flooding experiments. The core plug was
initially subjected to water flooding which resulted in oil recoveries in the range of 35 – 37
%OOIP after 4 PV of brine (SFB) injection. This was followed by SAG flooding which
included four cycles of alternated 0.25 PV gas/CO2 and 0.25 PV of surfactant solution
injection. Finally, the core plugs were flooded with 4 PV of SFB during EWF. The
additional oil recoveries obtained were 18.89 %OOIP and 17.23 %OOIP for the two core
flooding experiments. This amounted to an improvement of more than twice the oil
recovery by the CO2-WAG process. As the test conditions were maintained the same as in
CO2-WAG, the additional recovery highlights the beneficial effect of surfactant addition to
brine on the oil recovery during the WAG process. Fig. 5.4 (a) - (b) shows the cumulative
0 2 4 6 8 100
25
50
75
100
125
150
Pressure drop
Cumulative oil
recovery
Fluid injected (PV)
Pre
ssu
re d
rop
(p
si)
Water flooding Extended water
flooding
Bri
ne
Bri
ne
CO
2
CO
2
CO
2B
rin
e
Bri
ne
CO
2
0
20
40
60
80
Cu
mu
lati
ve o
il r
eco
very
(%
OO
IP)
TH-2437_126107015
Chapter 5 Enhanced Oil Recovery by ASAG Flooding
115
oil recovery and the ΔP as a function of the PV of fluid injected in the two SAG processes.
The average ΔP increased to 60.00 psi and 61.13 psi during the two SAG injection
experiments, and the corresponding MRF values were 1.16 and 1.18. These MRF values >
1 were indicative of in-situ foam formation in the core plug due to the alternate cycles of
surfactant solution and gas/CO2 injection during SAG flooding [76, 186]. Foam generation
in the core plug had increased the apparent viscosity of CO2 gas, thus making the mobility
ratio favorable. Consequently, better gas mobility control and improvement in Evo resulted
in higher oil recovery. The increased recovery during the SAG process could also be
attributed to the decrease in the oil-water IFT caused by the addition of surfactant to brine.
The results of IFT measurements indicated that the addition of surfactants (SDS and AOS)
could lower the oil-water IFT values to as low as 0.2 – 0.3 mN/m. These IFT values were
much lower than the typical crude oil-brine IFT values of 18 – 32 mN/m [220]. With the
decrease in the IFT, the capillary number (Ncap) increased which helped in mobilizing the
trapped oil in the core plug leading to higher oil recovery. In addition, injecting the
surfactant solutions is also known to alter wettability of the reservoir rock to more water-
wet condition which helps in improving the oil recovery [221]. Further, a correctly
designed surfactant solution can combine with brine and crude oil to form microemulsion
at oil-water interface further reducing the IFT to the lowest value for improved oil recovery
[222]. Moayedi et al. [223] reported incremental oil recovery of 12 %OOIP, which was 9%
higher than WAG flooding, from tertiary SAG core flooding experiments performed using
Berea sandstone cores with Hibernia crude oil.
TH-2437_126107015

Chapter 5 Enhanced Oil Recovery by ASAG Flooding
116
Fig. 5.4: Cumulative oil recovery and pressure drop versus pore volume of fluid injected in immiscible SAG flooding with chemical slug:
(a) 0.3 wt% SDS, and (b) 0.5 wt% AOS
0 2 4 6 8 10
50
75
100
125
150(a)
Pressure drop
Cumulative oil
recovery
Fluid injected (PV)
Pre
ssu
re d
rop
(p
si)
CO
2S
urf
acta
nt
CO
2S
urf
acta
nt
Su
rfacta
nt
CO
2
CO
2S
urf
acta
nt
Water flooding
Extended water
flooding
0
20
40
60
80
100
Cu
mu
lati
ve o
il r
eco
very
(%
OO
IP)
0 2 4 6 8 100
25
50
75
100
125
150
Pressure drop
Cumulative oil
recovery
Fluid injected (PV)
Pre
ssu
re d
rop
(p
si)
Water flooding
Extended water
flooding
0
20
40
60
80
100
Cu
mu
lati
ve o
il r
eco
very
(%
OO
IP)
Su
rfacta
nt
Su
rfacta
nt
CO
2
CO
2
CO
2S
urf
acta
nt
Su
rfacta
ntC
O2
(b)
TH-2437_126107015

Chapter 5 Enhanced Oil Recovery by ASAG Flooding
117
5.2.4 Alkaline-Surfactant (AS) Flooding
Two additional core flooding experiments were performed with only the AS
formulation without gas to compare the effect of chemical flooding with combined gas-
chemical flooding. The chemical slug used in the two AS flooding experiments were
0.3wt% SDS + 1 wt% Na2CO3 and 0.5wt% AOS + 0.75 wt% Na2CO3 respectively.
Following secondary water flooding, the core plug was subjected to 1 PV of chemical slug
injection at a constant rate followed by 5 PV of SFB injection. Fig. 5.5 (a) – (b) shows the
cumulative oil recovery and ΔP data of the two tertiary AS flooding experiments. The
residual oils recovered were 16.34 %OOIP and 15.20 %OOIP respectively - higher than
CGI and WAG flooding. Kumar et al. [224] reported incremental oil recovery of 20 – 40
%OOIP from AS flooding in sand packs with heavy oils of Alaska. Several mechanisms
are responsible for oil recovery by AS flooding including a decrease in oil-water IFT, the
formation of in-situ surfactants by the reaction between alkali and acidic components of
crude oil, wettability alteration, and emulsification of oil in water [138]. Adding alkali and
surfactants at optimum concentrations decreased the oil-water IFT values of the alkali-
surfactant (AS) formulations to ultra-low values (0.0068 mN/m and 0.0087 mN/m). Thus
the capillary held residual oil in the core plug could be mobilized and extra oil recovery
was obtained. In addition, it was observed from the phase behaviour study that alkali-
surfactant solutions at optimum salinity formed Winsor type III microemulsion This type
of microemulsion plays a very crucial role in enhanced oil recovery operations because of
its ultra-low IFT environment and ability to produce maximum oil [155]. It can be
observed from the figures that a rise in ΔP occurred during the AS injection as the oil bank
was formed due to the mobilization of the residual oil by the chemical slug. But after the
oil bank and injection fluid breakthrough, the ΔP decreased continuously before stabilizing
at around 40 psi during the EWF. The average pressure drop during AS injection period
were 62.50 psi and 59.75 psi respectively for the two experiments.
TH-2437_126107015

Chapter 5 Enhanced Oil Recovery by ASAG Flooding
118
Fig. 5.5: Cumulative oil recovery and pressure drop versus pore volume of fluid injected in tertiary AS flooding performed with chemical slugs:
(a) 0.3 wt% SDS + 1 wt% Na2CO3, and (b) 0.5 wt% AOS + 0.75 wt% Na2CO3
0 2 4 6 8 100
25
50
75
100
125
150
AS
flo
od
ing
Pressure drop
Cumulative oil
recovery
Fluid injected (PV)
Pre
ssu
re d
rop
(p
si)
Water flooding Extended water
flooding
(a)
0
20
40
60
80
Cu
mu
lati
ve o
il r
eco
very
(%
OO
IP)
0 2 4 6 8 100
25
50
75
100
125
150 (b)
A
S f
loo
din
g
Pressure drop
Cumulative oil
recovery
Fluid injected (PV)
Pre
ssu
re d
rop
(p
si)
Water floodingExtended water
flooding
0
20
40
60
80
Cu
mu
lati
ve o
il r
eco
very
(%
OO
IP)
TH-2437_126107015

Chapter 5 Enhanced Oil Recovery by ASAG Flooding
119
5.2.5 Alkaline-Surfactant-Alternated-Gas (ASAG) Flooding
The performance of tertiary ASAG flooding was studied by performing two core
flooding experiments for the two selected AS chemical slug. SFB was first injected into the
oil-saturated core plug during the secondary water flooding. The experiment was then
switched to ASAG flooding in which 4 cycles of alternated 0.25 PV gas/CO2 and 0.25 PV
AS slug were injected. Fig. 5.6 (a) – (b) shows the cumulative oil recovery and ΔP versus
PV of fluid injected during the ASAG flooding experiments. With core plugs of identical
properties, the oil recoveries of equivalent magnitude were obtained by secondary water
flooding (35 – 37 %OOIP) under similar experimental conditions. The immiscible tertiary
ASAG flooding resulted in additional oil recoveries of 23.85 %OOIP and 21.87 %OOIP
respectively, which were 7.51 %OOIP and 6.67 %OOIP higher than the respective AS
flooding experiments. The higher oil recovery by ASAG flooding compared to AS
flooding highlighted the synergic effect of AS and gas/CO2 alternate injection. The early
breakthrough of the injected chemical slug resulted in reduced Evo and consequently lower
oil recovery during AS flooding. However, during ASAG flooding the early injection fluid
breakthrough was prevented due to the injection of both AS and gas/CO2 in short alternate
slug. The presence of both injected fluids reduced the mobility of each other. Moreover,
high gas mobility was controlled due to in-situ foam generation during ASAG flooding.
Foam does not make the CO2 gas less mobile, but increases the apparent viscosity of the
gas and decreases the relative permeability of the liquid thus making the mobility ratio
favorable [57]. Further, the injection of the AS formulations lowered the oil-water IFT to
the lowest values to produce the adherent oil from the core plug. The CO2 injected also
resulted in oil-swelling and viscosity reduction, thereby improving oil recovery. Thus,
combination of all the above mechanisms accounted for the highest oil recovery obtained
by ASAG flooding. Luo et al. [124] reported better oil recovery during ASP/CO2 flooding
(27.43 %OOIP) for Saskatchewan heavy oils, compared to CO2-WAG flooding (9.43
TH-2437_126107015

Chapter 5 Enhanced Oil Recovery by ASAG Flooding
120
%OOIP) in core flooding experiments performed on sand packs prepared with Ottawa
sands. Srivastava et al. [78] had reported incremental oil recovery of 29% OOIP from
immiscible ASG (AS alternated CO2) flooding with Berea sandstone cores and Limbodara
crude oil.
As shown in Figure 5.6, the ΔP continuously fluctuated as the chemical slug and
the gas/CO2 were alternately injected during the ASAG cycle. At the beginning of water
flooding, the ΔP across the core plug build up and then sharply decreased after reaching a
peak following water breakthrough. ΔP was further observed to stabilize to a steady-state
value towards the end of the waterflood. During the ASAG flooding, when the first slug of
gas/CO2 was injected, the ΔP decreased slightly due to the low viscosity of CO2 gas. The
injected CO2 gas mobilized some of the residual oil due to dissolution forming an oil bank,
so a slightly increasing trend of ΔP was observed towards the end [61]. Thereafter, the
increasing trend of ΔP continues during the first alternating chemical slug injection
because of the change in viscosity of the injected fluid (from gas to liquid) and as oil bank
grew while moving through the core plug. The injection of chemical slug mobilized
residual oil increasing the oil bank size. The increase in the oil bank size and foam
generation also raised the ΔP. During the second slug of CO2 injection, a decreasing trend
of ΔP was again observed like in the first cycle. However, ΔP increased during the second
alternating chemical slug injection reaching the peak ΔP value just ahead of the oil bank
breakthrough. The formation of a second ΔP peak was related to the generation of a second
oil bank. The highest ΔP peak value occurred in the second cycle because of the flow
resistance offered by the propagating oil banks and foam generated. As a major part of the
residual oil was produced during the first two cycles, the sizes of oil banks formed in the
later cycles decreased gradually resulting in a lowering of ΔP peak values. The average
ΔPs recorded during the two ASAG flooding were 65.75 psi and 66.13 psi respectively
(Table 3.1). A comparison of these values with the data of AS flooding experiments
indicated that the higher average ΔP in ASAG flooding was because of in-situ foam
TH-2437_126107015

Chapter 5 Enhanced Oil Recovery by ASAG Flooding
121
generation and not due to the displacement of microemulsion formed during the process.
Similar difference in the average ΔP during ASG flooding (with gas) and AS flooding
(without gas) was reported by Cottin et al. [79].
The MRF values were calculated using Eq. (5.1), and found to 1.27 and 1.28
respectively. The values were greater than 1which suggested the generation of foam during
these processes. Further, the higher MRF values of ASAG flooding compared to SAG
implied stronger in-situ foam formation in the core plug. With stronger foam formed, gas
mobility control had improved and a more efficient displacement front was formed leading
to an increase in Evo. Alkali is known to react with the naphthenic acids present in crude
oils to produce in situ surfactants. The presence of both the injected and in-situ surfactants
helped to lower the oil-water IFT to ultra-low value. This ultra-low IFT was instrumental
in mobilizing the capillary held residual oil, thereby increasing the oil recovery.
Additionally, the presence of alkali also reduced the adsorption of surfactant by the core
plug. With less adsorption, more surfactants were available for foam formation and its
propagation through the core plug resulting in the better displacement of the residual oil.
Combinations of all these factors were responsible for the observed increase in the oil
recovery during ASAG flooding.
To study the water production behavior during ASAG flooding, the water-cut data
along with the cumulative oil recovery plot for the first ASAG flooding experiment were
plotted and is shown in Fig. 5.7. During the oil saturation phase, crude oil was injected into
the core plug at a constant rate until the water cut in the effluent reached 0%. During the
water flooding operation, 4 PV of SFB was injected again at a constant rate to establish
residual oil saturation indicated by 99% water cut. At the start of waterflooding, only crude
oil was produced (water cut ≈ 0 %) until water breakthrough occurred at 0.75 PV. From
there onwards the water cut gradually increased until it reached 99% at about 2.75 PV and
continuing to the end of water flood.
TH-2437_126107015
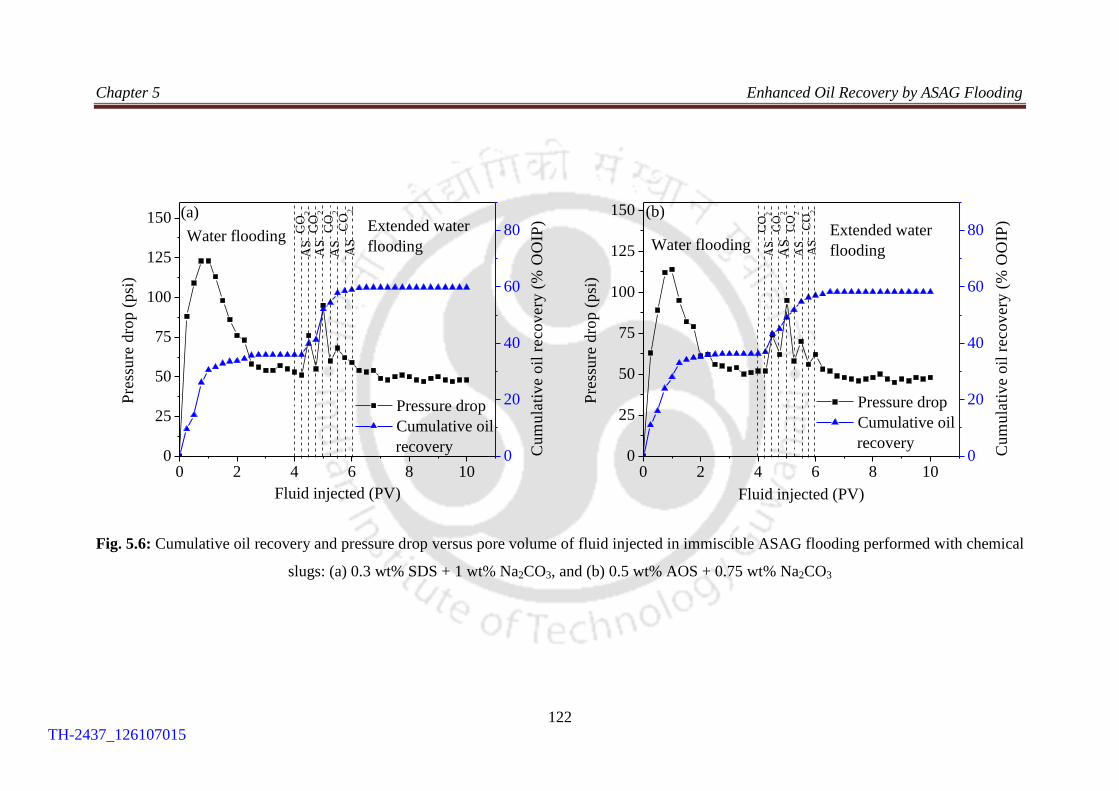
Chapter 5 Enhanced Oil Recovery by ASAG Flooding
122
Fig. 5.6: Cumulative oil recovery and pressure drop versus pore volume of fluid injected in immiscible ASAG flooding performed with chemical
slugs: (a) 0.3 wt% SDS + 1 wt% Na2CO3, and (b) 0.5 wt% AOS + 0.75 wt% Na2CO3
0 2 4 6 8 100
25
50
75
100
125
150
AS
AS
AS
Pressure drop
Cumulative oil
recovery
Fluid injected (PV)
Pre
ssu
re d
rop
(p
si)
CO
2A
S
CO
2
CO
2
CO
2
Water floodingExtended water
flooding
(a)
0
20
40
60
80
Cu
mu
lati
ve o
il r
eco
very
(%
OO
IP)
0 2 4 6 8 100
25
50
75
100
125
150
AS
AS
AS
Pressure drop
Cumulative oil
recovery
Fluid injected (PV)
Pre
ssu
re d
rop
(p
si)
CO
2A
S
CO
2
CO
2
CO
2
Water floodingExtended water
flooding
(b)
0
20
40
60
80
Cu
mu
lati
ve o
il r
eco
very
(%
OO
IP)
TH-2437_126107015

Chapter 5 Enhanced Oil Recovery by ASAG Flooding
123
Fig. 5.7: Water-cut and cumulative oil recovery versus pore volume of fluid injected in
ASAG flooding performed with the chemical slug: 0.3 wt% SDS + 1 wt% Na2CO3
As the four-cycle ASAG flooding mobilized and recovered residual oil, the water
cut in the effluent was also observed to change. In the first cycle, a little oil was produced
so the water cut was around 94%. However, during the second cycle maximum oil
production was observed so that the effluent water cut reached the lowest value of 68% at
5 PV. In the subsequent third and fourth cycles, an increasing trend of water cut was
observed as the amount of oil produced in the effluent decreased gradually. Finally, the
water cut reached 99% during the EWF period when very little oil was produced.
0 2 4 6 8 100
20
40
60
80
100
AS
AS
AS
Water cut
Cumulative oil
recovery
Fluid injected (PV)
Wate
r cu
t (%
)
CO
2A
S
CO
2C
O2
CO
2
Water flooding
Extended
water
flooding
0
20
40
60
80
100
Cu
mu
lati
ve o
il r
eco
very
(%
OO
IP)
TH-2437_126107015

Chapter Enhanced Oil Recovery by ASAG Flooding
124
Table 5. 1: Summary of core flooding experiments performed with various EOR injection schemes
Sl.
No. Description
(%)
K
(mD)
Saturation
(%)
Fluid Injected
(PV)
Avg.
ΔP
MRF
Recovery
(% OOIP)
Kabs Soi Swc WF EOR EWF (psi) WF EOR Total
1 Tertiary CGI 20.49 6.58 73.52 26.48 4.00 3.00
30.75
- 36.88 3.46 40.34
2 WAG 20.76 7.11 74.82 25.18 4.00 2.00 4.00 51.63 - 36.17 7.96 44.13
3
SAG (with
SDS)
20.73 6.87 73.31 26.69 4.00 2.00 4.00 60.00 1.16 35.62 18.89 54.51
4
SAG (with
AOS)
20.52 7.42 72.65 27.35 4.00 2.00 4.00 61.13 1.18 36.74 17.23 53.97
5
AS flooding
(with SDS)
20.69 6.98 74.14 25.86 4.00 1.00 5.00 62.50 36.48 16.34 52.82
6
AS flooding
(with AOS)
20.14 6.50 73.16 26.86 4.00 1.00 5.00 59.75 34.87 15.20 50.07
7
ASAG I
(with SDS)
20.27 6.87 74.21 25.79 4.00 2.00 4.00 65.75 1.27 35.94 23.85 59.79
8
ASAG II
(with AOS)
20.49 6.10 73.35 26.65 4.00 2.00 4.00 66.13 1.28 36.31 21.87 58.18
TH-2437_126107015

Chapter 5 Enhanced Oil Recovery by ASAG Flooding
125
5.3 Summary
This chapter highlighted the successful application of combined alkali, surfactant,
and gas/CO2 injection for improving oil recovery of medium gravity crudes through core
flooding experiments performed with sandstone core plugs. The oil recovery by tertiary
CGI was low (3.46 %OOIP) due to the early injection gas breakthrough. Unlike CGI, the
drastic decline in ΔP was not observed in CO2-WAG flooding due to gas mobility control
which resulted in the incremental oil recovery of 7.96 %OOIP. The oil recovery by SAG
flooding increased by more than double (~ 18 %OOIP) compared to CO2-WAG when the
best performing surfactant formulations were injected alternately with gas/CO2. Higher oil
recovery was possible primarily due to the lowering of oil-water IFT due to surfactant
addition and gas mobility control caused by in-situ foam formation (MRF values > 1).
Further, the effect of adding the optimum AS formulations to brine in the WAG
process was evaluated through ASAG flooding. The highest oil recovery (~ 23 %OOIP)
amongst all the EOR processes was achievable by the tertiary immiscible ASAG flooding.
The attributes that made ASAG flooding the favorable option include attainment of ultra-
low IFT, reduction of fluid mobility, stronger foam generation, and reduction of surfactant
adsorption. A fluctuation of ΔP was observed as the chemical slug and the gas were
alternately injected during the ASAG cycle. The mobilization of residual oil by the injected
fluids resulted in the formation of the oil banks which were indicated by the development
of ΔP peaks during ASAG flooding. Moreover, ΔP behavior of AS flooding and ASAG
flooding revealed that higher average ΔP during ASAG flooding was due to in-situ foam
generation and not due to displacement of microemulsion formed during the process.
TH-2437_126107015

126
TH-2437_126107015

CHAPTER 6
Key Parameters Influencing ASAG Flooding
Key operational parameters
Slug size
Slug ratio
Tapering
Application of salinity gradient
Black liquor preflushing
Work published as:
1. R. Phukan, S.B. Gogoi, and P. Tiwari, Alkaline-surfactant-alternated-gas/CO2
flooding: Effects of key parameters. Journal of Petroleum Science and Engineering,
Elsevier, 2019. 173: p. 547-557.
2. R. Phukan, S.B. Gogoi, P. Tiwari, and R.S.Vadhan, Optimization of immiscible
alkaline-surfactant-alternated-gas/CO2 flooding in an Upper Assam oilfield, in
SPE Western Regional Meeting 2019, Society of Petroleum Engineers: San Jose,
California, USA. p. 23, SPE-196262-MS.
Key
parameters
of ASAG
flooding
Slug ratio
Slug size
Injection scheme
Fluid injection volume
Gas injection rate
Tapering
Salinity gradient Preflushing with BL
TH-2437_126107015

TH-2437_126107015

Chapter 6 Key Parameters Influencing ASAG Flooding
127
Chapter 6
Key Parameters Influencing ASAG Flooding
This chapter addresses the effects of key operational parameters on the performance of
ASAG flooding. The optimum conditions for the best oil recovery by ASAG flooding
evaluated based on the core flooding experiments is presented. For the purpose of
improving process efficiency, this chapter also highlights the applications of salinity
gradient and preflushing during ASAG flooding.
6.1 Introduction
Chapter 5 highlighted the potential of ASAG flooding for EOR and showed that its
overall displacement efficiency was better compared to SAG and WAG flooding. The
alternate injection of gas/CO2 and AS slug resulted in in-situ foam generation during the
ASAG flooding as indicated (MRF value > 1). Foam was instrumental in providing
mobility control and increasing the volumetric sweep efficiency (Evo). However, in order to
establish ASAG flooding as a viable EOR method, the effects of key parameters on the
performance of ASAG flooding require further investigation. These operating parameters
are to be adjusted and optimized before ASAG flooding can be successfully applied in a
particular oil reservoir. A number of ASAG core flooding experiments were performed to
ascertain the performance of ASAG flooding under different injection schemes and to find
the optimum operating conditions. ASAG I and ASAG II described in section 5.2.5
represented the ASAG flooding experiments performed with the most suitable operating
parameters using the two optimum chemical formulations 0.3 wt% SDS + 1 wt% Na2CO3
and 0.5 wt% AOS + 0.75 wt% Na2CO3 respectively. The results of the other core flooding
TH-2437_126107015
Chapter 6 Key Parameters Influencing ASAG Flooding
128
experiments are presented along with these two ASAG flooding experiments to examine
the influence of various parameters on the performance of the immiscible ASAG flooding.
6.2 Effect of ASAG Slug Ratio
ASAG slug ratio means the ratio of the PV of chemical solution to the PV of CO2
gas injected in each ASAG cycle. In order to study the effect of different ASAG slug ratio
on the oil recovery efficiency, two core flooding experiments were performed with the slug
ratios of 2:1 and 1:2. The ASAG I experiment was carried out using the first chemical
formulation (0.3wt% SDS + 1wt% Na2CO3) with the slug ratio of 1:1. For the 2:1 slug
ratio experiment, 0.167 PV gas/CO2 and 0.333 PV AS slug were alternately injected per
cycle during ASAG flooding keeping other operating conditions the same as in ASAG I.
Thus liquid volume was increased per cycle and its effect on the oil recovery was studied.
Fig. 6.1 (a) shows the cumulative oil recovery and ΔP across the core plug versus the PV
of fluid injected with 2:1 slug ratio. The oil recovery achieved was 20.05 %OOIP, which is
lower than ASAG I (23.85 %OOIP). The average ΔP also dropped to 59 psi and the
corresponding MRF value decreased to 1.14. This implied that less strong foam was
formed compared to ASAG I performed with a slug ratio of 1:1. Thus increasing the
volume of chemical solution per cycle could not improve the oil recovery factor. The
higher volume of chemical solution results in the early breakthrough of the chemical
solution leading to a decrease in the Evo and consequently low oil recovery. Moreover, with
the increase in the volume of chemical solution the fraction of gas in the injected fluid was
reduced which dispersed the gas in the aqueous phase. As the gas was held in the aqueous
phase, the injected gas was unable to contact the residual oil in the pores of the core plug,
reducing the microscopic displacement efficiency (Edo) [66].
The effect of gas volume increase per cycle during the ASAG process was
observed by changing the slug ratio to 1:2. This was accomplished by injecting 0.333 PV
TH-2437_126107015

Chapter 6 Key Parameters Influencing ASAG Flooding
129
gas/CO2 and 0.167 PV of AS slug alternately in each ASAG cycle. Fig. 6.1(b) shows the
cumulative oil recovery and ΔP across the core plug versus the PV of fluid injected with
1:2 slug ratio. The oil recovery obtained was 21.11% OOIP, which is less than the recovery
with the slug ratio of 1:1 but more than with the slug ratio of 2:1. The average ΔP during
the process was 61.50 psi, and the corresponding MRF value was 1.19 Table 6.1). This
implied that stronger foam was generated when the gas volume was increased during the
cycle and hence the comparatively higher oil recovery. However, by increasing the gas
volume the amount of chemical solution available to mobilize residual oil decreased
resulting in reduced Edo. Furthermore, an increase of injected gas caused early gas
breakthrough reducing the Evo. Because of these reasons, lower oil recovery was obtained
compared to the slug ratio of 1:1. Thus, among the three ASAG slug ratios, the most
suitable injection scheme for ASAG flooding was 1:1 as the highest oil recovery and
strongest foam were generated with this slug ratio. Salehi et al. [66] reported the
achievement of maximum oil recovery efficiency with SAG ratio of 1:1 at which both the
Edo and Evo were high. Han and Gu [225] on the basis of their study on miscible WAG
concluded that WAG slug ratio of 1:1 was especially suitable due to high oil recovery and
production rate combined with moderate CO2 consumption. Other researchers also
observed that 1:1 slug ratio was optimum for WAG process [226-228]. However, Rahimi
et al. [53] have reported that 2:1 WAG ratio was best suitable for their study on miscible
CO2-WAG which resulted in the highest oil recovery, high oil production rate, and low
CO2 consumption.
TH-2437_126107015
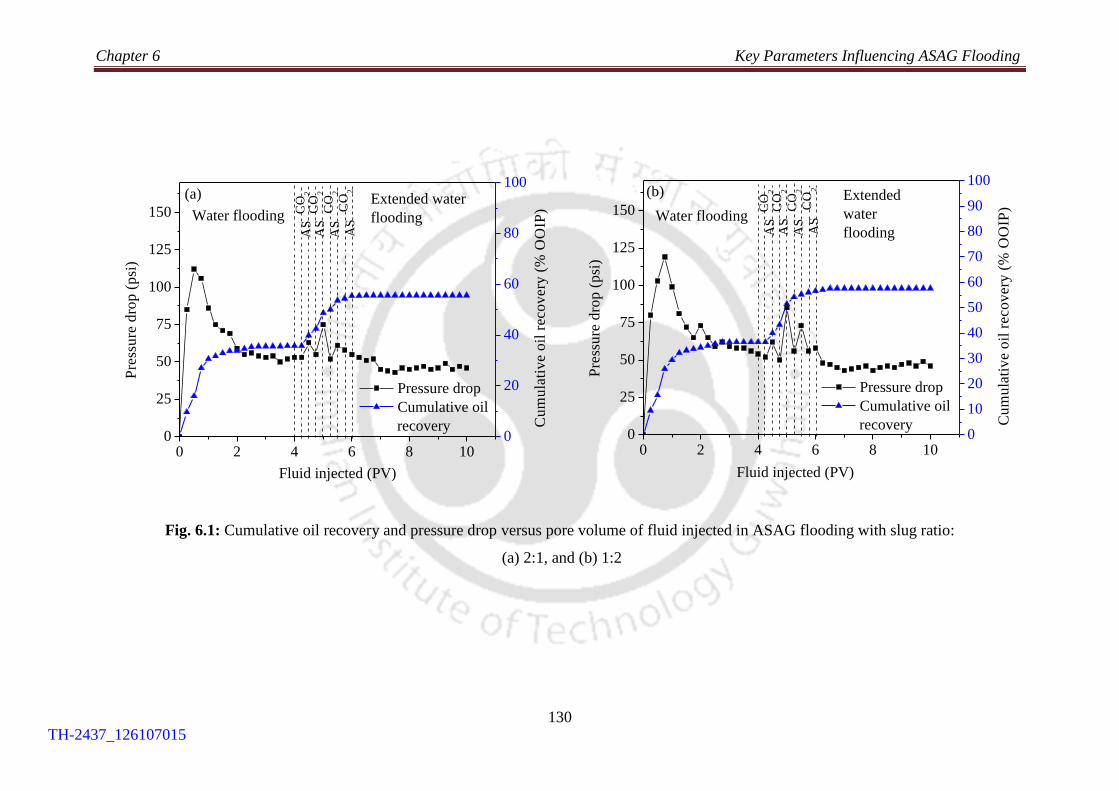
Chapter 6 Key Parameters Influencing ASAG Flooding
130
Fig. 6.1: Cumulative oil recovery and pressure drop versus pore volume of fluid injected in ASAG flooding with slug ratio:
(a) 2:1, and (b) 1:2
0 2 4 6 8 100
25
50
75
100
125
150
(a)
Fluid injected (PV)
Pre
ssu
re d
rop
(p
si)
Water floodingExtended water
flooding
AS
AS
AS
Pressure drop
Cumulative oil
recovery
CO
2A
SC
O2
CO
2
CO
2
0
20
40
60
80
100
Cu
mu
lati
ve o
il r
eco
very
(%
OO
IP)
0 2 4 6 8 100
25
50
75
100
125
150
(b)
Fluid injected (PV)
Pre
ssu
re d
rop
(p
si)
Water flooding
Extended
water
floodingAS
AS
AS
Pressure drop
Cumulative oil
recovery
CO
2A
SC
O2
CO
2
CO
2
0
10
20
30
40
50
60
70
80
90
100
Cu
mu
lati
ve o
il r
eco
very
(%
OO
IP)
TH-2437_126107015

Chapter 6 Key Parameters Influencing ASAG Flooding
131
Table 6. 1: Summary of core flooding experiments evaluating the effects of ASAG slug ratio, slug size, and injection scheme
Sl.
No. Description
(%)
K
(mD)
Saturation
(%)
Fluid Injected
(PV)
Avg.
ΔP
MRF Recovery
(% OOIP)
Kabs Soi Swc WF EOR EWF (psi) WF EOR Total
1
ASAG I
Slug ratio (1:1)
Slug size (0.25)
GAC
20.27 6.87 74.21 25.79 4.00 2.00 4.00 65.75 1.27
35.94
23.85
59.79
2
Slug ratio
(2:1)
20.73 5.72 73.17 26.83 4.00 2.00 4.00 59.00 1.14
35.56
20.05
55.61
3
Slug ratio
(1:2)
20.49 6.10 72.14 27.86 4.00 2.00 4.00 61.50 1.19
36.48
21.11
57.59
4 Slug size
(0.33) 20.51 5.97 73.8 26.2 4.00 1.98 4.00 59.50 1.16
36.65
19.74
56.39
5 Slug size
(0.50) 20.62
5.25
75.13 24.87
4.00
2.00
4.00 55.13 1.07
35.03
17.59
52.62
6
Slug size
(1.00)
20.73 6.10 76.91 23.09
4.00
2.00
4.00 53.38 1.04
34.39
12.64
50.66
7 CAG 20.37 6.35 77.15 22.85 4.00 2.00 4.00 60.24 1.17
35.42
19.78
55.20
TH-2437_126107015
Chapter 6 Key Parameters Influencing ASAG Flooding
132
6.3 Effect of ASAG Slug Size
Three core flooding experiments performed under similar experimental conditions
with different ASAG slug size or cycle frequency were compared with the performance of
ASAG I. The aim was done to study the effect of various slug sizes on the performance of
ASAG flooding. These experiments were conducted with the same slug ratio of 1:1 and
total fluid injection of 2 PV, but with different slug sizes of 0.33, 0.5, and 1 PV. Slug size
means the PV of the fluid (AS formulation or gas/CO2) injected per cycle. For optimal oil
recovery with the best utilization of injected fluids, injection of the chemical or the gas
slug in the correct volume during the ASAG process is desirable. The cumulative oil
recovery and the ΔP data of the three experiments are shown in Figure 6.2 and Table 6.1.
The additional oil recoveries of 19.74%, 17.59%, and 13.27% OOIP were achieved with
slug sizes of 0.33 PV, 0.5 PV, and 1 PV respectively. These oil recoveries were lower
than ASAG I (23.85 %OOIP) performed with the slug size of 0.25 PV. Thus, slug size
affected the oil recovery by ASAG flooding. More specifically, higher oil recovery by
ASAG flooding was achieved with a smaller slug size. This was probably due to the fact
that with smaller slug size (consequently, more cycles) better contacts between the
chemical solution and CO2 gas were possible which improved foam generation. Increasing
the slug size, on the other hand, decreases the Evo due to earlier fluid breakthrough.
However, too small a slug size raises the operating cost as the higher cycle frequency will
require the fluids to be alternately injected more frequently [225]. Fig. 6.2 also shows that
the experiment with the largest ASAG slug size of 1 PV developed the lowest ΔP peak
compared with smaller slug sizes. The average ΔPs recorded were 65.75 psi, 59.91 psi,
55.00 psi, and 43.52 psi respectively for slug sizes of 0.25 PV, 0.33 PV, 0.5 PV, and 1 PV
respectively. The corresponding MRF values were 1.27, 1.16, 1.07, and 1.04 respectively.
Thus, using smaller slug size resulted in better foaming behavior during ASAG flooding
TH-2437_126107015

Chapter 6 Key Parameters Influencing ASAG Flooding
133
and hence improved mobility control. The results indicated that slug size of 0.25 PV was
more appropriate for ASAG flooding of this study. Majidaie et al. [61] observed that the
optimum slug size for chemically enhanced water alternating gas (CWAG) injection was
around 0.25 PV which leads to maximum oil recovery. Chen and Reynolds [229] made a
similar observation in the case of WAG flooding technique that shorter cycle time, i.e.
more cycles, reduces the segregation of injected water and gas. Gravity segregation was
detrimental to the performance of WAG flooding processes as it yields poorer Evo and Edo.
Hussain et al. [230] found that the application of multiple-cycles SAG floods instead of
single-cycle SAG results in a more stable foam front, leading to a more efficient oil
displacement. Han and Gu [225] also reported that with a smaller slug size, higher oil
recovery factor for miscible CO2-WAG flooding was achievable.
6.4 Effect of Injection Scheme
Core flooding experiments were performed to compare the effect of different
ASAG injection scheme on the oil recovery. Injection scheme of the ASAG process refers
to the order of AS and gas/CO2 slug injection immediately following secondary water
flooding – gas alternated chemical (GAC) or chemical alternated gas (CAG). While ASAG
I was conducted in the GAC injection scheme, the other ASAG flooding experiment was
performed in the CAG injection mode. Along with other experimental conditions, in both
the experiments the slug ratio (1:1) and slug size (0.25 PV) were maintained the same. Fig.
6.3 shows the cumulative oil recovery and ΔP data of the ASAG flooding experiment in
CAG injection mode. The oil recovery by GAC injection scheme (23.85 %OOIP) was
found to be higher than the CAG injection (19.78 %OOIP). The higher oil recovery of
GAC injection scheme can be attributed to the hysteresis effect of drainage and imbibition
processes. As the waterflooding is primarily an imbibition process, the residual oil left
behind are trapped in the larger pore spaces of the core plug [231].
TH-2437_126107015

Chapter 6 Key Parameters Influencing ASAG Flooding
134
Fig. 6.2: Cumulative oil recovery and pressure drop versus pore volume of fluid injected in ASAG flooding with slug size of (a) 0.33 PV;
(b) 0.5 PV; and (c) 1 PV
0 2 4 6 8 100
25
50
75
100
125
150
AS
AS
Pressure drop
Cumulative oil
recovery
Fluid injected (PV)
Pre
ssu
re d
rop
(p
si)
CO
2A
S
CO
2
CO
2
Water
flooding
Extended
water
flooding
(a)
0
20
40
60
80
100
Cu
mu
lati
ve
oil
rec
ov
ery
(%
OO
IP)
0 2 4 6 8 10
50
75
100
125
150
AS
AS
Pressure drop
Cumulative oil
recovery
Fluid injected (PV)
Pre
ssu
re d
rop
(p
si)
CO
2
CO
2
Water
flooding
Extended
water
flooding
(b)
0
20
40
60
80
100
Cu
mu
lati
ve
oil
rec
ov
ery
(%
OO
IP)
0 2 4 6 8 100
25
50
75
100
125
150
AS
Pressure drop
Cumulative oil
recovery
Fluid injected (PV)
Pre
ssu
re d
rop
(p
si)
CO
2
Water
flooding
Extended
water
flooding
(c)
0
20
40
60
80
100
Cu
mu
lati
ve
oil
rec
ov
ery
(%
OO
IP)
TH-2437_126107015
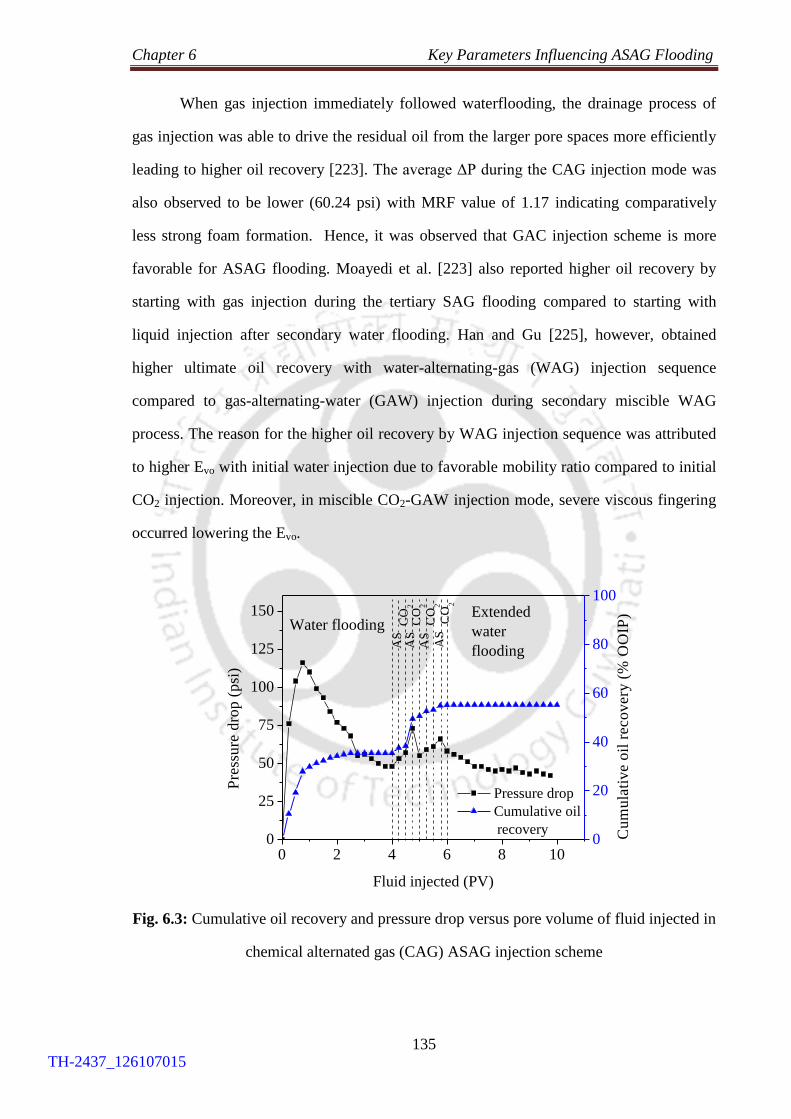
Chapter 6 Key Parameters Influencing ASAG Flooding
135
When gas injection immediately followed waterflooding, the drainage process of
gas injection was able to drive the residual oil from the larger pore spaces more efficiently
leading to higher oil recovery [223]. The average ΔP during the CAG injection mode was
also observed to be lower (60.24 psi) with MRF value of 1.17 indicating comparatively
less strong foam formation. Hence, it was observed that GAC injection scheme is more
favorable for ASAG flooding. Moayedi et al. [223] also reported higher oil recovery by
starting with gas injection during the tertiary SAG flooding compared to starting with
liquid injection after secondary water flooding. Han and Gu [225], however, obtained
higher ultimate oil recovery with water-alternating-gas (WAG) injection sequence
compared to gas-alternating-water (GAW) injection during secondary miscible WAG
process. The reason for the higher oil recovery by WAG injection sequence was attributed
to higher Evo with initial water injection due to favorable mobility ratio compared to initial
CO2 injection. Moreover, in miscible CO2-GAW injection mode, severe viscous fingering
occurred lowering the Evo.
Fig. 6.3: Cumulative oil recovery and pressure drop versus pore volume of fluid injected in
chemical alternated gas (CAG) ASAG injection scheme
0 2 4 6 8 100
25
50
75
100
125
150
Fluid injected (PV)
Pre
ssu
re d
rop
(p
si)
Water floodingExtended
water
flooding
0
20
40
60
80
100
Cu
mu
lati
ve o
il r
eco
very
(%
OO
IP)
AS
AS
AS
Pressure drop
Cumulative oil
recovery
CO
2
AS
CO
2
CO
2
CO
2
TH-2437_126107015

Chapter 6 Key Parameters Influencing ASAG Flooding
136
6.5 Effect of Gas Injection Rate
ASAG core flooding experiments were carried out to investigate the effect of
different gas/CO2 injection rates on the oil recovery. The experiments were conducted with
the same ASAG slug ratio of 1:1 and slug size of 0.25 PV, while keeping the total fluid
volume injected constant at 2 PV. The experiments were performed at gas/CO2 injection
rates of 0.2 ml/min, 0.5 ml/min, 1 ml/min and 2 ml/min. The liquid was injected at a
constant pressure during these tests. The cumulative oil recoveries of the experiments are
shown in Table 6.2 and Fig. 6.4. It was observed CO2 injection rate influenced the oil
recovery by ASAG flooding. The oil recovery decreased slightly (from 23.85% to 22.38%
OOIP) as the gas injection rate was increased from 0.2 ml/min to 0.5 ml/min. However,
increasing the injection rate to 1 ml/min and 2 ml/min significantly decreased the oil
recovery to 15.86% and 15.31% OOIP respectively. At higher gas injection rate, early gas
breakthrough occurs due to viscous fingering effect and the consequently low Evo.
Moreover, a higher injection rate lowers the possibility of proper contact between the
surfactant solution and the CO2 gas in the core plug. As a result, a reduction in foam
generation during the ASAG process probably took place. To study the foaming behavior
at lower and higher gas flow rates, the ΔP profiles of 0.2 ml/min and 2 ml/min injection
rates were studied and presented in Fig. 6.5. Higher average ΔP of 65.75 psi (MRF = 1.27)
for the 0.2 ml/min injection rate experiment was recorded compared to 57.75 psi (MRF =
1.12) for the 2 ml/min injection rate. This was an indication of improper foam generation
and propagation in the latter. Thus, residual oil recovery by ASAG flooding was dependent
on the gas injection rate and there was an optimum rate of gas/CO2 injection, which in this
case was 0.2 ml/min. Injecting the gas below this optimum rate is also likely to decrease
the oil recovery because lower injection rates induce lower ΔPs so the generated foam
would not be able to totally sweep the residual oil in place. Further, if injection rates are
too low gravity overriding effect becomes significant which would decrease the volume of
the residual oil contacted by the injected CO2 gas [232]. Safarzadeh et al. [233] reported
that oil recovery efficiency of SAG flooding performed in sand packs was a function of the
TH-2437_126107015

Chapter 6 Key Parameters Influencing ASAG Flooding
137
injection rate. An early breakthrough was observed at a higher injection rate (0.25 ml/min)
and the highest oil recovery of 87% was obtained at the optimal injection rate of 0.2
ml/min.
Fig. 6.4: Cumulative oil recovery versus pore volume of fluid injected in ASAG flooding
with different gas injection rates
Fig. 6.5: Pressure drop versus pore volume of fluid injected in ASAG flooding with low
and high gas injection rates
0 2 4 6 8 100
20
40
60
80
100
ASAG
Cu
mu
lati
ve o
il r
eco
very
(%
OO
IP)
Fluid injected (PV)
0.2 ml/min
0.5 ml/min
1 ml/min
2 ml/min
Water
flooding
Extended
water flooding
0 2 4 6 8 100
25
50
75
100
125
150
Pre
ssu
re d
rop
(p
si)
Fluid injected (PV)
0.2 ml/min
2 ml/min
Water
floodingASAG Extended
water flooding
TH-2437_126107015
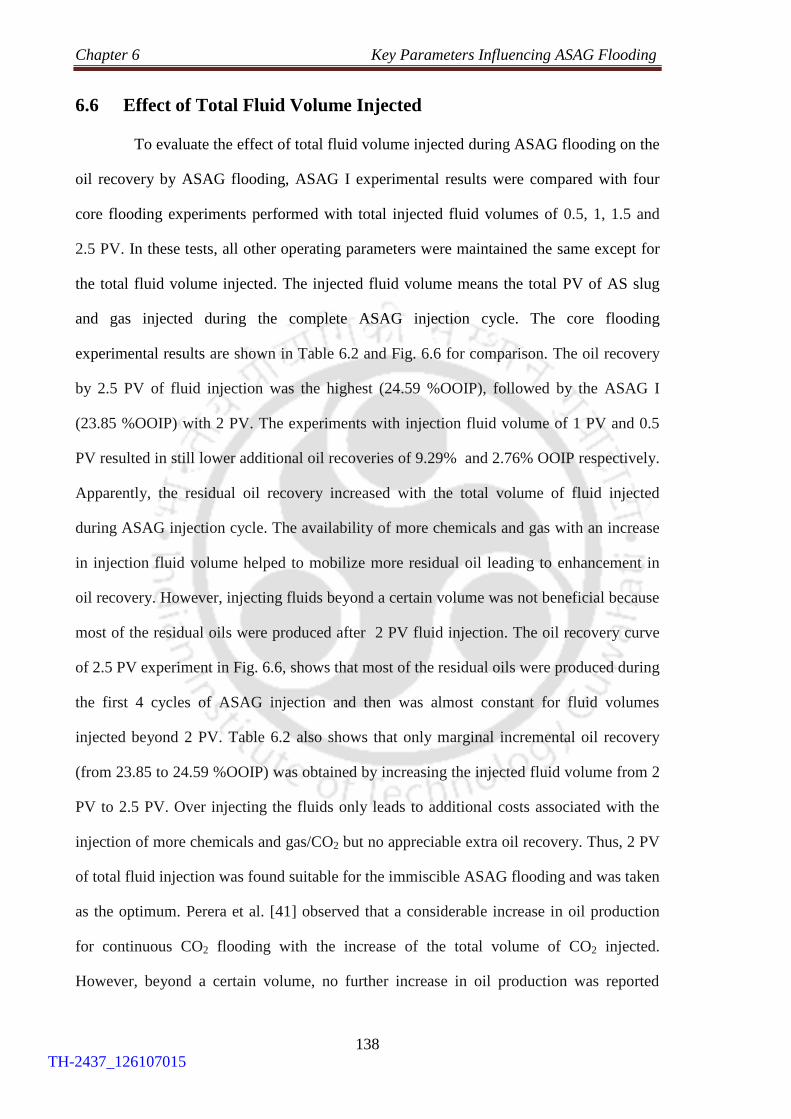
Chapter 6 Key Parameters Influencing ASAG Flooding
138
6.6 Effect of Total Fluid Volume Injected
To evaluate the effect of total fluid volume injected during ASAG flooding on the
oil recovery by ASAG flooding, ASAG I experimental results were compared with four
core flooding experiments performed with total injected fluid volumes of 0.5, 1, 1.5 and
2.5 PV. In these tests, all other operating parameters were maintained the same except for
the total fluid volume injected. The injected fluid volume means the total PV of AS slug
and gas injected during the complete ASAG injection cycle. The core flooding
experimental results are shown in Table 6.2 and Fig. 6.6 for comparison. The oil recovery
by 2.5 PV of fluid injection was the highest (24.59 %OOIP), followed by the ASAG I
(23.85 %OOIP) with 2 PV. The experiments with injection fluid volume of 1 PV and 0.5
PV resulted in still lower additional oil recoveries of 9.29% and 2.76% OOIP respectively.
Apparently, the residual oil recovery increased with the total volume of fluid injected
during ASAG injection cycle. The availability of more chemicals and gas with an increase
in injection fluid volume helped to mobilize more residual oil leading to enhancement in
oil recovery. However, injecting fluids beyond a certain volume was not beneficial because
most of the residual oils were produced after 2 PV fluid injection. The oil recovery curve
of 2.5 PV experiment in Fig. 6.6, shows that most of the residual oils were produced during
the first 4 cycles of ASAG injection and then was almost constant for fluid volumes
injected beyond 2 PV. Table 6.2 also shows that only marginal incremental oil recovery
(from 23.85 to 24.59 %OOIP) was obtained by increasing the injected fluid volume from 2
PV to 2.5 PV. Over injecting the fluids only leads to additional costs associated with the
injection of more chemicals and gas/CO2 but no appreciable extra oil recovery. Thus, 2 PV
of total fluid injection was found suitable for the immiscible ASAG flooding and was taken
as the optimum. Perera et al. [41] observed that a considerable increase in oil production
for continuous CO2 flooding with the increase of the total volume of CO2 injected.
However, beyond a certain volume, no further increase in oil production was reported
TH-2437_126107015
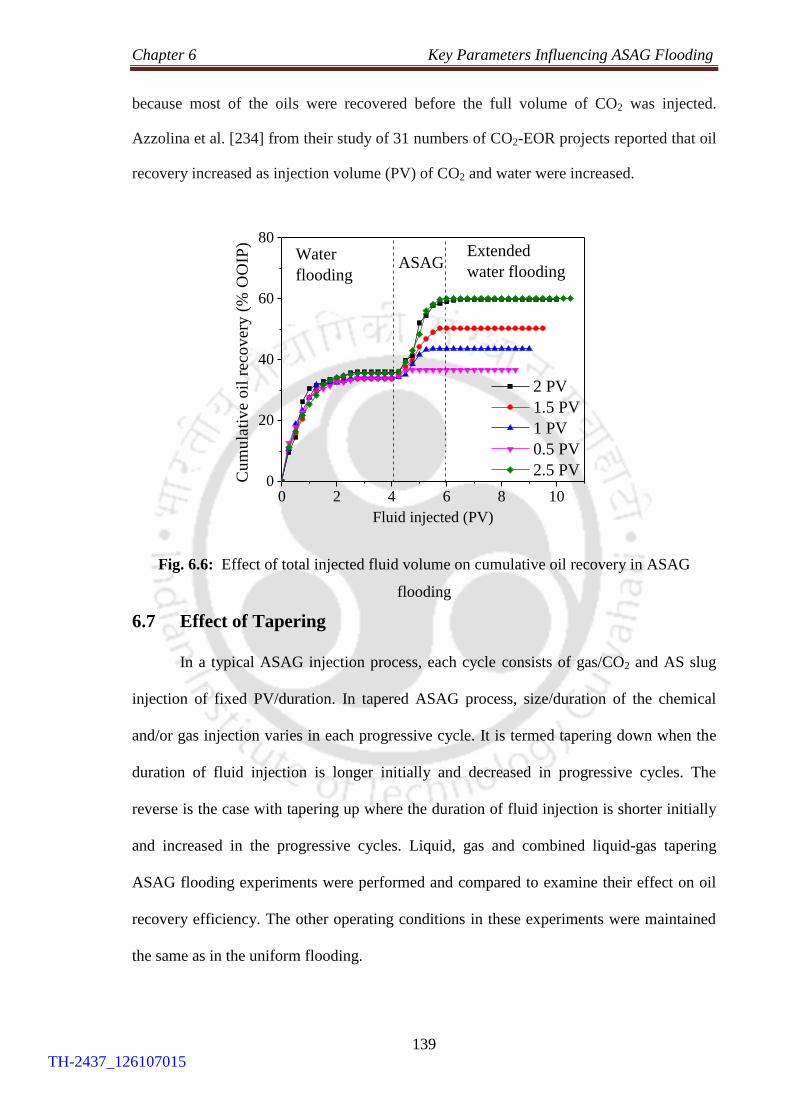
Chapter 6 Key Parameters Influencing ASAG Flooding
139
because most of the oils were recovered before the full volume of CO2 was injected.
Azzolina et al. [234] from their study of 31 numbers of CO2-EOR projects reported that oil
recovery increased as injection volume (PV) of CO2 and water were increased.
Fig. 6.6: Effect of total injected fluid volume on cumulative oil recovery in ASAG
flooding
6.7 Effect of Tapering
In a typical ASAG injection process, each cycle consists of gas/CO2 and AS slug
injection of fixed PV/duration. In tapered ASAG process, size/duration of the chemical
and/or gas injection varies in each progressive cycle. It is termed tapering down when the
duration of fluid injection is longer initially and decreased in progressive cycles. The
reverse is the case with tapering up where the duration of fluid injection is shorter initially
and increased in the progressive cycles. Liquid, gas and combined liquid-gas tapering
ASAG flooding experiments were performed and compared to examine their effect on oil
recovery efficiency. The other operating conditions in these experiments were maintained
the same as in the uniform flooding.
0 2 4 6 8 100
20
40
60
80
Cu
mu
lati
ve
oil
rec
ov
ery
(%
OO
IP)
Fluid injected (PV)
2 PV
1.5 PV
1 PV
0.5 PV
2.5 PV
Water
floodingASAG
Extended
water flooding
TH-2437_126107015

Chapter 6 Key Parameters Influencing ASAG Flooding
140
Table 6.2: Summary of core flooding experiments evaluating the effects of gas injection rate and total injection volume
Sl.
No.
Description of
ASAG process
Porosity
(%)
K
(mD)
Saturation
(%)
Fluid Injected
(PV)
Recovery
(% OOIP)
Kabs Soi Swc WF EOR EWF WF ASAG Total
1
ASAG I
Gas rate (0.2 ml/min)
Injection volume (2 PV)
20.27 6.87 74.21 25.79 4.00 2.00 4.00 35.94
23.85
59.79
2 Gas rate (0.5 ml/min) 20.14 5.85 76.34 23.66 4.00 2.00 4.00 36.86
22.38
59.24
3 Gas rate (1 ml/min) 20.16 6.53 76.53 23.47 4.00 2.00 4.00
35.18
15.86
51.04
4 Gas rate(2 ml/min) 20.21 6.06 75.78 24.22 4.00 2.00 4.00
35.95
15.31
51.26
5 Injection volume (0.5 PV) 20.49 6.10 77.35 22.65 4.00 0.5 4.00
33.95
2.76
36.71
6 Injection volume (1 PV) 20.27 5.99 76.02 23.98 4.00 1.00 4.00
34.28
9.29
43.57
7 Injection volume (1.5 PV) 20.09 6.31 75.23 24.77 4.00 1.50 4.00
33.71
16.61
50.32
8 Injection volume (2.5 PV) 20.52 6.06 75.87 24.13 4.00 2.50 4.00
35.57
24.59
60.16
TH-2437_126107015

Chapter 6 Key Parameters Influencing ASAG Flooding
141
In order to examine the effect of liquid tapering on residual oil recovery, two
tapered ASAG flooding experiments were performed and their results were compared with
the uniform flooding experiment. The total volume of gas/CO2 and AS formulation
alternately injected was fixed at 2 PV. In uniform ASAG flooding as in ASAG I, each
cycle of ASAG injection consisted of fixed volume (0.25 PV) of AS slug and CO2 gas
injection, whereas, in liquid tapering, the volume of liquid injection was varied in each
progressive cycle keeping the gas volume constant. In tapering down, the volume of liquid
injection was larger at first and decreased in subsequent cycles. In this injection mode,
during the ASAG injection, the gas/CO2 slug size/volume was kept constant at 0.25 PV
whereas the AS slug volume was decreased in each progressive cycle in the sequence 0.4,
0.3, 0.2 and 0.1 PV. In the tapering up mode, the liquid volume increased in each
progressive cycle in the sequence of 0.1, 0.2, 0.3 and 0.4 PV. Fig. 6.7 shows the
cumulative oil recoveries and the ΔP versus the PV of fluid injected during the liquid
tapering ASAG flooding experiments. The liquid tapering up ASAG flooding resulted in
better incremental oil recovery (27.48 %OOIP) compared to liquid tapering down injection
(25.72 %OOIP). However, the additional oil produced by both these tapered injection
schemes were higher than the uniform ASAG flooding (23.85 %OOIP). Thus, liquid
tapering had a positive effect on the oil recovery by ASAG flooding. In liquid tapering up
method, the slug ratio was low in the first cycle which means that the volume of the
injected chemical solution was lower while gas/CO2 volume was higher. With higher
initial gas saturation, the CO2 injected into the core plug could cause maximum dissolution
with crude oil. This resulted in an increase in the relative permeability of residual oil in the
core plug probably due to the oil swelling and viscosity reduction caused by the dissolution
of injected CO2 gas. When the chemical slug was alternately injected, the displacement
efficiency was further enhanced because of IFT reduction and foam formation. As the
TH-2437_126107015

Chapter 6 Key Parameters Influencing ASAG Flooding
142
liquid volume increased towards the end of the ASAG injection during liquid tapering up,
the increase in liquid volume helped to control the early gas/CO2 breakthrough by reducing
the relative permeability to gas.
To study the effect of gas tapering on ASAG performance, ASAG flooding
experiments were performed in gas tapering down and gas tapering up modes. In the gas
tapering down ASAG injection, the core plug with residual oil was subjected to 4 cycles of
CO2 and AS slug alternate injection. The size of chemical slug injected was kept constant
at 0.25 PV in each cycle, while gas slug size was decreased progressively in the sequence
0.4, 0.3, 0.2 and 0.1 PV. In the other experiment, the gas tapering up ASAG injection was
applied where the gas slug size was increased progressively in sequence 0.1, 0.2, 0.3 and
0.4 PV. The total PV of fluid injected during the ASAG cycles was kept constant at 2 PV.
The cumulative oil recovery and ΔP as a function of the PV of fluid injected during the gas
tapering down and gas tapering up ASAG flooding processes are shown in Fig. 6.8 (a) -
(b). The additional oil recoveries of 26.98 % and 24.75 % OOIP were obtained during the
gas tapering down and tapering up ASAG injection respectively. These recoveries were
better than the recovery by the uniform ASAG injection (ASAG I, 23.85 %OOIP). In
comparison, the gas tapering down ASAG injection was found to be superior in terms of
oil recovery. By injecting more gas in the first cycle maximum dissolution of CO2 gas with
crude oil and efficient use of gas most likely take place leading to the betterment of Evo
[235]. The trapping of the gas/CO2 also resulted in improved oil recovery due to more
stable foam formed during the next cycle of AS slug and gas injection [236]. More stable
foam formation was evident from the increase in the average ΔP to 68.38 psi (MRF = 1.33)
during gas tapering down injection scheme. The average ΔP during the tapering up scheme
was 67.25 psi (MRF = 1.30) – higher than the uniform ASAG injection (MRF = 1.27). As
the water-to-gas injection volume ratio increases towards the end of the gas tapering down
ASAG process, this also helps to control the mobility of the gas [62].
TH-2437_126107015

Chapter 6 Key Parameters Influencing ASAG Flooding
143
The combined effect of applying the gas tapering down and the liquid tapering up
injection in a single ASAG flooding process was also examined to observe the
enhancement in oil recovery. Following secondary water flooding, the ASAG injection
was performed in such a manner that the gas slug size decreased progressively in the
sequence of 0.4, 0.3, 0.2 and 0.1 PV, while the liquid volume increased as 0.1, 0.2, 0.3 and
0.4 PV. The cumulative oil recovery and ΔP data are shown in Fig. 6.9 and Table 6.3. The
additional oil produced was 29.35 %OOIP, which was an improvement of 5.50 %OOIP
over the uniform flooding. Thus, the synergic combination of gas and liquid tapering can
be successfully applied to optimize the ASAG flooding through efficient use of the
injected fluids. The MRF value also increased in favor of combined tapering ASAG
flooding from 1.27 to 1.40 compared to uniform fluid injection. This was an indication of
improvement in mobility control which in turn caused better displacement of the residual
oil. Srivastava and Mahli [237] showed that the displacement efficiency in both tapering
up (20.73%) and tapering down (23.84%) WAG injection process was higher than the
normal (19.3%) WAG process. The better recovery was due to improved Evo, better
mobility control, and increased oil relative permeability in the pores of the core sample.
Khan et al. [235] in an effort to optimize the miscible WAG process observed the
application of tapered injection was more favorable than uniform WAG due to efficient gas
utilization, faster recovery rate, and reduction of response time. According to Tovar [238]
the application of tapered WAG could reduce the residual oil saturation from 34.88% to
10.92%. Similarly, Verma [28] reported that tapered WAG is a widely used technique that
improves process efficiency, prevents an early gas breakthrough, and improves CO2
utilization.
TH-2437_126107015

Chapter 6 Key Parameters Influencing ASAG Flooding
144
Fig. 6.7: Cumulative oil recovery and pressure drop versus pore volume of fluid injected in ASAG flooding with (a) Liquid tapering up, and (b)
Liquid tapering down
0 2 4 6 8 100
25
50
75
100
125
150
Pressure drop
Cumulative oil
recovery
Fluid injected (PV)
Pre
ssu
re d
rop
(p
si)
0
20
40
60
80
100
Cu
mu
lati
ve o
il r
eco
very
(%
OO
IP)
CO
2A
S
CO
2A
S
AS
CO
2
CO
2A
SWater flooding
Extended
water
flooding
(a)
0 2 4 6 8 100
25
50
75
100
125
150
Pressure drop
Cumulative oil
recovery
Fluid injected (PV)
Pre
ssu
re d
rop
(p
si)
0
20
40
60
80
100
Cu
mu
lati
ve o
il r
eco
very
(%
OO
IP)
CO
2A
S
CO
2A
S
AS
CO
2
CO
2A
SWater flooding
Extended
water
flooding
(b)
TH-2437_126107015

Chapter 6 Key Parameters Influencing ASAG Flooding
145
Fig. 6.8: Cumulative oil recovery and pressure drop versus pore volume of fluid injected in ASAG flooding with (a) Gas tapering down, and
(b) Gas tapering up
0 2 4 6 8 100
25
50
75
100
125
150
Pressure drop
Cumulative oil
recovery
Fluid injected (PV)
Pre
ssu
re d
rop
(p
si)
0
20
40
60
80
100
Cu
mu
lati
ve o
il r
eco
very
(%
OO
IP)
CO
2A
S
CO
2A
SA
SC
O2
CO
2A
SWater flooding
Extended
water
flooding
(a)
0 2 4 6 8 100
25
50
75
100
125
150
Pressure drop
Cumulative oil
recovery
Fluid injected (PV)
Pre
ssu
re d
rop
(p
si)
0
20
40
60
80
100
Cu
mu
lati
ve o
il r
eco
very
(%
OO
IP)
CO
2A
S
CO
2A
S
AS
CO
2
CO
2A
SWater floodingExtended
water
flooding
(b)
TH-2437_126107015

Chapter 6 Key Parameters Influencing ASAG Flooding
146
Fig. 6.9: Cumulative oil recovery and pressure drop versus pore volume of fluid injected in
ASAG flooding with combined liquid tapering up and gas tapering down
6.8 Effect of Porosity/Permeability of Core Plug
When foam flow through reservoir rock, it develops a unique property called the
selective mobility reduction (SMR), which causes it to reduce the mobility of gas by a
greater fraction in high permeability regions of the reservoir compared to in the low
permeability regions. This happens due to the formation of stronger foam in the high
permeability zones where it appears to be more viscous than in low permeability zones.
The stronger foam in the high permeability zones is instrumental in the diversion of fluid
to the low permeability zones resulting in the smoothening of reservoir heterogeneities [57,
239, 240]. If the foam generated during ASAG flooding exhibits such a property then the
process can be successfully applied in oil reservoirs which in most cases are
heterogeneous.
0 2 4 6 8 100
25
50
75
100
125
150
Pressure drop
Cumulative oil
recovery
Fluid injected (PV)
Pre
ssu
re d
rop
(p
si)
0
20
40
60
80
100
Cu
mu
lati
ve o
il r
eco
very
(%
OO
IP)
CO
2A
S
CO
2A
S
AS
CO
2
CO
2A
SWater flooding
Extended
water
flooding
TH-2437_126107015

Chapter 6 Key Parameters Influencing ASAG Flooding
147
Table 6.3: Summary of core flooding experiments evaluating the effect of tapering during ASAG flooding
Sl.
No. Description
(%)
K
(mD)
Saturation
(%)
Fluid Injected
(PV)
Avg.
ΔP
MRF
Recovery
(% OOIP)
Kabs Soi Swc WF EOR EWF (psi) WF EOR Total
1 ASAG I
Uniform
injection
20.27 5.87 74.21 25.79 4.00 2.00 4.00 65.75 1.27
35.94
23.85
59.79
2
Liquid
tapering
down
20.68
5.99
74.01
25.99
4.00
2.00
4.00
68.63
1.33
35.95
25.72
58.98
3 Liquid
tapering up 20.21 6.35 72.64 27.34 4.00 2.00 4.00 69.50 1.35
36.86
27.48
64.34
4
Gas
tapering
down
20.56 6.49 72.86 27.14 4.00 2.00 4.00 68.38 1.33
35.95
26.98
61.70
5
Gas
tapering up
20.47 6.96 73.55 26.45 4.00 2.00 4.00 67.25 1.30
36.86
24.75
61.24
6
Combined
gas-liquid
tapering
20.38
6.75
73.13
26.87
4.00
2.00
4.00
72.00
1.40
36.10
29.35
62.45
TH-2437_126107015

Chapter 6 Key Parameters Influencing ASAG Flooding
148
In order to study the effect of rock porosity/permeability on ASAG flooding
performance, two core flooding experiments were performed with core plugs of different
porosity/permeability values. The first experiment was performed on a core plug of lower
porosity/permeability (12.23% and 2.25 mD) and the second on a core plug of higher
porosity/permeability (27.42% and 30.37 mD). All other experimental conditions in these
ASAG flooding experiments were maintained the same as ASAG I except the core plugs of
different porosity /permeability values were used. Fig. 6.10 (a) - (b) shows the cumulative
oil recovery and ΔP as a function of the PV of injected fluid. The oil recoveries by
secondary water flooding were 38.83 %OOIP and 30.41 %OOIP respectively for the lower
and higher porosity/permeability core plugs. The water flooding oil recovery data for lower
and higher porosity cores were found to be inversely proportional to their porosities. This
agrees well with the observations reported by other workers [241]. The performance of the
tertiary ASAG injection was better with oil recovery of 27.54% OOIP for the core plug
with higher porosity/permeability compared to 18.03% OOIP for the lower
porosity/permeability core plug (Table 6.4). Although the final cumulative oil recoveries
for both the core plugs were comparable, ASAG flooding in the higher
porosity/permeability core plug exhibited a higher average ΔP of 72.00 psi (MRF = 1.39)
compared to 59.25 psi (MRF = 1.18) in case of lower porosity/permeability core plug. The
higher MRF value was indicative of stronger foam formation in the more permeable core
plugs and the lower MRF value implied comparatively weaker foam in less permeable core
plugs. The stronger foam formed in the high permeability core plug provided better
mobility control and hence higher oil recovery was obtained. Thus, it can be concluded that
the SMR property was exhibited by in-situ foam generated during immiscible ASAG
flooding. So, it is expected that ASAG flooding can reduce the detrimental effects of field-
scale reservoir heterogeneity through the formation of in-situ foam having the property of
SMR.
TH-2437_126107015

Chapter 6 Key Parameters Influencing ASAG Flooding
149
Fig. 6.10: Cumulative oil recovery and pressure drop versus pore volume of fluid injected in ASAG flooding with (a) Low porosity/permeability
core plug; (b) High porosity/permeability core plug
0 2 4 6 8 100
25
50
75
100
125
150
Fluid injected (PV)
Pre
ssu
re d
rop
(p
si)
Pressure drop
Cumulative oil
recovery
Water flooding
Extended
water
flooding
(a)
AS
AS
AS
CO
2A
SC
O2
CO
2
CO
2
0
20
40
60
80
Cu
mu
lati
ve o
il r
eco
very
(%
OO
IP)
0 2 4 6 8 100
25
50
75
100
125
150
Fluid injected (PV)
Pre
ssu
re d
rop
(p
si)
Pressure drop
Cumulative oil
recovery
Water flooding
Extended
water
flooding
(b)
AS
AS
AS
CO
2A
S
CO
2
CO
2
CO
2
0
20
40
60
80
Cu
mu
lati
ve o
il r
eco
very
(%
OO
IP)
TH-2437_126107015

Chapter 6 Key Parameters Influencing ASAG Flooding
150
Table 6.4: Summary of core flooding experiments evaluating the effect of rock porosity/permeability on ASAG flooding
Sl.
No. Description
(%)
K
(mD)
Saturation
(%)
Fluid Injected
(PV)
Avg.
ΔP
MRF
Recovery
(% OOIP)
Kabs Soi Swc WF EOR EWF (psi) WF EOR Total
1
Lower
Porosity/permeability
core plug
12.23 2.25 70.02 29.98 4.00 2.00 4.00 59.25 1.18
38.83
18.03
56.86
2
Higher
porosity/permeability
core plug
27.42
30.37
78.23
21.77
4.00
2.00
4.00
72.00
1.39
30.41
27.54
57.95
TH-2437_126107015

Chapter 6 Key Parameters Influencing ASAG Flooding
151
6.9 Effect of Salinity Gradient during ASAG Flooding
Additional core flooding experiment was performed to investigate the effect of
salinity gradient or brine salinity change on the oil recovery performance of ASAG
flooding. Brine salinity change implies secondary water flooding at higher brine salinity is
followed by the chemical slug (injected during the ASAG cycle) at optimal brine salinity
and finally chased by a drive at a lower brine salinity. Thus salinity variation from higher
salinity to intermediate salinity and then to lower salinity occurs in the core plug during the
flooding process. As a result, the benefits of high, moderate and low salinities can be
exploited during the flooding process. In the experiment, the oil-saturated core plug was
waterflooded with SFB of 3458 ppm salinity which resulted in oil recovery of 37.83
%OOIP. The chemical slug (containing 0.5 wt% AOS + 0.75 wt% Na2CO3) was injected at
optimal salinity (at 70% SFB salinity, 2400 ppm) during the ASAG injection, while the
salinity of the drive (EWF) was maintained at 30% SFB salinity (1000 ppm). Fig. 6.11
shows the cumulative oil recovery and ΔP data obtained during the flooding process when
salinity gradient was applied. Table 6.5 shows that the additional oil recovered by
changing brine salinity during flooding increased to 25.74 %OOIP – an increment of 3.87
%OOIP over straight salinity (ASAG II). Injection of the AS slug at optimal SFB salinity
helped achieve the lowest oil-water IFT which in turn mobilized capillary held residual oil.
An increase in the MRF value from 1.28 to 1.36 indicated stronger foam formation during
the ASAG cycle. Injecting the AS slug at a lower optimal SFB salinity has the additional
benefit of decrease surfactant retention which resulted in the availability of more surfactant
for residual oil recovery [242, 243]. Additionally, injecting the brine at lower salinity
during EWF helps to remobilize the retained surfactant in the aqueous phase [244].
Srivastava et al. [83] reported that the application of salinity change/gradient improves the
alkali-surfactant-gas (ASG) flooding by providing better foam stability through the
TH-2437_126107015

Chapter 6 Key Parameters Influencing ASAG Flooding
152
mobilization of trapped surfactants. The stronger foam was instrumental in providing better
displacement efficiency in their ASG core flooding experiment.
Fig. 6.11: Cumulative oil recovery and pressure drop versus pore volume of fluid injected
during ASAG flooding with the application of salinity gradient
0 2 4 6 8 100
25
50
75
100
125
150 Water flooding
Pressure drop
Cumulative oil
recovery
Fluid injected (PV)
Pre
ssu
re d
rop
(p
si)
0
20
40
60
80
Cu
mu
lati
ve
oil
rec
ov
ery
(%
OO
IP)Extended water
floodingAS
AS
AS
CO
2A
SC
O2
CO
2
CO
2
TH-2437_126107015

Chapter 6 Key Parameters Influencing ASAG Flooding
153
Table 6.5: Summary of core flooding experiments evaluating the effects of salinity gradient, preflushing, and combined effect
Sl.
No. Description
(%)
K
(mD)
Saturation
(%)
Fluid Injected
(PV)
Avg.
ΔP
MRF
Recovery
(% OOIP)
Kabs Soi Swc WF EOR EWF (psi) WF EOR Total
1
ASAG II
Straight salinity
No BL preflush
20.49 6.10 73.35 26.65 4.00 2.00 4.00 66.13 1.28 36.31 21.87 58.18
2
Salinity
gradient
20.67 7.38 72.02 27.98 4.00 2.00 4.00 70.25 1.36 37.83 25.74 63.57
3
BL
preflush
20.82 6.98 74.23 25.77 4.00 2.00 4.00 71.38 1.38 39.26 24.48 63.74
4
Combined
effect
20.50 7.83 73.66 26.34 4.00 2.00 4.00 74.63 1.45 38.85 30.69 69.54
TH-2437_126107015

Chapter 6 Key Parameters Influencing ASAG Flooding
154
6.10 Use of Preflush in ASAG Flooding
In foam-based EOR application, preflushing with a less costly surfactant to
precondition the reservoir is commonly practiced for improving the process economics and
efficiency [213]. Along with improving the foam generation, this method reduces the
adsorption of primary surfactant onto the reservoir rock thus maintaining better foam
propagation [245, 246]. In order to evaluate the performance of ASAG flooding with
preflushing, ASAG core flooding experiment similar to ASAG II was performed but with
1 wt% BL added to the SFB used for secondary water flooding. Fig. 6.12 and Table 6.5
show the cumulative oil recovery and the ΔP data obtained during the core flooding
experiment performed with preflushing. The results show that higher residual oil recovery
(24.48 %OOIP) as well as higher cumulative oil recovery (63.74 %OOIP) was obtained by
ASAG flooding with BL preflushing. The higher oil recoveries were possible due to a
combination of the following favorable attributes. Firstly, BL has been reported to possess
the ability to reduce oil-water IFT and thus produce extra oil [142]. Adding BL to SFB
thus resulted in higher oil recovery by secondary water flooding (39.26 %OOIP).
Secondly, preflushing the core plug with BL reduced the adsorption of surfactant onto the
reservoir rock resulting in the availability of more primary surfactant (AOS) to mobilize
the residual oil trapped by capillary forces. The dynamic adsorption experiments have
shown that preflushing with 1wt% BL could reduce the adsorption of surfactant by more
than half. Thirdly, improved foam performance was possible during ASAG injection by
preflushing with BL. The preconditioning caused the reduction of foaming agent
adsorption onto reservoir rock, which in turn lead to better foam generation and
propagation during the ASAG flooding. An increase in the MRF value to 1.38 indicated
better foam stability during ASAG flooding with BL preflushing. Thus, preflushing prior
to ASAG flooding can be applied to optimize the process by increasing the effectiveness
of the foam in improving the oil recovery. Tsau et al. [247] reported that lignosulphonate
TH-2437_126107015

Chapter 6 Key Parameters Influencing ASAG Flooding
155
could reduce the adsorption of primary foaming agent in CO2 flooding by 24 – 60 % in
Berea sandstone. They observed that preflushing the core was more effective in reducing
the surfactant adsorption than co-injecting the lignosulphonate and the foaming agent.
Fig. 6.12: Cumulative oil recovery and pressure drop versus pore volume of fluid injected
in ASAG flooding with black liquor preflushing
6.11 Combined ASAG Flooding
Finally, one additional core flooding experiment was performed with the second
chemical slug (0.5 wt% AOS + 0.75 wt% Na2CO3) incorporating all the favorable operating
conditions of ASAG flooding including the application of combined gas-liquid tapering,
salinity gradient and preflushing with BL. During secondary water flooding, 4 PV of SFB
containing 1 wt% BL was injected into the oil-saturated core plug which resulted in an oil
recovery of 38.85 %OOIP. This was followed by 2 PV of alternated gas/CO2 and AS slug
(at optimal salinity) injection in the combined gas tapering down and liquid tapering-up
mode. Fig. 6.13 shows the cumulative oil recovery and ΔP as a function of the PV of fluid
injected during the experiment. The oil recovery through the 4 cycle ASAG injection was
0 2 4 6 8 100
25
50
75
100
125
150
Pressure drop
Cumulative oil
recovery
Fluid injected (PV)
Pre
ssu
re d
rop
(p
si)
0
20
40
60
80
Cu
mu
lati
ve
oil
rec
ov
ery
(%
OO
IP)
AS
AS
AS
CO
2A
SC
O2
CO
2
CO
2
Water flooding Extended water
flooding
TH-2437_126107015

Chapter 6 Key Parameters Influencing ASAG Flooding
156
30.69 %OOIP. The ASAG injection was followed by the EWF during which 4 PV of SFB
at 1000 ppm salinity was injected. The total oil recovery including water flooding, ASAG
injection and the final EWF was 69.54 %OOIP. Compared to the ASAG II experiment,
injecting the fluids in the manner described in the combined ASAG flooding could
increase the cumulative oil recovery by an encouraging 11.36 %OOIP. The experimental
results are shown in Table 6.5 also indicated better foam stability during the combined
ASAG flooding as depicted by the higher MRF values (1.45). The best result obtained
from the combined ASAG flooding indicated that utilizing the most favorable operating
conditions, the ASAG flooding can considerably enhance oil recovery. Both Edo and Evo
were improved through better mobility control of fluids by alternating injecting the
chemical slug with gas/CO2 in the correct sequence, using the optimal AS slug for
lowering of oil-water IFT to the lowest value and reducing surfactant loss by BL
preflushing.
Fig. 6. 13: Cumulative oil recovery and pressure drop versus pore volume of fluid injected
in the combined ASAG flooding
0 2 4 6 8 100
25
50
75
100
125
150
Pressure drop
Cumulative oil
recovery
Fluid injected (PV)
Pre
ssu
re d
rop
(p
si)
0
20
40
60
80
100
Cu
mu
lati
ve o
il r
eco
very
(%
OO
IP)
CO
2A
S
CO
2A
S
AS
CO
2
CO
2A
SWater flooding
Extended
water
flooding
TH-2437_126107015
Chapter 6 Key Parameters Influencing ASAG Flooding
157
The formation of in-situ foam in the core plug during the different ASAG injection
schemes/processes was evaluated based on the average ΔP and the MRF values. The
higher average ΔP value in ASAG flooding compared to the ΔP value of AS flooding
indicated that the higher value was due to the formation of in-situ foam. Among the
different slug ratios of ASAG flooding, the highest ΔP (65.75 psi) was obtained when the
slug ratio was 1:1. This was an affirmation that 1:1 slug ratio was a better injection scheme
due to stronger foam formation and hence higher oil recovery. Among the different slug
sizes of ASAG flooding, the highest ΔP was obtained with the smallest slug size of 0.25.
Hence, this slug size was chosen as the optimum for this study. The order of AS and CO2
gas slug injection during ASAG flooding also effect the average ΔP value, with GAC
injection scheme proving to be a better option due to the higher value of average ΔP. A
higher pressure drop of 72.00 psi was observed during the combined gas-liquid tapering
process which indicated that the process is more efficient in terms of mobility control by
foam generation and consequently higher oil recovery. However, the highest oil recovery
(69.54 %OOIP) was obtained when all the favorable injection schemes were included
during the combined ASAG flooding. The average ΔP value rose to 74.63 psi, thus
indicating that stronger foam generation is possible for better fluid mobility control and
maximum oil recovery.
6.11 Summary
The EOR by ASAG flooding was found to be influenced by various key
operational parameters that are required to be studied and optimized before the process
could be successfully applied in an oil reservoir. The most appropriate slug ratio was 1:1,
as neither increasing the volume of the liquid nor the gas could improve the additional oil
produced. The slug size or cycle frequency strongly influenced the effectiveness of ASAG
flooding in enhancing oil recovery. It was observed that smaller the slug size better the
TH-2437_126107015

Chapter 6 Key Parameters Influencing ASAG Flooding
158
foaming and hence improved mobility control. The optimal slug size for ASAG flooding
was found to be 0.25 PV. The GAW injection scheme proved to be more favorable for
ASAG flooding compared to CAG injection. The core flooding results indicated that
injecting gas immediately after secondary water flooding leads to higher oil recovery
(23.85 %OOIP) compared to injecting liquid after water flooding (19.78 %OOIP). The
experiments performed at different gas injection rates showed that an optimum rate of gas
injection rate (0.2 ml/min) existed at which the efficiency of ASAG flooding was the
maximum. Moreover, the oil recovery by ASAG flooding was determined by the total
volume of fluid (gas and liquid) injected during one complete ASAG cycle and the
optimum volume of fluid injected was found to be 2 PV.
Tapering, normally applied in CO2-WAG, could be successfully applied in ASAG
flooding and found to increase the oil recovery compared to uniform fluid injection due to
the efficient use of the fluids. More specifically, liquid tapering up and gas tapering down
approaches provided better oil recovery. The combination of these two approaches in
ASAG injection could enhance the residual oil recovery to 29.35 %OOIP – an
improvement of 5.50 %OOIP over uniform fluid injection. The selective mobility
reduction property was found to be exhibited by foam generated in the core plug by ASAG
injection. An increase in MRF value (from 1.18 to 1.39) indicated stronger foam formation
in the more porous/permeable cores.
The application of salinity gradient, commonly practiced in chemical flooding, was
also found to be encouraging for ASAG flooding. An increment oil recovery of 3.87
%OOIP was achieved by changing the brine salinity during flooding over straight salinity.
The higher oil recovery was primarily attributed to the attainment of the lowest oil-water
IFT and stronger foam formation. It was also observed that preflushing with a less
expensive surfactant (black liquor, BL), added to brine used for secondary water flooding,
TH-2437_126107015

Chapter 6 Key Parameters Influencing ASAG Flooding
159
improved both the additional as well as cumulative oil recovery obtainable by ASAG
flooding. Lower primary surfactant adsorption, reduction of oil-water IFT, and better
foaming achieved by preflushing improved the performance of the ASAG process. It was
observed that combining the most favorable operating conditions, ASAG flooding can
significantly enhance the oil recovery due to the improvement of both Edo and Evo. As a
whole, the experimental findings in this chapter provided sufficient amount of data for
optimizing the ASAG flooding through the use of the most suitable operating conditions.
TH-2437_126107015

160
TH-2437_126107015

CHAPTER 7
Overall Conclusions and Future Work
Summary of the work
Future scope
TH-2437_126107015

TH-2437_126107015
Chapter 7 Overall Conclusions and Future Work
161
Chapter 7
Overall Conclusions and Future Work
This chapter summarizes the conclusions drawn from the results of the present work. The
possible scope for future research has also been presented.
7.1 Conclusions
In this research work, the enhanced oil recovery by the immiscible alkaline-
surfactant-alternated-gas/CO2 (ASAG) flooding was studied in detail. Based on the
analysis of reservoir rock, crude oil, and formation water, the optimum chemical
formulations for ASAG flooding were designed. The key parameters influencing the oil
recovery performance of ASAG flooding have also been studied. The most important
findings and conclusions of this work are summarized below:
The crude oil was found to be medium gravity and high pour point was the result of its
high wax content. The asphaltene content of the crude was evaluated to be in the
stable state as there were enough amounts of resins for asphaltene stabilization. The
acidic nature of the crude is supported by acid number and FTIR study. Therefore, it is
expected that crude oil will respond favorably to alkaline injection for the formation
of in-situ surfactants. The total salinity of the formation water was found to be low
(3458 ppm) and marked by the presence of several types of dissolved ions including
the divalent ones like Ca++
and Mg++
.
The porosities of the core plugs were observed to vary with the depth of the formation
from where the cores were obtained. The core plug from shallower depths was found
to be more porous and vice-versa. The porosities and permeabilities of the core plugs
were directly related as the more porous core plugs were found to be more permeable.
TH-2437_126107015
Chapter 7 Overall Conclusions and Future Work
162
From the liquid and gas permeability values, it was found that the formation could be
classified as fair to moderate permeability reservoirs.
The reservoir rock was evaluated to be of anionic type due to the presence of silica
(quartz) as the dominant mineral. The existence of clays minerals in the rock matrix
was also identified through XRD and FESEM studies.
To determine the CO2-foam stability of different surfactants, the half-decay times
(t1/2) were calculated from the changes in foam volume recorded with respect to time.
SDS and AOS surfactants displayed comparatively better CO2-foam stability with the
crude oil under similar experimental conditions, with SDS having higher t1/2 values.
CO2-foam stability was found to be decreased by more than half as the temperature
increased from room to reservoir temperature. Additionally, optimum concentrations
of surfactants were found to exist that correspond to the point of maximum foam
stability.
Among the alkalis considered in the study, both Na2CO3 and NaOH were able to
reduce oil-water IFT values to the ultra-low range when combined with the optimum
concentrations of SDS and AOS. But, Na2CO3 was chosen as the preferred alkali as
the equilibrium IFT values obtained were the minimum with both the surfactants.
The maximum Winsor type III microemulsion volume was observed at 70% of
formation brine salinity (2400 ppm) during salinity scan of the phase behavior study.
This SFB salinity was considered as the optimal salinity, at which the lowest oil-water
IFT value was also obtained.
Under dynamic conditions, alkali addition was found to reduce the adsorption of
surfactants by reservoir rocks by more than half from 1.41 mg/g to 0.52 mg/g.
Additionally, the optimum concentration of BL for preflushing was found at its CMC
TH-2437_126107015

Chapter 7 Overall Conclusions and Future Work
163
value as no further reduction in surfactant adsorption was observed beyond the CMC
value.
The synergic effect of AS formulation and CO2 gas injected during ASAG flooding
resulted in higher oil recovery compared to tertiary CGI, CO2-WAG, SAG, and AS
flooding. The primary reason for the increase in oil recovery can be attributed to fluid
mobility control, achievement of ultra-low oil-water IFT, and in-situ foam generation.
The performance of ASAG flooding was found to be influenced by certain operational
parameters. The optimum conditions for the best oil recovery by ASAG flooding were
obtained with 1:1 slug ratio, 0.25 PV slug size, gas-alternated-chemical (GAC)
injection scheme, 0.2 ml/min CO2 gas injection rate, and 2 PV of total fluid injection.
Application of both liquid and gas tapering schemes during ASAG flooding indicated
to have a favorable effect on the oil recovery due to the efficient use of injected fluids
and better fluid mobility control. More specifically, liquid tapering up and gas
tapering down approaches provided better oil recovery. By combining these two
approaches in a single ASAG flooding, the oil recovery could be improved by 5.50
%OOIP over uniform fluid injection.
The application of salinity gradient during ASAG flooding helped achieve better
incremental oil recovery due to the attainment of the lowest oil-water IFT and
generation of the most stable foam.
By preflushing the core plug with a less costly natural surfactant (BL), which was
added to brine during secondary waterflooding, both the additional and cumulative oil
recoveries can be improved during ASAG flooding. The improved performance can
be attributed to the lower primary surfactant adsorption and better foam stability with
preflushing.
TH-2437_126107015

Chapter 7 Overall Conclusions and Future Work
164
7.2 Future Work
In this study, the potential of ASAG flooding for EOR under immiscible conditions
using reservoir rock and fluids of an Upper Assam oilfield was investigated on a laboratory
scale. However, taking into consideration the vastness of the subject the following future
studies can be undertaken:
This work can be extended to experimentally study the effectiveness of ASAG
flooding for the present reservoir fluids under miscible conditions. As miscible CO2
flooding is known to be more efficient for EOR, the miscible ASAG flooding is also
required to be investigated.
In ASAG flooding, the AS formulation and the gas/CO2 slug were alternately injected
in small slugs to form foam in the reservoir rock. Foam can also be formed by the
coinjection of the two fluids. The coinjection of gas/CO2 and AS slug for EOR can be
studied as larger mobility reduction is obtainable through this technique. Moreover,
foam quality which influences the mobility reduction characteristics can be controlled
in the coinjection method.
The effectiveness of ASAG flooding in carbonate reservoirs can be studied. These
reservoirs on an average have lower porosity and permeability than sandstones, which
poses various challenges for EOR by foam application as the effectiveness of foam in
controlling gas mobility is lower in low-permeability rocks.
The effects of bubble size on the injection rate and differential pressure (pressure
drop) on the performance of ASAG flooding can be investigated.
Development of EOR models and simulation studies would be useful to validate the
experimental data and to further predict the performance of ASAG flooding under
different reservoir and operating conditions.
Techno-economic analysis of the ASAG flooding needs to be carried out for a
successful pilot and field-scale implementation.
TH-2437_126107015

Appendix
TH-2437_126107015

TH-2437_126107015
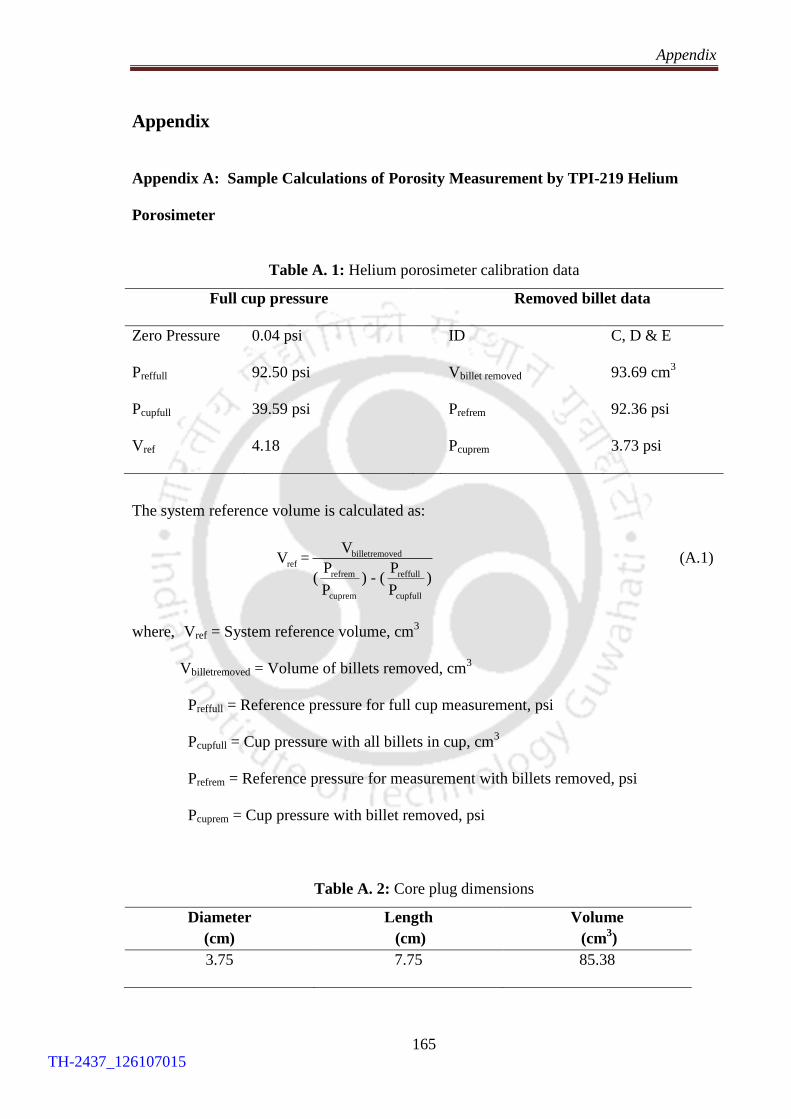
Appendix
165
Appendix
Appendix A: Sample Calculations of Porosity Measurement by TPI-219 Helium
Porosimeter
Table A. 1: Helium porosimeter calibration data
Full cup pressure Removed billet data
Zero Pressure 0.04 psi ID C, D & E
Preffull 92.50 psi Vbillet removed 93.69 cm3
Pcupfull 39.59 psi Prefrem 92.36 psi
Vref 4.18 Pcuprem 3.73 psi
The system reference volume is calculated as:
billetremovedref
refrem reffull
cuprem cupfull
VV =
P P( ) - ( )
P P
(A.1)
where, Vref = System reference volume, cm3
Vbilletremoved = Volume of billets removed, cm3
Preffull = Reference pressure for full cup measurement, psi
Pcupfull = Cup pressure with all billets in cup, cm3
Prefrem = Reference pressure for measurement with billets removed, psi
Pcuprem = Cup pressure with billet removed, psi
Table A. 2: Core plug dimensions
Diameter
(cm)
Length
(cm)
Volume
(cm3)
3.75 7.75 85.38
TH-2437_126107015

Appendix
166
The grain volume is calculated by the following equation:
r rP Peffull efsample
grain billetsremoved ref
cupfull cupsample
V V VP P
(A.2)
Where, Vgrain = Grain volume, cm3
Vbilletremoved = Volume of removed billets, cm3
Prefsample = Reference system pressure with core plug, psi
Pcupsample = Cup pressure with core plug, psi
Table A. 3: Core plug porosity measurement
Core
plug
ID
Zero
pressure
(psi)
System
reference
pressure
(psi)
Sample
pressure
(psi)
Sample
bulk
volume
(cm3)
Sample
weight
(gm)
Sample
grain
volume
(cm3)
Sample
porosity
(%)
CP1
0.04
92.40
9.65
85.38
195.74
63.45
25.69
TH-2437_126107015

Appendix
167
Appendix B
B.1. Viscosity Measurements of Crude Oil
Table B. 1: Kinematic and dynamic viscosity measurements of crude oil
Sl.
No.
Temperature
(oC)
Density of
crude oil
(g/cm3)
Calibration
constant of
viscometer
Flow time
(sec) Kinematic
viscosity
(cSt)
Dynamic
viscosity
(cP) Test readings Average
1 28 0.865 0.01
1156
1180 11.80 10.20 1212
1172
2 50 0.847 0.01
796
777 7.77 6.58 789
746
3 70 0.832 0.01
509
536 5.36 4.46 569
530
4 90 0.820 0.01
428
413 4.13 3.39 403
408
TH-2437_126107015

Appendix
168
B.2. Asphaltene, Resin and Wax Content Determination of Crude Oil
Table B. 2: Asphaltene content determination of crude oil
Sl.
No.
Wt. of
oil
sample
(g)
Wt. of filter
paper with
asphaltene
(g)
Wt. of filter
paper without
asphaltene
(g)
Wt. of
asphaltene
(g)
Asphaltene
content
= Wt. of
asphaltene / Wt.
of oil sample
(%)
1 5.00 1.15 1.07 0.08 1.60
2 5.00 1.12 1.05 0.07 1.40
3 5.00 1.16 1.10 0.06 1.20
Table B. 3: Resin content determination of crude oil
Sl.
No.
Wt. of
oil
sample
(g)
Wt. of petri
dish
(g)
Wt. of petri
dish with
resin
(g)
Wt. of
resin
(g)
Resin content
= Wt. of resin /
Wt. of oil sample
(%)
1 5.00 44.06 44.92 0.86 17.20
2 5.00 44.06 44.86 0.80 16.60
3 5.00 44.06 44.89 0.83 16.39
Table B. 4: Wax content determination of crude oil
Sl.
No.
Wt. of
oil
sample
(g)
Wt. of dish
(g)
Wt. of dish
with wax
(g)
Wt. of
wax
(g)
Resin content
= Wt. of wax / Wt.
of oil sample
(%)
1 5.00 198.84 199.46 0.62 12.40
2 5.00 198.84 199.50 0.66 13.20
3 5.00 198.84 199.43 0.59 11.80
TH-2437_126107015
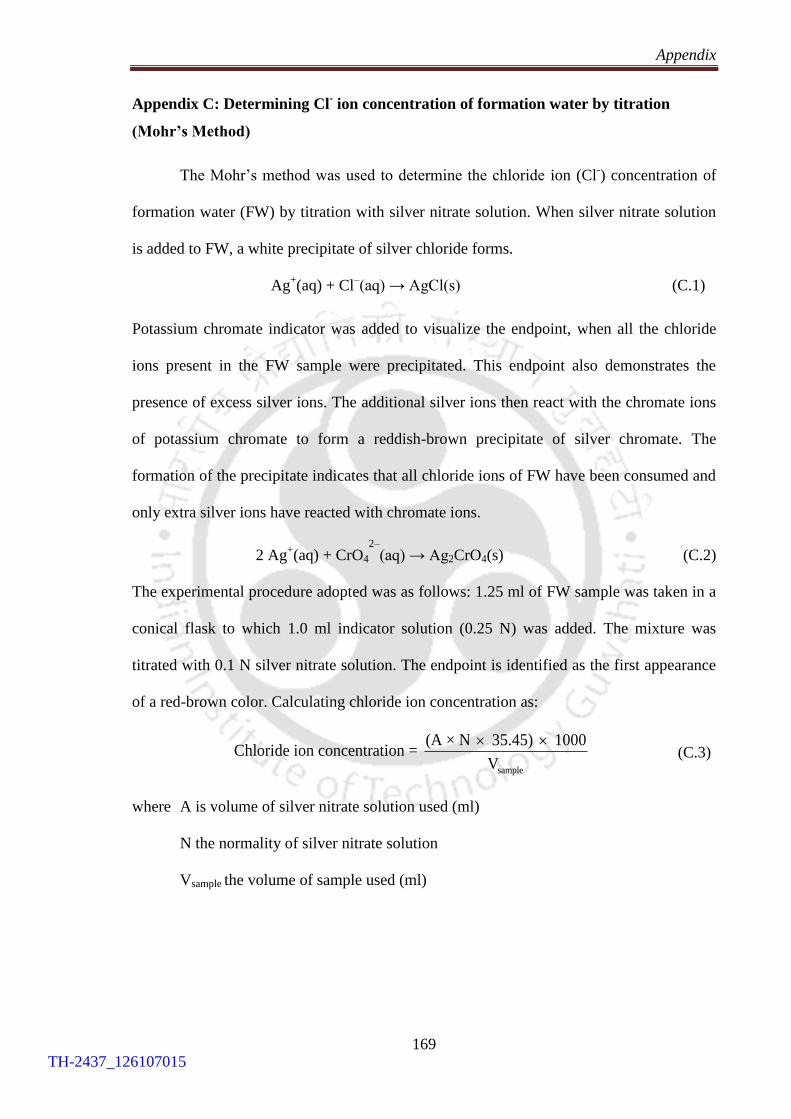
Appendix
169
Appendix C: Determining Cl- ion concentration of formation water by titration
(Mohr’s Method)
The Mohr’s method was used to determine the chloride ion (Cl-) concentration of
formation water (FW) by titration with silver nitrate solution. When silver nitrate solution
is added to FW, a white precipitate of silver chloride forms.
Ag+(aq) + Cl
–(aq) → AgCl(s) (C.1)
Potassium chromate indicator was added to visualize the endpoint, when all the chloride
ions present in the FW sample were precipitated. This endpoint also demonstrates the
presence of excess silver ions. The additional silver ions then react with the chromate ions
of potassium chromate to form a reddish-brown precipitate of silver chromate. The
formation of the precipitate indicates that all chloride ions of FW have been consumed and
only extra silver ions have reacted with chromate ions.
2 Ag+(aq) + CrO4
2–
(aq) → Ag2CrO4(s) (C.2)
The experimental procedure adopted was as follows: 1.25 ml of FW sample was taken in a
conical flask to which 1.0 ml indicator solution (0.25 N) was added. The mixture was
titrated with 0.1 N silver nitrate solution. The endpoint is identified as the first appearance
of a red-brown color. Calculating chloride ion concentration as:
sample
(A × N 35.45) 1000Chloride ion concentration =
V
(C.3)
where A is volume of silver nitrate solution used (ml)
N the normality of silver nitrate solution
Vsample the volume of sample used (ml)
TH-2437_126107015

Appendix
170
Table C. 1: Cl- ion concentration in formation water
Sl.
No.
Vsample
(ml)
N
(N)
A
(ml)
Cl-
concentration
(ppm)
1
25
0.1
5.1
723.18
2 25 0.1 5.05 716.09
3 25 0.1 5.15 730.27
Average 723.18
A = volume of silver nitrate solution used (ml)
N = normality of silver nitrate solution
Vsample = volume of sample used (ml)
TH-2437_126107015

Appendix
171
Appendix D: Determine Mg++
ion concentration of formation water by titration with
EDTA
The titration method with EDTA (ethylenediaminetetraacetic acid) was used to find
the total calcium and magnesium content of water sample. In this method, EDTA forms a
complex with calcium and magnesium ions. The indicator used was a blue dye called
Eriochrome Black T (ErioT). This dye too forms a complex with the calcium and
magnesium ions which changes the color from blue to pink. In the titration process, the
FW sample was reacted with excess of EDTA. The indicator was then added which
changes the color of the solution to blue because the calcium and magnesium ions were
present as complex of EDTA. Then a back titration was done with magnesium chloride
solution. All the excess EDTA form a complex with magnesium ions when the end-point
was reached. The remaining magnesium ions of the magnesium chloride solution then
form complex with ErioT indicator which changes the color from blue to pink.
The main reaction:
Ca2+
+ EDTA4−
→ [Ca-EDTA]2−
(D.1)
Back titration:
EDTA4−
+ Mg2+
→ [Mg-EDTA]2−
(D.2)
ErioT + Mg2+
→ ErioT-Mg (D.3)
The experimental procedure adopted was as follows: Mixing 100 ml of FW and 50 ml of
0.005 mol/L EDTA solution in a conical flask. To the mixture was added 10 ml of
ammonia buffer. The buffer was prepared by dissolving 7.0 g of ammonium chloride in 57
ml ammonia solution and further diluting to 100 ml with distilled water in a volumetric
flask. The pH should be 10.5. Next, 1 ml of ErioT indicator solution was added. The ErioT
indicator solution was prepared by dissolving 0.2 g of ErioT indicator in 15 ml of ammonia
TH-2437_126107015

Appendix
172
solution and 5 ml ethanol. The FW sample was titrated with 0.0025 mol/L MgCl2 solution
until pink color appears. The titrations were repeated until similar results were obtained.
Total number of moles of EDTA in the sample = 0.005
× 50 = 0.000251000
Moles of MgCl2 used in the back titration = 0.0025
× 1 = 0.00000251000
Moles of MgCl2 used in the back titration = Moles of excess EDTA
Moles of Ca++
and Mg++
in the sample
= Total moles of EDTA – Moles of excess EDTA
= 0.00025-0.0000025
= 0.0002475 moles/100 ml
= 0.002475 moles/L
= mol gm mg
0.002475 40.078 ×1000L mol gm
= 99 mg/L
= 99 ppm
[In a typical water sample, more calcium salts are present than magnesium salts so 40.078
gm was taken which is the molecular weight of calcium even though both Mg and Ca are
present in the sample]
Concentration of Ca++
from flame photometer test was obtained at 82 ppm.
Therefore, the concentration of Mg++
= 99 – 82 = 17 ppm
TH-2437_126107015
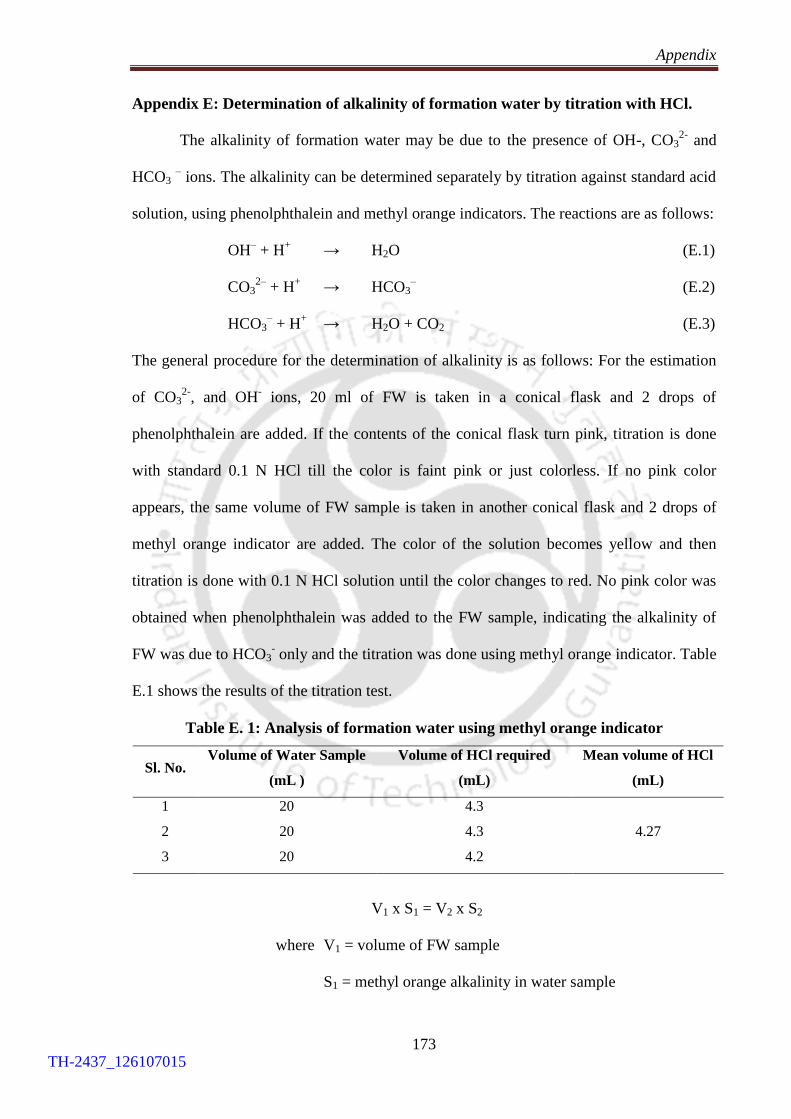
Appendix
173
Appendix E: Determination of alkalinity of formation water by titration with HCl.
The alkalinity of formation water may be due to the presence of OH-, CO32-
and
HCO3 – ions. The alkalinity can be determined separately by titration against standard acid
solution, using phenolphthalein and methyl orange indicators. The reactions are as follows:
OH– + H
+ → H2O (E.1)
CO32–
+ H+ → HCO3
– (E.2)
HCO3– + H
+ → H2O + CO2 (E.3)
The general procedure for the determination of alkalinity is as follows: For the estimation
of CO32-
, and OH- ions, 20 ml of FW is taken in a conical flask and 2 drops of
phenolphthalein are added. If the contents of the conical flask turn pink, titration is done
with standard 0.1 N HCl till the color is faint pink or just colorless. If no pink color
appears, the same volume of FW sample is taken in another conical flask and 2 drops of
methyl orange indicator are added. The color of the solution becomes yellow and then
titration is done with 0.1 N HCl solution until the color changes to red. No pink color was
obtained when phenolphthalein was added to the FW sample, indicating the alkalinity of
FW was due to HCO3- only and the titration was done using methyl orange indicator. Table
E.1 shows the results of the titration test.
Table E. 1: Analysis of formation water using methyl orange indicator
Sl. No. Volume of Water Sample
(mL )
Volume of HCl required
(mL)
Mean volume of HCl
(mL)
1 20 4.3
4.27 2 20 4.3
3 20 4.2
V1 x S1 = V2 x S2
where V1 = volume of FW sample
S1 = methyl orange alkalinity in water sample
TH-2437_126107015
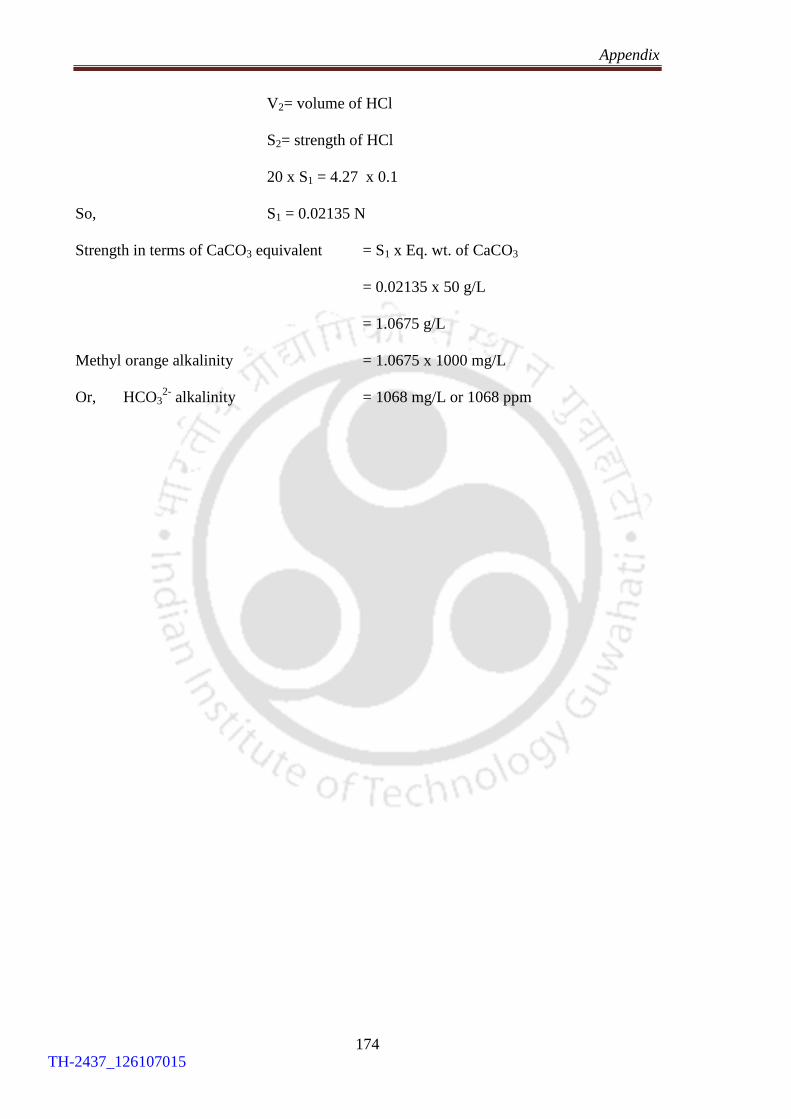
Appendix
174
V2= volume of HCl
S2= strength of HCl
20 x S1 = 4.27 x 0.1
So, S1 = 0.02135 N
Strength in terms of CaCO3 equivalent = S1 x Eq. wt. of CaCO3
= 0.02135 x 50 g/L
= 1.0675 g/L
Methyl orange alkalinity = 1.0675 x 1000 mg/L
Or, HCO32-
alkalinity = 1068 mg/L or 1068 ppm
TH-2437_126107015

List of Publications
TH-2437_126107015

TH-2437_126107015

List of Publications
175
List of Publications
Journal Publications:
1. R. Phukan, S.B. Gogoi, and P. Tiwari, Effects of CO2-foam stability, interfacial
tension and surfactant adsorption on oil recovery by alkaline-surfactant-alternated-
gas/CO2 flooding. Colloids and Surfaces A: Physicochemical and Engineering
Aspects, Elsevier, 2020;597:124799.
2. R. Phukan, S.B. Gogoi, and P. Tiwari, Alkaline-surfactant-alternated-gas/CO2
flooding: Effects of key parameters. Journal of Petroleum Science and Engineering,
Elsevier, 2019. 173: p. 547-557.
3. R. Phukan, S.B. Gogoi, and P. Tiwari, Enhanced oil recovery by
alkaline‑surfactant‑alternated‑gas/CO2 flooding. Journal of Petroleum Exploration
and Production Technology, Springer, 2019. 9: p. 247-260.
Publication in Refereed Conference:
1. R. Phukan, S.B. Gogoi, P. Tiwari, and R.S.Vadhan, Optimization of immiscible
alkaline-surfactant-alternated-gas/CO2 flooding in an Upper Assam oilfield, in SPE
Western Regional Meeting 2019, Society of Petroleum Engineers: San Jose,
California, USA. p. 23, SPE-196262-MS.
Manuscript communicated:
1. R. Phukan, S.B. Gogoi, and P. Tiwari, Characterization of reservoir rock and fluids
for CO2 foam enhanced oil recovery application (To be published as a book chapter of
Jenny Stanford Publishing, Singapore) (in Press)
TH-2437_126107015
List of Publications
176
Conference Presentations (National/International):
1. R. Phukan, P. Tiwari, and S. B. Gogoi, Characterization of reservoir rock and fluids
for CO2 foam enhanced oil recovery application. Reflux 2019, Indian Institue of
Technology, Guwahati, India.
2. R. Phukan, P. Tiwari, S. B. Gogoi, and A. Goswami, Black liquor as a sacrificial
adsorbate for EOR. Oil & Gas Workshop 2019, Dibrugarh University, India.
3. R. Phukan, S.B. Gogoi, P. Tiwari, and R.S.Vadhan, Optimization of immiscible
alkaline-surfactant-alternated-gas/CO2 flooding in an Upper Assam Oilfield. SPE
Western Regional Meeting 2019, Society of Petroleum Engineers: San Jose,
California, USA.
4. R. Phukan, S. B. Gogoi, and P. Tiwari, Enhanced oil recovery by combined
chemical/gas flooding. Research Conclave 2018, Indian Institue of Technology,
Guwahati, India.
5. R. Phukan, S. B. Gogoi, and P. Tiwari, Static and dynamic adsorption of surfactants
by reservoir rocks. Reflux 2017, Indian Institue of Technology, Guwahati, India.
6. R. Phukan, C. Dutta, S. B. Gogoi, and P. Tiwari, A comparative study of adsorption of
anionic, non-ionic and a natural surfactant by reservoir rocks of Upper Assam Basin.
International Conference on Advances in Petroleum, Chemical & Energy Challenges
2016, RGIPT, Amethi, India.
7. R. Phukan, S. B. Gogoi, P. Tiwari, and D. Das, Screening of chemical formulations for
alkali-surfactant-gas enhanced oil recovery process. Chemcon 2016, Anna University
and Indian Institue of Technology, Madras, India.
8. R. Phukan, P. Tiwari, and S. B. Gogoi, Enhanced oil recovery by alkaline-surfactant-
alternated-CO2 flooding. Chemcon 2015, Indian Institue of Technology, Guwahati,
India.
TH-2437_126107015
References
TH-2437_126107015

TH-2437_126107015

References
177
References
[1] Outlook for Energy: A Perspective to 2040. A report by ExxonMobil; 2019.
[2] Mehta VS. Why is Today’s Oil Market, a ‘No Mans’ Land? Financial Express. May
2017.
[3] Cunningham N. BP Sees Peak Oil Demand In 2030s. A report published on
Oilprice.com; 2018.
[4] Alvarado V, Manrique E. Enhanced Oil Recovery: An Update Review. Energies
2010;3:1529-75.
[5] Khan MY, Samanta A, Ojha K, Mandal A. Design of Alkaline/Surfactant/Polymer
(ASP) Slug and its use in Enhanced Oil Recovery. Petroleum Science and
Technology, 2009;27:1926-42.
[6] Mandal A. Chemical Flood Enhanced Oil Recovery: A Review. International
Journal of Oil, Gas and Coal Technology 2015;9(3):24.
[7] Kumar S, Mandal A. Studies on Interfacial Behavior ond Wettability Change
Phenomena Byionic ond Nonionic Surfactants in Presence of Alkalis and Salt for
Enhanced Oil Recovery. Applied Surface Science 2016;372:42-51.
[8] Cao M, Gu Y. Oil Recovery Mechanisms and Asphaltene Precipitation
Phenomenon in Immiscible and Miscible CO2 Flooding Processes. Fuel
2013;109:157-66.
[9] Andrianov A, Farajzadeh R, Nick MM, Talanana M, Zitha PLJ. Immiscible Foam
for Enhancing Oil Recovery: Bulk and Porous Media Experiments. Industrial &
Engineering Chemistry Research 2012;51:2214-26.
[10] Sheng JJ. A Comprehensive Review of Alkaline-Surfactant-Polymer (ASP)
Flooding. SPE Western Regional & AAPG Pacific Section Meeting 2013 Joint
Technical Conference. Monterey, California, USA: Society of Petroleum Engineers;
2013:20.
[11] R.K.Srivastava, S.S.Huang, M.Dong. Laboratory Investigation of Weyburn CO2
Miscible Flooding. Journal of Canadian Petroleum Technology 2000;39(2):41-51.
[12] Gogoi SB. Carbon-dioxide for EOR in Upper Assam Basin. In: Hou MZ, Xie H,
Were P, editors. Clean Energy Systems in the Subsurface: Production, Storage and
Conversion. Springer; 2013, p. 13.
TH-2437_126107015

References
178
[13] Patel J, Borgohain S, Kumar M, Rangarajan V, Somasundaran P, Sen R. Recent
Developments in Microbial Enhanced Oil Recovery. Renewable and Sustainable
Energy Reviews 2015;52:1539-58.
[14] Lazar I, Petrisor IG, Yen TF. Microbial Enhanced Oil Recovery (MEOR).
Petroleum Science and Technology 2007;25(11):1353-66.
[15] Pourafshary P, Moradpour N. Hybrid EOR Methods Utilizing Low-Salinity Water.
IntechOpen; 2019.
[16] Azim RA, Sara Faiz SR, Elbagir A, Obaidi NA. Numerical Study of Low Salinity
Water Flooding in Naturally Fractured Oil Reservoirs. Recent Insights in Petroleum
Science and Engineering. IntechOpen; 2017.
[17] Olajire AA. Review of ASP EOR (Alkaline Surfactant Polymer Enhanced Oil
Recovery) Technology in the Petroleum Industry: Prospects and Challenges. Energy
2014;77:20.
[18] Ahmed T. Reservoir Engineering Handbook. Elsevier; 2006.
[19] Mazzullo SJ, Rieke HH, Chilingarian GV. Carbonate Reservoir Characterization: A
Geologic-Engineering Analysis. Elsevier; 1996.
[20] Green DW, Willhite GP. Enhanced Oil Recovery. Richardson, Texas: Society of
Petroleum Engineers; 1998.
[21] Amili P, Yortsos YC. Darcian Dynamics: A New Approach to the Mobilization of a
Trapped Phase in Porous Media. Transport in Porous Media 2006;64(1):25-49.
[22] Yongmao H, Zenggui W, Yueming JBC, Xiangjie L. Laboratory Investigation of
CO2 Flooding. SPE 2004;88883:6.
[23] Karmakar GP. Carbon Dioxide Sequestration During Enhanced Oil Recovery:
Operational and Economical Aspects. Journal of Indian Geophysics Union
2016;1:5-12.
[24] Gogoi SB, Kakoty M. A Study of CO2 Flooding on Wave Velocities in the
Naharkatiya Oil Reservoir of Upper Assam Basin. Resource-Efficient Technologies
2017;3(1):101-12.
[25] Stocker TF, Qin D, Plattner GK, Tignor M, Allen SK, Boschung J, et al. Climate
Change 2013: The Physical Science Basis. Contribution of Working Group I to the
Fifth Assessment Report of the Intergovernmental Panel on Climate Change. 2018.
[26] Council NR, Studies DEL, Resources BES, Geodynamics CS, Engineering CGG,
Resources CE, et al. Induced Seismicity Potential in Energy Technologies. National
Academies Press; 2013.
TH-2437_126107015

References
179
[27] Gogoi SB. Carbon-dioxide for EOR in Upper Assam Basin. Berlin, Heidelberg:
Springer Berlin Heidelberg; 2013:157-69.
[28] Verma MK. Fundamentals of Carbon Dioxide-Enhanced Oil Recovery (CO2-
EOR)—A Supporting Document of the Assessment Methodology for Hydrocarbon
Recovery Using CO2-EOR Associated with Carbon Sequestration U.S. Geological
Survey; 2015:24.
[29] Satter A, Iqbal G, Buchwalter J. Practical Enhanced Reservoir Engineering:
Assisted With Simulation Softwar. PennWell Corporation; 2007.
[30] Jarrell PM. Practical Aspects of CO2 Flooding (SPE Monograph Series, Vol. 22).
Society of Petroleum Engineers (U.S.); 2002.
[31] Fath AH, Pouranfard A-R. Evaluation of Miscible and Immiscible CO2 Injection in
One of the Iranian Oil Fields. Egyptian Journal of Petroleum 2014;23(3):255-70.
[32] Bagci AS. Immiscible CO2 Flooding Through Horizontal Wells. Energy Sources,
Part A 2007;29:85-95.
[33] Mangalsingh D, T.Jagai. A Laboratory Investigation of the Carbon Dioxide
Immiscible Process. Society of Petroleum Engineers. SPE 36134. Port of Spain,
Trinidad & Tobago: Society of Petroleum Engineers; 1996:11.
[34] Li S, Li B, Zhang Q, Li Z, Yang D. Effect of CO2 on Heavy Oil Recovery and
Physical Properties in Huff-n-Puff Processes Under Reservoir Conditions. Journal
of Energy Resources Technology 2018;140:10.
[35] Song Z, Zhu W, Wang X, Guo S. 2‑D Pore-Scale Experimental Investigations of
Asphaltene Deposition and Heavy Oil Recovery by CO2 Flooding. Energy & Fuels
2018;32:3194-201.
[36] Zhang N, Wei M, Bai B. Comprehensive Review of Worldwide CO2 Immiscible
Flooding. SPE Improved Oil Recovery Conference Oklahoma, USA: Society of
Petroleum Engineers; 2018:14.
[37] Qin J, Han H, Liu X. Application and Enlightenment of Carbon Dioxide Flooding in
the United States of America. Petroleum Exploration and Development
2015;42(2):232-40.
[38] Spivak A, Karaoguz D, Issever K, Nolen JS. Simulation of Immiscible CO2
Injection in a Fractured Carbonate Reservoir, Bati Raman Field, Turkey. SPE
California Regional Meeting. California: Society of Petroleum Engineers; 1989.
[39] Sahin S, Kalfa U, Celebioglu D. Bati Raman Field Immiscible CO2 Application:
Status Quo and Future Plans. 2007 SPE Latin American and Caribbean Petroleum
TH-2437_126107015

References
180
Engineering Conference Buenos Aires, Argentina: Society of Petroleum Engineers;
2007.
[40] Godec ML. Global Technology Roadmap for CCS in Industry Sectoral Assessment
CO2 Enhanced Oil Recovery. USA: United Nations Industrial Development
Organization 2011.
[41] Perera MSA, Gamage RP, Rathnaweera TD, Ranathunga AS, Koay A, Choi X. A
Review of CO2-Enhanced Oil Recovery with a Simulated Sensitivity Analysis.
Energies 2016;9(481):22.
[42] Zhang, P.Luo, S H. Improved Heavy Oil Recovery by CO2 Injection Augumented
with Chemicals. CPS/SPE International Oil & Gas Conference and Exhibition
Beijing, China: Society of Petroleum Engineers; 2010:21.
[43] Kumar B, Mani D. India’s Energy Future and Carbon Management. 27th Oil Shale
Symposium. Colorado School of Mines; 2007:7.
[44] Viebahn P. Prospects of Carbon Capture and Storage Technologies (CCS) in
Emerging Economies. Wuppertal Institute for Climate, Environment and Energy;
2012.
[45] Enick RM, Olsen DK. Mobility and Conformance Control for Carbon Dioxide
Enhanced Oil Recovery (CO2-EOR) via Thickeners, Foams, and Gels – A Detailed
Literature Review of 40 Years of Research. In: Ammer J, ed. DOE/NETL-
2012/1540. National Energy Technology Laboratory; 2012:267.
[46] Ghedan S. Global Laboratory Experience of CO2-EOR Flooding. SPE/EAGE
Reservoir Characterization and Simulation Conference held Abu Dhabi, UAE:
SPE; 2009.
[47] Srivastava RK, S.S.Huang. Aphaltene Deposition During CO2 Flooding: A
Laboratory Assessment. SPE Production Operations Symposium 37468. Oklahoma:
SPE; 1997.
[48] Bon J, Sarma HK. A Technical Evaluation of a CO2 Flood for EOR Benefits in the
Cooper Basin, South Australia. SPE Asia PacificOil and Gas Conference and
Exhibition 88451. Perth, Australia: SPE; 2004.
[49] Leontaritis KJ, Mansoori GA. Asphaltene Flocculation During Oil Production and
Processing: A Thermodynamic Colloidal Model. SPE international Symposium on
Oilfield Chemistry. 16258. Texas SPE; 1987.
[50] Bahadori A. Fundamentals of Enhanced Oil and Gas Recovery from Conventional
and Unconventional Reservoirs. Gulf Professional Publishing; 2018.
TH-2437_126107015

References
181
[51] Elwy M, Zekri AY, Almehaideb RA, Al-Attar HH. Optimization of CO2 WAG
Processes in Carbonate Reservoirs-An Experimental Approach. Abu Dhabi
International Petroleum Conference and Exhibition. SPE-161782-MS. Abu Dhabi,
UAE: Society of Petroleum Engineers; 2012:12.
[52] Christensen JR, Stenby EH, Skauge A. Review of WAG Field Experience. SPE
Reservoir Evaluation & Engineering 2001;4(02):10.
[53] Rahimi V, Bidarigh M, Bahrami P. Experimental Study and Performance
Investigation of Miscible Water-Alternating-CO2 Flooding for Enhancing Oil
Recovery in the Sarvak Formation. Oil & Gas Science and Technology
2017;72(35):12.
[54] Andrei M. Study Confirms Underground Injections of Carbon Dioxide Triggered a
Series of Earthquakes in Texas. ZME Science; 2013.
[55] AlSumaiti AM, Hashmet MR, AlAmeri WS, Anto-Darkwah E. Laboratory Study of
CO2 Foam Flooding in High Temperature, High Salinity Carbonate Reservoirs
Using Co-injection Technique. Energy & Fuels 2018;32(2):1416-22.
[56] Dixit A, Tsau JS, Heller JP. Laboratory Study on Surfactant-Based Selective
Mobility Control. Permian Basin Oil and Gas Recovery Conference. Midland,
Texas: Society of Petroleum Engineers; 1994:9.
[57] Talebian SH, Masoudi R, M.Tan I, Zitha PLJ. Foam assisted CO2-EOR; Concepts,
Challenges and Applications. SPE Enhanced Oil Recovery Conference SPE 165280.
Kuala Lumpur, Malaysia: Society of Petroleum Engineers; 2013:14.
[58] Pu W, Wei P, Sun L, Wang S. Stability, CO2 sensitivity, oil tolerance and
displacement efficiency of polymer enhanced foam. RSC Advances
2017;7(11):6251-8.
[59] Skauge A, Stensen JA. Review of WAG Field Experience. Oil Recovery – 2003, 1st
International Conference and Exhibition Modern Challenges in Oil Recovery.
Russia, Moscow; 2003:11.
[60] Kulkarni MM, Rao DN. Experimental Investigation of Miscible and Immiscible
Water-Alternating-Gas (WAG) Process Performance. Journal of Petroleum Science
and Engineering 2005;48:1-20.
[61] Majidaie S, Onur M, Tan IM. An Experimental and Numerical Study of Chemically
Enhanced Water Alternating Gas Injection. Petroleum Science 2015;12:13.
TH-2437_126107015
References
182
[62] Kumar S, Mandal A. A Comprehensive Review on Chemically Enhanced Water
Alternating Gas/CO2 (CEWAG) Injection for Enhanced Oil Recovery. Journal of
Petroleum Science and Engineering 2017;157:20.
[63] Memon MK, Elraies KA, Al-Mossawy MI. Impact of New Foam Surfactant Blend
with Water Alternating Gas Injection on Residual Oil Recovery. Journal of
Petroleum Exploration and Production Technology 2017;7(3):843-51.
[64] Kibodeaux KR, Rossen WR. Coreflood Study of Surfactant-Alternating-Gas Foam
Processes: Implications for Field Design. SPE Western Regional Meeting. SPE-
38318-MS. Long Beach, California: Society of Petroleum Engineers; 1997:11.
[65] Gandomkar A, Honarvar B, Kazemzadeh Y, Derikvand Z. An Experimental Study
of Surfactant Alternating CO2 Injection for Enhanced Oil Recovery of Carbonated
Reservoir. Iranian Journal of Oil and Gas Science and Technology 2016;5(4):01-17.
[66] Salehi MM, Safarzadeh MA, Sahraei E, Nejad SAT. Comparison of Oil Removal in
Surfactant Alternating Gas with Wateralternating Gas, Water Flooding and Gas
Flooding in Secondary Oil Recovery Process. Journal of Petroleum Science and
Engineering 2014;120:8.
[67] Yaghoobi H, Tsau JS, Grigg RB. Effect of Foam on CO2 Breakthrough: Is This
Favorable to Oil Recovery? SPE Permian Basin Oil and Gas Recovery Conference.
Midland, Texas: Society of Petroleum Engineers; 1998:8.
[68] Aghdam KA, Moghaddas JS, Moradi B. An Investigation of the Effect of Using
Foam in WAG Injection in an Iranian Oil Reservoir. Petroleum Science and
Technology 2013;31(21):2228-36.
[69] Bernard GG, Jacobs WL. Effect of Foam on Trapped Gas Saturation and on
Permeability of Porous Media to Water. Society of Petroleum Engineers Journal
1965;5(04):6.
[70] Gandomkar A, Kharrat R, Motealleh M, Khanamiri HH, Nematzadeh M,
Ghazanfari MH. An Experimental Investigation of Foam for Gas Mobility Control
in a Low-Temperature Fractured Carbonate Reservoir. Petroleum Science and
Technology 2012;30(10):976–85.
[71] Telmadarreie A, Trivedi JJ. Static and Dynamic Performance of Wet Foam and
Polymer-Enhanced Foam in the Presence of Heavy Oil. Colloids and Interfaces
2018;2(38):18.
[72] Leeftink TN, Latooij CA, Rossen WR. Injectivity Errors in Simulation of Foam
EOR. Journal of Petroleum Science and Engineering 2015;126:26-34.
TH-2437_126107015

References
183
[73] Shi J-X, Rossen WR. Improved Surfactant-Alternating-Gas Foam Process to
Control Gravity Override. SPE/DOE Improved Oil Recovery Symposium. Tulsa,
Oklahoma: Society of Petroleum Engineers; 1988:8.
[74] Samanta A, A.Bera, K.Ojha, A.Mandal. Comparative Studies on Enhanced Oil
Recovery by Alkali–Surfactant and Polymer Flooding. Journal of Petroleum
Exploration & Production Technology 2012;2:8.
[75] ShamsiJazeyi H, Hirasaki GJ, Verduzco R. Sacrificial Agent for Reducing
Adsorption of Anionic Surfactants. SPE International Symposium on Oilfield
Chemistry. The Woodlands, Texas, USA: Society of Petroleum Engineers; 2013:16.
[76] M.Srivastava, Zhang J, Nguyen QP, Pope GA. A Systematic Study of Alkaline-
Surfactant-Gas Injection as an EOR Technique. SPE 2009;124752:15.
[77] Guo H, Zitha PLJ, Faber R, Buijse. A Novel Alkaline/Surfactant/Foam Enhanced
Oil Recovery Process. SPE Journal 2012;SPE 145043:10.
[78] Srivastava JP, D.S.Negi, K.Jain A, A.K.Dhawan. Surfactant-Alternate-Gas (SAG)
Injection Process as a Novel EOR Technique-- A Laboratory Investigation. 2nd
South Asain Geoscience Conference and Exhibition, GEOIndia2011. New Delhi,
India: Geo India; 2011:7.
[79] Cottin C, Morel D, Levitt D, Cordelier P, Pope G. Alkali Surfactant Gas Injection -
Attractive Laboratory Results in Carbonates under Harsh Salinity and High
Temperature. Abu Dhabi International Petroleum Exhibition & Conference SPE
161727. Abu Dhabi, UAE: Society of Petroleum Engineers; 2012:13.
[80] Lashgari HR, Sepehrnoori K, Delshad M. Modeling of Low-Tension Surfactant-Gas
Flooding Process in a Four-Phase Flow Simulator. SPE Annual Technical
Conference and Exhibition. SPE-175134-MS. Houston, Texas, USA: Society Of
Petroleum Engineers; 2015:21.
[81] Nasab SMH, Zitha PLJ. Investigation of Certain Physical–Chemical Features of Oil
Recovery by an Optimized Alkali–Surfactant–Foam (ASF) System. Colloid and
Polymer Science 2017;295:1873-86.
[82] Afzali S, Rezaei N, Zendehboudi S. A Comprehensive Review on Enhanced Oil
Recovery by Water Alternating Gas (WAG) Injection. Fuel 2018;227:218-46.
[83] Srivastava, Zhang J, Nguyen QP, Pope GA. A Systematic Study of Alkaline-
Surfactant-Gas Injection as an EOR Technique. SPE Annual Technical Conference
and Exhibition. SPE 124752. New Orleans, Louisiana, USA: Society of Petroleum
Engineers; 2009:15.
TH-2437_126107015

References
184
[84] Jong S, Nguyen NM, Eberle CM, Long X. Nghiem, Nguyen QP. Low Tension Gas
Flooding as a Novel EOR Method: An Experimental and Theoretical Investigation.
SPE Improved Oil Recovery Conference. Tulsa, Oklahoma, USA: Society of
Petroleum Engineers; 2016:25.
[85] Srivastava M. Foam Assisted Low Interfacial Tension Enhanced Oil Recovery.
PhD. The University of Texas at Austin; 2010.
[86] Carcoana A. Applied Enhanced Oil Recovery. Prentice-Hall Inc, New Jersey; 1992.
[87] Liu S. Alkaline Surfactant Polymer Enhanced Oil Recovery Process. PhD. Rice
University; 2007.
[88] Lyons WC. Chapter 5 - Enhanced Oil Recovery Methods. In: Lyons WC, editor
Working Guide to Reservoir Engineering. Boston: Gulf Professional Publishing;
2010, p. 279-310.
[89] Castor TP, Somerton WH, Kelly JF. 1981. Surface Phenomena in Enhanced Oil
Recovery. Springer, Boston, MA, p. 249-91.
[90] Sheng JJ. Status of Alkaline Flooding Technology. Journal of Petroleum
Engineering & Technology 2015;5(1):44-50.
[91] Speight JG. Chapter 4 - Nonthermal Recovery of Heavy Oil. In: Speight JG, editor
Heavy Oil Production Processes. Boston: Gulf Professional Publishing; 2013, p. 63-
92.
[92] Ramirez-Corredores MM. Chapter 4 - Acidity in Crude Oils: Naphthenic Acids and
Naphthenates. In: Ramirez-Corredores MM, editor The Science and Technology of
Unconventional Oils. Amsterdam: Academic Press; 2017, p. 295-385.
[93] Sheng JJ. Investigation of Alkaline-Crude Oil Reaction. Petroleum 2015;1(1):31-9.
[94] Kumar S, Yen TF, Chilingarian GV, Donaldson EC. Chapter 9 Alkaline Flooding.
In: Donaldson EC, Chilingarian GV, Yen TF, editors. Developments in Petroleum
Science. Elsevier; 1989, p. 219-54.
[95] Leach RO, Wagner OR, Wood HW, Harpke CF. A Laboratory and Field Study of
Wettability Adjustment in Water Flooding. Journal of Petroleum Technology
1962;14(02):206-12.
[96] Thomas NC, Ghosh B, AlAmeri WS, Kilybay A. Alkali and Hybrid-Alkali Flooding
as a Tertiary Oil Recovery Mode: Prospects and Challenges. International Journal of
Petroleum and Petrochemical Engineering 2016;2(2):22-31.
TH-2437_126107015

References
185
[97] Cheng KH. Chemical Consumption During Alkaline Flooding: A Comparative
Evaluation. SPE Enhanced Oil Recovery Symposium. Tulsa, Oklahoma: Society of
Petroleum Engineers; 1986:14.
[98] Burk JH. Comparison of Sodium Carbonate, Sodium Hydroxide, and Sodium
Orthosilicate for EOR. SPE Reservoir Engineering 1987;2(01):9-16.
[99] deZabala EF, Vislocky JM, Rubin E, Radke CJ. A Chemical Theory for Linear
Alkaline Flooding. Society of Petroleum Engineers Journal 1982;22(02):245-58.
[100] Sekhar G, Borgohain GS. Review on Microfluidic Studies for EOR Application.
Journal of Petroleum Exploration and Production Technology 2019;9(3):2263-77.
[101] Abbas AH, Sulaiman WRW, Jaafar MZ, Gbadamosi AO, Ebrahimi SS, Elrufai A.
Numerical Study for Continuous Surfactant Flooding Considering Adsorption in
Heterogeneous Reservoir. Journal of King Saud University - Engineering Sciences
2018.
[102] Sheng JJ. Status of Surfactant EOR Technology. Petroleum 2015;1:97-105.
[103] Sandersen SB. Enhanced Oil Recovery with Surfactant Flooding. Chemical and
Biochemical Engineering. PhD. Technical University of Denmark; 2012.
[104] Bera A, Mandal A. Microemulsions: A Novel Approach to Enhanced Oil Recovery:
A Review. Journal of Petroleum Exploration and Production Technology
2015;5(3):255-68.
[105] Lake LW, Johns R, Rossen B, Pope G. Fundamentals of Enhanced Oil Recovery
Society of Petroleum Engineers; 2014.
[106] Hirasaki GJ, Domselaar HRV, Nelson RC. Evaluation of the Salinity Gradient
Concept in Surfactant Flooding. Society of Petroleum Engineers Journal
1983(June):486-500.
[107] Salehi M, Johnson SJ, Liang J-T. Mechanistic Study of Wettability Alteration Using
Surfactants with Applications in Naturally Fractured Reservoirs. Langmuir
2008;24(24):14099-107.
[108] Kumar A, Mandal A. Synthesis and Physiochemical Characterization of
Zwitterionic Surfactant for Application in Enhanced Oil Recovery. Journal of
Molecular Liquids 2017;243:61-71.
[109] Schramm LL, Wassmuth F. Foams: Fundamentals and Applications in the
Petroleum Industry. Americal Chemcial Society; 1994.
[110] Prud'homme R. Foams: Theory: Measurements: Applications. Routledge; 2017.
TH-2437_126107015

References
186
[111] Kovscek AR, Radke CJ. Fundamentals of Foam Transport in Porous Media.
Bartlesville, OK: U.S. Department of Energy; 1993:78.
[112] Ransohoff TC, Radke CJ. Mechanisms of Foam Generation in Glass-Bead Packs.
SPE Reservoir Engineering 1988;3(2):573-85.
[113] Sheng J. Enhanced Oil Recovery Field Case Studies. Gulf Professional Publishing;
2013.
[114] Osei-Bonsua K, Shokria N, Grassiab P. Foam stability in the presence and absence
of hydrocarbons: From bubble- to bulk-scale. Colloids and Surfaces A:
Physicochemical and Engineering Aspects 2015;481:13.
[115] Bond DC, Holbrook OC. Gas Drive Oil Recovery Process. In: Patents U, ed. US;
1956.
[116] Kamal M, Marsden SS. Displacement of a Miscellar Slug Foam in Unconsolidated
Porous Media. 48th Annual Fall Meeting of the Society of Petroleum Engineers of
AIME. SPE 4584. Las Vegas: Society of Petroleum Engineers; 1973:7.
[117] Bernard GG, Holm LW, Harvey CP. Use of Surfactant to Reduce CO2 Mobility in
Oil Displacement. Society of Petroleum Engineers Journal 1980;August 1980.
[118] Julio SSD, Emanuel AS. Laboratory Study of Foaming Surfactant for CO2 Mobility
Control. SPE Reservoir Engineering 1989;4(2):136-42.
[119] Lawson JB, Reisberg J. Alternate Slug of Gas and Diute Surfactant for Mobility
Control During Chemical Flooding. First Joint SPE/DOE Symposium on Enhanced
Oil Recovery SPE 8839. Tulsa, Oklahoma: Society of Petroleum Engineers; 1980.
[120] Demin W, Jiecheng C, Qun L, Junzheng W, Wenxiang W, Yanqi Z. First Ultra-Low
Interfacial Tension Foam Flood Field Test Is Successful. 2001 SPE Annual
Technical Conference and Exhibition. SPE 71491. New Orleans, Louisiana: Society
of Petroleum Engineers; 2001.
[121] Srivastava JP, D.S.Negi, K.Jain A, Dr.A.K.Dhawan. Surfactant-Alternate-Gas
(SAG) Injection Process as a Novel EOR Technique-- A Laboratory Investigation.
2nd South Asain Geoscience Conference and Exhibition,GEOIndia2011. New
Delhi, India; 2011:7.
[122] Pei HH, Zhang GC, Ge JJ. Laboratory Investigation of Enhanced Heavy Oil
Recovery by Foam Flooding with Low Gas–Liquid Ratio. Petroleum Science and
Technology 2011;29:12.
[123] Guo H, Zitha PLJ, Faber R, Buijse M. A Novel Alkaline/Surfactant/Foam Enhanced
Oil Recovery Process. SPE Journal 2012;SPE 145043:10.
TH-2437_126107015

References
187
[124] Luo P, Zhang Y, Huang S. A Promising Chemical-Augmented WAG Process for
Enhanced Heavy Oil Recovery. Fuel 2013;104:333-41.
[125] Zhang S, Jiang G-C, Wang L, Guo H-T, Tang X-g, Bai D-G. Foam Flooding with
Ultra-Low Interfacial Tension to Enhance Heavy Oil Recovery. Journal of
Dispersion Science and Technology 2014;35(3):403-10.
[126] C.Cottin, D.Morel, D.Levitt, P.Cordelier, G.Pope. Alkali Surfactant Gas Injection:
Attractive Laboratory Results Under the Harsh Salinity and Temperature Conditions
of Middle East Carbonates. Abu Dhabi International Petroleum Exhibition &
Conference. SPE 161727. Abu Dhabi, UAE: Society of Petroleum Engineers;
2012:13.
[127] Guo H, Zitha PLJ, Faber R, Marten Buijse. A Novel Alkaline/Surfactant/Foam
Enhanced Oil Recovery Process. SPE Journal 2012;17(04):10.
[128] Majidaie S, Onur M, Tan IM. An experimental and numerical study of chemically
enhanced water alternating gas injection. Petroleum Science 2015(12):13.
[129] Antunes CdMMO, Kakitani C, Marcelino Neto MA, Morales REM, Sum AK. An
Examination of the Prediction of Hydrate Formation Conditions in the Presence of
Thermodynamic Inhibitors. Brazilian Journal of Chemical Engineering
2018;35:265-74.
[130] Oseghale CI, Ebhodaghe FO. Asphaltene Deposition and Remediation in Crude Oil
Production: Solubility Technique. Journal of Engineering and Applied Sciences
2011;6(4):258-61.
[131] Taber JJ, Martin FD, Seright RS. EOR Screening Criteria Revisited-Part 1 :
Introduction to Screening Criteria and Enhanced Recovery Field Projects. SPE
Reservoir Engineering 1997(August):189-98.
[132] Taber JJ, Martin FD, Seright RS. EOR Screening Criteria Revisited-Part 2:
Applications and Impact of Oil Prices. SPE Reservoir Engineering
1997(August):199-205.
[133] Adasani AA, Bai B. Analysis of EOR projects and updated screening criteria.
Journal of Petroleum Science and Engineering 2011;79:10-24.
[134] Kamari A, Mohammadi AH. Screening of Enhanced Oil Recovery Methods. In:
Ambrosio J, editor Handbook on Oil Production Research. Nova Science
Publishers, Inc.; 2014, p. 285-95.
[135] Akanji L, Sandrea R. A Neuro-Fuzzy Approach to Screening Reservoir Candidates
for EOR. Advances in Petroleum Exploration and Development 2016;12(1):1-14.
TH-2437_126107015

References
188
[136] Aladasani A. Updated EOR Screening Criteria and Modeling the Impacts of Water
Salinity Changes on Oil Recovery. Petroleum Engineering. PhD. Missouri
University of Science and Technology; 2012:260.
[137] Manrique E, Calderon G, Mayo L, Stirpe MT. Water-Alternating-Gas Flooding in
Venezuela: Selection of Candidates Based on Screening Criteria of International
Field Experiences. European Petroleum Conference. The Hague, Netherlands:
Society of Petroleum Engineers; 1998:9.
[138] Sheng JJ. Status of Alkaline-Surfactant Flooding. Polymer Sciences 2015;1(16):7.
[139] Chang HL, Zhang ZQ, Wang QM, Xu ZS, Guo ZD, Sun HQ, et al. Advances in
Polymer Flooding and Alkaline/Surfactant/Polymer Processes as Developed and
Applied in the People's Republic of China. Journal of Petroleum Technology
2006;58(02):84-91.
[140] Shedid SA. Experimental Investigation of Alkaline/Surfactant/Polymer (ASP)
Flooding in Low Permeability Heterogeneous Carbonate Reservoirs. SPE North
Africa Technical Conference and Exhibition. Cairo, Egypt: Society of Petroleum
Engineers; 2015:16.
[141] F.M. Orr J, Heller JP, Taber JJ. Carbon Dioxide Flooding for Enhanced Oil
Recovery: Promise and Problems. Annual !-leeting of the American Oil Chemists
Society. Toronto; 1982:28.
[142] Gogoi SB. Effluent as Surfactant for Enhanced Oil Recovery. Innovative Energy &
Research 2014;3(1).
[143] Amyx JW, Daniel M.Bass J, Whiting RL. Petroleum Reservoir Engineering.
Physical Properties. New York : McGraw-Hill Book Co.; 1960.
[144] Klinkenberg LJ. The Permeability Of Porous Media To Liquids And Gases Eleventh
Mid-Year Meeting. Tulsa, OK; 1942.
[145] IP Standards For Petroleum And Its Products. Part I Methods for Analysis and
Testing. The Institute of Petroleum; 1972.
[146] Bon J. Laboratory and Modelling Studies on the Effects of Injection Gas
Composition on CO2-Rich Flooding in Cooper Basin, South Australia. Australian
School of Petroleum Faculty of Engineering, Computer and Mathematical Sciences.
PhD. The University of Adelaide, Australia; 2009:227.
[147] Hubbard RL, Stanfield KE. Determination of Asphaltenes, Oils, and Resins in
Asphalt. Analytical Chemistry 1948;20(5):460-5.
TH-2437_126107015

References
189
[148] Rehan M, Nizami A-S, Taylan O, Al-Sasi BO, Demirbas A. Determination of wax
content in crude oil. Petroleum Science and Technology 2016;34(9):799-804.
[149] Belhaij A, Al-Mahdy O. Foamability and Foam Stability of Several Surfactants
Solutions: The Role of Screening and Flooding. Petroleum & Environmental
Biotechnology 2015;6(4):6.
[150] Bera A, Ojha K, Mandal A. Synergistic Effect of Mixed Surfactant Systems on
Foam Behavior and Surface Tension. Journal of Surfactants and Detergents
2013;16:10.
[151] Farzaneh SA, Sohrabi M. Experimental Investigation of CO2-Foam Stability
Improvement by Alkaline in the Presence of Crude Oil. Chemical Engineering
Research and Design 2015;94:15.
[152] Vonnegut B. Rotating Bubble Method for the Determination of Surface and
Interfacial Tensions. Review of Scientific Instruments 1942;13(1):6-9.
[153] Ahmed S, Elraies KA. Microemulsion in Enhanced Oil Recovery. Science and
Technology Behind Nanoemulsions. IntechOpen; 2018, p. 145-65.
[154] Bera A, Ojha K, Kumar T, Mandal A. Phase Behavior and Physicochemical
Properties of (Sodium Dodecyl Sulfate + Brine + Propan-1-ol + Heptane)
Microemulsions. Journal of Chemical and Engineering data 2012;57:7.
[155] Sarmah S, Gogoi SB, Xianfeng F, Baruah AA. Characterization and Identification
of the Most Appropriate Nonionic Surfactant for Enhanced Oil Recovery. Journal of
Petroleum Exploration and Production Technology 2019.
[156] Huh C. Interfacial Tensions and Solubilizing Ability of a Microemulsion Phase that
Coexists With Oil and Brine. Journal of Colloid And Interface Science
1979;71(2):408-26.
[157] Bera A, Kumar T, Ojha K, Mandal A. Adsorption of Surfactants on Sand Surface in
Enhanced Oil Recovery: Isotherms, Kinetics and Thermodynamic Studies. Applied
Surface Science 2013;284:87-99.
[158] Arand M, Friedberg T, Oesch F. Colorimetric Quantitation of Trace Amounts of
Sodium Lauryl Sulfate in the Presence of Nucleic Acids and Proteins. Analytical
Biochemistry 1992;207(1):73-5.
[159] Gogoi SB. Adsorption–Desorption of Surfactant for Enhanced Oil Recovery.
Transport in Porous Media 2011;90:589-604.
TH-2437_126107015

References
190
[160] Ahmadi MA, Shadizadeh SR. Experimental Investigation of a Natural Surfactant
Adsorption on Shale-Sandstone Reservoir Rocks: Static and Dynamic Conditions.
Fuel 2015;159:15-26.
[161] Kennedy M. Chapter 3 - Core and Other Real Rock Measurements. In: Kennedy M,
editor Developments in Petroleum Science. Elsevier; 2015, p. 73-88.
[162] Talukdar P, Gogoi SB. A Study on the Role of Pre-Gelatinized Starch (PGS) in the
Non Damaging Drilling Fluid (NDDF) for the Tipam Sand of Geleki Oilfield of
Upper Assam Basin. International Journal of Applied Sciences and Biotechnology
2015;3(2):291-300.
[163] Nelson PH, Bird KJ. Porosity-Depth Trends and Regional Uplift Calculated from
Sonic Logs, National Petroleum Reserve in Alaska. Scientific Investigations Report
2005. USA: U.S. Department of the Interior & U.S. Geological Survey; 2005.
[164] M.Ramm KB. Porosity/depth Trends in Reservoir Sandstones: Assessing the
Quantative Effects of Varying Pore-pressure, Temerature History & Mineralogy,
Norwegian Shelf Data. Clay Minerals 1994;29:16.
[165] Tiab D, Donaldson EC. Chapter 3 - Porosity and Permeability. In: Tiab D,
Donaldson EC, editors. Petrophysics (Second Edition). Burlington: Gulf
Professional Publishing; 2004, p. 87-202.
[166] Ma S, Morrow NR. Relationships Between Porosity and Permeability for Porous
Rocks. International Symposium of the Society of Core Analyst. Montpelier, France;
1996:12.
[167] Nind TEW. Principles of Oil Well Production. McGraw-Hill; 1964.
[168] Al-Bazzaz WH, Gupta A. Reservoir Characterization and Data Integration of
Complex Mauddud-Burgan Carbonate Reservoir. SPE Europec/EAGE Annual
Conference and Exhibition. Vienna, Austria: Society of Petroleum Engineers;
2006:14.
[169] Kamal MS, Hussein IA, Sultan AS. Review on Surfactant Flooding: Phase
Behavior, Retention, IFT, and Field Applications. Energy & Fuels 2017;31:7701-
20.
[170] Welton JE. SEM Petrology Atlas. Oklahoma: The American Association of
Petroleum Geologists; 2003.
[171] AH A, WR WS, M Z, A A. Anionic Surfactant Adsorption: Insight for Enhanced
Oil Recovery. Recent Advances in Petrochemical Science 2017;1(5):4.
TH-2437_126107015

References
191
[172] Wilson L, Wilson MJ, Green J, Patey I. The Influence of Clay Mineralogy on
Formation Damage in North Sea Reservoir Sandstones: A Review with Illustrative
Examples. Earth-Science Reviews 2014;134:70-80.
[173] Julius P, Ananthanarayanan PN, Srinivasan V. Investigation of Enhanced Oil
Recovery (EOR) Surfactants on Clay Mixed Sandstone Reservoirs for Adsorption.
Indian Journal of Science and Technology 2015;8(14):4.
[174] Menon ES. Liquid Pipeline Hydraulics. USA: MArcel Dekker, Inc.; 2004.
[175] ASTM. Petroleum Measurements Tables. 2004.
[176] Jafarinejad S. Petroleum Waste Treatment and Pollution Control. Elsevier Science;
2016.
[177] Fozao KF, Gabsia B, Alferov F, Yossa MT. Mount Cameroon Oil Seeps and their
Rheological Properties. International Journal Of Engineering Research And
Development 2019;15(1):67-78.
[178] Manual on Hydrocarbon Analysis. American Society for Testing and Materials;
1963.
[179] Kandwal VC, Agrawal KM, Nautiyal SP, Khan HU. Paraffin Deposition and
Viscosity Temperature Behaviour Of Assam Crude Oil. Petroleum Science and
Technology 2007;18:15.
[180] Ramirez-Corredores MM. The Science and Technology of Unconventional Oils:
Finding Refining Opportunities. Academic Press, 2017; 2017.
[181] Aske N, Kallevik H, Sjöblom J. Determination of Saturate, Aromatic, Resin, and
Asphaltenic (SARA) Components in Crude Oils by Means of Infrared and Near-
Infrared Spectroscopy. Energy & Fuels 2001;15(5):1304-12.
[182] Samanta A, Ojha K, Mandal A. Interactions between Acidic Crude Oil and Alkali
and Their Effects on Enhanced Oil Recovery. Energy & Fuels 2011;25(4):1642-9.
[183] Renpu W. Chapter 1 - Basis of Well Completion Engineering. In: Renpu W, editor
Advanced Well Completion Engineering (Third Edition). Gulf Professional
Publishing; 2011, p. 1-74.
[184] Burcik EJ. Properties of Petroleum Reservoir Fluids. Wiley; 1957.
[185] Sheng JJ. Enhanced Oil Recovery Field Case Studies. Gulf Professional Publishing;
2013.
[186] Belhaij A, Al-Mahdy O. Foamability and Foam Stability of Several Surfactants
Solutions: The Role of Screening and Flooding. Journal of Petroleum &
Environmental Biotechnology 2015;6(4):6.
TH-2437_126107015

References
192
[187] L.Schramm L, J.Novosad J. The Destabilization of Foams for Improved Oil
Recovery by Crude Oils: Effect of the Nature of the Oil. Journal of Petroleum
Science and Engineering 1992;7:77-90.
[188] Mannhard K, Novosad JJ, Schramm LL. Foam/Oil Interations at Reservoir
Conditions. SPE/DOE Improved Oil Recovery Symposium. Tulsa, Oklahoma:
Society of Petroleum Engineers; 1998:14.
[189] Simjoo M, Rezaei T, Andrianov A, Zitha PLJ. Foam Stability in the Presence of
Oil: Effect of Surfactant Concentration and Oil Type. Colloids and Surfaces A:
Physicochemical and Engineering Aspects 2013;438:11.
[190] Farajzadeh R, Krastev R, Zitha PLJ. Foam films stabilized with alpha olefin
sulfonate (AOS). Colloids and Surfaces A: Physicochemical and Engineering
Aspects 2008;324(1):35-40.
[191] Asari M, Hormozi F. Effects of Surfactant on Bubble Size Distribution and Gas
Hold-Up in a Bubble Column. American Journal of Chemical Engineering
2013;1(2):50-8.
[192] Xu X. A Novel CO2 Flooding Based EOR for Sandstone Reservoirs. Petroleum
Engineering. PhD. Curtin University; 2016:165.
[193] Pu W, Pang S, Wang C. Experimental Investigation of Foam Performance in the
Presence of Crude Oil. Journal of Surfactants and Detergents 2017;20:9.
[194] Wang J, Cao Y, Li G, Deng L, Li S. Effect of CTAB Concentration on Foam
Properties and Discussion Based on Liquid Content and Bubble Size in the Foam.
International Journal of Oil, Gas and Coal Engineering 2018;6(1):18-24.
[195] Kalekar MS, Bhagwat SS. Dynamic Behavior of Surfactants in Solution. Journal of
Dispersion Science and Technolog 2006;27:1027-34.
[196] Azdarpour A, Junin R, Manan M, Hamidi H, Rafati R. The Effects Of Controlling
Parameters On Polymer Enhanced Foam (PEF) Stability. Jurnal Teknologi
(Sciences & Engineering) 2015;73(1):53-9.
[197] Wang H, Guo W, Zheng C, Wang D, Zhan H. Effect of Temperature on Foaming
Ability and Foam Stability of Typical Surfactants Used for Foaming Agent. Journal
of Surfactants and Detergents 2017;20:8.
[198] Kamal MS. A Novel Approach to Stabilize Foam Using Fluorinated Surfactants.
Energies 2019;12:12.
TH-2437_126107015

References
193
[199] Yin D, Zhao D, Gao J, Gai J. Experimental Study of Enhancing Oil Recovery with
Weak Base Alkaline/Surfactant/Polymer. International Journal of Polymer Science
2017:7.
[200] Al-Sahhaf T, Elkamel A, Ahmed AS, A.R.Khan. The Influence of Temperature,
Pressure, Salinity, and Surfactant Concentration on the Interfacial Tension of the N-
Octane-Water System. Chemical Engineering Communications 2005;192:667-84.
[201] Salehi MM, Omidvar P, Naeim F. Salinity of Injection Water and its Impact on Oil
Recovery Absolute Permeability, Residual Oil Saturation, Interfacial Tension and
Capillary Pressure. Egyptian Journal of Petroleum 2017;26:301-12.
[202] Ruckenstein E, Rao IV. Interfacial Tension of Oil-Brine Systems in the Presence of
Surfactant and Cosurfactant. Journal of Colloid and Interface Science 1987;Vol.
117(1):104-19.
[203] Phan TT, Attaphong C, Sabatini DA. Effect of Extended Surfactant Structure on
Interfacial Tension and Microemulsion Formation with Triglycerides. Journal of
American Oil Chemists Society 2011;88:1223-8.
[204] Healy RN, Reed RL. Immiscible Microemulsion Flooding. Society of Petroleum
Engineers 1976:32.
[205] Lv W, Bazin B, Ma D, Liu Q, Han D, Wu K. Static and Dynamic Adsorption of
Anionic and Amphoteric Surfactants with and without the Presence of Alkali.
Journal of Petroleum Science and Engineering 2011;77:10.
[206] Seethepalli A, Adibhatla B, Mohanty KK. Wettability Alteration During Surfactant
Flooding of Carbonate Reservoirs. SPE/DOE Symposium on Improved Oil
Recovery. Tulsa, Oklahoma: Society of Petroleum Engineers; 2004:10.
[207] Krumrine PH, Falcone JS, Jr., Campbell TC. Surfactant Flooding 1: The Effect of
Alkaline Additives on IFT, Surfactant Adsorption, and Recovery Efficiency.
Society of Petroleum Engineers Journal 1982;22(04):503-13.
[208] Elraies KA, Ahmed S. A New Strategy for Minimizing Precipitations during ASP
Flooding in Carbonate Reservoirs International Journal of Chemical and Molecular
Engineering 2012;6(12):1186-8.
[209] Ghosh P. Study of Alternating Anionic Surfactant and Gas Injection in Carbonate
Cores. MS. The University of Texas at Austin; 2016.
[210] Hong SA, Bae JH. Field Experiment of Lignosulfonate Preflushing for Surfactant
Adsorption Reduction. SPE Reservoir Engineering 1990;November 1990:8.
TH-2437_126107015

References
194
[211] J.Novosad. Laboratory Evaluation of Lignosulfonates as Sacrificial Adsorbates in
Surfactant Flooding. Journal of Canadian Petroleum Technology 1984:24-8.
[212] Syahputra AE, Tsau J-S, B.Grigg R. Laboratory Evaluation of Using Lignosulfonate
and Surfactant Mixture in CO2 Flooding. 2000 SPE/DOE Improved Oil Recovery
Symposium SPE 59368. Tulsa, Oklahoma: Society of Petroleum Engineers; 2000:9.
[213] Tsau J-S, Syahputra AE, Yaghoobi H, Grigg RB. Use of Sacrificial Agents in CO2
Foam Flooding Application. 1999 SPE Annual Technical Conference and
Exhibition SPE 56609. Houston, Texas: Society of Petroleum Engineers; 1999.
[214] Kronberg B, Holmberg K, Lindman B. Surface Chemistry of Surfactants and
Polymers. Wiley Online Library; 2014.
[215] Bagci AS. Immiscible CO2 Flooding through Horizontal Wells. Energy Sources
2007;29:85-95.
[216] Goos E, Riedel U, Zhao L, Blum L. Phase diagrams of CO2 and CO2 -N2 gas
mixtures and their application in compression processes. Energy Procedia
2011;4:3778-85.
[217] Bagheri SR. Experimental and Simulation Study of the Steam−Foam Process. Part
2: The Effect of Oil on Foam Generation. Energy & Fuels 2017;31:2687-96.
[218] Memon MK, Elraies KA, Al-Mossawy MI. Impact of new foam surfactant blend
with water alternating gas injection on residual oil recovery. Journal of Petroleum
Exploration and Production Technology 2017;7:9.
[219] Rao D. Gas Injection EOR- A New Meaning in the New Millennium. Journal of
Canadian Petroleum Technology 2001;40(02):8.
[220] Hollebone B. Chapter 4 - Measurement of Oil Physical Properties. In: Fingas M,
editor Oil Spill Science and Technology. Boston: Gulf Professional Publishing;
2011, p. 63-86.
[221] Kamal MS, Hussein IA, Sultan AS. Review on Surfactant Flooding: Phase
Behavior, Retention, IFT, and Field Applications. Energy & Fuels 2017;31(8):7701-
20.
[222] Mandal ABA. Microemulsions: a novel approach to enhanced oil recovery: a
review. Petrol Explor Prod Technol 2015:14.
[223] Moayedi M, James LA, Mahmoodi M. An Experimental Study on Optimization of
SAG Process Utilizing Nonionic Surfactants and Sodium Lignosulfonate.
International Symposium of the Society of Core Analysts. Avignon, France; 2014:6.
TH-2437_126107015
References
195
[224] Kumar R, Dao EK, Mohanty KK. Emulsion Flooding of Heavy Oil. SPE Improved
Oil Recovery Symposium. Tulsa, Oklahoma, USA: Society of Petroleum Engineers;
2010:13.
[225] Han L, Gu Y. Optimization of Miscible CO2 Water-Alternating-Gas Injection in the
Bakken Formation. Energy & Fuels 2014;28:6811-9.
[226] Anuar NABM, Yunan MH, Sagala F, Katende A. The Effect of WAG Ratio and Oil
Density on Oil Recovery by Immiscible Water Alternating Gas Flooding. American
Journal of Science and Technology 2017;4(5):80-90.
[227] Amin ME, Zekri AY, Almehaideb R, Al-Attar H. Optimization of CO2 WAG
Processes in a Selected Carbonate Reservoir: An Experimental Approach.
International Journal of Engineering Research and Science & Technology
2013;2(2):16.
[228] Zekri AY, Nasr MS, AlShobakyh A. Evaluation of Oil Recovery by Water
Alternating Gas (WAG) Injection - Oil-Wet & Water-Wet Systems. SPE Enhanced
Oil Recovery Conference. Kuala Lumpur, Malaysia: Society of Petroleum
Engineers; 2011:8.
[229] Chen B, Reynolds AC. Ensemble-Based Optimization of the WAG Injection
Process. SPE Reservoir Simulation Symposium. Houston, Texas,: Society of
Petroleum Engineers; 2015.
[230] Hussain AAA, Amin A, Vincent-Bonnieu S, Farajzadeh R, Andrianov A, Hamid
PA, et al. Effect of Oil on Gravity Segregation in SAG Foam Flooding. 19th
European Symposium on Improved Oil Recovery. Stavanger, Norway: EAGE IOR
NORWAY 2017; 2017:14.
[231] Li J, Gao Y, Jiang H, Liu Y, Dong H. Pore-Scale Imaging of the Oil Cluster
Dynamic during Drainage and Imbibition Using In Situ X-Ray Microtomography.
Geofluids 2018;2018:13.
[232] Hatchell DC. Gravity-Assisted Inniscible CO2 for Enahnced Oil Recovery and
Storage. Department of Energy Resources Engineering. Master of Science. Stanford
University; 2017.
[233] Safarzadeh MA, Nejad SAT, Sahraei E. Experimental Investigation of the Effect of
Calcium Lignosulfonate on Adsorption Phenomenon in Surfactant Alternative Gas
Injection. Journal of Chemical and Petroleum Engineering 2011;45(2):141-51.
[234] Azzolina NA, Gorecki CD, Ayash SC, Peck WD, Melzer LS, Chatterjee LS.
Statistical Analysis of CO2 EOR Production and Injection Data to Examine Ongoing
TH-2437_126107015

References
196
and Ultimate CO2 EOR Incidental Storage. 13th Annual Carbon Capture,
Utilization & Storage Conference. Pittsburgh, Pennsylvania; 2014.
[235] Khan MY, Kohata A, Patel H, Syed FI, Al Sowaidi AK. Water Alternating Gas
WAG Optimization Using Tapered WAG Technique for a Giant Offshore Middle
East Oil Field. Abu Dhabi International Petroleum Exhibition & Conference. Abu
Dhabi, UAE: Society of Petroleum Engineers; 2016:12.
[236] J.P.Srivastava, Mahli L. Water-Alternating-Gas (WAG) Injection a Novel EOR
Technique for Mature Light Oil Fields - A Laboratory Investigation for GS-5C sand
of Gandhar Field. 9th Biennial International Conference and Exposition on
Petroleum Geophysics. Hyderabad, India; 2012.
[237] Srivastava JP, Mahli L. Water-Alternating-Gas (WAG) Injection a Novel EOR
Technique for Mature Light Oil Fields - A Laboratory Investigation for GS-5C sand
of Gandhar Field. 9th Biennial International COnference and Exposium on
Petroleum Geophysics. Hyderabad, India; 2012:7.
[238] Tovar FD. Experimental Investigation on the use of Water Soluble Polyacrylamides
as Thickeners during CO2 WAG EOR. MS. Texas A&M University; 2014.
[239] Tsau J-S, Heller JP. Evaluation of Surfactants for CO2-Foam Mobility Control.
Permian Basin Oil and Gas Recovery Conference. Midland, Texas: Society of
Petroleum Engineers; 1992:9.
[240] Hanssen JE, Holt T, Surguchev LM. Foam Processes: An Assessment of Their
Potential in North Sea Reservoirs Based on a Critical Evaluation of Current Field
Experience. SPE/DOE Improved Oil Recovery Symposium. Tulsa, Oklahoma:
Society of Petroleum Engineers; 1994:16.
[241] Ghoodjani E, H.Bolouri S. Prediction of Water-Flooding Performance in Core
Scale: Comparison of Numerical Simulator, Neural Network and Correlation.
Brazilian Journal of Petroleum and Gas 2011;5(4):209-16.
[242] Hosseini-Nasab SM, Padalkar C, Battistutta E, Zitha PLJ. Mechanistic Modeling of
the Alkaline/Surfactant/Polymer Flooding Process under Sub-optimum Salinity
Conditions for Enhanced Oil Recovery. Industrial & Engineering Chemistry
Research 2016(22):6875-88.
[243] Spildo K, Sun L, Djurhuus K, Skauge A. A Strategy for Low Cost, Effective
Surfactant Injection. Journal of Petroleum Science and Engineering 2014;117:8-14.
[244] Glover CJ, Puerto MC, Maerker JM, Sandvik EL. Surfactant Phase Behavior and
Retention in Porous Media. Society of Petroleum Engineers Journal 1979;19(03):11.
TH-2437_126107015

References
197
[245] Hong SA, Bae JH, Lewis GR. An Evaluation of Lignosulfonate as a Sacrificial
Adsorbate in Surfactant Flooding. SPE Reservoir Engineering 1987;February
1987:11.
[246] Syahputra AE. Experimental Evaluation of Lignosulfonate as a Sacrificial Agent in
CO2-Foam Flooding. Department of Petroleum Engineering. MS. Socorro, New
Mexico: New Mexico Institute of Mining and Technology; 1999:122.
[247] Tsau J-S, Syahputra AE, Grigg RB. Economic Evaluation of Surfactant Adsorption
in CO2 Foam Application. SPE/DOE Improved Oil Recovery Symposium. SPE
59365. Tulsa, Oklahoma: Society of Petroleum Engineers; 2000:9.
TH-2437_126107015


![Alkaline/Surfactant/Polymer Processes: Wide Range of ...gjh/Consortium/resources/SPE-113936-PA-P[1].pdf · Alkaline/Surfactant/Polymer Processes: Wide Range of Conditions for](https://img.dokumen.tips/doc/110x75/5b3eff4d7f8b9a5e528b92ca/alkalinesurfactantpolymer-processes-wide-range-of-gjhconsortiumresourcesspe-113936-pa-p1pdf.jpg)

![SPE 141462 Wettability Alteration and Foam Mobility Control in a …gjh/Consortium/resources/SPE-141462... · 2012. 3. 18. · 1997-2000], alkaline/surfactant/polymer (ASP) flooding](https://img.dokumen.tips/doc/110x75/6129a951580c7430412bcc59/spe-141462-wettability-alteration-and-foam-mobility-control-in-a-gjhconsortiumresourcesspe-141462.jpg)

![Favorable Attributes of Alkaline-Surfactant …gjh/Consortium/resources/SPE-99744-PA-P[1].pdfFavorable Attributes of Alkaline-Surfactant-Polymer Flooding Shunhua Liu, SPE, Rice University;](https://img.dokumen.tips/doc/110x75/5b09d09b7f8b9af0438e5562/favorable-attributes-of-alkaline-surfactant-gjhconsortiumresourcesspe-99744-pa-p1pdffavorable.jpg)


![Alkaline/Surfactant/Polymer Processes: Wide Range of ...porousmedia.rice.edu/resources/SPE-113936-PA-P[1].pdf · and George J. Hirasaki, ... presented. Here, this ASP simulator has](https://img.dokumen.tips/doc/110x75/5b3a9ab87f8b9a26728b94eb/alkalinesurfactantpolymer-processes-wide-range-of-1pdf-and-george-j.jpg)


